Methodology for Estimation of Greenhouse Gas Emissions from Tropical Peatlands in Indonesia.
24
TECHNICAL PAPER Methodology for Esmaon Of Greenhouse Gas Emissions from Tropical Peatlands in Indonesia KFCP Peat GHG Panel Kalimantan Forests and Climate Partnership (KFCP)
-
Upload
stella-pong -
Category
Documents
-
view
221 -
download
1
description
This report summarises a framework and methodology for greenhouse gas (GHG) accounting in tropical peatlands. A detailed account of the scientific basis for the methodology is provided in a review prepared by the Indonesia-Australia Forest Carbon Partnership (IAFCP) Peat and GHG Panel (2010). | Authors: KFCP Peat GHG Panel | Design & Layout: Stella Pong | Publisher: IAFCP
Transcript of Methodology for Estimation of Greenhouse Gas Emissions from Tropical Peatlands in Indonesia.

TECHNICAL PAPER
Methodology for Estimation Of Greenhouse Gas Emissions from Tropical Peatlands in Indonesia
KFCP Peat GHG Panel
Kalimantan Forests and Climate Partnership (KFCP)


TECHNICAL PAPER
Methodology for Estimation of Greenhouse Gas Emissions from Tropical Peatlands in IndonesiaKalimantan Forests and Climate Partnership (KFCP)
Prepared 2010
Published 2014
Methodology for Estimation of Greenhouse Gas Emissions from Tropical Peatlands in Indonesia
Authors:KFCP Peat GHG Panel
Editors:Dr Rachael Diprose and Dr Robert Waterworth

Methodology for Estimation of Greenhouse Gas Emissions from Tropical Peatlands in Indonesia iii
ACKNOWLEDGEMENTS
This methodology was prepared in 2010 by the KFCP Peat and GHG Panel, chaired by Dr John Raison of CSIRO and comprised of Dr Pep Canadell, Dr Aljosja Hooijer, Jyrki Jauhianen, Professor Hans Joosten, Dr Daniel Murdiyarso, Dr Susan Page, Dr Florian Siegert, Marcel Silvius, Dr Herwint Simbolon, and Grahame Applegate. The work was funded by the Indonesia-Australia Forest Carbon Partnership. This paper was edited for publication in 2013.
This research was carried out in collaboration with the Governments of Australia and Indonesia, but the analysis and findings presented in this paper represent the views of the authors and do not necessarily represent the views of those Governments. Any errors are the authors’ own. The paper constitutes a technical scientific working paper and as such, there is potential for future refinements to accommodate feedback and emerging evidence.
Methodology for Estimation of Greenhouse Gas Emissions from Tropical Peatlands in Indonesiaiv
TABLE OF CONTENTS
ACKNOWLEDGEMENTS iii
TABLE OF CONTENTS iv
LIST OF FIGURES v
ACRONYMS vi
SUMMARY 1
1. INTRODUCTION AND CONTEXT 2
2. ESSENTIAL COMPONENTS OF THE GHG ACCOUNTING METHODOLOGY 3
2.1 Change in C stocks in above- and below-ground biomass and dead organic matter 3
2.2 Emissions of CO2 from biological oxidation of peat 4
2.3 Emissions of non-CO2 GHGs (methane and nitrous oxide) from biological processes 6
2.4 Emissions of CO2 from combustion by fire 6
2.5 Emissions of non-CO2 GHGs from fire 7
3. PRELIMINARY DEFAULT VALUES FOR PARTS OF THE METHODOLOGY 8
3.1 Temporal pattern of forest C accumulation by new plantings, or after disturbancessuch as logging and fire 8
3.2 Root-shoot (R/S) ratios for forests growing on peat soils 8
3.3 Emission factors for GHG release in peat fires 8
3.4 Net emissions of CO2 from biological processes 9
3.5 Emissions of non-CO2 GHGs from biological processes 9
4. FIELD MONITORING REQUIRED TO SUPPORT AND IMPLEMENT THE METHODOLOGY 10
4.1 Remote sensing of change in vegetation cover, vegetation condition, extent of fire, and change in peat height 10
4.2 Ground measurement of temporal change in ground water table depth and change in peat height 10
4.3 Change in area and growth rate of new forest plantings 10
5. CRITICAL UNCERTAINTIES TO BE ADDRESSED BY FURTHER RESEARCH 11
5.1 Spatial variation in important peat characteristics 11
5.2 The quantitative relationship between peat subsidence and net (root-free) CO2 emissions 11
5.3 Area burnt and mass of peat combusted in fire 11
5.4 Emission factors for each important GHG in different types of peat fire 12
5.5 Temporal pattern of forest C accumulation by new plantings, or after disturbances such as logging and fire 12
6. PROGRESSIVE REFINEMENT OF THE METHODOLOGY 13
REFERENCES 14

Methodology for Estimation of Greenhouse Gas Emissions from Tropical Peatlands in Indonesia v
LIST OF FIGURES
Figure 1. Example of differing patterns of stand-level accumulation of C in biomass during forest growth 3
Figure 2. Rate of subsidence in relation to mean annual water level below surface 5

Methodology for Estimation of Greenhouse Gas Emissions from Tropical Peatlands in Indonesiavi
ACRONYMS
GHG : Greenhouse gas
GWP : Global Warming Potential
IAFCP : Indonesia-Australia Forest Carbon Partnership
INCAS : Indonesian National Carbon Accounting System
IPCC : Intergovernmental Panel on Climate Change
LiDAR : Airborne Light Detection and Ranging
REDD+ : Reducing Emissions from Deforestation and forest Degradation and conservation, sustainable forest management and the enhancement of forest carbon stocks

Methodology for Estimation of Greenhouse Gas Emissions from Tropical Peatlands in Indonesia 1
SUMMARY
This report summarises a framework and methodology for greenhouse gas (GHG) accounting in tropical peatlands. A detailed account of the scientific basis for the methodology is provided in a review prepared by the Indonesia-Australia Forest Carbon Partnership (IAFCP) Peat and GHG Panel (2010). The methodology is consistent with the Intergovernmental Panel on Climate Change (IPCC) GHG Guidelines (2006) and is comprised of the following five components:• change in carbon (C) stocks in above- and below-ground biomass and dead organic matter • emissions of carbon dioxide (CO2) from biological oxidation• emissions of non-CO2 GHGs (methane and nitrous oxide) from biological processes• emissions of CO2 from combustion by fire• emissions of non-CO2 GHGs from combustion by fire.
Each of these five components is discussed in this paper. The GHG account for any land area (e.g. REDD+1 project, district, region) is calculated as the sum of the net GHG balance for each of these five components, and this is required on an annual basis.
A very brief summary is provided here of the key scientific information that underpins the methods proposed for estimating the GHG balance for each of these components. Further information on the science underpinning the framework methodology is available in A review of the science underpinning a methodology for GHG accounting in tropical peat lands. (IAFCP Peat and GHG Panel, 2010).
Given the methodology is consistent with the IPCC GHG Guidelines (2006), it will support emissions estimation under the Indonesian National Carbon Accounting System (INCAS). It can also be used to provide GHG accounts that support the implementation of REDD+ projects.
A step-wise and incremental approach will be needed for further development of the GHG accounting methodology. Initially, generalised ‘default values’ (derived from the review of existing information) are used to estimate GHG change for several of the above components, but these will be improved and disaggregated so as to be more site-specific as new information becomes available.
The key research required to improve the GHG methodology over time is briefly presented. The most significant gaps relate to obtaining better spatial estimates of the carbon and nitrogen stocks in peat, to obtaining reliable quantitative relationships between the factors affecting peat decomposition and CO2 emissions and peat subsidence, and to establishing appropriate emission factors for non-CO2 GHG emissions from the combustion of tropical peats.
1Reducing Emissions from Deforestation and forest Degradation and conservation, sustainable forest management and the enhancement of forest carbon stocks

Methodology for Estimation of Greenhouse Gas Emissions from Tropical Peatlands in Indonesia2
1. INTRODUCTION AND CONTEXT
Lowland tropical peatlands have become a major source of GHG emissions. This is the result of deforestation, deep drainage and burning of peatlands to support the expansion of agricultural crops and forest plantations.
Given that human activity has underpinned the perturbation that has led to these high GHG emissions, future emissions can be reduced through better land use practices, ecosystem rehabilitation, and conservation of existing carbon stocks. In the near-term, REDD+ and other sustainable forest management initiatives may lead to significant mitigation of GHG emissions. To realise this potential it will be necessary to develop a cost-effective method of reliably estimating ‘savings’ in GHG emissions. This paper provides a framework methodology to achieve that aim. The paper presents the five essential components of the methodology, the default values needed, and the field methods required to implement the methodology.
This methodology will, by necessity, be improved over time. It will also inform the progressive development of the Indonesian National Carbon Accounting System (INCAS).
Methodology for Estimation of Greenhouse Gas Emissions from Tropical Peatlands in Indonesia 3
2. ESSENTIAL COMPONENTS OF THE GHG ACCOUNTING METHODOLOGY
The GHG balance of peat swamp forests depends on:• Change in the C stock in biomass (above and below-ground) and in dead organic matter above-ground.• Emissions of non-CO2 GHGs from burning of above-ground biomass and dead organic matter.• CO2 emissions from peat resulting from biological oxidation and from combustion by fire.• Emissions of non-CO2 GHGs from peat resulting from biological processes and from fire.
Each of these five components are discussed below. The peat-derived emissions of GHGs often dominate the total GHG flux and may exceed emissions from burning of forests by an order of magnitude, especially where the peat has been drained or intensely burned.
2.1 Change in C stocks in above- and below-ground biomass and dead organic matter
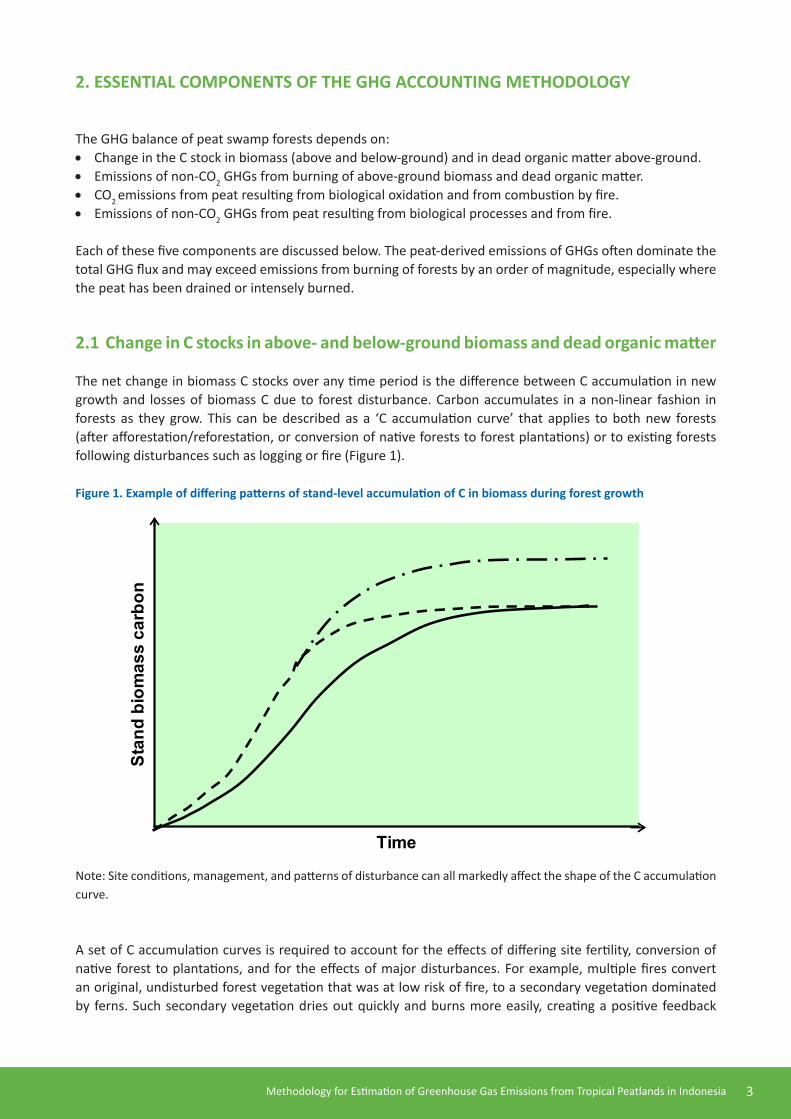
The net change in biomass C stocks over any time period is the difference between C accumulation in new growth and losses of biomass C due to forest disturbance. Carbon accumulates in a non-linear fashion in forests as they grow. This can be described as a ‘C accumulation curve’ that applies to both new forests (after afforestation/reforestation, or conversion of native forests to forest plantations) or to existing forests following disturbances such as logging or fire (Figure 1).
Figure 1. Example of differing patterns of stand-level accumulation of C in biomass during forest growth
Time
Stan
d bi
omas
s ca
rbon
Time
Stan
d bi
omas
s ca
rbon
Time
Stan
d bi
omas
s ca
rbon
Note: Site conditions, management, and patterns of disturbance can all markedly affect the shape of the C accumulation curve.
A set of C accumulation curves is required to account for the effects of differing site fertility, conversion of native forest to plantations, and for the effects of major disturbances. For example, multiple fires convert an original, undisturbed forest vegetation that was at low risk of fire, to a secondary vegetation dominated by ferns. Such secondary vegetation dries out quickly and burns more easily, creating a positive feedback

Methodology for Estimation of Greenhouse Gas Emissions from Tropical Peatlands in Indonesia4
through increased flammability. When this cycle is repeated two or three times, woody species disappear completely (Page et al. 2009) and this dramatically reduces the recovery of biomass C stocks.
Forest disturbance can cause a loss of biomass C stocks as a result of:• Removal of harvested wood,• Decay of dead above-ground and root biomass, including after forest die-back that follows drainage, and• Combustion of biomass in fires.The degree and pattern of C loss depends both on the biomass C stock in the standing forest (i.e. the point on the C accumulation curve) and the nature of disturbance (e.g. selective logging, fires of varying intensity, deforestation).
There are limited data available for Indonesian peat swamp forests to support accurate estimation of C change (the C accumulation curve or loss of biomass C due to disturbance) in living biomass in undisturbed or disturbed forests. Until further information becomes available, default values from the IPCC GHG Guidelines (2006) need to be used, and these are summarized in Section 4.1 below.
2.2 Emissions of CO2 from biological oxidation of peat
In undisturbed peat forests, peat C stocks are relatively stable. Disturbance, especially drainage, greatly increases CO2 emissions from biological oxidation (decomposition) of peat because a larger volume of peat and litter is exposed to oxic conditions. Enhanced release of CO2 from biological oxidation is often the major source of GHG following the disturbance of forests on peat. The rate of CO2 emissions depends on the quality of decomposable substrate for microorganisms and thus the rate may change over time. CO2 emissions can continue for many decades until all the aerated peat is decomposed.
To estimate CO2 emissions from peat decomposition, it is necessary to measure or estimate the net (root free) emissions of CO2. Separating the root respiration from the CO2 flux (resulting from peat decomposition) is a major challenge. This is made more difficult by the heterogeneous nature of peat forests, as is the scaling of fluxes over both space and time. Consequently, there exists only a very modest amount of reliable data on net (root free) CO2 emissions from peat decomposition in tropical peatlands that can be used for the calculation of emissions in a GHG accounting methodology.
When peat forests are disturbed, the peat typically begins to subside. The subsidence rate is correlated, to some extent, with drainage depth (depth of the water table) across a wide range of environmental conditions (Figure 2), suggesting that it may be a useful proxy for the rate of peat decomposition. However, a range of other factors such as vegetation cover and prior fire disturbance also affect subsidence, although their effects are difficult to quantify. Couwenberg et al. (2009) in their survey of the literature found a linear relationship between subsidence rate and water depth for Southeast Asian tropical peat soils, with subsidence increasing by 0.9 cm a-1 for each 10 cm of additional drainage depth. This is substantially more than in other parts of the world (cf. Hooijer et al. 2006; Couwenberg et al. 2009).

Methodology for Estimation of Greenhouse Gas Emissions from Tropical Peatlands in Indonesia 5
Figure 2. Rate of subsidence in relation to mean annual water level below surface
Note: horizontal bars indicate standard deviation in water table (where available). Open circles denote unused, drained forested sites, these were not taken into account in the regression that applies to water levels £50cm below surface only (slope = -0.09, r2 = 0.95). Land use: (□) agriculture, (●) oil palm (recorded 13 to 16 or 18 to 21 years after drainage), (●) degraded open land in the Ex Mega Rice Project area, recorded ~10 to ~12 years after drainage, (○) drained forested plots, recorded ~10 to 12 years after drainage. Dotted line denotes the relationship suggested by Hooijer et al.(2009) for pulpwood plantations in the Kampar area (Sumatra). Emission values are based on an assumed volumetric carbon content of 0.068 g C cm-3 and a 40% oxidative component to total subsidence.
Subsidence is due to several factors (especially compaction), and the fraction of subsidence that is due to decomposition is very poorly known and unlikely to be a constant across peat types and over time. Prior to new research findings on subsidence and compaction becoming available, CO2 emissions can be estimated from the assumed general relationship between change in peat height and emissions (e.g. Figure 2). However, such estimates may be quite unreliable.
A significant issue that needs to be resolved by further research is the extent to which the relationship that has been developed for CO2 emissions during the drainage phase is applicable for the re-wetting of peat (after the blocking of canals). We conclude that it will not apply to partial re-wetting in the shorter-term (i.e. the transition phase to more complete flooding). Additional research is needed to test the reversibility of this relationship.
.
7
Methodology for Estimation of Greenhouse Gas Emissions from Tropical Peatlands in Indonesia6
2.3 Emissions of non-CO2 GHGs (methane and nitrous oxide) from biological processes
Methane emissions are quite low from South East Asian tropical peatlands and make only a minor contribution to total GHG emissions from drained disturbed peatland. The peat is formed mainly from wood from dead tropical tree species that have a high lignin content, meaning that it is a poor resource for microbial production of methane under anoxic conditions. A default value based on the average of published emission rates will be used in the GHG accounting methodology. Little is known about the effects of re-wetting on methane emission rates, but these effects are not expected to be significant in the medium to long term.
Nitrous oxide (N2O) can have large spatial and temporal variation in flux rates, although most of the measured flux rates are small. Emissions of nitrous oxide can be significant, especially where fertilizer is applied to tropical peat. Prediction of emission rates, especially during land use transitions, and after major site disturbances such as drainage or fire is very difficult. Due to the high Global Warming Potential (GWP) of N2O, the spatio-temporal distribution of extreme N2O fluxes in tropical peat needs to be better quantified so that cumulative fluxes can be more accurately estimated. The only practical approach to accounting for N2O emissions at this stage is to use default values based on synthesis of existing information.
Change in peat subsidence is not a good indicator of non-CO2 GHG emissions resulting from biological processes, and cannot be used as a proxy for such emissions.
2.4 Emissions of CO2 from combustion by fire
Fire can be a major source (and the dominant source in major fire years) of GHG emissions (both CO2 and non-CO2) from tropical peatland, especially after drainage or forest removal, and during El Nino years. Emissions of CO2 are much greater than the CO2 equivalents of the non-CO2 GHG emissions in fire (see Section 3.5).
The key variables determining the amount of GHG emissions are the mass of fuel burnt and the emission factor (mass of GHG produced per unit of fuel burnt). The mass of fuel burnt is the product of the area burnt, and the mass of fuel burnt/unit area. GHG Emissions = Area burnt x Fuel consumed per unit area burnt x Emission factor (mass of each individual GHG emitted per unit of fuel combusted).
There is a critical need to improve knowledge of all of these factors in tropical peatlands.
GHG emissions from fires that burn above-ground fuels are reasonably well understood, but are very different in character to peat fires that are very poorly understood. Smouldering peat fires produce more CO relative to CO2, and there can be significant loss of C as other volatile compounds. In an excellent study in which the smouldering of blocks of peat was realistically achieved under a range of moisture contents, Rein et al. (2009) found that only 60% of the C in combusted peat was emitted as CO+CO2 (i.e. there were emissions of many other volatile C compounds). This contrasts with about 95% of combusted C released as CO2 + CO for surface fires.
Default emission factors are provided in Section 4.3.
Methodology for Estimation of Greenhouse Gas Emissions from Tropical Peatlands in Indonesia 7
2.5 Emissions of non-CO2 GHGs from fire
The emission factors (EF, g/kg of fuel burnt) for the combustion of above-ground biomass in tropical forests (IPCC, 2006) are 1580 (CO2), 6.8 (CH4), and 0.2 (N2O). After adjusting for the GWP of these gases, CO2 is ~ 10-fold more important than methane, and ~ 25-fold more important than N2O. However, release of the non-CO2 GHGs is significant because they represent long-term net GHG emissions from fire, in contrast with CO2 that can be re-fixed by re-growing vegetation. Peat fires are different because of oxygen limitations and the smouldering nature of combustion. The IPCC GHG accounting guidelines (2006) provide very little guidance for estimating GHG emissions from peat fires. Emissions of CO, N2O and CH4 during partial (smouldering) combustion during peat fires (Yokelson et al. 1997; Muraleedharan et al. 2000; Rein et al. 2009) appear to be proportionally greater than they are for combustion of above-ground fuels (IPCC, 2006). In particular, there seems, as expected, to be a marked increase in CO emissions as a percentage of total emissions, and a reduction in the percentage as CO2.At this time we propose using new emission factors for methane and nitrous oxide derived from peat combustion as specified in Section 4.5. We note that these are based on very limited information that needs to be urgently expanded by new research (Section 6.4).

Methodology for Estimation of Greenhouse Gas Emissions from Tropical Peatlands in Indonesia8
3. PRELIMINARY DEFAULT VALUES FOR PARTS OF THE METHODOLOGY
3.1 Temporal pattern of forest C accumulation by new plantings, or after disturbances such as logging and fire
Given the very limited number of studies of biomass in relation to age and disturbance history in forests growing on peat, and the significant variation reported, only very approximate values can be provided at the time of writing in 2010. The IPCC (2006) provides defaults for above-ground biomass of undisturbed tropical rainforests in Asia, but does not discriminate for those growing on peat. The IPCC (ibid.) suggests biomass of mature forests of 280 (range 120-680) and 350 (range 280-520) t/ha for continental and insular locations, respectively. Natural forests growing on peat also show a wide range of growth rates and of biomass stocks at maturity, even within a relatively small area (Peat and GHG Panel 2010).
The IPCC (2006) provides the following defaults for growth rates (t/ha/yr) of natural tropical rainforests in Asia:
Continental locations (≤20 yr old) 7.0 (range 3.0-11.0) (>20 yr old) 2.2 (range 1.3-3.0) Insular locations (≤20 yr old) 13 (>20 yr old) 3.4
For plantations, the IPCC does provide defaults for biomass and growth rates, but because these vary so much with species, age, site conditions and management practices, local data should be used.
All the above numbers, which are expressed as ‘t’ dry matter/ha, can be converted to C by multiplying by 0.5.
3.2 Root-shoot (R/S) ratios for forests growing on peat soils
Globally, R/S ratios range from ~ 0.2-0.5 for forests (Mokany et al. 2007). The saturated rooting environment in peat swamp forests may result in lower R/S ratios, but some of the reported values seem unrealistically low, perhaps reflecting methodological errors. We propose using an interim default value of 0.2 to estimate root biomass from above-ground biomass.There is an urgent need for further field studies to strengthen the basis for estimating temporal change in root biomass in tropical peat forests.
3.3 Emission factors for GHG release in peat fires
At this time, the emission factor for CO2 for combustion of above-ground biomass should be taken from IPCC (2006) as 1580 g/kg of fuel burnt (Section 3.5). For peat fires, the 60% emission of combusted C as CO2 + CO (~ 1100 g/kg of fuel burnt) measured by Rein et al. (2009) is proposed. There is an urgent need for further research to strengthen the basis for this default value for tropical peat fires because it has a major impact on estimation of CO2 emissions.
For the non-CO2 GHGs, the following IPCC (2006) default values should be used for both combustion of above-ground biomass and for combustion of peat: methane 6.8; nitrous oxide 0.2. Whilst there is some evidence that the emission factors for these gases are higher under smouldering combustion, there are too few reliable data to justify use of a different default value. Again, research to support emission factors for tropical peat fires is an urgent priority

Methodology for Estimation of Greenhouse Gas Emissions from Tropical Peatlands in Indonesia 9
3.4 Net emissions of CO2 from biological processes
Based on the limited number of direct field measurements of CO2 emissions from the peat surface in the Kampar region of Indonesia (Hooijer et al. 2009) from relatively root-free (measurements taken either in unplanted areas, or far from trees) locations, an interim default flux of 75 t CO2/ha/yr is proposed. The authors suggest a range from 50-100 t CO2/ha/yr.
These figures are higher than those inferred in Figure 2 above, possibly due to greater drainage depths and more recently drained peat at Kampar. There is also very high uncertainty in the assumed conversion from peat subsidence to gaseous CO2 emissions used in Figure 2.
3.5 Emissions of non-CO2 GHGs from biological processes
Based on our review of available flux data for tropical peat systems (Peat and GHG Panel, 2010), the following defaults (expressed as t CO2 equivalents/ha/yr to account for global warming potentials) are proposed:
Methane: < 0.3 for all land management systems
Nitrous oxide: < 1.5 for all land management systems other than agriculture ~ 34 for agriculture.
Methodology for Estimation of Greenhouse Gas Emissions from Tropical Peatlands in Indonesia10
4. FIELD MONITORING REQUIRED TO SUPPORT AND IMPLEMENT THE METHODOLOGY
4.1 Remote sensing of change in vegetation cover, vegetation condition, extent of fire, and change in peat height
As described by the Peat and GHG Panel (2010), a range of relevant remote-sensing data exists to support spatial GHG accounting. Landsat imagery can be used to estimate annual change in forest cover, and to monitor areas burnt (supported also by MODIS satellite ‘hot spot’ data). High resolution data (e.g. from ‘Rapid Eye’) can be used to estimate change in forest condition (e.g. degradation). Airborne Light Detection and Ranging (LiDAR) can be used to measure change in peat height caused either by fire or decomposition of peat.
4.2 Ground measurement of temporal change in ground water table depth and change in peat height
A network (grid or transects) of ‘dip wells’ can be used to monitor changes in depth of the ground water table throughout the year. Similarly, a network of metal poles that are well grounded to the mineral soil can be used to monitor change in peat height at appropriate timescales (for example after fire).
Monitoring of the mass of peat burnt, using either steel rods or LiDAR, can be used to build a better understanding of how moisture content, peat characteristics, fire history and above-ground fuel loads affect the mass of peat burnt, and to help devise improved models for estimating peat consumption at the landscape scale.
4.3 Change in area and growth rate of new forest plantings
A combination of Landsat imagery and local knowledge (e.g. of species planted as part of land development plans) can be used to estimate the net annual change in area of important plantation species such as Acacia, oil palm and others. Inventories and models are required to estimate, spatially, temporal patterns of forest growth, which underpin calculation of ‘C accumulation curves’ (Figure 1) for biomass (above- and below-ground).

Methodology for Estimation of Greenhouse Gas Emissions from Tropical Peatlands in Indonesia 11
5. CRITICAL UNCERTAINTIES TO BE ADDRESSED BY FURTHER RESEARCH
5.1 Spatial variation in important peat characteristics
Peat characteristics vary greatly spatially due to difference in vegetation, and to variation in environmental factors affecting peat formation. The stocks of C and N in peat by depth represent the starting point for estimating GHG emissions following disturbance (e.g. drainage, or combustion by fire). There is a critical need for a better, finer-scale, map of peat C and N stocks by depth to which the areas and nature of disturbance (e.g. depth of drainage, depth of peat burnt in fire) can be linked.
5.2 The quantitative relationship between peat subsidence and net (root-free) CO2 emissions
The relationship between subsidence and CO2 emissions is so fundamental to a practical methodology for estimating CO2 emissions, that research to strengthen it and to evaluate its generality across landscapes is of a very high priority.A more complete synthesis of existing information (including ‘grey’ literature and unpublished work) and a program of new research, is urgently needed to strengthen understanding of the relationships between drainage depth, subsidence and CO2 emissions resulting from peat decomposition. Part of the research program will need to focus on getting better spatial estimates of important peat characteristics such as bulk density and C and N concentrations.The above research may underpin the use of simpler proxies such as change in peat depth or average drainage depth for monitoring and estimating rates of biological oxidation of peat.
The linkage between the C and N cycle, in drained or otherwise disturbed peat requires further consideration. Biological release of large amounts of C from peat will also result in the mineralisation of very large amounts of N. Key questions to address include: • What is the fate of this N? • How much is subsequently nitrified and emitted as N2O from heavily disturbed peat forests? Further research is required to answer these questions. In the meantime, we adopt the approach described in Section 4 to account for biological emissions of N2O from peat.
5.3 Area burnt and mass of peat combusted in fire
The area of forest burnt can be determined from Landsat imagery, and can also be approximated from MODIS hot spot data. While it is possible to use measurements of lowering of peat height combined with information on peat C stocks/unit of peat depth in order to monitor and then estimate the mass of peat C combusted, this is an onerous task over large areas and where access is difficult. A more practical approach is to use LiDAR and ground measurements as research tools to build a solid understanding of how factors such as past fire history, peat moisture content, peat type, and the mass of above-ground fuel affect the amount of peat burnt in a particular fire. Using this information, a medium-term objective is to develop a robust set of ‘rules’ (look-up table) that can be used to estimate the amount of peat burnt under a range of burning conditions. This will remove the need to monitor the amount of peat burnt using either remote-sensing or metal poles.
Methodology for Estimation of Greenhouse Gas Emissions from Tropical Peatlands in Indonesia12
5.4 Emission factors for each important GHG in different types of peat fire
Emission factors for CO2, CO, and other C compounds from peat fires are very poorly understood and result in very large uncertainties in GHG emissions from peat fires. There are very few measurements of GHG emissions from burning peat. It is critical to get more robust data on the effects of peat type (chemistry) and burning conditions (especially variations in moisture content) on the nature of GHG emissions, so as to be able to establish more reliable emission factors. Measurements of GHG emissions during the combustion of a range of peats under a range of burning conditions in the laboratory, using methods that properly simulate combustion in the field, such as those adopted by Rein et al. (2009), are urgently needed.
5.5 Temporal pattern of forest C accumulation by new plantings, or after disturbances such as logging and fire
There are limited data available from the peat swamp forests of Central Kalimantan for estimating accurate values of C change (the C accumulation curve) in living biomass in undisturbed or disturbed forests. The following studies, which should be conducted in collaboration with those developing INCAS, are required to provide improved estimates of peat swamp forest C pools and their rates of change:
a) Forest stratification, followed by the partitioning of C in biomass components for different forest sub-types b) Quantifying the short and longer-term impacts of disturbances (logging and fire) on C stocks c) More studies of below-ground biomass across forest sub-types and levels of disturbance in order to improve
knowledge of the ratio between below and above-ground biomass under different management regimes d) Estimates of the C lost by root degradation under natural conditions and following disturbance, thus improving
the accuracy of constants of general allometry through the use of local forest condition data e) Improved knowledge of nutrient cycling and its relevance to forest C cycling, particularly following logging and
fire. A major limitation of previous research on the effects of fire on peatlands is the lack of integration of studies of both the immediate impacts on C and nutrient stocks and the longer-term dynamics of major factors controlling geochemical cycling
f) An enhanced use of remote sensing and spatial modelling to support estimation of C changes in living biomass over wide spatial scales based on calibrations from small-scale ground measurements.

Methodology for Estimation of Greenhouse Gas Emissions from Tropical Peatlands in Indonesia 13
6. PROGRESSIVE REFINEMENT OF THE METHODOLOGY
Despite the emerging research that highlights the significant contribution of tropical peatlands to global GHG emissions, these areas are heterogeneous and still relatively under-studied in terms of C pools and GHG fluxes. Estimating the effects of disturbance on net GHG balance is complex, and the initial methodology described here requires on-going refinement based on experience, new science, and evolving policy needs. In particular, there is a need for tools that can provide reliable fine-scale spatial estimates of annual variation in net GHG balance.

Methodology for Estimation of Greenhouse Gas Emissions from Tropical Peatlands in Indonesia14
REFERENCES
Couwenberg, J., Dommain, R. and H. Joosten. 2009. Greenhouse gas fluxes from tropical peat swamps in Southeast Asia. Global Change Biology, 16, 1715-1732.
Hooijer, A., Silvius, M., Wösten, H. and S. Page. 2006. PEAT-CO2, Assessment of CO2 emissions from drained peat lands in SE Asia. Delft Hydraulics report Q3943.
Hooijer, A. Haasnoot, M., Van der Vat, M. and R. Vernimmen. 2008. Peatland Subsidence Scenarios for the EMRP Area. Technical Report Number 3, Master Plan for the Rehabilitation of the Ex-Mega Rice Project Area in Central Kalimantan.
Hooijer, A., Page, S. and J. Jauhiainen. 2009. First tentative findings on hydrology, water management, carbon
emissions and landscape ecology. Kampar Peninsula Science Based Management Support Project. Summary Interim Report to April, 2007-2008.
IAFCP Peat and GHG Panel. 2010. A review of the science underpinning a methodology for GHG accounting in tropical peat lands. February, 2010. IAFCP: Jakarta
IPCC. 2006. 2006 IPCC Guidelines for National Greenhouse Gas Inventories. Prepared by the National Greenhouse Gas Inventories Programme, Eggleston H.S., Buendia L., Miwa K., Ngara T. and K. Tanabe (eds). IGES: Japan.
Mokany, K., Raison, R.J. and A.S. Prokushkin. 2006. A critical review of Root: Shoot ratios in the worlds terrestrial biomes. Global Change Biology 12, 84-96.
Muraleedharan, T.R., Radojevic, M., Waugh, A. and A. Caruana. 2000. Emissions from the combustion of peat: an experimental study. Atmospheric Environment 34, 3033-3035.
Page, S. E., A. Hoscilo, J. Jauhiainen and others (2009). Ecological restoration of tropical peatlands in Southeast Asia. Ecosystems 10.1007/s10021-008-9216-2.
Rein, G., Cohen, S. and A. Simeoni. 200. Carbon emissions from smouldering peat in shallow and strong fronts. Proceedings of the Combustion Institute 32, 2489-2496.
Yokelson, R.J., Susott, R., Ward, D.E., Reardon, J. and D.W.T. Griffith. 1997. Emissions from smouldering combustion of biomass measured by open-path Fourier transform infrared spectroscopy. Journal Geophysical Research 102, 18865-18877.