Methodology for Environmental Profiles 2008 · PDF fileMethodology for Environmental Profiles...
106
Version 0.0 © BRE Global 2013 1 BRE Global Methodology for Environmental Profiles of Construction Products. SD6050
Transcript of Methodology for Environmental Profiles 2008 · PDF fileMethodology for Environmental Profiles...

Version 0.0 © BRE Global 2013 1
BRE Global Methodology for Environmental Profiles of Construction Products. SD6050

SD6050 Issue 1.0 BRE Global Environmental Profiles methodology 2008 2
Uncontrolled copy if printed. Valid on day of printing only. © BRE Global Ltd 2008
Contents
Acknowledgement ................................................................................................................................................ 5
Peer review statement .......................................................................................................................................... 6
Revision of BRE Global Methodology for Environmental Profiles .......................................................................... 7
Foreword .............................................................................................................................................................. 8
1 Scope of this document ............................................................................................................................... 12
2 Normative references .................................................................................................................................. 14
3 Terms and Definitions ................................................................................................................................. 16
4 Symbols, Abbreviations and Acronyms ........................................................................................................ 19
4.1 Symbols and Abbreviations ......................................................................................................................... 19
4.2 Acronyms ..................................................................................................................................................... 19
5 General aspects of the Environmental Profiles Scheme ............................................................................... 21
5.1 Goal ............................................................................................................................................................. 21
5.2 Scope ........................................................................................................................................................... 21
5.3 Objectives .................................................................................................................................................... 23
5.4 Audience ...................................................................................................................................................... 23
5.5 Programme operator .................................................................................................................................. 24
5.6 Involvement of interested parties ............................................................................................................... 24 5.6.1 Industry Stakeholders ......................................................................................................................... 24 5.6.2 Peer review panel ................................................................................................................................ 25
5.7 Responsibility for the Environmental Profiles .............................................................................................. 26
5.8 Product Category ......................................................................................................................................... 26
5.9 Comparability of Environmental Profiles of construction products ............................................................. 26
5.10 Data confidentiality ..................................................................................................................................... 26
5.11 Keeping the methodology up to date .......................................................................................................... 27
6 Methodological framework ......................................................................................................................... 28
6.1 General ........................................................................................................................................................ 28
6.2 Data collection ............................................................................................................................................ 28
6.3 Declared and functional units ..................................................................................................................... 29
6.4 System boundaries ...................................................................................................................................... 29 6.4.1 Boundary rule: Cut-off criteria for the inclusion of inputs and outputs.............................................. 29

SD6050 Issue 1.0 BRE Global Environmental Profiles methodology 2008 3
Uncontrolled copy if printed. Valid on day of printing only. © BRE Global Ltd 2008
6.4.2 Boundary rule: Cut-off criteria for environmental impacts ................................................................ 30 6.4.3 Boundary rule: Capital equipment and infrastructure ........................................................................ 30 6.4.4 Boundary rule: Energy use in factory and factory support offices ...................................................... 30 6.4.5 Boundary rule: Construction impacts.................................................................................................. 30 6.4.6 Boundary rule: Site wastage ............................................................................................................... 30 6.4.7 Boundary rule: Lifetime use: maintenance ......................................................................................... 31 6.4.8 Boundary rule: Lifetime use: contribution to lifetime - energy use in a building ............................... 31 6.4.9 Boundary rule: Demolition .................................................................................................................. 31 6.4.10 Boundary rule: Disposal ...................................................................................................................... 32
6.5 Data quality requirements .......................................................................................................................... 32
6.6 Energy ......................................................................................................................................................... 32 6.6.1 Electricity models ................................................................................................................................ 32 6.6.2 Renewable electricity .......................................................................................................................... 33 6.6.3 Fuels .................................................................................................................................................... 33 6.6.4 Waste derived fuels ............................................................................................................................. 34 6.6.5 Biofuels ................................................................................................................................................ 36 6.6.6 Combined Heat and Power (CHP) ....................................................................................................... 37
6.7 Transport ..................................................................................................................................................... 38 6.7.1 Transport to factory gate .................................................................................................................... 38 6.7.2 Transport from factory to site ............................................................................................................. 38 6.7.3 Calculating inventory data for transport ............................................................................................. 38
6.8 Disposal ....................................................................................................................................................... 39 6.8.1 Disposal routes for construction materials ......................................................................................... 39 6.8.2 Waste models for waste treatment and disposal ............................................................................... 39 6.8.3 Waste water treatment models .......................................................................................................... 39
6.9 Allocation .................................................................................................................................................... 40 6.9.1 Allocation of material flows ................................................................................................................ 40 6.9.2 Allocation, waste and recycling ........................................................................................................... 43 6.9.3 Allocation for post-consumer materials which are recycled and reused ............................................ 44
6.10 Units to be used for inputs and outputs ...................................................................................................... 46
6.11 Imports ........................................................................................................................................................ 46
6.12 Carbon cycle ................................................................................................................................................ 47
6.13 Adjusting carbon dioxide emissions for carbonation .................................................................................. 47
7 Life Cycle Impact Assessment ...................................................................................................................... 48
7.1 Characterisation factors .............................................................................................................................. 48
7.2 Normalisation .............................................................................................................................................. 49 7.2.1 Sources of normalisation data ............................................................................................................ 49
7.3 Weighting .................................................................................................................................................... 51
8 Reporting..................................................................................................................................................... 54
8.1 General ........................................................................................................................................................ 54
8.2 Project report .............................................................................................................................................. 54

SD6050 Issue 1.0 BRE Global Environmental Profiles methodology 2008 4
Uncontrolled copy if printed. Valid on day of printing only. © BRE Global Ltd 2008
8.3 Project documentation ................................................................................................................................ 54
8.4 Rules for data confidentiality ...................................................................................................................... 55
8.5 Content of an Environmental Profile ........................................................................................................... 56
9 Environmental Profiles Scheme programme development and operation ................................................... 57
9.1 Responsibilities of the programme operator ............................................................................................... 57
9.2 Responsibilities of the peer review panel .................................................................................................... 57 9.2.1 Competence of the peer review panel ................................................................................................ 57
9.3 Responsibilities of the manufacturer / trade association ............................................................................ 57
9.4 Verification .................................................................................................................................................. 58 9.4.1 Verification for generic data sets based on data from two or more manufacturers .......................... 58 9.4.2 Verification for proprietary data sets from a single manufacturer ..................................................... 58 9.4.3 Competency of verification staff ......................................................................................................... 58
Appendix 1 Performance and service life ........................................................................................................ 59
Appendix 2 The Environmental Profiles database and data quality requirements .......................................... 72
Appendix 3 Content of an Environmental Profile (EPD) ................................................................................... 79
Appendix 4 Background to the characterisation factors used to create the Environmental Profiles ................ 85
Appendix 5 Carbonation calculations .............................................................................................................. 90
Appendix 6 Data collection questionnaire ....................................................................................................... 94

SD6050 Issue 1.0 BRE Global Environmental Profiles methodology 2008 5
Uncontrolled copy if printed. Valid on day of printing only. © BRE Global Ltd 2008
Acknowledgement
The Environmental Profiles methodology was first published in 1999. This 2009 update has been made possible with the kind support of:
• BRE Trust
• Department for Children, Schools and Families (DCSF)
• Department for Business Enterprise and Regulatory Reform (BERR)
• Energy Savings Trust (EST)
• English Partnerships (now Homes and Communities Agency)
• Housing Corporation (now Homes and Communities Agency)
• HSBC
• National House Building Council (NHBC)
• Office of Government Commerce (OGC)
• Oxford Brookes University
• Post Office (Royal Mail)
• RBS
• Waste and Resources Action Programme (WRAP)
• Willmott Dixon
and the contribution of the Construction Products Association and its members.

SD6050 Issue 1.0 BRE Global Environmental Profiles methodology 2008 6
Uncontrolled copy if printed. Valid on day of printing only. © BRE Global Ltd 2008
Peer review statement
The following experts in LCA and buildings have undertaken a peer review of this methodology:
• Wayne Trusty, Athena Sustainable Materials Institute, Canada (Chair)
• John Bowdidge, Independent LCA expert, UK
• Eva Schmincke, Five Winds Consultancy, Germany
The peer review team congratulates BRE Global on the production of a well-researched and well-developed PCR methodology. The PCR methodology closely follows the requirements of the relevant ISO standards, while at the same time providing the necessary detail to enable the derivation of Type III Environmental Product Declarations (EPD).
Suggestions to improve the clarity of the PCR and to modify a number of technical issues were made and these were implemented by BRE Global.

SD6050 Issue 1.0 BRE Global Environmental Profiles methodology 2008 7
Uncontrolled copy if printed. Valid on day of printing only. © BRE Global Ltd 2008
Revision of BRE Global Methodology for Environmental Profiles
The BRE Global Environmental Profiles methodology will be revised by issue of revised editions or amendments. Details will be posted on our website at www.GreenBookLive.com. Specifically sections of the methodology most likely to be updated have been placed in appendices.
Technical or other changes which affect the requirements for the approval or certification of the product or service will result in a new issue. Minor or administrative changes (e.g. corrections of spelling and typographical errors, changes to address and copyright details, the addition of notes for clarification etc.) may be made as amendments.
The issue number will be given in decimal format with the integer part giving the issue number and the fractional part giving the number of amendments (e.g. Issue 3.2 indicates that the document is at Issue 3 with 2 amendments).
Users of BRE Global methodology should ensure that they possess the latest issue and all amendments.
SD6050 Issue 1.0 BRE Global Environmental Profiles methodology 2008 8
Uncontrolled copy if printed. Valid on day of printing only. © BRE Global Ltd 2008
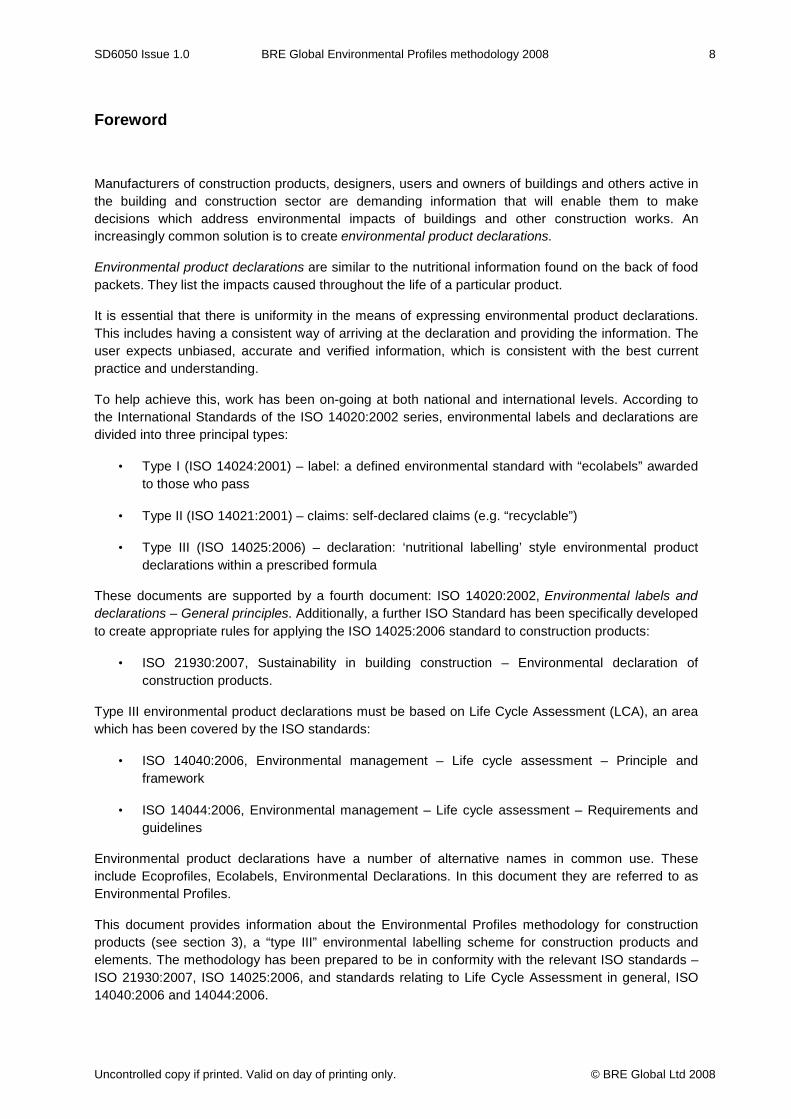
Foreword
Manufacturers of construction products, designers, users and owners of buildings and others active in the building and construction sector are demanding information that will enable them to make decisions which address environmental impacts of buildings and other construction works. An increasingly common solution is to create environmental product declarations.
Environmental product declarations are similar to the nutritional information found on the back of food packets. They list the impacts caused throughout the life of a particular product.
It is essential that there is uniformity in the means of expressing environmental product declarations. This includes having a consistent way of arriving at the declaration and providing the information. The user expects unbiased, accurate and verified information, which is consistent with the best current practice and understanding.
To help achieve this, work has been on-going at both national and international levels. According to the International Standards of the ISO 14020:2002 series, environmental labels and declarations are divided into three principal types:
• Type I (ISO 14024:2001) – label: a defined environmental standard with “ecolabels” awarded to those who pass
• Type II (ISO 14021:2001) – claims: self-declared claims (e.g. “recyclable”)
• Type III (ISO 14025:2006) – declaration: ‘nutritional labelling’ style environmental product declarations within a prescribed formula
These documents are supported by a fourth document: ISO 14020:2002, Environmental labels and declarations – General principles. Additionally, a further ISO Standard has been specifically developed to create appropriate rules for applying the ISO 14025:2006 standard to construction products:
• ISO 21930:2007, Sustainability in building construction – Environmental declaration of construction products.
Type III environmental product declarations must be based on Life Cycle Assessment (LCA), an area which has been covered by the ISO standards:
• ISO 14040:2006, Environmental management – Life cycle assessment – Principle and framework
• ISO 14044:2006, Environmental management – Life cycle assessment – Requirements and guidelines
Environmental product declarations have a number of alternative names in common use. These include Ecoprofiles, Ecolabels, Environmental Declarations. In this document they are referred to as Environmental Profiles.
This document provides information about the Environmental Profiles methodology for construction products (see section 3), a “type III” environmental labelling scheme for construction products and elements. The methodology has been prepared to be in conformity with the relevant ISO standards – ISO 21930:2007, ISO 14025:2006, and standards relating to Life Cycle Assessment in general, ISO 14040:2006 and 14044:2006.

SD6050 Issue 1.0 BRE Global Environmental Profiles methodology 2008 9
Uncontrolled copy if printed. Valid on day of printing only. © BRE Global Ltd 2008
BRE Global first published the Environmental Profiles methodology, “BRE Methodology for Environmental Profiles of construction materials, components and buildings” in 1999, with funding from the DETR and the involvement of over 20 trade associations and industry bodies. Following developments in LCA techniques and the work undertaken for the ISO Standards, BRE Global chose to update the methodology, a process which has involved extensive stakeholder consultation.
The purpose of this methodology is to describe the principles and framework for environmental declarations of construction products, including consideration of the reference service life (see section 3) of construction products over a building’s life cycle. This methodology forms the basis for the BRE Global Environmental Profiles Scheme, a Type III environmental declaration programme which enables manufacturers and trade associations to make Type III environmental declarations of construction products as described in ISO 14025:2006.
The overall goal of the BRE Global Environmental Profiles Scheme is to encourage the demand for, and supply of, construction products that cause less stress on the environment, through communication of verifiable and accurate information on environmental aspects of those construction products, thereby stimulating the potential for market-driven continuous environmental improvement.
This document will be of interest to individual construction product manufacturers and construction product trade associations wishing to prepare an Environmental Profile, and data users, including designers and clients, who wish to have a detailed understand of the basis of the information they are using.
There are two clear benefits to having a single, industry-agreed method that is applicable to all types of building product:
1. The application of the Environmental Profiles methodology allows manufacturers and trade associations to publish data about their products on the basis of a “level playing field”, i.e. in a way that is comparable and robust for competing product types.
2. Using data produced by this methodology will give confidence to designers and building clients who wish to ensure that they have taken full account of the life cycle environmental impacts of the construction products they are using, using the latest developments in life cycle assessment and that the data they are using has been produced such that competing products have been evaluated in a fair and independent manner.
For more information about the Environmental Profiles Scheme: www.greenbooklive.com
A diagram showing how the various elements of Environmental Profiling fit together and how it is used in building assessment schemes is given in Figure 1.

SD6050 Issue 1.0 BRE Global Environmental Profiles methodology 2008 10
Uncontrolled copy if printed. Valid on day of printing only. © BRE Global Ltd 2008
Figure 1: The key elements of the Environmental Profiles Scheme and its relationship to BREEAM1, the Code for Sustainable Homes2 and EcoHomes. This methodology is aimed primarily at the assessment and certification of products and materials for construction that are not wholly covered under current recognised standards and codes.
This scheme is reviewed by the BRE Global Sustainability Board which is a stakeholder technical board operated by BRE Global.
The methodology shall be used in conjunction with BRE Global Scheme Document SD 0283.
1 BREEAM Centre. BREEAM: BRE Environmental Assessment Method. www.breeam.org 2 Communities and Local Government (CLG). The Code for Sustainable Homes. Available from www.communities.go.uk/thecode or from www.planningportal.gov.uk 3 Scheme Document for Environmental Profiles Certification Scheme SD028. BRE Global Ltd.
*To receive a Green Guide to Specification rating and be eligible for credits in BREEAM, Code for Sustainable Homes and EcoHomes, data from individual manufacturers must be independently certified by BRE Global, or other licensed provider, to the Environmental Certification Scheme.
Generic data about products and processes the
manufacture uses but does not own or operate
Manufacturers data entered into Environmental Profiles Data
Capture Form
Data processed according to the rules set out in BRE
Methodology for Environmental Profiles of construction products
Data published as an Environmental Profile (also known as an Environmental
Product Declaration)*
Products can help contribute to a Green Guide to Specification A+ to E rating depending upon
specification build up
Materials Credits can be obtained for:
• BREEAM • Code for Sustainable
Homes • EcoHomes
Scope of Environmental Profiles Scheme

SD6050 Issue 1.0 BRE Global Environmental Profiles methodology 2008 11
Uncontrolled copy if printed. Valid on day of printing only. © BRE Global Ltd 2008
NOTE: Compliance with this BRE Global methodology does not of itself confer immunity from legal obligations. Users of the methodology should ensure that they possess the latest issue and all amendments.
NOTE: BRE Global welcomes comments of a technical or editorial nature and these should be addressed to “the Technical Director” at [email protected].
NOTE: BRE, BRE Global and LPCB are owned by the BRE Trust which is a registered charity. BRE Global tests, assesses, certificates and lists products and services within the construction, sustainability and fire and security sectors. For further information on our services please contact BRE Global, Watford, Herts. WD25 9XX or e-mail to [email protected].
NOTE: Listed products and services appear in the BRE Global’s Green Book Live which may be viewed on our website: www.GreenBookLive.com.

SD6050 Issue 1.0 BRE Global Environmental Profiles methodology 2008 12
Uncontrolled copy if printed. Valid on day of printing only. © BRE Global Ltd 2008
Environmental Profiles: a methodology for the environmental declaration of construction products in the UK
1 Scope of this document
This is a technical document and has not been prepared for the lay reader. For a simpler explanation of the scheme, see the BRE Global website.
This document provides the principles and requirements of the methodology that underpins the BRE Global Environmental Profiles Scheme, a scheme that produces Type III environmental product declarations for construction products. Under the conventions of this scheme, the declaration is known as an Environmental Profile.
The document describes the general programme requirements and the product category rules (PCR) (see section 3) for the Environmental Profiles of construction products. This methodology is based upon International Standard ISO 21930:2007 Sustainability in building construction – Environmental declaration of construction products. This International Standard contains specific requirements for construction products and complements International Standard ISO 14025:2006 Environmental labels and declarations – Type III environmental declarations – Principles and procedures, ISO 14040:2006 Environmental management – Life cycle assessment – Principles and framework, and ISO 14044:2006 Environmental management – Life cycle assessment – Requirements and guidelines.
NOTE: In ISO 21930:2007 Sustainability in building construction – Environmental declaration of construction products, EPD is an abbreviation used to represent both the single and plural full form designation of ‘environmental product declaration(s)’, which is intended to be synonymous with the designation ‘Type III environmental declaration’. In the practice of developing EPD, programmes or their declarations are referred to by various names such as Eco-Leaf, eco-profile, environmental declaration of products and environmental profile. This scheme uses the name Environmental Profile.
This document describes in detail the consistent approach to the identification and assessment of the impacts of all construction products over their life cycle that is used in the Environmental Profiles Scheme, including:
• Goal and scope,
• Inventory data collection procedures,
• Preferred data sources,
• Consistent treatment of transport,
• Calculation of emissions from fuel use,
• Allocating impacts to products from multiple product lines,
• Allocating impacts to products which are recycled,
• Impact assessment procedures for classification, characterisation and normalisation,
• Format for Environmental Profiles.

SD6050 Issue 1.0 BRE Global Environmental Profiles methodology 2008 13
Uncontrolled copy if printed. Valid on day of printing only. © BRE Global Ltd 2008
The Environmental Profiles are intended for business-to-business use, i.e. from manufacturer/trade association to designer/client. They may also be used for the communication of information from business to consumer.

SD6050 Issue 1.0 BRE Global Environmental Profiles methodology 2008 14
Uncontrolled copy if printed. Valid on day of printing only. © BRE Global Ltd 2008
2 Normative references
Document ISO 21930:2007, Sustainability in building construction – Environmental declaration of construction products contains provisions, which, through reference in this text, constitute provisions of this methodology.
ISO 21930:2007 draws on other related International Standards. To provide an indication of the range of related Standards a list is provided here. The related standards include:
• ISO 6707-1:2004, Building and civil engineering – Vocabulary – Part 1: General terms
• ISO 14001:2004, Environmental management systems – Specification with guidance for use
• ISO 14020:2002, Environmental labels and declarations – General principles
• ISO 14021:2001, Environmental labels and declarations – Self-declared environmental claims (Type II environmental labelling)
• ISO 14024:2001, Environmental labels and declarations – Type I environmental labelling – Principles and procedures
• ISO 14025:2006, Environmental labels and declarations – Type III environmental declarations – Principles and procedures
• ISO 14040:2006, Environmental management – Life cycle assessment – Principles and framework
• ISO 14044:2006, Environmental management – Life cycle assessment – Requirements and guidelines
• ISO/TR 14047:2003, Environmental management – Life cycle impact assessment – Examples of application of ISO 14042
• ISO 14050:2002, Environmental management – Vocabulary ISO/DIS 15392, Buildings and constructed assets – Sustainability in building construction – General Principles
• ISO 15686-1:2000, Buildings and constructed assets – Service life planning – Part 1: General principles
• ISO 15686-2:2001, Buildings and constructed assets – Service life planning – Part 2: Service life prediction methods
• ISO/DIS 15686-8 Buildings and constructed assets – Service life planning – Part 8: Reference service life
• ISO/TS 21929-1:2006, Buildings and constructed assets – Sustainability in building construction – Sustainability indicators – Part 1 – Framework for development of indicators for Buildings
• ISO/TS 21931-1:2006, Buildings and constructed assets – Sustainability in building construction – Framework for Assessment of Environmental Performance of Construction Works – Part 1 – Buildings

SD6050 Issue 1.0 BRE Global Environmental Profiles methodology 2008 15
Uncontrolled copy if printed. Valid on day of printing only. © BRE Global Ltd 2008
• ISO/CD 21932:2006, Buildings and constructed assets – Sustainability in building construction – Terminology

SD6050 Issue 1.0 BRE Global Environmental Profiles methodology 2008 16
Uncontrolled copy if printed. Valid on day of printing only. © BRE Global Ltd 2008
3 Terms and Definitions
For the purposes of this methodology, the terms and definitions given in ISO 21930:2007 apply.
NOTE: Terms are not defined where they retain their normal dictionary definition. Where bold type is used within a definition, this indicates a cross reference to another term defined in this clause, and the number reference for the term is given in parentheses.
3.1 ancillary product / complementary product
building product (see section 3.2) that enables another building product to fulfil its purpose in the intended application, for example fasteners used to attach structural panels to framing members
3.2 building product
goods or services used during the life cycle of a building or other construction works
NOTE: In this methodology, the term “product” used alone relates not only to product systems but can also include service systems. In either case, the declaration is presented in a manner that clearly indicates whether the declaration applies to goods, or only to a part of the goods or packaging, or to an element of service. This is discussed in ISO 14025:2006, see section 7.2.2.
NOTE: The manufacturing or processing of goods used as a building product may take place at the factory or on the construction site.
NOTE: The use of services can occur at any stage of the life cycle of the building or other construction works.
NOTE: It is possible to have an Environmental Profile (see section 3.17) for a material, a building product, a component, an assembly and/or a building element. The Environmental Profiles of a component, assembly or building element can incorporate the results of the Environmental Profiles of all the assembled materials and construction products. This is described in section 5.4 Modularity in ISO 14025:2006.
NOTE: Adapted from the definition of product in ISO 6707-1:2004 and ISO 14021:2001.
NOTE: Whereas ISO use ‘building product’, in this methodology the term ‘construction product’ is used. There is no difference in meaning intended between the two terms as defined above and the choice is based on the more common usage of ‘construction product’ in the UK.
3.3 characterisation factor
factor derived from a characterisation model which is applied to convert an assigned life cycle inventory analysis (LCI) result to the common unit of the category indicator
3.4 declared unit
quantity of a building product (see section 3.2) for use as a reference unit in an Environmental Profile (see section 3.17), based on LCA, for the expression of environmental information needed in information modules (see section 3.7). For example mass (kg), volume (m³)
NOTE: The declared unit will only be used where the function and the reference scenario for the whole life cycle, on the building level, cannot be stated.

SD6050 Issue 1.0 BRE Global Environmental Profiles methodology 2008 17
Uncontrolled copy if printed. Valid on day of printing only. © BRE Global Ltd 2008
3.5 functional unit
quantified performance of a product system for a building product (see section 3.2) for use as a reference unit in an Environmental Profile (see section 3.17) based on LCA
3.6 gate
point at which the building product (see section 3.2) or material leaves the factory before it becomes an input into another manufacturing process or before it goes to the distributor, a factory or building site
3.7 information module
compilation of data to be used as a basis for a Type III environmental declaration (see section 3.17), covering a unit process or a combination of unit processes that are part of the life cycle of a product
3.8 non-renewable resource
resource that exists in a fixed amount that cannot be replenished on a human time scale
3.9 PCR review
process whereby a third party (see section 3.15) panel verifies the product category rules (see section 3.11)
3.10 product category
group of construction products (see section 3.2) that can fulfill equivalent functions
3.11 product category rules (PCR)
set of specific rules, requirements and guidelines for developing Type III environmental declarations (see section 3.16) for one or more product categories (see section 3.10). The BRE Global methodology applies to the product category “construction products”.
NOTE: The term PCR has been replaced by ‘methodology’ in this document. The two terms may be used interchangeably.
3.12 reference service life
service life of a building product (see section 3.2) that is known or to be expected under a particular set, i.e., a reference set, of in-use conditions and which may form the basis of estimating the service life under other in-use conditions
NOTE: The reference service life is applied in the functional unit (see section 3.5) / declared unit (see section 3.4)
3.13 renewable resource
resource that is grown, naturally replenished or cleansed on a human time scale, e.g. trees in forests, grasses in grasslands and fertile soil.
NOTE: A renewable resource is capable of being exhausted, but may last indefinitely with proper stewardship.

SD6050 Issue 1.0 BRE Global Environmental Profiles methodology 2008 18
Uncontrolled copy if printed. Valid on day of printing only. © BRE Global Ltd 2008
3.14 sequestration (of carbon)
the removal and long-term storage of carbon dioxide from the atmosphere through the use of natural carbon sinks, primarily in forests in the form of increasing plant biomass
3.15 third party
person or body that is recognised as being independent of the parties involved, as concerns the issues in question
NOTE: "Parties involved" are usually supplier ("first party") and purchaser ("second party") interests.
3.16 Tonne.km (t.km)
unit of distance accounting for the mass being transported; expression of Mass and Distance.
NOTE: 100t transported 1km (100t.km) is equivalent to 1t transported 100km (100t.km)
3.17 Type III environmental declaration / environmental product declaration (EPD) / Environmental Profiles
environmental declaration providing quantified environmental data using predetermined parameters and, where relevant, additional environmental information
NOTE: The predetermined parameters are based on the ISO 14040 series of standards, which is made up of ISO 14040:2006 and ISO 14044:2006.
NOTE: The additional environmental information may be quantitative or qualitative.
3.18 waste
This method does not seek to define waste. ISO 21930:2007 defines waste as ‘substances or objects which the holder intends or is required to dispose of’. This definition is included here as a useful description.
NOTE: The ISO definition is taken from the Basel Convention on the Control of Trans-boundary Movements of Hazardous Wastes and Their Disposal (22 March 1989) but is not confined to hazardous waste

SD6050 Issue 1.0 BRE Global Environmental Profiles methodology 2008 19
Uncontrolled copy if printed. Valid on day of printing only. © BRE Global Ltd 2008
4 Symbols, Abbreviations and Acronyms
4.1 Symbols and Abbreviations
Energy mega joule MJ
Energy kilowatt hour kWh
Mass tonne (metric ton) t
Mass kilogram kg
Mass gram g
Surface square metres m2
Volume cubic metres m3
4.2 Acronyms
BRE Building Research Establishment
BREEAM BRE Environmental Assessment Methodology
CFC chloro-fluoro-carbons
CHP combined heat and power
CML University of Leiden: in the Netherlands
CSH Code for Sustainable Homes
EPD environmental product declaration
EU European Union
GWP global warming potential
HCFC hydrogenated chloro-fluoro-carbons
ISO international standards organisation
LCA life cycle assessment
LCI life cycle inventory
LCIA life cycle impact assessment
LEC levy exemption certificates
ODP ozone depletion potential
PCR product category rules

SD6050 Issue 1.0 BRE Global Environmental Profiles methodology 2008 20
Uncontrolled copy if printed. Valid on day of printing only. © BRE Global Ltd 2008
REGO renewable energy guarantees of origin certificates
ROC renewable obligation certificates
VOC volatile organic compounds

SD6050 Issue 1.0 BRE Global Environmental Profiles methodology 2008 21
Uncontrolled copy if printed. Valid on day of printing only. © BRE Global Ltd 2008
5 General aspects of the Environmental Profiles Scheme
5.1 Goal
The overall goal of Environmental Profiles is to encourage the demand for, and supply of, construction products that cause less stress on the environment, through communication of verifiable and accurate information on environmental aspects of those construction products, thereby stimulating the potential for market-driven continuous environmental improvement. This is part of the BREEAM family of tools, created to enable more sustainable construction.
This document provides information about the methodology for preparing Environmental Profiles for construction products.
This common methodology used to create Environmental Profiles allows for comparisons to be made between different types of construction products, based on units of equivalent functional performance at a building level, created according to the standards required by 2006 Approved Building Regulations for England and Wales.
5.2 Scope
This methodology provides the rules necessary for the declaration of environmental information of construction products in the form of Environmental Profiles. Environmental Profiles are used for the assessment of the environmental performance of the fabric, structure, finishes and fittings of buildings.
The methodology identifies all the significant environmental aspects associated with the life cycle of construction products, according to the guidance on identifying significant environmental aspects in ISO 14001.
Only environmental impacts and aspects are considered. The social and economic aspects of sustainability are excluded.
The working environment (during product production or construction) is not included.
The impacts in use/operation (e.g. heat loss avoided by use of insulation) are excluded, except maintenance and replacement of the products over their life. These aspects of materials performance are considered in the building performance criteria within the BREEAM standards and in the Code for Sustainable Homes. They are also considered in envest24, which brings the data from Environmental Profiles together at a whole building level.
The rules stating what is included and what is excluded when creating an Environmental Profile are set out in section 6.4.
NOTE: The impacts in use/operation depend on a number of factors outside the scope of an Environmental Profile for construction products, including the size, form and function of the building and occupant behaviour.
Environmental information in an Environmental Profile covering all life cycle stages (“cradle to grave”) comprises data from the following four life cycle stages:
4 BRE. Envest. Available from www.bre.co.uk/envest

SD6050 Issue 1.0 BRE Global Environmental Profiles methodology 2008 22
Uncontrolled copy if printed. Valid on day of printing only. © BRE Global Ltd 2008
• product stage (raw material supply, transport, manufacturing of products, and all upstream processes from cradle to gate);
• construction process stage (transport to the building site and building installation/construction);
• use stage (maintenance, repair and replacement, refurbishment);
• end of life stage (recycling and disposal; all including transport).
From distinguishing these different levels, it is clear that there are two types of Environmental Profiles: for products and for building elements. These have distinct properties, as shown in Table 1.
Providing the data for these is the responsibility of different parties and the table distinguishes this.
This document can therefore be used in two ways: to identify the basic requirements of a manufacturer who wishes to prepare an Environmental Profile and for interested parties to identify how the data is treated to create an Environmental Profile once it has been provided to BRE Global Limited, the programme operator.
Table 1: The three types of Environmental Profile
Profile type
Life Cycle stages included Study units Use for Comparison
Responsible party
Cradle to
gate
Production stage (raw material supply, raw material transport, manufacturing of products, and all upstream processes from cradle to gate).
Information module: per tonne
Shall not be used for comparison
In-factory (gate to gate) data collected by manufacturer
Pre-factory data for raw materials provided by BRE Global
Cradle to site
As for cradle to gate
AND
Construction process stage (transport of product to the building site and wastage from building installation/construction only) including transport and disposal of waste.
Information module: per square metre installed element
Shall not be used for comparison
As above
AND
Construction process data provided by BRE Global
Cradle to
grave
As for cradle to site
AND
Use stage: repair, replacement, maintenance and refurbishment including transport of any materials and disposal of waste over the study period.
Demolition: is expected to occur any time at or after the end of the study period and is included within this Environmental Profile. It includes transport and disposal of waste.
Functional unit: per square metre installed element over a 60-year study period in the building
Can be used for comparison if the functional unit is equivalent
As above
AND
Life-time data provided by BRE Global

SD6050 Issue 1.0 BRE Global Environmental Profiles methodology 2008 23
Uncontrolled copy if printed. Valid on day of printing only. © BRE Global Ltd 2008
NOTE: It is possible to have an Environmental Profile for a material, for a product and for a component, an assembly and/or a building element. The Environmental Profiles of a component, assembly or building element can incorporate the results of the Environmental Profiles of all the assembled materials and construction products. This is described in section 5.4 Modularity in ISO 14025:2006.
NOTE: Transport of people for any form of labour at any stage in the life cycle is not included, e.g. construction or maintenance.
The terminology of ‘cradle to cradle’ assessment is often applied to LCA models. The Environmental Profiles methodology does not use this description and BRE Global prefer to use the term ‘cradle to grave’ assessment. This is in recognition of the fact that Environmental Profiles are most commonly communicated using a defined study period of 60-years (see Appendix 1). This means they have a clear time horizon and point of conclusion. The reality of this however, is that many of the material LCA models could also be accurately described as ‘cradle to cradle’ assessments. Cradle to cradle assessment occurs when materials at the end of their life are usefully reused or recycled into future scenarios. This most commonly occurs with metals, but other materials such as plastic, timber and aggregate and concrete also benefit from this practice. In conclusion, although the Environmental Profiles methodology uses the description of cradle to grave to characterise its life cycle models, the reality is that many of the models can also be accurately described as cradle to cradle in scope.
5.3 Objectives
The purpose of an Environmental Profile for construction products is
1. To provide a measurable and verifiable input for the assessment of the environmental performance of buildings.
2. For interested parties to compare the environmental impacts of different construction products as they are used within a building, based on units of equivalent functionality.
3. To provide a means of collecting relevant data for the preparation of tools for comparing the environmental impacts of construction products, including the Green Guide to Specification5 and the envest2 software for the environmental assessment of whole buildings. These are used to give credits for the use of materials with a lower than average environmental impact in the BREEAM family of environmental assessment tools for buildings and the Code for Sustainable Homes.
5.4 Audience
Environmental Profiles of construction products are intended to provide information for planning and assessing buildings and are intended mainly for business-to-business communication. This does not preclude their use for business to consumer purposes, where third party verification has been obtained.
The users of this methodology are information users, who may include trade associations, manufacturers in the manufacturing chain, designers, developers, architects, contractors, facility managers and their clients.
5 BRE Global. The Green Guide to Specification Online. www.thegreenguide.org.uk

SD6050 Issue 1.0 BRE Global Environmental Profiles methodology 2008 24
Uncontrolled copy if printed. Valid on day of printing only. © BRE Global Ltd 2008
5.5 Programme operator
The programme operator is BRE Global. Third Party verification is provided by BRE Global. (see section 9).
5.6 Involvement of interested parties
The process of developing this methodology included an open, participatory consultation with interested parties and effort was made to achieve a consensus throughout the process.
This methodology has been compiled to reflect the conclusions of the industry consultation exercise including discussions with the Construction Products Association and its members, the project steering group, and the BRE Global Sustainability Board. Every attempt has been made to accurately reflect the agreed conclusions of these discussions.
5.6.1 Industry Stakeholders
This document has been produced by BRE Global. The research was undertaken in consultation with three groups:
1. The Green Guide project steering group
2. The Construction Products Association manufacturers advisory group
3. A panel of LCA expert advisors
The technical quality of the methodology development process has been overseen by the BRE Global Sustainability Board.
5.6.1.1 Group 1 – Green Guide project steering group
This work has been made possible with the financial sponsorship of the Green Guide steering group:
• BRE Trust
• BRE and BRE Global
• Department for Children, Schools and Families (DCSF)
• Department for Business Enterprise and Regulatory Reform (BERR)
• Energy Savings Trust (EST)
• English Partnerships (now Homes and Communities Agency)
• Housing Corporation (now Homes and Communities Agency)
• HSBC
• National House Building Council (NHBC)
• Office of Government Commerce (OGC)
• Oxford Brookes University
• Post Office (Royal Mail)

SD6050 Issue 1.0 BRE Global Environmental Profiles methodology 2008 25
Uncontrolled copy if printed. Valid on day of printing only. © BRE Global Ltd 2008
• RBS
• Waste and Resources Action Programme (WRAP)
• Willmott Dixon
A number of additional interested parties had membership of the project steering group to ensure construction industry representation:
• John Bowdidge, Independent LCA expert
• Construction Products Association*
• National Building Specification (NBS)
• RIBA
• RICS
NOTE: *The Construction Products Association was a member of this group as representatives of the construction products industry but made no financial contribution to the project. This status was established to ensure no conflict of interest and to reflect the substantial contribution of the construction products sector in meeting the cost of processing new Environmental Profiles LCA data. None of the additional parties were financial sponsors of the project.
5.6.1.2 Group 2 – Construction Products Association: manufacturers advisory group
This was a special working group convened by the Construction Products Association and was called the manufacturers advisory group. Other trade associations not affiliated to the Construction Products Association and industry members of the BRE Global Environmental Profiles Certification Scheme were also consulted throughout the development process.
5.6.1.3 Group 3 – LCA expert advisory panel
The following experts in LCA and building materials were consulted on different aspects during the development of this methodology:
• Wayne Trusty, Athena Sustainable Materials Institute, Canada.
• John Bowdidge, independent LCA expert, UK.
• Jean Luc Chevalier, Head of the Environment and Durability Division, Materials Department CSTB (Centre Scientifique et Technique du Bâtiment), France.
• Sverre Fossdal, Senior Researcher, Norwegian Building Research Institute.
• Rolf Frischknecht, ESU-services, Switzerland.
• Tarja Häkkinen, Chief Research Scientist, VTT Building and Transport, Finland.
5.6.2 Peer review panel
The following experts in LCA and buildings have undertaken a peer review of this methodology:
• Wayne Trusty, Athena Sustainable Materials Institute, Canada. (Chair).
SD6050 Issue 1.0 BRE Global Environmental Profiles methodology 2008 26
Uncontrolled copy if printed. Valid on day of printing only. © BRE Global Ltd 2008
• John Bowdidge, Independent LCA expert, UK.
• Eva Schmincke, Five Winds Consultancy, Germany.
5.7 Responsibility for the Environmental Profiles
Data for an Environmental Profile are in two forms: the raw data (Life Cycle Inventory – LCI) and the data processed into environmental impacts assessed by Characterising and Normalising the data (Section 7) so that it is known as Life Cycle Assessment (LCA) data.
Two types of Environmental Profile exist:
• with generic data provided by trade associations and groups of manufacturers.
• with proprietary data provided by manufacturers and certified by BRE Global.
The responsibility for the data is different according to the type of data.
The manufacturer, group of manufacturers or Trade Association who have provided the data for the building product is the owner of and takes responsibility for the LCI data, in both proprietary and generic Environmental Profiles.
BRE Global is the owner of and takes responsibility for the LCA data in Proprietary, Certified Environmental Profiles and with generic data.
BRE Global has an agreement with the manufacturers and trade associations it works with to use the LCA data that it prepares on their behalf within tools such as the Green Guide to Specification and to publish Environmental Profiles with their permission.
5.8 Product Category
At its highest level, the scheme is applied to a single product category: construction materials. This document sets out the Product Category Rules (PCR) for all construction materials. Where exceptions apply for particular groups, these are clearly stated.
NOTE: The methodology can be applied to non-building applications such as infrastructure. An appropriate functional unit will be created.
5.9 Comparability of Environmental Profiles of construction products
Comparison of construction products using Environmental Profiles shall only be carried out at the building level, using a functional unit of an installed element within a scenario. The Environmental Profile “Per installed element over 60-year study period in the building (cradle to grave)” provides this. This document describes the rules and requirements for how the 60-year scenario is created. Comparability of construction products using Environmental Profiles is in accordance with the requirements for comparability as described in ISO 14025:2006, Clause 5.6.
Environmental Profiles for the equivalent functional unit prepared using the methodology set out in this document are deemed to be comparable.
5.10 Data confidentiality
Data from manufacturers is stored securely. Access is limited to staff working as part of the Environmental Profiles Scheme. Data confidentiality as a restriction on publication is described in Section 8.

SD6050 Issue 1.0 BRE Global Environmental Profiles methodology 2008 27
Uncontrolled copy if printed. Valid on day of printing only. © BRE Global Ltd 2008
5.11 Keeping the methodology up to date
This is the second edition of the Environmental Profiles methodology. The first edition was published in 1999. An addendum to the first edition was published in 2000.
Developments in the LCI data sources and standards and Building Regulations for England and Wales will be reviewed by BRE Global at a minimum interval of three years. BRE Global as the programme operator will form an opinion on significance of the changes identified, with contribution from the PCR Review Panel. The BRE Global Sustainability Board will make the final decision. The intention is to maintain the PCR according to latest best practice, within the financial constraints of operating the scheme such that it is commercially viable and accessible to new and existing manufacturer participants.

SD6050 Issue 1.0 BRE Global Environmental Profiles methodology 2008 28
Uncontrolled copy if printed. Valid on day of printing only. © BRE Global Ltd 2008
6 Methodological framework
6.1 General
The methodology is designed to be consistent, scientifically robust and to ensure that burdens and impacts are comprehensively accounted for without any double counting or undercounting.
The methodology is also designed to be consistent for all stages of the life cycle across all material classes – i.e. the winning of raw materials and fuels, energy conversion, chemical processes, manufacture, fabrication, transport, waste from installation (see section 6.4), use (i.e. repair and maintenance, refurbishment), demolition, reuse or recycling and disposal.
6.2 Data collection
Data is collected by manufacturers using a standard questionnaire (see Appendix 6).
Inventory data is collected for the following items:
• Inputs:
o Materials
o Transport
o Process Fuel
o Heat
o Water
• Outputs:
o Emissions to air
o Discharge to water
o Emissions to land
o Products, co-products, by-products and wastes
Manufacturers provide a process tree, including any major transportation stages with a clearly marked system boundary to indicate included and excluded processes. The resulting inventory is checked for balance in mass (including taking account of evaporation of water). The total mass flowing into the system boundary must be accounted for with an equivalent mass flow out of the system boundary. Figure 2 illustrates the generic components of a process tree. Energy consumption is checked for appropriateness compared to known systems.

SD6050 Issue 1.0 BRE Global Environmental Profiles methodology 2008 29
Uncontrolled copy if printed. Valid on day of printing only. © BRE Global Ltd 2008
Figure 2: Generic process tree.
6.3 Declared and functional units
Construction products are considered as ’functional units’. This is defined as one square metre of building element (external wall, ground floor etc.), over a lifetime of 60 years. Any repair and maintenance that happens during this time is included and a scenario of the assumed dismantling/disposal at the end of life is also considered. The quantity of construction products used to fabricate the element is calculated and this is dependent on the type of product and the energy performance that the element is built to.
The energy performance for the functional unit for elements is based on 2006 Building Regulations for England and Wales and includes a U-value provided by BRE Global, which is likely to ensure that any resulting building would satisfy Approved Documents Part L1A and B and Part L2A and B (2006). All the element specifications have been designed to achieve this requirement.
The product category units used by the Environmental Profiles methodology are fully explained in Appendix 1 Section A1.2.
6.4 System boundaries
System boundaries have been established in accordance with the provisions of ISO 14044:2006, 4.2.3.3 and 4.3.3.4.
6.4.1 Boundary rule: Cut-off criteria for the inclusion of inputs and outputs
The inventory process gathers all the inputs to the plant that are associated with a product, including product ingredients, packaging materials and consumable items.
For many processes, a large number of substances and materials are used in very small quantities and it is unrealistic to gather data on all of these.
However, it is important that significant environmental effects are not omitted by ignoring these low mass substances. Analysis may later reveal that these substances do not significantly affect the overall result but it is important that data is provided to enable this conclusion to be drawn. To achieve this, the following conventions are applied:

SD6050 Issue 1.0 BRE Global Environmental Profiles methodology 2008 30
Uncontrolled copy if printed. Valid on day of printing only. © BRE Global Ltd 2008
98% by mass of inputs must be included – therefore a maximum of 20 kg of inputs per tonne of product output (2% of 1 tonne) can be ignored, and then, if they have:
• significant effects or energy use in their extraction, their use or disposal, or
• are highly toxic, or
• are classed as hazardous waste
they must be included.
Mass balance checks ensure the inputs stated are sufficient to produce all the outputs, including waste arising. The methodology adjusts input inventories proportionally to 100% where it is not possible to quantify internal process waste.
NOTE: The application of these rules is by BRE Global. Manufacturers discuss their process with BRE Global prior to completing the questionnaire to determine how the cut-off rule applies to them.
A manufacturing plant often has offices attached, and the power, water and waste associated with these premises are included in the Environmental Profile. If the head office is situated on the same site as a manufacturing plant, it is not included in the assessment.
6.4.2 Boundary rule: Cut-off criteria for environmental impacts
Thirteen environmental impacts are reported. These are the impact categories provided in section 7.1. No cut-off criteria are provided for environmental impacts resulting from the included material flows; all are included within the assessment and all environmental impacts are reported.
6.4.3 Boundary rule: Capital equipment and infrastructure
The contribution of capital equipment and infrastructure (e.g. a factory building) is not normally considered in LCA and is not included here. Maintenance of equipment is also not included in the LCA except for frequently consumed items which are included in the inventory if they meet the data 2% cut-off rule in Section 6.4.1 or are deemed to have a significant impact.
NOTE: The application of the 2% and significance rule is determined by BRE Global. Manufacturers discuss their process with BRE Global prior to completing the questionnaire to determine how this applies to the maintenance of their equipment.
6.4.4 Boundary rule: Energy use in factory and factory support offices
All energy used in factories and factory support offices is included. Head offices and sales offices etc. are excluded.
6.4.5 Boundary rule: Construction impacts
Construction process impacts are not accounted for except for waste. Data sets are not widely available and the impact is considered to be small and unfeasible to allocate to products.
In particular circumstances where there are considered to be especially great impacts from the construction process, the energy impacts will also be included. This is important for the consideration and comparison of offsite and onsite manufactured systems.
6.4.6 Boundary rule: Site wastage
Site wastage during the construction and refurbishment process is included.
SD6050 Issue 1.0 BRE Global Environmental Profiles methodology 2008 31
Uncontrolled copy if printed. Valid on day of printing only. © BRE Global Ltd 2008
Wastage rates are collated through the consideration of data from a number of sources. A costing handbook, Laxtons6, includes wastage rates for the most popular specifications. This is used as a default source to collate wastage rates for construction materials within particular contexts, in terms of use within the building (e.g. timber as studwork, within window frames and as floorboards), whether the project is new build or refurbishment, and size of project. The rates are checked through consultation with manufacturers or trade associations for appropriateness and tailored models are created where evidence is available for particular construction practices.
To create the Environmental Profile for a specification, the appropriate context for each material used is selected as part of the specification process and the relevant wastage rate for first installation and any subsequent replacements are calculated.
6.4.7 Boundary rule: Lifetime use: maintenance
Maintenance is considered where the environmental impacts are significant (as per section 6.4.1) and may vary depending on the use of the product within the building. Typical maintenance for a product within a given specification will be considered. Transportation impacts for personnel and plant are not included in maintenance models.
The quantity and transport of any significant materials used (e.g. in painting and varnishing) over the lifetime of a product will be included.
For flooring a model of cleaning impacts over the lifetime is included. This takes account of water, materials and energy used but not transport of cleaning staff to the site.
6.4.8 Boundary rule: Lifetime use: contribution to lifetime - energy use in a building
This boundary rule applies to construction element Environmental Profiles only and does not apply to ‘per tonne’ Environmental Profiles.
All the element specifications have been designed to achieve the requirement set out in section 6.3. This allows the designer to consider the overall impact from quantities of different materials required to produce different building solutions without having to consider differences in energy consumption resulting from different thermal resistance values. In general, comparison between elements with the same functional unit can ignore lifetime energy use within the assessment. However, care should be taken where aspects such as thermal mass may have implications on energy consumption in the building.
Where a building element, for example a modular construction system, is normally built to a better U value than the functional units defined in Appendix 1, section A1.2.3, BRE Global will adapt it to meet the U value defined in the functional unit. This ensures it is not penalised for the use of more materials to achieve a higher U value.
6.4.9 Boundary rule: Demolition
The impact of the demolition process is not included. Data sets are not widely available and the impact is considered to be small and difficult to allocate to specific materials. However the impact of disposal of material arising from demolition is considered based on section 6.4.10.
6 VB Johnson & Partners (Eds). Laxton’s Building Price Book, 2006: Major and small works. Oxford, Butterworth-Heinemann, 2005

SD6050 Issue 1.0 BRE Global Environmental Profiles methodology 2008 32
Uncontrolled copy if printed. Valid on day of printing only. © BRE Global Ltd 2008
6.4.10 Boundary rule: Disposal
The boundary of the LCA includes the impacts of disposal of all materials. Models for the amounts for construction materials estimated to go to landfill, incineration, recycling and reuse are described in section 6.8.1.
The models for landfill and incineration are described in section 6.8.2.
The impacts of recycling and reuse are allocated in accordance to the procedures in section 6.9.2 and section 6.9.3.
6.5 Data quality requirements
The data quality requirements of the Environmental Profiles methodology are fully explained in Appendix 2. This provides information about the quality of data provided by industry and the upstream data sets used to create the Environmental Profiles.
The ecoinvent 2000 database is the default data source used for quantifying the impact of inventory data. If manufacturers are able to provide more specific, quality data about a product or processing they are using, this will be used as a preference, in accordance with the data quality requirements set out in Appendix 2.
6.6 Energy
6.6.1 Electricity models
Detailed LCA models for electricity production for national production across Europe have been developed on behalf of the Swiss Government, as part of the ecoinvent database.
These models:
• are based on generation in 2000
• are based on national models of energy mix for electricity production
• cover all resource use and emissions to air, water and land, for all stages of the electricity system, from resource extraction, fuel refining, storage, generation and distribution of electricity
• include imports and exports of power between countries
• exclude impacts from infrastructure which includes the building of power stations, wind farms, dams, and supply network including pylons and cables) over the lifespan of the power production with the exception of renewable energy infrastructure, which is considered to have a higher proportion of energy embodied in the infrastructure compared to energy generated over the life time of the infrastructure compared to conventional energy sources
• include different LCA models for High Voltage (direct supply to some major industries), Medium Voltage (most industry) and Low Voltage Supply (domestic and offices). Distribution losses increase as voltage lowers.
For non-European countries where electricity models are not available in ecoinvent, national electricity models can be created based on the national energy mix for electricity generation using ecoinvent models for electricity generation from specific fuels.
The most appropriate voltage model will be used.

SD6050 Issue 1.0 BRE Global Environmental Profiles methodology 2008 33
Uncontrolled copy if printed. Valid on day of printing only. © BRE Global Ltd 2008
6.6.1.1 Company specific electricity model
Where a company has invested in the construction of a specific power plant from which it takes the majority or all of the supply, then the use of a specific LCA model for that power plant will be considered based on ecoinvent data, but adapted where relevant for the specific installation, for example in terms of emissions or infrastructure (where significant as per section 6.4.3). The environmental impact associated with the manufacture of the equipment and its anticipated lifespan is accounted for in the model.
6.6.2 Renewable electricity
For electricity purchased from “green tariffs” for renewable or other generation, then the profile will be based on the specific mix using ecoinvent data.
Green tariffs within the UK will need to demonstrate that Renewable Energy Guarantees of Origin certificates (REGOs) are held, and that Levy Exemption Certificates (LECs) and Renewable Obligation Certificates (ROCs) have been retired for the electricity supplied7. Overseas green tariffs will need to demonstrate a similar level of renewable sourcing and additionality. Any other green tariffs will be calculated with the standard national electricity mix.8
See also waste-derived fuels (see section 6.6.4) and biofuels (see section 6.6.5).
6.6.2.1 Onsite generation of electricity
If a manufacturer has invested in the generation of electricity on site, then the appropriate electricity model will be used for that supply which is used by the manufacturer based on ecoinvent data or actual data if available. This applies equally to renewable or conventional energy. The environmental impact associated with the manufacture of the equipment and its anticipated lifespan is accounted for in the model. The manufacturer will need to provide evidence that LECs and ROCs for the onsite supply have not been sold on to any other parties, in which case the standard national electricity mix will be used.
6.6.3 Fuels
LCA data for fuels is derived from the ecoinvent database. This data:
• is the latest available data source for fuels (2000)
• includes all upstream extraction, production and distribution impacts
• excludes infrastructure (e.g. building of oil wells and refineries) and supply network (e.g. building and operation of pipelines) over the lifespan of fuel production
Profiles are available for the production of different fuels (including natural gas, coal, coke, light and heavy oil, wood) and for their performance in boilers or furnaces, according to their different sizes (e.g. >100 kW) and different technologies (e.g. modulating/condensing boilers).
7 This means that the carbon dioxide savings are claimed and not available to be passed on to further processes. 8 Note that green tariffs are treated differently in this methodology compared to BREEAM and the Code for Sustainable Homes. This method is able to demonstrate that the green energy is consumed. The other schemes are dealing with future scenarios.

SD6050 Issue 1.0 BRE Global Environmental Profiles methodology 2008 34
Uncontrolled copy if printed. Valid on day of printing only. © BRE Global Ltd 2008
Where measured emissions from a specific factory are available, these are used and the ecoinvent LCA models are adapted accordingly.
6.6.4 Waste derived fuels
When a processing plant uses fuels derived from the waste of another process, the circumstances of acquiring the waste determine how much of the environmental impact from processing, transporting and burning the waste is allocated to the product utilising the waste and how much is allocated to the process that produced the waste.
Where a manufacturer buys a waste fuel, the emissions from its use are all allocated to the manufacturer.
Where a manufacturer is given a waste fuel, the emissions from its use are all allocated to the manufacturer.
If the manufacturer is paid to take a waste fuel, i.e. to treat or dispose of waste as part of their manufacturing process, the product created by this waste treatment process is considered as a co-product from the original waste producing process, and impacts from the whole system will be allocated back to the waste producer on the basis of value (see section 6.9.2). The emissions from the use of the fuel and the process of producing it are therefore allocated between the waste producer and the manufacturer, at a rate determined by the income received by the manufacturer. This is value-based allocation and is described in section 6.9.
EXAMPLE A manufacturer is paid to receive waste for fuel and receives 10% of their income from taking this material. 90% of their income is from selling the product they manufacture using the waste fuel. 10% of the total environmental impacts (including waste fuel use) are allocated back to the waste producer and not accounted for in the inventory of environmental impacts from the construction product.
The impact of transport of waste fuels will be carried by the manufacturer if they pay for the fuel or pay for the delivery of the fuel. Figure 3 provides a diagram to illustrate this process.

SD6050 Issue 1.0 BRE Global Environmental Profiles methodology 2008 35
Uncontrolled copy if printed. Valid on day of printing only. © BRE Global Ltd 2008
Figure 3: How the impact of waste fuels is allocated to manufacturers if they pay for the fuel or pay for the delivery of the fuel.
The impact of transport of waste fuels will be carried by the waste producer if they pay for the disposal of the fuel or the delivery of the fuel. Figure 4 provides a diagram to illustrate this process.
Inputs
Process X Product
X
Waste (to be used as fuel or input)
Emissions
Process Y
Product Y
Emissions
As Process Y buys the waste from Process X to use as a fuel or input, it receives a proportion of the impact of Process X, based on the % of income that Process X derives from selling the waste.
Inputs
10% Process X impact passed to Product Y.
As Process X sells its waste to Process Y, deriving 10% of its income, it can allocate 10% of its impact to Product Y and 90% to Product X. The Waste from Process X is considered as a co-product of Process X
90%
Process X impact to Product X
100% Process Y impact to Product Y
£

SD6050 Issue 1.0 BRE Global Environmental Profiles methodology 2008 36
Uncontrolled copy if printed. Valid on day of printing only. © BRE Global Ltd 2008
Figure 4: How the impact of waste fuels is allocated if the waste producer pays for the disposal of the fuel or the delivery of the fuel.
6.6.5 Biofuels
As plants grow they absorb CO2 from the atmosphere and convert the carbon in it to plant matter such as cellulose. This process is known as sequestration.
Fuels derived from agriculture or forestry (e.g. wood or bio-diesel) or from organic wastes such as paper or food waste, have sequestered the carbon they contain within the time period of the last 100 years. Any emissions of CO2 from burning these fuels (known as biogenic emissions) are therefore returning it to the atmosphere without causing any net increase in CO2 over this timescale. Both sequestered (removed) CO2 and biogenic (emitted) CO2 flows are included within the Environmental
Inputs
Process X Product
X
Waste (to be used as fuel or input)
Emissions
Process Y
Product Y
Emissions
As Process Y receives 10% of its income by taking waste from Process X and using as a fuel or an input, 10% of the impacts of producing Product Y (and disposing of waste) are passed back to Process X. Waste Disposal for Process X is considered as a co-product of Process Y.
Inputs
10% Process Y impact passed back to Product X
As Process X pays to dispose of its waste, it receives some of the impact of Process Y which takes it.
100%
Process X impact to Product X
90% Process Y impact to Product Y
£
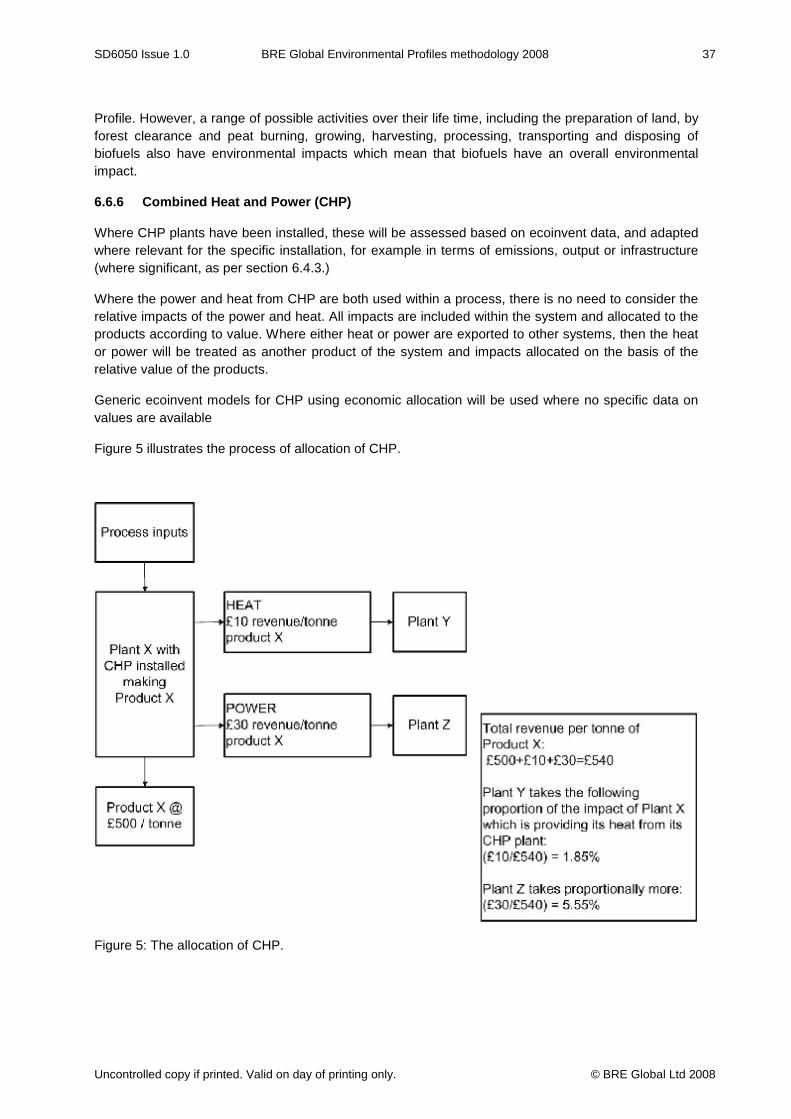
SD6050 Issue 1.0 BRE Global Environmental Profiles methodology 2008 37
Uncontrolled copy if printed. Valid on day of printing only. © BRE Global Ltd 2008
Profile. However, a range of possible activities over their life time, including the preparation of land, by forest clearance and peat burning, growing, harvesting, processing, transporting and disposing of biofuels also have environmental impacts which mean that biofuels have an overall environmental impact.
6.6.6 Combined Heat and Power (CHP)
Where CHP plants have been installed, these will be assessed based on ecoinvent data, and adapted where relevant for the specific installation, for example in terms of emissions, output or infrastructure (where significant, as per section 6.4.3.)
Where the power and heat from CHP are both used within a process, there is no need to consider the relative impacts of the power and heat. All impacts are included within the system and allocated to the products according to value. Where either heat or power are exported to other systems, then the heat or power will be treated as another product of the system and impacts allocated on the basis of the relative value of the products.
Generic ecoinvent models for CHP using economic allocation will be used where no specific data on values are available
Figure 5 illustrates the process of allocation of CHP.
Figure 5: The allocation of CHP.

SD6050 Issue 1.0 BRE Global Environmental Profiles methodology 2008 38
Uncontrolled copy if printed. Valid on day of printing only. © BRE Global Ltd 2008
6.7 Transport
6.7.1 Transport to factory gate
For transport of materials to the factory, data is obtained from
• the manufacturers for the distance travelled,
• mode of transport (e.g. sea, rail, and road),
• vehicle or ship type and
• average loads or number of deliveries and return load. An average default return load is assumed for the return journey. If the return load is empty, the return journey is considered to be equal to the outward journey. Part loads are accounted for. No adjustment is made for lighter loads. Shipping in container ships is considered as a single route only.
If distances are not provided, then BRE Global will use default data provided by the Department for Transport from the continuing Survey of Roads Goods Transport9. For shipping, standardised distances by sea are calculated using the Maritime Chain10. For road distances, a web-based tool is used11.
6.7.2 Transport from factory to site
Manufacturers are asked to provide data on the typical methods of transport of the product to the construction site. This includes distance travelled, vehicle type and average load and return load if any. In the absence of this information, BRE Global uses the default data described in section 6.7.1.
Wherever possible, specific data is used, to take account of variables in weight and volume between products. A separate questionnaire is provided to record this as part of the data collection process (see Appendix 6).
6.7.3 Calculating inventory data for transport
6.7.3.1 Road transport excluding municipal waste collection, tractor and trailer and van < 3.5 tonnes
For road transport, the overall distance and tonnes.km (t.km) travelled by each vehicle type is calculated based on the average number of deliveries. Fuel consumption is calculated based on direct fuel consumption figures obtained from UK DfT Road Freight Statistics 200512 and the overall distance travelled.
Infrastructure for road transport including road building and maintenance, lorry and tyre maintenance and replacement is not included within the Environmental Profiles.
9 Typical load and haul data for 2005 calculated for common commodities used in construction and product manufacture from an extract from the Continuing Survey of Road Goods Transport provided to BRE by the Department for Transport in a personal communication (21.11.2006) 10 www.maritimechain.com 11 e.g. www.multimap.com 12 http://www.dft.gov.uk/162259/162469/221412/221522/222944/coll_roadfreightstatistics2005in/rfs05comp.pdf

SD6050 Issue 1.0 BRE Global Environmental Profiles methodology 2008 39
Uncontrolled copy if printed. Valid on day of printing only. © BRE Global Ltd 2008
6.7.3.2 Rail, water and air transport and municipal waste collection, tractor and trailer and van < 3.5 tonnes
For rail and ship transport, the overall t.km travelled by each transport type is calculated. This unit is an expression of distance and tonnes moved.
Ecoinvent models for the energy and impact associated with transport are then used based on the total t.km travelled by each mode of transport.
Rail transport is assumed to be a mix of electric and diesel, based on a European average.
Infrastructure for rail, water and air transport is not included within the Environmental Profiles.
6.8 Disposal
6.8.1 Disposal routes for construction materials
Disposal route models have been produced by BRE Global in consultation with Trade Associations. These are based on the most likely scenario for construction materials at disposal, consisting of the percentage of material sent to each disposal route (landfill, incineration, recycling and reuse) using practical evidence gathered during site audits and industry surveys. Where relevant, they are also specific to construction waste, refurbishment waste and demolition waste. These models are used to calculate the relevant impacts of the disposal route using the ecoinvent data.
A standard waste model is applied unless manufacturers provide evidence that an alternative scenario is more typical. The standard models are checked with manufacturers for appropriateness and tailored models are created where evidence is available for particular disposal practices.
The waste model for biological materials such as wool or wood is considered with regard to the carbon cycle and this is dealt with in section 6.12.
6.8.2 Waste models for waste treatment and disposal
The ecoinvent database has a number of waste treatment models for incineration, landfill and waste sorting which are detailed and include a number of models for specific wastes and technologies. From these models, the following items are included in an Environmental Profile: transport to waste treatment and any emissions arising from the waste treatment. Infrastructure and the impacts from capping and lining layers are excluded. Whilst waste treatment continues to have impacts for thousands of years, only impacts for the first 100 years from disposal are included in these models.
Infrastructure associated with waste treatment and disposal is not included within the Environmental Profiles.
6.8.3 Waste water treatment models
The ecoinvent database has produced a generic LCA model for waste water treatment which allows the content of waste water to be evaluated in terms of its impact. This model allows different sizes of waste water treatment facility (from 800 – 230,000 per capita facilities) to be evaluated. A base load for sewerage is assessed for all plants and additional materials are accounted for on a case by case basis. The model is adapted for on-site water treatment.

SD6050 Issue 1.0 BRE Global Environmental Profiles methodology 2008 40
Uncontrolled copy if printed. Valid on day of printing only. © BRE Global Ltd 2008
6.9 Allocation
6.9.1 Allocation of material flows
A standardised procedure is used to calculate how different materials produced by the same plant should share the environmental burdens resulting from the manufacturing process. This is called allocation. The type of process requiring allocation is illustrated in Figure 6.
Figure 6: A process which will require allocation for the apportioning of impacts to multiple products and wastes
A number of approaches can be taken according to ISO standards. BRE Global has developed a method within this context. This complies with ISO requirements but the BRE Global methodology does exclude some approaches due to the requirements of the goal and scope for consistency across all product types.
The materials, energy flows and associated emissions are allocated to the different products according to the following order of preference:
1. Avoid allocation, by division of a single process into sub-processes: Figure 7
2. Allocate by physical property (excluding stoichiometry): Figure 8
3. Allocate by product value (economic allocation): Figure 9
Processes requiring allocation: multiple products/wastes
Product 1
Product 3
Product 2
Product 4
Waste 5
Process

SD6050 Issue 1.0 BRE Global Environmental Profiles methodology 2008 41
Uncontrolled copy if printed. Valid on day of printing only. © BRE Global Ltd 2008
Figure 7: First allocation choice – avoid allocation through the subdivision of process into multiple products and wastes.
EXAMPLE When a production line produces more than one product. Sub-division can be undertaken through the use of metering during the time that the specific product is being manufactured.
EXAMPLE The use of sub-metering in a situation where there are two separable parallel processes, but only one energy flow reported.
Figure 8: Second allocation choice – by physical allocation for multiple products and wastes.
EXAMPLE A plant applies paint to different products. The impacts of paint application can be allocated to the different products based on the surface area of the product.
Multiple products/wastes: First Choice: Subdivide
Product 1
Product 3
Product 2
Product 4
Waste 5
Process 1
Process 2
Multiple products/wastes: Second Choice: Physical Allocation
Product 1
Waste 3
Product 2
Product 4
Waste 5
Input 1
Process Input 3
Input 4
Input 5
Input 2

SD6050 Issue 1.0 BRE Global Environmental Profiles methodology 2008 42
Uncontrolled copy if printed. Valid on day of printing only. © BRE Global Ltd 2008
Allocation by product value is illustrated in Figure 9 where two or more outputs come from a single process, and sub-division and physical allocation are not appropriate, then burdens are allocated according to the proportion of product revenue earned from the different outputs. This is known as economic allocation. Any output from such a process will attract burdens on the basis of the relative income it generates compared to the overall income generated by the process. Any outputs which do not generate income for the manufacturer are not allocated any impacts from the manufacturing process.
The price that is used to make the allocation is the average three-year market price of the relevant materials. This makes allowance for fluctuating global markets. Manufacturers are also able to provide proportions of output by value if price data is commercially sensitive.
For sequential processes, the system boundary is expanded to account for them collectively.
In cases where the data cannot be separated for the two processes, the system boundary can be expanded to encompass both processes, and allocation by product stream value will be used to allocate burdens between the products.
EXAMPLE Steel manufacturing produces steel and slag. Slag is used in concrete manufacture and displaces cement. If slag is £2/tonne and steel is £150/tonne, the impact of making cement can be deducted from the impact of making steel for a proportion of the process equivalent to the relative price of slag to steel.
There are a number of processes where the physical properties are used to allocate particular impacts between products and co-products and value is used for the other impacts. These are for carbon sequestration (see section 6.12) and for minerals extraction.
EXAMPLE 1 A saw-mill produces sawn timber, saw dust and bark. The amount of carbon sequestered within each is that which is physically sequestered within the product. The overall amount of sequestered carbon entering the system is that within the timber entering the saw-mill. Once the sequestered carbon for the products and co-products has been calculated, any remaining sequestered carbon (for example within wood waste used as fuel) is followed through the system. Where the fuel is burnt, the resulting greenhouse gas emissions are allocated to the sawn timber and sawdust by value. All remaining impacts from the saw-mill process are allocated to the products and co-products by value.
EXAMPLE 2 A quarry produces cut stone. In situations where large amounts of smaller pieces of stone and other associated minerals are generated as part of the quarrying process, this is likely to be sold as aggregate. Using value-based allocation, we would simply allocate the minerals depletion impact according to the relative value of the cut stone and the aggregate. If this aggregate would be liable for the UK Aggregates Levy, then it will be considered to have a mineral resource depletion impact (see Appendix 4) of 1 tonne of minerals resource depletion per tonne of material extracted. This minerals extraction would then be deducted from the total amount of minerals extraction for the quarry, to give a minerals extraction impact which would be allocated by value to the products and co-products. Any other impacts (e.g. fuel use, minerals extraction from overburden) are also allocated to the products and co-products on the basis of value.

SD6050 Issue 1.0 BRE Global Environmental Profiles methodology 2008 43
Uncontrolled copy if printed. Valid on day of printing only. © BRE Global Ltd 2008
Figure 9: Third allocation choice – by value for multiple products and wastes.
6.9.2 Allocation, waste and recycling
The outputs may include co-products, by-products and reusable and recyclable wastes all of which might find application in further processes, together with wastes which must be disposed of and pollution which must be carried by the environment. The same allocation hierarchy as per section 6.9.1 is used for by-products and reusable and recyclable wastes as for co-products, but because sub-division and physical allocation are rarely appropriate for these outputs, economic allocation as per section 6.9.1 is normally used.
Particulates collected from gas streams and de-watered sludge and solids from treated effluents, mine overburden waste from mining and extraction operations and furnace slag, ash, bark and sawdust are all considered as outputs. Some materials produced during a manufacturing process may be:
• recycled or reused in the process
• sold
• taken away free of charge by another company for recycling
• sent to waste disposal at a cost to the producer or
• recycled by another company at a cost to the producer.
Other outputs from a process may include services (e.g. waste disposal) or energy (e.g. electricity), some of which may generate revenue for the process.
A precise definition of ‘waste’ is not provided in this methodology. All outputs from a process (a product, waste or service) where sub-division or physical allocation cannot be used are treated using the economic allocation procedure as per section 6.9.1.
Multiple products/wastes: Third Choice: Allocation by value
Product 1
Waste 3
Product 2
Product 4
Waste 5
Process
Mass * £/tonne
Mass * £/tonne
Mass * £/tonne
Mass * £/tonne
Mass * £/tonne
Product Impact: Mass * £/tonne * Impact Total Value

SD6050 Issue 1.0 BRE Global Environmental Profiles methodology 2008 44
Uncontrolled copy if printed. Valid on day of printing only. © BRE Global Ltd 2008
Economic allocation means that each output from the process will attract burdens on the basis of the relative income it generates compared to the overall income generated by the process. Any output which is given away or which the manufacturer has to pay to dispose of will not attract any burdens from the manufacturing process. Outputs which the manufacturer pays to dispose will attract burdens from the disposal/treatment process back into the manufacturing system. These scenarios are further illustrated in Figure 10.
Figure 10: The two models of end of life recycling which illustrate the influence of value on the contribution that recycling makes to the final impact of a product.
6.9.3 Allocation for post-consumer materials which are recycled and reused
Many processes manufacture a primary product which after use is likely to be recycled or reused. The recycling may be into the same product as the original or into one with a lower-grade application. The problem faced is how to ensure that the recycled or reused product carries an appropriate amount of the environmental impact from the original process into the new product.
End of Life Recycling I
Product 1 Process A Process B Recycling Product 2
Use
Impact from Process A or B will carry forward if there is value from recycling
Does any impact come from making product 1 carry forward? If Product 1 has no value at end of use – NO If Product 1 has any value at end of use – YES
End of Life Recycling II
Product 1 Process A Process B Recycling Product 2
Use
Impact allocated to recycling = End of life value * Impact to Base Point Base Value
BASE Point: After which processing has no further benefit to recycling Examples: Rolling sheet metal isn’t of value for recycling: Metal Ingot/Slab = base point Glass to glass bottles isn’t of value for recycling: Glass = base point
End of life Value: mass arising * £/tonne
Base Value: 1 tonne * £/tonne

SD6050 Issue 1.0 BRE Global Environmental Profiles methodology 2008 45
Uncontrolled copy if printed. Valid on day of printing only. © BRE Global Ltd 2008
The thinking behind the Environmental Profiles procedure follows that for allocation to co-products and is therefore based on economic value. This is one of the allocation approaches for recycling recommended in ISO 14044:2006.
The underlying concept is that when manufacturing a primary product, some of the primary manufacturing impact will be transferred forward to any future recycling on the basis of the relative values of the primary product and the material arising in the waste stream for recycling or reuse. Therefore any post-consumer recycled input will incur a proportion of primary impact calculated according to its value relative to that of the primary manufacturing process. Scrap material without value will carry no burdens forward.
EXAMPLE When a steel frame building is demolished, the steel sections within the building have a value as a resource for recycling. A proportion of the impact of their primary manufacture is allocated forward to this recycling, based on the relative values of the primary production stream and the waste arising.
Allocation to post-consumer recycling is undertaken from the point in primary manufacture at which further processing is no longer useful in terms of recycling. This is called the "base point", and the material the "base material". Only the impacts up to the base point are allocated to the recycled product. Any subsequent manufacturing beyond the base point will be totally allocated to the primary product.
EXAMPLES:
• a glass bottle recycled into another glass object – the base point is just before the glass (base material) is made into bottles
• aluminium foil – the base point is the aluminium ingot (base material) before it goes to rolling
• steel section – the base point is the manufacture of steel slab (base material) before section manufacture
Therefore, in the example above of the glass bottle, the impact of bottle manufacture is only carried by the first use of the bottle, but some of the impact of glass manufacture will be allocated to post-consumer recycling. For the aluminium foil, some of impact of aluminium ingot production is allocated forward to recycled aluminium, but the foil manufacturing process will only be allocated to the use of the foil.
6.9.3.1 Allocation to post-consumer recycling
The allocation to recycling is based on the cost of the base material at the base point and this is compared to the cost of the material arising for recycling to give the proportion of impact which is transferred to any recycled product.
However, this allocation for recycling can only be undertaken when recycling actually happens. This means a further calculation for the proportion of material recycled must also be used in the equation, based on the current recycling rate.
In other words, of products manufactured today, the proportion assumed to be recycled in the future is the percentage based on current recycling rates. Recycling rates for demolition waste have been collected by BRE Global and consulted on with industry in the development of this methodology.
EXAMPLE Continuing the example from above of aluminium foil, the amount of impact allocated to recycled aluminium will be based on the relative value of aluminium ingot being produced and the corresponding value of aluminium which would be expected to arise for recycling.

SD6050 Issue 1.0 BRE Global Environmental Profiles methodology 2008 46
Uncontrolled copy if printed. Valid on day of printing only. © BRE Global Ltd 2008
For one tonne of ingot, the three-year average is approximately £1250, the product yield from 1 tonne of ingot is 0.988 tonnes, and the estimated scrap arising is 90% of this figure, 0.9 tonnes, with a value of approximately £750/tonne.
The amount of impact allocated forward to future recycling is therefore:
%54)1250£1()750£9.0(
=×
×
Any post-consumer recycled input into a process will carry impact calculated in this way, and this is calculated in the same way for pre-consumer waste as post-consumer recycling. For closed loop pre-consumer recycling, the per tonne impacts carried forward to recycling will match the per tonne impact brought with the recycled input, though there may be additional impacts for the recycled input based on any secondary processing.
For the above example, any recycled aluminium includes the burdens carried forward from primary manufacture. However as recycled aluminium has a similar value to primary aluminium, and is as likely to be recycled, then a similar proportion of impact will be carried forward to its own next use.
Where a product with recycled input is recycled again at the end of life, then the impact from primary manufacturing will again transfer forward to this future recycling. Reprocessing and re-melting of scrap into ingot etc. is of no value to any future recycling process, so the “base point” is the value of the scrap, compared to the value of the scrap after use, so there is no change in value, therefore only the losses through recycling rate and yield need to be accounted for and this impact from primary production will remain with any recycled input.
6.9.3.2 Allocation to reuse
Allocation to reuse follows a similar principle to that above, but with a different base point. In this respect, allocation to reuse is undertaken from the point of final manufacture at which further processing is no longer useful in terms of reuse.
For example for a steel section which is reused, the manufacture of both steel slab and steel section is useful to the reused product, and therefore the base point is after steel section manufacture.
Allocation is based on the cost of the final product, and the amount of final product manufactured. This is compared to the cost of the product arising for reuse and the amount of product arising for reuse based on current reuse rates (again sourced by BRE Global). Any additional impacts of manufacturing that are not useful for reuse (e.g. labelling or packaging) are allocated to the primary product (in the scenarios common within construction, these impacts are not generally significant as per section 6.4.1).
6.10 Units to be used for inputs and outputs
• energy: mega joules, MJ; or kilowatt hours, kWh
• mass: tonne, t; or kilogram, kg; or gram, g
6.11 Imports
The inputs and outputs attributed to imports of materials and products are, wherever possible, based upon analyses appropriate to the country of origin and include the energy of transportation. Where data for the country of origin are not available, the input and output data are based upon the closest domestically produced product with an addition made for the transportation from the country of origin.

SD6050 Issue 1.0 BRE Global Environmental Profiles methodology 2008 47
Uncontrolled copy if printed. Valid on day of printing only. © BRE Global Ltd 2008
6.12 Carbon cycle
The carbon cycle applies to all types of biomass, such as wool, linoleum, paper packaging.
Carbon sequestration (see section 3.14) is considered over a timescale of 100 years and is included within the Environmental Profile.
Carbon dioxide emissions from biomass that is burnt are assumed to match the CO2 absorbed in carbon sequestration but are included within the Environmental Profile.
For biomass that is recycled or reused at the end of life, the sequestered carbon is passed to the recycled or reused product as it is an inherent physical property. As the carbon is not emitted to the atmosphere, no CO2 emission will be recorded for the primary product at end of life, but a mass balance and carbon balance will be achieved. The standard assumption for packaging materials is that it is disposed of at the site, therefore taking the benefits of sequestration for the process.
For timber and biomass that is landfilled, the release of sequestered carbon over 100 years has been modelled based on the Environment Agency’s Gassim13 program and included within the ecoinvent models. The Gassim model includes the effect of collecting and burning landfill gas.
The CO2 and other greenhouse gas emissions at the end of life for timber are modelled based on current average disposal model for timber based on incineration, landfill and reclamation.
Timber and other biomass cannot be assumed to be CO2 neutral according to the assumption above because not all timber and biomass is recycled, reused or burnt at the end of its life and there are also CO2 emissions associated with the processing and transport of timber and biomass products.
6.13 Adjusting carbon dioxide emissions for carbonation
For lime- and cement-based products, a small proportion of the carbon dioxide emitted during their production will be "carbonised" back into the finished products after manufacture. An adjustment is made for this in the Environmental Profile. The carbonation is considered over a 100-year timescale.
For lime, carbonation is an essential property of the material. All carbon dioxide emitted is assumed to be reabsorbed within 1-2 weeks of installation and therefore this process is accounted for in the calculations for the Environmental Profile.
For cement, carbonation happens slowly and is an undesirable process. The rate of carbonation is dependent upon a number of factors and these are taken into account during the creation of an Environmental Profile.
A detailed explanation of the calculations made is provided in Appendix 5.
13 http://www.gassim.co.uk

SD6050 Issue 1.0 BRE Global Environmental Profiles methodology 2008 48
Uncontrolled copy if printed. Valid on day of printing only. © BRE Global Ltd 2008
7 Life Cycle Impact Assessment
7.1 Characterisation factors
Where available, the characterisation factors applied have been developed by the University of Leiden (CML) in the Netherlands. Where there are gaps in areas of environmental impact important to building materials, characterisation factors have been developed by BRE Global.
CML prepares its characterisation factors by basing them on work undertaken by the most expert groups or researchers in the respective area, e.g. their climate change characterisation factor is based on the findings of the Intergovernmental Panel on Climate Change.
In 2000, CML published an updated characterisation methodology. The CML indicators use a midpoint approach which has a direct link between the inventory and endpoint. Further information on the CML method can be found on their website14.
Characterisation categories have been created for five additional areas of environmental impact which are significant for construction products and which are not considered by CML. The areas are Fossil Fuel Depletion, Waste Disposal, Nuclear Waste, Minerals Extraction and Water Extraction.
The Environmental Profiles methodology uses and reports the following environmental impact categories and reference characterisation units:
• Climate change: kg CO2 eq. (100 yr)
• Stratospheric ozone depletion: kg CFC-11 eq.
• Eutrophication: kg phosphate (PO4) eq.
• Acidification: kg sulfur dioxide (SO2) eq.
• Photochemical ozone creation - (summer smog): kg ethene (C2H4) eq.
• Human toxicity: kg 1,4 dichlorobenzene (1,4-DB) eq.
• Ecotoxicity to water: kg 1,4 dichlorobenzene (1,4-DB)eq.
• Ecotoxicity to land: kg 1,4 dichlorobenzene (1,4-DB) eq.
• Fossil fuel depletion: tonnes of oil equivalent (toe)
14 Guinée et al, Life cycle assessment: an operational guide to the ISO standards. CML, Leiden University 2000. This can be downloaded in 4 parts from Part 1: LCA in perspective: http://www.leidenuniv.nl/cml/ssp/projects/lca2/part1.pdf
Part 2a: Guide: http://www.leidenuniv.nl/cml/ssp/projects/lca2/part2a.pdf
Part 2b: Operational Appendix: http://www.leidenuniv.nl/cml/ssp/projects/lca2/part2b.pdf
Part 3: Scientific Background: http://www.leidenuniv.nl/cml/ssp/projects/lca2/part3.pdf
Part 2b provides more detail on the exact baseline methodologies and characterisation factors for the chosen category indicators

SD6050 Issue 1.0 BRE Global Environmental Profiles methodology 2008 49
Uncontrolled copy if printed. Valid on day of printing only. © BRE Global Ltd 2008
• Waste disposal: tonne solid waste
• Water extraction: m3 water extracted
• Mineral resource extraction: tonne of minerals extracted
• Nuclear waste: mm3 high level waste
The background to each impact category including a summary description, category scope, and characterisation approach is provided in Appendix 4.
7.2 Normalisation
Characterisation measures the level of environmental impact caused by a product or functional unit studied in an LCA. Because the impact categories are in different units, it is difficult to see which categories are causing the most impact. This is why normalisation is often undertaken.
Normalisation is the calculation of the magnitude of the category indicator results relative to reference information. Normalisation compares the level of impact in each category to a reference impact.
For an Environmental Profile, the reference information is the impact of a European citizen over a year. The normalised impacts are an easily understandable quantity for the user.
7.2.1 Sources of normalisation data
For each environmental impact category based on the CML characterisation method, normalisation scores have already been calculated by CML15 for the year 1995 covering Western Europe (the EU-15 nations plus Norway and Switzerland), with an overall population at that time of 384 million. Normalisation data for the impact category.
The normalisation data for CML categories are described in a spreadsheet which can be downloaded from the CML website16. Normalisation data for the other five categories has been based on the same geographic area (EU-15 plus Norway and Switzerland) and data has been obtained from Eurostat17 and national statistics using the same year and population18 as CML where possible. Further information is provided in the notes to Table 2.
Normalisation data is based on inputs and emissions from goods manufactured in Europe. Imports are excluded. There is an exception for minerals extracted outside the EU. These are included within the normalisation data set. Fossil fuel consumption is based on fossil fuel used in Europe and does not include fossil fuels extracted in Europe then exported. These choices for normalisation are influenced by the availability of data.
Normalisation factors for the Environmental Profiles methodology can be seen in Table 2.
15 Huijbregts M.A.J., Van Oers L., De Koning A., Huppes G., Suh S. & Breedveld L. (2001) Normalisation figures for environmental life cycle asssessment: The Netherlands (1997/1998), Western Europe (1995) and the world (1990 and 1995), Journal of Cleaner Production, 11, 737-748 16 http://www.leidenuniv.nl/interfac/cml/ssp/index.html 17 http://epp.eurostat.cec.eu.int/portal/page?_pageid=1073,46587259&_dad=portal&_schema=PORTAL&p_product_code=KS-AO-01-002 18 Population: 1995 for EU15, Norway and Switzerland: Eurostat

SD6050 Issue 1.0 BRE Global Environmental Profiles methodology 2008 50
Uncontrolled copy if printed. Valid on day of printing only. © BRE Global Ltd 2008
Table 2: Normalisation data for the Environmental Profiles methodology – the environmental impact of one European citizen (1995)
Category Per Citizen Unit
Climate change 12.3 tonne CO2 eq. (100 yr)
Ozone layer depletion 0.217 kg CFC-11 eq.
Human toxicity 19.7 tonne 1,4-DB eq.
Freshwater aquatic ecotoxicity 1.32 tonne 1,4-DB eq.
Terrestrial toxicity 123 kg 1,4-DB eq.
Photochemical oxidation 21.5 kg C2H4 eq.
Acidification 71.2 kg SO2 eq.
Eutrophication 32.5 kg PO4 eq.
Fossil fuel depletion 6.51 tonnes oil equivalent (toe)19
Solid waste 3.75 tonnes solid waste20
Radioactivity 23700 mm3 high level waste21
Mineral resource extraction 24.4 tonnes minerals extracted22
Water extraction 377m3 water extracted23
19 Source: Fossil fuel Consumption for EU15 and Norway for 1995, Eurostat, based on total Energy Consumption less Renewable. Source: Swiss fossil fuel consumption for 1995 from Schweizerische Gesamtenergiestatistik 1997. 20 Waste Generated: 1995: EU15, Norway and Switzerland, Eurostat website
21 (a) Volume of high and intermediate level waste in final repository per kWh, and % of nuclear energy used in EU15, Norway and Switzerland: Ecoinvent energy report: Life Cycle Inventories of Energy Systems: Results for Current Systems in Switzerland and other UCTE Countries Data v1.1 (2004) Roberto Dones et al.
(b) Amount of electricity generated for EU15 and Norway in 1995: Eurostat website.
(c) Amount of electricity generated in Swizerland in 1995: Schweizerische Gesamtenergiestatistik 1997, 3.34/98 d/f Sonderdruck aus Bulletin SEV/VSE, Nr. 16/1998, August. Bundesamt für Energie Schweizerischer Energierat Table 14 Production of Electricity.
22 Data from “Material Use in the EU: 1980-1997” for EU15 in 1995. Page 23. Given per capita. Material use in the European Union 1980-1997: Indicators and analysis. Luxembourg: Office for Official Publications of the European Communities, 2001 Prepared for DG Environment and Eurostat by Stefan Bringezu and Helmut Schütz Wuppertal Institute
23 Source: Eurostat data for total freshwater (ground and surface) abstraction per capita for 1995. Deductions made for water used in 1995 for cooling for industry and electricity based Eurostat except for Italy and Norway

SD6050 Issue 1.0 BRE Global Environmental Profiles methodology 2008 51
Uncontrolled copy if printed. Valid on day of printing only. © BRE Global Ltd 2008
7.3 Weighting
Weightings are used to create an Ecopoint Score in the Environmental Profile, a single score for overall environmental impact. 100 Ecopoints are equivalent to the environmental impact of one Western European citizen for one year. Further details about the creation of Ecopoints are provided in BRE Digest 44624.
This section deals with the weightings that underpin the creation of the Ecopoint score.
Every construction product selected for use in a building has an environmental impact throughout its lifecycle. How we decide upon the relative importance of the environmental impact of different construction choices depends on our view of how significant the different environmental impacts related to each choice are. For example, when considering the relative environmental impact of two products over their lifecycle, does the product with a high climate change impact that does not pollute water resources result in less or more overall environmental impact than the product that has a low climate change impact but produces significant water pollution?
Since people have different views and different levels of understanding of environmental issues, a standardised procedure for assigning relative importance to different environmental impacts is required if there is to be a consistent basis for decision making. This procedure is known as ‘weighting’25.
BRE Global has undertaken a study26 27 to identify weightings for a range of environmental sustainability issues. An international panel of ten experts was set up to judge the importance of thirteen parameters and their individual responses have been aggregated to create a single set of weightings.
The purpose of this study was to ask the question “which environmental issues are of greatest importance?” – i.e. is climate change more important than, say, waste generation or mineral resource extraction and if it is, then how much more important?
The expert panel were:
• Joachim Spangenberg – Vice President Sustainable Europe Research Institute, Vienna, Austria and Professeur invité at the University of Versailles St. Quentin-en-Yvelines, France and expert to UN on sustainable development indicators
where an average for the rest of Western Europe has been used. Where 1995 is not provided, an average for the closest years reported has been used.
24 BRE Digest 446. Assessing environmental impacts of construction. Industry consensus, BREEAM and UK Ecopoints, Nigel Howard and Ian Dickie 1999. ISBN 1 86081 398 4 CRC Ltd. 25 Weighting is also commonly referred to as “valuation” in International Standards Organisation documents. 26 Hamilton L, Edwards S, Aizlewood C, Shiers D, Thistlethwaite P & Steele K. Creating environmental weightings for construction products: Results of a study. BR 493. Bracknell, IHS BRE Press, 2007 27 Aizlewood C, Edwards S, Hamilton L, Shiers D & Steele K. Environmental weightings: their use in the environmental assessment of construction products. Information Paper IP 4/07. Bracknell, IHS BRE Press, 2007

SD6050 Issue 1.0 BRE Global Environmental Profiles methodology 2008 52
Uncontrolled copy if printed. Valid on day of printing only. © BRE Global Ltd 2008
• László Pintér – Director of International Institute for Sustainable Development (IISD) Measurement and Indicators Strategic Objective, leading projects on state of the environment and sustainability reporting, sustainable development indicators and performance evaluation
• R. Andreas Kraemer – Managing Director of Ecologic, Institute for International and European Environmental Policy
• Prof. Helias A. Udo de Haes – Scientific Director and founder (1978) of CML, a multidisciplinary research institute at the Technical University in Delft; Scientific Director of the UNEP/SETAC Life Cycle Initiative for identifying best available practice in Life Cycle Assessment and Life Cycle Management
• Russell M Foster – Chief Executive of the Institute of Environmental Management and Assessment (IEMA) Director of the Society for the Environment (SocEnv) 2003- present. ‘Umbrella body’ for the environment
• John Barwise – Director of QoL Consultancy, Member of Croner Publishing Environment Magazine Editorial Board; Previously Head of Environmental Policy and Research at the Robens Institute, Surrey University
• Magdalena Styles – Policy Development Advisor, Environmental Policy team, Environment Agency, UK
• Peter Matthews – Board member of the Environment Agency for England and Wales 2000-2006 and Founder of the Society for the Environment
• Tony Long – Director of the WWF European Policy Office
• Graham Wynne, CBE – Chief Executive, Royal Society for the Protection of Birds.
Weightings for the Environmental Profiles methodology can be seen in Table 3.

SD6050 Issue 1.0 BRE Global Environmental Profiles methodology 2008 53
Uncontrolled copy if printed. Valid on day of printing only. © BRE Global Ltd 2008
Table 3: Weightings for Environmental Profiles
Environmental Issue Weighting (%)
Climate change 21.6
Water extraction 11.7
Mineral resource extraction 9.8
Stratospheric ozone depletion 9.1
Human toxicity 8.6
Ecotoxicity to water 8.6
Nuclear waste 8.2
Ecotoxicity to land 8.0
Waste disposal 7.7
Fossil fuel depletion 3.3
Eutrophication 3.0
Photochemical ozone creation 0.20
Acidification 0.05

SD6050 Issue 1.0 BRE Global Environmental Profiles methodology 2008 54
Uncontrolled copy if printed. Valid on day of printing only. © BRE Global Ltd 2008
8 Reporting
8.1 General
The manufacturer provides the required Environmental Profile documentation, in the form of a completed questionnaire.
Once the data is processed and an Environmental Profile created, these are written up into an accompanying report and presented to the verifier.
There are therefore two outputs from the Environmental Profiling process:
• an Environmental Profile (EPD)
• a project report
8.2 Project report
The project report supports the data published in the Environmental Profile and sets out how the Environmental Profile was prepared in accordance with the methodology, including a list of all the assumptions made. Manufacturers are asked to review the assumptions made. The report demonstrates in a transparent way how the data and information declared in the Environmental Profile results from the LCA study. The Environmental Profile (EPD) is Appendix 3 of this methodology. This is always published for certified Environmental Profiles.
The project report is owned by the manufacturer and they can decide whether or not to publish.
8.3 Project documentation
The Environmental Profiles project documentation is made available to the verifier in order to demonstrate that the requirements of this Standard have been met. The project documentation is not published or made publicly available.
The project documentation contains the information required to establish the LCA and Environmental Profile. This includes:
a) The input and output data of the unit processes that are used for the LCA calculations;
b) The documentation (measurements, calculations, estimates, sources, correspondence, traceable references to origin, etc.) that provides the basis from which the process data for the LCA is formulated;
c) The specification used to create the manufacturer's building product;
d) Data that demonstrates that the information is complete (mass balance);
e) Referenced literature and databases from which data have been extracted;
f) Documentation from a competent party demonstrating that the building product can fulfil the intended use;
g) Documentation that demonstrates that the chosen processes and scenarios satisfy the requirements set in this International Standard;

SD6050 Issue 1.0 BRE Global Environmental Profiles methodology 2008 55
Uncontrolled copy if printed. Valid on day of printing only. © BRE Global Ltd 2008
h) Documentation that substantiates the chosen life cycle stages of the building product;
i) The data used to carry out the sensitivity analyses;
j) The documentation that substantiates the percentages or figures used for the calculations in the end of life scenario;
k) Documentation that substantiates the percentages and figures (number of cycles, prices, etc.) used for the calculations in the allocation procedure;
l) Information showing how averages of different reporting locations have been calculated in order to obtain generic data;
m) Documentation that substantiates how the additional environmental information is determined (see ISO 14025:2006, 7.2.4);
n) Procedures used to carry out the data collection (questionnaires, instructions, informative material, confidentiality agreements, etc.);
o) The criteria and substantiation used to determine the system boundaries;
p) Documentation used to substantiate any other choices and assumptions;
q) Documentation that demonstrates the consistency when using information modules.
Information as shown in Table 4 is provided within the report to list the scenario choices used for each product and element.
Table 4: Example of matrix to meet requirements of section 8.3 (g), (h), & (j)
Material Life Cycle Stages
Transport to site Construction Use, Maintenance, Repair Disposal
OSB Manufacturer’s data 5% wastage rate 20 year life Wood end of life
8.4 Rules for data confidentiality
Product-specific data is very often confidential, because of:
• competitive business issues
• intellectual property rights; or
• similar legal restrictions
Such confidential data are not made publicly available unless this is requested by the manufacturer who owns the data.
The Environmental Profile only presents data that has been aggregated over the life cycle or relevant portions of it and the aggregation obscures the underlying competitive information.
BRE Global will publish all Environmental Profiles from all stages of the life cycle if requested by a manufacturer. Upstream life cycle inventory data not owned by BRE Global cannot be published.

SD6050 Issue 1.0 BRE Global Environmental Profiles methodology 2008 56
Uncontrolled copy if printed. Valid on day of printing only. © BRE Global Ltd 2008
8.5 Content of an Environmental Profile
The content of an Environmental Profile has been prepared in accordance with ISO 21930:2007. It is fully detailed in Appendix 3.
NOTE: The format is under development and therefore may change.

SD6050 Issue 1.0 BRE Global Environmental Profiles methodology 2008 57
Uncontrolled copy if printed. Valid on day of printing only. © BRE Global Ltd 2008
9 Environmental Profiles Scheme programme development and operation
9.1 Responsibilities of the programme operator
BRE Global is the programme operator and is responsible for:
• establishment of the Environmental Profiles Scheme
• development of the scheme document, i.e. the general participation rules
• development of the methodology for the Environmental Profiles Scheme, including open consultation and also including:
o definition of product category
o collection and creation of product category LCA based information
o development of the methodology document
• recording and publication of the Environmental Profile
• updating the Environmental Profile
9.2 Responsibilities of the peer review panel
The peer review panel is named in section 5.6.2. These three independent experts are responsible for the review of the product category rules as set out in this methodology.
9.2.1 Competence of the peer review panel
The peer review panel members all have:
• good general knowledge of the construction products sector and product-related environmental impacts
• expertise in LCA and methodology for LCA work
• awareness of relevant standards for environmental labelling and LCA
They are national experts representing their country on international standards committees and/or run their own programme.
9.3 Responsibilities of the manufacturer / trade association
Manufacturers submit data and are responsible for:
• generating Life Cycle Inventory data (voluntary)
• communicating their Environmental Profile (voluntary)
• updating their data
SD6050 Issue 1.0 BRE Global Environmental Profiles methodology 2008 58
Uncontrolled copy if printed. Valid on day of printing only. © BRE Global Ltd 2008
9.4 Verification
The Environmental Profiles Scheme provides independent verification. There are two levels of verification:
9.4.1 Verification for generic data sets based on data from two or more manufacturers
Data are verified through an independent review of the manufacturer’s data in a desk based exercise. They are evaluated for accuracy, completeness, precision and representativeness. Data from different manufacturers are compared to each other and their submitted data are compared to existing data sets.
9.4.2 Verification for proprietary data sets from a single manufacturer
Data are subject to third party verification by BRE Global. This takes place through both a site visit and a desk top review, including comparison to existing datasets. The data collection and analysis process is then verified as complete according to the method recorded in the Scheme Document, and procedures, by a technically competent independent reviewer working on behalf of BRE Global. This authorised person is not party to the data collection or processing of the Environmental Profile.
NOTE: BRE Global Ltd is owned by the BRE Trust.
9.4.3 Competency of verification staff
With regard to review and verification procedures, provisions given in ISO 14025:2006, Clause 8 applies. Verifiers are required to have the following competencies:
• general knowledge of the construction products sector and product-related environmental impacts
• expertise in LCA and methodology for LCA work
• knowledge of relevant standards in the fields of environmental labelling and LCA
• knowledge of the regulatory framework within which requirements for Type III environmental declarations have been prepared
• knowledge of Type III declarations programme
• knowledge of the BRE Global Environmental Profiles Methodology

SD6050 Issue 1.0 BRE Global Environmental Profiles methodology 2008 59
Uncontrolled copy if printed. Valid on day of printing only. © BRE Global Ltd 2008
Appendix 1 Performance and service life
Buildings and their component parts generally deteriorate over time. The rate of deterioration depends on a number of factors such as the indoor and outdoor environmental conditions, design, quality of construction, the nature of building use and the level of maintenance. Buildings may also cease to fulfil their intended function due to obsolescence.
These aspects are fundamental to determining the service life performance of a building and its components when using methods such as Life Cycle Assessment (LCA). This Appendix sets out the method for the assessment of service life as used by the Environmental Profiles methodology, and as such should be read alongside the Environmental Profiles methodology. BRE Global has also published a separate Information Paper on this subject28. This describes in more detail how the service life methodology has been applied in the development of the Green Guide to Specification.
A1.0 Introduction
To undertake an LCA of a building material or product it is important to consider and define its life cycle and use scenario. To ensure objectivity and fairness this cannot be considered by examining a quantity of material such a 300 bricks or a tonne of insulation in isolation. This is because a construction material or product can only really be defined in life cycle terms when considered in the context in which it is used, e.g. as a wall.
A wall, or any other type of building element, can be assigned a service life within the study period of an LCA model. In a scenario like this the LCA considers the functions of the building element for a set amount of time (a study period). In order for it to do this, it will commonly require maintenance (and/or intermediate replacements) and at the end of the life, or the study period, an allowance will be made for the building element to be dismantled and disposed of.
By using this approach different materials can be compared on a like-for-like basis, as groups of components that fulfil the same or similar functions. This means that important variables such as the mass of material required to fulfil a particular function are correctly taken into account. This is critical within an LCA because material mass has direct linkage to environmental impact.
In this part of the Environmental Profiles methodology an explanation is provided for how functional comparison is undertaken and how study period, service life and replacement rate are defined.
A1.1 Terms and definitions
A1.1.1 Service life
The period of time from installation during which a building or its parts meets or exceeds its performance requirements
A1.1.2 Study period
The period of time over which the environmental impacts of a building or its parts will be measured
28 Anderson, J., Bourke, K., Clift, M., Lockie, S., Steele, K., & Wilkins, A. Performance and service life in the Environmental Profiles Methodology and Green Guide to Specification. Information Paper IP 1/09, Bracknell, IHS BRE Press, ISBN 978-1-84806-083-8, 2009

SD6050 Issue 1.0 BRE Global Environmental Profiles methodology 2008 60
Uncontrolled copy if printed. Valid on day of printing only. © BRE Global Ltd 2008
A1.1.3 End of life
The point of time after installation when a building or its parts no longer meet the performance requirements and when physical failure is possible and/or when it is no longer practical or economical to continue with corrective maintenance. End of life may also be reached due to fashion or image related factors.
A1.1.4 Reference service life
The service life that a material, component or building element is expected (or is predicted to have) in a certain set (reference set) of in-use conditions life29
A1.1.5 Reference service life value (RSLV)
The material, component or building element reference service life figure used in an Environmental Profile
A1.1.6 Functional unit
Quantified performance of a product system for use as a reference unit30
A1.1.7 Replacement factor
The number of times that a material, component or building element will experience replacement during the study period
A1.2 Declared and functional units
Functional units are used as the basis for ensuring comparability in the Environmental Profiles methodology. They work based on standardised units and defined study periods.
A1.2.1 Environmental Profiles and units of assessment
Environmental Profiles can be created for materials, components or building elements. Within this scope three common types of Environmental Profile are typically reported. Figure A1.1 illustrates these within the life cycle context. They include:
1. a material "cradle to gate" Environmental Profile presented on a “per tonne” basis
2. an installed building element "cradle to site" Environmental Profile presented on a "per square metre" basis
3. a building element "cradle to grave" Environmental Profile using a 60-year study period; these take into account maintenance, replacement and disposal activity for the study period and an assumed disposal of any part of the element remaining after the end of the 60-year study period, at whatever time that might occur, and are calculated on a "per square metre" basis
29 BS ISO 15686-1: 2000 Buildings and Constructed Assets – Service life planning – Part 1: General principles. 30 BS EN ISO 14040: 2006 Environmental Management – Life cycle assessment – Principles and framework.

SD6050 Issue 1.0 BRE Global Environmental Profiles methodology 2008 61
Uncontrolled copy if printed. Valid on day of printing only. © BRE Global Ltd 2008
Figure A1.1: The three different types of Environmental Profiles and the life cycle stages that they include
A1.2.2 Per tonne and building element Environmental Profiles
Table A1.1 describes the processes included within each type of Environmental Profile including the units used to declare environmental impacts and where they can be used in comparison.
Table A1.1: The three types of Environmental Profile
Profile type
Life Cycle stages included Study units Comparison
Cradle to gate
Production stage (raw material supply, raw material transport, manufacturing of products, and all upstream processes from cradle to gate).
Information module: per tonne
Shall not be used for comparison
Cradle to site
As for cradle to gate
AND
Construction process stage (transport of product to the building site and wastage from building installation/construction only) including transport and disposal of waste.
Information module: per square metre installed element
Shall not be used for comparison
Raw material extraction
Cradle to gate (1 tonne of product)
Cradle to site (1m2 of
installed element)
Cradle to grave (1m2 of installed element over a 60-year study period in the
building)
Scope of different Environmental Profiles
Production
Construction
Use
Reuse, recycling and/or disposal
Life cycle

SD6050 Issue 1.0 BRE Global Environmental Profiles methodology 2008 62
Uncontrolled copy if printed. Valid on day of printing only. © BRE Global Ltd 2008
Profile type
Life Cycle stages included Study units Comparison
Cradle to
grave
As for cradle to site
AND
Use stage: repair, replacement, maintenance and refurbishment including transport of any materials and disposal of waste over the study period.
Demolition: is expected to occur any time at or after the end of the study period and is included within this Environmental Profile. It includes transport and disposal of waste.
Functional unit: per square metre installed element over a 60-year study period in the building
Environmental Profile can be used for comparison if the functional unit is equivalent
NOTE: Disposal of waste takes account of waste treatment practice including landfill and incineration burdens. It will also include the allocation of waste to reuse or recycling routes but does not include the burdens arising from these activities.
NOTE: Comparison should only be made with cradle to grave information as gate or site based scenarios do not include service life performance and hence exclude an important aspect which can influence environmental impact and therefore like for like comparison.
A1.2.3 Functional unit
To understand the life cycle of a product, it is essential that it is considered in the context of its application. For the purposes of undertaking LCA studies this is called the functional unit. In this respect the functional unit can be defined as the performance characteristic of a product system. For Environmental Profiles it is used as a reference unit in comparative assessment.
This makes the functional unit the basic unit of Elemental Profiles, which allows comparative assessments. It allows material flows (inputs and output data of an Environmental Profile) to be normalised mathematically. This allows building elements with the same function, but different technical characteristics to be compared.
The functional unit of a building product is related to a building, or part of a building and its performance. Therefore a functional unit of a building product is expressed on the basis of the relevant technical performance characteristics of the building product when integrated into a building.
For the Environmental Profiles methodology, the ‘generic’ functional unit for building products has been chosen to be:
• 1m2 of the typical as-built element
• with - where appropriate - a fixed U-Value set using the 2006 Building Regulations (England and Wales)
• with defined physical characteristics (e.g. load, span, sound transmittance) as may be relevant
• to include any repair, refurbishment or replacement over
• a “study period” of 60-years
A full listing of Environmental Profile functional units can be found in Table A1.2.

SD6050 Issue 1.0 BRE Global Environmental Profiles methodology 2008 63
Uncontrolled copy if printed. Valid on day of printing only. © BRE Global Ltd 2008
A1.3 Study period (60-years)
The study period is the period over which the environmental impacts of a building element will be measured. The Environmental Profile will include for any maintenance, refurbishment or replacement of the building element over the study period.
The Environmental Profiles methodology uses a 60-year study period for measuring the environmental impacts of building elements in all cradle to grave Environmental Profiles. This means the Environmental Profile includes burdens which occur during the 60-year period and also those of disposal that will occur at any time after the end of the 60-year study period.
NOTE: The use of a 60-year time period to define study boundaries does not imply that long life components (i.e. those with a service life in excess of 60-years) will have reached the end of their service lives in 60-years.
NOTE: Where other applications are required, e.g. for infrastructure, an appropriate functional unit will be calculated by the scheme operator.
A1.4 Service life
In cradle to grave assessments some materials, components or building elements may be expected to need maintenance, refurbishment or replacement before the end of the 60-year study period. This is dealt with in the Environmental Profiles methodology by determining a reference service life for each material, component or building element. Note this is not the same as the study period.
The number of maintenance, refurbishment or replacement operations is calculated by considering the likelihood that the component will be replaced within the 60-year study period.
The Environmental Profile will take account of maintenance, refurbishment or replacement operations by increasing the environmental impacts associated with these activities based on the likelihood of replacement over the 60 year study period.
If a component in an element is expected to be replaced within the 60-year study period and can be replaced without removing the rest of the building element, then only the materials associated with that particular component will be replaced. If other components of the building element, or the entire element, must be replaced because of the shorter lived components, then all the relevant components or element will be replaced within the assessment, even if the materials removed have a potentially longer lifetime.
A1.4.1 Reference conditions
In order to undertake the cradle to grave assessment for Environmental Profiles, it is necessary for BRE Global to estimate a reference service life value for each material, component or building element considered.
An Environmental Profile is not project or site specific and therefore does not consider particular factors in identifying a reference service life value. The following relevant factors which affect durability (based on ISO 15686-1) are considered in making the expert assessments of values.
The reference set (i.e. the conditions under which the specified material will be used) is defined as:
1. Material and component quality: complying with relevant BS/ISO standards
2. Design: To good practice standards
3. Workmanship: To good practice standards and BS 8000

SD6050 Issue 1.0 BRE Global Environmental Profiles methodology 2008 64
Uncontrolled copy if printed. Valid on day of printing only. © BRE Global Ltd 2008
4. Indoor environment: Dry and warm
5. Outdoor environment: Inland with normal urban pollution
6. Maintenance: Maintenance in accordance with manufacturers recommendations
7. Use: Specifications adjusted to building sector (office, domestic, education, healthcare and retail and warehouse type buildings)
A1.4.2 Estimating reference service life
BRE Global accesses data from two principle sources in the review of reference service life information for Environmental Profiles. These include 1) data from material suppliers and sector trade associations; and 2) independent reference sources.
Independently verified manufacturer-specific service life data is used as the preferred source, but information provided directly by trade associations can also be valid. Trade industry information is only used where it can be substantiated with the appropriate evidence. This includes:
1. Evidence of service lives from installations supported by photographs and evidence of installation dates
2. Where evidence has been provided from outside the UK, confirmation that similar products with similar specifications have been installed in the UK
3. Third party certification covering reference service lives
4. Evidence from long-term site exposure and/or accelerated testing
5. Confirmation that the product or material complies with relevant codes of practice and standards
6. Where manufacturer or trade association data are not available, independent sources of service life data will be applied.
A1.4.3 Independent sources of reference service life data
Where manufacturer or trade association data is not available, independent sources of service life data are used. These include:
• HAPM* Component life manual. 199231
• BLP* Building fabric component life manual. 199932
• BLP* Building services component life manual: Building life plans. 200033
31 Construction Audit Limited. HAPM Component life manual. HAPM Publications Abingdon, E & FN Spons Taylor & Francis, 1992 32 Building Performance Group (BPG). BPGP Building fabric component life manual. Abingdon, E & FN Spons,Taylor & Francis, 1999 33 Building LifePlans (BLP). BLP Building services component life manual: Building LifePlans. Oxford, Wiley-Blackwell Science, 2000
SD6050 Issue 1.0 BRE Global Environmental Profiles methodology 2008 65
Uncontrolled copy if printed. Valid on day of printing only. © BRE Global Ltd 2008
• CIBSE Guide to ownership, operation and maintenance of building services. 200034
• BCIS. BMI Life expectancy of building components. 200135
• Property Services Agency (PSA). Costs-in-use tables. 199136
NOTE: *The HAPM, BPG and BLP publications have now been updated and amalgamated into the BLP Construction Durability Database (www.blpinsurance.com: follow links to durability data); this was used as a central data record.
A1.4.4 Reference service life values (RSLV)
Once BRE Global has identified a reference service life for a material or product, a “reference service life value” is determined. This is based on more specific in-use conditions, in terms of materials, design, use and maintenance scenario.
A reference service life value is determined for all materials or components used in building elements for functional unit cradle to grave Environmental Profiles. It is used as the basis for material and product replacement rate in these studies.
Where there are differences between varying sources of reference service life data, an expert assessment is made. For the purposes of the Green Guide to Specification update project, the final values were reviewed by Faithful+Gould (see Note below).
The reference service life values used are solely for the purposes of undertaking an Environmental Profile.
The reference service life values will be generic unless manufacturer specific information has been provided to allow BRE Global to derive a specific reference service life value.
Reference service life values will be provided in multiples of 5 years, and will range from 5 to 80 years. Where a reference service life value is given, it is the average and represents a spread of values likely if the component or element was used in a wide range of buildings. Based on data provided in the RICS study (2001)37, BRE Global has assumed that the spread of service live values is distributed equally over a period of the service life value, or 40 years, whichever is the shorter. Four examples are used to illustrate this approach:
A RSLV of 5 years
For a component with a reference service life value of 5 years, replacement is considered to start at 2.5 years, with 50% likelihood that the component will have been replaced after 5 years, and with the component having been completely replaced after 7.5 years. Over the 60-year study period, the component will therefore have been replaced 11.5 times on average.
34 CIBSE. Guide to ownership, operation and maintenance of building services. London, CIBSE, 2000 35 Building Cost Information Service (BCIS). BMI Life expectancy of building components. London, BCIS, 2001 36 Property Services Agency (PSA). Costs-in-use tables. Norwich, The Stationery Office, 1991 37 Life Expectancy of Building Components: Surveyors experiences of buildings in use, a practical guide; Building Cost Information Service; The Royal Institution of Chartered Surveyors (2001).

SD6050 Issue 1.0 BRE Global Environmental Profiles methodology 2008 66
Uncontrolled copy if printed. Valid on day of printing only. © BRE Global Ltd 2008
A RSLV of 30 years
For a component with a reference service life of 30 years, replacement is considered to start at 15 years, with a 50% likelihood of the component having been replaced at year 30, and the replacement being completed by year 45. At the end of the study period, there will be a 50% likelihood that the component will have been replaced twice, therefore the number of replacements will be 1.5.
For where the RSLV was determined to be 40 years or more, the spread of service life values was distributed equally about the stated RSLV, but always assumed a consistent 20 year spread on either side:
A RSLV of 50 years
For a component with a reference service life value of 50 years, replacement is considered to start at year 30, with 50% likelihood of components having been replaced at year 50, ending at year 70. Thus at the end of the 60-year study period, there will be a 75% likelihood that the component will have been replaced, giving a replacement factor of 0.75.
A RSLV of 80 years
A reference service life value of 80 years implies that the material, component or building element has a life in excess of 80 or more years, and replacement will not start until the end of the 60-year study period at the earliest, so no replacement will be assumed.
As this last example illustrates, the use of a 60-year study period does not imply that long life components (i.e. those with a reference service life in excess of 60 years) will have reached the end of their service lives in 60 years.
NOTE: For the purposes of the Green Guide to Specification update, BRE Global also conducted a wider industry consultation. In this process, relevant manufactures and trade associations were provided access to the reference service life data relevant to their materials, components or building specification categories. In this way they could advise BRE Global as to the appropriateness of the reference service lives proposed for use in the Green Guide. In presenting their perspective, it was required that they use the evidence base summarised in Section A1.4.2 to substantiate views. As a final independent review, BRE Global also used Faithful+Gould to examine and critique the final reference service life values applied and used in the guide.
A1.5 End of Service life
A1.5.1 What marks the end of service life?
The end of service life occurs at the point of time after installation when a building or its parts no longer meet the performance requirements and when physical failure is possible and/or when it is no longer practical or economical to continue with corrective maintenance. For functional units that look at floor coverings and partitions, the aspect of ‘fashion’ based churn is also recognised. In these cases the end of service life is also considered to occur when the item requires replacement due to the image and fashion related drivers of the building owner.
A1.5.2 Replacement factors
Replacement factors are important to the Environmental Profiles methodology because they are used in the calculation process to determine the amount of material (i.e. mass) that is required for a building element to perform its functional requirement over the 60-year study period used in a cradle to grave assessment.

SD6050 Issue 1.0 BRE Global Environmental Profiles methodology 2008 67
Uncontrolled copy if printed. Valid on day of printing only. © BRE Global Ltd 2008
Material mass is important as it is used within an Environmental Profile to determine life cycle inventory flows (see Note below) and hence environmental impact.
A type of fractional method is applied to calculate the replacement factors for building element functional units. This means that within each of the building component/specification service life models, the sudden step changes commonly associated with replacement are avoided. This circumvents the problem of having to define a specific service life value in any given generic scenario where the life time of the components will vary within a range and cannot be so accurately predicted. This fractional method is undertaken through using a replacement factor formula.
NOTE: Inventory flows are the environmental interactions that take place between the study system examined by the LCA and the environment around it. They consist of all the inputs and outputs to the study system and include extraction of raw materials and fuels, heat and water consumption, and emissions to air, discharges to water and emissions to land.
A1.5.3 Replacement factor formula
When a replacement is likely to occur within the 60-year study period, the likelihood of replacement can be calculated giving a replacement factor. The amount of material required for the replacements is calculated by identifying a replacement factor. These are determined by using the following formulae:
For reference service life values of 0 to 40 years:
Replacement factor = 5.060−
RSLV
For reference service life values of 40 to 80 years:
Replacement factor = ( )
4080 RSLV−
The notion of the model is one of spreading the replacement period around the point of reference service life value. This is because the service life of materials, components or building elements, in the real world, is always a distribution of replacements around an “average life period”.
Therefore, the trend recognised by this methodology is one which distributes the service live values equally over a period about the service life reference value. This leads to its characterisation as a fractional method based on the probability of replacement either side of the reference service life value.
A summary of replacement factors for different reference service life values can be seen in Table A1.3. The graphical trend lines for these different service life periods are shown in Figure A1.2.
Table A1.3: Replacement factors that a construction component will experience after initial installation within a study period of 60 years
Service Life (years)
5 10 15 20 25 30 35 40 45 50 60 70 80 100
Replacement factor
11.5 5.5 3.5 2.5 1.9 1.5 1.22 1.0 0.88 0.75 0.5 0.25 0.0 0.0

SD6050 Issue 1.0 BRE Global Environmental Profiles methodology 2008 68
Uncontrolled copy if printed. Valid on day of printing only. © BRE Global Ltd 2008
0
3
6
9
12
0 10 20 30 40 50 60 70 80
Study period (years)
No
of R
epla
cem
ents
5 years
10 years
15 years
20 years
25 years
30 years
35 years
40 years
45 years
50 years
60 years
70 years
80 years
90 years
Figure A1.2: Replacement trends for all product estimated service lives from 5 to 80 years as assessed in the Environmental Profiles cradle to grave assessments.
A benefit of the approach is that definitive determination of reference service life values is not necessary as a spread can be used; it also avoids the necessity to determine a reference service life value in excess of 80 years for long life components such as structure where it is inherently difficult to do so.
The cradle to grave Environmental Profile is where this methodology is used. Once a replacement factor has been calculated it can be applied to determine the required material mass over the 60-year study period for the building element and its distinct material components.
In calculating the material masses resulting from product replacement only those items which require replacement and which are integral to the replaced item are included in the assessment. This means that in many instances retained materials exist.
For example, for a double skin profiled roof consisting of coated steel and insulation on a steel structure, the profiled coated steel is determined to have a reference service life value of 25 years. Because the insulation is integral to that component it will also undergo replacement using the same factor. The steel structure however will not be changed and would be retained in the roof component throughout the 60-year study period.
Each cradle to grave Environmental Profile uses this approach whereby replacement factors and specification design details can be used to calculate material masses and subsequently allow the determination of life cycle inventory flows.

SD6050 Issue 1.0 BRE Global Environmental Profiles methodology 2008 69
Uncontrolled copy if printed. Valid on day of printing only. © BRE Global Ltd 2008
Table A1.2: The functional units used for comparative assessment by the Environmental Profiles methodology
Element Element sub-sections Commercial Domestic Schools Health Retail Industrial
Ground floors • Solid •Suspended N/A
1 m2 ground floor of 40 m2 area and exposed perimeter of 18 m to satisfy England and
Wales Building Regulations and a U-value of 0.22 W/m2K.
N/A N/A N/A N/A
Upper floors
1 m2 of upper floor construction, to satisfy building regulations,
capable of supporting a live floor load of 2.5 kN/m2, including any additional beams to
span a 7.5 m column grid and surface ready
for addition of sub-structural floor system.
As Commercial but based on a 4 m span and area of 40 m2, a
live loading of 1.5 kN/m2 and a surface
ready for the addition of a sheet carpet and
underlay.
As Commercial but based on a floor
between classrooms with a 8 m span and a live loading of 3 kN/m2,
and a maximum weighted BB93
standardised impact sound pressure level 60 L’nT (Tmf,max),w (source: BB9338) and surface ready for the addition of a sheet
flooring.
As Commercial but based on a 6 m span, a live loading of 2 kN/m2 and surface ready for the addition of a sheet
flooring.
As Commercial but based on a 6 m span, a live loading of 4 kN/m2 and surface ready for
addition of sub-structural floor system.
Where relevant, see Commercial.
Separating floors • In situ concrete
• Precast concrete • Timber
• Composite
N/A
1 m2 of upper floor with a live loading of 1.5 kN/ m2 to satisfy England and Wales Building
Regulations, in particular a minimum
airborne sound insulation DnTw + Cx of 45 dB and impact
sound insulation L’nTw of 62 dB (source:
Approved Document E 200339) and a span of
5 m.
N/A N/A N/A N/A
38 Department for Education and Skills. Acoustic design of schools: a design guide. Building Bulletin Number 93. London, The Stationery Office, 2003 39 Department for Communities and Local Government (CLG). Approved Document E: Resistance to the passage of sound. (2003 edition). Available as a pdf from www.planningportal.gov.uk

SD6050 Issue 1.0 BRE Global Environmental Profiles methodology 2008 70
Uncontrolled copy if printed. Valid on day of printing only. © BRE Global Ltd 2008
Element Element sub-sections Commercial Domestic Schools Health Retail Industrial
Roofs (flat or pitched) • Flat
• Low pitched (not exceeding 15°) •
Pitched
1 m2 of roof area, (measured
horizontally), to satisfy building regulations and
a U-value of 0.16 W/m2K (pitched) or 0.25 W/m2K (flat).
Based on an overall span of 15 m with support at 7.5 m.
1 m2 of roof area (measured
horizontally), to satisfy England and Wales
Building Regulations, particularly a U-value of 0.16 W/m2K (pitched) or 0.25 W/m2K (flat).
Span of 8 m.
As Commercial and based on a span of 15 m with supports at a
central corridor.
As Commercial with a span of 8 m. As Commercial.
External walls 1 m2 of external wall construction, to satisfy current building regulations, and a U-value of 0.3 W/m2K. Where relevant, the specification will also include an internal wall finish.
Windows and curtain walling
1 m2 of double glazed, fixed pane window or clear glazed curtain walling, to satisfy Building Regulations in England and Wales, and a U-value of 1.8 W/m2K.
Double-glazed window, based on the BFRC domestic window model (1.48 m high × 1.23 m wide with a central mullion and one opening light)40, to satisfy Building Regulations in England and Wales, and a U-value of 1.8 W/m2K.
As Commercial for all windows in building.
All Internal walls and Partitioning for buildings up to three storeys and non-loadbearing walls for buildings four storeys and more
• Framed • Masonry • Demountable and Proprietary
1 m2 of internal wall or partitioning, to satisfy Building Regulations in England and Wales.
As Commercial for all walls except those for classrooms.
As Commercial
Internal walls and partitioning: additional for schools
N/A N/A 1 m2 of internal wall or partitioning between classrooms or classrooms and circulation; to satisfy building regulations, in particular minimum 45 DnT (Tmf,max),w (dB) airborne sound insulation (Source: BB93), and mid-frequency reverberation time, Tmf, in classroom not to exceed 0.6 seconds (Source:
N/A N/A N/A
40 British Fenestration Rating Council (BFRC). www.bfrc.org

SD6050 Issue 1.0 BRE Global Environmental Profiles methodology 2008 71
Uncontrolled copy if printed. Valid on day of printing only. © BRE Global Ltd 2008
Element Element sub-sections Commercial Domestic Schools Health Retail Industrial BB93). Wall to be specified to Severe Duty (SD) as per BS 5234-241.
Separating walls • Masonry • Steel • Timber
N/A 1 m2 of party wall to satisfy England and Wales Building Regulations, in particular a minimum airborne sound insulation DnTw + Cx of 45 DB (Source: Approved Document E 2003.
N/A N/A N/A N/A
Insulation 1 m2 of insulation with sufficient thickness to provide a thermal resistance value of 3 m2K/W, equivalent to approximately 100 mm of insulation with a conductivity (k value) of 0.034 W/mK.
Landscaping: Hard surfacing
• Pedestrian only 1 m2 of hard surfacing, suitable for pedestrian loading, informed by relevant British Standards and Industry consultation.
• Lightly trafficked Areas
1 m2 of hard surfacing, suitable for the parking of cars and light traffic loading, informed by relevant British Standards and Industry consultation.
• Heavily trafficked areas
1 m2 of hard surfacing, suitable for heavier traffic loading, informed by relevant British Standards and Industry consultation.
Landscaping: Boundary protection
1 m2 of boundary protection or balustrading up to 2 m high, informed by relevant British Standards and Industry consultation.
NOTE: U values quoted in Table A1.2 and in other parts of this methodology represent what BRE Global consider to be realistic maximum values to satisfy Part L of the Building Regulations 2006. Performance is measured at the whole building level. All functional units, unless otherwise stated, include any repair, refurbishment or replacement over the 60-year cradle to grave study period.
41 British Standards Institution (BSI). BS 5234-2: 1992 Partitions (including matching linings). Specification for performance requirements for strength and robustness including methods of test

SD6050 Issue 1.0 BRE Global Environmental Profiles methodology 2008 72
Uncontrolled copy if printed. Valid on day of printing only. © BRE Global Ltd 2008
Appendix 2 The Environmental Profiles database and data quality requirements
The development of this edition of the Environmental Profiles methodology has also seen a major initiative undertaken in parallel in which BRE Global and the UK construction materials supply industry have worked to update and grow the depth of the Environmental Profiles database of LCI and LCA information. This Appendix summarises that work and provides explanation of the data quality requirements for Environmental Profiles and the database.
A2.0 Introduction
Environmental Profiles are produced by BRE Global or other licensed service providers using the Environmental Profiles methodology. They can be classified into two principle types where the origin of the LCI information differs (see section 5.7):
• Manufacturer-specific (proprietary)
o LCI derived directly from a specific manufacturing process
• Generic
o LCI derived from a group of manufacturers or from generic databases
The Environmental Profiles methodology is the basis for two schemes designed to produce LCA and EPD:
• the BRE Global Environmental Profiles Certification Scheme, which provides a service to enable manufacturers to publish certified EPD about their proprietary products
• the BRE Global Environmental Profiles Scheme, which provides a service to allow groups of manufacturers or a trade association to obtain, and voluntarily publish, verified LCA data and EPD about generic (typical) construction products
Both types of Environmental Profile are held in the UK database of Environmental Profiles of construction products.
Manufacturers and trade associations can add new Environmental Profiles to the database if they fully comply with the Environmental Profiles methodology and can demonstrate this fact.
A2.1 Generic LCA data
Generic Environmental Profiles of construction products and materials can be derived from one of two routes including 1) data developed from a group of manufacturers who produce the same common product (work arising in this area is often coordinated through a trade association); or 2) from a commercial database of generic LCI/LCA where the gathered data may have come from a number of potential different sources.
A2.1.1 Generic LCA data from trade associations
BRE Global’s preference is always to work with a representative industry trade body to gather LCI to create a generic LCA of a construction product. Indeed, many of the datasets documented in the Environmental Profiles database have been developed by working directly with UK and International trade bodies. These data provide the most accurate and representative picture of products from a sector and are the preferred source of LCA data whenever it is available.

SD6050 Issue 1.0 BRE Global Environmental Profiles methodology 2008 73
Uncontrolled copy if printed. Valid on day of printing only. © BRE Global Ltd 2008
To represent UK production activity, data captured directly through UK trade associations is the preferred source of LCA data, though for materials commonly traded in Europe or globally, European or international trade associations are preferred. Where the industry has worked to gather such information, and provided BRE Global the permission to use the resulting Environmental Profiles, BRE Global has used this data to develop specification tools such as The Green Guide to Specification and Envest.
When LCI of UK supplied construction materials are not forthcoming, BRE Global is able to draw from a number of other sources. One is LCA studies undertaken by trade associations which operate in different geographic regions to the UK. In such cases BRE Global, and if possible, the relevant trade associations (UK and other), work together to ensure that the available LCI data is accurately adapted (where necessary) to produce an Environmental Profile of the construction product that is representative of the generic product available on the UK market.
It is through these initiatives that the Environmental Profiles database was significantly updated over the period 2007 and 2008. Table A3.1 summarises the trade associations which took part in the provision of new LCA data.
Table A3.1: A summary of the LCA Environmental Profiles derived directly from industry trade bodies to represent UK supplied construction products (2007-2008)
Trade Association or Body LCA Environmental Profile data
• Building and material specification design details
• Material and component service life
• Material site waste rates
• Material waste disposal routes
Aircrete Products Association x x
Architectural Cladding Association x
Brick Development Association x x
British Cement Association x x
British Lime Association x
British Plastics Federation, Plastics Europe
x x
British Precast Concrete Federation x
British Ready Mixed Concrete Association
x x
British Woodworking Federation x x
Cementitous Slag Makers Association x

SD6050 Issue 1.0 BRE Global Environmental Profiles methodology 2008 74
Uncontrolled copy if printed. Valid on day of printing only. © BRE Global Ltd 2008
Trade Association or Body LCA Environmental Profile data
• Building and material specification design details
• Material and component service life
• Material site waste rates
• Material waste disposal routes
Composites Processing Association x
Concrete Block Association x x
Concrete Tile Manufacturers Association x
Copper Development Association, Deutsches Kupferinstitut
x x
Council for Aluminium in Building, European Aluminium Association
x x
Engineered Panels in Construction x
Eurisol x x
European Extruded Polystyrene Insulation Board Association
x
Flat Roofing Association x
GUT x x
Gypsum Products Development Association
x
Interpave x x
Lead Sheet Association x
Precast Flooring Federation x x
Quarry Products Association x x
Single Ply Roofing Association x x
Steel Construction Institute, International Iron & Steel Institute, Corus
x x
Steel Window Association x
Stone Federation Great Britain x x

SD6050 Issue 1.0 BRE Global Environmental Profiles methodology 2008 75
Uncontrolled copy if printed. Valid on day of printing only. © BRE Global Ltd 2008
Trade Association or Body LCA Environmental Profile data
• Building and material specification design details
• Material and component service life
• Material site waste rates
• Material waste disposal routes
The Concrete Centre x
UK Forest Products Association x
UK Quality Ash Association x
UK Resilient Flooring Association, European Resilient Flooring Manufacturers Institute
x x
Wood Panel Industries Federation x x
A2.1.2 Generic LCA data from databases
Unfortunately LCA data for some materials is not always available through trade associations. Where assessment has not occurred, or permission to use Environmental Profiles has not been obtained, BRE Global refers to other sources of data for the Environmental Profiles database. These sources include LCA data in the public or private domain and overseas studies, or LCA databases including:
• Ecoinvent – produced for the Swiss Government – www.ecoinvent.ch
• Boustead – produced by a UK-based LCA consultancy – www.boustead-consulting.co.uk
• GaBi – produced by PE Consulting – www.gabi-software.com
• Idemat – produced by TU Delft – www.idemat.nl
• IVAM – produced by the University of Amsterdam – www.ivam.nl
When necessary, BRE Global will take care to adapt a study to ensure that it takes account of the differences between UK and overseas practice, in for example energy mix, LCA methodology, or the improvements in production techniques where older LCA studies are used as a data source. In some cases LCA data is not available, and in such cases BRE Global may derive an LCA dataset by analogy and assumption, and from working off industry literature and first principle calculation.
In all cases BRE Global use the ecoinvent 2000 database as a default data source for quantifying the impact of inventory models. If manufacturers are able to provide more specific, quality data about a product or process they are using, this is used as a preference. The data quality requirements as documented in this Appendix are always applied as appropriate.

SD6050 Issue 1.0 BRE Global Environmental Profiles methodology 2008 76
Uncontrolled copy if printed. Valid on day of printing only. © BRE Global Ltd 2008
A2.1.3 Generic LCA data preferences
A simple order of ranking can be summarised which sets out the BRE Global preference for LCI put into the Environmental Profiles database:
1. Industry-representative data, UK-sourced
2. Industry-representative data, European/International sourced
3. Manufacturer-specific data, UK-sourced
4. Manufacturer-specific data, European/International sourced
5. Best Available data. This data may be derived from commercial databases, published or unpublished literature sources, or be an estimate based on an extrapolation from a similar product.
A2.2 Generic LCA data quality
The Environmental Profiles database contains LCI derived from a number of different sources. To provide users with confidence in generic data quality, a quality framework is used to categorise all generic information that goes into the Environmental Profiles database. Regardless of data source, BRE Global will always categorise an LCI in terms of its quality.
The data quality framework is used to ensure consistent documentation of LCI data quality and the use of LCI that are at a minimum acceptable. The basis to this framework is documented in Table A2.2. It provides a basis for the categorisation of data sourced from 1 – 4 preference classes identified above.
Table A2.2: The Environmental Profiles data quality framework.
QUALITY GOOD FAIR ACCEPTABLE
Age From 2000 onward From 1995-1999 From 1990-1994
Geography UK* Europe Rest of World
Source Trade Association Single Manufacturer Single Manufacturer
Representativeness Over 50% of industry 20-50% of industry Less than 20% of industry
LCA Practitioner LCA verified by 3rd Party
Non-verified Student, Non-verified
Methodology Transparent and including all inputs and outputs
Some transparency or some aspects missing (e.g. waste)
No transparency, unclear methodology or significant aspects missing (e.g. emissions)
NOTE: *UK specific data is generally considered to be most acceptable. The exception here is for raw materials such as steel or plastics which are commonly sourced internationally.
To allow for uncertainty arising with reduction in data quality and encourage industry trade bodies to gather their own LCI, the overall environmental impact of a material or product LCA may be adjusted

SD6050 Issue 1.0 BRE Global Environmental Profiles methodology 2008 77
Uncontrolled copy if printed. Valid on day of printing only. © BRE Global Ltd 2008
by a quality factor where it fails to meet any of the quality criteria. Table A2.3 shows the Environmental Profiles methodology adjustment protocol.
Table A2.3: The Environmental Profiles methodology LCA data adjustment protocol.
QUALITY GOOD FAIR ACCEPTABLE
Age No adjustment No adjustment –manufacturing efficiency will have improved over the time period therefore no further adjustment is required
No adjustment –manufacturing efficiency will have improved over the time period therefore no further adjustment is required
Geography No adjustment 5% increase 10% increase
Source No adjustment 10% increase 10% increase
Representativeness No adjustment 5% increase 10% increase
LCA Practitioner No adjustment 2% increase 5% increase
Methodology Data adapted to BRE Global methodology
Data adapted to BRE Global methodology and worst case estimate for missing data
Data adapted to BRE Global methodology and worst case estimate for missing data
These adjustments are necessary to overcome potential inaccuracy in low quality data, to ensure that UK industry is well represented in its generic models, and to ensure that those organisations which undertake Environmental Profiles and prepare high quality datasets are not disadvantaged.
The adjustment protocol shown in Table A2.3 has been used in the development of all Environmental Profiles (LCA) undertaken to the Environmental Profiles methodology documented in this BRE Global methodology and subsequently used in the 4th edition of the Green Guide to Specification (www.thegreenguide.org).
In making this statement however, it is important to recognise a distinction between background LCI and the upstream processes it is often used to represent, and the ‘gate to gate’ LCI gathered or calculated to represent the production process activity of a specific construction product.
The distinction between the two is important because the adjustment protocol is applied to the gate to gate LCI/LCA, but not the inventories taken for upstream or background processes. This includes all inventories taken from the ecoinvent database.
A2.3 Generic data for Transport, Energy and Waste models
LCA models for transport, energy and waste disposal (unit processes) have been produced by BRE Global in consultation with Trade Associations. These are applied within an LCA of a construction product based on the scenario for production and the specific circumstance that must be represented.

SD6050 Issue 1.0 BRE Global Environmental Profiles methodology 2008 78
Uncontrolled copy if printed. Valid on day of printing only. © BRE Global Ltd 2008
Standard LCA models for each unit process are always used unless manufacturers provide evidence that an alternative scenario is more typical. The standard models are checked with manufacturers for appropriateness and tailored models are created where evidence is available for particular practices.
The ecoinvent database is used as the basis for all the standard models and more detailed description can be found in the following sections of the methodology:
• Energy – see section 6.6
• Transport – see section 6.7
• Waste and Disposal – see section 6.8
BRE Global has not applied the LCI data adjustment protocol to these ecoinvent models.

SD6050 Issue 1.0 BRE Global Environmental Profiles methodology 2008 79
Uncontrolled copy if printed. Valid on day of printing only. © BRE Global Ltd 2008
Appendix 3 Content of an Environmental Profile (EPD)
This section documents the content of an Environmental Profile and has been prepared in accordance with ISO 21930:2007. The format presented in this Appendix remains under development and therefore may change as the Environmental Profiles scheme evolves (see SD028). It should be read in conjunction with section 8 of this methodology.
A3.0 Declaration of general information
All Environmental Profiles issued under this scheme shall follow the format presented here and include the parameters identified in this Appendix.
The following information is declared within the Profile format:
a) The name and address of the manufacturer(s);
b) The description of the building product’s use and the functional or declared unit of the building product to which the data relates;
c) Building product identification by name (e.g. including production code) and a simple visual representation of the building product to which the data relates;
d) Name of the programme and the programme operator’s address, logo and website;
e) The reference for this methodology;
f) The date the declaration was issued and period of validity;
g) Environmental Aspects Data from LCA or LCI or information modules (see A3.1 Declaration of environmental aspects);
h) Additional environmental information: An Ecopoint Score and a Green Guide Rating; other information as required;
i) Content of the product is provided;
j) Information on which life cycle stages are not considered, if the declaration is not based on an LCA covering all stages;
k) A statement that environmental declarations from different programmes may not be comparable;
l) The site(s), manufacturer or group of manufacturers or those representing them for whom the results of the LCA are representative;
m) Information on where explanatory material may be obtained.
The Table A3.1 shall be included in each Environmental Profile to demonstrate the verification process it has been through.

SD6050 Issue 1.0 BRE Global Environmental Profiles methodology 2008 80
Uncontrolled copy if printed. Valid on day of printing only. © BRE Global Ltd 2008
Table A3.1: Information to be replicated in each Environmental profile to provide transparency on the verification process
BRE Global Methodology for Environmental Profiles of Construction Products: Product Category Rules for Type III environmental product declaration of construction products has been peer reviewed to ISO 21930:2007 by an independent third party panel chaired by Wayne Trusty of Athena Sustainable Materials Institute, Canada. Full contact details are available from BRE Global.
Independent verification of the EPD and data, in accordance with ISO 21930:2007
* Internal * External
The third party verifier of this EPD:
……………………………….. …………………………………..
Print Name Signature
A3.1 Declaration of environmental aspects
A3.1.1 Environmental impacts expressed with the impact categories of LCIA
• Abiotic depletion
• Global warming (GWP100)
• Ozone layer depletion (ODP)
• Human toxicity
• Freshwater aquatic ecotoxicity
• Terrestrial ecotoxicity
• Photochemical oxidation
• Acidification
• Eutrophication
• Solid waste
• Radioactivity
• Minerals Extraction
• Water Extraction
A3.1.2 Use of resources and renewable primary energy (data derived from LCI and not assigned to the impact categories of LCIA)
• depletion of non-renewable energy resources
• depletion of non-renewable material resources

SD6050 Issue 1.0 BRE Global Environmental Profiles methodology 2008 81
Uncontrolled copy if printed. Valid on day of printing only. © BRE Global Ltd 2008
• use of renewable material resources
• use of renewable primary energy
• consumption of freshwater
A3.1.3 Waste to disposal (data derived from LCA not assigned to the impact categories of LCIA)
The waste allocated to the building product during its life cycle is separated into two categories in the Environmental Profile:
• hazardous waste
• non-hazardous waste
A3.1.4 Emissions to water, soil and to indoor air
Releases to ground and surface water are included within the LCIA data categories. Information on emissions to indoor air and on human health and comfort due to chemical, biological and physical emissions is not provided in this Environmental Profile.
A3.1.5 Additional environmental information
An Environmental Profile includes additional information related to environmental issues, other than the environmental information derived from LCA, LCI or information modules (see A3.1.1.) and other than emissions to water and to indoor air. This information is separate from the information described in A3.1.2, A3.1.3 and A3.1.4.
A3.1.6 Scenarios and technical information
Scenarios and technical information are necessary for the application of Environmental Profiles in building assessment. Therefore Environmental Profiles, when relevant, include information for the building product about:
• reference service life of the building product
• transportation, construction, use, operation, maintenance and replacements based on the reference service life
A3.1.7 Differentiation of use of material and energy resources
The use of resources for all stages of the life cycle of the building product is differentiated into the following list:
• hydro/wind power
• fossil energy
• bio energy
• nuclear energy
• other energy
• secondary fuels

SD6050 Issue 1.0 BRE Global Environmental Profiles methodology 2008 82
Uncontrolled copy if printed. Valid on day of printing only. © BRE Global Ltd 2008
• non-renewable resources
• renewable resources
• recycled materials
• secondary raw materials
• land
• water
• hazardous substances
The information documented throughout this Appendix is comprehensive. For this reason the Environmental Profiles shall be communicated using a consistent tabular structure. This is presented in Table A3.2.
Table A3.2: Tabular formats providing framework in which Environmental profiles data shall be communicated
Company information (name & address)
Date issued + period of validity
Product description (including picture & Brand Name)
Product content including specification of materials & substances that can adversely affect human health & the environment, in all stages of the life cycle.
Restricted according to confidentiality.
Information Module/Functional Unit
Life cycle stages covered
Note: Environmental declarations from different programmes may not be comparable
ENVIRONMENTAL INFORMATION
Theme Unit Value
I. Product stage
(cradle-to-gate)
II. Design & construction process
stage
III. Building stage
IV. End of life stage
(grave)

SD6050 Issue 1.0 BRE Global Environmental Profiles methodology 2008 83
Uncontrolled copy if printed. Valid on day of printing only. © BRE Global Ltd 2008
Raw
mat
eria
l sup
ply
Tran
spor
t
Man
ufac
turin
g
Tran
spor
t
Con
stru
ctio
n-in
stal
latio
n pr
oces
s
Ope
ratio
n
Mai
nten
ance
Dec
onst
ruct
ion
& d
emol
ition
Tran
spor
t
Reu
se/re
cycl
ing
Dis
posa
l
Depletion of non-renewable material resources
kg
Use of renewable material resources
kg
Depletion of non-renewable energy resources
MJ
Use of renewable primary energy resources
MJ
Consumption of freshwater m3
Climate change kg CO2
Depletion of the stratospheric ozone layer
kg CFC-11
Formation of tropospheric ozone (photochemical oxidation)
kg ethene
Acidification of land and water sources
kg SO2
Eutrophication kg PO4
Waste to disposal – non-hazardous kg
Waste to disposal –hazardous kg
Reference service life for product
Years
ADDITIONAL ENVIRONMENTAL INFORMATION
Human toxicity
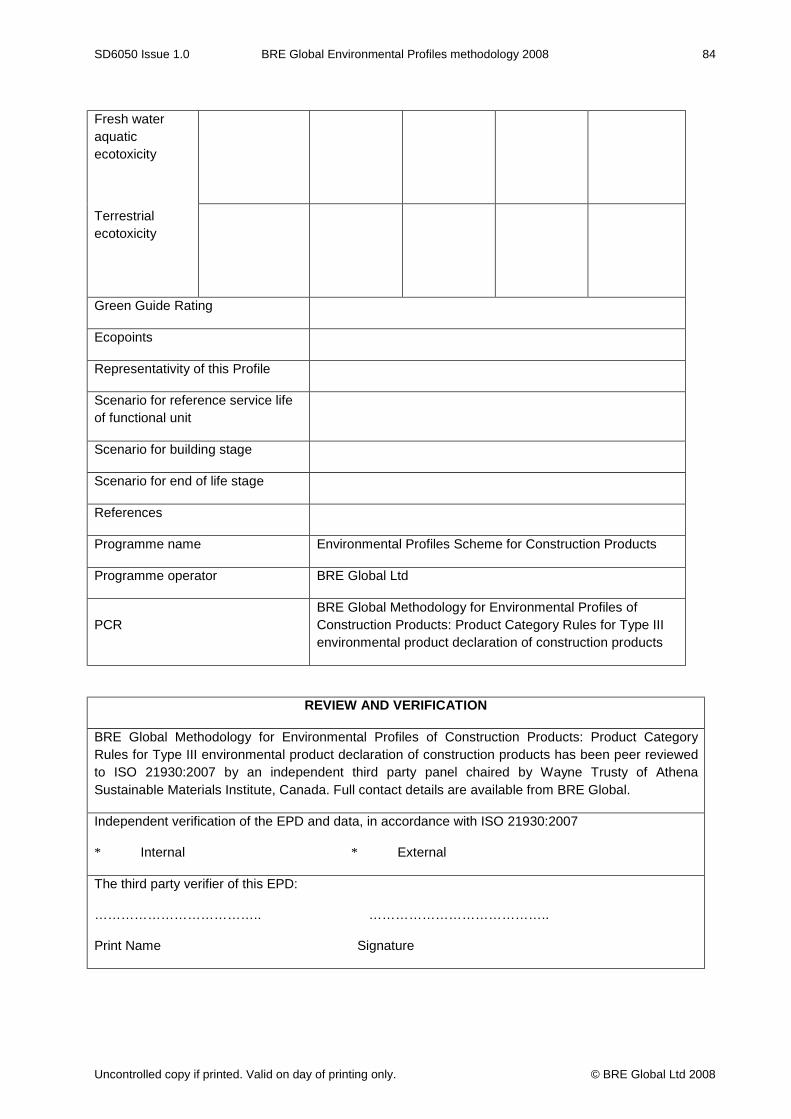
SD6050 Issue 1.0 BRE Global Environmental Profiles methodology 2008 84
Uncontrolled copy if printed. Valid on day of printing only. © BRE Global Ltd 2008
Fresh water aquatic ecotoxicity
Terrestrial ecotoxicity
Green Guide Rating
Ecopoints
Representativity of this Profile
Scenario for reference service life of functional unit
Scenario for building stage
Scenario for end of life stage
References
Programme name Environmental Profiles Scheme for Construction Products
Programme operator BRE Global Ltd
PCR BRE Global Methodology for Environmental Profiles of Construction Products: Product Category Rules for Type III environmental product declaration of construction products
REVIEW AND VERIFICATION
BRE Global Methodology for Environmental Profiles of Construction Products: Product Category Rules for Type III environmental product declaration of construction products has been peer reviewed to ISO 21930:2007 by an independent third party panel chaired by Wayne Trusty of Athena Sustainable Materials Institute, Canada. Full contact details are available from BRE Global.
Independent verification of the EPD and data, in accordance with ISO 21930:2007
* Internal * External
The third party verifier of this EPD:
……………………………….. …………………………………..
Print Name Signature

SD6050 Issue 1.0 BRE Global Environmental Profiles methodology 2008 85
Uncontrolled copy if printed. Valid on day of printing only. © BRE Global Ltd 2008
Appendix 4 Background to the characterisation factors used to create the Environmental Profiles
The Environmental Profiles methodology uses and reports the following environmental impact categories. The organisation responsible for developing the impact category is summarised in brackets after each title. It should be read in conjunction with section 7 of this standard.
A4.0 Acidification (CML 2000)
Acidic gases such as sulphur dioxide (SO2) and nitrogen oxides (NOx) given off in fuel combustion react with water in the soil or in the atmosphere (where it forms "acid rain"). Acid deposition can damage ecosystems and erode materials. Acidification Potential (AP) is expressed using the reference unit, kg SO2 equivalent.
The model does not take account of regional differences in terms of which areas are more or less susceptible to acidification. The method accounts for acidification caused by ammonia, nitrogen oxides and sulfur oxides. It accounts for acidification due to fertiliser use, according to the method developed by the Intergovernmental Panel on Climate Change (IPCC)42. CML have based the characterisation factor on the RAINS model developed by the University of Amsterdam43.
A4.1 Climate change (CML 2000)
Climate change refers to the change in global temperature caused via the greenhouse effect by the release of "greenhouse gases" such as carbon dioxide by human activity. There is now scientific consensus that the increase in these emissions is having a noticeable effect on climate. Raised global temperature is expected to cause climatic disturbance, desertification, rising sea levels and spread of disease.
The Environmental Profiles characterisation model as based on factors developed by the UN’s Inter-governmental Panel on Climate Change (IPCC). Factors are expressed as Global Warming Potential over the time horizon of 100 years (GWP100), measured in the reference unit, kg CO2 equivalent.
A4.2 Ecotoxicity to freshwater and land (CML 2000)
The emission of some substances can have impacts on ecosystems. Ecotoxicity potentials are calculated with a toxicity model, USES-LCA44, which is based on EUSES, the EU’s toxicity model45. This provides a method for describing fate, exposure and the effects of toxic substances on the environment. Characterisation factors are expressed using the reference unit, kg 1,4-dichlorobenzene equivalents (1,4-DB)/kg emission, and are measured separately for impacts of toxic substances on:
42 Forster P, Ramaswamy V, Artaxo P, Berntsen T et al. Changes in atmospheric constituents and in radiative forcing, Table 2.14. In: Solomon S, Qin D, Manning M, Chen Z et al (eds) Climate Change 2007: The physical science basis. Contribution of Working Group I to the Fourth Assessment Report of the Intergovernmental Panel on Climate Change. Cambridge, Cambridge University Press, 2007 43 Heijungs R & Huijbregts M. Threshold-based life cycle impact assessment and marginal change: incompatible? CML-SSP Working Paper 99.002. 1999. Centrum voor Milieukunde (Institute for Environmental Sciences), Leiden University (CML). Available from: www.leidenuniv.nl/CML 44 Huijbregts MAJ. Priority assessment of toxic substances in the frame of LCA – The multi-media fate, exposure and effect model USES-LCA. Amsterdam: University of Amsterdam, 1999 45 Institute for Environment & Sustainability. European Union System for the Evaluation of Substances (EUSES). Version 1. Ispra, Italy, Joint Research Centre, European Commission, 1997

SD6050 Issue 1.0 BRE Global Environmental Profiles methodology 2008 86
Uncontrolled copy if printed. Valid on day of printing only. © BRE Global Ltd 2008
• Freshwater aquatic ecosystems
• Terrestrial ecosystems
NOTE: Characterisation factors are also available for marine ecotoxicity, and ecotoxicity to marine and freshwater sediments. The marine and freshwater sedimentary ecotoxicity factors are not included within the CML baseline characterisation factors and are therefore not included here. CML has identified errors in its marine ecotoxicity category and do not recommend its use until these have been corrected.
NOTE: It should be noted that issues relating to toxicity generate much debate. The reader is advised to review carefully any construction product supplier’s guidance, to note any relevant regulations, codes and standards appropriate to different industries and materials and to consider the context and application within which the materials are to be used. The Environmental Profiles methodology does consider toxic effects, but these should in no way be considered comprehensive for any of the material options considered. Many of the chemicals used in society in materials and products have not undergone a risk assessment, and assessment techniques are still developing.
A4.3 Eutrophication (CML 2000)
Nitrates and phosphates are essential for life but increased concentrations in water can encourage excessive growth of algae, reducing the oxygen within the water and damaging ecosystems. Potential sources include fertilisers and NOx emissions from the combustion of fossil fuels. Eutrophication potential is based on the work of Heijungs et al.46, and is expressed using the reference unit, kg PO4 equivalents.
Direct and indirect impacts of fertilisers are included in the method. The direct impacts are from production of the fertilisers and the indirect ones are calculated using the IPCC method47 to estimate emissions to water causing Eutrophication.
A4.4 Fossil fuel depletion (BRE Global)
This impact category indicator is related to the use of fossil fuels. Fossil fuels provide a valuable source of energy and feedstock for materials such as plastics. Although there are alternatives, these are only able to replace a small proportion of our current use. Fossil fuels are a finite resource and their continued consumption will make them unavailable for use by future generations.
BRE Global use an absolute measure based on the energy content of the fossil fuel. This does not take into account the relative scarcity of different fossil fuels, but in fact these only vary by 17% between coal (the most common) and gas (the most scarce). The characterisation factor is measured in tonnes of oil equivalent (toe).
46 Heijungs R, Guinée JB, Huppes G et al. Environmental life cycle assessment of products. Guide and background (Part 1). October 1992. Centrum voor Milieukunde (Institute for Environmental Sciences), Leiden University, 1992 47 Forster P, Ramaswamy V, Artaxo P, Berntsen T et al. Changes in atmospheric constituents and in radiative forcing, Table 2.14. In: Solomon S, Qin D, Manning M, Chen Z et al (eds) Climate Change 2007: The physical science basis. Contribution of Working Group I to the Fourth Assessment Report of the Intergovernmental Panel on Climate Change. Cambridge, Cambridge University Press, 2007
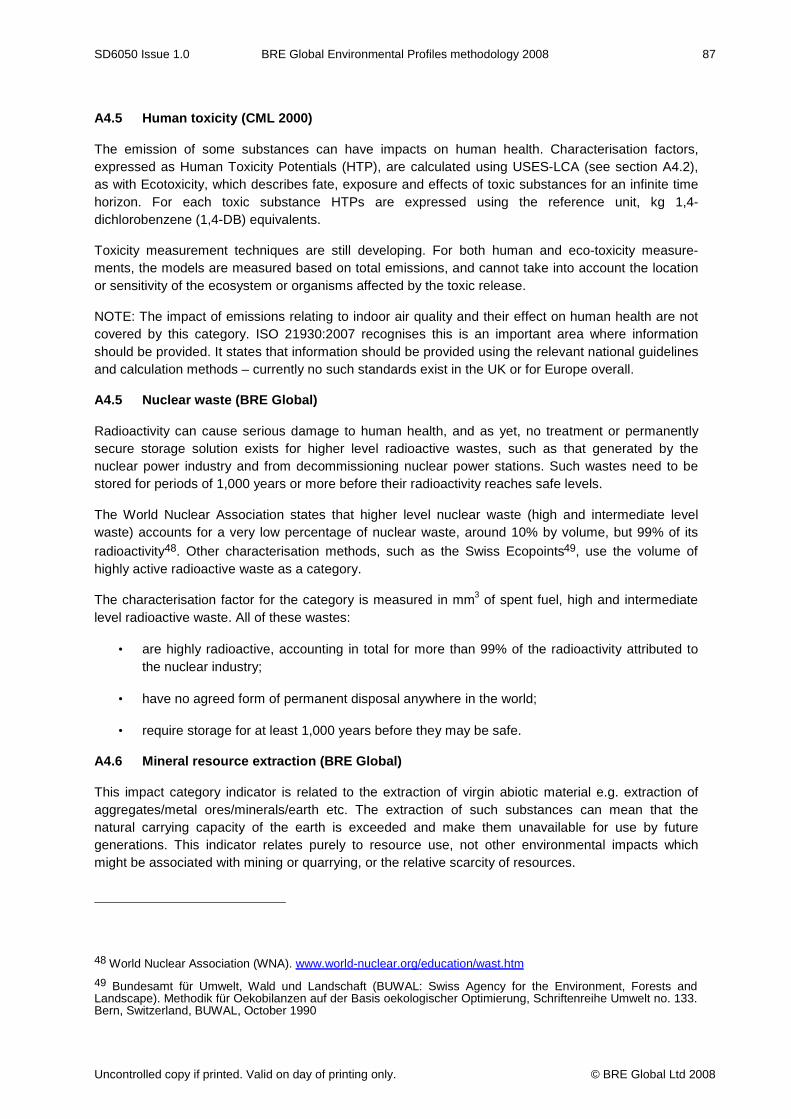
SD6050 Issue 1.0 BRE Global Environmental Profiles methodology 2008 87
Uncontrolled copy if printed. Valid on day of printing only. © BRE Global Ltd 2008
A4.5 Human toxicity (CML 2000)
The emission of some substances can have impacts on human health. Characterisation factors, expressed as Human Toxicity Potentials (HTP), are calculated using USES-LCA (see section A4.2), as with Ecotoxicity, which describes fate, exposure and effects of toxic substances for an infinite time horizon. For each toxic substance HTPs are expressed using the reference unit, kg 1,4-dichlorobenzene (1,4-DB) equivalents.
Toxicity measurement techniques are still developing. For both human and eco-toxicity measure-ments, the models are measured based on total emissions, and cannot take into account the location or sensitivity of the ecosystem or organisms affected by the toxic release.
NOTE: The impact of emissions relating to indoor air quality and their effect on human health are not covered by this category. ISO 21930:2007 recognises this is an important area where information should be provided. It states that information should be provided using the relevant national guidelines and calculation methods – currently no such standards exist in the UK or for Europe overall.
A4.5 Nuclear waste (BRE Global)
Radioactivity can cause serious damage to human health, and as yet, no treatment or permanently secure storage solution exists for higher level radioactive wastes, such as that generated by the nuclear power industry and from decommissioning nuclear power stations. Such wastes need to be stored for periods of 1,000 years or more before their radioactivity reaches safe levels.
The World Nuclear Association states that higher level nuclear waste (high and intermediate level waste) accounts for a very low percentage of nuclear waste, around 10% by volume, but 99% of its radioactivity48. Other characterisation methods, such as the Swiss Ecopoints49, use the volume of highly active radioactive waste as a category.
The characterisation factor for the category is measured in mm3 of spent fuel, high and intermediate level radioactive waste. All of these wastes:
• are highly radioactive, accounting in total for more than 99% of the radioactivity attributed to the nuclear industry;
• have no agreed form of permanent disposal anywhere in the world;
• require storage for at least 1,000 years before they may be safe.
A4.6 Mineral resource extraction (BRE Global)
This impact category indicator is related to the extraction of virgin abiotic material e.g. extraction of aggregates/metal ores/minerals/earth etc. The extraction of such substances can mean that the natural carrying capacity of the earth is exceeded and make them unavailable for use by future generations. This indicator relates purely to resource use, not other environmental impacts which might be associated with mining or quarrying, or the relative scarcity of resources.
48 World Nuclear Association (WNA). www.world-nuclear.org/education/wast.htm 49 Bundesamt für Umwelt, Wald und Landschaft (BUWAL: Swiss Agency for the Environment, Forests and Landscape). Methodik für Oekobilanzen auf der Basis oekologischer Optimierung, Schriftenreihe Umwelt no. 133. Bern, Switzerland, BUWAL, October 1990

SD6050 Issue 1.0 BRE Global Environmental Profiles methodology 2008 88
Uncontrolled copy if printed. Valid on day of printing only. © BRE Global Ltd 2008
The indicator is based on the Total Material Requirement (TMR) indicators used by the European Union and developed by the Wuppertal Institute, based on earlier work for the World Resources Institute. The indicators covering fossil fuel, biomass (mainly agricultural product) and soil erosion (only covered for agriculture, not forestry) are not included. Further details can be obtained in the Eurostat working papers, Technical Reports 55 and 5650.
The indicator calculates the total resource use associated with any use of any non-energy, abiotic materials within the EU, wherever the resource use occurs. For example, for steel use, it traces back to tonnes of iron ore extraction wherever this occurs. The TMR indicator includes material that is extracted as a result of economic activities, but not used as input for production or consumption activities, for example mining overburden. Excavated and dredged material is also included. For normalisation purposes, the Eurostat data provides relevant figures covering imports of materials as well as resource use within Europe.
A4.7 Photochemical ozone creation: summer smog (CML 2000)
In atmospheres containing nitrogen oxides (NOx, a common pollutant) and volatile organic compounds (VOCs), ozone can be created in the presence of sunlight. Although ozone is critical in the high atmosphere to protect against ultraviolet (UV) light, at low level it is implicated in impacts as diverse as crop damage and increased incidence of asthma. VOC sources include solvents (e.g. in paints, glues or cleaning materials), and fuels.
Photochemical ozone creation potential (also known as summer smog) for emission of substances to air is calculated with the United Nations Economic Commission for Europe (UNECE) trajectory model51 (including fate), and expressed using the reference unit, kg ethene (C2H4) equivalents/kg emission.
A4.8 Solid waste (BRE Global)
This category represents the environmental issues associated with the loss of resource implied by the final disposal of waste. Any waste that is disposed of in landfill or incinerated without energy recovery will be included. The aspect is also used in other characterisation methodologies, for example the Dutch EcoIndicator52 and the Swiss Ecopoints (see section A4.5). The characterisation factor is based on the mass of solid waste. Key points for this characterisation factor are:
• reflects the loss of resource resulting from waste disposal (in contrast to recycling or reuse);
• does not include any other impacts associated with landfill or incineration – emissions from decomposition, burning and associated transport and other machinery are included in the relevant categories;
50 Bringezu S & Schütz H. Total material requirement of the European Union. Technical report Nos 55 & 56. Copenhagen, European Environment Agency, 2001
51 (a) Derwent RG, Jenkin ME, Saunders SM & Pilling MJ. Photochemical ozone creation potentials for organic compounds in Northwest Europe calculated with a master chemical mechanism. Atmospheric Environment 32: 2429–2441. 1998
(b) Jenkin ME & Hayman GD. Photochemical ozone creation potentials for oxygenated volatile organic compounds: sensitivity to variations in kinetic and mechanistic parameters. Atmospheric Environment 33: 1775–1293. 1999 52 Product Ecology Consultants (PRé). Eco-indicator 99: life cycle impact assessment and ecodesign method. Available at www. pre.nl/eco-indicator99

SD6050 Issue 1.0 BRE Global Environmental Profiles methodology 2008 89
Uncontrolled copy if printed. Valid on day of printing only. © BRE Global Ltd 2008
• the mass of waste is used as a proxy for the loss of resource;
• includes waste sent to incineration and landfill or any other form of final disposal (e.g. dumping on land or in the sea);
• does not differentiate between hazardous, non-hazardous, inert or organic wastes;
• different impacts from hazardous, non-hazardous etc. will be;
• included within the waste treatment models (landfill, incineration and composting) for these wastes;
• where heat recovery, energy recovery or other material recovery (e.g. recovery/recycling of ash, metal residues etc.) are undertaken as part of incineration or landfill, then value is used to calculate the loss of resource.
EXAMPLE If an incineration process makes 50% of its income from processing waste, 25% from heat recovery and 25% from sale of residues/ash, then only 0.5 tonnes of final waste disposal is attributed per tonne of waste treated.
If a landfill site makes 90% of its income from receiving waste, and 10% from energy recovery from landfill gas, then 0.9 tonnes of final waste disposal is attributed per tonne of waste received.
A4.9 Stratospheric ozone depletion (CML2000)
Damage to the ozone layer by chlorinated and brominated chemicals increases the amount of harmful ultraviolet (UV) light hitting the earth's surface. Although the use of chemicals such as CFCs and HCFCs have been phased out in Europe following the 1987 Montreal Protocol, much existing refrigeration equipment and insulation foam still contains CFCs and HCFCs.
The characterisation model has been developed by the World Meteorological Organisation (WMO) and defines ozone depletion potential of different gases relative to the reference substance chloro-fluorocarbon-11 (CFC-11), expressed in kg CFC-11 equivalent.
A4.10 Water extraction (BRE Global)
Around the world, water is becoming an increasingly scarce resource, due to increased demand, and changes in patterns of rainfall. To recognise the value of water as a resource, and the damage that over extraction from rivers and aquifers can cause, this category includes all water extraction, except:
• Seawater
• Water extracted for cooling or power generation and then returned to the same source with no change in water quality (water lost through evaporation would be included in the category)
• Water stored in holding lakes on site for recirculation (‘top-up’ water from other sources would be included)
• Rainwater collected for storage on site
This category is measured using m3 of water extracted.

SD6050 Issue 1.0 BRE Global Environmental Profiles methodology 2008 90
Uncontrolled copy if printed. Valid on day of printing only. © BRE Global Ltd 2008
Appendix 5 Carbonation calculations
Carbonation of Calcium Oxide in concrete and lime is an important aspect. How the Environmental Profiles methodology deals with the topic is summarised in this Appendix.
A5.0 Introduction
The Environmental Profiles methodology takes into account the carbonation of Calcium Oxide (CaO) within products containing cement and lime. Different assumptions have been made for different products.
A5.1 Products containing Lime
For products containing lime, 100% of the CaO is assumed to carbonate within a short time after installation in the building. Therefore the carbonation of lime is considered within the per tonne Cradle to Gate Environmental Profile for both quick lime and hydrated lime. The amount of carbonation is equivalent to the CO2 driven off from the calcium carbonate in making the lime.
A5.2 Virgin Products containing Cement
The amount of carbonation for cement based products has been calculated based on a simplified version of the approach provided in a Danish report “Guidelines- Uptake of carbon dioxide in the life cycle inventory of concrete”53, and from information supplied by the Concrete Centre in the UK. This document can be obtained from the Concrete Centre or BRE Global.
The approach covers two aspects, the depth of carbonation which can be expected in different elements, and the amount of carbonation where it occurs.
Based on results from the study, and advice from the Concrete Study, concrete products have been split into two groups.
For either group, the assumptions about the relative rate of different types of products are similar. Concrete blocks assume an instant carbonation at the point of manufacture. Upper floors carbonate faster than lower floors because two sides are exposed to air. For all concrete layers it is the area exposed rather than weight of the material that is the key factor in determining how much CO2 will be absorbed.
A5.2.1. Group 1
For the first group, covering concrete blocks, low strength concrete and mortars and screeds, the assumption is that the total depth of the product will carbonate within the building lifetime. This is based on estimates provided within the Danish report which give a depth of carbonation for ‘sheltered’ and indoors’ locations of 97 mm over 60 years. Since carbonation occurs from both sides of the block, the total theoretical depth of carbonation would be approximately 200 mm, which is greater than the depth of most blocks, low strength concrete and mortars. For screeds, most are less than 100mm thick and will therefore carbonate even though only one face is exposed.
53 Kirsten Pommer & Claus Pade, “Guidelines – Uptake of carbon dioxide in the life cycle inventory of concrete”, Danish Technological Institute, October 2005, prepared as part of the Nordic Innovation Centre Project “CO2 Uptake During the Concrete Life Cycle”

SD6050 Issue 1.0 BRE Global Environmental Profiles methodology 2008 91
Uncontrolled copy if printed. Valid on day of printing only. © BRE Global Ltd 2008
The amount of carbonation is therefore based the % of CaO which will carbonate, and the amount of CaO within the concrete product.
For these products, based on data provided by the Concrete Centre, the assumption is that 63% of the CaO will carbonate.
The amount of CaO can be calculated from the amount of cement within the concrete product (Qc), the % of clinker within cement (80% for ready mix and 90% for precast and paving), and % of CaO within the clinker (65%).
The amount of CO2 reabsorbed through carbonation can be found by multiplying the mass of CaO which carbonates by the molecular mass of CO2 and dividing by the molecular mass of CaO (44/56).
A5.2.2. Group 2
The second group covers high strength ready mix and precast concrete and paving.
For these, because the strength of the concrete is higher, the amount of carbonation is less during the building lifetime, and the Danish Guidelines provide an estimate of the depth of carbonation expected, and therefore factors which can be used to provide indicative carbonation and mass of carbon dioxide reabsorbed (M) for various elements.
Additionally, where concrete is recycled or landfilled (10% of concrete arising), further carbonation is assumed to take place as the concrete is broken up and exposed to air. The carbonation methodology attributes the carbonation that takes place for recycled concrete within the Environmental Profile for the recycled concrete. For concrete that is landfilled, this carbonation is attributed to the original product. It is worth noting that the environmental performance of the waste disposal cancels out any environmental benefit arising from the carbonation. The amount of carbonation within recycled and landfilled concrete is based on the typical particle size, the existing level of carbonation and the likely depth of further carbonation. The Concrete Centre provided BRE Global with secondary life factors (E) to take account the carbonation of landfilled concrete over a 100 year secondary life, allowing a longer period for the remaining CaO to carbonate.
The Secondary Life Factors are:
Ready mix: E = 2.02
Precast: E = 1.39
Paving: E = 1.67
Mass of CO2 absorbed = K x S x (√SP) x Q x 0.65 x (44/56) x C x E
K= depth of carbonation
S= Surface area
SP= Study Period (100 years)
Q= CEM I content (kg/m3) x clinker content fraction (0.8 or 0.9)
% of CaO within the clinker (65%)
Amount of CO2 per mole of CaO (44/56)
C= % of CaO which carbonates (63% assumed by the Concrete Centre)

SD6050 Issue 1.0 BRE Global Environmental Profiles methodology 2008 92
Uncontrolled copy if printed. Valid on day of printing only. © BRE Global Ltd 2008
E = Factor to take account of carbonation of concrete in landfill at EOL
Therefore for
1 m2 of ready mix:
M = 0.00125 x 1 x (√100) x (290*0.8=232) x 0.65 x (44/56) x 0.63 x 2.02 = 1.88 kg CO2
1 m2 of precast:
M = 0.00233 x 1 x (√100) x (350*0.9=315) x 0.65 x (44/56) x 0.63 x 1.39 = 3.28 kg CO2
1 m2 of paving:
M = 0.001 x 1 x (√100) x (300*0.9=270) x 0.65 x (44/56) x 0.63 x 1.67 = 1.45. kg CO2
Table 4.3 of the Danish report provides carbonation factors for concretes using cement replacements. The following factors are given (by extrapolation) from the table.
30% PFA: 10% higher
50% GGBS: 25% higher
The factors above should therefore be applied to the high strength concretes using these materials.
A5.2.3. Recycled Concrete
Concrete which is recycled as either aggregate or hardcore will continue to carbonate.
The amount of carbonation within recycled and landfilled concrete is based on the typical particle size, the existing level of carbonation and the likely depth of further carbonation.
For concrete which is recycled as hardcore, the average particle size has been assumed to be 150 mm in diameter (data from The Concrete Centre). For buried infrastructure which is where we assume hardcore is used, the depth of carbonation is 0.75mm*(year)-0.5 which over 100 years means that 73% of the concrete will not be able to carbonate. However the existing level of carbonation of concrete post demolition needs to be considered, as concrete which has already carbonated cannot carbonate again. BRE Global has taken the amount of carbonation which has already taken place as 5% at demolition – this is based on the amount of carbonation within a typical m3 of RMC, paving or precast compared to the maximum possible.
The amount of carbonation for concrete recycled as hardcore is therefore reduced by 75% to account for the concrete within the 150mm diameter particles which will not carbonate, and by 5% to account for the concrete which has already carbonated. BRE Global has taken 200 kg/m3 as the typical amount of cement clinker per m3.
M = 25% x 95% x 200 x 0.65 x (44/56) x 0.63 = 15.3 kg CO2

SD6050 Issue 1.0 BRE Global Environmental Profiles methodology 2008 93
Uncontrolled copy if printed. Valid on day of printing only. © BRE Global Ltd 2008
NOTE: for non-concrete hardcore, and for hardcore sourced from low strength concretes or blocks, there will be no carbonation as the concretes will have fully carbonated during use.
For concrete that is recycled as graded aggregate, the particle sizes are much smaller. Data from a WRAP report54, were used to estimate the typical particulate sizes. All particles 14mm and smaller would be able to carbonate, with larger particles carbonating to varying degrees, giving a total ability to carbonate of 91% if the carbonation rate for buried infrastructure is used.
The amount of carbonation for concrete recycled as graded aggregate (not within concrete) is therefore reduced by 9% to account for the concrete within the different diameter particles which will not carbonate, and by 5% to account for the concrete which has already carbonated. BRE Global has taken 200 kg/m3 as the typical amount of cement clinker per m3.
M = 91% x 95% x 200 x 0.65 x (44/56) x 0.63 = 55.6 kg CO2
However, for concrete that is recycled as aggregate into concrete – recycled concrete aggregate (RCA), the rate of carbonation will relate to the type of concrete. For low strength concretes, the assumption is that the concrete will still fully carbonate. For high strength concretes, the consideration has been to add the uncarbonated cement within the RCA to the amount of cement within the concrete to calculate the additional carbonation. Taking 20% replacement of coarse aggregate, approximately 240 kg of RCA would be used per m3, which will increase the Cement content, and therefore the typical amount of carbonation by 10%. This factor will therefore be used for concretes containing 20% RCA.
54 C R Sowerby, TRL Limited, “Low-strength Concrete Ground Engineering Applications for Recycled and Secondary Aggregates”, WRAP, June 2004, Table 5.1

SD6050 Issue 1.0 BRE Global Environmental Profiles methodology 2008 94
Uncontrolled copy if printed. Valid on day of printing only. © BRE Global Ltd 2008
Appendix 6 Data collection questionnaire
This Appendix is for illustration purposes and the Scheme Document SD028 should be consulted for the latest Environmental Profiles Data Collection Form.
The Environmental Profiles questionnaire consists of three parts:
1. construction materials and the environment
2. transportation
3. company declaration
Please complete the document in its entirety including any assumptions that you are making and references to where you have obtained the data e.g. delivery notes, utility bills, purchase orders etc.
Once completed, please return this questionnaire including any supporting information to: Environmental Profiles Certification Scheme, BRE Global Ltd, Building 26, Bucknalls Lane, Garston, Watford, Herts, WD25 9XX, UK
Part 1: Construction Materials and the Environment
This part of the questionnaire is to be used for the collection of data from:
a) raw material processing (including transport to factory) or
b) secondary processing (including transport to factory) or
c) component manufacture (including transport to factory)
This data will be used to calculate figures of inputs and outputs associated with the production of one tonne of your products. This questionnaire requests the raw data that will allow these calculations to be made.
An electronic version of this document is available.
1. Plant Information
Company name/code number
.............................................................................................................
Company address
.............................................................................................................
Telephone.......................................................
Fax.................................................................
E-mail.................................................................
Name of respondent…………………………………………………

SD6050 Issue 1.0 BRE Global Environmental Profiles methodology 2008 95
Uncontrolled copy if printed. Valid on day of printing only. © BRE Global Ltd 2008
2. Process and products
Please provide a PROCESS TREE containing information about the main process and sub-processes involved, even if they are at a different site or outsourced. Information will be collected for the overall process but it is important to produce a detailed flow chart to aid the assessment of the data you provide and to ensure that the key processes have been included.
Please provide information about all the product(s) produced by this factory. (Please include BS or CEN numbers, end use, grade, thickness, density, weight, conductivity etc. in your description of the finished product). Certificates or product literature for each product would be very useful.
...........................................................................................................
3. Quality of data
Age
Please indicate below the starting and end months and the year(s) in which the data in this questionnaire were collected (this should be for a typical 12 month period)
Start month and year
..............................................................................................................................
End month and year
..............................................................................................................................
Please indicate in the questionnaire where the age of specific data differs from that stated above and give reasoning
Source of data
Please provide information about the sources and derivation of all figures. Where possible, include data ranges or other descriptions so that it is clear how any general figures were calculated. Please state clearly whether the figures quoted are based on measured or estimated values and the basis for both measurements and estimations.
...............................................................................................................................

SD6050 Issue 1.0 BRE Global Environmental Profiles methodology 2008 96
Uncontrolled copy if printed. Valid on day of printing only. © BRE Global Ltd 2008
4. Works output
For the production process or site for which you are providing data, please enter all the outputs i.e. main products and any co-products (including any material not sent to waste disposal) and the annual production of each. This information allows the burdens of production to be allocated to co-products using physical relationships.
Output description Production
(tonnes)
Relative values (£/tonne)1
Density or mass/m2 (e.g. for flooring)
1We ask about the relative value for each output (i.e. how much are you paid for each) as an alternative means of allocation, should this be necessary. You do not need to give this information now but in the future we may need to discuss how you can provide it on a confidential basis.
5. Works Input
5 a) Materials
We are interested in all the inputs to the plant that are associated with your product. Please include packaging materials and consumable items, as well as the ingredients of your product. Please list all input materials even if you know you cannot provide information about their manufacture before they reach you. Examples are:
Raw materials:
Minerals - limestone, clay, silica, sand, gravel
Metallic minerals - zinc, alumina, iron ore
Wood materials - solid timber, sawmill chips, other residues (with species and moisture content where possible).
Fossil fuels used as feedstock materials rather than for energy production - natural gas to make plastics, petroleum products to make roofing materials
Processed materials:
Cement, screws, resins, paints, acids etc.
scrap and materials recycled from other processes
consumable items - sanding paper, drilling bits, detergents, mould oils
(Note: Do not include repair and maintenance of machinery or vehicles)
Packaging Materials:
Steel Banding, Polythene shrink-wrapping, timber pallets etc.
Please include any materials or chemicals that may be used as substitutes or which reflect deviations from the normal content.

SD6050 Issue 1.0 BRE Global Environmental Profiles methodology 2008 97
Uncontrolled copy if printed. Valid on day of printing only. © BRE Global Ltd 2008
• If volumes are used, please specify the density
• If solutions are used, please specify concentration
• If allocations have been made, please state method of calculation
Item Quantity used per year
Units (e.g. dry or wet tonnes,
kg)
Is it recycled or does it have
recycled content?
Y/N
Allocation Method
5 b) Transport of materials to the factory
Please provide data for each of the input materials mentioned in 5a (including packaging materials) and any relevant fuels. Transport to the factory may be achieved by more than one mode of transport, e.g. ship then road. Please list each and detail the mileage of each mode separately. If you do not know the mileage, please state where the material is travelling from, including any ports it passes through. Please note that the transport of the material should be from its point of origin. Where more than one supplier is used you may estimate the tonnage from each and indicate this in the table. The data for each supplier can then be entered into the table.
Input Material
(specify)
Quantity delivered to
plant per year (t)
Transport type (lorry, ship etc).
Give GLW if known
Average Load (t)
If part load what % of
load
Number of deliveries per year
Average distance source to
plant (state km or miles)
Return Load?
(material, average
load, distance to
pickup point)
Please provide any further information about the material inputs
..............................................................................................................
5 c) Direct consumption of fuel
• Please enter the fuel used by your plant for one year.

SD6050 Issue 1.0 BRE Global Environmental Profiles methodology 2008 98
Uncontrolled copy if printed. Valid on day of printing only. © BRE Global Ltd 2008
• Include all fuels purchased for the site, including fuels used for heating and lighting in buildings and any fuels generated on site, e.g. wood waste. It will be useful to indicate what different fuels are used for. This helps to ensure all are included.
• Please only include vehicle fuels used for transport on site. Fuels used as feedstocks (e.g. Natural Gas for plastics) should be given as Inputs in Section 5a).
• Where the emissions from a fuel have been calculated or measured (e.g. emissions from a boiler flue), please put a “C” or “M” in the final column.
• For fuels other than electricity and Mains Natural Gas, please provide information about transport mode and distances in Table 5b).
Fuel Used What is the fuel used for? (e.g. kilns, fork lifts)
Total quantity used per year
Units of fuel used
(e.g. m3 or kWh)
Source of data
(e.g. meters, bills etc)
Emissions calculated “C” or
measured “M”
Grid Electricity1
Natural Gas
Fuel Oil
Diesel/Gas Oil
LPG
Coal
Kerosene
Gasoline
Landfill Gas
Biomass-Specify Type
Waste From Plant (Specify)
External Waste2 (Specify)
Other (Specify)
1 If electricity is not purchased from the national supply, please indicate its source and list under Other.
2 For example, wood residues, secondary liquid fuels (SLF).
Allocation Method
To allow more accurate energy calculations, please also complete the following:
• Please state the power of any boilers/furnaces used in kW or MW and information about the type of appliance e.g. condensing, modulating/non-modulating, low NOx.

SD6050 Issue 1.0 BRE Global Environmental Profiles methodology 2008 99
Uncontrolled copy if printed. Valid on day of printing only. © BRE Global Ltd 2008
Type/Description of boiler/furnace Power (in kW or MW)
• For electricity usage, please state the voltage of the supply:
Voltage of supply:
5 d) Water Used
Please provide data on the water used in the plant in the year. Where water is recycled within a local surface water or groundwater source, please supply further details. For surface water, please state source and discharge location, e.g. river, reservoir, rainwater from roof, etc. If volume of run-off is not known, please give site area.
Water Type Quantity taken into plant per year
(litres or m3 – please specify)
Quantity discharged per year
(litres or m3 – please specify)
Mains water
Surface water
Groundwater
Sewer
6. Works emissions / discharges
• Emissions from a plant may be from more than one product. If you can allocate emissions to specific products, by causal relationship, please attach a description of the method used. If you cannot do this, please give emissions for the whole plant.
• Please give the units in which your emissions are measured.
BRE Global will convert general fuel data to emissions using standard conversion figures.
• If you have calculated your own emissions, please provide details of the conversion figures used.
• Please also mark the final column in Table 5c) if you have provided calculated or measured emissions in the table below. Please enter these emissions and the fuel sources beside your data entry in Table 6 a) below.

SD6050 Issue 1.0 BRE Global Environmental Profiles methodology 2008 100
Uncontrolled copy if printed. Valid on day of printing only. © BRE Global Ltd 2008
6 a) Emissions to Air
Where possible, please provide in the following table specific data on Carbon Monoxide, Sulphur Dioxide, Nitrogen Oxides and Particulates or PM10s.
Emission to outside air
Measured quantity per year
(include range)
Units measured Sampling procedure
(include baseline)
Emission calculated from fuel(s)
For the following categories, please list individual compounds wherever possible (with percentage composition for each component): Volatile Organic Compounds, Halogens, Hydrocarbons e.g. Methane, Metals e.g. Lead
6 b) Discharge to Water
Discharges to water Measured value
(average and range)
Units
(concentration or mass)
Sampling procedure
BOD1 to sewer
BOD to surface water
COD2 to sewer
COD to surface water
Total organic carbon
To sewer
Total organic carbon to surface water
pH to sewer
pH to surface water
Suspended solids
to sewer
Suspended solids to surface water
Other to sewer
Other to surface water
1 BOD: Biological Oxygen demand
2 COD: Chemical Oxygen Demand

SD6050 Issue 1.0 BRE Global Environmental Profiles methodology 2008 101
Uncontrolled copy if printed. Valid on day of printing only. © BRE Global Ltd 2008
6 c) Solid Waste
• Please provide a list of the main materials in the description of the wastes produced.
• Please provide the European Waste Catalogue (EWC) code for the wastes produced.
• Please also include all wastes which are reused/recycled externally (i.e. off-site), indicating the price that they are sold for or if they are given away. Wastes which are reused/recycled internally do not need to be included.
Waste produced
Description of waste
EWC Code
Quantity per year
(tonnes)
Destination type e.g. reuse,
recycling, landfill, incineration
Actual destination, e.g. town, country
If reused or recycled please state the
price the material is sold for or if it is
given away
Controlled:
Commercial
Controlled:
Industrial
Controlled:
Hazardous
Any further information on the emissions and discharges
..............................................................................................................
Part 2: Transport data collection “Beyond the factory gate”
Background
This section is looking at the transport of your product from the factory gate. This data will be used to estimate the typical transport impacts associated with the transport of different construction materials from factory to site. This questionnaire requests the raw data that will allow these calculations to be made.
BRE Global has analysed data provided by DETR from their “Continuing Survey of Road Transport” and proposes to use the data on mean transport distance (loaded and empty journey), load and fuel consumption of vehicle for different commodity types provided by this analysis as the basis for this study. Data on vehicle type, loading and distance travelled is therefore only requested where it is easily available. It is not intended that this survey should take hours to complete. BRE Global will compare any actual transport data provided with the data analysis of the DETR statistics.

SD6050 Issue 1.0 BRE Global Environmental Profiles methodology 2008 102
Uncontrolled copy if printed. Valid on day of printing only. © BRE Global Ltd 2008
1. Source
Please give information about the source of the data for this questionnaire, e.g. factory details, trade organisation etc.
Company/Organisation: …………………………………………………………………………………
Address:
…………………………………………………………………………………
Telephone and fax:
…………………………………………………………………………………
Contact:
…………………………………………………………………………………
2. Products
Please give details of the product(s) covered by this questionnaire. If it is more convenient, please complete a separate questionnaire for each product.
Product 1…………………………………………………………………………………
Product 2…………………………………………………………………………………
3. Quality of data
Please indicate below the start and end months and the year(s) in which the data in this questionnaire was collected.
Start month and year…………………………………………………………………………………
End month and year…………………………………………………………………………………
4. Transport process diagram
Below is a process diagram for an imaginary Product X showing some of the possible transport scenarios expected to arise relating to the transport of construction materials to site.

SD6050 Issue 1.0 BRE Global Environmental Profiles methodology 2008 103
Uncontrolled copy if printed. Valid on day of printing only. © BRE Global Ltd 2008
In the following box, please insert a Transport Process Diagram similar to that shown above to illustrate the transport routes for Products where you are able to provide data. Hand drawn diagrams are expected. If several products are covered, you may find it easier to draw separate diagrams for each product using the further boxes provided. When creating the diagram, please consider the points listed below in Section 5.
PRODUCT: ……………………………
5. Transport
Product: Please give details of the product or products which take these routes.
Routes: Please show the various routes used to transport the product from factory to site: e.g. direct to site; factory to distribution centre to site; factory to builders merchant to site; direct to site (builders merchant controlled) etc. If part of the factory production is exported, this should be shown with just one arrow pointing to EXPORT and showing the amount exported.
Proportion following route: Please give the amount of the product(s) following each stage of the route, e.g. 25%, ½ or 10,000 tonnes (total output must also be given if amounts are used). If using percentages or proportions, please ensure that these always relate to the total production of the product.
Mode of Transport: Building materials are commonly transported by road, rail and water. Please indicate the mode of transport for each stage of the journey from factory to site.

SD6050 Issue 1.0 BRE Global Environmental Profiles methodology 2008 104
Uncontrolled copy if printed. Valid on day of printing only. © BRE Global Ltd 2008
If details can be easily obtained, please list average load, distance and type of vehicle.
PRODUCT: ……………………………
Part 3: Company declaration
Questionnaire Declaration
I hereby confirm on behalf of …………………..…………………………………..(the company), that the information provided in this questionnaire is correct and represents all of the inputs to the product(s), and any changes in circumstances will be notified to BRE Global in writing.
We understand that this information will form the basis of the data to be used for the certification project and will be reviewed at the verification visit along with any assumptions made and using the references provided on this form to verify the data.
Name: Position: Signature: Date:

SD6050 Issue 1.0 BRE Global Environmental Profiles methodology 2008 105
Uncontrolled copy if printed. Valid on day of printing only. © BRE Global Ltd 2008
Amendments issued since publication
DOCUMENT NO. AMENDMENT DETAILS SIGNATURE DATE

Uncontrolled copy if printed. Valid on day of printing only. © BRE Global Ltd 2008