
Methodology for calculating emissions from ships. 1 ... · SMED (Swedish Methodology for...
47
Report series SMED and SMED&SLU Nr 4 2004 Swedish Methodology for Environmental Data Methodology for calculating emissions from ships: 1. Update of emission factors David Cooper, IVL Tomas Gustafsson, SCB 2004-02-02 Assignment for Swedish Environmental Protection Agency
Transcript of Methodology for calculating emissions from ships. 1 ... · SMED (Swedish Methodology for...
Report series SMED and SMED&SLU Nr 4 2004
Swedish Methodology for Environmental Data
Methodology for calculating emissionsfrom ships: 1. Update of emission
factors
David Cooper, IVL
Tomas Gustafsson, SCB
2004-02-02
Assignment for Swedish Environmental Protection Agency
Report title: Methodology for calculating emissions from ships. 1. Update of emission factorsAuthors: David Cooper IVL, Tomas Gustafsson, SCBYear of publication: 2004Publication at: www.smed.seTitle: Report series for SMED and SMED&SLUPublisher: SMHI Swedish Meteorological and Hydrological InstituteAddress: Folkborgsvägen 1, 601 76 Norrköping, SwedenStart Year: 2004ISSN: 1652-4179
SMED är en förkortning för Svenska MiljöEmissionsData, och är ett samarbete mellan IVL Svenska Miljöinstitutet, SCB
och SMHI. Samarbetet inom SMED inleddes under 2001 med syftet att långsiktigt samla och utveckla kompetensen inom
emissionsstatistik kopplat till åtgärdsarbete inom olika områden, bland annat som ett svar på Naturvårdsverkets behov
av upprätta ett svenskt datavärdskap för utsläpp till luft. Målsättningen med SMED-samarbetet är att utveckla och driva
nationella emissionsdatabaser och att tillhandahålla olika tjänster relaterade till dessa. Kundbasen är tänkt att omfatta
både nationella, regionala och lokala myndigheter samt luft- och vattenvårdsförbund och näringsliv. Dessa kan genom
samarbetet inom SMED erbjudas en attraktiv återföring av resultat inom ett större område än tidigare. Konsulttjänster
kommer att utvecklas både för nationella och internationella uppdrag.
SMED is an abbreviation for Swedish Methodology for Environmental Data which is based on a collaboration between
IVL Swedish Environmental Research Institute, SCB Statistics Sweden and SMHI Swedish Meteorological and
Hydrological Institute. The work co-operation within SMED commenced during 2001 with the long-term aim of
acquiring and developing expertise within emission statistics. SMED fulfils the Swedish Environmental Protection
Agency’s requirements for a Swedish air emission data centre. In particular, the work focuses on following the
introduction of abatement measures for different sectors. A central objective of the SMED collaboration is thus to
develop and maintain national emission databases and offer related services. Potential clients include national, regional
and local governmental authorities, air and water quality associations, and industrial representatives. In work-
coperation with SMED, an implementation of results in a wider perspective is achieved. Consultant services will be
developed for both national and international assigments.

3
Acknowledgement
In compiling this report, a great amount of underlying measurement work has beenundertaken on board several ships. Assistance and enthusiasm from shipowners and theships’ crews has been invaluable in this respect. The 100% response from the “Low-NOx” shipowners regarding the questionnaire in this study is in particularcommendable. In addition, the author would like to thank many experts working in themarine emission field for constructive and useful discussions.
4
Summary
SMED (Swedish Methodology for Environmental Data, a collaboration between theSwedish Environmental Research Institute, Statistics Sweden and the SwedishMeteorological and Hydrological Institute) has derived emission factors for ships (> 100Gross Register Tonnage) to be applied in Sweden’s international reporting duties. Thebasis for this type of reporting is that only emissions derived from Swedish sold marinefuels are accounted for.
The study has focused on 28 different air pollutants, where the emission factors havebeen proposed as a function of engine and fuel type. For year 2002, the factors coverthree operational modes (“at sea”, “manoeuvring” and “in port”) and thereby take intoaccount main engine and auxiliary engine emissions. A set of “at sea “ emission factorshas also been prepared from 1990 up to 2001 to allow an update of the marine emissiontime series.
In order to obtain representative and up-to-date emission factors for this application,“in-house” emission data and also published literature emission factor databases havebeen assessed. Thus emission factors were derived from a database consisting ofexhaust measurements from ca. 62 ships involving ca.180 marine engines. The emissionfactors have been weighted to account for the proportion of the fleet using exhaust gascleaning measures, age factors for fuel consumption and increased use of low-sulphurfuels.
Since the number of measurement data available for the different pollutant emissionfactors varies considerably, an attempt has been made to classify the factors afterestimated uncertainty.
5
Swedish Summary
SMED (Svenska Miljö Emissions Data, ett konsortium bestående av IVL SvenskaMiljöinstitutet, Statistiska Centralbyrån och Sveriges Meteorologiska och HydrologiskaInstitut) har tagit fram emissionsfaktorer för fartyg (> 100 Brutto tonnage) som gällerför Sveriges internationella rapporteringsändamål. Grunden för denna typ avrapportering är att endast emissioner från i Sverige sålda marina bränslen ingår.
Studien har fokuserat på 28 olika luftföroreningar där emissionfaktorerna har angivits isamband med motor- och bränsletyp. För år 2002 har emissionsfaktorer för tre olikadriftssätt presenterats (”till sjöss”, ”manövrering” och ”i hamn”) och därmed harutsläppen från både huvud- och hjälpmotorer ingått. Emissionsfaktorer “till sjöss” haräven beräknats från år 1990 till 2001 så att tidserien för marina emissioner kanuppdateras.
För att erhålla representativa och uppdaterade emissionsfaktorer har data från egnamätserier och literaturstudier utvärderats. På så sätt bygger de framtagnaemissionsfaktorerna på mätningar från 62 olika fartyg och ca. 180 motorer. Faktorernahar viktats för att ta hänsyn till andelen av fartygen som använder någon form avavgasreningsteknik, åldringsfaktorer för bränsleförbrukning samt en ökad användningav lågsvavelbränslen.
Eftersom antalet bakomliggande mätdata för de olika emissionsfaktorerna varierarkraftigt har resultaten presenterats med ett mått på mätosäkerheten.
6
Contents
ACKNOWLEDGEMENT .........................................................................................................................3
SUMMARY.................................................................................................................................................4
SWEDISH SUMMARY .............................................................................................................................5
CONTENTS................................................................................................................................................6
1 INTRODUCTION.............................................................................................................................8
1.1 AIM OF PROJECT..............................................................................................................................81.2 INTERNATIONAL EMISSION REPORTING REQUIREMENTS..................................................................91.3 OTHER SWEDISH MARINE EMISSION REPORTING ...........................................................................12
2 FACTORS INFLUENCING EMISSIONS FROM SHIPS .........................................................13
2.1 ENGINE TYPE ................................................................................................................................132.2 FUEL TYPE ....................................................................................................................................142.3 SHIP OPERATIONAL MODE .............................................................................................................142.4 ENGINE AGE AND USE OF EMISSION REDUCTION TECHNOLOGIES...................................................14
3 METHODOLOGY FOR EVALUATING EMISSION FACTORS ...........................................16
3.1 GENERAL OVERVIEW ....................................................................................................................163.2 SCOPE ...........................................................................................................................................173.3 DATABASE ....................................................................................................................................183.4 REDUCTION PROFILES FOR ENGINE/FUEL CATEGORIES ..................................................................183.5 EVALUATION AND FORM OF EMISSION FACTORS IN RESULT TABLES .............................................203.6 COMMENTS ON DERIVATION OF SPECIFIC EMISSION FACTORS .......................................................20
3.6.1 NOx emissions.....................................................................................................................203.6.2 CO2 and heavy metal emissions..........................................................................................213.6.3 SO2 emissions .....................................................................................................................223.6.4 PAH, PCB, HCB and dioxin emissions...............................................................................243.6.5 N2O and CH4 emissions ......................................................................................................253.6.6 TSP, PM10 and PM2.5 emissions .........................................................................................263.6.7 NH3 emissions.....................................................................................................................26
3.7 EMISSIONS FROM IN PORT AND MANOEUVRING OPERATIONS ........................................................26
4 EMISSION FACTORS FOR SHIPS.............................................................................................29
5 DISCUSSION ..................................................................................................................................30
5.1 AVAILABLE ACTIVITY DATA .........................................................................................................305.2 "USABLE" EMISSION FACTORS ......................................................................................................315.3 CONCLUSION.................................................................................................................................32
6 REFERENCES................................................................................................................................34
APPENDICES ..........................................................................................................................................36

7
8
1 Introduction
Reporting of air emissions from Swedish sea traffic is currently based on combiningactivity data (from marine fuel delivery statistics) with pollutant specific, emissionfactors (from guidebooks provided by EMEP (EMEP, 2002) and IPCC (IPCC, 1997)).This methodology and the results generated however, have raised several questionsconcerning the following:
• The emission factors used for ships in the guidebooks are mostly based on arelatively old and limited data set from the early 1990s (Lloyds RegisterEngineering Services, 1995). Furthermore some emission factors are lacking andthey do not reflect Swedish developments regarding the introduction of NOx
emission reduction technologies, low sulphur fuel usage etc.
• For the Swedish privately-owned boat sector (so-called leisure craft), an evengreater uncertainty exists in calculating these emissions; i.e. both in the activity dataused and the lack of emission factor data.
• Since the emissions are generated from data on Swedish marine fuel sales only(according to international reporting requirements), fluctuations in fuel pricesabroad will effect the reported emissions. In addition, many ships using fuelpurchased abroad give rise to significant emissions around the Swedish coastlinewhich will not be accounted for using the international reporting rules. Thus there isa need for a “more accurate and morally correct” methodology to determine actual“Swedish emissions” (see section 1.3).
In view of the above, (Swedish Methodology for Environmental Data (SMED) hasinitiated a multi-phase project with the aim to address these key issues and therebyimprove the quality of Swedish marine emission reporting.
1.1 Aim of project
As part of the overall objective of improving Swedish marine emission reporting, thisreport focuses on the first of the topics above. Specifically, the aim of this work was toprovide an updated and representative set of emission factors (in g/kWh, kg/ton fuel andkg/TJ supplied fuel) for ships (> 100 gross tonnage) to be used for present Swedish,international emission reporting duties. Applying these new emission factors for 2002only will however create difficulties when comparing total marine emissions fromprevious years (where old emission factor methodology was used). Therefore, anadditional aim was to modify the new set of 2002 emission factors so that they can beapplied to previous years’ activity data (i.e. from 1990 to 2001). A recalculation canthereby be made for each year and a relevant time series for Swedish marine emissionsobtained.
9
1.2 International emission reporting requirements
On a yearly basis Sweden is obligated to report national air emissions of severalpollutants to several international bodies:
• Directive 2001/81/EC on national emission ceilings for certain atmosphericpollutants which follows CORINAIR / EMEP guidelines.
• CLRTAP (United Nation’s Convention on Long-Range Transboundary AirPollution). which follows CORINAIR / EMEP guidelines.
• European Union’s Mechanism for Monitoring Community greenhouse gasemissions and for implementing the Kyoto Protocol. Reporting follows revised 1996IPCC (Intergovernmental Panel on Climate Change) Guidelines for NationalGreenhouse gas Inventories (IPCC Guidelines), IPCC Good Practice Guidance andUncertainty Management in National Greenhouse gas inventories (IPCC GoodPractice Guidance), and UNFCCC Reporting Guidelines on annual inventories(FCCC/CP/2002/8).
• UNFCCC (United Nations Framework Convention on Climate Change): EUsclimate gas directive ”Monitoring Mechanism”, which follows IPCC(Intergovernmental Panel on Climate Change) guidelines. Reporting follows revised1996 IPCC (Intergovernmental Panel on Climate Change) Guidelines for NationalGreenhouse gas Inventories (IPCC Guidelines), IPCC Good Practice Guidance andUncertainty Management in National Greenhouse gas inventories (IPCC GoodPractice Guidance), and UNFCCC Reporting Guidelines on annual inventories(FCCC/CP/2002/8).
Although some harmonisation exists between these bodies, different rules prescribepollutants, quality requirements, reporting intervals, source categories, and geographicaldistribution. In general, common guidelines exist on choice of emission factors andcalculation methodology (e.g. in EMEP, 2002; IPCC, 1997) but each nation is free toadopt a calculation methodology which is best suited to local conditions.
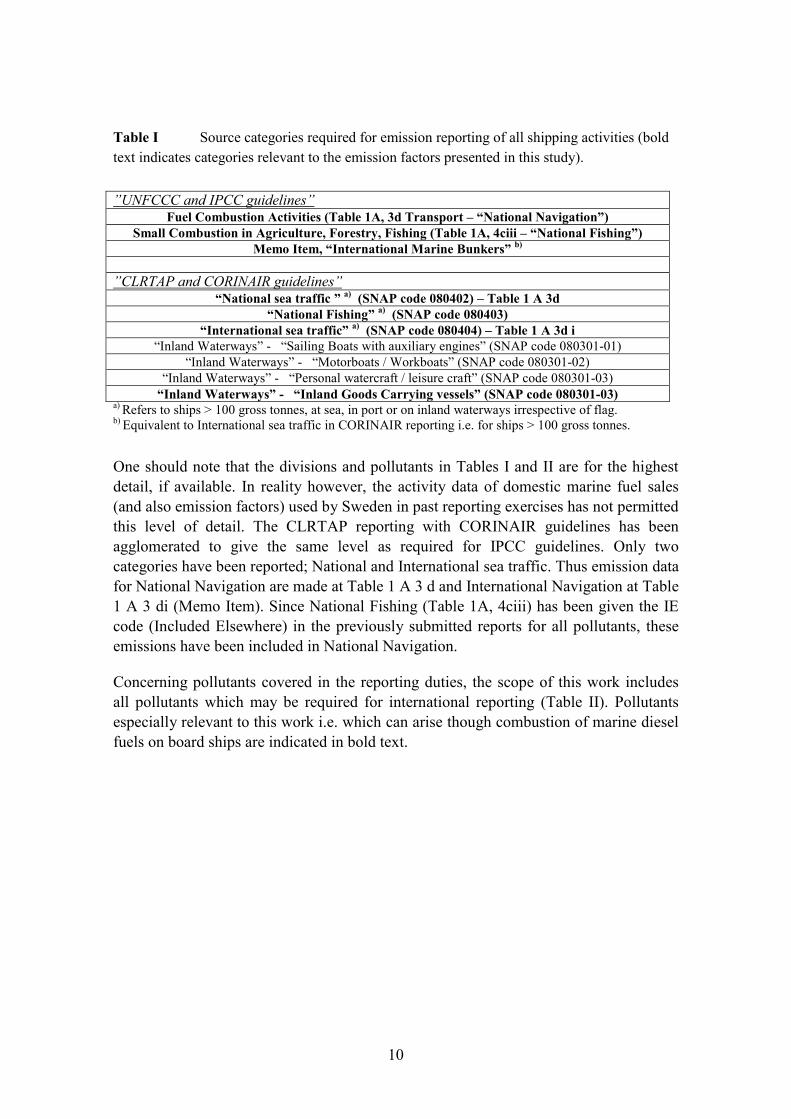
Regarding source categories covering marine navigational activities, Table Isummarises the general divisions of the categories required and those where theemission factors presented in this study are applicable (bold text). The specificpollutants of concern for reporting are presented in Table II. In the past, definitionsbetween national and international assignments have been a source of confusion.Improved definition criteria have however been added to the latest version (October2003) of the web-based EMEP guidebook (EMEP, 2002) which offers someclarification.
10
Table I Source categories required for emission reporting of all shipping activities (boldtext indicates categories relevant to the emission factors presented in this study).
”UNFCCC and IPCC guidelines”Fuel Combustion Activities (Table 1A, 3d Transport – “National Navigation”)
Small Combustion in Agriculture, Forestry, Fishing (Table 1A, 4ciii – “National Fishing”)Memo Item, “International Marine Bunkers” b)
”CLRTAP and CORINAIR guidelines”“National sea traffic ” a) (SNAP code 080402) – Table 1 A 3d
“National Fishing” a) (SNAP code 080403)“International sea traffic” a) (SNAP code 080404) – Table 1 A 3d i
“Inland Waterways” - “Sailing Boats with auxiliary engines” (SNAP code 080301-01)“Inland Waterways” - “Motorboats / Workboats” (SNAP code 080301-02)
“Inland Waterways” - “Personal watercraft / leisure craft” (SNAP code 080301-03)“Inland Waterways” - “Inland Goods Carrying vessels” (SNAP code 080301-03)
a) Refers to ships > 100 gross tonnes, at sea, in port or on inland waterways irrespective of flag.b) Equivalent to International sea traffic in CORINAIR reporting i.e. for ships > 100 gross tonnes.
One should note that the divisions and pollutants in Tables I and II are for the highestdetail, if available. In reality however, the activity data of domestic marine fuel sales(and also emission factors) used by Sweden in past reporting exercises has not permittedthis level of detail. The CLRTAP reporting with CORINAIR guidelines has beenagglomerated to give the same level as required for IPCC guidelines. Only twocategories have been reported; National and International sea traffic. Thus emission datafor National Navigation are made at Table 1 A 3 d and International Navigation at Table1 A 3 di (Memo Item). Since National Fishing (Table 1A, 4ciii) has been given the IEcode (Included Elsewhere) in the previously submitted reports for all pollutants, theseemissions have been included in National Navigation.
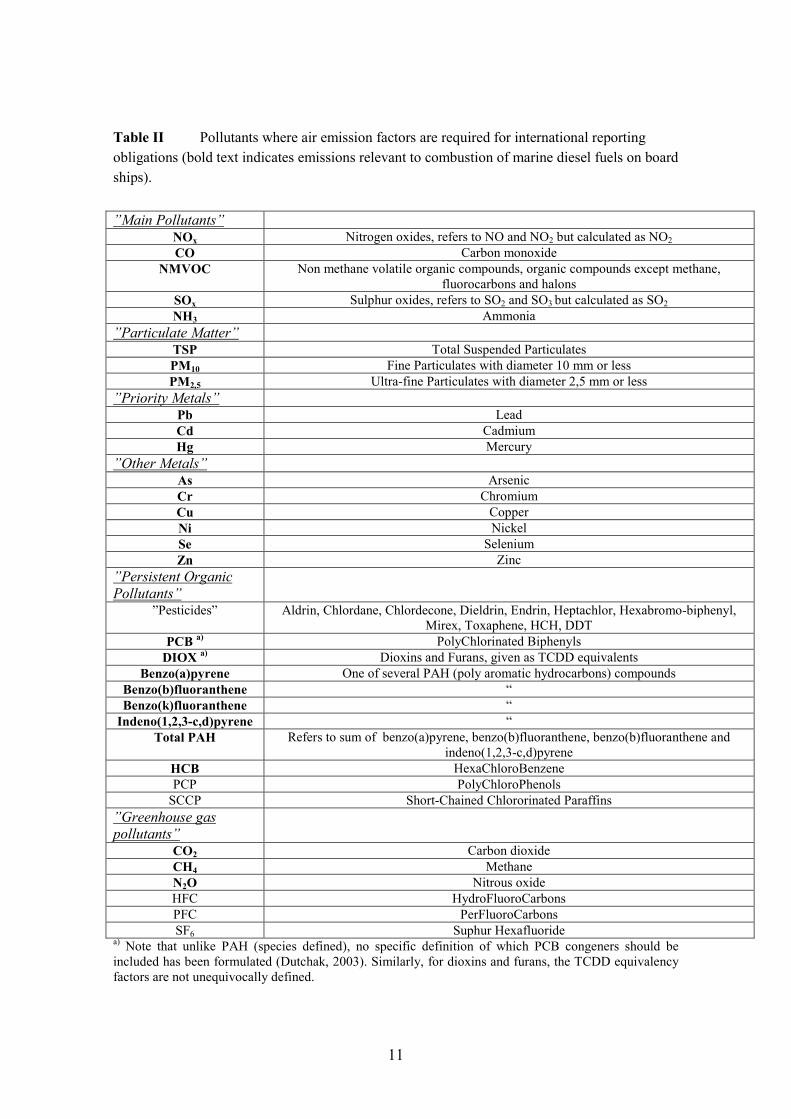
Concerning pollutants covered in the reporting duties, the scope of this work includesall pollutants which may be required for international reporting (Table II). Pollutantsespecially relevant to this work i.e. which can arise though combustion of marine dieselfuels on board ships are indicated in bold text.
11
Table II Pollutants where air emission factors are required for international reportingobligations (bold text indicates emissions relevant to combustion of marine diesel fuels on boardships).
”Main Pollutants”NOx Nitrogen oxides, refers to NO and NO2 but calculated as NO2
CO Carbon monoxideNMVOC Non methane volatile organic compounds, organic compounds except methane,
fluorocarbons and halonsSOx Sulphur oxides, refers to SO2 and SO3 but calculated as SO2
NH3 Ammonia”Particulate Matter”
TSP Total Suspended ParticulatesPM10 Fine Particulates with diameter 10 mm or lessPM2,5 Ultra-fine Particulates with diameter 2,5 mm or less
”Priority Metals”Pb LeadCd CadmiumHg Mercury
”Other Metals”As ArsenicCr ChromiumCu CopperNi NickelSe SeleniumZn Zinc
”Persistent OrganicPollutants”
”Pesticides” Aldrin, Chlordane, Chlordecone, Dieldrin, Endrin, Heptachlor, Hexabromo-biphenyl,Mirex, Toxaphene, HCH, DDT
PCB a) PolyChlorinated BiphenylsDIOX a) Dioxins and Furans, given as TCDD equivalents
Benzo(a)pyrene One of several PAH (poly aromatic hydrocarbons) compoundsBenzo(b)fluoranthene “Benzo(k)fluoranthene “
Indeno(1,2,3-c,d)pyrene “Total PAH Refers to sum of benzo(a)pyrene, benzo(b)fluoranthene, benzo(b)fluoranthene and
indeno(1,2,3-c,d)pyreneHCB HexaChloroBenzenePCP PolyChloroPhenols
SCCP Short-Chained Chlororinated Paraffins”Greenhouse gaspollutants”
CO2 Carbon dioxideCH4 MethaneN2O Nitrous oxideHFC HydroFluoroCarbonsPFC PerFluoroCarbonsSF6 Suphur Hexafluoride
a) Note that unlike PAH (species defined), no specific definition of which PCB congeners should beincluded has been formulated (Dutchak, 2003). Similarly, for dioxins and furans, the TCDD equivalencyfactors are not unequivocally defined.
12
1.3 Other Swedish marine emission reporting
In addition to the international reporting duties outlined in section 1.2, “Swedish”marine emissions are periodically calculated as part of a contract for the SwedishMaritime Administration (Sjöbris et al., 2001; Mariterm 2003a, Mariterm 2003b). It isimportant to note that for this purpose both the boundaries and calculation methodologydiffer from those for the international reporting obligations. The main differences arethat the emission boundaries are more “morally” representative of the Swedishemissions and the calculation methodology is based on the so-called “bottom-upapproach” using a ship movement database. Specifically, fuel consumption data fromfuel sales delivery data are not used in these calculations and instead the fuelconsumption for an individual ship movement is calculated as an intricate function ofengine type, ship type, route etc.1 In addition, the emission factors used in thecalculations (European Commission, 1999) are slightly more refined than those whichhave been previously used in the international reporting. A disadvantage with the“bottom-up approach” is that although well intended regarding improved accuracy andcompleteness, a substantial effort is necessary to fully complete such a model andthereafter maintain it.
Bearing in mind the obvious drawbacks with the regulations and boundaries governingthe international reporting requirements however, other more “realistic” national marineemission inventories are indeed warranted. As a compliment to these efforts, it is hopedthat the emission factors derived in this report will be of use.
1 Recently, a bottom-up approach was carried out on global marine emissions and compared withprevious top-down estimates from fuel sales. For fuel consumption (and NOx emissions) the bottom-upcalculation gave values twice those estimated by top-down estimates (Corbett and Koehler, 2003). Thisclearly highlights the potential uncertainty which can arise between the different calculationmethodologies.
13
2 Factors influencing emissions from ships
A brief review of factors which affect pollutant emissions from ships are presentedbelow2. A more in depth overview is presented elsewhere (European Commission;2002a).
2.1 Engine type
Apart from a very few exceptions where power cables from land sources are connectedand used on board vessels in port, ships are self sufficient regarding energy supply.Generally, ship propulsion is provided by main engines while on board electricity isgenerated from auxiliary engines. In terms of number and emission magnitude, main(ME) and auxiliary (AE) diesel engines dominate by far, followed by turbine machinery(steam (ST) and gas turbines (GT)). Emissions from boilers, emergency diesel enginesand waste incinerators are relatively very small and can be considered negligible(excluded hereafter). Rather than size, ME and AE diesel engines are normally sub-divided according to their engine speed at the crankshaft as: high speed (HSD), mediumspeed (MSD) and slow speed (SSD)3. Slow and medium speed engines are far moreabundant than high speed engines for main engines. For AEs, high and medium speedengines dominate. Old steam turbine systems, which use steam to drive turbines gearedto the propeller shaft, have a relatively low efficiency and consequently are beingreplaced by diesel engines.
Since engine type will affect the prevailing combustion conditions (temperature, fuelmix, pressure, residence time), the level of emissions of some pollutants (e.g. NOx,NMVOC and CO etc.) will also be influenced.
2 Besides the factors mentioned here, meteorological factors will also have an influence on emissions.For NOx, these are accounted for by directly correcting the emissions factors (in g/kWh) according toIMO Technical NOx Code, 1997. Thus all the factors presented in the results refer to the IMO correctedemissions (in g/kWhcorr). In general, weather conditions will also affect the fuel consumption required fora ship to tavel a given distance. This is accounted for when combining the activity data with the emissionfactors.
3 Refers to engine speed at the crankshaft in terms of number of revolutions per minute (rpm). For thepurposes of this study, slow speed has been assigned to engines with speeds between 60 - 300 rpm,medium speed as 300 - 1000 rpm and high speed as 1000 - 3000 rpm. In some cases, high and mediumspeed diesel engines are combined collectively and termed simply medium speed diesel engines.
14
2.2 Fuel type
Ships consume a variety of fuels classed primarily by their viscosity, ranging from“marine distillates (MD)” through to heavier “residual oils (RO)”. Within the distillateclassification, a further division is normally made between marine gas oils and marinediesel oils. Marine gas oil is a light and clean distillate oil containing no residual fueloil. Marine diesel oil is a heavier distillate and may contain some residual fuel oil.Marine distillate fuels are largely used by fishing vessels that have less space forequipment targeted to treat high viscosity fuels (RO) which require preheating. For thepurposes of this study, RO fuels are classed as fuels with viscosity (measured at 50 oC)between 55 - 810 cst, and MD fuels between 1 - 50 cst.
Some pollutant emissions are predetermined solely by their fuel content irrespective ofthe engine combustion conditions. Examples are CO2, SO2 and metal emissions.
2.3 Ship operational mode
Some emission factors are dependent on how an engine is run, for example idling andrapid load changes give rise to more pollutants associated with incomplete combustion(CO, NMVOC, PM). Thus indirectly, the type of ship operation will affect the demandson the engine and thereby emissions. In general, one can identify three ship operationalmodes; at sea (where the ME are at ca. 80% of maximum load and AE emissions arerelatively insignificant), manoeuvring (where ME emissions also dominate but at lowerand varying loads), in port (where MEs are off and the emissions arise from AEs at ca.50% of maximum load).
2.4 Engine age and use of emission reduction technologies
Some changes in emissions occur from a given engine with age but these are oftendifficult to quantify and are dependent on individual shipboard service and maintenanceroutines. For a larger fleet where older ships are continually being replaced however,the introduction of new engines with improved fuel consumption and following newemission legislation e.g. IMO Technical NOx Code, 1997, will have an impact on theemissions. Similarly implementation of emission reduction technologies (e.g. SelectiveCatalytic Reduction, SCR, for reducing NOx) will have a dramatic influence on theemissions. In this regard, the introduction and use of different fuels, for example, thosecontaining lower sulphur contents, can also be seen as an emission reductiontechnology.
15
For the purposes of this study, the possible emission reduction categories taken intoaccount and the magnitude of influence on the emission factors has been based largelyon in-house experience and consultation with engine manufacturers. Note also that thesetechnologies will affect only certain emission factors and they will be more evidentwhen considering how the emission factors have changed over the time period 1990 –2002. The following briefly summarises the central assumptions used. Further detailsare presented in section 3.6.
• Engines older than 10 years (engines manufactured before 1993) have been assignedspecific fuel consumption values as being 7% greater (sfcold) than for newerengines (Hellén, 2003; Nielsen, 2003).
• All engines equipped with SCR for NOx control (SCR) are assumed to achieve 91%reduction and gain an additional NH3 emission factor (0,10 g/kWh). 45% of theSCR engines are assumed to have oxidation catalysts which provide a 70% and 80%reduction in CO and NMVOC emissions respectively. Engines using so-called low-NOx techniques (e.g. slide valves and retarded injection) (lowNOx) are assumed toreach a 20% reduction, while Humid Air Motors (HAM) are assumed to reduce NOx
by 70%. Finally direct water injection systems (DWI) are expected to give NOx
reductions of 50%. New engines built from year 2000 onwards should conform tothe IMO Technical NOx Code (NOxCode) and therefore be tuned for lower NOx
emissions which correspond to a 6% decrease compared to the older engines4. It isassumed that new engines replace 4% of the older ones each year and 50% of thenew engines will have one of the NOx reduction technologies mentioned above.Note that for some of these NOx emission reduction technologies, marginal changesin CO, PM and fuel consumption are conceivable but these have largely been judgedas negligible in assigning the emission factors. An exception however, is for CO andNMVOC emissions from SCR engines (see above)
• Fuel usage, in terms of increased MD fuel is accounted for directly in the underlyingactivity data (fuel sales of each fuel type). The sulphur contents, (and therebyemission factor) can however differ within each fuel type for different years. For2002, these have been assigned as 1,3 wt-% for RO fuel and 0,2 wt-% for MD fuel.
4 It is assumed that old steam turbine driven ships will not be replaced by steam turbine machinery.
16
3 Methodology for evaluating emission factors
3.1 General overview
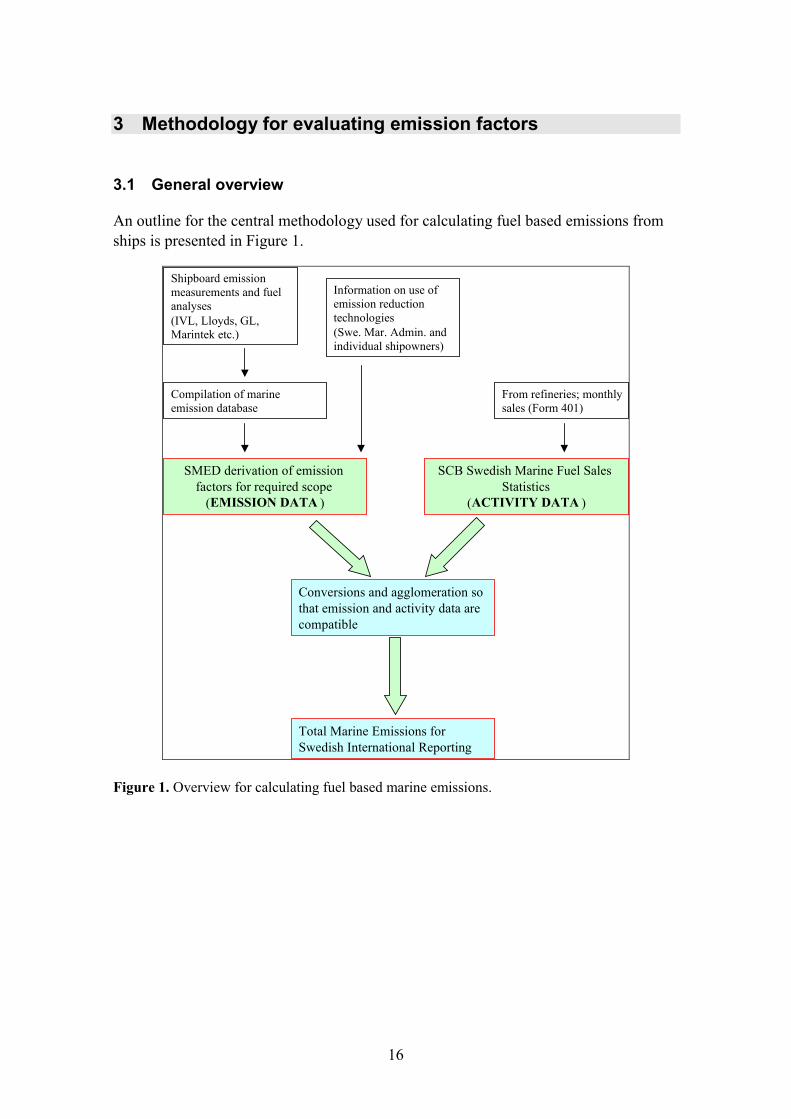
An outline for the central methodology used for calculating fuel based emissions fromships is presented in Figure 1.
From refineries; monthlysales (Form 401)
Conversions and agglomeration sothat emission and activity data arecompatible
Total Marine Emissions forSwedish International Reporting
SCB Swedish Marine Fuel SalesStatistics
(ACTIVITY DATA )
SMED derivation of emissionfactors for required scope
(EMISSION DATA )
Shipboard emissionmeasurements and fuelanalyses(IVL, Lloyds, GL,Marintek etc.)
Compilation of marineemission database
Information on use ofemission reductiontechnologies(Swe. Mar. Admin. andindividual shipowners)
Figure 1. Overview for calculating fuel based marine emissions.
17
3.2 Scope
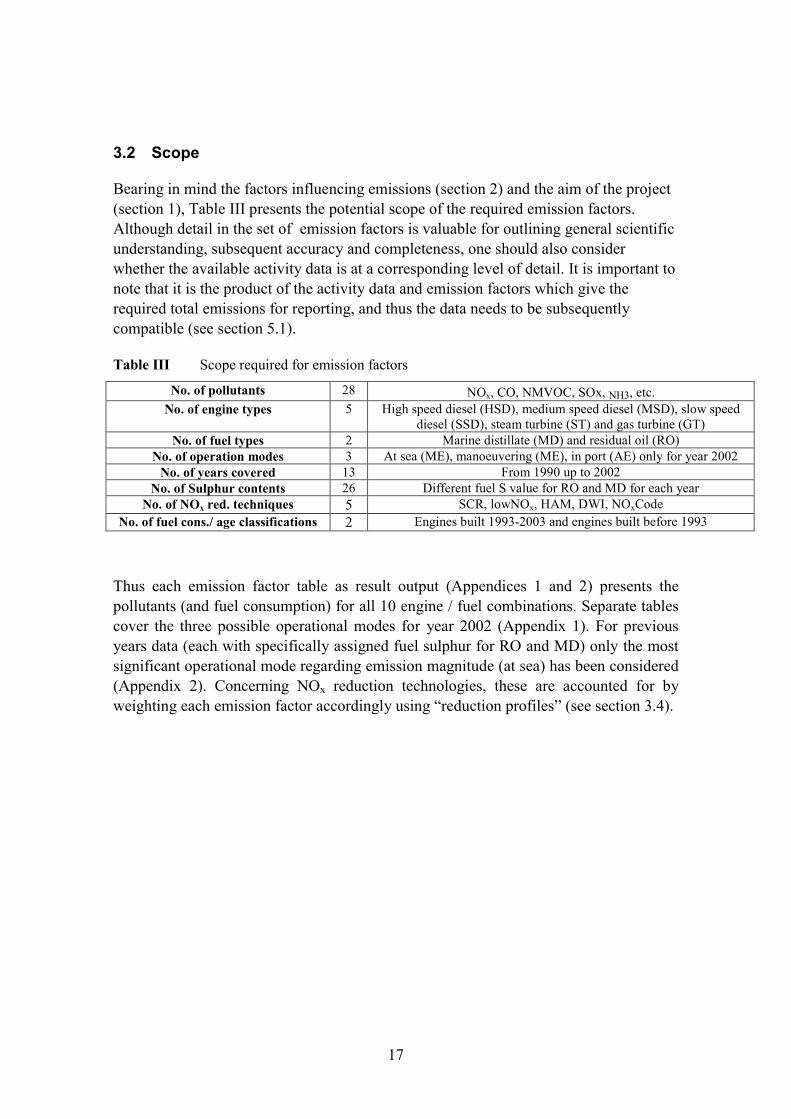
Bearing in mind the factors influencing emissions (section 2) and the aim of the project(section 1), Table III presents the potential scope of the required emission factors.Although detail in the set of emission factors is valuable for outlining general scientificunderstanding, subsequent accuracy and completeness, one should also considerwhether the available activity data is at a corresponding level of detail. It is important tonote that it is the product of the activity data and emission factors which give therequired total emissions for reporting, and thus the data needs to be subsequentlycompatible (see section 5.1).
Table III Scope required for emission factors
No. of pollutants 28 NOx, CO, NMVOC, SOx, NH3, etc.No. of engine types 5 High speed diesel (HSD), medium speed diesel (MSD), slow speed
diesel (SSD), steam turbine (ST) and gas turbine (GT)No. of fuel types 2 Marine distillate (MD) and residual oil (RO)
No. of operation modes 3 At sea (ME), manoeuvering (ME), in port (AE) only for year 2002No. of years covered 13 From 1990 up to 2002
No. of Sulphur contents 26 Different fuel S value for RO and MD for each yearNo. of NOx red. techniques 5 SCR, lowNOx, HAM, DWI, NOxCode
No. of fuel cons./ age classifications 2 Engines built 1993-2003 and engines built before 1993
Thus each emission factor table as result output (Appendices 1 and 2) presents thepollutants (and fuel consumption) for all 10 engine / fuel combinations. Separate tablescover the three possible operational modes for year 2002 (Appendix 1). For previousyears data (each with specifically assigned fuel sulphur for RO and MD) only the mostsignificant operational mode regarding emission magnitude (at sea) has been considered(Appendix 2). Concerning NOx reduction technologies, these are accounted for byweighting each emission factor accordingly using “reduction profiles” (see section 3.4).
18
It should be noted that of the 10 possible engine/fuel combinations given in the tables,several of them are of minor importance (and possibly will not even apply) for thecurrent fleet using Swedish fuels. For example, steam turbines (with either RO or MD)are being gradually phased out and only a very few gas turbine ships are in operation. Inaddition slow speed engines (SSD) almost always operate using residual oil (RO) fuelswhich renders the emission factors for SSD/MD largely irrelevant. By far the mostdominant combinations in use are SSD/RO, MSD/RO and MSD/MD5. In this regard,most of the available measurement data (from which the factors are assigned)fortunately reflect these populations, although the SSD/RO category could beconsidered slightly under represented. Few data exist for gas turbine ships and verylittle reliable data exists for steam turbines.
Initially, no difference in the emission factors was planned between ships operating ondomestic and international routes. Since the use of SCR for controlling NOx emissionsis however significantly different for international and domestic routes relative to thefuel sold in these groups, an amendment for this has been included in the result tables.Thus different NOx, CO, NMVOC and NH3 emission factors are given for domestic andinternational traffic.
3.3 DatabaseThe central database from where the appropriate emission factors have been derivedconsists largely of in-house emission measurement data and other sources (LloydsEngineering Services, 1995; and various fuel oil analyses). The database consists ofmeasurements from 62 different ships covering ca. 180 engines. This database is similarto that used to estimate European ship emissions and is presented in detail in EuropeanCommission 2002a. More pollutants have however been included in the currentdatabase, and new measurements have been added and old data (ships older than 23years) removed. Since the number of measurements for a particular pollutant can varyconsiderably a range of uncertainty exists between the different emission factors. Anattempt has been made to roughly quantify these uncertainties in the result tables usingdifferent colour codes.
3.4 Reduction profiles for engine/fuel categories
In order to account for NOx reduction techniques in use, the base emission factors (i.e.without emission abatement) and those emission factors corresponding to the reducedemissions, have been weighted accordingly. Firstly data on the emission levels with thereduction techniques in use are required. These are relatively well represented in thedatabase with a reasonable measurement uncertainty (see section 3.6.1).
5 For the world fleet, it is estimated that 95% of all slow speed diesels and 70% of medium speed dieselsoperate using RO fuel (Corbett and Koehler, 2003).
19
Since the activity data is based on Swedish fuel sales, secondary information is alsorequired concerning how much Swedish purchased fuel is consumed for a givenreduction technique. Ideally this information should be quantified for each fuel / enginecombination. To gather this data a questionnaire was sent out to cover 60 ships for 2002(36 ships with “NOx reduction certificates” identified by the Swedish MaritimeAdministration and an additional 24 ships using low-NOx engines). Even data on thestart year of the techniques has been collected. Since a 100% response was achieved, agood estimate of the relative use of the techniques and thereby emission factors isanticipated. Data on ships using low-NOx engines may however be lacking since manyof these ships are not certified with NOx Reduction Certificates, thus a direct contactwith the shipowner was the only apparent way of collecting data. In this regard, two ofthe larger shipowners, well known for their environmental progress (24 low-NOx slidevalve ships) were contacted within the project6. Since these ships are of the transoceanictype relatively small quantities of the ships’ fuel are purchased in Sweden, but theimpact for Swedish marine emissions from Swedish fuel is however considerable (i.e.ca. 18% of Swedish RO fuel in 2002 is operated by low NOx slide valve engines).
The “reduction profiles” i.e. fractions of total fuel consumed for a given year used by agiven reduction technique and engine / fuel combination are presented in Appendix 4.Data on the total fuel consumed (i.e. activity data) is presented in Appendix 3. Note thatthe reduction profiles have been largely derived from International ships only. Fordomestic ships however, the emission reduction technologies are confined to SCR onMSD and HSD engines using MD and RO fuels. Since there is a considerable differencebetween the fraction of SCR fuel for international and domestic traffic (e.g. forMSD/MD ships the fraction is 44% for domestic traffic compared to 3,3% forInternational ships7), these differences cannot easily be ignored. Consequently an“Amendment table” to treat the consequences of domestic SCR use is included in theresult tables i.e. different emission factors for NOx, CO, NMVOC and NH3 for domestictraffic.
From Appendix 4, ca. 5,7% of the RO fuel sold in Sweden in 2002 was used for shipsusing SCR in international traffic. If all the SCR ships calling on Swedish ports hadchosen to purchase only Swedish fuels then this percentage would increase to 11,8%.The emission reductions of the SCR ships using foreign fuels should be accounted forby the country selling the fuel.
6 There may be other ships using this low-NOx technique which have not been registered in the presentdatabase. One of the larger engine manufacturers are now fitting low-NOx slide valves on all newly builtslow-speed engines giving emission reduction significantly greater that the IMO regulations (Motor Ship,2002).
7 It should be noted that International RO fuel is sold in much larger quantities i.e. 9 - 90 times the ROfuel sold for domestic traffic.
20
3.5 Evaluation and form of emission factors in result tables
Following standard international procedure for gaseous emissions from diesel engines,the base emission factors are presented in terms of a weight of a given pollutant (ingrams) divided by the uncorrected power at the crankshaft (in kWh), i.e. g/kWh. Thelatter represents the net effect output from the engine as opposed to the supplied inputeffect from the fuel energy content (which is often used as convention for land-basedpower plants for example). By using the specific fuel combustion (gram fuel consumedper kWh) a simple calculation converts the power-based emission factors from g/kWhto g/ton fuel supplied which in turn is converted to Gg/supplied TJ using the heatingvalue of the fuel in question. This latter unit is generally more useful when applyingactivity data (often expressed for reporting requirements as fuel consumed in TJ). In theemission factor tables supplied in Appendices 1 and 2 all these units are used.
Initially, the most appropriate emission factors (derived from the database) for apollutant are given specifically for the 5 different engines types and each for the 2alternative fuels. These “base” emission factors in g/kWh (which even include agecorrections for the specific fuel consumption) have then been weighted according to therelative fuel used with the 5 different NOx reduction technologies to obtain “corrected”factors in g/kWh (see reduction profiles in section 3.4). An example of this step fromthe base to corrected emission factors is provided in Appendix 5.
Finally, the “corrected” factors given in g/kWh are converted to g/ton fuel and Gg/TJsupplied energy.
3.6 Comments on derivation of specific emission factors
3.6.1 NOx emissions
A detailed presentation of the base NOx emission factors including comparisons withother sources is presented in European Commission, 2002a. An extension of this datafor this study has focused on emission reduction technologies, most notably SelectiveCatalytic Reduction (SCR) systems.
21
From the database, SCR NOx emission factors are based on 99 measurements (42 withRO fuel and 57 with MD fuel) on different MSD engines with 3 different manufacturersof SCR. The data includes certification measurements (at 75% engine load setting) andalso so-called real-world measurements. An average NOx emission of 1,26 g/kWh isobtained which can be compared with a weighted baseline 13.54 g/kWh. Thus a 91%reduction has been assumed.8 Approximately 45% (international traffic) and 46%(domestic traffic) of the systems are equipped with oxidation catalysts in addition to theSCR. From the database, the oxidation catalysts result in emission reductions of CO andHC by 70% and 80% respectively. No significant change in PM or N2O emissions hasbeen observed with SCR systems.
3.6.2 CO2 and heavy metal emissions
Fuel dependent emission factors of CO2 and heavy metals have been assumed not tovary over the period 1990-2003. CO2 emissions have been calculated from a carboncontent of 86,7% for all fuels.
For heavy metals, fuel analysis data has been used where available to derive theemission factors (assumes that all the metals in the fuel are emitted in the exhaust).Some analysis certificates accompanying deliveries (especially residual oils) caninclude heavy metal contents. These however normally only include only lead, zinc andnickel of the metals to be reported. Vanadium and iron contents which can beappreciable are usually also included in the analyses9 but these are not required forreporting purposes. A very limited amount of data is however available on the other 6metals to be reported (Lloyds Register Engineering Services, 1995). In general however,measured values have been obtained for all metals although some are more certain thanothers and the RO data is slightly biased towards residual oils with higher viscosities(>300 cSt).
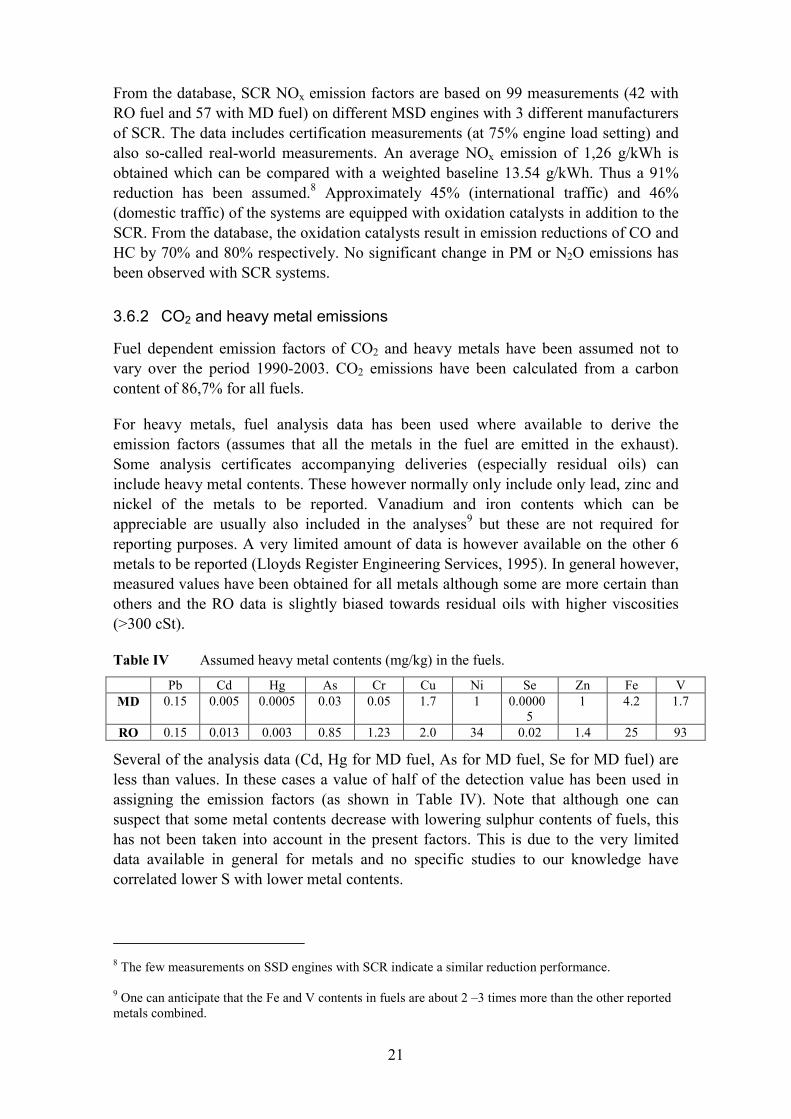
Table IV Assumed heavy metal contents (mg/kg) in the fuels.
Pb Cd Hg As Cr Cu Ni Se Zn Fe VMD 0.15 0.005 0.0005 0.03 0.05 1.7 1 0.0000
51 4.2 1.7
RO 0.15 0.013 0.003 0.85 1.23 2.0 34 0.02 1.4 25 93
Several of the analysis data (Cd, Hg for MD fuel, As for MD fuel, Se for MD fuel) areless than values. In these cases a value of half of the detection value has been used inassigning the emission factors (as shown in Table IV). Note that although one cansuspect that some metal contents decrease with lowering sulphur contents of fuels, thishas not been taken into account in the present factors. This is due to the very limiteddata available in general for metals and no specific studies to our knowledge havecorrelated lower S with lower metal contents.
8 The few measurements on SSD engines with SCR indicate a similar reduction performance.
9 One can anticipate that the Fe and V contents in fuels are about 2 –3 times more than the other reportedmetals combined.
22
3.6.3 SO2 emissions
As for CO2 and heavy metals, SO2 emissions can be directly calculated from the sulphurcontent in the fuel. Thus the potential for a relatively accurate estimate for SO2
emissions clearly exists. Unfortunately however, although sulphur content in marinefuels is relatively well tested (about 30% of all residual oils world-wide are tested)access to this data and the resulting averages for different fuel types is limited.
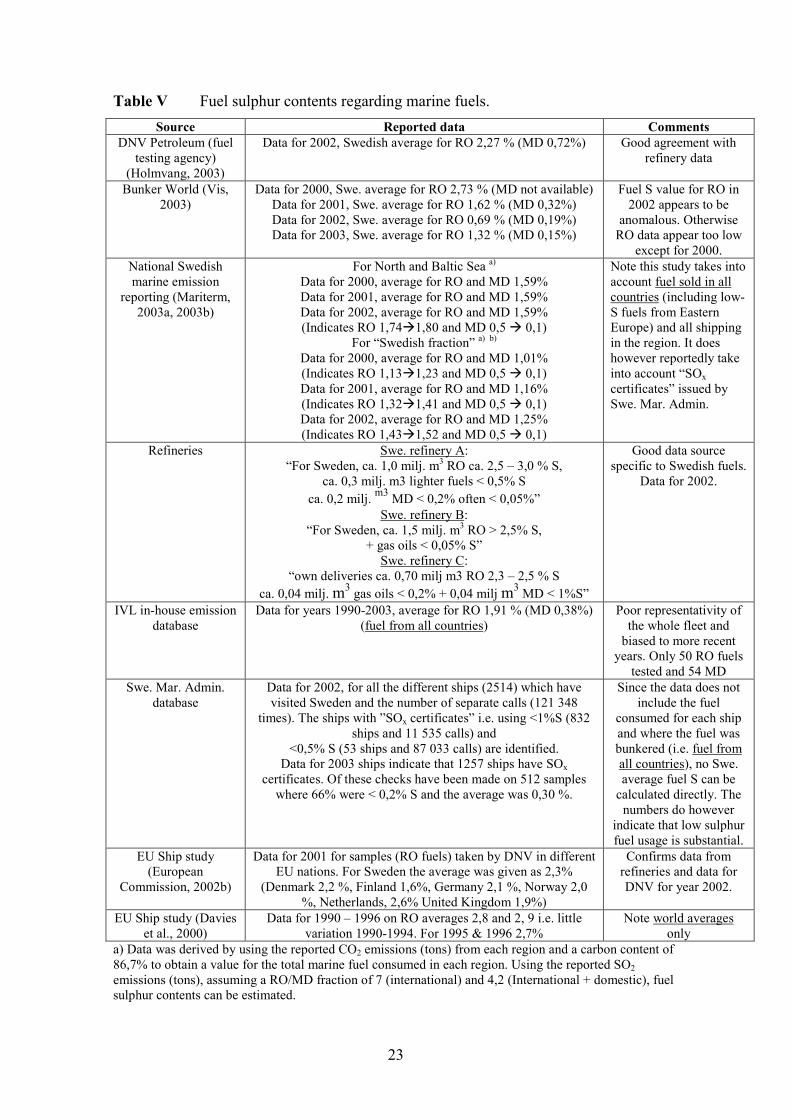
For the purposes of this project, a variety of information sources regarding sulphurcontent in marine fuels sold in Sweden was used (Table V). In addition, SCB havegathered data on the amounts of Swedish fuel sold with sulphur > 1 wt-%, but this datais at present confidential and not available to SMED (see section 5.1).The spread in thedata of Table V and its applicability however casts some doubt on the general reliabilityand representativity of the material.
23
Table V Fuel sulphur contents regarding marine fuels.Source Reported data Comments
DNV Petroleum (fueltesting agency)
(Holmvang, 2003)
Data for 2002, Swedish average for RO 2,27 % (MD 0,72%) Good agreement withrefinery data
Bunker World (Vis,2003)
Data for 2000, Swe. average for RO 2,73 % (MD not available)Data for 2001, Swe. average for RO 1,62 % (MD 0,32%)Data for 2002, Swe. average for RO 0,69 % (MD 0,19%)Data for 2003, Swe. average for RO 1,32 % (MD 0,15%)
Fuel S value for RO in2002 appears to be
anomalous. OtherwiseRO data appear too low
except for 2000.National Swedishmarine emission
reporting (Mariterm,2003a, 2003b)
For North and Baltic Sea a)
Data for 2000, average for RO and MD 1,59%Data for 2001, average for RO and MD 1,59%Data for 2002, average for RO and MD 1,59%(Indicates RO 1,74 1,80 and MD 0,5 0,1)
For “Swedish fraction” a) b)
Data for 2000, average for RO and MD 1,01%(Indicates RO 1,13 1,23 and MD 0,5 0,1)Data for 2001, average for RO and MD 1,16%(Indicates RO 1,32 1,41 and MD 0,5 0,1)Data for 2002, average for RO and MD 1,25%(Indicates RO 1,43 1,52 and MD 0,5 0,1)
Note this study takes intoaccount fuel sold in allcountries (including low-S fuels from EasternEurope) and all shippingin the region. It doeshowever reportedly takeinto account “SOxcertificates” issued bySwe. Mar. Admin.
Refineries Swe. refinery A:“For Sweden, ca. 1,0 milj. m3 RO ca. 2,5 – 3,0 % S,
ca. 0,3 milj. m3 lighter fuels < 0,5% Sca. 0,2 milj. m3 MD < 0,2% often < 0,05%”
Swe. refinery B:“For Sweden, ca. 1,5 milj. m3 RO > 2,5% S,
+ gas oils < 0,05% S”Swe. refinery C:
“own deliveries ca. 0,70 milj m3 RO 2,3 – 2,5 % Sca. 0,04 milj. m3 gas oils < 0,2% + 0,04 milj m3 MD < 1%S”
Good data sourcespecific to Swedish fuels.
Data for 2002.
IVL in-house emissiondatabase
Data for years 1990-2003, average for RO 1,91 % (MD 0,38%)(fuel from all countries)
Poor representativity ofthe whole fleet and
biased to more recentyears. Only 50 RO fuels
tested and 54 MDSwe. Mar. Admin.
databaseData for 2002, for all the different ships (2514) which havevisited Sweden and the number of separate calls (121 348
times). The ships with ”SOx certificates” i.e. using <1%S (832ships and 11 535 calls) and
<0,5% S (53 ships and 87 033 calls) are identified.Data for 2003 ships indicate that 1257 ships have SOx
certificates. Of these checks have been made on 512 sampleswhere 66% were < 0,2% S and the average was 0,30 %.
Since the data does notinclude the fuel
consumed for each shipand where the fuel wasbunkered (i.e. fuel fromall countries), no Swe.average fuel S can be
calculated directly. Thenumbers do however
indicate that low sulphurfuel usage is substantial.
EU Ship study(European
Commission, 2002b)
Data for 2001 for samples (RO fuels) taken by DNV in differentEU nations. For Sweden the average was given as 2,3%
(Denmark 2,2 %, Finland 1,6%, Germany 2,1 %, Norway 2,0%, Netherlands, 2,6% United Kingdom 1,9%)
Confirms data fromrefineries and data forDNV for year 2002.
EU Ship study (Davieset al., 2000)
Data for 1990 – 1996 on RO averages 2,8 and 2, 9 i.e. littlevariation 1990-1994. For 1995 & 1996 2,7%
Note world averagesonly
a) Data was derived by using the reported CO2 emissions (tons) from each region and a carbon content of86,7% to obtain a value for the total marine fuel consumed in each region. Using the reported SO2emissions (tons), assuming a RO/MD fraction of 7 (international) and 4,2 (International + domestic), fuelsulphur contents can be estimated.
24
b) “Swedish fraction” refers to all domestic sea traffic and a “morally correct” fraction of international seatraffic (Sjöbris et al., 2001).
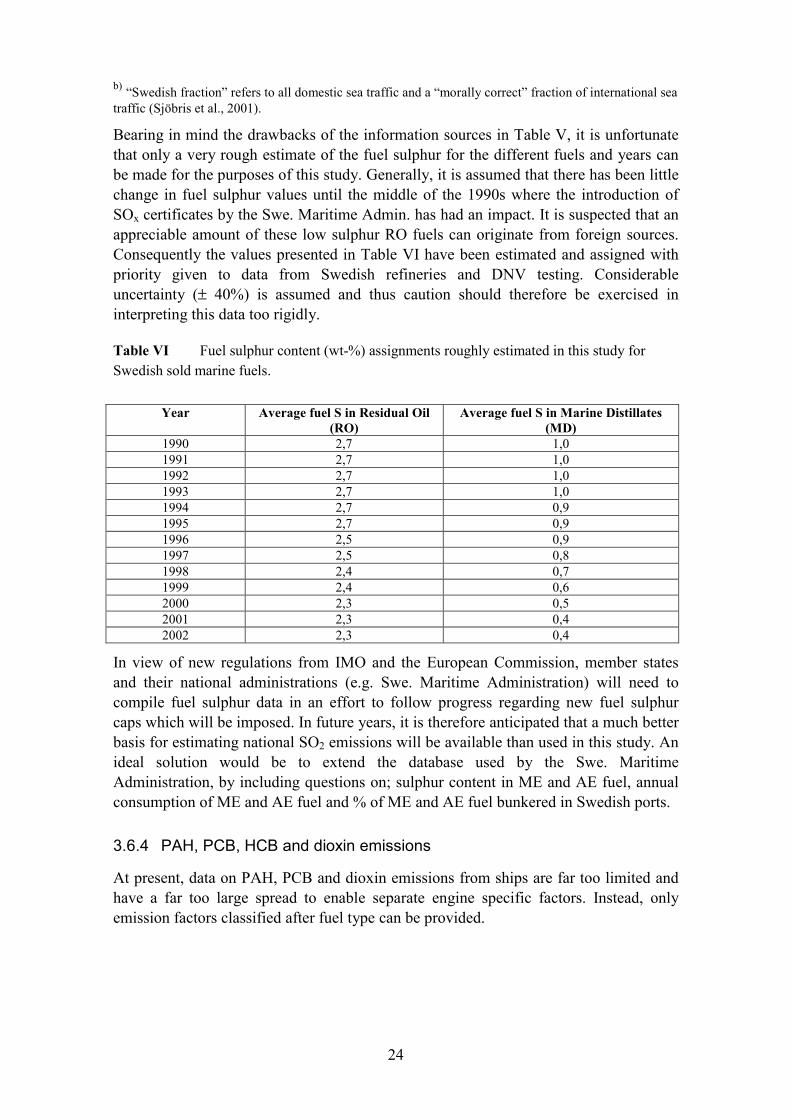
Bearing in mind the drawbacks of the information sources in Table V, it is unfortunatethat only a very rough estimate of the fuel sulphur for the different fuels and years canbe made for the purposes of this study. Generally, it is assumed that there has been littlechange in fuel sulphur values until the middle of the 1990s where the introduction ofSOx certificates by the Swe. Maritime Admin. has had an impact. It is suspected that anappreciable amount of these low sulphur RO fuels can originate from foreign sources.Consequently the values presented in Table VI have been estimated and assigned withpriority given to data from Swedish refineries and DNV testing. Considerableuncertainty (± 40%) is assumed and thus caution should therefore be exercised ininterpreting this data too rigidly.
Table VI Fuel sulphur content (wt-%) assignments roughly estimated in this study forSwedish sold marine fuels.
Year Average fuel S in Residual Oil(RO)
Average fuel S in Marine Distillates(MD)
1990 2,7 1,01991 2,7 1,01992 2,7 1,01993 2,7 1,01994 2,7 0,91995 2,7 0,91996 2,5 0,91997 2,5 0,81998 2,4 0,71999 2,4 0,62000 2,3 0,52001 2,3 0,42002 2,3 0,4
In view of new regulations from IMO and the European Commission, member statesand their national administrations (e.g. Swe. Maritime Administration) will need tocompile fuel sulphur data in an effort to follow progress regarding new fuel sulphurcaps which will be imposed. In future years, it is therefore anticipated that a much betterbasis for estimating national SO2 emissions will be available than used in this study. Anideal solution would be to extend the database used by the Swe. MaritimeAdministration, by including questions on; sulphur content in ME and AE fuel, annualconsumption of ME and AE fuel and % of ME and AE fuel bunkered in Swedish ports.
3.6.4 PAH, PCB, HCB and dioxin emissions
At present, data on PAH, PCB and dioxin emissions from ships are far too limited andhave a far too large spread to enable separate engine specific factors. Instead, onlyemission factors classified after fuel type can be provided.
25
One should note that the 4 PAH species required for reporting in Table II represent onlya very small fraction of the “total PAH” determined in studies10 where other PAHspecies are identified, irrespective of the fuel used. Thus for these 4 PAHs there is littledifference in emissions from engines using RO or MDO, neither as individual speciesnor the sum of the four i.e. “Total PAH-4”.
Similarly, regarding HCB, PCB and PCDD/PCDF (dioxins and furans), the lack ofmeasurement data has prevented assigned specific emission factors for different enginetype, operation mode nor fuel type. For PCB there are currently no definitions as towhich isomers (of the 209 available species) are summed and need to be reported(Dutchak, 2003). The PCB data for marine emissions used here refers to PCB totals of7 – 15 species. Dioxin and furans are reported as a Toxicity Equivalent Quantity of 17isomers using a set of Toxicity Equivalent Factors assigned in Lloyds RegisterEngineering Services, 1995
3.6.5 N2O and CH4 emissions
Data on CH4 and N2O emissions from ships are sparse but the emissions are consideredas of minor importance. The CH4 emission factors used here are based on 8 measuredratios of CH4 : NMVOC from 4 ships (only HSD and MD fuels). To our knowledge nodata exists on other engines and fuels but it is assumed that the same ratios are valid.Thus in all cases 2% 11 of NMVOC is assumed as CH4.
For N2O there are limited data (20 measurements) for so-called baseline conditions (i.e.without NOx abatement) covering 7 ships and 12 different engines. None of the datacover however slow speed engines running on residual oil fuel. Since the results arefairly similar, one emission factor value (0,031 g/kWh) has been assigned for all fuelsand engines 12. For turbine machinery, only one measurement value (0,08 g/kWh) for amarine gas turbine has been found. This value has been assumed to be valid for allturbine machinery but carries a high uncertainty.
Regarding use of SCR systems with urea injection for NOx abatement, measurementshave shown no significant change in N2O emissions. Thus trials on 5 different ships and8 engines covering 2 types of SCR, show an average N2O emission of 0,036 g/kWh.Thus bearing in mind measurement uncertainty and the relatively low number of data,no adjustment has been made for the N2O emissions with use of SCR systems for NOx
control.
10 By including fluoranthene and benzo(ghi)perylene as extra PAH species however, as required forreporting in European Commission, 2000 (presumably required for stationary large combustion sources),then the “Total PAH-6” is 8 times greater than “Total PAH-4” due largely to the inclusion offluoranthene. If the PAH list is further increased to include 29 species (including naphthalene) the “TotalPAH-29” emission factor would be 0,0044 g/kWh for residual oil (ca. 730 times the reported PAH-4) and0,0025 g/kWh for distillate fuel (ca. 420 times the reported PAH-4).
11 In previous emission factor guidebooks, 12% of NMVOC has been assumed as CH4 without anycitation regarding measurement data (IPCC, 1997; EMEP, 2002).
12 The value 0,031 g/kWh is about twice that recommended in IPCC 1997 (no measurement citation).
26
3.6.6 TSP, PM10 and PM2.5 emissions
Very few studies have been conducted on particle size distributions from operatingmarine diesel engines. The general consensus however is that as for other diesel enginesthe emissions are dominated by particles with diameters less than 1 µm (i.e. TSP =PM10 = PM2,5). This approach has been used in this study 13.
3.6.7 NH3 emissions
For so-called baseline cases (i.e. engines without SCR systems for NOx abatement),NH3 emissions are very small and have been determined as an average of 0,003 g/kWh(ca. 0,5 ppm) for 7 engines on 5 ships. For a gas turbine only one value has beenmeasured < 0,0008 g/kWh 14.
For SCR systems with urea injection for NOx abatement (3 different SCRmanufacturing companies considered), measurements for all engine and fuel types havebeen grouped together. The data includes measurements at steady-state (mostly at 75%for certification purposes) but also some real-world data where other operating loadsand conditions are considered. In all, the data comprises 66 engines on 17 ships andindicates an average “NH3 slip” of 15 ppm at 15% O2 (0,10 g/kWh). Most engines haveslip < 10 ppm but a few have considerably higher slip emissions which influence theaverage. These high NH3 engines are a result of poorly trimmed systems and also caseswhere changing engine loads occur, both of these factors reflect the so-called “real-world”. Note that the NH3 slip from SCR systems is considered not to be dependent onengine type or fuel used.
3.7 Emissions from in port and manoeuvring operations
13 Preliminary tests on two operating diesel engines (AE with MDO and ME with RO) indicate howeverthat about 50 - 70% of the TSP could be as PM2,5 and the remainder as PM10 (Cooper, 2003). One cananticipate that particle size distribution will be dependent on fuel type (due to ash and sulphur in the fuel).
14 Note in the emission factor tables, for measurement data reported as less than a detection value, half ofthe detection limits has been used (i.e. 0,0004 g/kWh in this case).
27
Although “in port” and “manoeuvring” emissions account for a relative small fraction ofthe total emissions when compared to those generated “at sea” for propulsion of theship, they are of importance due to their proximity to populated areas. Strictly speaking,a division of the activity data (marine fuel sales) into fuel consumed for the threeoperational modes (“at sea”, “in port” and “manoeuvring”) would ideally be required tofully utilise “in port” and “manoeuvring” emission factors and thereby improve theaccuracy of the total emission estimate. Since one can assume that the relative fractionsof fuel consumed for these modes are considerably smaller than for “at sea” operation, itis a reasonable simplification to use only the “at sea” emission factors whendetermining the total emissions. Nevertheless on the ground of completeness andoutlining current scientific understanding an insight into in port and manoeuvringemissions has been provided for the year 2002 (Appendix 2).
Some fundamental assumptions used in assigning these emission factors are:
• The SCR reduction profiles for the auxiliary engines (AEs) used in port are assumedto be the same as those evaluated for MEs “at sea”. This will however probably leadto an underprediction of the NOx emission factor since in several cases AEs areoperated in the real-world with relatively low engine loads which keep the exhausttemperature below the minimum for urea injection in the SCR to function correctly.
• No AEs are operated with low-NOx, HAM or DWI.
• AEs are assumed to be either medium or high speed diesels (i.e. no slow-speeddiesels or turbine machinery are used as AEs).
• For certain pollutants (e.g. PCB, dioxin and furans), measurement data from AEsare lacking. In these cases data from ME measurements have been used.
• For “manoeuvring” (MEs assumed to be operating at 20% MCR) the factors carry ahigh uncertainty and are based largely on professional judgement due to a lack ofdata. Consideration has however been given to in-house so-called real-world studieswhich cover whole journeys (e.g. Cooper, 2001) and the transient/passage andsteady state/passage ratios reported in Lloyds Register Engineering Services, 1995.The approach adopted was to multiply “at sea” ME emission factors (derived fromsteady state loads 70 - 100%) by 0,8 for NOx, 2,0 for HC, CO and PM for all dieselengines and steam turbines. For gas turbines the corresponding factors were taken as0,5 for NOx, 5,0 for HC, CO and PM. In addition, the specific fuel consumption(and thereby specific SO2 and CO2 emissions) has been assumed to increase by 10%for all engines at these low and varying loads. Clearly this approach unfortunatelyintroduces significant uncertainty and provides an area to be targeted for futureemission factors studies.
• The reduction profiles for “manoeuvring” are assumed to be the same as for “atsea”. With regard to SCR operation which usually require a 30 minute warm-upperiod, this will probably give an underprediction of the NOx emission factors.
28
• One should note that for manoeuvring emissions some ME operation can be eitherfrom starts with a cold engine, which will give significantly different emissions(especially CO, HC and PM), compared to starts with relatively warm engines.Secondly since engine loads can change rapidly during manoeuvring operations, thevariability in emissions is increased.
In view of the differences in the emission factors between the three modes and theuncertainty level anticipated, it is difficult to specify exactly how biased the totalemissions may be when relying solely on the “at sea” emission factors. With areservation for the lack of measurement data, one can anticipate however that PMemissions in particular are likely to be underestimated.

29
4 Emission factors for ships
The results generated are presented in Appendices 1 and 2 for year 2002 and years 1990–2001 respectively.
30
5 Discussion
5.1 Available activity data
The current level of detail for the activity data (Swedish marine fuel sales) provided byStatistics Sweden (SCB) for calculating ship emissions is, relative to the emissionfactors, quite limited (Table VII). Since diesel fuel oil, and fuel oil Eo1, are allessentially covered as “marine distillate fuel” and fuel oil Eo2 – Eo6 can be equatedwith “residual marine fuel”, these 3 SCB fuel groups can be agglomerated to thenomenclature of the 2 marine fuel types without any loss of pertinent information. TheSwedish marine fuel sales data for 1990 – 2002 is presented in Appendix 3.
The data presented in Appendix 3 is considered to cover 100 % of all Swedish marinefuel sales. This even includes bunkering at sea made just outside of port areas. Somecaution should be exercised however regarding the fraction of domestic andinternational fuels. Since some ships operate between several Swedish port (bydefinition domestic traffic) before going on to an international port (by definitioninternational traffic), the fuel consumed for these voyages should ideally be split asdomestic/international in the accounting procedure. Clearly, in practice this is verydifficult and it is suspected that the fuel is classed as international traffic only. If this isthe case, then the activity data (and thereby emissions) for domestic traffic isunderestimated.
An additional factor to consider is that a fraction of the fuel included by the salesstatistics is used by smaller sea vessels i.e. pleasure craft, fishing boats with < 100gross tonnage. This will be particular so for distillate fuels. Since the activity data hasno division for vessel size and a set of emission factors for the smaller vessels is outsideof the scope of this work, then some uncertainty is introduced. In view of previousemission factors estimates for these types of vessel (Swedish Environmental ProtectionAgency,1992) one can expect a slight overestimate in NOx emissions and underestimatein CO and HC emissions.
Table VII Scope of activity data (in m3 delivered) concerning marine emissions reported bySCB
No. of fuel types 3 Diesel fuel oil, Fuel oil Eo1 (“Marine Distillate fuel”)and Fuel oil Eo2 – Eo6 (“Residual Oil”)
No. of uses for fuel 2 International and Domestic sea traffic
It should be borne in mind that from years 1997 onwards, some data on the amount offuel sold with sulphur greater than or equal to 1 wt-% has been acquired by SCB. Sincethis data is supplied by only one company however, the data has been classed asconfidential and thus has not been made available for use in this study.
31
The available activity data will dictate the form and units required for the “usableemission factors” (i.e. those directly used to give the total emissions as the product ofactivity data and emission factors). Although the fuel sales data is reported in m3
delivered, convention is to convert this data directly to TJ supplied energy using heatingvalue and density data (since UNFCC and IPCC guidelines require even fuelconsumption data in TJ supplied energy).
The “usable emission factors” will therefore have to correspond to the same detail i.e. 2different sets of emission factors one for RO and one for MD fuel. A further division ofemission factors for international and domestic traffic is only required for NOx, CO,NMVOC and NH3 due to the different use of SCR between international and domestictraffic. It is important to note that additional emission factors covering for exampledifferent operational modes (“manoeuvring”, “in port”) and engine types will be largelysuperfluous and need to be agglomerated and weighted to suit the final two fueldivisions in order to obtain the total emissions (see section 5.2).
5.2 "Usable" emission factors
To calculate the total emissions, the emission factors in Appendices 1 and 2 need to becombined so that for each pollutant only two emission factors (one for MD fuel and onefor RO fuel) are obtained in a way which is representative of the ships operating onSwedish fuel. An exception however is for NOx, CO, NMVOC and NH3 where bothInternational and Domestic traffic emission factors will be required. In order to weightthe original engine specific emission factors correctly, data on the fleet’s (i.e. shipsusing Swedish fuel) machinery and fuel use is necessary. Such data is as yetunfortunately not been made available. Some data on ship machinery for the entire fleetmaking calls in Sweden forms however part of a central database kept by the SwedishMaritime Administration. Although the machinery of the ships is not linked to theamount of Swedish purchased fuel consumed, the data can be weighted by usinginstalled engine effect. Fuel type (RO or MD) information can also most probably bededuced. Thus it is hoped that this database can be used in the future to obtain a bestestimate of the total Swedish emissions.
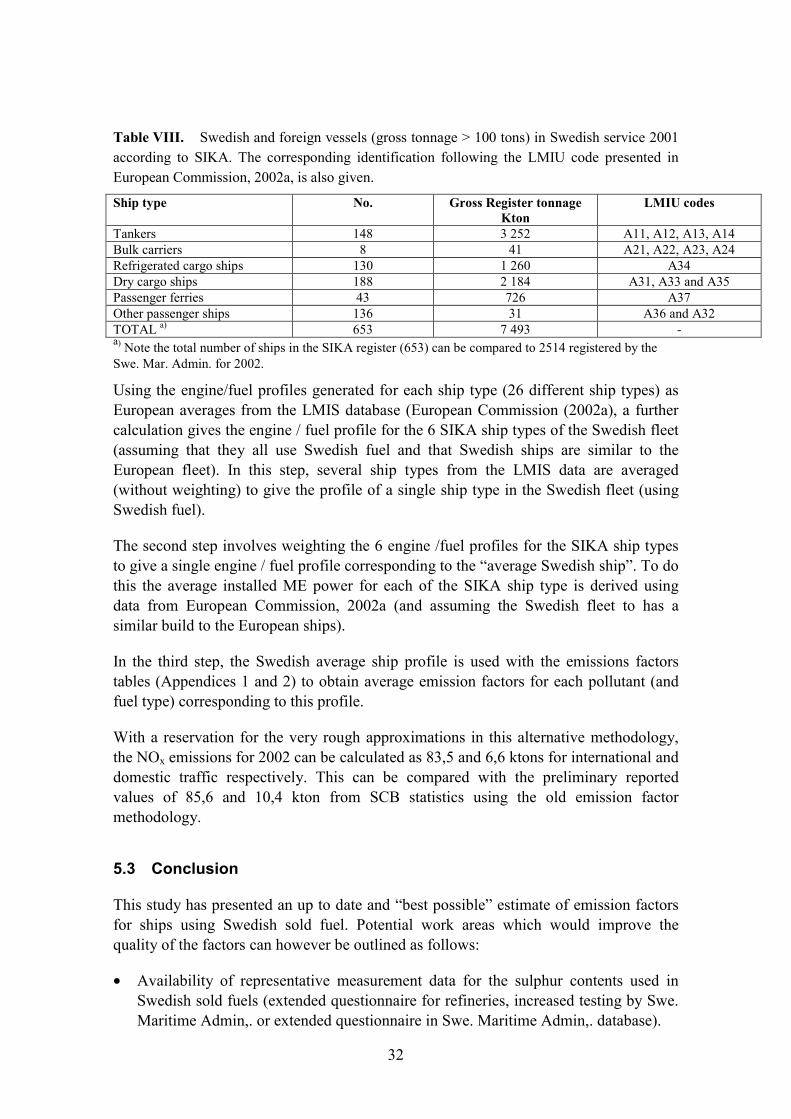
If access to the above database proves not possible, an alternative using a moresimplified approximation can be made by using data publicly available on the numberand type of ships identified by the Swedish Institute for Transport and CommunicationsAnalysis (SIKA) for 2001 (Table VIII).
32
Table VIII. Swedish and foreign vessels (gross tonnage > 100 tons) in Swedish service 2001according to SIKA. The corresponding identification following the LMIU code presented inEuropean Commission, 2002a, is also given.
Ship type No. Gross Register tonnageKton
LMIU codes
Tankers 148 3 252 A11, A12, A13, A14Bulk carriers 8 41 A21, A22, A23, A24Refrigerated cargo ships 130 1 260 A34Dry cargo ships 188 2 184 A31, A33 and A35Passenger ferries 43 726 A37Other passenger ships 136 31 A36 and A32TOTAL a) 653 7 493 -a) Note the total number of ships in the SIKA register (653) can be compared to 2514 registered by theSwe. Mar. Admin. for 2002.
Using the engine/fuel profiles generated for each ship type (26 different ship types) asEuropean averages from the LMIS database (European Commission (2002a), a furthercalculation gives the engine / fuel profile for the 6 SIKA ship types of the Swedish fleet(assuming that they all use Swedish fuel and that Swedish ships are similar to theEuropean fleet). In this step, several ship types from the LMIS data are averaged(without weighting) to give the profile of a single ship type in the Swedish fleet (usingSwedish fuel).
The second step involves weighting the 6 engine /fuel profiles for the SIKA ship typesto give a single engine / fuel profile corresponding to the “average Swedish ship”. To dothis the average installed ME power for each of the SIKA ship type is derived usingdata from European Commission, 2002a (and assuming the Swedish fleet to has asimilar build to the European ships).
In the third step, the Swedish average ship profile is used with the emissions factorstables (Appendices 1 and 2) to obtain average emission factors for each pollutant (andfuel type) corresponding to this profile.
With a reservation for the very rough approximations in this alternative methodology,the NOx emissions for 2002 can be calculated as 83,5 and 6,6 ktons for international anddomestic traffic respectively. This can be compared with the preliminary reportedvalues of 85,6 and 10,4 kton from SCB statistics using the old emission factormethodology.
5.3 Conclusion
This study has presented an up to date and “best possible” estimate of emission factorsfor ships using Swedish sold fuel. Potential work areas which would improve thequality of the factors can however be outlined as follows:
• Availability of representative measurement data for the sulphur contents used inSwedish sold fuels (extended questionnaire for refineries, increased testing by Swe.Maritime Admin,. or extended questionnaire in Swe. Maritime Admin,. database).
33
• More measurement data for heavy metals, persistent organic pollutants (PCB, HCB,PCDD, PCDF) and PM (in particular particle size distributions).
• Finally combining this work with information on the machinery/fuel profile for theSwedish fleet using Swedish fuel (e.g. by use of Swe. Maritime Admin,. database),the total emissions can be evaluated with an improved accuracy and completenesscovering the requirements for Sweden’s international reporting obligations. Inaddition this would highlight areas for priority (if necessary) regarding engine / fueltypes (e.g. steam turbines).
34
6 References
Cooper, D. A. (2001) ‘Exhaust emissions from high speed passenger ferries’, AtmosphericEnvironment 35, pp 4189-4200.
Cooper, D. A. (2003) ‘Exhaust emissions from ships at berth’, Atmospheric Environment 37, pp3917-3830.
Corbett, J. J., Koehler, H. W. (2003) ‘Updated emissions from ocean shipping‘ Journal ofGeophysical Research Vol. 108 D20, 4650.
Davies, M. E., Plant, G., Cosslett C., Harrop, O. and Petts, J. W. (2000) ‘Study on the economic,legal, environmental and practical implications of a European Union system to reduce shipemissions of SO2 and NOx‘ European Commission contract B4-3040/98/000839/MAR/B1’,BMT Murray Fenton Edon Liddiard Vince Ltd., England.
Dutchak, S. (2003) Meteorolgical Synthesizing Centre-East (MSC-East of EMEP), Moscow,Russia. Personal communication 2003-11-10.
EMEP (2002) ‘Atmospheric Emission Inventory Guidebook – 3rd Edition – October 2002update’, European Environmental Agency, January 2001.http://reports.eea.eu.int/EMEPCORINAIR3/en.
European Commission (1999) ‘Transport Research - EUR 18902 - COST 319 - Estimation ofpollutant emissions from transport - Final report of the action’ ISBN 92-828-6797-8, Chapter3.6 “Maritime transport and inland navigation emissions” by C. Trozzi and R. Vaccaro (Technesrl, Italy) pp 98 – 104.
European Commission (2000) ‘Guidance document for EPER (European Pollutant EmissionRegister) implementation’ November 2000. Refers to Council Directive 96/61 EC concerningIPPC (Integrated Pollution Prevention and Control).
European Commission (2002a) ‘Quantification of emissions from ships associated with shipmovements between ports in the European Community’. Entec UK Ltd and IVL SwedishEnvironmental Research Institute, July 2002.
European Commission (2002b) ‘Advice on the costs to fuel producers and price premia likely toresult from a reduction in the level of sulphur in marine fuels marketed in the EU’ ContractStudy /C.1/01/2002. Beicap-Franlab.
Hellén, G. (2003) Wärtsilä Finland OY, Vasa Finland. Personal communication 2003-10-30.
Holmvang, P. (2003) Det Norske Veritas, Oslo, Norway. Personal communication 2003-10-14.
IMO Technical NOx Code, (1997) ‘Technical code on control of emission of nitrogen oxidesfrom marine diesel engines’. MP/CONF. 3/35 22 October 1997.
35
IPCC (1997) ‘Greenhouse Gas Inventory Reference Manual – Revised 1996, Volume 3’Intergovernmental Panel on Climate Change Edited by J. T. Houghton, L. G. Meira Filho, B.Lim, K. Tréanton, I. Mamaty, Y. Bonduki, D. J. Griggs and B. A. Callander.
Lloyds Register Engineering Services (1995) ‘Marine Exhaust Emissions ResearchProgramme’, Lloyds Register Engineering Services, London UK.
Nielsen, O-M (2003) MAN B&W, Copenhagen, Denmark. Personal communication 2003-10-27.
MariTerm AB (2003a) ’Emissions from Swedish sea traffic 2001’ (in Swedish) Mariterm AB,Gothenburg. Report for Swedish Maritime Administration.
MariTerm AB (2003b) ’Emissions from Swedish sea traffic 2002’ (in Swedish) Mariterm AB,Gothenburg. Report for Swedish Maritime Administration.
Motor Ship (2002) ‘NOx on the slide’, The Motor Ship, October 2002, p 4.
Sjöbris A., Flodström E. and Behm, E. G. W. (2001) ‘Emissions from ships in the North Sea,Baltic Sea and for Swedish traffic year 2000’ (In Swedish) Mariterm AB, Gothenburg. Reportfor Swedish Maritime Administration.
Swedish Environmental Protection Agency (1992) ’Environmental influence of pleasure craft,fishing boats and supply vessels’ (in Swedish) Rapport 3993.
Vis. (2003) Viswa Lab Corporation / Bunker World, USA. Personal communication 2003-10-25.
Appendices
Appendix 1: Emission factors for ships, year 2002
Appendix 2: Emission factors for ships, year 2001
Appendix 3: Swedish marine fuel sales data for 1990-2002
Appendix 4: Reduction profiles for NOx reduction techniques
Appendix 5: Example of calculation of NOx emission factor.
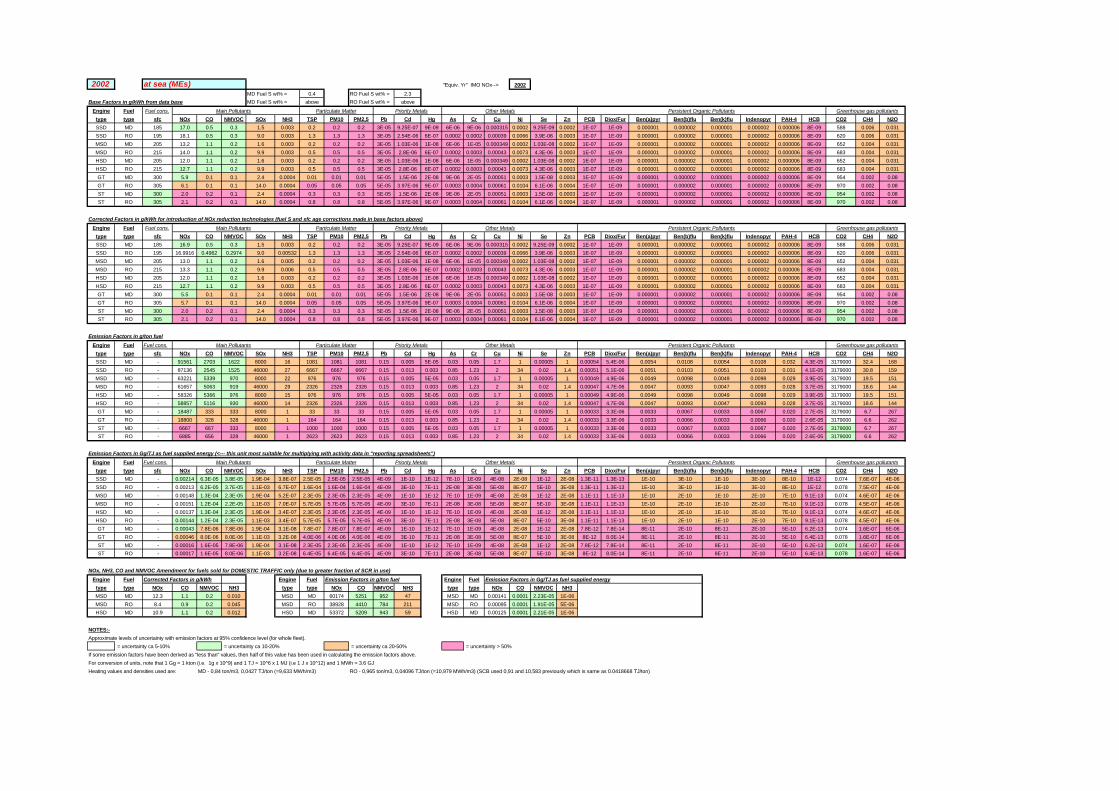
2002 at sea (MEs) "Equiv. Yr" IMO NOx--> 2002
MD Fuel S wt% = 0.4 RO Fuel S wt% = 2.3
Base Factors in g/kWh from data base MD Fuel S wt% = above RO Fuel S wt% = above
Engine Fuel Fuel cons. Main Pollutants Particulate Matter Priority Metals Other Metals Persistent Organic Pollutants Greenhouse gas pollutants
type type sfc NOx CO NMVOC SOx NH3 TSP PM10 PM2,5 Pb Cd Hg As Cr Cu Ni Se Zn PCB Diox/Fur Ben(a)pyr Ben(b)flu Ben(k)flu Indenopyr PAH-4 HCB CO2 CH4 N2O
SSD MD 185 17.0 0.5 0.3 1.5 0.003 0.2 0.2 0.2 3E-05 9.25E-07 9E-09 6E-06 9E-06 0.000315 0.0002 9.25E-09 0.0002 1E-07 1E-09 0.000001 0.000002 0.000001 0.000002 0.000006 8E-09 588 0.006 0.031
SSD RO 195 18.1 0.5 0.3 9.0 0.003 1.3 1.3 1.3 3E-05 2.54E-06 6E-07 0.0002 0.0002 0.00039 0.0066 3.9E-06 0.0003 1E-07 1E-09 0.000001 0.000002 0.000001 0.000002 0.000006 8E-09 620 0.006 0.031
MSD MD 205 13.2 1.1 0.2 1.6 0.003 0.2 0.2 0.2 3E-05 1.03E-06 1E-08 6E-06 1E-05 0.000349 0.0002 1.03E-08 0.0002 1E-07 1E-09 0.000001 0.000002 0.000001 0.000002 0.000006 8E-09 652 0.004 0.031
MSD RO 215 14.0 1.1 0.2 9.9 0.003 0.5 0.5 0.5 3E-05 2.8E-06 6E-07 0.0002 0.0003 0.00043 0.0073 4.3E-06 0.0003 1E-07 1E-09 0.000001 0.000002 0.000001 0.000002 0.000006 8E-09 683 0.004 0.031
HSD MD 205 12.0 1.1 0.2 1.6 0.003 0.2 0.2 0.2 3E-05 1.03E-06 1E-08 6E-06 1E-05 0.000349 0.0002 1.03E-08 0.0002 1E-07 1E-09 0.000001 0.000002 0.000001 0.000002 0.000006 8E-09 652 0.004 0.031
HSD RO 215 12.7 1.1 0.2 9.9 0.003 0.5 0.5 0.5 3E-05 2.8E-06 6E-07 0.0002 0.0003 0.00043 0.0073 4.3E-06 0.0003 1E-07 1E-09 0.000001 0.000002 0.000001 0.000002 0.000006 8E-09 683 0.004 0.031
GT MD 300 5.9 0.1 0.1 2.4 0.0004 0.01 0.01 0.01 5E-05 1.5E-06 2E-08 9E-06 2E-05 0.00051 0.0003 1.5E-08 0.0003 1E-07 1E-09 0.000001 0.000002 0.000001 0.000002 0.000006 8E-09 954 0.002 0.08
GT RO 305 6.1 0.1 0.1 14.0 0.0004 0.05 0.05 0.05 5E-05 3.97E-06 9E-07 0.0003 0.0004 0.00061 0.0104 6.1E-06 0.0004 1E-07 1E-09 0.000001 0.000002 0.000001 0.000002 0.000006 8E-09 970 0.002 0.08
ST MD 300 2.0 0.2 0.1 2.4 0.0004 0.3 0.3 0.3 5E-05 1.5E-06 2E-08 9E-06 2E-05 0.00051 0.0003 1.5E-08 0.0003 1E-07 1E-09 0.000001 0.000002 0.000001 0.000002 0.000006 8E-09 954 0.002 0.08
ST RO 305 2.1 0.2 0.1 14.0 0.0004 0.8 0.8 0.8 5E-05 3.97E-06 9E-07 0.0003 0.0004 0.00061 0.0104 6.1E-06 0.0004 1E-07 1E-09 0.000001 0.000002 0.000001 0.000002 0.000006 8E-09 970 0.002 0.08
Corrected Factors in g/kWh for introduction of NOx reduction technologies (fuel S and sfc age corrections made in base factors above)
Engine Fuel Fuel cons. Main Pollutants Particulate Matter Priority Metals Other Metals Persistent Organic Pollutants Greenhouse gas pollutants
type type sfc NOx CO NMVOC SOx NH3 TSP PM10 PM2,5 Pb Cd Hg As Cr Cu Ni Se Zn PCB Diox/Fur Ben(a)pyr Ben(b)flu Ben(k)flu Indenopyr PAH-4 HCB CO2 CH4 N2O
SSD MD 185 16.9 0.5 0.3 1.5 0.003 0.2 0.2 0.2 3E-05 9.25E-07 9E-09 6E-06 9E-06 0.000315 0.0002 9.25E-09 0.0002 1E-07 1E-09 0.000001 0.000002 0.000001 0.000002 0.000006 8E-09 588 0.006 0.031
SSD RO 195 16.9916 0.4962 0.2974 9.0 0.00532 1.3 1.3 1.3 3E-05 2.54E-06 6E-07 0.0002 0.0002 0.00039 0.0066 3.9E-06 0.0003 1E-07 1E-09 0.000001 0.000002 0.000001 0.000002 0.000006 8E-09 620 0.006 0.031
MSD MD 205 13.0 1.1 0.2 1.6 0.005 0.2 0.2 0.2 3E-05 1.03E-06 1E-08 6E-06 1E-05 0.000349 0.0002 1.03E-08 0.0002 1E-07 1E-09 0.000001 0.000002 0.000001 0.000002 0.000006 8E-09 652 0.004 0.031
MSD RO 215 13.3 1.1 0.2 9.9 0.006 0.5 0.5 0.5 3E-05 2.8E-06 6E-07 0.0002 0.0003 0.00043 0.0073 4.3E-06 0.0003 1E-07 1E-09 0.000001 0.000002 0.000001 0.000002 0.000006 8E-09 683 0.004 0.031
HSD MD 205 12.0 1.1 0.2 1.6 0.003 0.2 0.2 0.2 3E-05 1.03E-06 1E-08 6E-06 1E-05 0.000349 0.0002 1.03E-08 0.0002 1E-07 1E-09 0.000001 0.000002 0.000001 0.000002 0.000006 8E-09 652 0.004 0.031
HSD RO 215 12.7 1.1 0.2 9.9 0.003 0.5 0.5 0.5 3E-05 2.8E-06 6E-07 0.0002 0.0003 0.00043 0.0073 4.3E-06 0.0003 1E-07 1E-09 0.000001 0.000002 0.000001 0.000002 0.000006 8E-09 683 0.004 0.031
GT MD 300 5.5 0.1 0.1 2.4 0.0004 0.01 0.01 0.01 5E-05 1.5E-06 2E-08 9E-06 2E-05 0.00051 0.0003 1.5E-08 0.0003 1E-07 1E-09 0.000001 0.000002 0.000001 0.000002 0.000006 8E-09 954 0.002 0.08
GT RO 305 5.7 0.1 0.1 14.0 0.0004 0.05 0.05 0.05 5E-05 3.97E-06 9E-07 0.0003 0.0004 0.00061 0.0104 6.1E-06 0.0004 1E-07 1E-09 0.000001 0.000002 0.000001 0.000002 0.000006 8E-09 970 0.002 0.08
ST MD 300 2.0 0.2 0.1 2.4 0.0004 0.3 0.3 0.3 5E-05 1.5E-06 2E-08 9E-06 2E-05 0.00051 0.0003 1.5E-08 0.0003 1E-07 1E-09 0.000001 0.000002 0.000001 0.000002 0.000006 8E-09 954 0.002 0.08
ST RO 305 2.1 0.2 0.1 14.0 0.0004 0.8 0.8 0.8 5E-05 3.97E-06 9E-07 0.0003 0.0004 0.00061 0.0104 6.1E-06 0.0004 1E-07 1E-09 0.000001 0.000002 0.000001 0.000002 0.000006 8E-09 970 0.002 0.08
Emission Factors in g/ton fuel
Engine Fuel Fuel cons. Main Pollutants Particulate Matter Priority Metals Other Metals Persistent Organic Pollutants Greenhouse gas pollutants
type type sfc NOx CO NMVOC SOx NH3 TSP PM10 PM2,5 Pb Cd Hg As Cr Cu Ni Se Zn PCB Diox/Fur Ben(a)pyr Ben(b)flu Ben(k)flu Indenopyr PAH-4 HCB CO2 CH4 N2O
SSD MD - 91561 2703 1622 8000 16 1081 1081 1081 0.15 0.005 5E-05 0.03 0.05 1.7 1 0.00005 1 0.00054 5.4E-06 0.0054 0.0108 0.0054 0.0108 0.032 4.3E-05 3179000 32.4 168
SSD RO - 87136 2545 1525 46000 27 6667 6667 6667 0.15 0.013 0.003 0.85 1.23 2 34 0.02 1.4 0.00051 5.1E-06 0.0051 0.0103 0.0051 0.0103 0.031 4.1E-05 3179000 30.8 159
MSD MD - 63221 5339 970 8000 22 976 976 976 0.15 0.005 5E-05 0.03 0.05 1.7 1 0.00005 1 0.00049 4.9E-06 0.0049 0.0098 0.0049 0.0098 0.029 3.9E-05 3179000 19.5 151
MSD RO - 61657 5063 919 46000 29 2326 2326 2326 0.15 0.013 0.003 0.85 1.23 2 34 0.02 1.4 0.00047 4.7E-06 0.0047 0.0093 0.0047 0.0093 0.028 3.7E-05 3179000 18.6 144
HSD MD - 58326 5366 976 8000 15 976 976 976 0.15 0.005 5E-05 0.03 0.05 1.7 1 0.00005 1 0.00049 4.9E-06 0.0049 0.0098 0.0049 0.0098 0.029 3.9E-05 3179000 19.5 151
HSD RO - 58857 5116 930 46000 14 2326 2326 2326 0.15 0.013 0.003 0.85 1.23 2 34 0.02 1.4 0.00047 4.7E-06 0.0047 0.0093 0.0047 0.0093 0.028 3.7E-05 3179000 18.6 144
GT MD - 18487 333 333 8000 1 33 33 33 0.15 0.005 5E-05 0.03 0.05 1.7 1 0.00005 1 0.00033 3.3E-06 0.0033 0.0067 0.0033 0.0067 0.020 2.7E-05 3179000 6.7 267
GT RO - 18800 328 328 46000 1 164 164 164 0.15 0.013 0.003 0.85 1.23 2 34 0.02 1.4 0.00033 3.3E-06 0.0033 0.0066 0.0033 0.0066 0.020 2.6E-05 3179000 6.6 262
ST MD - 6667 667 333 8000 1 1000 1000 1000 0.15 0.005 5E-05 0.03 0.05 1.7 1 0.00005 1 0.00033 3.3E-06 0.0033 0.0067 0.0033 0.0067 0.020 2.7E-05 3179000 6.7 267
ST RO - 6885 656 328 46000 1 2623 2623 2623 0.15 0.013 0.003 0.85 1.23 2 34 0.02 1.4 0.00033 3.3E-06 0.0033 0.0066 0.0033 0.0066 0.020 2.6E-05 3179000 6.6 262
Emission Factors in Gg/TJ as fuel supplied energy (<--- this unit most suitable for multiplying with activity data in "reporting spreadsheets")
Engine Fuel Fuel cons. Main Pollutants Particulate Matter Priority Metals Other Metals Persistent Organic Pollutants Greenhouse gas pollutants
type type sfc NOx CO NMVOC SOx NH3 TSP PM10 PM2,5 Pb Cd Hg As Cr Cu Ni Se Zn PCB Diox/Fur Ben(a)pyr Ben(b)flu Ben(k)flu Indenopyr PAH-4 HCB CO2 CH4 N2O
SSD MD - 0.00214 6.3E-05 3.8E-05 1.9E-04 3.8E-07 2.5E-05 2.5E-05 2.5E-05 4E-09 1E-10 1E-12 7E-10 1E-09 4E-08 2E-08 1E-12 2E-08 1.3E-11 1.3E-13 1E-10 3E-10 1E-10 3E-10 8E-10 1E-12 0.074 7.6E-07 4E-06
SSD RO - 0.00213 6.2E-05 3.7E-05 1.1E-03 6.7E-07 1.6E-04 1.6E-04 1.6E-04 4E-09 3E-10 7E-11 2E-08 3E-08 5E-08 8E-07 5E-10 3E-08 1.3E-11 1.3E-13 1E-10 3E-10 1E-10 3E-10 8E-10 1E-12 0.078 7.5E-07 4E-06
MSD MD - 0.00148 1.3E-04 2.3E-05 1.9E-04 5.2E-07 2.3E-05 2.3E-05 2.3E-05 4E-09 1E-10 1E-12 7E-10 1E-09 4E-08 2E-08 1E-12 2E-08 1.1E-11 1.1E-13 1E-10 2E-10 1E-10 2E-10 7E-10 9.1E-13 0.074 4.6E-07 4E-06
MSD RO - 0.00151 1.2E-04 2.2E-05 1.1E-03 7.0E-07 5.7E-05 5.7E-05 5.7E-05 4E-09 3E-10 7E-11 2E-08 3E-08 5E-08 8E-07 5E-10 3E-08 1.1E-11 1.1E-13 1E-10 2E-10 1E-10 2E-10 7E-10 9.1E-13 0.078 4.5E-07 4E-06
HSD MD - 0.00137 1.3E-04 2.3E-05 1.9E-04 3.4E-07 2.3E-05 2.3E-05 2.3E-05 4E-09 1E-10 1E-12 7E-10 1E-09 4E-08 2E-08 1E-12 2E-08 1.1E-11 1.1E-13 1E-10 2E-10 1E-10 2E-10 7E-10 9.1E-13 0.074 4.6E-07 4E-06
HSD RO - 0.00144 1.2E-04 2.3E-05 1.1E-03 3.4E-07 5.7E-05 5.7E-05 5.7E-05 4E-09 3E-10 7E-11 2E-08 3E-08 5E-08 8E-07 5E-10 3E-08 1.1E-11 1.1E-13 1E-10 2E-10 1E-10 2E-10 7E-10 9.1E-13 0.078 4.5E-07 4E-06
GT MD - 0.00043 7.8E-06 7.8E-06 1.9E-04 3.1E-08 7.8E-07 7.8E-07 7.8E-07 4E-09 1E-10 1E-12 7E-10 1E-09 4E-08 2E-08 1E-12 2E-08 7.8E-12 7.8E-14 8E-11 2E-10 8E-11 2E-10 5E-10 6.2E-13 0.074 1.6E-07 6E-06
GT RO - 0.00046 8.0E-06 8.0E-06 1.1E-03 3.2E-08 4.0E-06 4.0E-06 4.0E-06 4E-09 3E-10 7E-11 2E-08 3E-08 5E-08 8E-07 5E-10 3E-08 8E-12 8.0E-14 8E-11 2E-10 8E-11 2E-10 5E-10 6.4E-13 0.078 1.6E-07 6E-06
ST MD - 0.00016 1.6E-05 7.8E-06 1.9E-04 3.1E-08 2.3E-05 2.3E-05 2.3E-05 4E-09 1E-10 1E-12 7E-10 1E-09 4E-08 2E-08 1E-12 2E-08 7.8E-12 7.8E-14 8E-11 2E-10 8E-11 2E-10 5E-10 6.2E-13 0.074 1.6E-07 6E-06
ST RO - 0.00017 1.6E-05 8.0E-06 1.1E-03 3.2E-08 6.4E-05 6.4E-05 6.4E-05 4E-09 3E-10 7E-11 2E-08 3E-08 5E-08 8E-07 5E-10 3E-08 8E-12 8.0E-14 8E-11 2E-10 8E-11 2E-10 5E-10 6.4E-13 0.078 1.6E-07 6E-06
NOx, NH3, CO and NMVOC Amendment for fuels sold for DOMESTIC TRAFFIC only (due to greater fraction of SCR in use)
Engine Fuel Corrected Factors in g/kWh Engine Fuel Emission Factors in g/ton fuel Engine Fuel Emission Factors in Gg/TJ as fuel supplied energy
type type NOx CO NMVOC NH3 type type NOx CO NMVOC NH3 type type NOx CO NMVOC NH3
MSD MD 12.3 1.1 0.2 0.010 MSD MD 60174 5251 952 47 MSD MD 0.00141 0.0001 2.23E-05 1E-06
MSD RO 8.4 0.9 0.2 0.045 MSD RO 38928 4410 784 211 MSD RO 0.00095 0.0001 1.91E-05 5E-06
HSD MD 10.9 1.1 0.2 0.012 HSD MD 53372 5209 943 59 HSD MD 0.00125 0.0001 2.21E-05 1E-06
NOTES:-
Approximate levels of uncertainty with emission factors at 95% confidence level (for whole fleet).
= uncertainty ca 5-10% = uncertainty ca 10-20% = uncertainty ca 20-50% = uncertainty > 50%
If some emission factors have been derived as "less than" values, then half of this value has been used in calculating the emission factors above.
For conversion of units, note that 1 Gg = 1 kton (i.e. 1g x 10^9) and 1 TJ = 10^6 x 1 MJ (i.e 1 J x 10^12) and 1 MWh = 3.6 GJ
Heating values and densities used are: MD - 0,84 ton/m3, 0,0427 TJ/ton (=9,633 MWh/m3) RO - 0,965 ton/m3, 0,04096 TJ/ton (=10,979 MWh/m3) (SCB used 0,91 and 10,583 previously which is same as 0.0418668 TJ/ton)
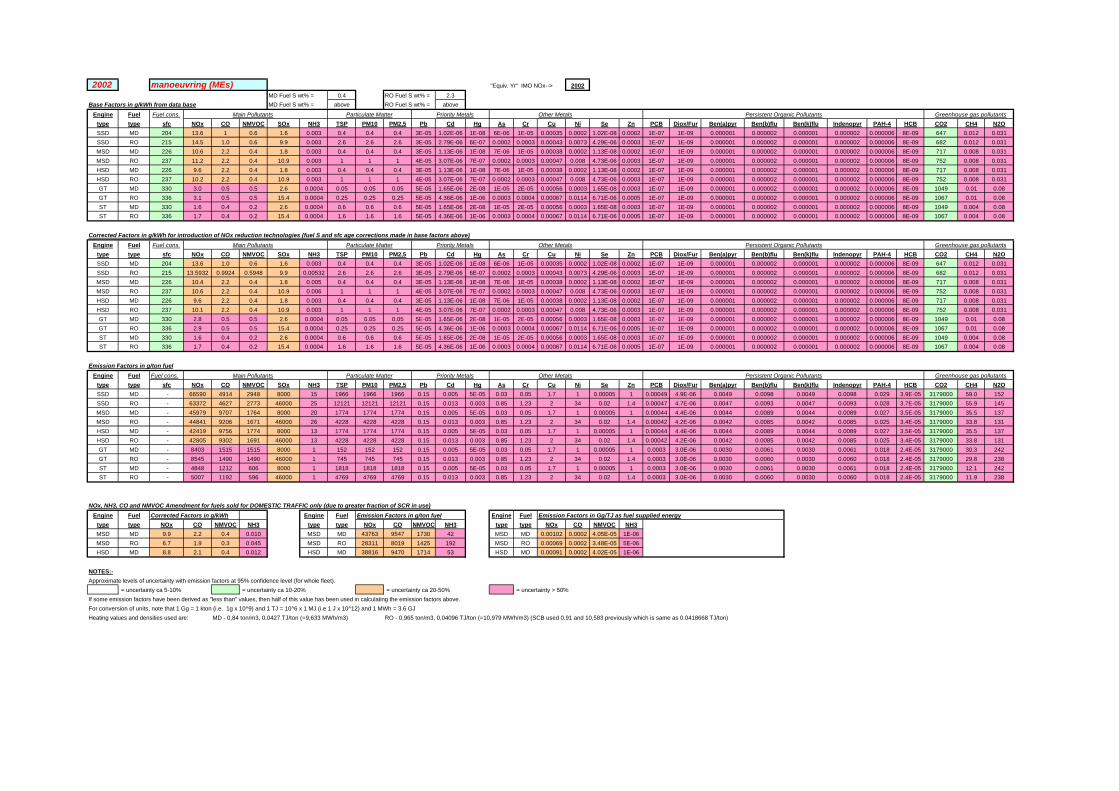
2002 manoeuvring (MEs) "Equiv. Yr" IMO NOx--> 2002
MD Fuel S wt% = 0.4 RO Fuel S wt% = 2.3
Base Factors in g/kWh from data base MD Fuel S wt% = above RO Fuel S wt% = above
Engine Fuel Fuel cons. Main Pollutants Particulate Matter Priority Metals Other Metals Persistent Organic Pollutants Greenhouse gas pollutants
type type sfc NOx CO NMVOC SOx NH3 TSP PM10 PM2,5 Pb Cd Hg As Cr Cu Ni Se Zn PCB Diox/Fur Ben(a)pyr Ben(b)flu Ben(k)flu Indenopyr PAH-4 HCB CO2 CH4 N2O
SSD MD 204 13.6 1 0.6 1.6 0.003 0.4 0.4 0.4 3E-05 1.02E-06 1E-08 6E-06 1E-05 0.00035 0.0002 1.02E-08 0.0002 1E-07 1E-09 0.000001 0.000002 0.000001 0.000002 0.000006 8E-09 647 0.012 0.031
SSD RO 215 14.5 1.0 0.6 9.9 0.003 2.6 2.6 2.6 3E-05 2.79E-06 6E-07 0.0002 0.0003 0.00043 0.0073 4.29E-06 0.0003 1E-07 1E-09 0.000001 0.000002 0.000001 0.000002 0.000006 8E-09 682 0.012 0.031
MSD MD 226 10.6 2.2 0.4 1.8 0.003 0.4 0.4 0.4 3E-05 1.13E-06 1E-08 7E-06 1E-05 0.00038 0.0002 1.13E-08 0.0002 1E-07 1E-09 0.000001 0.000002 0.000001 0.000002 0.000006 8E-09 717 0.008 0.031
MSD RO 237 11.2 2.2 0.4 10.9 0.003 1 1 1 4E-05 3.07E-06 7E-07 0.0002 0.0003 0.00047 0.008 4.73E-06 0.0003 1E-07 1E-09 0.000001 0.000002 0.000001 0.000002 0.000006 8E-09 752 0.008 0.031
HSD MD 226 9.6 2.2 0.4 1.8 0.003 0.4 0.4 0.4 3E-05 1.13E-06 1E-08 7E-06 1E-05 0.00038 0.0002 1.13E-08 0.0002 1E-07 1E-09 0.000001 0.000002 0.000001 0.000002 0.000006 8E-09 717 0.008 0.031
HSD RO 237 10.2 2.2 0.4 10.9 0.003 1 1 1 4E-05 3.07E-06 7E-07 0.0002 0.0003 0.00047 0.008 4.73E-06 0.0003 1E-07 1E-09 0.000001 0.000002 0.000001 0.000002 0.000006 8E-09 752 0.008 0.031
GT MD 330 3.0 0.5 0.5 2.6 0.0004 0.05 0.05 0.05 5E-05 1.65E-06 2E-08 1E-05 2E-05 0.00056 0.0003 1.65E-08 0.0003 1E-07 1E-09 0.000001 0.000002 0.000001 0.000002 0.000006 8E-09 1049 0.01 0.08
GT RO 336 3.1 0.5 0.5 15.4 0.0004 0.25 0.25 0.25 5E-05 4.36E-06 1E-06 0.0003 0.0004 0.00067 0.0114 6.71E-06 0.0005 1E-07 1E-09 0.000001 0.000002 0.000001 0.000002 0.000006 8E-09 1067 0.01 0.08
ST MD 330 1.6 0.4 0.2 2.6 0.0004 0.6 0.6 0.6 5E-05 1.65E-06 2E-08 1E-05 2E-05 0.00056 0.0003 1.65E-08 0.0003 1E-07 1E-09 0.000001 0.000002 0.000001 0.000002 0.000006 8E-09 1049 0.004 0.08
ST RO 336 1.7 0.4 0.2 15.4 0.0004 1.6 1.6 1.6 5E-05 4.36E-06 1E-06 0.0003 0.0004 0.00067 0.0114 6.71E-06 0.0005 1E-07 1E-09 0.000001 0.000002 0.000001 0.000002 0.000006 8E-09 1067 0.004 0.08
Corrected Factors in g/kWh for introduction of NOx reduction technologies (fuel S and sfc age corrections made in base factors above)
Engine Fuel Fuel cons. Main Pollutants Particulate Matter Priority Metals Other Metals Persistent Organic Pollutants Greenhouse gas pollutants
type type sfc NOx CO NMVOC SOx NH3 TSP PM10 PM2,5 Pb Cd Hg As Cr Cu Ni Se Zn PCB Diox/Fur Ben(a)pyr Ben(b)flu Ben(k)flu Indenopyr PAH-4 HCB CO2 CH4 N2O
SSD MD 204 13.6 1.0 0.6 1.6 0.003 0.4 0.4 0.4 3E-05 1.02E-06 1E-08 6E-06 1E-05 0.00035 0.0002 1.02E-08 0.0002 1E-07 1E-09 0.000001 0.000002 0.000001 0.000002 0.000006 8E-09 647 0.012 0.031
SSD RO 215 13.5932 0.9924 0.5948 9.9 0.00532 2.6 2.6 2.6 3E-05 2.79E-06 6E-07 0.0002 0.0003 0.00043 0.0073 4.29E-06 0.0003 1E-07 1E-09 0.000001 0.000002 0.000001 0.000002 0.000006 8E-09 682 0.012 0.031
MSD MD 226 10.4 2.2 0.4 1.8 0.005 0.4 0.4 0.4 3E-05 1.13E-06 1E-08 7E-06 1E-05 0.00038 0.0002 1.13E-08 0.0002 1E-07 1E-09 0.000001 0.000002 0.000001 0.000002 0.000006 8E-09 717 0.008 0.031
MSD RO 237 10.6 2.2 0.4 10.9 0.006 1 1 1 4E-05 3.07E-06 7E-07 0.0002 0.0003 0.00047 0.008 4.73E-06 0.0003 1E-07 1E-09 0.000001 0.000002 0.000001 0.000002 0.000006 8E-09 752 0.008 0.031
HSD MD 226 9.6 2.2 0.4 1.8 0.003 0.4 0.4 0.4 3E-05 1.13E-06 1E-08 7E-06 1E-05 0.00038 0.0002 1.13E-08 0.0002 1E-07 1E-09 0.000001 0.000002 0.000001 0.000002 0.000006 8E-09 717 0.008 0.031
HSD RO 237 10.1 2.2 0.4 10.9 0.003 1 1 1 4E-05 3.07E-06 7E-07 0.0002 0.0003 0.00047 0.008 4.73E-06 0.0003 1E-07 1E-09 0.000001 0.000002 0.000001 0.000002 0.000006 8E-09 752 0.008 0.031
GT MD 330 2.8 0.5 0.5 2.6 0.0004 0.05 0.05 0.05 5E-05 1.65E-06 2E-08 1E-05 2E-05 0.00056 0.0003 1.65E-08 0.0003 1E-07 1E-09 0.000001 0.000002 0.000001 0.000002 0.000006 8E-09 1049 0.01 0.08
GT RO 336 2.9 0.5 0.5 15.4 0.0004 0.25 0.25 0.25 5E-05 4.36E-06 1E-06 0.0003 0.0004 0.00067 0.0114 6.71E-06 0.0005 1E-07 1E-09 0.000001 0.000002 0.000001 0.000002 0.000006 8E-09 1067 0.01 0.08
ST MD 330 1.6 0.4 0.2 2.6 0.0004 0.6 0.6 0.6 5E-05 1.65E-06 2E-08 1E-05 2E-05 0.00056 0.0003 1.65E-08 0.0003 1E-07 1E-09 0.000001 0.000002 0.000001 0.000002 0.000006 8E-09 1049 0.004 0.08
ST RO 336 1.7 0.4 0.2 15.4 0.0004 1.6 1.6 1.6 5E-05 4.36E-06 1E-06 0.0003 0.0004 0.00067 0.0114 6.71E-06 0.0005 1E-07 1E-09 0.000001 0.000002 0.000001 0.000002 0.000006 8E-09 1067 0.004 0.08
Emission Factors in g/ton fuel
Engine Fuel Fuel cons. Main Pollutants Particulate Matter Priority Metals Other Metals Persistent Organic Pollutants Greenhouse gas pollutants
type type sfc NOx CO NMVOC SOx NH3 TSP PM10 PM2,5 Pb Cd Hg As Cr Cu Ni Se Zn PCB Diox/Fur Ben(a)pyr Ben(b)flu Ben(k)flu Indenopyr PAH-4 HCB CO2 CH4 N2O
SSD MD - 66590 4914 2948 8000 15 1966 1966 1966 0.15 0.005 5E-05 0.03 0.05 1.7 1 0.00005 1 0.00049 4.9E-06 0.0049 0.0098 0.0049 0.0098 0.029 3.9E-05 3179000 59.0 152
SSD RO - 63372 4627 2773 46000 25 12121 12121 12121 0.15 0.013 0.003 0.85 1.23 2 34 0.02 1.4 0.00047 4.7E-06 0.0047 0.0093 0.0047 0.0093 0.028 3.7E-05 3179000 55.9 145
MSD MD - 45979 9707 1764 8000 20 1774 1774 1774 0.15 0.005 5E-05 0.03 0.05 1.7 1 0.00005 1 0.00044 4.4E-06 0.0044 0.0089 0.0044 0.0089 0.027 3.5E-05 3179000 35.5 137
MSD RO - 44841 9206 1671 46000 26 4228 4228 4228 0.15 0.013 0.003 0.85 1.23 2 34 0.02 1.4 0.00042 4.2E-06 0.0042 0.0085 0.0042 0.0085 0.025 3.4E-05 3179000 33.8 131
HSD MD - 42419 9756 1774 8000 13 1774 1774 1774 0.15 0.005 5E-05 0.03 0.05 1.7 1 0.00005 1 0.00044 4.4E-06 0.0044 0.0089 0.0044 0.0089 0.027 3.5E-05 3179000 35.5 137
HSD RO - 42805 9302 1691 46000 13 4228 4228 4228 0.15 0.013 0.003 0.85 1.23 2 34 0.02 1.4 0.00042 4.2E-06 0.0042 0.0085 0.0042 0.0085 0.025 3.4E-05 3179000 33.8 131
GT MD - 8403 1515 1515 8000 1 152 152 152 0.15 0.005 5E-05 0.03 0.05 1.7 1 0.00005 1 0.0003 3.0E-06 0.0030 0.0061 0.0030 0.0061 0.018 2.4E-05 3179000 30.3 242
GT RO - 8545 1490 1490 46000 1 745 745 745 0.15 0.013 0.003 0.85 1.23 2 34 0.02 1.4 0.0003 3.0E-06 0.0030 0.0060 0.0030 0.0060 0.018 2.4E-05 3179000 29.8 238
ST MD - 4848 1212 606 8000 1 1818 1818 1818 0.15 0.005 5E-05 0.03 0.05 1.7 1 0.00005 1 0.0003 3.0E-06 0.0030 0.0061 0.0030 0.0061 0.018 2.4E-05 3179000 12.1 242
ST RO - 5007 1192 596 46000 1 4769 4769 4769 0.15 0.013 0.003 0.85 1.23 2 34 0.02 1.4 0.0003 3.0E-06 0.0030 0.0060 0.0030 0.0060 0.018 2.4E-05 3179000 11.9 238
NOx, NH3, CO and NMVOC Amendment for fuels sold for DOMESTIC TRAFFIC only (due to greater fraction of SCR in use)
Engine Fuel Corrected Factors in g/kWh Engine Fuel Emission Factors in g/ton fuel Engine Fuel Emission Factors in Gg/TJ as fuel supplied energy
type type NOx CO NMVOC NH3 type type NOx CO NMVOC NH3 type type NOx CO NMVOC NH3
MSD MD 9.9 2.2 0.4 0.010 MSD MD 43763 9547 1730 42 MSD MD 0.00102 0.0002 4.05E-05 1E-06
MSD RO 6.7 1.9 0.3 0.045 MSD RO 28311 8019 1425 192 MSD RO 0.00069 0.0002 3.48E-05 5E-06
HSD MD 8.8 2.1 0.4 0.012 HSD MD 38816 9470 1714 53 HSD MD 0.00091 0.0002 4.02E-05 1E-06
NOTES:-
Approximate levels of uncertainty with emission factors at 95% confidence level (for whole fleet).
= uncertainty ca 5-10% = uncertainty ca 10-20% = uncertainty ca 20-50% = uncertainty > 50%
If some emission factors have been derived as "less than" values, then half of this value has been used in calculating the emission factors above.
For conversion of units, note that 1 Gg = 1 kton (i.e. 1g x 10^9) and 1 TJ = 10^6 x 1 MJ (i.e 1 J x 10^12) and 1 MWh = 3.6 GJ
Heating values and densities used are: MD - 0,84 ton/m3, 0,0427 TJ/ton (=9,633 MWh/m3) RO - 0,965 ton/m3, 0,04096 TJ/ton (=10,979 MWh/m3) (SCB used 0,91 and 10,583 previously which is same as 0.0418668 TJ/ton)
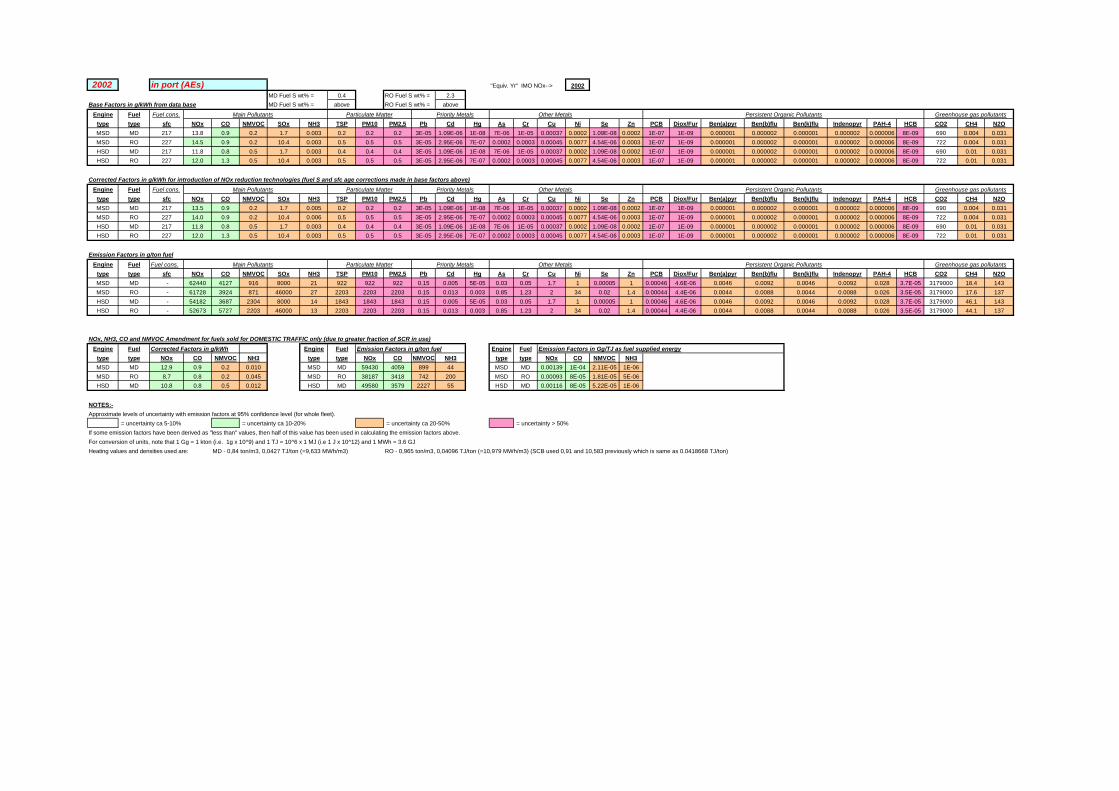
2002 in port (AEs) "Equiv. Yr" IMO NOx--> 2002
MD Fuel S wt% = 0.4 RO Fuel S wt% = 2.3
Base Factors in g/kWh from data base MD Fuel S wt% = above RO Fuel S wt% = above
Engine Fuel Fuel cons. Main Pollutants Particulate Matter Priority Metals Other Metals Persistent Organic Pollutants Greenhouse gas pollutants
type type sfc NOx CO NMVOC SOx NH3 TSP PM10 PM2,5 Pb Cd Hg As Cr Cu Ni Se Zn PCB Diox/Fur Ben(a)pyr Ben(b)flu Ben(k)flu Indenopyr PAH-4 HCB CO2 CH4 N2O
MSD MD 217 13.8 0.9 0.2 1.7 0.003 0.2 0.2 0.2 3E-05 1.09E-06 1E-08 7E-06 1E-05 0.00037 0.0002 1.09E-08 0.0002 1E-07 1E-09 0.000001 0.000002 0.000001 0.000002 0.000006 8E-09 690 0.004 0.031
MSD RO 227 14.5 0.9 0.2 10.4 0.003 0.5 0.5 0.5 3E-05 2.95E-06 7E-07 0.0002 0.0003 0.00045 0.0077 4.54E-06 0.0003 1E-07 1E-09 0.000001 0.000002 0.000001 0.000002 0.000006 8E-09 722 0.004 0.031
HSD MD 217 11.8 0.8 0.5 1.7 0.003 0.4 0.4 0.4 3E-05 1.09E-06 1E-08 7E-06 1E-05 0.00037 0.0002 1.09E-08 0.0002 1E-07 1E-09 0.000001 0.000002 0.000001 0.000002 0.000006 8E-09 690 0.01 0.031
HSD RO 227 12.0 1.3 0.5 10.4 0.003 0.5 0.5 0.5 3E-05 2.95E-06 7E-07 0.0002 0.0003 0.00045 0.0077 4.54E-06 0.0003 1E-07 1E-09 0.000001 0.000002 0.000001 0.000002 0.000006 8E-09 722 0.01 0.031
Corrected Factors in g/kWh for introduction of NOx reduction technologies (fuel S and sfc age corrections made in base factors above)
Engine Fuel Fuel cons. Main Pollutants Particulate Matter Priority Metals Other Metals Persistent Organic Pollutants Greenhouse gas pollutants
type type sfc NOx CO NMVOC SOx NH3 TSP PM10 PM2,5 Pb Cd Hg As Cr Cu Ni Se Zn PCB Diox/Fur Ben(a)pyr Ben(b)flu Ben(k)flu Indenopyr PAH-4 HCB CO2 CH4 N2O
MSD MD 217 13.5 0.9 0.2 1.7 0.005 0.2 0.2 0.2 3E-05 1.09E-06 1E-08 7E-06 1E-05 0.00037 0.0002 1.09E-08 0.0002 1E-07 1E-09 0.000001 0.000002 0.000001 0.000002 0.000006 8E-09 690 0.004 0.031
MSD RO 227 14.0 0.9 0.2 10.4 0.006 0.5 0.5 0.5 3E-05 2.95E-06 7E-07 0.0002 0.0003 0.00045 0.0077 4.54E-06 0.0003 1E-07 1E-09 0.000001 0.000002 0.000001 0.000002 0.000006 8E-09 722 0.004 0.031
HSD MD 217 11.8 0.8 0.5 1.7 0.003 0.4 0.4 0.4 3E-05 1.09E-06 1E-08 7E-06 1E-05 0.00037 0.0002 1.09E-08 0.0002 1E-07 1E-09 0.000001 0.000002 0.000001 0.000002 0.000006 8E-09 690 0.01 0.031
HSD RO 227 12.0 1.3 0.5 10.4 0.003 0.5 0.5 0.5 3E-05 2.95E-06 7E-07 0.0002 0.0003 0.00045 0.0077 4.54E-06 0.0003 1E-07 1E-09 0.000001 0.000002 0.000001 0.000002 0.000006 8E-09 722 0.01 0.031
Emission Factors in g/ton fuel
Engine Fuel Fuel cons. Main Pollutants Particulate Matter Priority Metals Other Metals Persistent Organic Pollutants Greenhouse gas pollutants
type type sfc NOx CO NMVOC SOx NH3 TSP PM10 PM2,5 Pb Cd Hg As Cr Cu Ni Se Zn PCB Diox/Fur Ben(a)pyr Ben(b)flu Ben(k)flu Indenopyr PAH-4 HCB CO2 CH4 N2O
MSD MD - 62440 4127 916 8000 21 922 922 922 0.15 0.005 5E-05 0.03 0.05 1.7 1 0.00005 1 0.00046 4.6E-06 0.0046 0.0092 0.0046 0.0092 0.028 3.7E-05 3179000 18.4 143
MSD RO - 61728 3924 871 46000 27 2203 2203 2203 0.15 0.013 0.003 0.85 1.23 2 34 0.02 1.4 0.00044 4.4E-06 0.0044 0.0088 0.0044 0.0088 0.026 3.5E-05 3179000 17.6 137
HSD MD - 54182 3687 2304 8000 14 1843 1843 1843 0.15 0.005 5E-05 0.03 0.05 1.7 1 0.00005 1 0.00046 4.6E-06 0.0046 0.0092 0.0046 0.0092 0.028 3.7E-05 3179000 46.1 143
HSD RO - 52673 5727 2203 46000 13 2203 2203 2203 0.15 0.013 0.003 0.85 1.23 2 34 0.02 1.4 0.00044 4.4E-06 0.0044 0.0088 0.0044 0.0088 0.026 3.5E-05 3179000 44.1 137
NOx, NH3, CO and NMVOC Amendment for fuels sold for DOMESTIC TRAFFIC only (due to greater fraction of SCR in use)
Engine Fuel Corrected Factors in g/kWh Engine Fuel Emission Factors in g/ton fuel Engine Fuel Emission Factors in Gg/TJ as fuel supplied energy
type type NOx CO NMVOC NH3 type type NOx CO NMVOC NH3 type type NOx CO NMVOC NH3
MSD MD 12.9 0.9 0.2 0.010 MSD MD 59430 4059 899 44 MSD MD 0.00139 1E-04 2.11E-05 1E-06
MSD RO 8.7 0.8 0.2 0.045 MSD RO 38187 3418 742 200 MSD RO 0.00093 8E-05 1.81E-05 5E-06
HSD MD 10.8 0.8 0.5 0.012 HSD MD 49580 3579 2227 55 HSD MD 0.00116 8E-05 5.22E-05 1E-06
NOTES:-
Approximate levels of uncertainty with emission factors at 95% confidence level (for whole fleet).
= uncertainty ca 5-10% = uncertainty ca 10-20% = uncertainty ca 20-50% = uncertainty > 50%
If some emission factors have been derived as "less than" values, then half of this value has been used in calculating the emission factors above.
For conversion of units, note that 1 Gg = 1 kton (i.e. 1g x 10^9) and 1 TJ = 10^6 x 1 MJ (i.e 1 J x 10^12) and 1 MWh = 3.6 GJ
Heating values and densities used are: MD - 0,84 ton/m3, 0,0427 TJ/ton (=9,633 MWh/m3) RO - 0,965 ton/m3, 0,04096 TJ/ton (=10,979 MWh/m3) (SCB used 0,91 and 10,583 previously which is same as 0.0418668 TJ/ton)
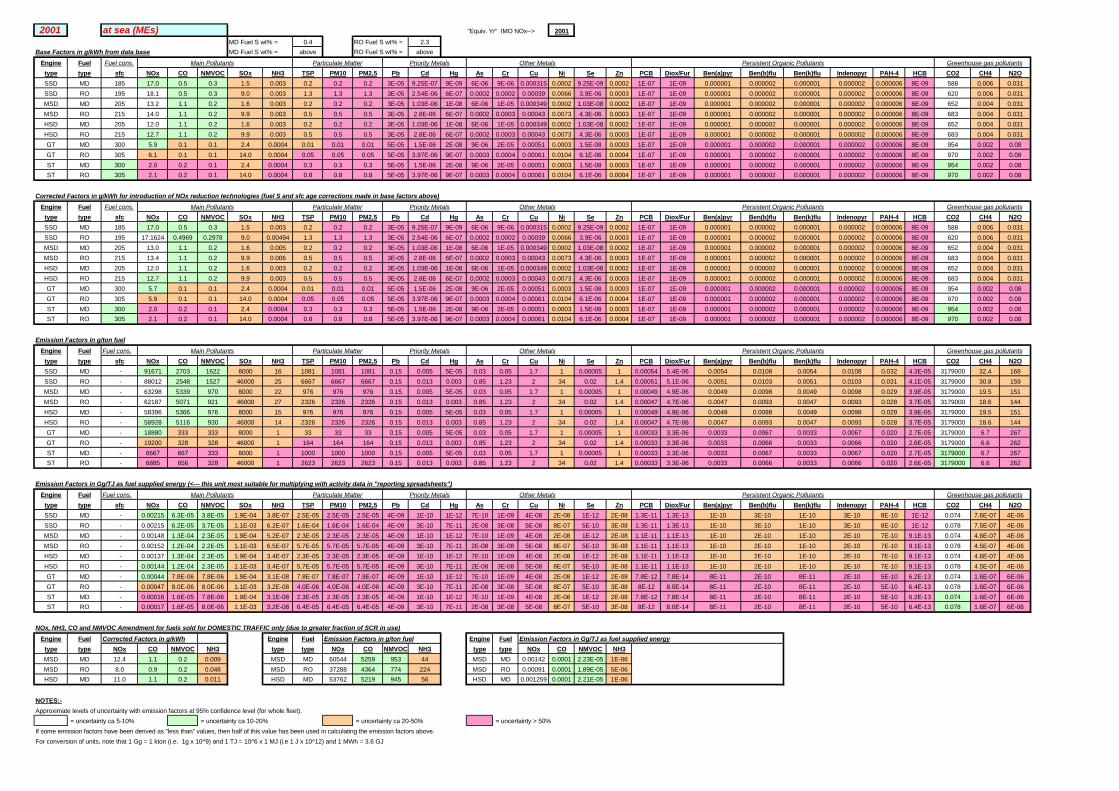
2001 at sea (MEs) "Equiv. Yr" IMO NOx--> 2001
MD Fuel S wt% = 0.4 RO Fuel S wt% = 2.3
Base Factors in g/kWh from data base MD Fuel S wt% = above RO Fuel S wt% = above
Engine Fuel Fuel cons. Main Pollutants Particulate Matter Priority Metals Other Metals Persistent Organic Pollutants Greenhouse gas pollutants
type type sfc NOx CO NMVOC SOx NH3 TSP PM10 PM2,5 Pb Cd Hg As Cr Cu Ni Se Zn PCB Diox/Fur Ben(a)pyr Ben(b)flu Ben(k)flu Indenopyr PAH-4 HCB CO2 CH4 N2O
SSD MD 185 17.0 0.5 0.3 1.5 0.003 0.2 0.2 0.2 3E-05 9.25E-07 9E-09 6E-06 9E-06 0.000315 0.0002 9.25E-09 0.0002 1E-07 1E-09 0.000001 0.000002 0.000001 0.000002 0.000006 8E-09 588 0.006 0.031
SSD RO 195 18.1 0.5 0.3 9.0 0.003 1.3 1.3 1.3 3E-05 2.54E-06 6E-07 0.0002 0.0002 0.00039 0.0066 3.9E-06 0.0003 1E-07 1E-09 0.000001 0.000002 0.000001 0.000002 0.000006 8E-09 620 0.006 0.031
MSD MD 205 13.2 1.1 0.2 1.6 0.003 0.2 0.2 0.2 3E-05 1.03E-06 1E-08 6E-06 1E-05 0.000349 0.0002 1.03E-08 0.0002 1E-07 1E-09 0.000001 0.000002 0.000001 0.000002 0.000006 8E-09 652 0.004 0.031
MSD RO 215 14.0 1.1 0.2 9.9 0.003 0.5 0.5 0.5 3E-05 2.8E-06 6E-07 0.0002 0.0003 0.00043 0.0073 4.3E-06 0.0003 1E-07 1E-09 0.000001 0.000002 0.000001 0.000002 0.000006 8E-09 683 0.004 0.031
HSD MD 205 12.0 1.1 0.2 1.6 0.003 0.2 0.2 0.2 3E-05 1.03E-06 1E-08 6E-06 1E-05 0.000349 0.0002 1.03E-08 0.0002 1E-07 1E-09 0.000001 0.000002 0.000001 0.000002 0.000006 8E-09 652 0.004 0.031
HSD RO 215 12.7 1.1 0.2 9.9 0.003 0.5 0.5 0.5 3E-05 2.8E-06 6E-07 0.0002 0.0003 0.00043 0.0073 4.3E-06 0.0003 1E-07 1E-09 0.000001 0.000002 0.000001 0.000002 0.000006 8E-09 683 0.004 0.031
GT MD 300 5.9 0.1 0.1 2.4 0.0004 0.01 0.01 0.01 5E-05 1.5E-06 2E-08 9E-06 2E-05 0.00051 0.0003 1.5E-08 0.0003 1E-07 1E-09 0.000001 0.000002 0.000001 0.000002 0.000006 8E-09 954 0.002 0.08
GT RO 305 6.1 0.1 0.1 14.0 0.0004 0.05 0.05 0.05 5E-05 3.97E-06 9E-07 0.0003 0.0004 0.00061 0.0104 6.1E-06 0.0004 1E-07 1E-09 0.000001 0.000002 0.000001 0.000002 0.000006 8E-09 970 0.002 0.08
ST MD 300 2.0 0.2 0.1 2.4 0.0004 0.3 0.3 0.3 5E-05 1.5E-06 2E-08 9E-06 2E-05 0.00051 0.0003 1.5E-08 0.0003 1E-07 1E-09 0.000001 0.000002 0.000001 0.000002 0.000006 8E-09 954 0.002 0.08
ST RO 305 2.1 0.2 0.1 14.0 0.0004 0.8 0.8 0.8 5E-05 3.97E-06 9E-07 0.0003 0.0004 0.00061 0.0104 6.1E-06 0.0004 1E-07 1E-09 0.000001 0.000002 0.000001 0.000002 0.000006 8E-09 970 0.002 0.08
Corrected Factors in g/kWh for introduction of NOx reduction technologies (fuel S and sfc age corrections made in base factors above)
Engine Fuel Fuel cons. Main Pollutants Particulate Matter Priority Metals Other Metals Persistent Organic Pollutants Greenhouse gas pollutants
type type sfc NOx CO NMVOC SOx NH3 TSP PM10 PM2,5 Pb Cd Hg As Cr Cu Ni Se Zn PCB Diox/Fur Ben(a)pyr Ben(b)flu Ben(k)flu Indenopyr PAH-4 HCB CO2 CH4 N2O
SSD MD 185 17.0 0.5 0.3 1.5 0.003 0.2 0.2 0.2 3E-05 9.25E-07 9E-09 6E-06 9E-06 0.000315 0.0002 9.25E-09 0.0002 1E-07 1E-09 0.000001 0.000002 0.000001 0.000002 0.000006 8E-09 588 0.006 0.031
SSD RO 195 17.1624 0.4969 0.2978 9.0 0.00494 1.3 1.3 1.3 3E-05 2.54E-06 6E-07 0.0002 0.0002 0.00039 0.0066 3.9E-06 0.0003 1E-07 1E-09 0.000001 0.000002 0.000001 0.000002 0.000006 8E-09 620 0.006 0.031
MSD MD 205 13.0 1.1 0.2 1.6 0.005 0.2 0.2 0.2 3E-05 1.03E-06 1E-08 6E-06 1E-05 0.000349 0.0002 1.03E-08 0.0002 1E-07 1E-09 0.000001 0.000002 0.000001 0.000002 0.000006 8E-09 652 0.004 0.031
MSD RO 215 13.4 1.1 0.2 9.9 0.006 0.5 0.5 0.5 3E-05 2.8E-06 6E-07 0.0002 0.0003 0.00043 0.0073 4.3E-06 0.0003 1E-07 1E-09 0.000001 0.000002 0.000001 0.000002 0.000006 8E-09 683 0.004 0.031
HSD MD 205 12.0 1.1 0.2 1.6 0.003 0.2 0.2 0.2 3E-05 1.03E-06 1E-08 6E-06 1E-05 0.000349 0.0002 1.03E-08 0.0002 1E-07 1E-09 0.000001 0.000002 0.000001 0.000002 0.000006 8E-09 652 0.004 0.031
HSD RO 215 12.7 1.1 0.2 9.9 0.003 0.5 0.5 0.5 3E-05 2.8E-06 6E-07 0.0002 0.0003 0.00043 0.0073 4.3E-06 0.0003 1E-07 1E-09 0.000001 0.000002 0.000001 0.000002 0.000006 8E-09 683 0.004 0.031
GT MD 300 5.7 0.1 0.1 2.4 0.0004 0.01 0.01 0.01 5E-05 1.5E-06 2E-08 9E-06 2E-05 0.00051 0.0003 1.5E-08 0.0003 1E-07 1E-09 0.000001 0.000002 0.000001 0.000002 0.000006 8E-09 954 0.002 0.08
GT RO 305 5.9 0.1 0.1 14.0 0.0004 0.05 0.05 0.05 5E-05 3.97E-06 9E-07 0.0003 0.0004 0.00061 0.0104 6.1E-06 0.0004 1E-07 1E-09 0.000001 0.000002 0.000001 0.000002 0.000006 8E-09 970 0.002 0.08
ST MD 300 2.0 0.2 0.1 2.4 0.0004 0.3 0.3 0.3 5E-05 1.5E-06 2E-08 9E-06 2E-05 0.00051 0.0003 1.5E-08 0.0003 1E-07 1E-09 0.000001 0.000002 0.000001 0.000002 0.000006 8E-09 954 0.002 0.08
ST RO 305 2.1 0.2 0.1 14.0 0.0004 0.8 0.8 0.8 5E-05 3.97E-06 9E-07 0.0003 0.0004 0.00061 0.0104 6.1E-06 0.0004 1E-07 1E-09 0.000001 0.000002 0.000001 0.000002 0.000006 8E-09 970 0.002 0.08
Emission Factors in g/ton fuel
Engine Fuel Fuel cons. Main Pollutants Particulate Matter Priority Metals Other Metals Persistent Organic Pollutants Greenhouse gas pollutants
type type sfc NOx CO NMVOC SOx NH3 TSP PM10 PM2,5 Pb Cd Hg As Cr Cu Ni Se Zn PCB Diox/Fur Ben(a)pyr Ben(b)flu Ben(k)flu Indenopyr PAH-4 HCB CO2 CH4 N2O
SSD MD - 91671 2703 1622 8000 16 1081 1081 1081 0.15 0.005 5E-05 0.03 0.05 1.7 1 0.00005 1 0.00054 5.4E-06 0.0054 0.0108 0.0054 0.0108 0.032 4.3E-05 3179000 32.4 168
SSD RO - 88012 2548 1527 46000 25 6667 6667 6667 0.15 0.013 0.003 0.85 1.23 2 34 0.02 1.4 0.00051 5.1E-06 0.0051 0.0103 0.0051 0.0103 0.031 4.1E-05 3179000 30.8 159
MSD MD - 63298 5339 970 8000 22 976 976 976 0.15 0.005 5E-05 0.03 0.05 1.7 1 0.00005 1 0.00049 4.9E-06 0.0049 0.0098 0.0049 0.0098 0.029 3.9E-05 3179000 19.5 151
MSD RO - 62187 5071 921 46000 27 2326 2326 2326 0.15 0.013 0.003 0.85 1.23 2 34 0.02 1.4 0.00047 4.7E-06 0.0047 0.0093 0.0047 0.0093 0.028 3.7E-05 3179000 18.6 144
HSD MD - 58396 5366 976 8000 15 976 976 976 0.15 0.005 5E-05 0.03 0.05 1.7 1 0.00005 1 0.00049 4.9E-06 0.0049 0.0098 0.0049 0.0098 0.029 3.9E-05 3179000 19.5 151
HSD RO - 58928 5116 930 46000 14 2326 2326 2326 0.15 0.013 0.003 0.85 1.23 2 34 0.02 1.4 0.00047 4.7E-06 0.0047 0.0093 0.0047 0.0093 0.028 3.7E-05 3179000 18.6 144
GT MD - 18880 333 333 8000 1 33 33 33 0.15 0.005 5E-05 0.03 0.05 1.7 1 0.00005 1 0.00033 3.3E-06 0.0033 0.0067 0.0033 0.0067 0.020 2.7E-05 3179000 6.7 267
GT RO - 19200 328 328 46000 1 164 164 164 0.15 0.013 0.003 0.85 1.23 2 34 0.02 1.4 0.00033 3.3E-06 0.0033 0.0066 0.0033 0.0066 0.020 2.6E-05 3179000 6.6 262
ST MD - 6667 667 333 8000 1 1000 1000 1000 0.15 0.005 5E-05 0.03 0.05 1.7 1 0.00005 1 0.00033 3.3E-06 0.0033 0.0067 0.0033 0.0067 0.020 2.7E-05 3179000 6.7 267
ST RO - 6885 656 328 46000 1 2623 2623 2623 0.15 0.013 0.003 0.85 1.23 2 34 0.02 1.4 0.00033 3.3E-06 0.0033 0.0066 0.0033 0.0066 0.020 2.6E-05 3179000 6.6 262
Emission Factors in Gg/TJ as fuel supplied energy (<--- this unit most suitable for multiplying with activity data in "reporting spreadsheets")
Engine Fuel Fuel cons. Main Pollutants Particulate Matter Priority Metals Other Metals Persistent Organic Pollutants Greenhouse gas pollutants
type type sfc NOx CO NMVOC SOx NH3 TSP PM10 PM2,5 Pb Cd Hg As Cr Cu Ni Se Zn PCB Diox/Fur Ben(a)pyr Ben(b)flu Ben(k)flu Indenopyr PAH-4 HCB CO2 CH4 N2O
SSD MD - 0.00215 6.3E-05 3.8E-05 1.9E-04 3.8E-07 2.5E-05 2.5E-05 2.5E-05 4E-09 1E-10 1E-12 7E-10 1E-09 4E-08 2E-08 1E-12 2E-08 1.3E-11 1.3E-13 1E-10 3E-10 1E-10 3E-10 8E-10 1E-12 0.074 7.6E-07 4E-06
SSD RO - 0.00215 6.2E-05 3.7E-05 1.1E-03 6.2E-07 1.6E-04 1.6E-04 1.6E-04 4E-09 3E-10 7E-11 2E-08 3E-08 5E-08 8E-07 5E-10 3E-08 1.3E-11 1.3E-13 1E-10 3E-10 1E-10 3E-10 8E-10 1E-12 0.078 7.5E-07 4E-06
MSD MD - 0.00148 1.3E-04 2.3E-05 1.9E-04 5.2E-07 2.3E-05 2.3E-05 2.3E-05 4E-09 1E-10 1E-12 7E-10 1E-09 4E-08 2E-08 1E-12 2E-08 1.1E-11 1.1E-13 1E-10 2E-10 1E-10 2E-10 7E-10 9.1E-13 0.074 4.6E-07 4E-06
MSD RO - 0.00152 1.2E-04 2.2E-05 1.1E-03 6.5E-07 5.7E-05 5.7E-05 5.7E-05 4E-09 3E-10 7E-11 2E-08 3E-08 5E-08 8E-07 5E-10 3E-08 1.1E-11 1.1E-13 1E-10 2E-10 1E-10 2E-10 7E-10 9.1E-13 0.078 4.5E-07 4E-06
HSD MD - 0.00137 1.3E-04 2.3E-05 1.9E-04 3.4E-07 2.3E-05 2.3E-05 2.3E-05 4E-09 1E-10 1E-12 7E-10 1E-09 4E-08 2E-08 1E-12 2E-08 1.1E-11 1.1E-13 1E-10 2E-10 1E-10 2E-10 7E-10 9.1E-13 0.074 4.6E-07 4E-06
HSD RO - 0.00144 1.2E-04 2.3E-05 1.1E-03 3.4E-07 5.7E-05 5.7E-05 5.7E-05 4E-09 3E-10 7E-11 2E-08 3E-08 5E-08 8E-07 5E-10 3E-08 1.1E-11 1.1E-13 1E-10 2E-10 1E-10 2E-10 7E-10 9.1E-13 0.078 4.5E-07 4E-06
GT MD - 0.00044 7.8E-06 7.8E-06 1.9E-04 3.1E-08 7.8E-07 7.8E-07 7.8E-07 4E-09 1E-10 1E-12 7E-10 1E-09 4E-08 2E-08 1E-12 2E-08 7.8E-12 7.8E-14 8E-11 2E-10 8E-11 2E-10 5E-10 6.2E-13 0.074 1.6E-07 6E-06
GT RO - 0.00047 8.0E-06 8.0E-06 1.1E-03 3.2E-08 4.0E-06 4.0E-06 4.0E-06 4E-09 3E-10 7E-11 2E-08 3E-08 5E-08 8E-07 5E-10 3E-08 8E-12 8.0E-14 8E-11 2E-10 8E-11 2E-10 5E-10 6.4E-13 0.078 1.6E-07 6E-06
ST MD - 0.00016 1.6E-05 7.8E-06 1.9E-04 3.1E-08 2.3E-05 2.3E-05 2.3E-05 4E-09 1E-10 1E-12 7E-10 1E-09 4E-08 2E-08 1E-12 2E-08 7.8E-12 7.8E-14 8E-11 2E-10 8E-11 2E-10 5E-10 6.2E-13 0.074 1.6E-07 6E-06
ST RO - 0.00017 1.6E-05 8.0E-06 1.1E-03 3.2E-08 6.4E-05 6.4E-05 6.4E-05 4E-09 3E-10 7E-11 2E-08 3E-08 5E-08 8E-07 5E-10 3E-08 8E-12 8.0E-14 8E-11 2E-10 8E-11 2E-10 5E-10 6.4E-13 0.078 1.6E-07 6E-06
NOx, NH3, CO and NMVOC Amendment for fuels sold for DOMESTIC TRAFFIC only (due to greater fraction of SCR in use)
Engine Fuel Corrected Factors in g/kWh Engine Fuel Emission Factors in g/ton fuel Engine Fuel Emission Factors in Gg/TJ as fuel supplied energy
type type NOx CO NMVOC NH3 type type NOx CO NMVOC NH3 type type NOx CO NMVOC NH3
MSD MD 12.4 1.1 0.2 0.009 MSD MD 60544 5259 953 44 MSD MD 0.00142 0.0001 2.23E-05 1E-06
MSD RO 8.0 0.9 0.2 0.048 MSD RO 37288 4364 774 224 MSD RO 0.00091 0.0001 1.89E-05 5E-06
HSD MD 11.0 1.1 0.2 0.011 HSD MD 53762 5219 945 56 HSD MD 0.001259 0.0001 2.21E-05 1E-06
NOTES:-
Approximate levels of uncertainty with emission factors at 95% confidence level (for whole fleet).
= uncertainty ca 5-10% = uncertainty ca 10-20% = uncertainty ca 20-50% = uncertainty > 50%
If some emission factors have been derived as "less than" values, then half of this value has been used in calculating the emission factors above.
For conversion of units, note that 1 Gg = 1 kton (i.e. 1g x 10^9) and 1 TJ = 10^6 x 1 MJ (i.e 1 J x 10^12) and 1 MWh = 3.6 GJ

Heating values and densities used are: MD - 0,84 ton/m3, 0,0427 TJ/ton (=9,633 MWh/m3) RO - 0,965 ton/m3, 0,04096 TJ/ton (=10,979 MWh/m3) (SCB used 0,91 and 10,583 previously which is same as 0.0418668 TJ/ton)
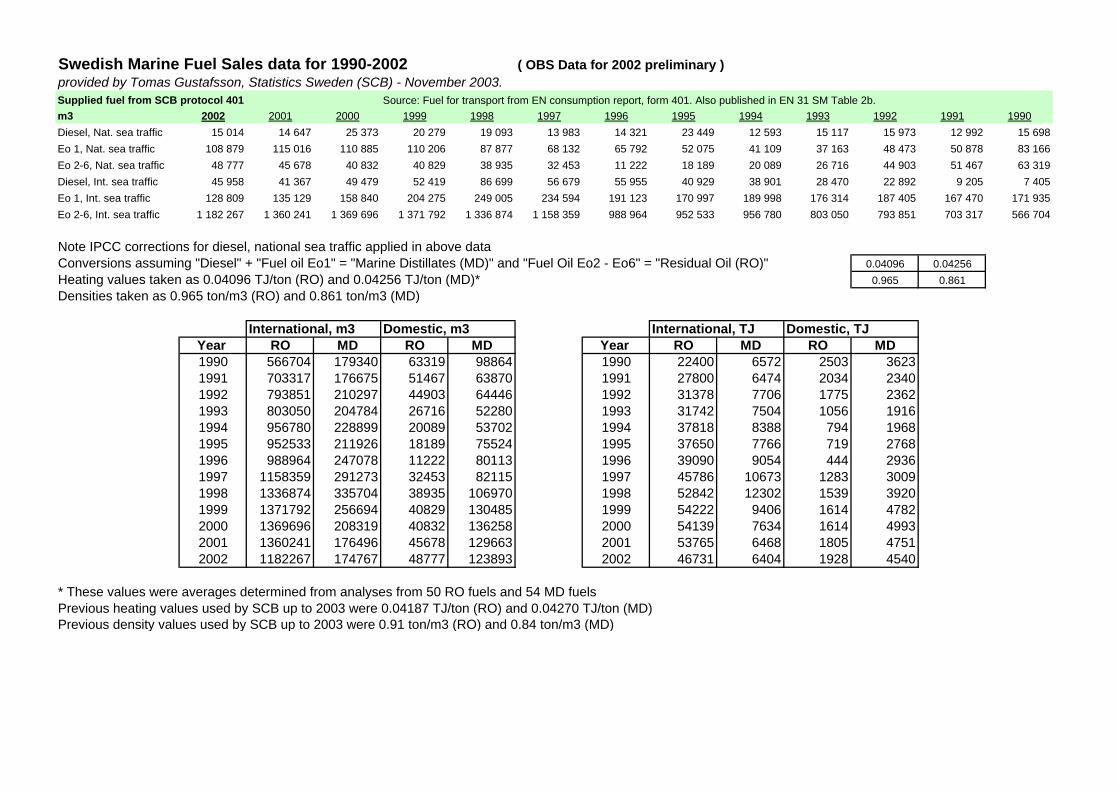
Swedish Marine Fuel Sales data for 1990-2002 ( OBS Data for 2002 preliminary )provided by Tomas Gustafsson, Statistics Sweden (SCB) - November 2003.
m3 2002 2001 2000 1999 1998 1997 1996 1995 1994 1993 1992 1991 1990
Diesel, Nat. sea traffic 15 014 14 647 25 373 20 279 19 093 13 983 14 321 23 449 12 593 15 117 15 973 12 992 15 698
Eo 1, Nat. sea traffic 108 879 115 016 110 885 110 206 87 877 68 132 65 792 52 075 41 109 37 163 48 473 50 878 83 166
Eo 2-6, Nat. sea traffic 48 777 45 678 40 832 40 829 38 935 32 453 11 222 18 189 20 089 26 716 44 903 51 467 63 319
Diesel, Int. sea traffic 45 958 41 367 49 479 52 419 86 699 56 679 55 955 40 929 38 901 28 470 22 892 9 205 7 405
Eo 1, Int. sea traffic 128 809 135 129 158 840 204 275 249 005 234 594 191 123 170 997 189 998 176 314 187 405 167 470 171 935
Eo 2-6, Int. sea traffic 1 182 267 1 360 241 1 369 696 1 371 792 1 336 874 1 158 359 988 964 952 533 956 780 803 050 793 851 703 317 566 704
Note IPCC corrections for diesel, national sea traffic applied in above dataConversions assuming "Diesel" + "Fuel oil Eo1" = "Marine Distillates (MD)" and "Fuel Oil Eo2 - Eo6" = "Residual Oil (RO)" 0.04096 0.04256
Heating values taken as 0.04096 TJ/ton (RO) and 0.04256 TJ/ton (MD)* 0.965 0.861
Densities taken as 0.965 ton/m3 (RO) and 0.861 ton/m3 (MD)
International, m3 Domestic, m3 International, TJ Domestic, TJYear RO MD RO MD Year RO MD RO MD1990 566704 179340 63319 98864 1990 22400 6572 2503 36231991 703317 176675 51467 63870 1991 27800 6474 2034 23401992 793851 210297 44903 64446 1992 31378 7706 1775 23621993 803050 204784 26716 52280 1993 31742 7504 1056 19161994 956780 228899 20089 53702 1994 37818 8388 794 19681995 952533 211926 18189 75524 1995 37650 7766 719 27681996 988964 247078 11222 80113 1996 39090 9054 444 29361997 1158359 291273 32453 82115 1997 45786 10673 1283 30091998 1336874 335704 38935 106970 1998 52842 12302 1539 39201999 1371792 256694 40829 130485 1999 54222 9406 1614 47822000 1369696 208319 40832 136258 2000 54139 7634 1614 49932001 1360241 176496 45678 129663 2001 53765 6468 1805 47512002 1182267 174767 48777 123893 2002 46731 6404 1928 4540
* These values were averages determined from analyses from 50 RO fuels and 54 MD fuelsPrevious heating values used by SCB up to 2003 were 0.04187 TJ/ton (RO) and 0.04270 TJ/ton (MD)Previous density values used by SCB up to 2003 were 0.91 ton/m3 (RO) and 0.84 ton/m3 (MD)
Supplied fuel from SCB protocol 401 Source: Fuel for transport from EN consumption report, form 401. Also published in EN 31 SM Table 2b.
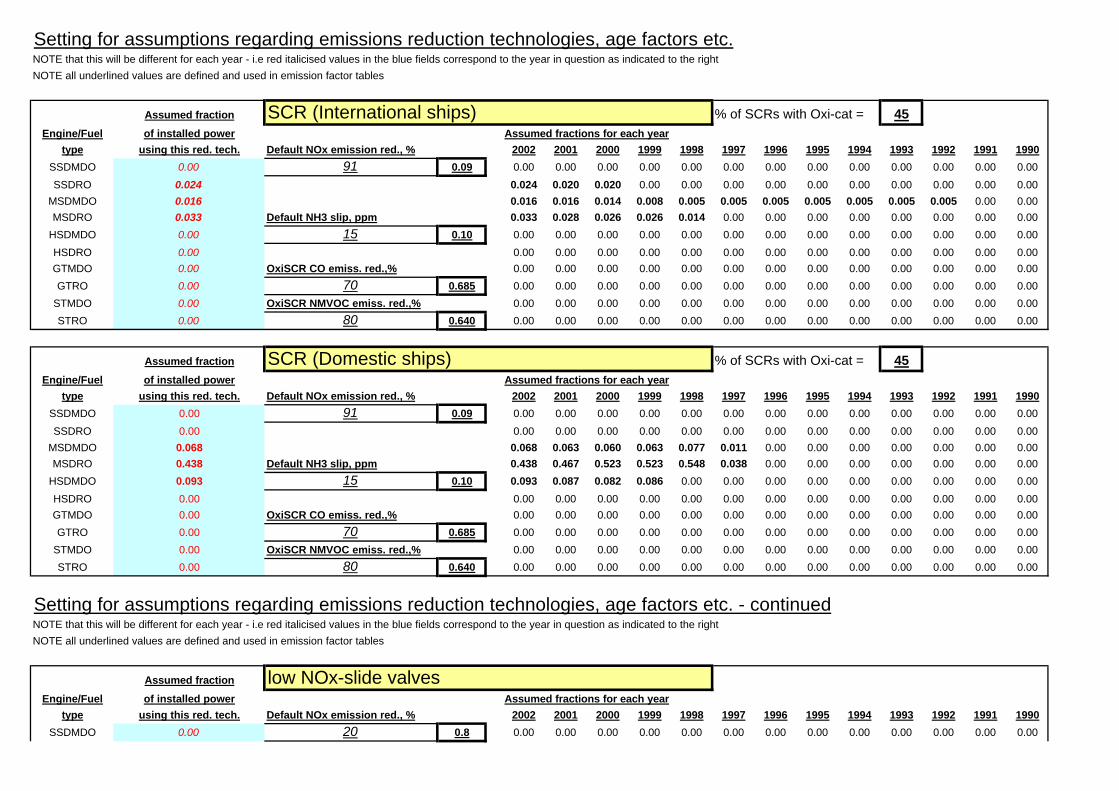
Setting for assumptions regarding emissions reduction technologies, age factors etc.NOTE that this will be different for each year - i.e red italicised values in the blue fields correspond to the year in question as indicated to the right
NOTE all underlined values are defined and used in emission factor tables
Assumed fraction SCR (International ships) % of SCRs with Oxi-cat = 45Engine/Fuel of installed power Assumed fractions for each year
type using this red. tech. Default NOx emission red., % 2002 2001 2000 1999 1998 1997 1996 1995 1994 1993 1992 1991 1990
SSDMDO 0.00 91 0.09 0.00 0.00 0.00 0.00 0.00 0.00 0.00 0.00 0.00 0.00 0.00 0.00 0.00
SSDRO 0.024 0.024 0.020 0.020 0.00 0.00 0.00 0.00 0.00 0.00 0.00 0.00 0.00 0.00
MSDMDO 0.016 0.016 0.016 0.014 0.008 0.005 0.005 0.005 0.005 0.005 0.005 0.005 0.00 0.00MSDRO 0.033 Default NH3 slip, ppm 0.033 0.028 0.026 0.026 0.014 0.00 0.00 0.00 0.00 0.00 0.00 0.00 0.00
HSDMDO 0.00 15 0.10 0.00 0.00 0.00 0.00 0.00 0.00 0.00 0.00 0.00 0.00 0.00 0.00 0.00
HSDRO 0.00 0.00 0.00 0.00 0.00 0.00 0.00 0.00 0.00 0.00 0.00 0.00 0.00 0.00GTMDO 0.00 OxiSCR CO emiss. red.,% 0.00 0.00 0.00 0.00 0.00 0.00 0.00 0.00 0.00 0.00 0.00 0.00 0.00
GTRO 0.00 70 0.685 0.00 0.00 0.00 0.00 0.00 0.00 0.00 0.00 0.00 0.00 0.00 0.00 0.00
STMDO 0.00 OxiSCR NMVOC emiss. red.,% 0.00 0.00 0.00 0.00 0.00 0.00 0.00 0.00 0.00 0.00 0.00 0.00 0.00
STRO 0.00 80 0.640 0.00 0.00 0.00 0.00 0.00 0.00 0.00 0.00 0.00 0.00 0.00 0.00 0.00
Assumed fraction SCR (Domestic ships) % of SCRs with Oxi-cat = 45Engine/Fuel of installed power Assumed fractions for each year
type using this red. tech. Default NOx emission red., % 2002 2001 2000 1999 1998 1997 1996 1995 1994 1993 1992 1991 1990
SSDMDO 0.00 91 0.09 0.00 0.00 0.00 0.00 0.00 0.00 0.00 0.00 0.00 0.00 0.00 0.00 0.00
SSDRO 0.00 0.00 0.00 0.00 0.00 0.00 0.00 0.00 0.00 0.00 0.00 0.00 0.00 0.00
MSDMDO 0.068 0.068 0.063 0.060 0.063 0.077 0.011 0.00 0.00 0.00 0.00 0.00 0.00 0.00MSDRO 0.438 Default NH3 slip, ppm 0.438 0.467 0.523 0.523 0.548 0.038 0.00 0.00 0.00 0.00 0.00 0.00 0.00
HSDMDO 0.093 15 0.10 0.093 0.087 0.082 0.086 0.00 0.00 0.00 0.00 0.00 0.00 0.00 0.00 0.00
HSDRO 0.00 0.00 0.00 0.00 0.00 0.00 0.00 0.00 0.00 0.00 0.00 0.00 0.00 0.00GTMDO 0.00 OxiSCR CO emiss. red.,% 0.00 0.00 0.00 0.00 0.00 0.00 0.00 0.00 0.00 0.00 0.00 0.00 0.00
GTRO 0.00 70 0.685 0.00 0.00 0.00 0.00 0.00 0.00 0.00 0.00 0.00 0.00 0.00 0.00 0.00
STMDO 0.00 OxiSCR NMVOC emiss. red.,% 0.00 0.00 0.00 0.00 0.00 0.00 0.00 0.00 0.00 0.00 0.00 0.00 0.00
STRO 0.00 80 0.640 0.00 0.00 0.00 0.00 0.00 0.00 0.00 0.00 0.00 0.00 0.00 0.00 0.00
Setting for assumptions regarding emissions reduction technologies, age factors etc. - continuedNOTE that this will be different for each year - i.e red italicised values in the blue fields correspond to the year in question as indicated to the right
NOTE all underlined values are defined and used in emission factor tables
Assumed fraction low NOx-slide valvesEngine/Fuel of installed power Assumed fractions for each year
type using this red. tech. Default NOx emission red., % 2002 2001 2000 1999 1998 1997 1996 1995 1994 1993 1992 1991 1990
SSDMDO 0.00 20 0.8 0.00 0.00 0.00 0.00 0.00 0.00 0.00 0.00 0.00 0.00 0.00 0.00 0.00
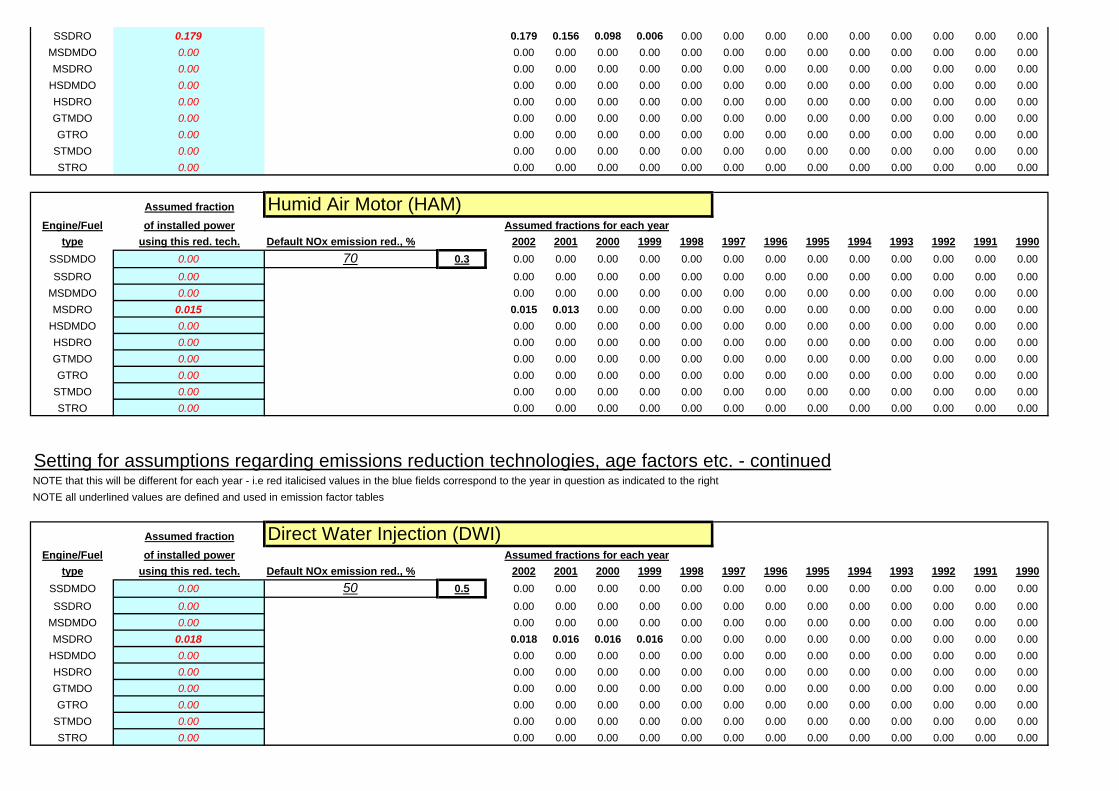
SSDRO 0.179 0.179 0.156 0.098 0.006 0.00 0.00 0.00 0.00 0.00 0.00 0.00 0.00 0.00
MSDMDO 0.00 0.00 0.00 0.00 0.00 0.00 0.00 0.00 0.00 0.00 0.00 0.00 0.00 0.00
MSDRO 0.00 0.00 0.00 0.00 0.00 0.00 0.00 0.00 0.00 0.00 0.00 0.00 0.00 0.00
HSDMDO 0.00 0.00 0.00 0.00 0.00 0.00 0.00 0.00 0.00 0.00 0.00 0.00 0.00 0.00
HSDRO 0.00 0.00 0.00 0.00 0.00 0.00 0.00 0.00 0.00 0.00 0.00 0.00 0.00 0.00
GTMDO 0.00 0.00 0.00 0.00 0.00 0.00 0.00 0.00 0.00 0.00 0.00 0.00 0.00 0.00
GTRO 0.00 0.00 0.00 0.00 0.00 0.00 0.00 0.00 0.00 0.00 0.00 0.00 0.00 0.00
STMDO 0.00 0.00 0.00 0.00 0.00 0.00 0.00 0.00 0.00 0.00 0.00 0.00 0.00 0.00
STRO 0.00 0.00 0.00 0.00 0.00 0.00 0.00 0.00 0.00 0.00 0.00 0.00 0.00 0.00
Assumed fraction Humid Air Motor (HAM)Engine/Fuel of installed power Assumed fractions for each year
type using this red. tech. Default NOx emission red., % 2002 2001 2000 1999 1998 1997 1996 1995 1994 1993 1992 1991 1990
SSDMDO 0.00 70 0.3 0.00 0.00 0.00 0.00 0.00 0.00 0.00 0.00 0.00 0.00 0.00 0.00 0.00
SSDRO 0.00 0.00 0.00 0.00 0.00 0.00 0.00 0.00 0.00 0.00 0.00 0.00 0.00 0.00
MSDMDO 0.00 0.00 0.00 0.00 0.00 0.00 0.00 0.00 0.00 0.00 0.00 0.00 0.00 0.00
MSDRO 0.015 0.015 0.013 0.00 0.00 0.00 0.00 0.00 0.00 0.00 0.00 0.00 0.00 0.00
HSDMDO 0.00 0.00 0.00 0.00 0.00 0.00 0.00 0.00 0.00 0.00 0.00 0.00 0.00 0.00
HSDRO 0.00 0.00 0.00 0.00 0.00 0.00 0.00 0.00 0.00 0.00 0.00 0.00 0.00 0.00
GTMDO 0.00 0.00 0.00 0.00 0.00 0.00 0.00 0.00 0.00 0.00 0.00 0.00 0.00 0.00
GTRO 0.00 0.00 0.00 0.00 0.00 0.00 0.00 0.00 0.00 0.00 0.00 0.00 0.00 0.00
STMDO 0.00 0.00 0.00 0.00 0.00 0.00 0.00 0.00 0.00 0.00 0.00 0.00 0.00 0.00
STRO 0.00 0.00 0.00 0.00 0.00 0.00 0.00 0.00 0.00 0.00 0.00 0.00 0.00 0.00
Setting for assumptions regarding emissions reduction technologies, age factors etc. - continuedNOTE that this will be different for each year - i.e red italicised values in the blue fields correspond to the year in question as indicated to the right
NOTE all underlined values are defined and used in emission factor tables
Assumed fraction Direct Water Injection (DWI)Engine/Fuel of installed power Assumed fractions for each year
type using this red. tech. Default NOx emission red., % 2002 2001 2000 1999 1998 1997 1996 1995 1994 1993 1992 1991 1990
SSDMDO 0.00 50 0.5 0.00 0.00 0.00 0.00 0.00 0.00 0.00 0.00 0.00 0.00 0.00 0.00 0.00
SSDRO 0.00 0.00 0.00 0.00 0.00 0.00 0.00 0.00 0.00 0.00 0.00 0.00 0.00 0.00
MSDMDO 0.00 0.00 0.00 0.00 0.00 0.00 0.00 0.00 0.00 0.00 0.00 0.00 0.00 0.00
MSDRO 0.018 0.018 0.016 0.016 0.016 0.00 0.00 0.00 0.00 0.00 0.00 0.00 0.00 0.00
HSDMDO 0.00 0.00 0.00 0.00 0.00 0.00 0.00 0.00 0.00 0.00 0.00 0.00 0.00 0.00
HSDRO 0.00 0.00 0.00 0.00 0.00 0.00 0.00 0.00 0.00 0.00 0.00 0.00 0.00 0.00
GTMDO 0.00 0.00 0.00 0.00 0.00 0.00 0.00 0.00 0.00 0.00 0.00 0.00 0.00 0.00
GTRO 0.00 0.00 0.00 0.00 0.00 0.00 0.00 0.00 0.00 0.00 0.00 0.00 0.00 0.00
STMDO 0.00 0.00 0.00 0.00 0.00 0.00 0.00 0.00 0.00 0.00 0.00 0.00 0.00 0.00
STRO 0.00 0.00 0.00 0.00 0.00 0.00 0.00 0.00 0.00 0.00 0.00 0.00 0.00 0.00
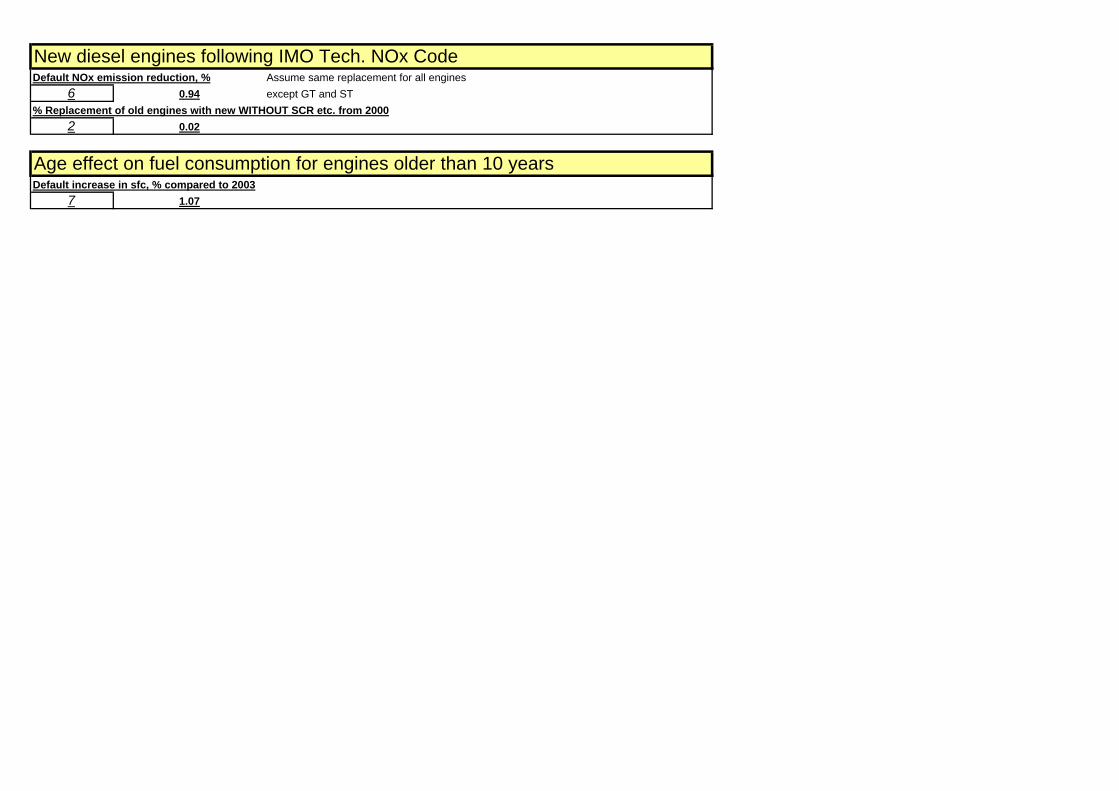
New diesel engines following IMO Tech. NOx CodeDefault NOx emission reduction, % Assume same replacement for all engines
6 0.94 except GT and ST
% Replacement of old engines with new WITHOUT SCR etc. from 2000
2 0.02
Age effect on fuel consumption for engines older than 10 yearsDefault increase in sfc, % compared to 2003
7 1.07
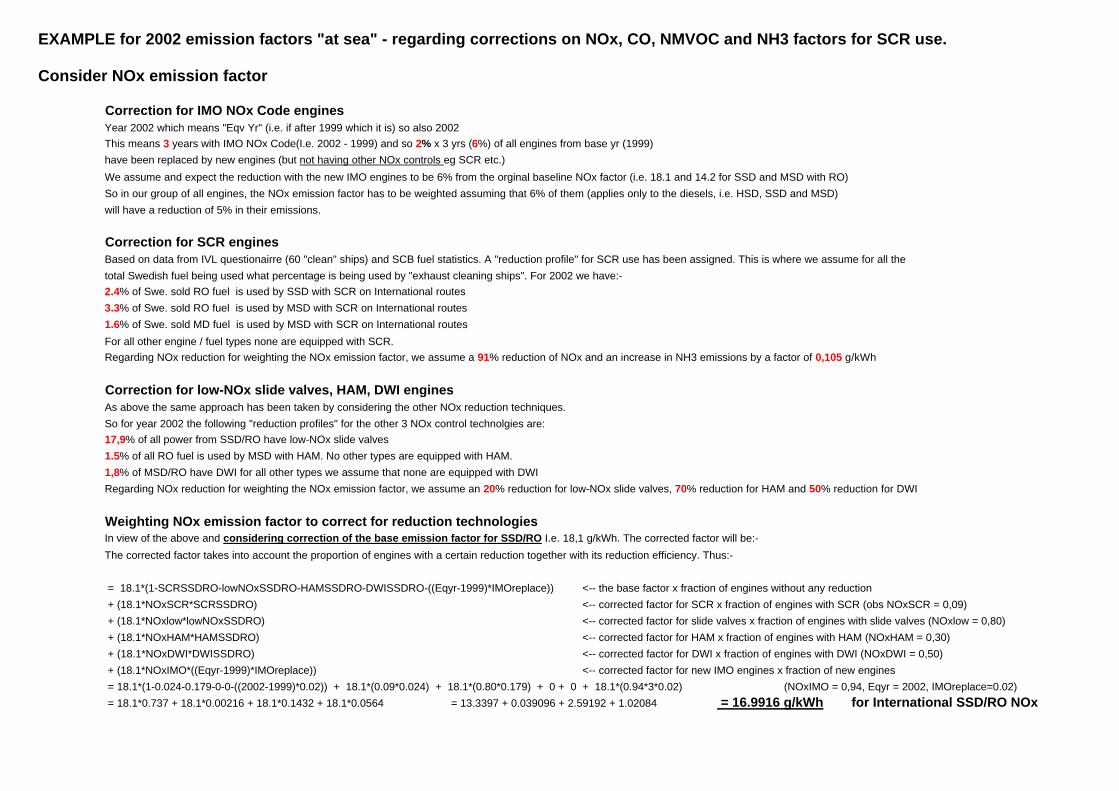
EXAMPLE for 2002 emission factors "at sea" - regarding corrections on NOx, CO, NMVOC and NH3 factors for SCR use.
Consider NOx emission factor
Correction for IMO NOx Code enginesYear 2002 which means "Eqv Yr" (i.e. if after 1999 which it is) so also 2002This means 3 years with IMO NOx Code(I.e. 2002 - 1999) and so 2% x 3 yrs (6%) of all engines from base yr (1999)
have been replaced by new engines (but not having other NOx controls eg SCR etc.)
We assume and expect the reduction with the new IMO engines to be 6% from the orginal baseline NOx factor (i.e. 18.1 and 14.2 for SSD and MSD with RO)
So in our group of all engines, the NOx emission factor has to be weighted assuming that 6% of them (applies only to the diesels, i.e. HSD, SSD and MSD)
will have a reduction of 5% in their emissions.
Correction for SCR enginesBased on data from IVL questionairre (60 "clean" ships) and SCB fuel statistics. A "reduction profile" for SCR use has been assigned. This is where we assume for all the
total Swedish fuel being used what percentage is being used by "exhaust cleaning ships". For 2002 we have:-2.4% of Swe. sold RO fuel is used by SSD with SCR on International routes
3.3% of Swe. sold RO fuel is used by MSD with SCR on International routes
1.6% of Swe. sold MD fuel is used by MSD with SCR on International routes
For all other engine / fuel types none are equipped with SCR.Regarding NOx reduction for weighting the NOx emission factor, we assume a 91% reduction of NOx and an increase in NH3 emissions by a factor of 0,105 g/kWh
Correction for low-NOx slide valves, HAM, DWI enginesAs above the same approach has been taken by considering the other NOx reduction techniques.
So for year 2002 the following "reduction profiles" for the other 3 NOx control technolgies are:17,9% of all power from SSD/RO have low-NOx slide valves
1.5% of all RO fuel is used by MSD with HAM. No other types are equipped with HAM.
1,8% of MSD/RO have DWI for all other types we assume that none are equipped with DWI
Regarding NOx reduction for weighting the NOx emission factor, we assume an 20% reduction for low-NOx slide valves, 70% reduction for HAM and 50% reduction for DWI
Weighting NOx emission factor to correct for reduction technologiesIn view of the above and considering correction of the base emission factor for SSD/RO I.e. 18,1 g/kWh. The corrected factor will be:-
The corrected factor takes into account the proportion of engines with a certain reduction together with its reduction efficiency. Thus:-
= 18.1*(1-SCRSSDRO-lowNOxSSDRO-HAMSSDRO-DWISSDRO-((Eqyr-1999)*IMOreplace)) <-- the base factor x fraction of engines without any reduction
+ (18.1*NOxSCR*SCRSSDRO) <-- corrected factor for SCR x fraction of engines with SCR (obs NOxSCR = 0,09)
+ (18.1*NOxlow*lowNOxSSDRO) <-- corrected factor for slide valves x fraction of engines with slide valves (NOxlow = 0,80)
+ (18.1*NOxHAM*HAMSSDRO) <-- corrected factor for HAM x fraction of engines with HAM (NOxHAM = 0,30)
+ (18.1*NOxDWI*DWISSDRO) <-- corrected factor for DWI x fraction of engines with DWI (NOxDWI = 0,50)
+ (18.1*NOxIMO*((Eqyr-1999)*IMOreplace)) <-- corrected factor for new IMO engines x fraction of new engines
= 18.1*(1-0.024-0.179-0-0-((2002-1999)*0.02)) + 18.1*(0.09*0.024) + 18.1*(0.80*0.179) + 0 + 0 + 18.1*(0.94*3*0.02) (NOxIMO = 0,94, Eqyr = 2002, IMOreplace=0.02)
= 18.1*0.737 + 18.1*0.00216 + 18.1*0.1432 + 18.1*0.0564 = 13.3397 + 0.039096 + 2.59192 + 1.02084 = 16.9916 g/kWh for International SSD/RO NOx
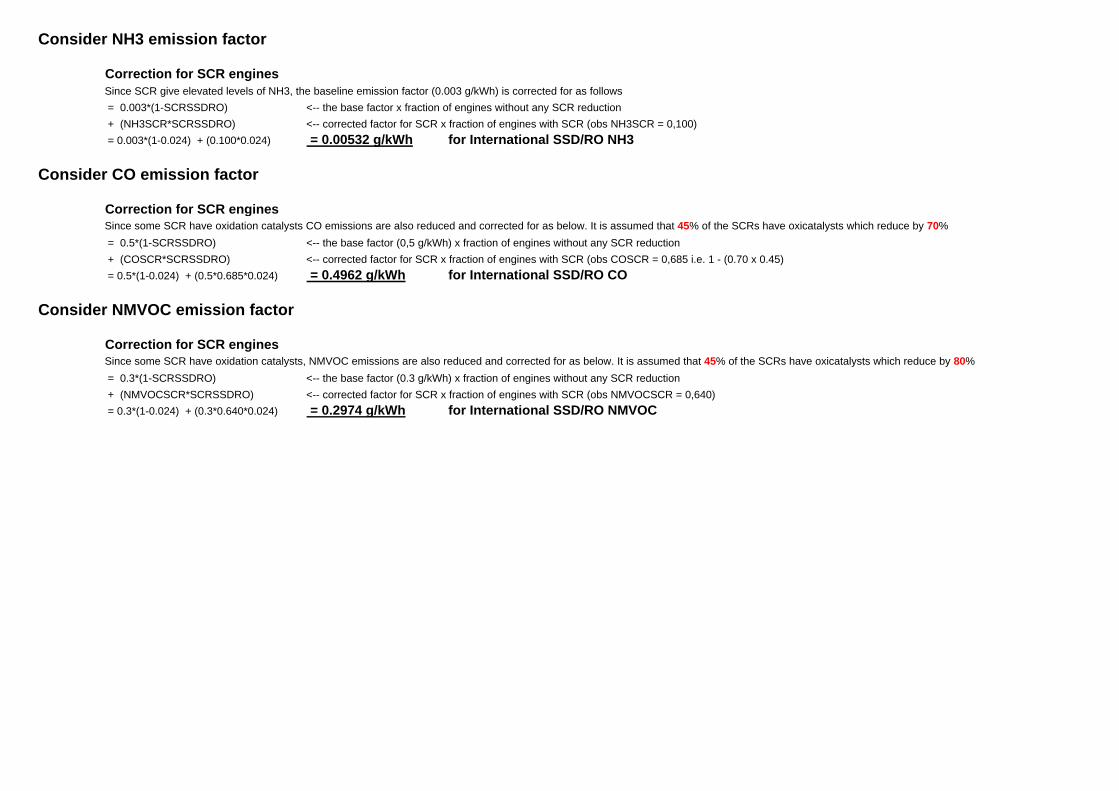
Consider NH3 emission factor
Correction for SCR enginesSince SCR give elevated levels of NH3, the baseline emission factor (0.003 g/kWh) is corrected for as follows
= 0.003*(1-SCRSSDRO) <-- the base factor x fraction of engines without any SCR reduction
+ (NH3SCR*SCRSSDRO) <-- corrected factor for SCR x fraction of engines with SCR (obs NH3SCR = 0,100)
= 0.003*(1-0.024) + (0.100*0.024) = 0.00532 g/kWh for International SSD/RO NH3
Consider CO emission factor
Correction for SCR enginesSince some SCR have oxidation catalysts CO emissions are also reduced and corrected for as below. It is assumed that 45% of the SCRs have oxicatalysts which reduce by 70%
= 0.5*(1-SCRSSDRO) <-- the base factor (0,5 g/kWh) x fraction of engines without any SCR reduction
+ (COSCR*SCRSSDRO) <-- corrected factor for SCR x fraction of engines with SCR (obs COSCR = 0,685 i.e. 1 - (0.70 x 0.45)
= 0.5*(1-0.024) + (0.5*0.685*0.024) = 0.4962 g/kWh for International SSD/RO CO
Consider NMVOC emission factor
Correction for SCR enginesSince some SCR have oxidation catalysts, NMVOC emissions are also reduced and corrected for as below. It is assumed that 45% of the SCRs have oxicatalysts which reduce by 80%
= 0.3*(1-SCRSSDRO) <-- the base factor (0.3 g/kWh) x fraction of engines without any SCR reduction
+ (NMVOCSCR*SCRSSDRO) <-- corrected factor for SCR x fraction of engines with SCR (obs NMVOCSCR = 0,640)
= 0.3*(1-0.024) + (0.3*0.640*0.024) = 0.2974 g/kWh for International SSD/RO NMVOC