METHODOLOGY ARTICLE Open Access MMpred: functional …
18
METHODOLOGY ARTICLE Open Access MMpred: functional miRNA – mRNA interaction analyses by miRNA expression prediction Przemyslaw A Stempor 1,2* , Michael Cauchi 1 and Paul Wilson 2 Abstract Background: MicroRNA (miRNA) directed gene repression is an important mechanism of posttranscriptional regulation. Comprehensive analyses of how microRNA influence biological processes requires paired miRNA-mRNA expression datasets. However, a review of both GEO and ArrayExpress repositories revealed few such datasets, which was in stark contrast to the large number of messenger RNA (mRNA) only datasets. It is of interest that numerous primary miRNAs (precursors of microRNA) are known to be co-expressed with coding genes (host genes). Results: We developed a miRNA-mRNA interaction analyses pipeline. The proposed solution is based on two miRNA expression prediction methods – a scaling function and a linear model. Additionally, miRNA-mRNA anti- correlation analyses are used to determine the most probable miRNA gene targets (i.e. the differentially expressed genes under the influence of up- or down-regulated microRNA). Both the consistency and accuracy of the prediction method is ensured by the application of stringent statistical methods. Finally, the predicted targets are subjected to functional enrichment analyses including GO, KEGG and DO, to better understand the predicted interactions. Conclusions: The MMpred pipeline requires only mRNA expression data as input and is independent of third party miRNA target prediction methods. The method passed extensive numerical validation based on the binding energy between the mature miRNA and 3’ UTR region of the target gene. We report that MMpred is capable of generating results similar to that obtained using paired datasets. For the reported test cases we generated consistent output and predicted biological relationships that will help formulate further testable hypotheses. Background MicroRNAs are short non-coding RNAs that utilise the cellular RNA-induced silencing complex (RISC) to influ- ence gene expression [1]. The biogenesis of those regula- tory organic polymers involves nuclear processing of the primary microRNA (pri-miRNA) by Drosha RNase III to precursor sequences (pre-miRNA). Pre-miRNA are in turn processed by Dicer endoribonuclease before being imported into the RISC, or redirected to the nucleus. The primary function of miRNA is believed to be gene repres- sion [2], although gene activation (RNAa) has also been reported [3]. The majority of human coding genes are believed to be regulated by a relatively small set of microRNAs [4,5]. However, for efficient targeting of mRNA transcripts the co-regulation of many miRNAs is required. This many-to-many relationship between micro- RNA and coding transcripts creates an extensive, robust regulatory network, which is highly influential during cell differentiation and disease processes [6]. This complex regulatory miRNA-mRNA network is further integrated via co-expression of the coding transcripts. That is, the ma- jority of pri-miRNAs are either located within introns or are in close proximity of coding genes, the so called host genes [7,8]. Consequently microRNAs are assumed to share transcription regulatory sites and to be co-expressed with coding mRNA transcripts. Recent surveys indicate that as few as 26% of intergenic mammalian miRNAs are transcribed from their own specific promoters [9]. Lutter et al. report that at least 37% of miRNAs are co-located within coding genes [10], while Rodriguez et al. state that * Correspondence: [email protected] 1 Cranfield Health, Cranfield University, Vincent Building, Cranfield, UK 2 Computational Biology, GlaxoSmithKline Medicine Research Centre, Gunnels Wood Road, Stevenage, UK © 2012 Stempor et al.; licensee BioMed Central Ltd. This is an Open Access article distributed under the terms of the Creative Commons Attribution License (http://creativecommons.org/licenses/by/2.0), which permits unrestricted use, distribution, and reproduction in any medium, provided the original work is properly cited. Stempor et al. BMC Genomics 2012, 13:620 http://www.biomedcentral.com/1471-2164/13/620
Transcript of METHODOLOGY ARTICLE Open Access MMpred: functional …

Stempor et al. BMC Genomics 2012, 13:620http://www.biomedcentral.com/1471-2164/13/620
METHODOLOGY ARTICLE Open Access
MMpred: functional miRNA – mRNA interactionanalyses by miRNA expression predictionPrzemyslaw A Stempor1,2*, Michael Cauchi1 and Paul Wilson2
Abstract
Background: MicroRNA (miRNA) directed gene repression is an important mechanism of posttranscriptionalregulation. Comprehensive analyses of how microRNA influence biological processes requires pairedmiRNA-mRNA expression datasets. However, a review of both GEO and ArrayExpress repositories revealed fewsuch datasets, which was in stark contrast to the large number of messenger RNA (mRNA) only datasets. It is ofinterest that numerous primary miRNAs (precursors of microRNA) are known to be co-expressed with codinggenes (host genes).
Results: We developed a miRNA-mRNA interaction analyses pipeline. The proposed solution is based on twomiRNA expression prediction methods – a scaling function and a linear model. Additionally, miRNA-mRNA anti-correlation analyses are used to determine the most probable miRNA gene targets (i.e. the differentiallyexpressed genes under the influence of up- or down-regulated microRNA). Both the consistency and accuracyof the prediction method is ensured by the application of stringent statistical methods. Finally, the predictedtargets are subjected to functional enrichment analyses including GO, KEGG and DO, to better understand thepredicted interactions.
Conclusions: The MMpred pipeline requires only mRNA expression data as input and is independent of thirdparty miRNA target prediction methods. The method passed extensive numerical validation based on thebinding energy between the mature miRNA and 3’ UTR region of the target gene. We report that MMpred iscapable of generating results similar to that obtained using paired datasets. For the reported test cases wegenerated consistent output and predicted biological relationships that will help formulate further testablehypotheses.
BackgroundMicroRNAs are short non-coding RNAs that utilise thecellular RNA-induced silencing complex (RISC) to influ-ence gene expression [1]. The biogenesis of those regula-tory organic polymers involves nuclear processing of theprimary microRNA (pri-miRNA) by Drosha RNase III toprecursor sequences (pre-miRNA). Pre-miRNA are in turnprocessed by Dicer endoribonuclease before beingimported into the RISC, or redirected to the nucleus. Theprimary function of miRNA is believed to be gene repres-sion [2], although gene activation (RNAa) has also beenreported [3]. The majority of human coding genes arebelieved to be regulated by a relatively small set of
* Correspondence: [email protected] Health, Cranfield University, Vincent Building, Cranfield, UK2Computational Biology, GlaxoSmithKline Medicine Research Centre, GunnelsWood Road, Stevenage, UK
© 2012 Stempor et al.; licensee BioMed CentraCommons Attribution License (http://creativecreproduction in any medium, provided the or
microRNAs [4,5]. However, for efficient targeting ofmRNA transcripts the co-regulation of many miRNAs isrequired. This many-to-many relationship between micro-RNA and coding transcripts creates an extensive, robustregulatory network, which is highly influential during celldifferentiation and disease processes [6]. This complexregulatory miRNA-mRNA network is further integratedvia co-expression of the coding transcripts. That is, the ma-jority of pri-miRNAs are either located within introns orare in close proximity of coding genes, the so called hostgenes [7,8]. Consequently microRNAs are assumed toshare transcription regulatory sites and to be co-expressedwith coding mRNA transcripts. Recent surveys indicatethat as few as 26% of intergenic mammalian miRNAs aretranscribed from their own specific promoters [9]. Lutteret al. report that at least 37% of miRNAs are co-locatedwithin coding genes [10], while Rodriguez et al. state that
l Ltd. This is an Open Access article distributed under the terms of the Creativeommons.org/licenses/by/2.0), which permits unrestricted use, distribution, andiginal work is properly cited.

Stempor et al. BMC Genomics 2012, 13:620 Page 2 of 18http://www.biomedcentral.com/1471-2164/13/620
approximately half of miRNAs are located within intronsof coding and non-coding RNA [11]. Furthermore, Kimand Kim report that among microRNAs mapped to ESTsthe percentage of intronic and exonic ones are 87% and13% respectively [12]. The authors also suggest that due toexon pairing/tethering the independent processes of in-tronic miRNA biogenesis and mRNA splicing may occurin parallel, without affecting each other [12]. Moreover,genomic mapping conducted in support of this report(based on miRBase release 15) indicate that 578 of 940(61%) human miRNAs share a primary RNA transcriptwith known coding genes [10]. These findings are furthersupported by a widely reported coherence of function be-tween miRNA and host genes [8,10,13,14]. It is currentopinion that microRNA support host gene functionby repressing the expression and increasing decay rateof antagonistically acting genes, or promoting the ex-pression of synergistically acting genes. For example,murine heart-specific gene Myh6 overlaps with miR-208a, which has been reported to negatively regulatethe thyroid hormone associated protein and myostatinboth of which negatively regulate muscle growth andhypertrophy [15]. Similar antagonistic effects havebeen shown for miR-346, miR-338 and their corre-sponding host genes GRID1 and AATK [13,14]. Fur-thermore, genes that share expression profiles withmiRNA have been observed not to encode their re-spective microRNA seed regions [16], leading to thepostulation that host genes have developed evolution-ary resistance for miRNA mediated repression and de-generation [10,13]. Moreover, host genes tend to beco-expressed in clusters, which when combined withmiRNA expression data create large, significantly cor-related expression patterns [8,10,13].
Figure 1 Simple overview of the Predictive Model assumptions.
The most significant changes of miRNA repressionactivity are observed during differentiation process[17,18]. It is believed that functional miRNA-mRNAcoherence acts as a stabilizing mechanism that pro-motes the expression of tissue-specific genes whilesuppressing the expression of genes specific to stemcells and other tissues. Thus, a miRNA expression pro-file is tissue specific [10,19].Combined these observations imply that a miRNA ex-
pression profile is positively correlated with it’s host genemRNA expression profile and anti-correlated with it’starget genes expression profiles. This simple functionalmodel can be further extended to identify functionalclusters of miRNA host genes. An intriguing applicationof this model is that we can use mRNA expression datato predict both miRNA expression and their putativetargets (Figure 1).Performing functional analyses of miRNA-mRNA
interactions using standard methodology would requiremeasuring global expression of mRNA and miRNAusing two different arrays or RNA-sequencing experi-ments. Such approach requires a large quantity of puri-fied RNA, increased processing and handling overhead,as well as the additional costs of supporting two differ-ent array platforms. Such impediments are reflected inthe relatively small number of paired miRNA-mRNAdatasets available in public repositories - (i.e. there areonly nine Agilent Human miRNA Microarray (V2)datasets in GEO [20,21]; see Additional file 1). In con-trast, GEO contains an impressive collection of highquality mRNA assays. Currently there are 2,170 datasets(60,334 samples) derived from the Affymetrix HumanGenome U133 Plus 2.0 array and 117 datasets (4,642samples) for Affymetrix Human Exon 1.0 ST, (as of 04/

Stempor et al. BMC Genomics 2012, 13:620 Page 3 of 18http://www.biomedcentral.com/1471-2164/13/620
12/2010). Mining these data for host gene – miRNAtargets offers a tremendous and immediate source ofinformation regarding both miRNA target identificationand regulation networks. In this paper we describe amethod that is capable of both identifying putativeregulatory clusters and predicting approximate expres-sion levels of miRNAs from mRNA microarray data.In completing this investigation we have focused on
paired Affymetrix Human Exon ST 1.0 – AgilentHuman miRNA Microarray 2.0 datasets to build a pre-diction model, and data derived from the AffymetrixHuman Genome U133 Plus 2.0 - Agilent HumanmiRNA Microarray 2.0 as validation sets.The initial step of this process involved mapping all
of the miRBase human miRNAs to Affymetrix probes.Then, the paired datasets were used to construct twoindependent, general predictors. A consensus methodwas then developed to consolidate the predictors’ out-put and to correlate this with experimental mRNA ex-pression data. This was used to identify putativemiRNA interactions with coding genes (targets). Finallyoverrepresentation of the predicted target genes in dif-ferent ontologies was estimated using a hypergeometric
Figure 2 The flowchart presenting the general structure of the pipeli
test to determine functionally annotated clusters ofmiRNA-genes interactions. The model has been imple-mented in the R statistical environment and is access-ible as a modular, user-friendly analysis pipeline forthe prediction of microRNA regulatory mechanismsusing HG-U133Plus2 microarray data as input.
ResultsUser input and pre-processingRaw microarray intensity values are pre-processed usingthe Robust Microarray Average (RMA) method [22].Subsequent t-test or ANOVA statistical testing (this isdependent on the user-defined experimental designtable) is performed. To determine a statistical signifi-cance (p-value) cut-off an equivalent test is performed ona randomised expression matrix. The randomization isachieved by simple permutation of the experimentallyderived data. The lowest p-value statistic observed in therandomly designed experiment is chosen as the p-valuecut-off for the experimental data. The pipeline outputincludes the expression matrix of significantly up-/down-regulated genes along with the estimated p-values andfold change vectors (Figure 2). Furthermore, visualisation
ne.

Stempor et al. BMC Genomics 2012, 13:620 Page 4 of 18http://www.biomedcentral.com/1471-2164/13/620
of principal components analysis (PCA) scores, hierarchalcluster analysis (HCA) heatmaps and volcano plots areused as quality control assessments of the predicted model.
The mapping of microRNAs to protein coding “host genes”The mapping between microRNAs and its host geneswas completed using a simple method that utilizes gen-omic coordinates retrieved from miRBase [23]. Retrievedfields include the Ensembl transcript IDs, and informa-tion detailing the nature of overlap (e.g. exonic, intronic,3’UTR, 5’UTR etc.), the. This method proved more efficientthan other tested approaches – (e.g. direct string matchingand chromosome location methods; see Methods for fur-ther details).The resulting network comprised 690 mature miRNAs
and 544 coding genes connected by 3992 edges. The largenumber of connections between the nodes supportscurrent opinion of a many-to-many relationship betweenmiRNAs and host genes. 92% of the overlaps (3653)involve intronic sites, while 208 (5%) involve the exons ofcoding genes. In addition, 97 and 34 (2% and >1%) involvethe 5’UTR and 3’UTRs respectively. Sorting the overlapsby DNA strand indicated that 3320 (83%) of the predictedinteractions involve the coding strand and 672 (17%) theanti-sense strand.The microarray platform specific mappings between
Affymetrix genes/exons IDs and mature mRNA identi-fiers represented on the chosen platforms were retrievedand directly incorporated into the pipeline. In the caseof Affymetrix Human Genome 133 Plus 2.0 mapping toAgilent Human miRNA Microarray 2.0, 996 probesetscorresponding to 483 host genes (1,600 Ensembl tran-scripts), were identified. A total of 4,857 edges connectthe transcripts to 544 pre-microRNAs. This can be fur-ther processed to 646 mature miRNAs as representedon the Human miRNA microarray. The second mappingfeatures the same miRNA array platform and AffymetrixHuman Exon 1.0 ST array. In this instance 996 probesetsrepresenting 14,191 exons (encoding 544 genes), havebeen identified as in close proximity of pri-miRNAsequences. An estimated 16,851 edges associate thesetranscripts to 578 pre-microRNAs, (representative of646 mature miRNAs). Due to the increased genomiccoverage and robust expression measurements theHuEx-1.0ST mapping were used to calculate the predic-tors’ parameters and validate the model. However, be-cause of much larger numbers of HG-U133Plus2experiments in GEO, this array was selected as the pri-mary input platform for the pipeline.The mapping is utilised as a binary file when the pipeline
is executed. Obviously the mappings can be re-calculated,with new releases of the source databases. A representativesection of the mapping table is illustrated in Table 1; thefull mapping table is included as Additional file 2.
Predictor I: Scaling functionPaired microRNA-mRNA dataset “Array-based bioinfor-matic analysis on pediatric primary central nervous sys-tem germ cell tumors” [24] has been selected to testlinear model assumptions. After obtaining an expressionmatrix using the RMA method [22], correlation coeffi-cients were calculated for each gene – microRNA inter-action (i.e. how each row of the miRNA matrixcorrelates with each row of the mRNA matrix). Correl-ation values were determined using the Pearson prod-uct–moment coefficient, which is generally consideredsuitable when estimating the linear relationships. AlsoSpearman’s ρ and Kendall’s τ rank coefficients were used.These methods are sensitive to monotonic associationand resistant to outliers. No significant correlation wasdetected with the unfiltered data using either method.Furthermore, the distribution of correlation coefficientswas very close to a standard normal distribution (sup-ported by the Shapiro-Wilk test [25]).In contrast, when only those miRNAs that had been
mapped to the host genes transcripts were used, the cor-relation coefficient values attained were 0.23 for Pear-son’s, 0.22 for Spearman’s and 0.16 for Kendall’s method.This is a significant improvement over non-mappedinteractions. The relatively higher value of the Pearsonproduct–moment correlation suggests that the observedcorrelation in the dataset may be linear in nature. Todetermine if the mapped genes represent a random sam-pling of the population of all genes, the Shapiro-Wilktest was performed. The null hypothesis that the sampleis derived from a normally distributed population, wasrejected with a 99% confidence interval p-value of< 0.0001 (α level 0.05).Consequently a scaling function was introduced to es-
timate the miRNA expression values from the corre-sponding host genes’ expression (Figure 3). The mainassumption of the model is that the expression of 587pre-miRNA can be predicted from mRNA expression.However, many microRNA have been mapped to morethan one probeset, likewise some Affymetrix probesetIDs correspond to more than one miRNA (i.e. a many-to-many relationship). Consequently, miRNA mapping tothe sense strand of the intronic regions of coding genes,and those miRNA with experimental evidence are muchmore relevant to the model. Furthermore, significant differ-ential expression of host gene mRNA transcripts (i.e. iden-tified by high absolute fold change in association with alow p-value) indicates a significant change in expression ofcorresponding microRNA.Validation of the model indicated that the mean correl-
ation of overlapping miRNA with their host genes is onlymarginally improved by performing scaling. However,values on the right tail of the probability distributionplot, representing strongly correlated expressions (i.e. a

Table 1 The sample of the mapping table containing information from miRBase and Ensembl
Mirbase_id s. Overlap Evidence Ensembl_gene_id Ensembl_transcript_id Affy_hg_u133_plus_2 Affy_hu x _1_0_st_v2
Chromosome Start_position
End_position
miR miR*
hsa-let-7a-3 + exon HGNC_automatic_transcript ENSG00000197182 ENST00000360737 232480_at 3948921 22 46449741 46509808 hsa-let-7a hsa-let-7a*
hsa-let-7a-3 + exon Vega_transcript ENSG00000197182 ENST00000360737 232480_at 3948949 22 46449741 46509808 hsa-let-7a hsa-let-7a*
hsa-let-7b + exon HGNC_automatic_transcript ENSG00000197182 ENST00000360737 232480_at 3948921 22 46449741 46509808 hsa-let-7b hsa-let-7b*
hsa-let-7b + exon Vega_transcript ENSG00000197182 ENST00000360737 232480_at 3948949 22 46449741 46509808 hsa-let-7b hsa-let-7b*
hsa-let-7c + intron HGNC_curated_transcript ENSG00000215386 ENST00000308787 1559901_s_at 3915214 21 17442842 17982094 hsa-let-7c hsa-let-7c*
hsa-let-7c + intron HGNC_curated_transcript ENSG00000215386 ENST00000308787 1559901_s_at 3915194 21 17442842 17982094 hsa-let-7c hsa-let-7c*
hsa-let-7c + intron HGNC_curated_transcript ENSG00000215386 ENST00000308787 1559901_s_at 3915317 21 17442842 17982094 hsa-let-7c hsa-let-7c*
hsa-let-7c + intron HGNC_curated_transcript ENSG00000215386 ENST00000308787 1559901_s_at 3915201 21 17442842 17982094 hsa-let-7c hsa-let-7c*
hsa-let-7c + intron HGNC_curated_transcript ENSG00000215386 ENST00000308787 1559901_s_at 3915291 21 17442842 17982094 hsa-let-7c hsa-let-7c*
hsa-let-7c + intron HGNC_curated_transcript ENSG00000215386 ENST00000308787 1559901_s_at 3915202 21 17442842 17982094 hsa-let-7c hsa-let-7c*
hsa-let-7c + intron HGNC_curated_transcript ENSG00000215386 ENST00000308787 1559901_s_at 3915257 21 17442842 17982094 hsa-let-7c hsa-let-7c*
hsa-let-7c + intron HGNC_curated_transcript ENSG00000215386 ENST00000308787 1559901_s_at 3915275 21 17442842 17982094 hsa-let-7c hsa-let-7c*
hsa-let-7c + intron HGNC_automatic_transcript ENSG00000215386 ENST00000308787 1559901_s_at 3915192 21 17442842 17982094 hsa-let-7c hsa-let-7c*
hsa-let-7c + intron Vega_transcript ENSG00000215386 ENST00000308787 1559901_s_at 3915318 21 17442842 17982094 hsa-let-7c hsa-let-7c*
hsa-let-7c + intron Vega_transcript ENSG00000215386 ENST00000308787 1559901_s_at 3915193 21 17442842 17982094 hsa-let-7c hsa-let-7c*
hsa-let-7c + intron Vega_transcript ENSG00000215386 ENST00000400178 1559901_s_at 3915214 21 17442842 17982094 hsa-let-7c hsa-let-7c*
This table is used by the mapping function, essential for both prediction methods.
Stempor
etal.BM
CGenom
ics2012,13:620
Page5of
18http://w
ww.biom
edcentral.com/1471-2164/13/620

Figure 3 Predictor I – The scaling function.
Stempor et al. BMC Genomics 2012, 13:620 Page 6 of 18http://www.biomedcentral.com/1471-2164/13/620
Pearson’s correlation coefficient of 0.6 and above), aresignificantly enriched. This is readily apparent when wecompare the respective un-scaled and scaled histograms(Figure 3). Furthermore, the scaling function introduceseven stronger deviation from Gaussian distribution. Thisis reflected the lower p-value obtained from the Shapiro-Wilk normality test. The mean Pearson’s, Spearman andKendall correlation coefficients achieved after scalingwere 0.24, 0.22 and 0.16 respectively.Finally the predictor uses calculated expression values
to build a pseudo-expression matrix. This matrix hasexactly the same construction as expression sets obtainedfrom real microarray experiments, but the values aregenerated in silico, using the linear predictor, rather thanexperimentally determined expression data.
Predictor II: Linear modelDespite the satisfactory performance of scaling functionpredictor several tests indicated that implementing ageneral linear model might further enhance the predict-ive power of the model. When applying this approachthe coefficients are fitted using least squares methodderived from the paired data rather than being arbitrarilychosen. Furthermore, it is also feasible to introduce
individual coefficient values for each miRNA to more ac-curately reflect biological dependencies.To fit a linear model that correctly optimizes the lin-
ear function parameters for each microRNA, an appro-priate training dataset was required. The “Array-basedbioinformatic analysis on pediatric primary centralnervous system germ cell tumors” dataset, previouslyused for validation and evaluation was obviously toosmall for building a robust model capable of gener-alization. Consequently it was decided to train the modelon a larger dataset and use the smaller dataset for valid-ation. Ideally the training set should comprise >100paired arrays and provide the best coverage for bothcoding transcripts and miRNAs. Assessing GEO andArrayExpress identified only one dataset [26] that metthese specifications: “Integrative genomic profiling ofhuman prostate cancer” (GSE21032). The raw array datawere RMA normalised [22]. Messenger RNA expressionindexes were used as independent variable to describethe dependent variable – i.e. the miRNA expression. Thelinear regression coefficients were fitted using the leastsquares method.To pair miRBase IDs with their corresponding Affy-
metrix Human Exon Array host transcripts IDs, the

Stempor et al. BMC Genomics 2012, 13:620 Page 7 of 18http://www.biomedcentral.com/1471-2164/13/620
previously used mapping array was extended usingHuEx-1.0ST transcript IDs. Since the Human Exon chipis backward compatible with Affymetrix genome chipsthis operation proved feasible [27-29].In order to optimize the predictor power and avoid
over-fitting expression values were split into a train-ing set (2/3 of the data) and a test set (1/3 of data).To minimise any potential bias the composition ofboth sets was randomized after pairing miRNA ex-pression indexes with their respective mRNA expres-sion values (Figure 4).After maximizing the prediction power the utility of
generalizing predictions on different array experimentsand platforms were assessed. On this occasion, the linearmodels were trained on all available data from the “Inte-grative genomic profiling of human prostate cancer”(GSE21032) dataset (i.e. previous training and test setjoined together) and validated using the “Array-basedbioinformatic analysis on pediatric primary central ner-vous system germ cell tumors” (GSE19350) dataset. Thecalculated cross-platform correlation was 0.884, whichsupport s the assumption of conservative cross-tissuemiRNA-mRNA regulatory mechanisms (i.e. the modeltrained on the prostate cancer dataset was able to pre-cisely predict miRNA expression in brain tissue).
Figure 4 Predictor II – linear model.
Correlation analysesCorrelation between messenger RNA and microRNA isthe corner stone of the pipeline. A positive correlationindicates a host gene relationship while a negative valuesuggests a target gene relationship. The pipeline utilizesboth dependences to extract genes predicted to be influ-enced by miRNA (i.e. in the absence of experimentallyestimated miRNA expression data). Each significant pre-dicted miRNA pseudo-expression value is correlated tothe significant experimental mRNA expression data cre-ating a correlation matrix (Figure 5). Then a user-determined cut-off filter is applied. The cut-off is a nega-tive number representing strong reversed correlation.The default value of −0.8 was chosen for robust generalperformance. Typically, if a user is interested in thebroad spectrum of processes that may be influenced bymiRNA the cut-off should be higher. In contrast a nar-row and highly reliable set of predicted interactions isachieved using lower cut-off values.
Final analyses – GO, KEGG, DOLight and user definedterms overrepresentation testingFiltering the most anti-correlated expression values gen-erates a list of microRNA – target gene interactions. De-pending on the parameters defined by the user and the

Figure 5 The flow-chart presenting the idea of filtering putative miRNA target genes. The predictor output based correlation matrix isfiltered by a negative correlation cut-off in order to find putative miRNA-target interactions. These interactions are subsequently used for GO,KEGG, DOlight over-representation testing and creating user-readable HTML output.
Stempor et al. BMC Genomics 2012, 13:620 Page 8 of 18http://www.biomedcentral.com/1471-2164/13/620
quality of the input data the length of this list may varysignificantly. The pipeline generates three summary lists:(1) influenced genes, sorted by miRNA identified as in-ducer of coding transcript quantity change, (2) miRNAssorted by genes they are influencing and (3) all interac-tions with significance score (i.e. the number of anti-correlation values supporting the interaction).The Affymetrix probe IDs are transformed into user-
friendly Entrez IDs, HGNC symbols and gene names,which are also easily integrated into third party tools.Each of the lists is available to the user in either CSVformat, or displayed in an HTML report.The final step of the pipeline performs analyses of
gene ontology terms, KEGG pathways, DOLite diseaseontology and user defined Entrez terms. In each case ahypergeometric test is applied to those genes predictedto be influenced by miRNA differential expression toevaluate enrichment of each category. Subsequently, thecorresponding table of terms with test statistics, piechart, bar chart, and concept network of interaction andheatmap of most overrepresented genes featured in eachof the ontology categories is generated. These tables andplots are incorporated into a final HTML report. Themotivation for incorporating such analyses into the pipe-line was to facilitate biological interpretation of the out-put. The lists of miRNAs and differentially repressedmRNAs may by very long; enrichment categories offersthe user a consistent, compact output and simplifies as-sessment of the biological significance of the predictedmRNA – miRNA interactions and direct further valid-ation studies.
Examples of the pipeline results and sample HTMLreports (i.e. basic output of the pipeline, as well as reportsgenerated by performing case-studies) are provided as sup-plementary material (Additional files 3 and 4).
The validation of expression based target prediction andpipeline’s general performanceWe experimentally validated the predictive models bycorrelating the predicted miRNA expressions with theones obtained from microarrays. To validate if stronglyanti-correlated interactions between the predictedmiRNA and measured mRNA expressions can identifyputative target genes we implemented systematic, nu-merical method based on the binding energy betweenthe mature miRNA and 3’ UTR region of the gene. Thegeneral pipeline performance was assayed by comparingthe analyses presented in the GSE19350 validation data-set author’s publication (Wang et al., BMC Genomics.2010) with the output generated by MMpred. Finally, weapplied the analysis pipeline to a number of datasetsto further investigate the validity of predicted miRNA-mRNA interaction networks. Two of the completedcase studies are provided in Supplementary materials(Additional files 5, 6 and 7).
The miRNA-target binding energy base validationThe method we propose is modified “energy walk” pro-cedure described in the paper by Ritchie et al. [30],which utilizes the impact of binding energy in propermiRNA-target pairing [31,32]. The experimentallyproven miRNA-mRNA interactions from miRecords

Stempor et al. BMC Genomics 2012, 13:620 Page 9 of 18http://www.biomedcentral.com/1471-2164/13/620
were sampled in order to calibrate the method. To con-firm the significance of results, two random sets of freebinding energies were calculated: by permutation ofgenes name vector (using the same set of 3’UTRsequences) and by substituting the original set of 3’UTRwith random gene sequences. The results are shown onFigure 6.The study of lowest binding energy distributions revealed
that using fixed free energy cut-off (−20 Kcal, Ritchie et al.)would discard most of validated targets. For this reason wecompared the distributions of minimal energy among themiRNA-target pairs rather than the number of high energybinding sites like in original procedure.To further assay the significance between actual and
randomized energy calculation the Welch Two Samplet-test has been performed. The null hypothesis (true dif-ference in means between actual and randomized data isequal to 0) has been rejected with p-value < 2.2e-16 forboth randomizations. It should be noted that the rando-mized samples have the same mean with p-value = 0.9776.Further, we validated experimentally measured miRNA-
mRNA expression anti-correlation as target identificationmethod using the paired microarray dataset “Comparativegenomics matches mutations and cells to generate faithfulependymoma models” (GSE21687). At first, measuredmiRNA expression matrix was correlated against mRNAexpression matrix. Then the correlations have been filteredusing GetHT function from MMpred pipeline with correl-ation cut-off equal −0.6. The predicted interactions weresubjected to the same procedure as miRecords interactions.Two randomized energy calculations have been prepared:using permutated vector of predicted targets (Figure 6) andthe permutated target sequence (not shown on the figure).The mean of predicted targets is significantly different
35 30 25
0.00
0.04
0.08
0.12
Free e
Den
sity
Validated interactionsPermuted vector of validated targetsRandom 3’UTR sequences
Figure 6 The distribution of calculated free energies in validated targby sampling 3240 sequences of 3’UTR human target genes for optimal miRnumber of free energy calculations.
from the randomized values (p-values of 2.925e-11 and5.663e-07; Welch Two Sample t-test). Furthermore, thedistribution is similar to validated targets (p-value =0.3748; Welch Two Sample t-test).Finally, to assess both predictive power of miRNA ex-
pression predictor and targets predictive capabilities, thefull MMpred pipeline has been run on GSE21687mRNA expression data only, repeating the same freeenergy calculation procedure (distribution shown onFigure 7 as blue curve). The distribution is similar toboth miRecords and experimental data driven distribu-tions (p-values equals 0.03952 and 0.05833) and dissi-milar to randomized ones (see Figure 8 for all p-valuecomparisons). Comprehensive description of the methodcan be found in Additional file 8.
General performance and usabilityWe compared the analyses presented in Wang et al.publication (BMC Genomics. 2010), which is citing theGSE19350 dataset, with the output of MMpred. The ori-ginal analyses have been performed on paired dataset(miRNA expression assayed by microarray), whileMMpred used mRNA data only (miRNA expression waspredicted). Wang et al. picked signature miRNAs andpredicted their targets. Of the three intragenic miRNAslisted there MMpred determined hsa-mir-218 to besignificantly deregulated. Of the 6 target genes identi-fied for hsa-mir-218 by Wang et al. MMpred wasable to predict 5. Considering 5 MMpred predictionsoverlapping and 1 not overlapping with publisheddata, 146 other MMpred predictions and 21835 otherpossible predictions (based on 21976 protein coding ge-nes represented on HGU-133plus2 microarray; source:Ensembl67) the Fisher's exact test p-value equals 8.52e-11.
20 15 10 5
nergy [KCal]
ets set driven from miRecords. The calculation has been obtainedNA binding free energy. The randomized sampling contains the same

35 30 25 20 15 10 5
0.00
0.02
0.04
0.06
0.08
0.10
0.12
Free energy [KCal]
Den
sity
Interactions predicted using measured miRNA expression
Permuted vector of predicted targets
Interactions predicted using predicted miRNA expression from mRNA expression
miRecords validated interactions (for reference)
Figure 7 The distribution of calculated free energies in expression anti-correlation based target predictions. The calculations have beenobtained by sampling sequences of 697 3’UTR human target genes candidates for experimental miRNA expression dataset and 26 for predictordrive miRNA expression (full MMpred pipeline). The randomized sampling contains 697 free energy calculations.
Stempor et al. BMC Genomics 2012, 13:620 Page 10 of 18http://www.biomedcentral.com/1471-2164/13/620
Moreover, the downstream analyses performed by Wanget al. and automated MMpred pipeline output shows sig-nificant overlap; e.g. MMpred identified 4 out of 5 topKEGG pathways (total of 7 KEGG pathways identifiedby Wang et al.). The presented results were obtainedusing default MMpred settings and input dataset have
Validated miRecords
targets
Randomized miRecords 1
Randomized miRecords 2
e
Validated miRecords
targets6.01E-31 9.96E-31
Randomized miRecords 1
6.01E-31 0.977604
Randomized miRecords 2
9.96E-31 0.977604
Measured expression predicted
0.374818 7.58E-14 8.77E-14
Measured expression
randomized 11.33E-13 0.133514 0.129887
Measured expression
randomized 21.45E-08 0.168947 0.174625
mRNA only expression predicted
0.039524 0.001974 0.001990
Figure 8 P-values obtained from Welch Two Sample t-test. The cases w(p-value cut-off equals 0.01), otherwise marked in green.
never been used for training the predictive model. Re-mapping the miRNAs both to their host genes and tothe transcripts represented on mRNA expression arraysusing the most recent releases of miRbase and Ensembledatabases enhances the prediction power even further.The examples of such analyses are provided in Additional
Measured xpression
predicted
Measured expression
randomized 1
Measured expression
randomized 2
mRNAonly expression predicted
0.374818 1.33E-13 1.45E-08 0.039524
7.58E-14 0.133514 0.168947 0.001974
8.77E-14 0.129887 0.174625 0.001990
2.92E-11 5.66E-07 0.058329
2.92E-11 0.026457 0.000946
5.66E-07 0.026457 0.003859
0.058329 0.000946 0.003859
here the null hypothesis has been rejected are marked in red

Stempor et al. BMC Genomics 2012, 13:620 Page 11 of 18http://www.biomedcentral.com/1471-2164/13/620
file 8. Presented examples clearly illustrates that MMpredis capable of generating similar results to that obtainedusing paired datasets (considering the limitation to intra-genic miRNA).
DiscussionThe primary objective of the reported model is to facili-tate miRNA focussed analyses of the large body ofmRNA expression data available in public repositories.Extensive, long term usage of microarray gene expres-sion assays in clinical studies has produced a vast reposi-tory of extremely valuable, well-designed datasets. Thisis in contrast to the very limited miRNA expressiondatasets available in the public domain. Our modelenables inexpensive hypothesis generation regardingmiRNA regulatory events, from this vast repository ofmRNA expression datasets. The primary assumptionimplemented in the pipeline is that analyses of correl-ation between regulatory host genes and miRNAs can beused to predict miRNA regulatory networks. Since themajority of human microRNAs are co-expressed withhost genes we propose that expression of these miRNAsis positively correlated to their host transcripts. That is,over-expression of host genes indicates a positive foldchange of miRNA copy number and visa-versa. A furtherassumption is that such microRNAs are expressed in thesame quantity and at the same time as their respectivehost genes (i.e. we conveniently neglect the maturationprocess and post-transcriptional regulation of miRNA,of which little is currently known).In contrast, miRNAs promote target gene degradation,
which is in turn detected as a lower expression signal onmRNA microarrays. These two dependences were usedto create a general mathematical model of miRNA ex-pression prediction and to predict regulatory miRNAnetworks. The model was initially validated using nu-merical coherence between predicted and experimentaldata achieving a significant degree of correlation. Subse-quent functional hypothesis generation using model pre-dictions was evaluated by completing case studies withthree previously reported mRNA expression datasets(GSE11327 [33], GSE11375 [34] and GSE19743 [35]). Allillustrated cases indicate that it is feasible to predictwhat appears to be biologically coherent miRNA-mRNAregulatory networks using only mRNA expression data.Further systematic validation of target prediction wassuccessfully accomplished by analysing the distributionof free binding energy between miRNAs and predictedtarget’s 3’ UTR region. We showed that the predictedbinding energy distribution is similar to energy distribu-tion driven from miRecords [36] validated targets data-base, and significantly different from randomized one(see Additional file 9 for details).
Possible applications of the pipeline include, miRNAtarget prediction, constructing putative miRNA regula-tory clusters and a cost efficient means of generating alarge number of predicted differential miRNA expressionprofiles from the vast repository of human mRNA datain the public domain.Methodology similar to MMpred was previously
reported. For example, several tools utilises miRNA-targets anti-correlation to rank the computational targetpredictions (usually sequence matching or homologybased) and identify ones, which are most probable to bea true biological hits. The validation is usually performedby experimental assays or measuring the enrichment inoverlap between top ranked predictions and validatedmiRNA targets. A noteworthy example is the HOCTARmethod [37,38], which uses large collection of mRNAexpression profiles (utilizing both host genes’ correlationand anti-correlation with targets) to score predictionsfrom PicTar, TargetScan, and miRanda. Similar approachis proposed in GenMiR++ method [39], though thismethod does not utilize host genes interaction andrequires paired miRNA-mRNA microarray datasets. Fur-thermore, a method developed by Ritchie et al. uses ex-pression patterns conserved between human and mouseto predict miRNA targets more accurately [30]. More-over, several assays not focussed on target prediction usesimilar methodology as a validation technique: e.g. the“enrichment score” proposed by Biasiolo et al. [40]. Des-pite several published methods focusing on the correl-ation of expression patterns we strongly believe thatMMpred is a significant improvement and valuableaddition to the field. While other methods study largecollections of expression experiments and provide gen-eral target predictions MMpred focuses on case specifictargets, which are under differential control of differen-tially expressed miRNAs. Furthermore MMpred is inde-pendent of both external target predictions and miRNAexpression data. The model predicts and functionallyannotates dataset specific miRNA regulatory networksusing abundant coding gene expression data.However, before applying the model one must be
aware of it’s limitations. In particular, the predictor doesnot determine if genes connected within the functionalcategory are suppressed by miRNA, or that the suppres-sion normally existing in the control group has beenalleviated. The pipeline does identify if the expression ofdifferentially regulated genes is significantly anti-correlated with the expression of one more predictedmiRNA. The direction of regulation (i.e. up-regulationby lifting miRNA suppression or down-regulation byintroducing miRNA suppression and degradation) isdetermined using fold change calculations.The functional analyses (i.e. GO, KEGG, DO and user
determined Entrez terms) are performed using predicted

Stempor et al. BMC Genomics 2012, 13:620 Page 12 of 18http://www.biomedcentral.com/1471-2164/13/620
target gene annotation. MicroRNAs are poorly anno-tated, with no consistent ontology. Many miRNAs arereported to regulate a large numbers of genes so it isvery difficult to determine the primary miRNA function.To determine the specific function of miRNA in a givenexpression set both the combined predictions and over-representation testing of significant miRNA targets isrequired.Although the gene ID method was chosen as the de-
fault pipeline’s mapping generator, other tested methods(i.e. direct string matching and genomic location) arealso worthy of consideration. Apart from the associatedcomputational complexity a string matching approachwould be expected to generate the most accurate results.Moreover, this method generates a number of pre-miRNA sequence overlaps with each gene sequence,which could be used to boost the predictor’s accuracy.However this approach is likely to also produce falsenegatives, as partial miRNA-mRNA matches may still beco-expressed. Furthermore, the changes that would beincurred with different human genome assembly ver-sions may introduce unwanted variability of mappings.The validation of predictors indicated that for many
intronic miRNAs the linear model predictor performedbetter, though in a few cases the scaling functions per-formed best. For that reason we decided to implementboth predictors in the pipeline. The number of miRNApredicted to be significantly misregulated after perform-ing auto-generated cut-off may differ considerably foreach of the predictors. In certain extreme cases theremay be no miRNA found significantly over- or under-expressed by one or both predictors. If only one
(A) (B
Figure 9 Correlation box. (A) Top500 mRNA transcripts ranked by p-valuThe group presenting good linear correlation is featured with green regresfeatured with red one. (B) Messenger RNA transcripts expression index (X-aexpressions index (Y-axis). No expression indexes dependence is visible on
predictor returns significant miRNAs the pipeline willcontinue to execute. If both predictors return no signifi-cant result further analyses is impossible and the processwill terminate. In such scenarios the user would eitheradjust the cut-off parameter or re-evaluate the experi-ment design. A union of the predictions is used to reporta consensus result. When using the linear model ap-proach fold change values are generally smaller and pos-sibly more likely to reflect experimental fold change.This is due to the specificity of this predictor – that isthe linear model uses coefficients fitted using the experi-mental data, hence making its predictions more accur-ate. In contrast, the coefficients of the scaling functionsare chosen manually and the final coefficient is a prod-uct of the multiplication. This approach may overesti-mate the fold change value of genes/miRNAs with highexpression index. Beside linear predictors some higherorder predicting methods (e.g. Generalized Linear Model(GLM), Neural Networks and Genetic Algorithms) havebeen tested without any significant improvement to thepipeline’s performance.The interactions derived from correlation analyses
support the biological rational of the predictors. Ourfirst investigation is an assessment of the top 500mRNA intronic transcripts expression (“Integrative gen-omic profiling of human prostate cancer”, GSE21032dataset [26]) ranked by the absolute value of foldchange plotted against expression indexes of corre-sponding miRNAs (Figure 9A). The visualized tran-scripts can be divided into two subsets. The first onepresents a strong linear correlation. In the second,increased mRNA expression have not been reflected in
)
e (X-axis) plotted against corresponding miRNA expressions (Y-axis).sion line, while the group with no expression indexes dependence isxis) plotted against corresponding exotic miRNA transcripts’this plot.

Stempor et al. BMC Genomics 2012, 13:620 Page 13 of 18http://www.biomedcentral.com/1471-2164/13/620
a higher miRNA expression index. This perfectly illus-trates the biological dependence between microRNAand its host genes (i.e. the pri-miRNA transcript mustbe transcribed along with the mRNA to be processedand then detected on the microarray as maturemiRNA). Given this define relationship no miRNA withhigh expression corresponds to a mRNA with low ex-pression. In contrast there are many observed mRNAwith high expression values corresponding to miRNAwith very low expression indexes. This likely to occuras posttranscriptional regulation is an important factorboth during miRNA transport and maturation, so sim-ply expressing a pre-miRNA transcript does not guar-antee it will be processed to the mature form. Suchrelationships introduce a danger that the model mayproduce a significant number of false positives, but therisk of false negatives is minimal. Exonic transcriptsthat overlap with pri-miRNA have been used as nega-tive control. Our rational being that those transcriptsare primarily used to generate mRNA, and our modelassumes that they are not available for miRNA proces-sing, so the probability of maturating into a functionalmiRNA is minimal. This is confirmed when observingthe scatter plot of expressions (Figure 9B) - where nu-merous highly expressed miRNAs map to mRNA withvery low expression index and also highly expressedmRNA corresponding to miRNA with very low expres-sion indexes. Furthermore, the distribution of inter-mediate points seems random, as there is no significantlinear correlation present in the exonic transcripts.
ConclusionsWe present details of MMpred, a novel and generallyapplicable mathematical model of miRNA-mRNA inter-actions predicted from mRNA expression data. Themethod enables cost and time efficient hypotheses build-ing of both miRNA differential expression and miRNA-mRNA interactions using retrospective analyses of pub-licly available mRNA microarray datasets. The notableadvantage of the model is the creation of case specificpredictions of miRNA-mRNA signalling networks frommRNA datasets. Contrary to the approach applied byother miRNA target prediction tools, that aim to find allpossible miRNA-target repression interactions, ourminimalistic, case specific approach reduces the burdenof numerous false discovery rates. Additionally, thefewer number of significant targets returned by the pre-diction pipeline simplifies associated functional analysesof the predicted networks.The MMpred pipeline reports the functional enrichment
categories of the most likely miRNA-mRNA relationshipsgiven the experimentally determined differential geneexpression profile. The data are presented in a succinctmanner to facilitate testable hypothesis generation of the
predicted miRNA-mRNA interaction networks. For ex-ample, the comparative burn and blunt injuries case studyindicates that miRNAs repressing immune system cells’metabolic genes are down-regulated in order to relief themetabolic lock of inflammatory response, thus protectingthe organism against infections and promoting the regen-eration process (see Additional file 5). The predicted sig-nalling mechanism appears biologically meaningful andfacilitates the design of further experimental validationstudies.The MMpred model is implemented as an R package
and is suitable for further community validation (details inthe Supplementary materials). Our validation showed sig-nificant prediction power and ability to partially reproduceresults obtained by analysing paired expression datasets.The reported case studies indicate that the method pre-dicts biologically coherent miRNA-mRNA networks andthat the approach will add value to current miRNA regula-tory network analysis efforts. Consequently, we believeMMpred is a useful tool for mining the vast mRNA ex-pression data resources and screening for potential miRNAtargets and miRNA-mRNA functional modules.
MethodsThe mathematical bases of the predictors and correlationanalysesThe scaling function predictor can be summarized as setof vector equations and implemented as required in themodel:
^emiRNA Estimated microRNA expression index
eaffy⇀ Vector of mRNAs expression indexesEaffy Expression matrix of mRNA obtained from
Affymetrix microarrayEmiRNA Expression matrix of miRNA obtained from
Agilent microarrayFCi Fold change of i-th mRNA present on Affyme-
trix arraypvali p-value (from Student’s t-test or ANOVA) statis-
tic of i-th mRNA present on Affymetrix arrayksense Strain dependant coefficient (1.2 for sense 0.8
for antisense)koverlap Overlap dependant coefficient (2 for intronic
0.8 for exonic, 3’UTR, 5’UTR)kevidence Evidence dependant coefficient (1.2 for experi-
mentally determined 0.8 for predicted)
Equation 1 - General formula for the scaling functionpredictor
emiRNA^¼ mean eaffy⇀ � ω⇀� �
Equation 2 - Mapping function
eaffy⇀ ¼ f : Eaffy→EmiRNA
Stempor et al. BMC Genomics 2012, 13:620 Page 14 of 18http://www.biomedcentral.com/1471-2164/13/620
Equation 3 - Weight vector
ω⇀ ¼ ω1;ω2; . . . ;ωnf g; n ¼ length eaffy⇀� �
Equation 4 - Scaling coefficients determining weightvector elements
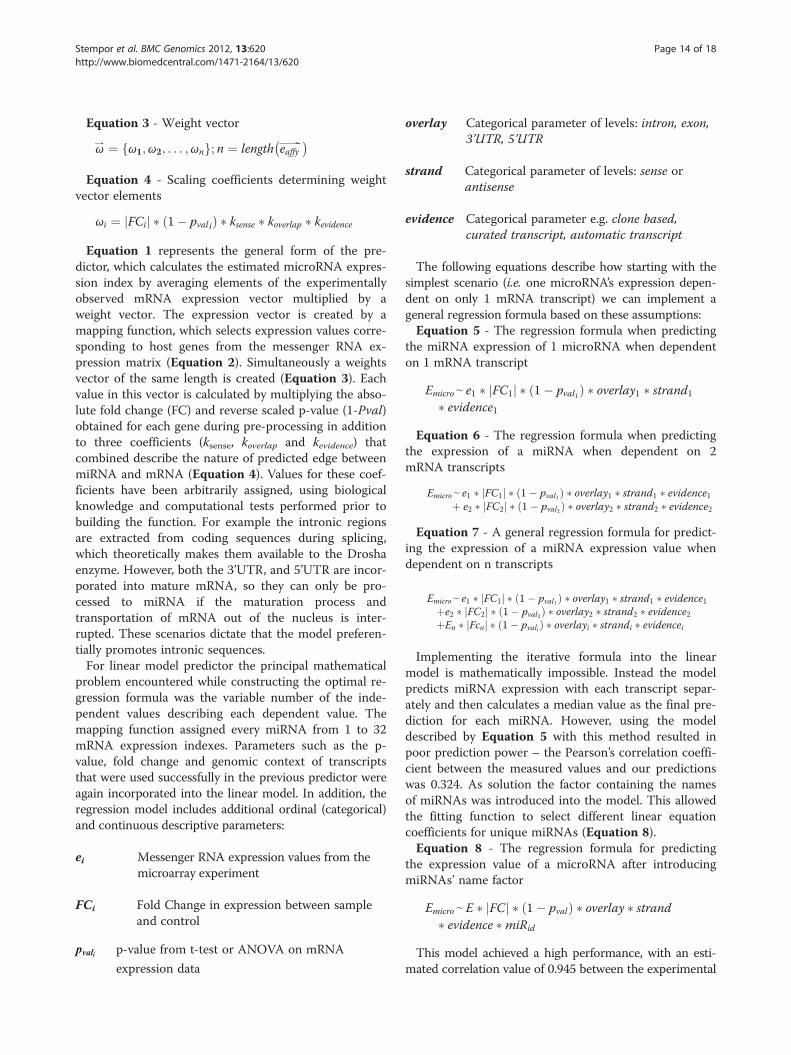
ωi ¼ FCij j � 1� pvalið Þ � ksense � koverlap � kevidenceEquation 1 represents the general form of the pre-
dictor, which calculates the estimated microRNA expres-sion index by averaging elements of the experimentallyobserved mRNA expression vector multiplied by aweight vector. The expression vector is created by amapping function, which selects expression values corre-sponding to host genes from the messenger RNA ex-pression matrix (Equation 2). Simultaneously a weightsvector of the same length is created (Equation 3). Eachvalue in this vector is calculated by multiplying the abso-lute fold change (FC) and reverse scaled p-value (1-Pval)obtained for each gene during pre-processing in additionto three coefficients (ksense, koverlap and kevidence) thatcombined describe the nature of predicted edge betweenmiRNA and mRNA (Equation 4). Values for these coef-ficients have been arbitrarily assigned, using biologicalknowledge and computational tests performed prior tobuilding the function. For example the intronic regionsare extracted from coding sequences during splicing,which theoretically makes them available to the Droshaenzyme. However, both the 3’UTR, and 5’UTR are incor-porated into mature mRNA, so they can only be pro-cessed to miRNA if the maturation process andtransportation of mRNA out of the nucleus is inter-rupted. These scenarios dictate that the model preferen-tially promotes intronic sequences.For linear model predictor the principal mathematical
problem encountered while constructing the optimal re-gression formula was the variable number of the inde-pendent values describing each dependent value. Themapping function assigned every miRNA from 1 to 32mRNA expression indexes. Parameters such as the p-value, fold change and genomic context of transcriptsthat were used successfully in the previous predictor wereagain incorporated into the linear model. In addition, theregression model includes additional ordinal (categorical)and continuous descriptive parameters:
ei Messenger RNA expression values from themicroarray experiment
FCi Fold Change in expression between sampleand control
pvali p-value from t-test or ANOVA on mRNA
expression data
overlay Categorical parameter of levels: intron, exon,3’UTR, 5’UTR
strand Categorical parameter of levels: sense orantisense
evidence Categorical parameter e.g. clone based,curated transcript, automatic transcript
The following equations describe how starting with thesimplest scenario (i.e. one microRNA’s expression depen-dent on only 1 mRNA transcript) we can implement ageneral regression formula based on these assumptions:Equation 5 - The regression formula when predicting
the miRNA expression of 1 microRNA when dependenton 1 mRNA transcript
Emicroe e1 � FC1j j � 1� pval1ð Þ � overlay1 � strand1� evidence1
Equation 6 - The regression formula when predictingthe expression of a miRNA when dependent on 2mRNA transcripts
Emicroe e1 � FC1j j � 1� pval1ð Þ � overlay1 � strand1 � evidence1þ e2 � FC2j j � 1� pval2ð Þ � overlay2 � strand2 � evidence2
Equation 7 - A general regression formula for predict-ing the expression of a miRNA expression value whendependent on n transcripts
Emicroe e1 � FC1j j � 1� pval1ð Þ � overlay1 � strand1 � evidence1þe2 � FC2j j � 1� pval2ð Þ � overlay2 � strand2 � evidence2þEn � Fcnj j � 1� pvalið Þ � overlayi � strandi � evidencei
Implementing the iterative formula into the linearmodel is mathematically impossible. Instead the modelpredicts miRNA expression with each transcript separ-ately and then calculates a median value as the final pre-diction for each miRNA. However, using the modeldescribed by Equation 5 with this method resulted inpoor prediction power – the Pearson’s correlation coeffi-cient between the measured values and our predictionswas 0.324. As solution the factor containing the namesof miRNAs was introduced into the model. This allowedthe fitting function to select different linear equationcoefficients for unique miRNAs (Equation 8).Equation 8 - The regression formula for predicting
the expression value of a microRNA after introducingmiRNAs’ name factor
Emicroe E � FCj j � 1� pvalð Þ � overlay � strand� evidence �miRid
This model achieved a high performance, with an esti-mated correlation value of 0.945 between the experimental

Stempor et al. BMC Genomics 2012, 13:620 Page 15 of 18http://www.biomedcentral.com/1471-2164/13/620
values and our predicted values. Additional analyses indi-cated that miRNAs located on antisense strand, exonic,3’UTR and 5’UTR are weakly correlated and may intro-duce noise rather than add to the signal in the model. Pre-filtering these transcripts marginally increased the cor-relation to 0.949. The ambiguous nature of the evidence(i.e. origin of the entry in miRBase) also introduced thenoise. Discarding this independent variable (Equation 9)further increased prediction power to 0.956. This simplifi-cation of the model (Equation 10), based only on mRNAexpression values and miRNA ID factor resulted in a cor-relation coefficient of 0.955. Despite the larger computa-tional complexity the best performing regression formuladescribed by Equation 9 was implemented in the pipeline(Figure 4).Equation 9 - Final regression formula characterised by
the highest prediction power and moderate resourceconsumption.
Emicroe E � FCj j � 1� pvalð Þ �miRid
Equation 10 - Simplified regression formula for thelinear model predictor.
Emicroe E �miRid
Finally the miRNA-mRNA correlation analyses can besimplified to the following formula:Equation 11 - The mathematical bases of miRNA-
mRNA correlation analyses:
ehosts↔correlated
emiRNA
etargets↔anti–correlated
emiRNAg⇒ehosts↔anti–correlatedetargets
R/ Bioconductor implementationDespite the complexity of the model, the R implementa-tion (referred further as the pipeline) has been designedto be simple and user friendly. The pipeline takes as in-put raw Affimetrix CEL files and experiment design vec-tor (or matrix in case of more complicated ANOVAstatistics), which distinguish the biological replicates,time series etc. (e. g. sample versus control in the sim-plest case). The output is HTML formatted report. Thisincludes output of predictors in tabular form, as well asquality assessment plots on statistical pre-processing andperformance of the predictors. Functional analyses pre-sented as hypergeometric test result tables are supportedby pie charts, bar plots, interaction concept networksand annotated heatmaps (provided by R/BioconductorGeneAnswers library). The primary pipeline interface isin the form of a command-line R console, however userswith different requirements may use a convenient graph-ical user interface (GUI) build with GTK+. Most advanced
users may benefit on the modular structure of the pipe-line, which facilitate applying changes to the componentsand utilising single modules in third party projects.An explicit documentation explaining the interfaces,
system requirements and implementation structure isavailable as Additional file 10. The MMpred softwareimplemented as R scripts and distributed under BSD li-cence is attached as Additional file 11.
Pre-processing of raw array data in RThe expression matrices for both array types were ob-tained by performing standard Robust Multi-chip Averageprocedure [22] – the probes signal was obtained from per-fect match (PM) probes; the quantiles method was incor-porated for cross-array normalization and MedianPolishfor summarization of the results. The BioConductor Affylibrary was used for processing HG-U133Plus2 chips, andthe same functions ported in AgiMicroRna library wereincorporated for Agilent miRNA 2.0 arrays.
Correlation matrixThe idea of creating correlation matrices has beeninspired by mathematical procedures present in regres-sion analyses. The independent variables are being cor-related against each other to assess their independence.The important differences are that regression analysesmethod operates on vectors, creates square matrices andaims to minimize the absolute value of correlation: cor-relation close to 0 indicates that independent variablesare not biased to describe each other. The method thatwe have developed operates on arrays – though can betreated as reducing the dimensionality of the data. Thebasic assumption is that the expression matrices calcu-lated using every paired dataset have the same numberof columns – the same quantity of arrays must be usedto assay miRNA and mRNA, and different number ofrows – there is much more coding genes than miRNAs.Every row of the miRNA array is correlated against eachrow of the mRNA array and the correlation coefficient iscaptured – this way two matrices are collapsed into one,which shares the number of rows with miRNA’s expres-sion matrix. The number of columns is equal to thenumber of rows present in mRNA array.The most correlation comprehensive investigation has
been made on the “Integrative genomic profiling ofhuman prostate cancer” (GSE21032) dataset. 1,411,189exons are represented on the Affymetrix Human Exon1.0 ST array. Agilent Human miRNA Microarray 2.0captures the expression of 821 different miRNAs andcontrol quality sets. In constructing the correlation ma-trix quality control probesets and viral miRNA have alsobeen correlated to mRNA for negative control. The outputmatrix, size of 821 × 1,411,189, has captured 1,158,586,169 correlation coefficients.
Stempor et al. BMC Genomics 2012, 13:620 Page 16 of 18http://www.biomedcentral.com/1471-2164/13/620
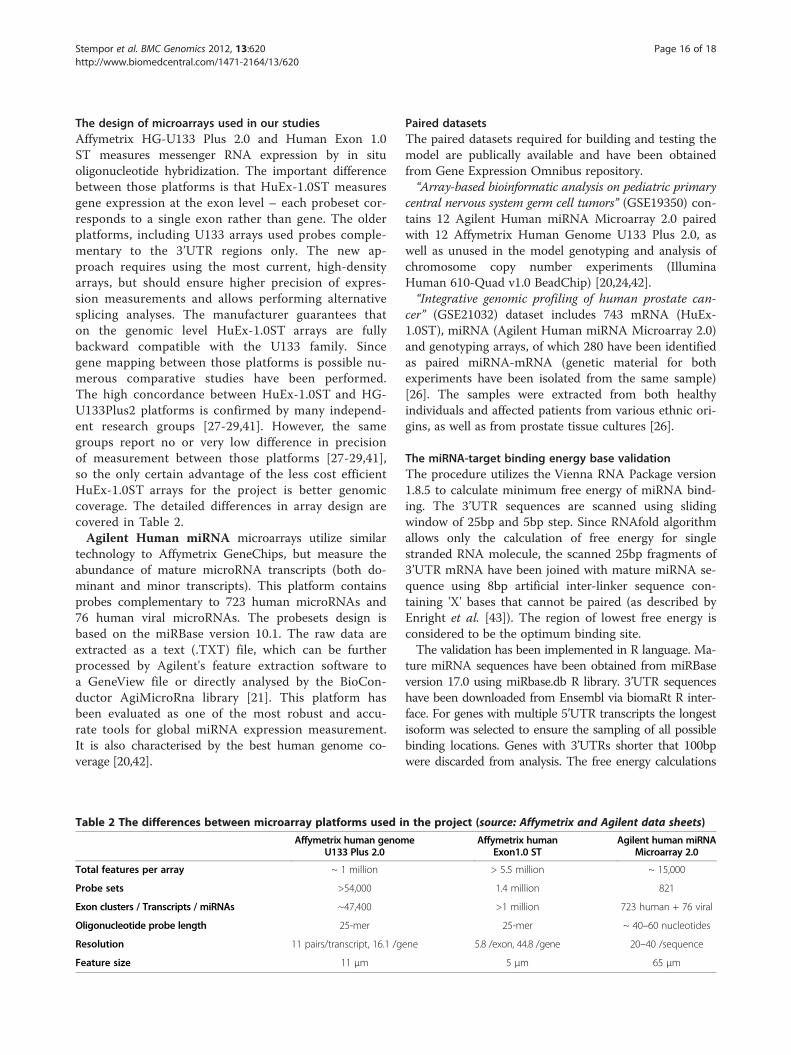
The design of microarrays used in our studiesAffymetrix HG-U133 Plus 2.0 and Human Exon 1.0ST measures messenger RNA expression by in situoligonucleotide hybridization. The important differencebetween those platforms is that HuEx-1.0ST measuresgene expression at the exon level – each probeset cor-responds to a single exon rather than gene. The olderplatforms, including U133 arrays used probes comple-mentary to the 3’UTR regions only. The new ap-proach requires using the most current, high-densityarrays, but should ensure higher precision of expres-sion measurements and allows performing alternativesplicing analyses. The manufacturer guarantees thaton the genomic level HuEx-1.0ST arrays are fullybackward compatible with the U133 family. Sincegene mapping between those platforms is possible nu-merous comparative studies have been performed.The high concordance between HuEx-1.0ST and HG-U133Plus2 platforms is confirmed by many independ-ent research groups [27-29,41]. However, the samegroups report no or very low difference in precisionof measurement between those platforms [27-29,41],so the only certain advantage of the less cost efficientHuEx-1.0ST arrays for the project is better genomiccoverage. The detailed differences in array design arecovered in Table 2.Agilent Human miRNA microarrays utilize similar
technology to Affymetrix GeneChips, but measure theabundance of mature microRNA transcripts (both do-minant and minor transcripts). This platform containsprobes complementary to 723 human microRNAs and76 human viral microRNAs. The probesets design isbased on the miRBase version 10.1. The raw data areextracted as a text (.TXT) file, which can be furtherprocessed by Agilent's feature extraction software toa GeneView file or directly analysed by the BioCon-ductor AgiMicroRna library [21]. This platform hasbeen evaluated as one of the most robust and accu-rate tools for global miRNA expression measurement.It is also characterised by the best human genome co-verage [20,42].
Table 2 The differences between microarray platforms used i
Affymetrix human genomU133 Plus 2.0
Total features per array ~ 1 million
Probe sets >54,000
Exon clusters / Transcripts / miRNAs ~47,400
Oligonucleotide probe length 25-mer
Resolution 11 pairs/transcript, 16.1 /g
Feature size 11 μm
Paired datasetsThe paired datasets required for building and testing themodel are publically available and have been obtainedfrom Gene Expression Omnibus repository.“Array-based bioinformatic analysis on pediatric primary
central nervous system germ cell tumors” (GSE19350) con-tains 12 Agilent Human miRNA Microarray 2.0 pairedwith 12 Affymetrix Human Genome U133 Plus 2.0, aswell as unused in the model genotyping and analysis ofchromosome copy number experiments (IlluminaHuman 610-Quad v1.0 BeadChip) [20,24,42].“Integrative genomic profiling of human prostate can-
cer” (GSE21032) dataset includes 743 mRNA (HuEx-1.0ST), miRNA (Agilent Human miRNA Microarray 2.0)and genotyping arrays, of which 280 have been identifiedas paired miRNA-mRNA (genetic material for bothexperiments have been isolated from the same sample)[26]. The samples were extracted from both healthyindividuals and affected patients from various ethnic ori-gins, as well as from prostate tissue cultures [26].
The miRNA-target binding energy base validationThe procedure utilizes the Vienna RNA Package version1.8.5 to calculate minimum free energy of miRNA bind-ing. The 3’UTR sequences are scanned using slidingwindow of 25bp and 5bp step. Since RNAfold algorithmallows only the calculation of free energy for singlestranded RNA molecule, the scanned 25bp fragments of3’UTR mRNA have been joined with mature miRNA se-quence using 8bp artificial inter-linker sequence con-taining 'X' bases that cannot be paired (as described byEnright et al. [43]). The region of lowest free energy isconsidered to be the optimum binding site.The validation has been implemented in R language. Ma-
ture miRNA sequences have been obtained from miRBaseversion 17.0 using miRbase.db R library. 3’UTR sequenceshave been downloaded from Ensembl via biomaRt R inter-face. For genes with multiple 5’UTR transcripts the longestisoform was selected to ensure the sampling of all possiblebinding locations. Genes with 3’UTRs shorter that 100bpwere discarded from analysis. The free energy calculations
n the project (source: Affymetrix and Agilent data sheets)
e Affymetrix humanExon1.0 ST
Agilent human miRNAMicroarray 2.0
> 5.5 million ~ 15,000
1.4 million 821
>1 million 723 human + 76 viral
25-mer ~ 40–60 nucleotides
ene 5.8 /exon, 44.8 /gene 20–40 /sequence
5 μm 65 μm

Stempor et al. BMC Genomics 2012, 13:620 Page 17 of 18http://www.biomedcentral.com/1471-2164/13/620
have been executed using GeneRfold R interface for ViennaRNA library. The miRecords (version 3, mirecords.biolead.org/download.php) have been used as comprehensive col-lection of validated targets.
Additional files
Additional file 1: Summary of all miRNA datasets performed onpopular platforms in GEO (represented by at least 25 arrays, datafrom July 2011). Paired datasets are marked in green with mRNA arrayplatform and number of samples stated). Description and remarks: All thedata have been derived from NCBI Gene Expression Omnibus (http://www.ncbi.nlm.nih.gov/geo/). The newest and most advanced, 3rd versionof Agilent Human miRNA is represented only by 49 samples, gathered in5 datasets. The older Agilent array (version 2.0, capable of measuring 723microRNAs), listed currently as most popular global miRNA expressiontest in GEO is represented only by 17 datasets containing 539 samples.Among 10 major miRNA microarray platforms available in GEO (thoseplatforms are represented by more than 25 arrays) only 23 experimentshave been identified as paired miRNA-mRNA. The vast majority of thoseassays concern large cancer tissue expression studies, so the chance offinding a dataset on different biological subject is relatively low.
Additional file 2: The complete mapping table in CSV format.Filtered for sense intronic transcripts only.
Additional file 3: Sample pipeline outputs in HTML format(compressed file).
Additional file 4: Overview of the pipeline outputs (raw MMpredoutput for both case studies).
Additional file 5: The short description of analysed case studies.
Additional file 6: Detailed report on case study I: Toll-like 4receptor activated by Lipopolysaccharide (LPS).
Additional file 7: Detailed report on case study II: Comparison ofmiRNA regulation in human severe blunt trauma and severe burninjury.
Additional file 8: Systematic validation of target prediction by thesimilarity of binding free energy distribution with miRecords.
Additional file 9: Examples of MMpred predictions supported byexperimental data and mapping against current databases.
Additional file 10: The detailed description of softwareimplementation in R language.
Additional file 11: The R implementation of the presented method:MMpred.
Abbreviationspri-miRNA: primary micro ribonucleic acid; pre-miRNA: precursor microribonucleic acid; RISC: RNA-induced silencing complex; Nt: nucleotides;HG-U133Plus2: Affymetrix GeneChip Human Genome U133 Plus 2.0 Array;HuEx-1.0ST: Affymetrix GeneChip Human Exon 1.0 ST Array; RMA: RobustMulti-array Average; GEO: Gene Expression Omnibus; GO: Gene Ontology;DO: Disease Ontology; KEGG: Kyoto Encyclopedia of Genes and Genomes.
Competing interestsThe authors declare that they have no competing interests.
Authors’ contributionsPS, MC and PW conceived and planned the project. PS developed,implemented and tested the algorithm, plus performed the analyses. PS, MCand PW co-authored the paper. All authors read and approved the finalmanuscript.
AcknowledgementsThis work was funded by the GlaxoSmithKline Medicine Research Centre. Wewould like to thank GlaxoSmithKline for providing HPC resources vital tocomplete the project, as well as Cranfield University for substantial support.
We also thank authors of utilized microarray datasets for providing publicallyavailable, high quality experimental data.
Received: 13 December 2011 Accepted: 2 October 2012Published: 14 November 2012
References1. Taft RJ, Pang KC, Mercer TR, Dinger M, Mattick JS: Non-coding RNAs:
regulators of disease. J Pathol 2010, 220:126–139.2. Filipowicz W, Jaskiewicz L, Kolb FA, Pillai RS: Post-transcriptional gene
silencing by siRNAs and miRNAs. Curr Opin Struct Biol 2005, 15:331–341.3. Krispies R: Genetics. Small RNAs Reveal an Activating Side. Science (New
York, N.Y.) 2006, 314:741–742.4. Hu Z: Insight into microRNA regulation by analyzing the characteristics
of their targets in humans. BMC Genomics 2009, 10:594.5. Pauley KM, Cha S, Chan EKL: MicroRNA in autoimmunity and autoimmune
diseases. J Autoimmun 2009, 32:189–194.6. Griffiths Jones S, Saini HK, Dongen S, van Enright AJ: miRBase: tools for
microRNA genomics. Nucleic Acids Res 2008, 36:D154–D158.7. Taft RJ, Pheasant M, Mattick JS: The relationship between non-protein-
coding DNA and eukaryotic complexity. BioEssays 2007, 29:288–299.8. Baskerville S, Bartel DP: Array profiling of microRNAs reveals frequent
coexpression with neighboring miRNAs and host genes. RNA (New York,N.Y.) 2005, 11:241–247.
9. Corcoran DL, Pandit KV, Gordon B, Bhattacharjee A, Kaminski N, Benos PV:Features of mammalian microRNA promoters emerge from polymerase IIchromatin immunoprecipitation data. PLoS One 2009, 4:e5279.
10. Lutter D, Marr C, Krumsiek J, Lang EW, Theis FJ: Intronic microRNAssupport their host genes by mediating synergistic and antagonisticregulatory effects. BMC Genomics 2010, 11:224.
11. Rodriguez A, Griffiths-Jones S, Ashurst JL, Bradley A: Identification ofmammalian microRNA host genes and transcription units. Genome Res2004, 14:1902–1910.
12. Kim Y-K, Kim VN: Processing of intronic microRNAs. EMBO J 2007, 26:775–783.13. Barik S: An intronic microRNA silences genes that are functionally
antagonistic to its host gene. Nucleic Acids Res 2008, 36:5232–5241.14. Zhu Y, Kalbfleisch T, Brennan MD, Li Y: A MicroRNA gene is hosted in an intron
of a schizophrenia-susceptibility gene. Schizophr Res 2009, 109:86–89.15. Callis TE, Pandya K, Seok HY, Tang R-H, Tatsuguchi M, Huang Z-P, Chen J-F,
Deng Z, Gunn B, Shumate J, Willis MS, Selzman CH, Wang D-Z: MicroRNA-208a is a regulator of cardiac hypertrophy and conduction in mice. J ClinInvest 2009, 119:2772–2786.
16. Farh KK-H, Grimson A, Jan C, Lewis BP, Johnston WK, Lim LP, Burge CB,Bartel DP: The widespread impact of mammalian MicroRNAs on mRNArepression and evolution. Science (New York, N.Y.) 2005, 310:1817–1821.
17. Chen C-Z, Li L, Lodish HF, Bartel DP: MicroRNAs modulate hematopoieticlineage differentiation. Science (New York, N.Y.) 2004, 303:83–86.
18. Wulczyn FG, Smirnova L, Rybak A, Brandt C, Kwidzinski E, Ninnemann O,Strehle M, Seiler A, Schumacher S, Nitsch R: Post-transcriptional regulationof the let-7 microRNA during neural cell specification. FASEB J 2007,21:415–426.
19. Tsang J, Zhu J, van Oudenaarden A: MicroRNA-mediated feedback andfeedforward loops are recurrent network motifs in mammals. Mol Cell2007, 26:753–767.
20. Sah S, McCall MN, Eveleigh D, Wilson M, Irizarry RA: Performanceevaluation of commercial miRNA expression array platforms. BMCresearch notes 2010, 3:80.
21. López-Romero P, González MA, Callejas S, Dopazo A, Irizarry RA: Processingof Agilent microRNA array data. BMC research notes 2010, 3:18.
22. Irizarry RA, Bolstad BM, Collin F, Cope LM, Hobbs B, Speed TP:Summaries of Affymetrix GeneChip probe level data. Nucleic Acids Res2003, 31:e15.
23. Kozomara A, Griffiths-Jones S: miRBase: integrating microRNA annotationand deep-sequencing data. Nucleic Acids Res 2011, 39:D152–D157.
24. Wang H-W, Wu Y-H, Hsieh J-Y, Liang M-L, Chao M-E, Liu D-J, Hsu M-T, WongT-T: Pediatric primary central nervous system germ cell tumors ofdifferent prognosis groups show characteristic miRNome traits andchromosome copy number variations. BMC Genomics 2010, 11:132.
25. Shapiro SS, WILK MB: An analysis of variance test for normality (completesamples). Biometrika 1965, 52:591–611.

Stempor et al. BMC Genomics 2012, 13:620 Page 18 of 18http://www.biomedcentral.com/1471-2164/13/620
26. Taylor BS, Schultz N, Hieronymus H, Gopalan A, Xiao Y, Carver BS, Arora VK,Kaushik P, Cerami E, Reva B: Integrative Genomic Profiling of HumanProstate Cancer. Cancer Cell 2010, 18:11–22.
27. Okoniewski M, Hey Y, Pepper S, Miller C: High correspondence betweenAffymetrix exon and standard expression arrays. Biotechniques 2007,42:181–185.
28. Pradervand S, Paillusson A, Thomas J, Weber J, Wirapati P, Hagenbüchle O,Harshman K: Affymetrix Whole-Transcript Human Gene 1.0 ST array ishighly concordant with standard 3’ expression arrays. Biotechniques 2008,44:759–762.
29. Robinson MD, Speed TP: A comparison of Affymetrix gene expressionarrays. BMC Bioinformatics 2007, 8:449.
30. Ritchie W, Rajasekhar M, Flamant S, Rasko JEJ: Conserved expressionpatterns predict microRNA targets. PLoS Comput Biol 2009, 5:e1000513.
31. Kertesz M, Iovino N, Unnerstall U, Gaul U, Segal E: The role of site accessibilityin microRNA target recognition. Nat Genet 2007, 39:1278–1284.
32. Long D, Lee R, Williams P, Chan CY, Ambros V, Ding Y: Potent effect of targetstructure on microRNA function. Nat Struct Mol Biol 2007, 14:287–294.
33. Dohnal AM, Luger R, Paul P, Fuchs D, Felzmann T: CD40 ligation restorestype 1 polarizing capacity in TLR4 activated dendritic cells that haveceased interleukin-12 expression. J Cell Mol Med 2009, 13:1741–1750.
34. Warren HS, Elson CM, Hayden DL, Schoenfeld DA, Cobb JP, Maier RV,Moldawer LL, Moore EE, Harbrecht BG, Pelak K, Cuschieri J, Herndon DN,Jeschke MG, Finnerty CC, Brownstein BH, Hennessy L, Mason PH, TompkinsRG: A genomic score prognostic of outcome in trauma patients. Mol Med(Cambridge, Mass.) 2009, 15:220–227.
35. Zhou B, Xu W, Herndon D, Tompkins R, Davis R, Xiao W, Wong WH, TonerM, Warren HS, Schoenfeld DA, Rahme L, McDonald-Smith GP, Hayden D,Mason P, Fagan S, Yu Y-M, Cobb JP, Remick DG, Mannick JA, Lederer JA,Gamelli RL, Silver GM, West MA, Shapiro MB, Smith R, Camp DG, Qian W,Storey J, Mindrinos M, Tibshirani R, Lowry S, Calvano S, Chaudry I, Cohen M,Moore EE, Johnson J, Moldawer LL, Baker HV, Efron PA, Balis UGJ, Billiar TR,Ochoa JB, Sperry JL, Miller-Graziano CL, De AK, Bankey PE, Finnerty CC,Jeschke MG, Minei JP, Arnoldo BD, Hunt JL, Horton J, Brownstein B,Freeman B, Maier RV, Nathens AB, Cuschieri J, Gibran N, Klein M, O’Keefe G:Analysis of factorial time-course microarrays with application to a clinicalstudy of burn injury. 2010, 107:9923–9928.
36. Xiao F, Zuo Z, Cai G, Kang S, Gao X, Li T: miRecords: an integratedresource for microRNA-target interactions. Nucleic Acids Res 2009, 37:D105–D110.
37. Gennarino VA, Sardiello M, Avellino R, Meola N, Maselli V, Anand S, Cutillo L,Ballabio A, Banfi S: MicroRNA target prediction by expression analysis ofhost genes. Genome Res 2009, 19:481–490.
38. Gennarino VA, Sardiello M, Mutarelli M, Dharmalingam G, Maselli V, Lago G,Banfi S: HOCTAR database: A unique resource for microRNA targetprediction. Gene 2011, 480:51–58.
39. Huang JC, Babak T, Corson TW, Chua G, Khan S, Gallie BL, Hughes TR,Blencowe BJ, Frey BJ, Morris QD: Using expression profiling data toidentify human microRNA targets. Nat Methods 2007, 4:1045–1049.
40. Biasiolo M, Sales G, Lionetti M, Agnelli L, Todoerti K, Bisognin A, Coppe A,Romualdi C, Neri A, Bortoluzzi S: Impact of host genes and strandselection on miRNA and miRNA* expression. PLoS One 2011, 6:e23854.
41. Kapur K, Xing Y, Ouyang Z, Wong WH: Exon arrays provide accurateassessments of gene expression. Genome Biol 2007, 8:R82.
42. Pradervand S, Weber J, Thomas J, Bueno M, Wirapati P, Lefort K, Dotto GP,Harshman K: Impact of normalization on miRNA microarray expressionprofiling. RNA (New York, N.Y.) 2009, 15:493–501.
43. Enright AJ, John B, Gaul U, Tuschl T, Sander C, Marks DS: MicroRNA targetsin Drosophila. Genome Biol 2003, 5:R1.
doi:10.1186/1471-2164-13-620Cite this article as: Stempor et al.: MMpred: functional miRNA – mRNAinteraction analyses by miRNA expression prediction. BMC Genomics2012 13:620.
Submit your next manuscript to BioMed Centraland take full advantage of:
• Convenient online submission
• Thorough peer review
• No space constraints or color figure charges
• Immediate publication on acceptance
• Inclusion in PubMed, CAS, Scopus and Google Scholar
• Research which is freely available for redistribution
Submit your manuscript at www.biomedcentral.com/submit