Report on the Mandates Validation Exercise and Proposed Methodology for Their Prioritization
Methodology and prioritization
WP2
Brussels – May 15, 2014

Methodology and Prioritisation Objectives
Objectives have been pursued in two stages:
• To develop methodologies that will provide relevant
information concerning the CRM flows:
identify the most relevant sources of information concerning
materials and products flows
identify worldwide trends for materials flows into products
Input the relevant information to be ‘extracted’ from stakeholders,
in order to guide the collection of relevant info for further analysis
• To apply the acquired methodologies onto:
Applications
Technological Solutions
• providing the basis to potential substitution trajectories

Methodology and Prioritisation Workflow
• Applications and Technological solutions are the objects of
prioritization

Methodology and Prioritisation Workflow
Value Chain
Analysis of
Priority Sectors
Methodology and
Prioritisation
To Roadmapping
Methodology:
Applications
Methodology
and
Prioritisation Methodology:
Bottom-up
CRM List for
prioritization
Methodology:
Top-down
identification of
threatened
applications/
bottlenecks
Potential
Substitution
technologies
Methodology:
Technological
Solutions
Activities focussed on Applications
Evaluation Criteria for Applications
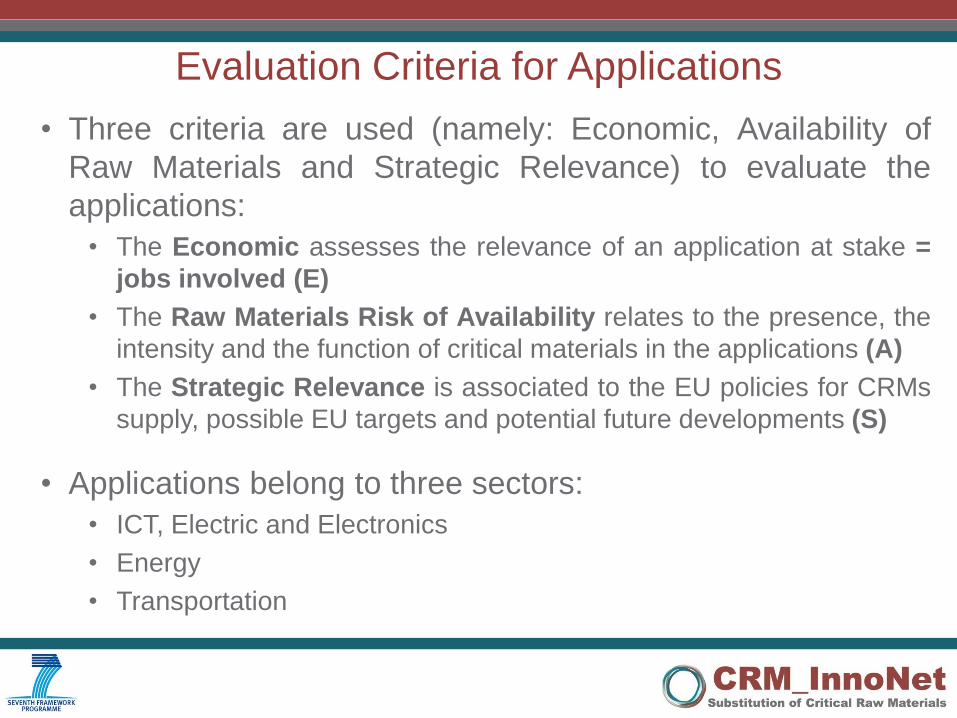
• Three criteria are used (namely: Economic, Availability of
Raw Materials and Strategic Relevance) to evaluate the
applications:
• The Economic assesses the relevance of an application at stake =
jobs involved (E)
• The Raw Materials Risk of Availability relates to the presence, the
intensity and the function of critical materials in the applications (A)
• The Strategic Relevance is associated to the EU policies for CRMs
supply, possible EU targets and potential future developments (S)
• Applications belong to three sectors:
• ICT, Electric and Electronics
• Energy
• Transportation
Evaluation Criteria for Applications
• The completed value chain descriptions according to the
criteria are then ranked in accordance to score 0, 1, or 3
• Scores are assigned depending on the type of criteria
and its value:
• 0 if the criterion is below average / detrimental / at the threshold
• 1 if the criterion is on average / neutral / above the threshold
• 3 if the criterion is above average / improving / significantly
above the threshold
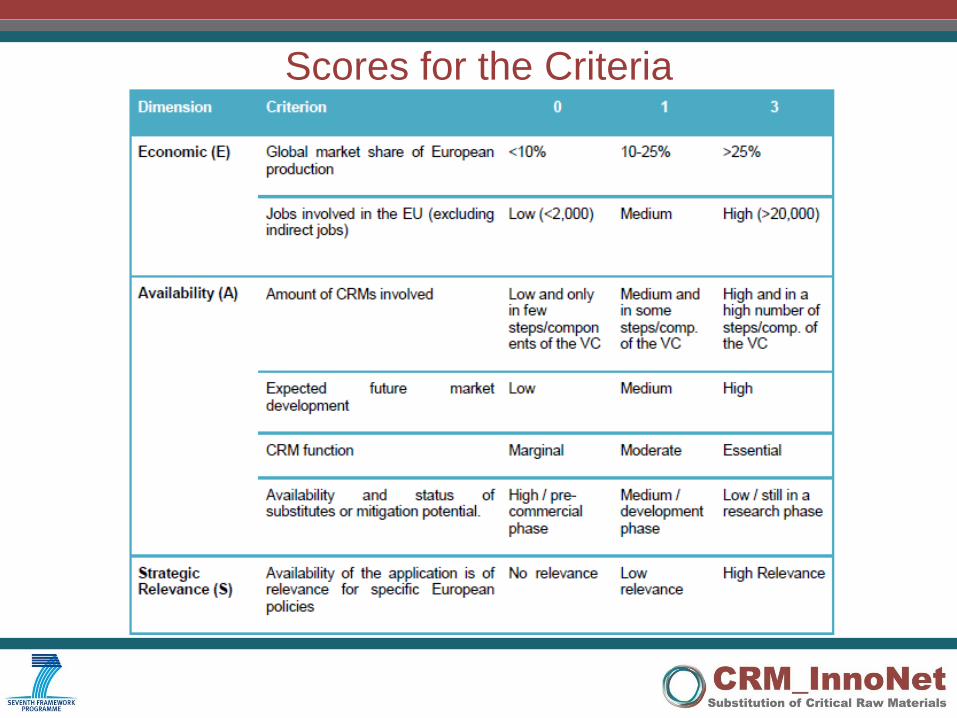
Scores for the Criteria
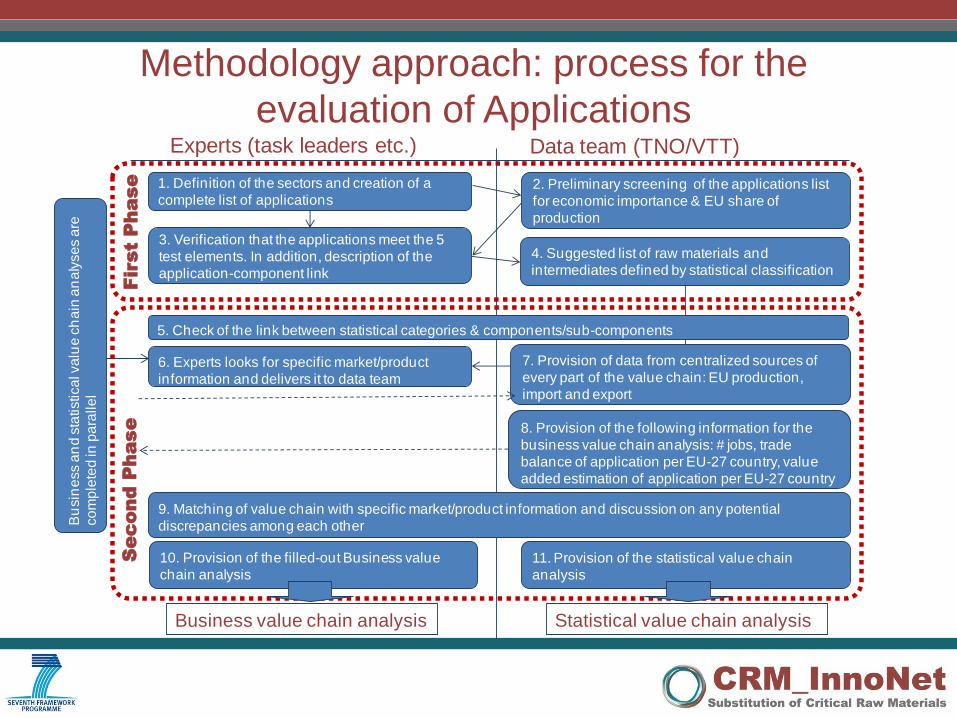
Methodology approach: process for the
evaluation of Applications
1. Definition of the sectors and creation of a
complete list of applications
3. Verification that the applications meet the 5
test elements. In addition, description of the
application-component link
4. Suggested list of raw materials and
intermediates defined by statistical classification
Experts (task leaders etc.) Data team (TNO/VTT)
6. Experts looks for specific market/product
information and delivers it to data team
Bu
sin
ess a
nd
sta
tistica
l va
lue
ch
ain
an
aly
se
s a
re
co
mp
lete
d in
pa
ralle
l
7. Provision of data from centralized sources of
every part of the value chain: EU production,
import and export
8. Provision of the following information for the
business value chain analysis: # jobs, trade
balance of application per EU-27 country, value
added estimation of application per EU-27 country
9. Matching of value chain with specific market/product information and discussion on any potential
discrepancies among each other
11. Provision of the statistical value chain
analysis
2. Preliminary screening of the applications list
for economic importance & EU share of
production
10. Provision of the filled-out Business value
chain analysis
5. Check of the link between statistical categories & components/sub-components
Business value chain analysis Statistical value chain analysis
First P
ha
se
Se
co
nd
P
ha
se
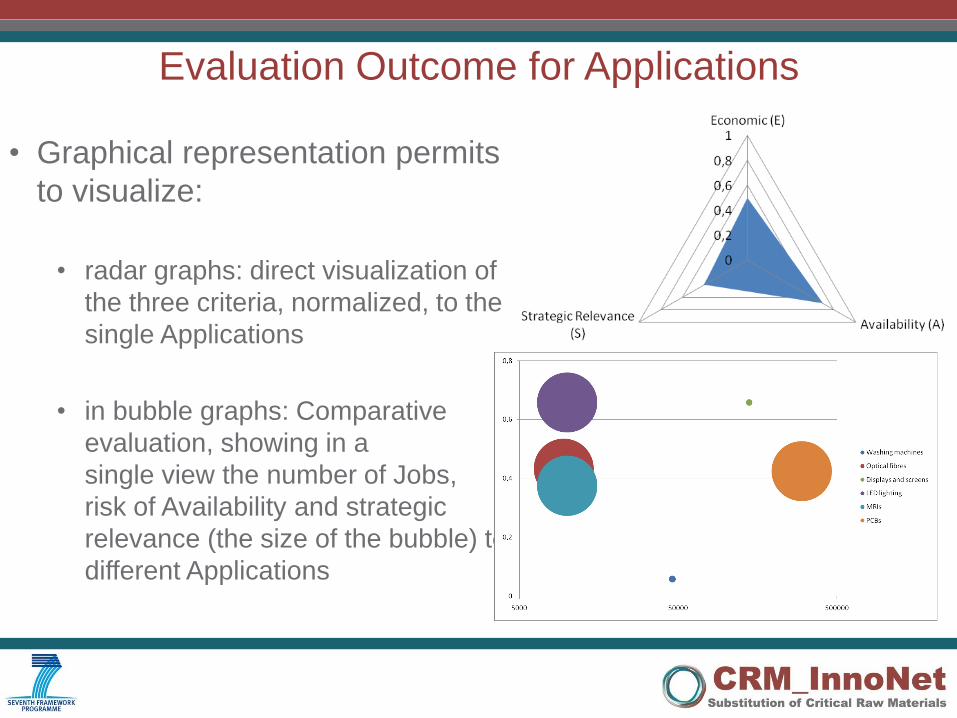
Evaluation Outcome for Applications
• Graphical representation permits
to visualize:
• radar graphs: direct visualization of
the three criteria, normalized, to the
single Applications
• in bubble graphs: Comparative
evaluation, showing in a
single view the number of Jobs,
risk of Availability and strategic
relevance (the size of the bubble) to
different Applications

Outcome – ICT-Electric-Electronics
• ICT-Electric-Electronics Applications above threshold:
• Washing Machines
• Optical Fibres
• Displays / Screens
• PCB / Electronic components
• LED lighting
• MRI
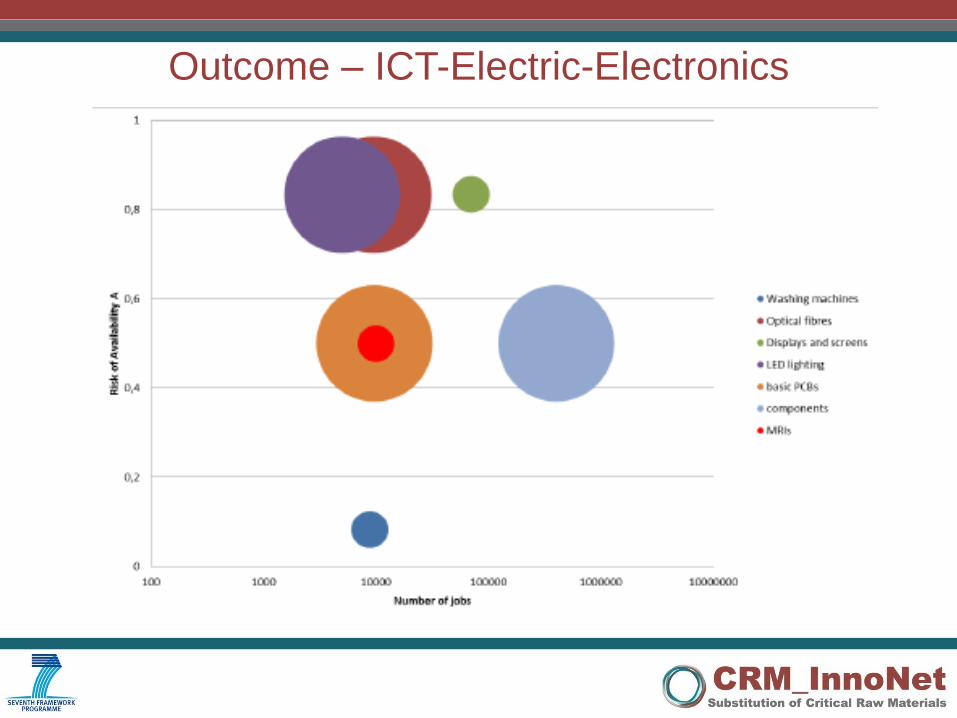
Outcome – ICT-Electric-Electronics

Outcome – Energy
• Energy Applications above threshold:
• Wind Power
• Energy Storage – Batteries
• Thin Film PV
Energy Storage Thin Film PV
Wind Power
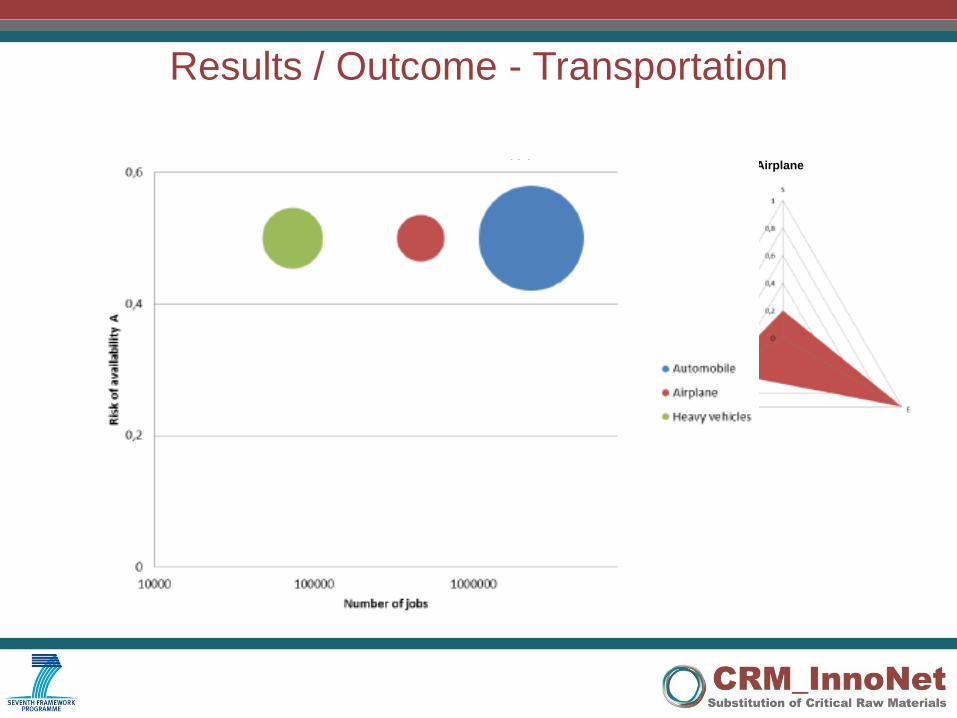
Results / Outcome - Transportation
Automotive Heavy Vehicle Airplane
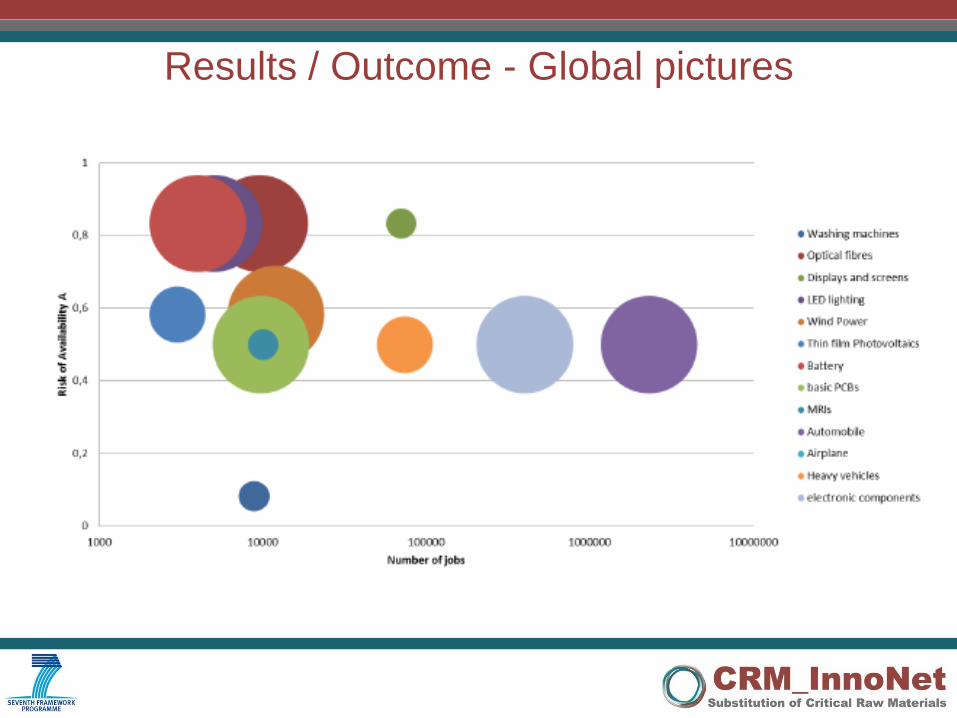
Results / Outcome - Global pictures

Results / Outcome - Global pictures
• Red Cells = Urgency for
substitution roadmap to
be developed
• Green Cells = Lower
necessity to further
roadmap

WP2 Conclusions
• Suggested priorities for further roadmapping,
according to the prioritization process:
– PCBs (incl. Components)
– Permanent magnet based applications
– Batteries and energy accumulators
– High value – extreme applications alloys
– Photonics: LEDs, fiber optics
• Thanks for the attention