METHODOLOGY AND APPROACH - dpsa.gov.za · Enumerator Areas (EAs) comprising informal settlements,...
21
METHODOLOGY AND APPROACH
Transcript of METHODOLOGY AND APPROACH - dpsa.gov.za · Enumerator Areas (EAs) comprising informal settlements,...

METHODOLOGY AND APPROACH
Geographic Accessibility Analysis Methodology and Approach
Copyright © 2016 Page i

Geographic Accessibility Analysis Methodology and Approach
Copyright © 2016 Page ii
T A B L E O F C O N T E N T S
1 METHODOLOGY ................................................................................................... 1
1.1 METHODOLOGY AND APPROACH ....................................................................................... 1
1.2 COLLECTION AND PREPARATION OF DATA....................................................................... 1
1.2.1 SETTLEMENT TYPOLOGY ......................................................................................... 2
1.2.2 THUSONG SERVICE CENTRES AND THUSONG SERVICE CLUSTERS ............... 3
1.2.3 2011 STATS SA POPULATION DATA ........................................................................ 4
1.2.4 2011 STATS SA GEOGRAPHIC DATA ....................................................................... 5
1.2.5 CENSUS DWELLING FRAME POINTS ...................................................................... 8
1.2.6 TRAVEL NETWORK .................................................................................................. 10
1.3 ASSESSMENT OF THE CURRENT PROVISIONING AND LOCATION OF FACILITIES .... 11
1.4 FACILITY LOCATION ANALYSIS TO OPTIMISE THE PROVISIONING OF FACILITIES ... 13
1.5 THUSONG SERVICE CENTRE TYPOLOGY ........................................................................ 14
2 LIMITATIONS AND CONSIDERATIONS ............................................................. 16
Geographic Accessibility Analysis Methodology and Approach
Copyright © 2016 Page iii
LIST OF TABLES
Table 1: Settlement typology .................................................................................................. 2
Table 2: Buffer distance for urban and rural areas ................................................................. 4
Table 3: Census Dwelling Frame Points - feature descriptions and categories....................... 9
Table 4: Maximum travel distance per settlement typology .................................................. 12
Table 5: Thusong Service Centre typology ........................................................................... 15
Geographic Accessibility Analysis Methodology and Approach
Copyright © 2016 Page iv
LIST OF FIGURES
Figure 1: Methodology and approach ..................................................................................... 1
Figure 2: Settlement typology ................................................................................................. 3
Figure 3: Example of a Thusong Service Cluster ................................................................... 4
Figure 4: Census 2011; Interactive data in SuperCROSS ...................................................... 5
Figure 5: Small Area Layer (SAL) boundaries ........................................................................ 6
Figure 6: Centroid points derived from SAL boundaries ......................................................... 6
Figure 7: SAL areas greater than 300, 500, 800 and 1000 km2 .............................................. 7
Figure 8: Population distribution to EAs ................................................................................. 8
Figure 9: National road network ........................................................................................... 10
Figure 10: Feed-links or centroid connectivity lines .............................................................. 11
Figure 11: Travel network .................................................................................................... 11
Figure 12: Shortest route calculation .................................................................................... 12
Figure 13: Location analysis................................................................................................. 14
Geographic Accessibility Analysis Methodology and Approach
Copyright © 2016 Page 1
1 METHODOLOGY
1.1 METHODOLOGY AND APPROACH
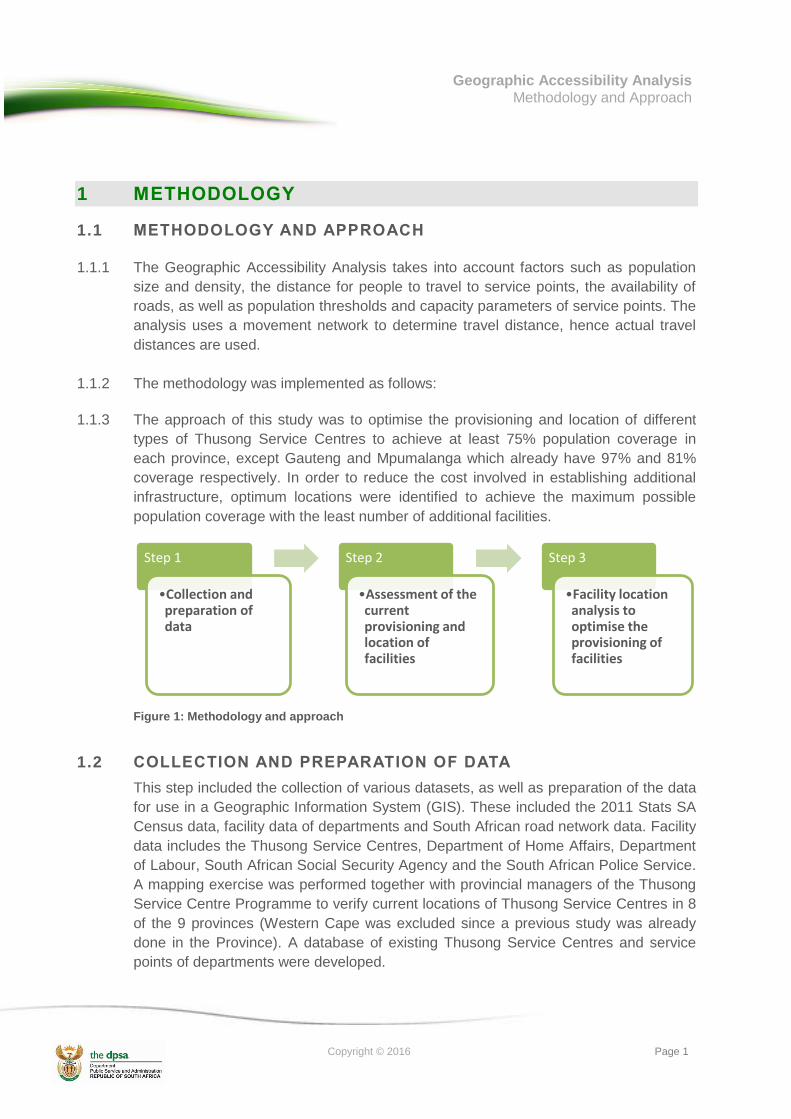
1.1.1 The Geographic Accessibility Analysis takes into account factors such as population
size and density, the distance for people to travel to service points, the availability of
roads, as well as population thresholds and capacity parameters of service points. The
analysis uses a movement network to determine travel distance, hence actual travel
distances are used.
1.1.2 The methodology was implemented as follows:
1.1.3 The approach of this study was to optimise the provisioning and location of different
types of Thusong Service Centres to achieve at least 75% population coverage in
each province, except Gauteng and Mpumalanga which already have 97% and 81%
coverage respectively. In order to reduce the cost involved in establishing additional
infrastructure, optimum locations were identified to achieve the maximum possible
population coverage with the least number of additional facilities.
Figure 1: Methodology and approach
1.2 COLLECTION AND PREPARATION OF DATA
This step included the collection of various datasets, as well as preparation of the data
for use in a Geographic Information System (GIS). These included the 2011 Stats SA
Census data, facility data of departments and South African road network data. Facility
data includes the Thusong Service Centres, Department of Home Affairs, Department
of Labour, South African Social Security Agency and the South African Police Service.
A mapping exercise was performed together with provincial managers of the Thusong
Service Centre Programme to verify current locations of Thusong Service Centres in 8
of the 9 provinces (Western Cape was excluded since a previous study was already
done in the Province). A database of existing Thusong Service Centres and service
points of departments were developed.
Step 1
•Collection and preparation of data
Step 2
•Assessment of the current provisioning and location of facilities
Step 3
•Facility location analysis to optimise the provisioning of facilities

Geographic Accessibility Analysis Methodology and Approach
Copyright © 2016 Page 2
1.2.1 SETTLEMENT TYPOLOGY
1.2.1.1 Settlement typologies were defined to differentiate between urban and rural spaces.
As no single official classification currently exists in South Africa to distinguish between
urban and rural spaces, for the purpose of this study the South African Geospatial
Data Dictionary and its application, compiled by South African National Standards
(SANS) served as a standard and guide to differentiate urban and rural areas.
1.2.1.2 Urban type classification is based on dominant settlement type and land use. Cities,
towns, townships, suburbs, etc., are typical urban settlements. Enumerator Areas
(EAs) comprising informal settlements, hostels, institutions, industrial and recreational
areas, and small holdings within or adjacent to any formal urban settlement are
classified as urban.
1.2.1.3 Rural type is any area that is not classified as urban.
1.2.1.4 The CSIR guidelines for the provision of social facilities in South African settlements
were used as a general guideline to subdivide the urban and rural type into 5
settlement typologies based on population totals. Table 1 depicts the settlement
typology that is used in this study.
URBAN
Type Classification Description
Urban Metro Areas classified as urban and situated in Metropolitan areas
Urban Major Urban Town Urban areas with population above 25 000
Urban Urban Town Urban areas with population below 25 000
RURAL
Type Classification Description
Rural Rural Town Rural areas with population above 25 000
Rural Rural Rural areas with population below 25 000
Table 1: Settlement typology

Geographic Accessibility Analysis Methodology and Approach
Copyright © 2016 Page 3
1.2.1.5 Figure 2 shows a map of the 5 settlement typologies.
Figure 2: Settlement typology
1.2.2 THUSONG SERVICE CENTRES AND THUSONG SERVICE CLUSTERS
1.2.2.1 The study includes both Thusong Service Centres and Thusong Service Clusters in
the accessibility calculations. Thusong Service Centres are permanent structures
where services of departments are housed under 1 roof and where services are
provided on a daily basis (Monday – Friday). Thusong Service Clusters are
permanent facilities consisting of 3 or more key departments which are located in close
proximity to each other. These serve as de facto Thusong Service Centres.
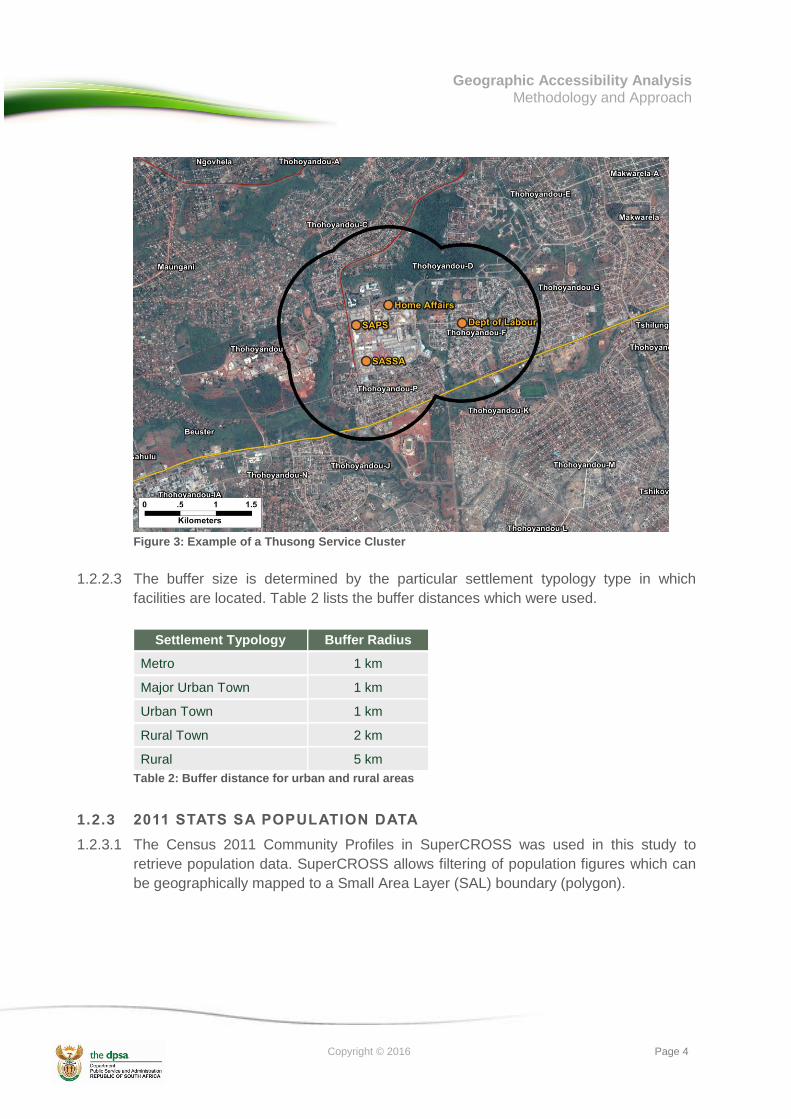
1.2.2.2 A Thusong Service Cluster is defined by creating a geographic distance buffer around
service points of the Departments of Home Affairs, Department of Labour, South
African Social Security Agency and the South African Police Service. Clusters are
identified when the buffers of at least 3 departments intersect with one another. (Figure
3).
Geographic Accessibility Analysis Methodology and Approach
Copyright © 2016 Page 4
Figure 3: Example of a Thusong Service Cluster
1.2.2.3 The buffer size is determined by the particular settlement typology type in which
facilities are located. Table 2 lists the buffer distances which were used.
Settlement Typology Buffer Radius
Metro 1 km
Major Urban Town 1 km
Urban Town 1 km
Rural Town 2 km
Rural 5 km
Table 2: Buffer distance for urban and rural areas
1.2.3 2011 STATS SA POPULATION DATA
1.2.3.1 The Census 2011 Community Profiles in SuperCROSS was used in this study to
retrieve population data. SuperCROSS allows filtering of population figures which can
be geographically mapped to a Small Area Layer (SAL) boundary (polygon).

Geographic Accessibility Analysis Methodology and Approach
Copyright © 2016 Page 5
Figure 4: Census 2011; Interactive data in SuperCROSS
1.2.4 2011 STATS SA GEOGRAPHIC DATA
1.2.4.1 The Census 2011 SAL dataset was used to map population distribution in the country.
The dataset contains the smallest geographical areas for the entire country that is
relationally linked to the Census 2011 Demographical Profile Alphanumeric Database.
The SAL dataset consists of 84 907 polygons with an average area size of 13.5 km2.
(Figure 5).
Geographic Accessibility Analysis Methodology and Approach
Copyright © 2016 Page 6
Figure 5: Small Area Layer (SAL) boundaries
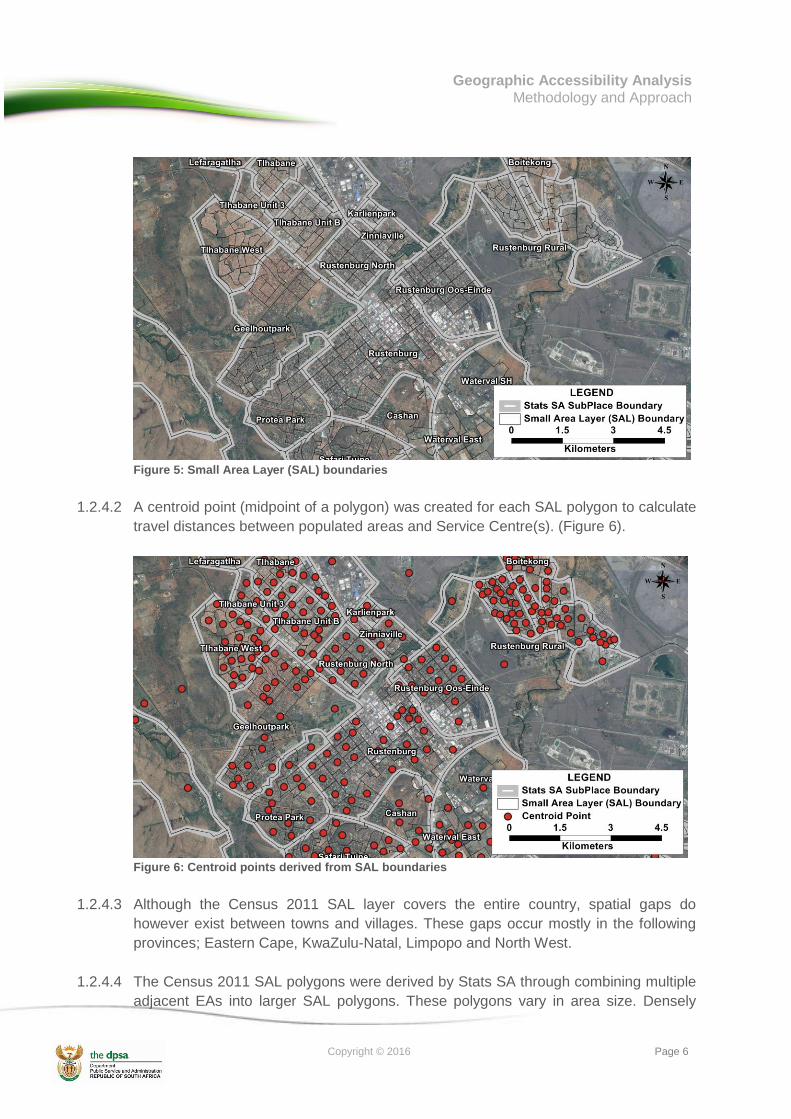
1.2.4.2 A centroid point (midpoint of a polygon) was created for each SAL polygon to calculate
travel distances between populated areas and Service Centre(s). (Figure 6).
Figure 6: Centroid points derived from SAL boundaries
1.2.4.3 Although the Census 2011 SAL layer covers the entire country, spatial gaps do
however exist between towns and villages. These gaps occur mostly in the following
provinces; Eastern Cape, KwaZulu-Natal, Limpopo and North West.
1.2.4.4 The Census 2011 SAL polygons were derived by Stats SA through combining multiple
adjacent EAs into larger SAL polygons. These polygons vary in area size. Densely

Geographic Accessibility Analysis Methodology and Approach
Copyright © 2016 Page 7
populated urban areas have several SAL polygons, compared to more sparsely
populated rural areas that usually have less SAL polygons but are larger in area size.
The use of centroid points as the midpoint for the SAL polygons work well in urban
areas, but remains a challenge in rural areas due to the large differences in polygon
size.
1.2.4.5 In an attempt to reduce the overall area size of SAL polygons in rural areas, the
original EAs were used in areas where SAL polygons exceed 500 km2. The following
maps display the geographical spread of SAL polygons across the country where the
area size per SAL is greater than 300, 500, 800 and 1000 km2. (Figure 7).
Figure 7: SAL areas greater than 300, 500, 800 and 1000 km2
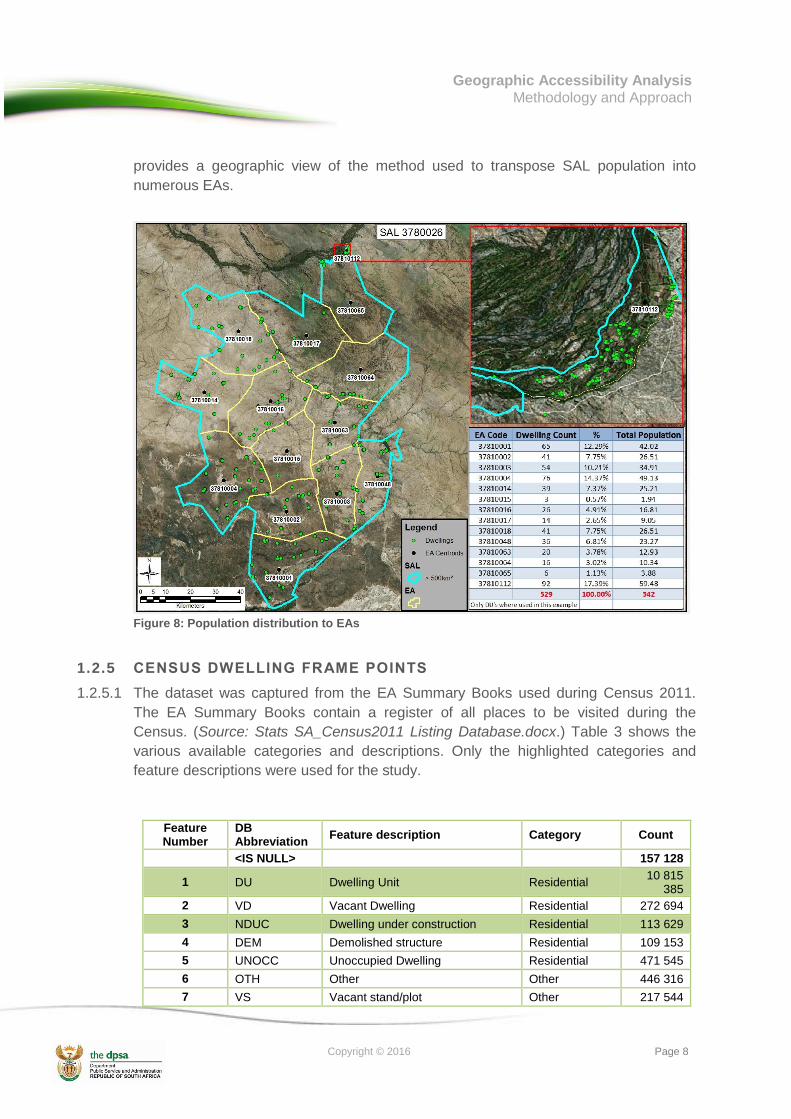
1.2.4.6 Since Census 2011 population data is only available on SAL level, a spatial
aggregation function was used to transpose SAL population figures to selected EAs.
The number of Census Dwelling Frame points (consisting of more than 13 million
dwelling points across the country) per EA served as a weighting factor to divide SAL
population proportionally to selected EAs.
1.2.4.7 The sub-dividing of SAL polygons into smaller units allows for better travel distance
calculations to Thusong Service Centres and Thusong Service Clusters. Figure 8
Geographic Accessibility Analysis Methodology and Approach
Copyright © 2016 Page 8
provides a geographic view of the method used to transpose SAL population into
numerous EAs.
Figure 8: Population distribution to EAs
1.2.5 CENSUS DWELLING FRAME POINTS
1.2.5.1 The dataset was captured from the EA Summary Books used during Census 2011.
The EA Summary Books contain a register of all places to be visited during the
Census. (Source: Stats SA_Census2011 Listing Database.docx.) Table 3 shows the
various available categories and descriptions. Only the highlighted categories and
feature descriptions were used for the study.
Feature Number
DB Abbreviation
Feature description Category Count
<IS NULL> 157 128
1 DU Dwelling Unit Residential 10 815
385
2 VD Vacant Dwelling Residential 272 694
3 NDUC Dwelling under construction Residential 113 629
4 DEM Demolished structure Residential 109 153
5 UNOCC Unoccupied Dwelling Residential 471 545
6 OTH Other Other 446 316
7 VS Vacant stand/plot Other 217 544

Geographic Accessibility Analysis Methodology and Approach
Copyright © 2016 Page 9
Feature Number
DB Abbreviation
Feature description Category Count
8 VL Vacant Land Other 111 576
9 PARK Park Recreation 3 226
10 GAR Garage Business 22 856
11 OFF Offices Business 28 981
12 BUS Business Business 80 102
13 PO Post Office Business 3 467
14 SHOP Shop Business 47 198
15 SCH School Community Services
28 262
16 FACT Factory Business 18 361
17 BANK Bank Business 655
18 PLSN Police station (Police cells) Community Services
828
19 FLSN Filling station Business 1 511
20 BS Bottle store Business 2 245
21 CEM Cemetery Community Services
3 899
22 CH_MSQ Church or other place of worship Community Services
45 750
23 CL Day clinic Community Services
1 191
24 OVAL Sports oval, stadium Recreation 5 810
25 HALL Community Hall Community Services
4 916
26 OSUC Other Structure Under Construction
Other 1 204
27 SDI/HOTEL Non-residential Hotel/ Motels/B&Bs/Lodges/Guesthouses
Business 8 467
28 SDI/HOSP Hospital/ Frail Care Centre/Nursing Homes
Community Services
1 139
29 SDI/STRESS Students’ Residence Residential 726
30 SDI/HOME Home for the aged (other than Frail Care Centre)
Residential 4 656
31 SDI/CCARE Child Care Institution/ Orphanage Residential 1 663
32 SDI/WHOST Workers’ Hostel Residential 2 543
33 SDI/SHOST Boarding School Hostel Residential 1 048
34 SDI/INIT Initiation School Community Services
204
35 SDI/CON Convent/ Monastery/ Religious Retreat/ Reformatories
Community Services
168
36 SDI/BARR Defence Force Barracks/ Camp/ Ship in Harbour
Residential 254
37 SDI/PRSN Prison/ Correctional Institution/ Police Cells
Community Services
363
38 SDI/HALL Community/ Church Hall (in cases of refuge for disaster)
Community Services
372
39 SDI/SHEL Refugee Camp/ Shelter for the Homeless
Residential 356
40 MARK Market Business 1 059
13 038 450
Table 3: Census Dwelling Frame Points - feature descriptions and categories
Geographic Accessibility Analysis Methodology and Approach
Copyright © 2016
Page
10
1.2.6 TRAVEL NETWORK
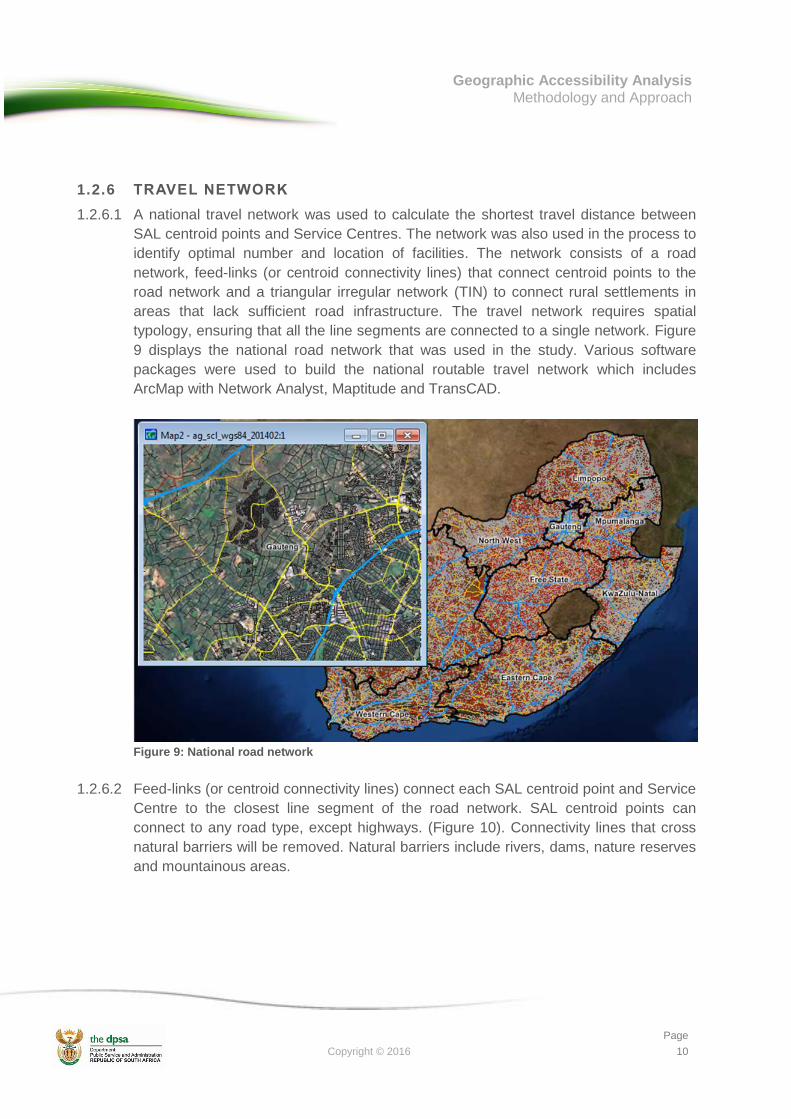
1.2.6.1 A national travel network was used to calculate the shortest travel distance between
SAL centroid points and Service Centres. The network was also used in the process to
identify optimal number and location of facilities. The network consists of a road
network, feed-links (or centroid connectivity lines) that connect centroid points to the
road network and a triangular irregular network (TIN) to connect rural settlements in
areas that lack sufficient road infrastructure. The travel network requires spatial
typology, ensuring that all the line segments are connected to a single network. Figure
9 displays the national road network that was used in the study. Various software
packages were used to build the national routable travel network which includes
ArcMap with Network Analyst, Maptitude and TransCAD.
Figure 9: National road network
1.2.6.2 Feed-links (or centroid connectivity lines) connect each SAL centroid point and Service
Centre to the closest line segment of the road network. SAL centroid points can
connect to any road type, except highways. (Figure 10). Connectivity lines that cross
natural barriers will be removed. Natural barriers include rivers, dams, nature reserves
and mountainous areas.

Geographic Accessibility Analysis Methodology and Approach
Copyright © 2016
Page
11
Figure 10: Feed-links or centroid connectivity lines
1.2.6.3 A TIN connects SAL centroid points to each other where nearby road infrastructure is
not available. This method creates straight lines between all SAL centroid points in
non-overlapping triangles. A TIN is based on a Delaunay triangulation. TIN lines were
removed if they cross natural barriers such as rivers, dams, nature reserves and steep
mountainous areas. Figure 11 displays the complete travel network.
Figure 11: Travel network
1.3 ASSESSMENT OF THE CURRENT PROVISIONING AND LOCATION OF FACILITIES
1.3.1 Accessibility modelling was done to determine the current population coverage of
Thusong Service Centres and Thusong Service Clusters. Catchment area analysis
Geographic Accessibility Analysis Methodology and Approach
Copyright © 2016
Page
12
was done to quantify the demand on each Centre and to identify areas that are under-,
over- or poorly-served.
1.3.2 Population Coverage is measured by calculating the distance people travel along the
travel network to their nearest Service Centre within the maximum allowed travel
distances. The maximum travel distance in urban areas is 15 km and 25 km in more
sparsely populated rural areas. It is assumed for this study that people are more likely
to travel to their nearest Thusong Service Centre. Table 4 depicts the maximum travel
distances per settlement typology that were applied in the analysis.
Settlement Typology Maximum Travel Distance
Metro 15 km
Major Urban Town 15 km
Urban Town 15 km
Rural Town 25 km
Rural 25 km
Table 4: Maximum travel distance per settlement typology
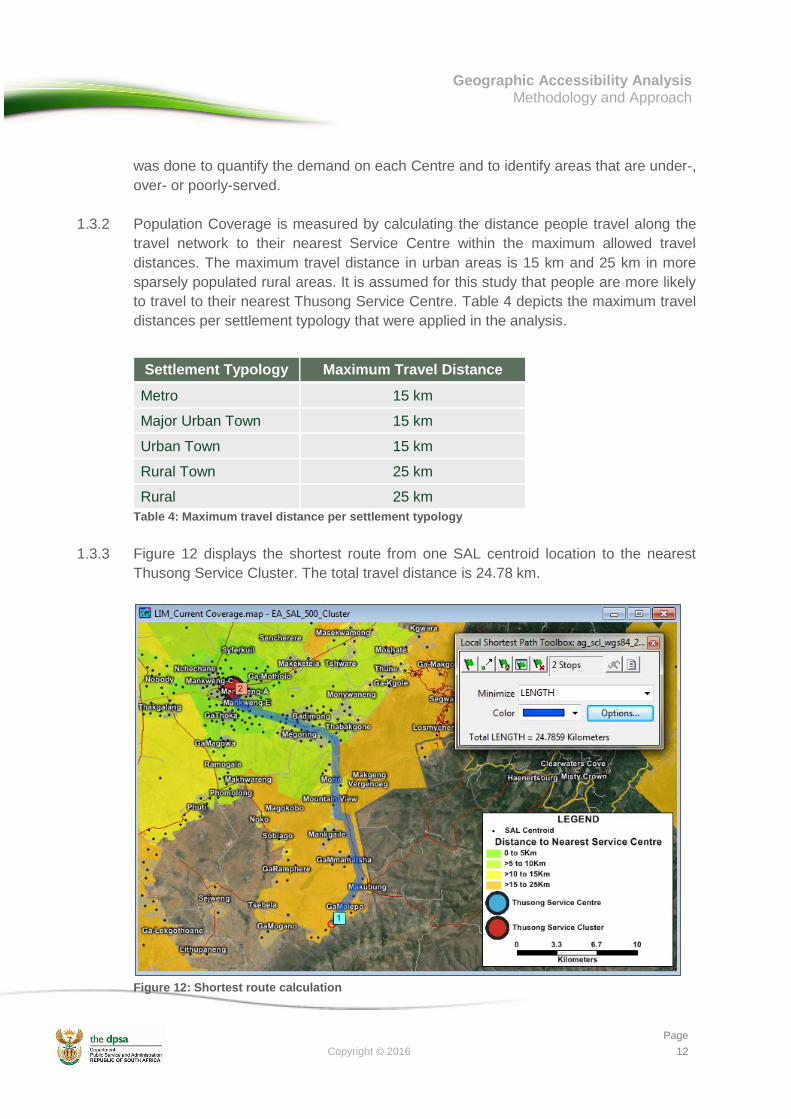
1.3.3 Figure 12 displays the shortest route from one SAL centroid location to the nearest
Thusong Service Cluster. The total travel distance is 24.78 km.
Figure 12: Shortest route calculation

Geographic Accessibility Analysis Methodology and Approach
Copyright © 2016
Page
13
1.4 FACILITY LOCATION ANALYSIS TO OPTIMISE THE PROVISIONING OF FACILITIES
1.4.1 Location analysis was done to identify the optimum number and location of facilities
and to identify other possible options for meeting the unserved population demand.
This analysis accepted the current locations of Thusong Service Centres and Thusong
Service Clusters, while determining the minimum number of additional locations that
would be required to increase population coverage to set percentage.
1.4.2 The analysis is a desktop exercise that utilises the data analysis capabilities of
Geographic Information Systems (GIS) to identify optimal locations. For this reason,
the proposed locations identified in the study refer to generalised locations and not
exact locations. Since the population distribution, number of Services Centres and
road infrastructure differ in each province a facility location analysis was done for
separately for each province.
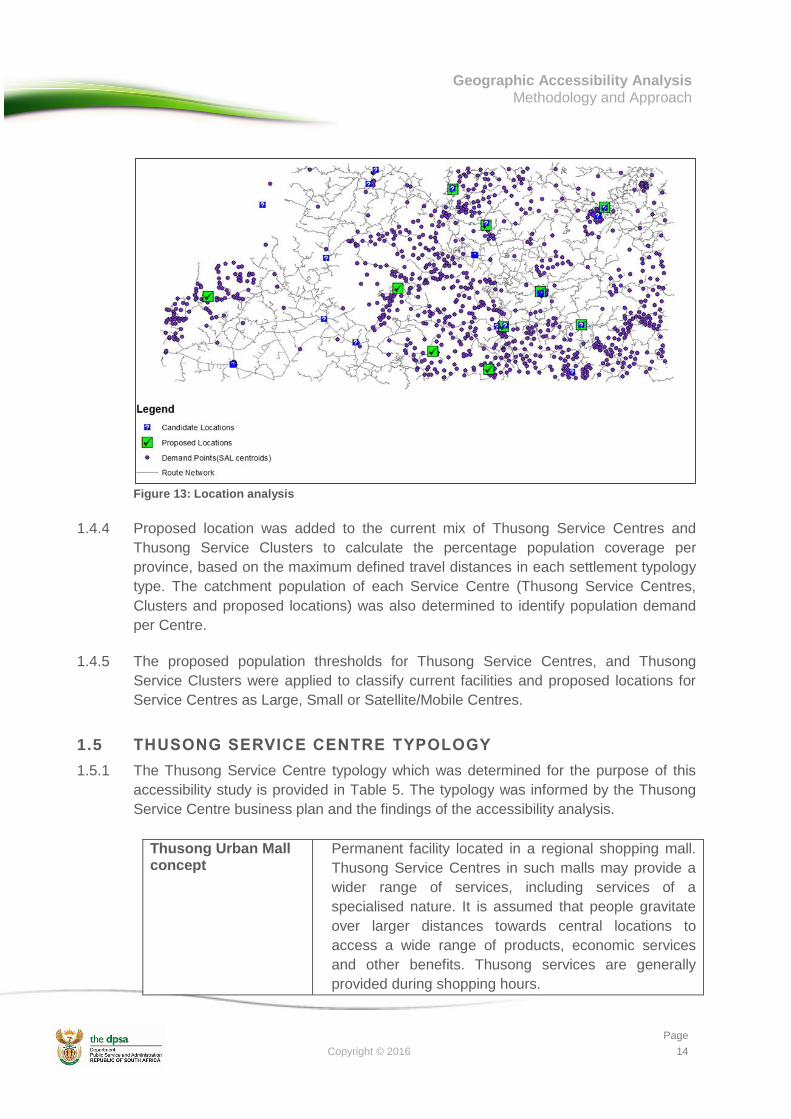
1.4.3 Optimal locations were identified in unserved areas through various GIS processes
including density mapping, Location-Allocation procedures by using maximum
capacitated coverage and target market share functionalities in ArcMap through the
utilisation of Network Analyst. These methods rely on a demand layer (SAL centroids
with population values) and a potential candidate layer. The candidate layer was
derived from densely populated SAL locations. This procedure selects candidate
locations by maximising attendance (SAL centroids) within an impedance cut-off travel
distance (Figure 13). A target market share of 75% was used in combination with a
maximum travel distance of 10, 15 and 20 km to generate a list of possible locations.
In densely populated metropolitan areas, a maximum capacitated coverage of 300 000
was used to identify possible locations that will reduce population pressure on existing
Centres. Preference was given (where possible) to areas where existing service points
of departments are in close proximity.
Geographic Accessibility Analysis Methodology and Approach
Copyright © 2016
Page
14
Figure 13: Location analysis
1.4.4 Proposed location was added to the current mix of Thusong Service Centres and
Thusong Service Clusters to calculate the percentage population coverage per
province, based on the maximum defined travel distances in each settlement typology
type. The catchment population of each Service Centre (Thusong Service Centres,
Clusters and proposed locations) was also determined to identify population demand
per Centre.
1.4.5 The proposed population thresholds for Thusong Service Centres, and Thusong
Service Clusters were applied to classify current facilities and proposed locations for
Service Centres as Large, Small or Satellite/Mobile Centres.
1.5 THUSONG SERVICE CENTRE TYPOLOGY
1.5.1 The Thusong Service Centre typology which was determined for the purpose of this
accessibility study is provided in Table 5. The typology was informed by the Thusong
Service Centre business plan and the findings of the accessibility analysis.
Thusong Urban Mall concept
Permanent facility located in a regional shopping mall.
Thusong Service Centres in such malls may provide a
wider range of services, including services of a
specialised nature. It is assumed that people gravitate
over larger distances towards central locations to
access a wide range of products, economic services
and other benefits. Thusong services are generally
provided during shopping hours.

Geographic Accessibility Analysis Methodology and Approach
Copyright © 2016
Page
15
Thusong Service Centre
Permanent structure where services of departments are
housed under 1 roof and where services are provided
on a daily basis (Monday – Friday).
Thusong Service Cluster
Permanent facilities of 3 or more departments which are
located in close proximity. These serve as de facto
Thusong Service Centres. In densely populated areas
the facilities of departments could be located in a radius
of 1 – 2 km, while facilities in more sparsely populated
areas could be clustered together within a 5 km radius
from each other.
Satellite Service Centre
Thusong Service Satellite Centre - permanent
infrastructure where all the Thusong Anchor
Departments have established periodic service delivery
points, i.e. operate according to fixed service delivery
schedules.
Thusong Mobile Service
A Thusong Mobile is a Mobile Service where all the
Thusong anchor departments and other relevant
government departments deliver integrated services in
outlying and more sparsely populated areas which have
intermittent small settlement clusters. In these areas it is
not financially viable to operate either a Thusong
Service Centre or a periodic satellite service. It should
be noted that road links (or lack thereof) and road
conditions have a major impact with respect to access
times and/or the delivery of Mobile Services.
Thusong Outreach projects
Thusong Outreach projects serve extreme sparsely
populated areas with no settlement clusters. Such a
service could possibly utilise Community Development
Workers (CDWs) to access far outlying areas where the
population density does not warrant a Thusong Mobile
or Thusong Service Satellite Centre.
Table 5: Thusong Service Centre typology

Geographic Accessibility Analysis Methodology and Approach
Copyright © 2016
Page
16
2 LIMITATIONS AND CONSIDERATIONS
2.1 The geographic accuracy of base data is crucial for any spatial analysis project.
Accurate origin locations (population data), destination locations (service points) and a
national street centreline layer are required to measure travel distances and to
calculate coverage statistics.
2.2 This accessibility study relies on the accurate location of service points since Thusong
Service Clusters are identified where 3 or more service points are in close proximity to
each other. Inaccurate service point locations could potentially influence the number of
Thusong Service Clusters and in turn this could influence the coverage figures, as well
as the calculations to identify the optimum number and location of facilities for meeting
the unserved population demand.