Methodologies to Evaluate the Impact of Large Scale...
84
Transcript of Methodologies to Evaluate the Impact of Large Scale...

Methodologies to Evaluate the Impact of
Large Scale Nutrition Programs June 2009

2
Acknowledgement
This paper was written by Jean-Pierre Habicht1, Gretel H. Pelto
2 and Julia Lapp
3 for the
Doing Impact Evaluation Series, published by the Poverty Reduction and Economic
Management Unit at the World Bank. This note was task managed by Emmanuel
Skoufias.
1 Graduate Professor of Nutritional Epidemiology, Division of Nutritional Sciences,
Cornell University, e-mail: [email protected] 2 Graduate Professor of Nutritional Anthropology, Division of Nutritional Sciences,
Cornell University, e-mail: [email protected] 3 Assistant Professor, Department of Health Promotion and Physical Education,
Ithaca College, e-mail: [email protected]

3
TABLE OF CONTENTS
EXECUTIVE SUMMARY ............................................................................................................... 5
1. INTRODUCTION ........................................................................................................................... 7
2. THE CONTEXT OF IMPACT EVALUATIONS: TECHNICAL AND SOCIAL ISSUES ....................... 9
A. WHY EVALUATE NUTRITION INTERVENTION PROGRAMS? ...................................... 9
B. FROM BIOLOGICAL AGENT TO BIOLOGICAL IMPACT IN A POPULATION: STEPS IN THE
PROCESS OF ASSESSING NUTRITIONAL INTERVENTIONS .................................................. 11
C. TRUSTWORTHINESS: THE CREDIBILITY OF AN INTERVENTION .............................. 14
3. DECIDING TO UNDERTAKE AN EVALUATION TO ASSESS NUTRITIONAL IMPACT OF A
PROGRAM ................................................................................................................................. 15
A. EXPLICIT PURPOSE ............................................................................................... 15
B. FIRST STEPS ......................................................................................................... 16
C. ASCERTAINING THE QUALITY OF THE IMPLEMENTATION ..................................... 17
D. ASCERTAINING APPROPRIATENESS OF TIMING ..................................................... 18
4. DESIGNING IMPACT EVALUATIONS FOR NUTRITION INTERVENTIONS .................................. 19
A. DESCRIBING TREATMENT AND TREATMENT PATHWAYS ...................................... 19
B. BLINDING ............................................................................................................ 21
C. ALLOCATIONS OF INTERVENTIONS ...................................................................... 22
D. DATA SOURCES FOR EVALUATIONS .................................................................... 25
5. PROBABILITY AND PLAUSIBILITY ANALYSES FOR RCT PROGRAM EVALUATION ................ 26
A. PROBABILITY ANALYSIS FOR INTENT-TO-TREAT .................................................. 26
B. ANALYSIS OF EFFECT OF THE TREATMENT ON THE TREATED ............................... 26
C. ASSESSING ADEQUACY OF IMPACT ...................................................................... 26
D. LONGITUDINAL “BEFORE AND AFTER” ANALYSES: ESTIMATING THE “DIFFERENCE OF
THE DIFFERENCES” ................................................................................................. 27
E. PLAUSIBILITY EVALUATION WITHIN AN RCT ...................................................... 28
6. TYPES OF INTERVENTIONS ....................................................................................................... 32
A. SUPPLEMENTATION ............................................................................................. 34
B. FORTIFICATION ................................................................................................... 34
C. NUTRITION EDUCATION ...................................................................................... 35
D. HOME/COMMUNITY BASED HORTICULTURE ....................................................... 35
E. FOOD PRICE REDUCTION INTERVENTIONS ........................................................... 35
F. CONDITIONAL CASH TRANSFERS ......................................................................... 36

4
G. INTEGRATED NUTRITION PROGRAMS .................................................................. 36
H. OTHER ................................................................................................................. 36
7. BENEFICIARIES ......................................................................................................................... 38
A. TARGETING THOSE WITH A POTENTIAL TO BENEFIT ............................................. 38
B. TARGETING FOR DELIVERY OF GOODS AND SERVICES ........................................ 40
8. IMPACT INDICATORS ................................................................................................................ 41
A. INDICATORS OF DIETARY INTAKE ........................................................................ 41
B. BIOCHEMICAL AND CLINICAL INDICATORS OF NUTRITIONAL STATUS .................. 43
C. ANTHROPOMETRY: INDICATORS OF GROWTH IN CHILDREN ................................. 47
D. OTHER INDICATORS IN NUTRITION INTERVENTION EVALUATIONS ....................... 49
9. ETHICS ....................................................................................................................................... 49
10. CONCLUSIONS ....................................................................................................................... 50
REFERENCES .............................................................................................................. 53
APPENDIX A. EXAMPLES OF CHARACTERISTICS, INDICATORS AND OTHER FEATURES OF
NUTRITION INTERVENTION IMPACT EVALUATION REPORTS ....................................... 59
APPENDIX B. IMPACT EVALUATION REPORTS COMPILED FOR THIS REPORT .............. 68
APPENDIX C. CONSORT CHECKLIST FOR REPORTING A RANDOMIZED CONTROL TRIAL
................................................................................................................................... 73
APPENDIX D. STANDARDIZATION OF PROCEDURES FOR THE COLLECTION OF
ANTHROPOMETRIC DATA IN THE FIELD .................................................................... 75
5
Executive Summary
Recent evaluations of large scale social interventions have used randomized control trial
(RCT) designs that require the identification of comparable areas before the intervention
is initiated so that some areas can be randomized to receive the intervention, while others
serve as controls. An RCT begins with a baseline survey to collect data before the
program is implemented and then a follow-up survey is conducted after the program has
run long enough to have an impact. RCTs are not only technically, programmatically,
and financially difficult, but also delineating between treatment and control groups can
be politically challenging. RCTs also require lag times that are long enough (3-5 years) to
ensure that impact can be validly measured.
RCTs are used to establish the efficacy of interventions at several levels, from the clinic
to the field. RCTs of large-scale programs should be reserved for ascertaining the highest
level of program efficacy. Under certain conditions, they can also be used to assess
program effectiveness. Effectiveness evaluation refers to the examination of the results of
a program under usual operational conditions, in contrast to efficacy evaluation, in which
the program is undertaken under more ideal conditions. There are several prerequisites
for determining whether an RCT design is appropriate for the evaluation of a large scale
public health intervention that is intended to improve health outcomes: (1) there has
already been confirmation of the social, behavioral and biological theories that support
the intervention and the development of these theories into an integrated “program
theory”, which is the basis of the program design and evaluation; (2) the expected impact
and criteria of adequacy are defined; and (3) pilot testing has confirmed that the
intervention can be implemented. Although there are situations in which large scale
programs need an RCT to confirm efficacy for legitimate political purposes, this report
recommends that, in general, program efficacy RCTs should be reserved for evaluations
of large scale social and public health programs. These provide not only evidence of one
time impact, but also are aimed at determining that the impact can be replicated in the
future and in other settings within usual public health or social programmatic
environments.
The prerequisites for an RCT for large-scale programs go beyond probability designs,
which are aimed at assuring internal validity through testing the probability that the
program had an impact. In a public health evaluation, the design must also ascertain that
the impact was plausibly due to specific components of the intervention. The probability
analysis of an RCT results in a higher standard of internal validity than that obtained with
plausibility analyses. An RCT also could, in principle, separate out the important
components, although this is unlikely to be either theoretically useful, much less feasible.
Moreover, careful plausibility analyses can identify the important components of the
interventions by confirming the pathways through which these are implemented (program
delivery factors) and mediated through families and individuals (utilization factors) to
produce biological or behavioral outcomes. Plausibility analyses require added design
features and data collection, embedded within an RCT. These do not necessarily add
significantly to the costs of the evaluation. Plausibility analyses should also identify
which recipients of the program were responsible for the impact. This information is

6
useful for improving program targeting and also improves the internal validity of the
analysis. Most importantly, it is essential for inferring the generalizability (external
validity) of the impact.
This report recommends that RCTs of inadequately implemented programs should be
aborted. This would save more than half of the cost of a full RCT and, more importantly,
avoid inappropriate inferences about the potential of similar programs. Coming to a
conclusion about the quality of program implementation requires operations research that
need not be costly, but must be timely to be useful. The findings from such research can
be fed back to the program to improve it. Operations research should also ascertain
whether the economic and social circumstances are changing. Both changes in the
program and in the environment need to be carefully documented and taken into account
in interpreting the RCT findings.
Non RCT evaluation designs should follow the same principles described above, except
that they must also demonstrate plausible causality of the overall impact. In these cases,
plausible demonstration of causality may be less costly than an RCT because of savings
from reduced data collection. This report explains why these potentially much less
expensive and timelier evaluations are adequate for most program and policy decisions.
The remaining part of the report discusses the technical aspects of design and analyses for
RCTs of nutrition interventions and for the plausibility and the adequacy investigations.
It presents technical information for evaluating nutritional interventions, including types
of interventions and their beneficiaries, as well as indicators to assess nutritional impact.
A final section discusses ethical principles and related legalities that evaluations must
consider.
7
1. Introduction
This report is designed to provide guidance on evaluating the impact of large scale
nutrition intervention programs that are aimed at preventing and/or curing undernutrition.
We review the requirements for evaluating by means of a probability design, ie.
randomized control trials (RCTs), and discuss under what circumstances evaluating for
plausible impact and for adequate impact are sufficient and should be the methods of
choice because their designs are operationally more feasible (Habicht et al, 1999). We
discuss the various uses of data from evaluation studies and the requirements to meet
these uses. Regardless of the type of design that is selected, most of the material that we
cover is pertinent for all evaluations of nutrition intervention programs.
Undernutrition. The term “undernutrition” is used to refer to micronutrient [vitamin and
mineral] and macronutrient [energy and protein] deficiencies, and we will cover both
aspects in this report. The term “malnutrition” is also commonly used to refer to
undernutrition, but as this includes obesity and other nutritional pathologies, it is
preferably to use the more specific designation.
Undernutrition is one of the most important public health problems in the developing
world, the source of serious short-term and long term consequences. Undernourished
children die from common infectious diseases that well nourished children survive
(Caulfield et al, 2004). The case-fatality rate is two fold for children who are mildly
undernourished, rises to three fold for moderate undernutrition and eleven fold for severe
(Pelletier et al, 1993). Since even mild to moderate undernutrition increases mortality
risk, and very significant proportions of children in developing countries suffer from mild
to moderate undernutrition, this insidious condition is responsible for over half of post-
neonatal deaths (Bryce et al, 2005 a). Apart from the mortality toll, children who are
undernourished usually experience developmental delays that affect cognitive
performance (Grantham-McGregor et al, 1999) not only in childhood, but also into
adolescence and adult life (Malucio et al, 2006). Mild to moderate undernutrition is not
immediately evident to clinicians, much less to the lay public. This feature makes it
difficult to motivate research allocation for nutrition programs compared to programs that
are directed to overtly fatal and crippling diseases. The fact that undernutrition produces
health and developmental problems at every level along the continuum from mild to
severe also has implications for evaluations of nutrition interventions.
Impact. In this report, we define “impact” as the effect of an intervention on the
biological outcomes that are the objective of a large scale nutrition intervention program.
By definition, nutrition interventions are explicitly intended to produce improvements in
nutritional status, in addition to what ever other goals and consequences are intended.
Thus the final impact measures have to include indicators of biological status.
In simplest terms, we can define “impact” as the difference in outcome measures that can
be ascribed to the intervention. The different types of research designs that can be utilized
to evaluate the impact of an intervention vary with respect to the certainty with which one
can ascribe a difference to the intervention. They vary in the degrees of plausibility and

8
probability about whether there was an impact, the magnitude of the impact, and whether
this magnitude was adequate (Habicht et al, 1999). Our discussion in this paper is based
on present practice in evaluation of nutrition programs. It is informed by evaluation
(Rossi et al, 1999) and statistical approaches (Murray, 1998) augmented by perspectives
from an epidemiological point of view.
Certain methodologies, such as those that are used to measure “nutritional outcomes”, are
so central to nutritional sciences that there are text book-length treatments of their
measurement. We have not summarized the various measuring methods (and their
advantages and disadvantages), but we provide references to excellent sources where
both general and specific guidance on the use of these methods can be found.
Nutrition Interventions. In this report, we use the conventional definition (adapted from
McLaren, 1976) in which “nutrition interventions” are defined as: “... planned actions
that introduce new goods and/or services into the existing food [and /or health] system for
the explicit purpose of improving the nutritional well-being of designated groups.”
For the preparation of this report, we conducted a literature review that permitted us to
bring together a corpus of material. The intent was not a definitive description of
nutrition program evaluations, but a body of information that would provide substantive
examples of evaluations of nutrition intervention programs and an overview of current
practice.
We used two types of sources to identify evaluations of large scale nutrition interventions
that address undernutrition: (1) peer reviewed journals and (2) agency and NGO reports.
In addition to materials that were available in printed form, we also searched agency web
sites and contacted authors of agency bulletins, reports or unpublished manuscripts for
additional documentation for more details about methodologies, data sources and
research designs. Finally, we drew on other relevant information from research and
practitioners when the information in the papers was, in our view, too limited,
particularly with respect to outcome.
Appendix B lists all of the interventions in our corpus and Appendix A contains a set of
tables that provide information on characteristics, variables, and other features of
evaluations of large scale nutrition interventions, keyed to the specific studies that we
utilized in the preparation of this report. For example, if a reader is interested in
evaluations of interventions that involved iron, Table 1 (Appendix A), in the section on
micro-nutrients, row labeled "iron”, has references to 3 studies, and a 4th
study is listed
further down in the table, in the section on food fortification, row labeled iron. Similarly,
in Table 4, in the section on biochemical indicators, there are references to 10 studies that
evaluated impact of an intervention on hemoglobin, regardless of whether an iron
intervention was an explicit input into the intervention.
Evaluations. Adequacy evaluations require benchmarks of attainment or change to
compare to performance. Plausibility and probability evaluations require control groups
to compare with the treatment group to assess impact. Depending on the situation, it is

9
often methodologically, politically and/or ethically necessary to institute new activities in
the control group. Thus, it is appropriate to use the term "intervention" to refer to both the
treatment and the control group activities. The selection of the interventions in the control
groups is crucially important in assessing the cause of the impact and its generalizability
to other situations. Probability evaluations also require that the treatment and control
interventions are allocated randomly to the recipients or groups of recipients.
The number of impact evaluations of nutrition programs that use an RCT design is
growing, but the majority of studies that have been conducted to date are not RCTs.
Therefore, we have drawn on both RCTs and non-RCTs to provide examples of
techniques, experiences and other issues that we cover in succeeding sections.
2. The Context of Impact Evaluations: Technical and Social
Issues
This section takes up some general issues and questions that are pertinent for the decision
to undertake an evaluation and for the interpretation of results. We begin with the reasons
for undertaking an evaluation of a nutrition program; we then discuss the logic of
evaluation research and the scientific rationale for plausibility and probability
(randomized, controlled) trials. This section also examines the issue of what makes an
evaluation "trustworthy".
A. Why evaluate nutrition intervention programs?
In the final analysis, the utility of an evaluation depends on its ability to provide
information for making decisions addressed to the purpose for which the research was
undertaken. Program evaluations fall into two general categories:
(a) evaluations to improve an on-going program
(b) evaluations to assess the impact of a program
The first category, research to improve an on-going program, is often referred to as
"formative evaluation”, while the latter is often called "summative evaluation" (Rossi et
al, 1999).
In this report we use the phrase "impact evaluation" for research in the second category.
One can distinguish four main purposes for which the information from an impact
evaluation is used: (1) deciding to continue the program, (2) deciding to expand or
diminish the size of the program, (3) deciding to implement it elsewhere, or (4) deciding
to stop the program.
All of the project reports we reviewed for this paper were impact evaluations of large-
scale programs, and the majority of the reports state that the purpose for undertaking the
research was to "assess impact". None of the studies were undertaken for the sole purpose

10
of improving an on-going nutrition program, although some investigators reported that as
a second purpose. Only 3 authors from the more than 60 reports we reviewed mentioned
extension of a current program, or using the impact evaluation as a source of information
to design a new program, as a reason for doing the research. However, the information
that is generated by evaluations is often useful for improving programs. An evaluation
that focuses exclusively on the measurement of impact may be sufficient for a decision to
continue a program or to stop a program that is not having an adequate impact and for
which there is no interest in improving it or in determining the reasons for lack of impact.
However, an evaluation that focuses exclusively on impact cannot yield insights on why a
program is failing to achieve its goals or whether this failure is due to problems in
implementation or incorrect assumptions about the biological and behavioral mechanisms
of action.
Often the decisions that will follow from an evaluation are not clearly articulated, and the
importance of including information on why a program is failing to achieve its full
impact is not clearly specified when the evaluation is being planned. It would be naive to
assume that the sole, or even the primary, reason for establishing a nutrition intervention
program is always to improve the nutritional well-being of the population in which the
program is situated. Other social, political and economic motivations are often involved.
Similarly, the decision to evaluate the nutritional impact of an intervention may also be
motivated by several factors in addition to a desire to assess whether there are
improvements in biological outcomes. Regardless of what other motivations might be
involved, an appraisal that is concerned with determining a program's impact on nutrition
needs to attend to the steps through which a program can achieve its intended outcome,
and ascertain that each of these steps is adequate before evaluating for impact.
Program Theory. The value or importance of explicating the logical sequence of steps
that link inputs to outcomes cannot be stressed enough, in part because it rarely receives
the attention it deserves - either in the initial design of programs or in their evaluation. In
the evaluation literature, this set of steps or linkages is often referred to as "program
theory". Epidemiologists commonly couch this in terms of "causal pathways". "Proof of
construct" is another phrase that is used to refer to input-outcome linkages. Each of these
phrases refers to the set of assumptions (articulated or implicit) that underlie the decision
to undertake a particular intervention with the aim of producing an outcome. Common to
all of these concepts is the recognition of the sequential nature of the steps that are
required to achieve a desired outcome. Programs can fail to achieve their goals because
of a failure in one of the steps and/or because some part of the "construct" ("theory") was
wrong. In the case of nutrition program evaluations, where impact is assessed as a change
(improvement) in a biological measure, there are several steps at which either
implementation issues or constructs (or both) may lead to reduced impact.
The basic pathway that underlies many nutrition interventions begins with a focus on the
food sources that are available to a household and concludes with the biological
outcomes from the consumption of those foods (see 6. Types of Interventions). There are
various ways in which programs may be designed to increase household food availability,
and each of these pathways contain a set of steps that link program inputs through
11
program activities to increased household availability. Improved household food
available requires a series of steps before there is improved food intake by young
children. The greater the level of specification in the program theory, the easier it is to
identify what features of the intervention - implementation or constructs or both - reduced
or supported its impact.
One of the most difficult challenges for program impact evaluation is that, in the usual
case, one is simultaneously testing the adequacy with which the intervention has been
operating and the underlying social and biological constructs at the same time. Even
when the biology is thought to be well-understood, the assumptions about the
intermediate programmatic delivery and utilization steps that link the "input" (biological
agent) to the "outcome" (biological response) may be incomplete or incorrect. As it is
difficult in an impact evaluation to completely avoid the problem of distinguishing
implementation problems from problems in the underlying assumptions, we will discuss,
below, strategies for reducing the challenges this poses for the interpretation of results of
an impact evaluation. To set the stage for that discussion, the next section provides an
overview of the research steps that have employed randomized controlled trials to
progressively assess interventions to improve nutrition in populations. Our presentation is
clearer if we concentrate on RTC’s because we avoid having to deal with the
uncertainties that occur in plausibility trials.
B. From biological agent to biological impact in a population: steps in
the process of assessing nutritional interventions
Clinical trials in the field
Testing the biological efficacy of a prescribed regimen in a field setting is the first step
for assessing a potential public nutrition intervention after laboratory and clinical human
studies have shown its potential. Such studies require strict control of the intervention.
An example is an ongoing zinc supplementation trial in Guatemala. This trial, which is
being conducted in schools, randomizes children within the class rooms to receive zinc or
a placebo. Tablet intake for each child is observed, and, through careful record-keeping,
investigators can be assured that the intervention (zinc) was biologically delivered to
(ingested by) the individuals in the treatment group and was not delivered to individuals
in the control group.
Another variant of a clinical field trial is one in which all the individuals in a cluster (e.g.
classroom or village) receive the agent. There is no difference between cluster level and
individual level trials in the rigor with which one ensures the delivery of the biological
agent. The famous studies that provided the proof of the life saving properties of vitamin
A, conducted by Sommer and colleagues, used both individual and cluster level clinical
trials (Sommer and West, 1996). The implementation of such studies is not compatible
with implementing a large scale public health intervention and only a research study can
adequately control the ingestion of the biological agent (food or nutrient supplement).

12
Utilization efficacy trials
Once nutritional regimen efficacy is established, and one is sure that the biological
context is similar enough to justify the assumption that it will have similar biological
efficacy in another context, the next step is to evaluate utilization efficacy on the
biological outcome. Utilization refers to the uptake of the intervention by the intended
“target unit”. Sometimes the food or biological agent is given to an individual who takes
it home to consume (Ekstrom et al, 2002). Often the utilization pathway is more complex
and involves sequential target units. For example, the ultimate target may be an infant or
young child, but the responsibility for delivering the agent to the child is assigned to the
household, or more specifically (although often ambiguously) to the child's caregiver.
(Bonveccio et al, 2006). In some cases, the “target unit” is a community (Chen et al,
2005).
The purpose of a utilization efficacy trial is to determine whether the target units will
actually accept and use the intervention in a manner that leads to biological impact. Thus,
the strategy in this type of efficacy trial is to ensure that the intervention is adequately
delivered to the targeted unit (e.g. individual, household, community), which then permits
one to assess response, along the pathway from participation to biological outcome.
Several steps need to be examined in utilization trials: (i) participation of the intended
beneficiaries; (ii) "adherence", which is compliance with the appropriate use of a service
or good provided by a treatment intervention, and (iii) biological impact.
"Adherence" is a term that covers the range of behaviors that mediate between delivery
and ingestion. For example, when the intervention is a nutrient supplement that is added
to foods to increase micronutrient intake in young children (Menon et al, 2006),
"adherence" involves the set of behaviors that a caregiver needs to carry out to ensure that
the preparation is correctly mixed, added to foods for the child and not given to other
family members, fed to the child, accepted by the child and actually ingested. Utilization
efficacy trials require measures of both adherence and impact.
Food and nutrients are not the only deliverables in nutrition programs. Information and
motivation are usually also necessary, and sometimes these non-nutrient bearing
interventions are delivered without food or supplements. Randomized assignment in a
utilization trial of these interventions is only warranted if the availability of the
prerequisite economic, food and social resources that are necessary to act on information
have already been examined, and there is reasonable assurance that these are in place.
Utilization efficacy studies are difficult to interpret if there is a negative finding because
the absence of effect could be due to false expectations about adherence (compliance) or
to confounding biological factors that were not adequately revealed in the clinical trials.
It is therefore essential to know whether adherence was adequate by assessing all the
steps from participation in receiving the intervention until the ingestion of the food or
nutrient. Because this data collection requires special expertise, utilization trials are best

13
conducted by a research agency, not a programmatic agency, although it is often feasible
to embed the study within a public health operation.
Program efficacy trials
The randomized control efficacy trials described above are designed to ensure that the
intervention is capable of producing a biological outcome when it reaches its intended
biological beneficiary. When one is sure that the biological and household contexts are
similar enough to guarantee efficacy if the intervention is delivered, one can then test its
efficacy when it is delivered through a program. This is still an efficacy trial because the
program delivery system is set up to function as envisioned and planned. Program inputs,
including design according to correct program theory, training, supervision, and supplies
are assured (Penny et al, 2005; Menon et al, 2002) but the actual program delivery to the
intended target unit is not assured. Thus, this type of trial is a test of the full set of
constructs (program theory) on which the intervention is based, including the constructs
about bureaucratic behavior. A program efficacy trial may assess the impact of a new
program, or of an addition to a program, or a change to a program.
Other parts of the pathway from biological agent to impact, including compliance, should
be well established before a program efficacy trial is envisaged. However, even when one
is confident that these are in place, it would be improvident to measure only biological
impact and not collect information on intermediate steps.
If the purpose of the program efficacy evaluation is to design future large scale programs,
it would be wise to ensure that the program is administered in the same manner as the
future program will be. However, impact evaluation of program efficacy also requires
concurrent formative program evaluation, not only for use in the interpretation of the
results, but also to improve program performance (Loechl, 2004). In a true efficacy study,
it is essential to correct situations that interfere with achieving the delivery, as planned.
Efficacy studies that include formative research also present a challenge to program
administration, which must be willing to implement required changes in a timely and
effective manner.
Program effectiveness trials
In contrast to efficacy trials, effectiveness evaluations study the impact of a program
under usual, not ideal, conditions. Programs in which all the effort is concentrated on
delivering a single intervention (or package of interventions) to individuals, such as
vaccination campaigns, can be easily evaluated for effectiveness using an RCT. This
type of evaluation was done for vitamin A supplementation campaigns following after the
clinical trials (Sommer and West, 1996). These campaigns deliver the vitamin A directly
into the mouths of the beneficiary, and thereby avoid the utilization step completely.
They resemble a military campaign rather than a public health program in that all the
staff, energies and the program hierarchy are concentrated on a single activity. In many
ways, they resemble a program efficacy trial more than an effectiveness trial in the
quality control exercised over the program bureaucracy. Major uncertainties relate to
14
coverage more than to delivery. This participation component warrants evaluation, but it
is rarely done even though it does not require an RCT for relevant program decisions.
In the past, effectiveness has usually been judged in relation to expected adequacy as
measured by coverage and by whether the public health outcomes are evolving over time
in the expected direction. Impact has been examined by plausibility analyses in which
investigators compare outcomes in those who participated with those who did not, taking
into account factors that affect both participation and the outcome. The recognition that
randomized trials might be used to assess effectiveness of more complex programs is
relatively recent. Most of the nutrition intervention RCTs we identified pertained to
nutrition education and conditional cash transfer programs that depend on complex
household and bureaucratic response behaviors for their success.
C. Trustworthiness: the credibility of an intervention
Decision makers must believe the inferences made in an evaluation report. This trust
depends on how the evaluation is conducted and how its quality is judged. It also depends
on the position and perspectives of the users/readers. Program managers tend to trust a
report that is intended to be useful for improving an ongoing program if they have been
intimately involved in setting the evaluation objectives, understand how the design helps
to meet those objectives, and are involved in the interpretation of the results.
Many people believe that the prerequisites for a good impact evaluation are incompatible
with the prerequisites of a useful formative evaluation of an ongoing program. There are
two elements to this belief:
1) The assumption that involving program implementers in an impact evaluation
may bias the measuring and reporting of the results that are used to assess outcomes.
2) The assumption that involving program implementers in the evaluation may
change the intervention so that it is no longer the original intervention that was to be the
object of the evaluation.
This report focuses on impact evaluations that are intended to provide information that is
useful for policy makers, who generally tend to base their assessment of the quality of a
report on technical expert opinion. Technical experts define quality according to a
combination of their judgment of the logic of the presentation and the algorithms that
have been used in the evaluation design (sampling, data collection and analysis). These
experts’ judging standards are rarely made explicit, and often are unrecognized by the
experts themselves. They depend in large part on the disciplinary training and experience
of the expert (McCloskey, 1998).
Many readers of this report depend on the opinion of experts who are economists. Until
recently, economists believed that they could determine impact without taking the step of
allocating the intervention to the recipients, provided they could estimate the
characteristics of those who received the intervention sufficiently well that they could
15
compare them with others with identical characteristics who did not receive the
intervention (see instrumentalization in Judge et al, 1980). This is similar to the position
taken by many epidemiologists when they control, through statistical analysis, for factors
that may be different between those who do and those who do not receive an intervention
(Rothman, 1998).
Recently, many economists started to think differently (e.g. Ravallion, 2005) and
concluded that a randomized control trial (RCT) approach has technical advantages that
other designs lack. The statistical approach used in the randomized control trial method
was described by Fisher in the 1930’s for agricultural research and adopted for drug
testing in the early 1950s (Cochrane, 1972), culminating in a canonical methodology (see
Appendix C). It has been applied to populations by epidemiologists, beginning in the late
1960s (Habicht and Martorell, 1993; Sommer and West, 1996), and social scientists (for
examples see Savidoff, 2006; and Rossi, 1999). It is increasingly widely seen across a
range of disciplines as the “Gold Standard” of evaluation design for impact studies
because it is the only procedure that is capable of providing a probability statement that
the observed impact was caused by the intervention (Habicht et al, 1999).
However, it is wise to remember that the quality that is defined as" adequate" at one time
may not be judged as adequate at another time, even in the same discipline. We believe
that the present wisdom about the appropriateness of using randomized control trials to
provide impact information in populations will be found wanting (Victora et al, 2004). In
part this is because the “Gold Standard” only specifies the procedures that improve the
certainty of the impact and its magnitude. This certainty is important in some
circumstances, but not in others. And this certainty of impact is insufficient for many
decisions. Thus one needs to ask: for what decisions are impact evaluations warranted, or
even essential? For what decisions are impact evaluations not warranted? For what
decisions do impact evaluations, as presently conceived, fail to provide the necessary
information?
3. Deciding to undertake an evaluation to assess nutritional
impact of a program
The issues discussed in this section are pertinent to any impact evaluation. They are
especially pertinent to an RCT because the difficulty and cost of implementing an RCT is
so great that deciding when an impact evaluation is not warranted is more important than
for other evaluation designs.
A. Explicit purpose
Before undertaking an impact evaluation, the purpose of the study should be examined to
be sure that this type of evaluation is necessary to achieve the intended purpose. High
plausibility or probability evaluations are required to:

16
1. Provide evidence through a program efficacy trial that an intervention or set of
interventions can work when it is fully implemented under ideal conditions.
2. Provide evidence that a program that has already been shown to work in an efficacy
trial is effective when it is brought to scale.
3. Provide evidence that a successful program can be extended to situations that are
similar in those in which effectiveness has already been demonstrated.
This purpose requires knowledge about the conditions that are thought to be the
reasons for success. Again, this requires an examination and testing of the
program theory at each the of the pathway steps between intervention and impact.
4. Provide evidence that an effective program can work when it is extended or replicated
in new areas or situations that are different from those in which effectiveness has been
demonstrated.
Extending a successful program to another situation requires program theory
about the barriers and facilitating circumstances that need to be taken into account
in extrapolating impact from one situation to another. This means that the
planning for the evaluation must identify likely synergisms or antagonisms (effect
modifications) of the new conditions so that effect modifiers are examined.
Plausibility evaluations are warranted for the following decisions:
1. Deciding to stop the implementation of a potentially damaging program. Setting up a
probability evaluation (RCT) for this purpose of demonstrating causality of pernicious
impact would be unethical. Other methods should be used.
Sometimes it is necessary to know the magnitude of the beneficial impact to
weigh against the damaging impact for a program that has already been
implemented. Other methods that do not endanger future recipients of the
program can give answers that are plausible enough to make these decisions.
These methods involve the use of rapid non-longitudinal and non-randomized
evaluations of the present program.
2. Deciding to stop a program for which there is no interest in improving it.
B. First steps
The decision to plan for any evaluation should be made before an intervention is
mounted. A baseline survey needs to be conducted in the population where the program
will be sited. If an RCT is to be used, a randomization procedure must assign
communities or areas to intervention and control groups.

17
This early stage of planning for a potential impact evaluation is the time to examine the
program theory that underlies the intervention. As discussed above, every intervention
has a theory which underlies its planning and implementation. This "program theory"
explains why the intervention is supposed to produce the desired results (e.g. Bryce,
2005b). If it is wrong, it is less likely that the intervention will have any impact, even if it
is well implemented. Getting program theory "right" is particularly important for
nutrition interventions because these usually involve complex biological and psycho-
biological interactions as well as all the social factors and interactions that are at work in
social-behavioral interventions.
Assessing the adequacy of the program theory requires multi-disciplinary inputs from the
spectrum of disciplines that are involved in the pathway from input to nutritional impact.
Tracing the pathway requires substantive knowledge about the diseases and conditions
being addressed by the intervention and about the causal pathways. For example, in a
food intervention, one needs to trace the pathway from the source of the food to the
program, from the program to the household, and from the household to the beneficiary
in the family to be sure that the program theory assures that the food will reach the
beneficiary. As part of the assessment of the program theory for the intervention, it is
also important to identify other pathways that could explain how the intervention might
function, including synergistic (facilitating) and antagonistic (blocking) conditions and
processes. Tracing the pathways is also necessary to identify intermediary outcomes and
processes that should be measured during the evaluation to be sure that the pathway is
actually followed.
None of the evaluations reviewed for this report had adequate descriptions of program
theory, and it is probable that the explanation for some of the evaluations that failed to
show an impact can be traced back to basic problems in the assumptions about how the
program was expected to achieve an impact; that is, to problems in the program theory.
This prerequisite step of tracing pathways and the critical review of the program theory is
likely to change an intervention considerably, so enough time must be given to this step
for the consequences of this effort to be incorporated into the program design. Program
theory is as important for program effectiveness evaluations as it is for program efficacy
evaluations.
C. Ascertaining the quality of the implementation
Prior to undertaking the follow-up study to obtain data on impact, the quality of program
implementation should be ascertained. This is most efficiently done in steps (Mason,
1984). Each step carries increased costs in time and resources; however, all of these costs
are a fraction of the cost of follow-up surveys for a probability or plausibility evaluation.
Even a well planned intervention based on correct program theory will not be successful
if the resources allocated to it are patently inadequate, or if its administration is obviously
inadequate to provide staff, resources and supervision. These matters can be ascertained
relatively quickly and inexpensively from documents that are available at a central level
(e.g. project monitoring data), or from the absence of such documentation.

18
If all is well at the central level, the next issue is implementation in the field, which may
be so inadequate that no impact could be expected. Ascertaining the quality of
implementation in the field is also most efficiently accomplished in steps. The first step is
field visits by experts who know how to ascertain adequate implementation of the
specific intervention or program through appropriate sampling and investigative methods.
They can quickly decide if implementation is grossly inadequate. Less gross inadequacies
in implementation require more careful investigation and more expertise in qualitative
operations research.
None of the impact evaluations reviewed for this report indicated that preliminary work
was undertaken to determine the quality of implementation prior to mounting the impact
evaluation. Had this been done, some of the program evaluations would not have been
conducted because the preliminary investigation would have revealed inadequate
implementation.
We believe that a primary reason that these necessary preliminary steps are not usually
taken is that their relevance is not widely understood. Typically, experts with skills in
conducting RCTs do not have the type of program experience that sensitize them to the
importance of assessing quality of implementation prior to impact evaluation. Also, they
often do not have the type of field research expertise to conduct the “quality of
implementation” research.
In some of the evaluation reports, one can surmise that an impact RCT was the only
study that was bureaucratically and politically feasible, and that the funds for the RCT
evaluation were not fungible for a formative evaluation to improve the program. This
last possibility means that the agencies that fund RCTs must have a larger vision about
how to allocate funds for evaluation than seems to be the case presently.
D. Ascertaining appropriateness of timing
The appropriate timing of an evaluation depends on three lag times:
1. The time until a program can achieve the quality of implementation necessary
for adequate coverage with adequate quality. This is the effective starting time for
judging impact. This decision is as important for program effectiveness studies as
it is for program efficacy studies.
2. The time it takes an individual to respond to the interventions, and whether that
response changes over time. For example, an individual with vitamin A
deficiency manifest as night blindness will show improved night vision in less
than a week. On the other hand, the response of hemoglobin to iron takes a month
(Gibson, 2005), but it usually takes three months before one can identify an
adequate response to a public health intervention. In young children, the effect of
a nutritional intervention on growth in height is about a month, but the effect is
small. The impact increases over time because growth in height is accretionary, so

19
that maximum effect is seen at two years of age, after which there is usually no
more effect. The effect of nutritional interventions on birth weight takes months if
the intervention improves the nutrition of pregnant women. It takes years to
achieve the incremental effect that is brought about by improving nutrition status
of women before pregnancy, and it takes two generations when a still greater
incremental effect is sought because the mother is taller due to better intra-uterine
and childhood nutrition.
3. The time until an adequate sample size can be amassed for impact. The larger
the sample, the easier it is to determine that there is an impact and the smaller the
magnitude of impact that can be identified. The magnitude depends on the
distribution of coverage at different levels of magnitude of the intervention, and
the responses of individual to the intervention at those levels.
There is a trade off between waiting for maximum effect and sample size. Smaller,
incomplete effects can be identified earlier if one has a large enough sample. It is best to
wait for maximum response by individuals because that permits one to distinguish
between an optimal versus an adequate and a partial response. The magnitude of the
response and its lag time should be part of the program theory so that they are
incorporated into program objectives. This would prevent unrealistic goals and prevent
evaluations that are undertaken too early, both of which result in evaluations that
conclude erroneously that a program is ineffective. Thus, good program theory provides
the guidance necessary to decide when an evaluation should be done.
4. Designing impact evaluations for nutrition interventions
In earlier sections we presented the theoretical rationale for ascertaining the conditions
for an impact evaluation. In this section we discuss design issues that are relevant once
one has decided to undertake an impact evaluation.
A. Describing treatment and treatment pathways
A full description of the treatment, including the steps in the pathway to biological
impact, is an essential prerequisite for an impact evaluation, not only to identify the
inputs, processes and outcomes that need to be measured, but also to provide a basis for
generalizing to other situations. Most of the evaluations we reviewed for this report were
spare in their description of interventions. The more steps that were required between the
intervention and the outcome, the less complete was the specification, and few of the
RCTs had sufficient description of the assumptions to guide data collection for validating
the assumptions or for external validity. We believe that detailed flow charts are
necessary to identify the assumptions, and to decide which ones need to be measured.
Setting up dummy tables for the appropriate analyses is also useful to identify appropriate
statistical methods and examine their feasibility. Reports of impact results need to review

20
the assumptions that were considered, note which ones were found to be true, and give
major attention to the discussion of those found to be wanting.
Control and placebo activities
In evaluations, the impact is probabilistically or at least plausibly due to whatever is
different between the treatment and the control groups. Program assumptions must be
precise about what this difference is supposed to be and design the treatment and control
interventions so that the only difference between the two is the treatment or combination
of treatments of interest. The most rigorous implementation of this principle is in a
clinical trial in which a biological agent is being examined. The control group receives
exactly the same "pill" or other nutrient carrier as the treatment group except that the
biological agent is absent. Furthermore, all contacts with treatment staff are identical in
kind and amount. In these trials, the control intervention is called a placebo, which makes
it clear that only the treatment is different. In program effectiveness studies in nutrition, a
simple placebo (given to a "negative control group") is often difficult to establish.
Another type of control is a “positive control” group. The “positive control” group
receives the same intervention (ie. the same nutrient) but in a different form, one that has
been shown to be efficacious in other settings. For example, giving an iron tablet that has
been shown to be efficacious against iron deficiency anemia to compare with an
unproven iron fortification intervention. Having both negative and positive controls is
useful because it provides information on the range of potential response (see further
discussion about adequacy of impact in 5.C below).
Sometimes only a positive control is used because it is thought to be unethical not to give
a treatment, and one presumes that the "efficacious treatment" that is to be used as the
"positive control" is universally applicable. The danger with this use of a "positive
control" design, without also having a negative control, is that one makes the inference
that the treatment shows adequate impact if the results in the treatment group are as good
as the “positive control” groups results. However, equal outcomes in the two groups
could occur if the positive control is inefficacious in the new setting, which would be the
case, for example, if anemia in the new setting was not due to iron deficiency. The iron
intervention literature is bedeviled by a continuing production of such studies resulting in
false inferences of effectiveness (cf. Ekstrom et al, 2002). These problems would have
been avoided with the use of negative controls.
Describing the treatment context to assess external validity
With respect to an intervention trial, the phrase "external validity" refers to the potential
to generalize the results to other populations. This potential depends on the biological and
social characteristics of the other populations relative to the population in which the
evaluation was carried out. For example, what is the similarity in the distribution of the
nutritional deficiency? For equal treatment, the greater the nutritional deficiency the
greater will be the biological capacity to respond (Rivera, 1991). Other determinants of
the outcome also have to be taken into consideration. For example, when malaria is

21
endemic in an area, the impact of iron supplementation is much less for equivalent
average levels of anemia.
Sometimes an adjunct to a nutrition intervention changes conditions in both intervention
and control groups in a fashion that can affect external validity. For example, deciding to
give basic, but effective, medical treatment to both treatment and control groups in a
nutrition supplementation trial in Guatemala made sense given the objectives of the
intervention (INCAP, 1993). However, this feature clearly changed the environmental
context.
The external validity of a program evaluation should examine the range of responses, not
only in relation to biological capacity to respond, but also in relation to household,
programmatic and bureaucratic characteristics. Will the program be able to deliver the
intervention as effectively in another setting? Will households participate at similar levels
and take up what the program offers? Will households use the program inputs similarly?
The description of the program that is being evaluated needs to have sufficient
information about the program setting, staff deployment, training and supervision,
logistics and other factors that affect delivery so that these issues can be examined in
new settings. Similar information is required about household access to program services,
the factors that determine their uptake of the services, and the factors that determine how
these inputs are transferred to the biological target persons.
B. Blinding
Because recipients' knowledge that they are receiving an intervention is, in effect, an
intervention in its own right, an important principle in randomized trials is that the
recipients are blinded (ignorant) about whether they are receiving the treatment or the
placebo. Without blinding, the potential for a biased response is even more likely if the
outcome of interest is behavioral (Westinghouse effect). A second principle is that the
measurers of the outcomes must also be blind to what the recipients received in order to
avoid biases in measurement associated with the measurers’ expectations.
In some nutrition evaluations, double blinding is impossible. For example, an
intervention to improve breastfeeding, which involves a behavioral component, cannot be
readily paired with a placebo behavior. The breastfeeding mother is aware that she and
her infant are receiving an intervention, which may affect other aspects of her behavior
toward her infant. In such cases, one develops placebo interventions that expose mothers
to the same amount and intensity of an educational intervention, but on another subject
(Kramer et al, 2003). Keeping the recipients and the measurers blinded is done by
physical separation so that treatment and control groups are unaware of each others'
activities. This presents a challenge for the standardization of measurements because the
two groups have different measurers. It also provides challenges in developing
meaningful informed consent procedures.
Setting up an appropriate placebo is particularly challenging when there is a possibility
that the placebo intervention affects a determinant that is synergistic or antagonistic with
22
the treatment in producing an outcome. A good example is the matter of breastfeeding,
which is most effective in preventing infant deaths where environmental sanitation is
poor (Habicht et al, 1988). A placebo that substitutes cleaning up the environment for an
intervention that uses breastfeeding counseling to change mothers behaviors would not
give information on the impact of breastfeeding among those living in poor
environments, and would impair the external validity of the evaluation for many relevant
situations.
Delivering behavioral change interventions in programmatic contexts also involves
developing or changing the organizations that deliver the intervention, and designing
blinded organizational behavior placebos is very difficult. It is clear that double blinding
of recipient and measurer becomes more difficult as one moves from the biological
pathways upward to program delivery. Double blinding in program efficacy trials is
difficult, but still possible, if the intervention and control groups are sufficiently
geographically separated. Double blinding is nearly impossible in program effectiveness
evaluations, so one must appeal to plausibility to conclude that an impact is not affected
by lack of blinding.
Two placebo problems that can occur in every impact evaluation - including RCTs - are
felt to be particularly pernicious:
1. Field activities, including the activities of program staff, are not equally distributed
between treatment and controls. Ideally every staff member in the program and every
measurer should spend the same amount of time in treatment and control areas. At the
least one should be sure that the identity of the individuals who are collecting data are
recorded the data set so that this can be examined in the analysis.
2. The vehicle of the biological agent appears different or contains different ingredients in
the treatment and control groups.
All program evaluations can endeavor to avoid the first problem, and program efficacy
evaluations should endeavor to avoid the second.
C. Allocations of interventions
Allocation to clusters to assess overall impact
Probability and plausibility evaluations must allocate the treatment and control
interventions to individuals or clusters of individuals. Allocating to clusters of individuals
must take into account that, apart from exposure to the intervention, the individuals in a
cluster also have common characteristics that are not shared by individuals in other
clusters. This means that clusters are less similar to each other than are the individuals
within a cluster. Consequently, each individual provides less information about impact
than would be the case if they were less similar. This feature produces a trade-off for
investigators between having more clusters with fewer individuals or fewer clusters with
more individuals. Part of the decision about the best trade-off is made on feasibility and
23
financial grounds. Part of the decision is made on whether or not one is looking for
overall impact or for differential impacts related to different population characteristics,
such as examining the effect of iron fortification in higher and lower hook worm-
infected areas. The latter requires more clusters and more total individuals.
Characterizing clusters
Before allocation, the clusters (e.g. villages) that are potentially available for the
evaluation must be examined to: (a) assess their feasibility for a study and (b)
characterize them in relation to conditions that are likely to affect the final outcome.
In an ideal world, all clusters would be eligible for inclusion, but some conditions are so
daunting that the cost of including them is prohibitive. For example, access to some
villages may be too difficult or the political situation is likely to prevent participation
initially or in the longer run. Evaluations of nutrition interventions are often of longer
duration than other kinds of evaluations, so that the feasibility for the longer run is
important. An example of long-term feasibility problems was encountered in the Progresa
evaluation (Rivera, 2004), which required two years to evaluate the impact on growth,
while it was politically impossible not to extend the program to the control villages
earlier. Of course excluding areas from the sampling frame means that conditions in those
areas that may affect the impact of the intervention will impair the external validity of the
evaluation. But poor internal validity destroys external validity. Thus, it is better to have
strong internal validity in a well implemented program, than poor internal validity in a
program with more external validity, so long as the limitations of external validity are
well described.
Characterization of the clusters to ascertain conditions that are likely to affect the final
outcome is important, particularly to ensure that these conditions are adequately
measured. Initial values of the variables that will be used to measure impact usually
affect the outcomes. An area with a higher initial value is likely to have a higher outcome
value too. The more similar the initial values are among the areas (homogeneity), the
more likely that they will be similar on final evaluation except for the effect of the
intervention. This increases statistical power, which makes the evaluation cheaper. A
good procedure to improve initial and predicted homogeneity across the intervention and
comparison groups is to pair clusters according to similarities of initial characteristics
most likely to affect the outcome.
However, one also has to pay attention to the problem of contamination between paired
treatment and control clusters. Having a thorough program theory will help identify
potential areas of future associations of outcomes within pairs. For example, if the same
team of front-line health workers delivers the intervention to the treatment group cluster
and the control intervention cluster, the likelihood of an association is increased. A
program theory that specifies the importance of front line worker motivation and skill for
the quality of intervention delivery and utilization would flag this potential problem and
the threat it poses for analysis and interpretation.

24
Assessing comparability of intervention and control groups after randomization
The probability design requires randomization to allocate the treatment to the
intervention and control intervention units according to a random process, analogous to
flipping a coin. The theory underlying the probability design does not require knowledge
of initial values. Only the final results need be used to ascertain impact. However,
baseline information is essential for determining the success of the randomization
process. Additionally, one can also use the baseline information to look at longitudinal
(before-after) changes within the treatment groups and show impact by comparing the
within group changes across the treatment groups.
Homogeneity across clusters diminishes the likelihood of large initial differences
between the intervention and control groups that occur by chance in the randomization
process. However, neither randomization nor relative homogeneity guarantee
comparability of treatment and control groups. Therefore, it is crucial to examine the
difference between the initial, particularly predictive, characteristics after randomization,
but before the intervention is initiated, and do more randomizations until the differences
between crucial initial values are statistically very similar between intervention and
control groups. Some believe that repeated randomization until an initial condition of no
statistical difference between randomized groups is attained (constrained randomization)
impairs statistical probability testing for impact. This belief is certainly not true if the
criteria to accept a randomization are predefined. Failing to perform constrained
randomization can result in initial values being better for the intervention group, which
impairs the plausibility of inferring that the final effect is due to the intervention or,
conversely, that the initial results were worse for the intervention group, which might
cancel out an effect. When inadequate comparability occurs prior to initiation of the
intervention, investigators have to deal with the problems raised through plausibility
analyses, thereby forfeiting the benefit of the probability design, the only reason for
doing an RCT in the first place.
Randomization to identify the impact of specific interventions within a program
Often it is desirable to obtain information about the relative magnitudes of impact of
separate interventions in a multiple intervention program. This requirement may be
motivated by the need to prioritize the interventions with most cost-effective impacts.
The most efficient strategy is to add a new treatment group that excludes the intervention
component that is thought to be least cost effective. This would increase the sample size
by 50%. Other comparisons to parse out the relative contributions of the separate
interventions would cost many times more. Simple designs that test additive impact
would still add substantially to the cost but can result in seriously erroneous conclusions
because of the likelihood that multiple interventions have synergistic (non-additive)
effects. Designs that test for interactions would cost even more. On the other hand, some
answers to the question of relative impact may be suggested by plausibility analyses if
appropriate data are collected in the RCT, but these conclusions will be tenuous.

25
D. Data Sources for Evaluations
There are three main sources of data for evaluations of nutrition intervention programs:
(a) survey data, (b) data collected by the program, and (c) data collected by other
programs or agencies, including routine administrative information. Table 1 shows the
types of data sources utilized by evaluations. Many of the evaluations we reviewed used
national nutrition surveys for pre and post intervention assessment of impact. None of
these were RCT evaluations. The RCT evaluations collected their data by special surveys.
Very few evaluations used data from other programs. These consisted primarily of
routinely collected health clinic data.
Table 1: . Sources of Data for Nutrition Evaluations
(a) Survey data
“General Purpose” Survey Data (e.g. NHAINES, MICS)
Special Purpose Survey Data (e.g. CDD, Morbidity, special marketing surveys)
Survey for the Evaluation
(b) Data collected within the program
Administrative Data
1) input data
i) supplies
ii) training
iii) distribution
2) output (beneficiary) data
i) delivery/coverage
ii) growth and health status
Specialized data collected within program being evaluated
(c) Data collected in other programs
Administrative Data (hospitals and health facilities)
1) input data
i) supplies
ii) training
2) output (beneficiary) data
i) delivery/coverage
ii) growth and health status
Specialized data collected within other programs
26
5. Probability and plausibility analyses for RCT program
evaluation In this section we deal with analyses for an RCT, which are necessary to establish
probability of impact.
A. Probability analysis for intent-to-treat
The appropriate analyses for a probability design require that impact be assessed in all of
the individuals whom one intended to treat, whether or not they were actually treated.
The counterfactual of interest in this analysis is the comparison of the “state of the world
in the presence of the program” to the “state of the world if the program did not exist”
(Heckman and Smith, 1995). This is different from the counterfactual for the “effect of
the treatment on the treated”, which is the “state of the treated in the presence of the
program” compared to the “state of the treated if the program did not exist”.
The intent-to-treat analysis requires measurements of the impact variables even in those
who dropped out or did not participate in the treatment. Only intent-to-treat analysis
permits one to ascribe causality to the probability of the statistical test. Unmeasured drop-
outs might not have shown an impact or might have shown a negative impact so that not
including them in the analyses would have biased the results. The theory underlying the
probability analyses does not permit drop-outs.
B. Analysis of effect of the treatment on the treated
Once the intent-to-treat result is in hand, one can estimate a mean treatment effect in the
participants by dividing the intent-to-treat impact by the proportion of those who actually
received the treatment (Nitsch et al, 2006). These estimates of individual impact are
unbiased and cannot be due to other confounding factors that independently affected the
outcomes. However, it is important to be clear that this estimate of impact cannot be
extrapolated to those who did not participate because the impact, although unbiased,
nevertheless includes synergisms and antagonisms that the participants had, which the
non-participants might not have had. Conversely, the participants may have lacked
synergisms and antagonisms that the non-participants might have had, had they received
the treatment.
C. Assessing adequacy of impact
Two of the main reasons for assessing adequacy of impact are as follows:
1. A primary purpose for estimating the adequacy of an intervention with respect
to its nutritional impact is to determine its cost-effectiveness. Impact must be
assessed relative to absolute change from baseline for cost-effectiveness analyses.

27
2. Impact may also be assessed for adequacy relative to a predefined expectation,
such as diminishing malnutrition by half. When expectations are pre-defined,
evaluation planning needs to take into account the fact that nutrition interventions
often involve a lag time before they are effective in changing biological status.
(see 3.D above).
All of the reports we examined used expectations of inadequate impact as the basis for
calculating sample sizes. Logically, these should be less ambitious than the impact one
hopes to achieve. The degree to which the expected impact is met is a definition of
adequacy. This can be measured as the ratio of the improvement from baseline divided by
the difference between baseline and the expected impact.
The most common nutritional impact variables are measured in individuals (these are
presented in section 8 below). For the assessment of adequacy, these measures are
compiled into summary measures that describe the impact on populations. In clinical
studies, these summary variables are often presented in terms of the prevalence of clinical
symptoms. For some variables, those that can be meaningfully examined as a continuous
distribution, the treatment and control summaries are presented as means. For some
variables, it is more common to show prevalence in relation to cut-off points, such as the
number of children who fall below a cut-off for serious growth faltering in weight-for-
age or height-for-age. In general, public health decisions, including cost-effectiveness
measures, are made on the basis of differences in prevalence. Problems are defined as the
difference in actual prevalence from some desired prevalence, and impact is assessed as a
difference in prevalence. The value of concern in public health is the absolute difference,
not the relative difference, which is the usual focus of attention in clinical medicine.
Thus, analyses of differences in prevalence, which are performed by logistic analysis,
must be transformed from relational to absolute differences.
Another way to measure adequacy of impact is to compare the results to a standard. The
standard is usually derived from a healthy population (Rivera, 2004) and can be
expressed as the ratio of the improvement divided by the difference between baseline and
the standard (Habicht & Butz, 1979). Sometimes the standard that is employed is derived
from a “Golden Standard” intervention. For example, Zlotkin and colleagues (2001)
compared the results on anemia reduction of a new intervention (Sprinkles) to the results
of drops containing iron (a gold standard measure).
D. Longitudinal “before and after” analyses: estimating the “difference
of the differences”
As previously noted, the probability theory underlying the RCT approach does not
require that baseline information be taken into account in the analysis. However, all
RCTs collect initial values before the interventions or program is implemented because
this information is required for randomization. Most studies collect the same information
in the baseline and the final survey. If the methods of data collection are identical in the
baseline and follow-up studies - as they should be - one can take the initial values into
account in the impact analyses. The simplest approach to calculate the difference over

28
time is by simple subtraction, and this is usually satisfactory. Rarely are more
complicated methods necessary, although they are required if “regression towards the
mean” might bias the estimate.
One can use these differences over time to estimate impact by obtaining a second
difference through subtracting the first differences between the treatment and control
groups. This second difference is referred to as “the difference of the differences”. One
reason for using the difference of the differences is to improve statistical power in order
to achieve greater statistical significance for a same impact. However, the procedure does
not guarantee this result. It only occurs if the initial and final measures have moderately
high correlations, e.g. of r >.250. High correlations are usual for measures over time
within individuals, such as measures of hemoglobin or anthropometry.
In many evaluations, investigators need to assess the impact on clusters, not individuals,
and the measures that are compared are cluster prevalences or cluster means. These are
not necessarily correlated over time. One scenario is that they are not correlated at all, in
which case one needs twice as large a sample size to obtain the same statistical
significance. This is a large two fold loss of statistical power. Loss of statistical power is
even greater when there is no correlation at baseline, but the matches between treatment
and control are correlated at the end of the evaluation. This can happen, for example,
when there are differences in the quality of delivery a program as a result of differences
in frontline workers, and the same workers are operating in both intervention and control
group clusters. In this case, there can be even larger losses of statistical power. In one
recent study, the loss was over three fold (Menon et al, 2006).
A correlation between treatment-control matches at the end of an evaluation that was not
there at the beginning may indicate leakage of the treatment into the control group. This
determination must be made by plausibility analyses. If such is the case, the impact will
be greater than estimated by the probability analyses and can be adjusted. The adjustment
is a plausibility analysis and cannot appeal to the statistical significance of the probability
analysis.
Another reason for using the differences of the differences is to increase the plausibility
of the results, especially for consumers of evaluation results who do not understand the
premises of the probability analyses. This is a legitimate use, so long as it does not
destroy the statistical significance of the probability analyses, which, again, is the only
reason for doing an RCT in the first place.
E. Plausibility evaluation within an RCT
The fact that an evaluation uses a randomized design does not obviate the need for
plausibility analyses. In this section, we review several issues for which plausibility
analyses are essential.
29
Accounting for loss of randomization
Ascribing a statistical probability statement that the intervention actually caused the
impact outcome is the only reason to do an RCT, and this ascription depends on
successful randomization. During the design phase, the statistical similarity between the
intervention and comparison groups should have been guaranteed by constrained
randomization. However, this cannot guarantee that events after completion of
randomization also occurred in a random fashion. In an RCT where randomization is at
the cluster level and not the individual level, a serious threat is that whole clusters will be
affected differentially by unexpected happenings. For example, some clusters might drop
out of the study because of political or social events. Alternatively, events such as
epidemics, floods, new roads, or increases in income opportunities may be more frequent
in control or in treatment villages. All of these events can affect food availability and
food intake and thus influence nutritional status. When this happens, the effects of the
beneficial events may be wrongly ascribed to the intervention, resulting in a false
inference that the intervention caused the impact. Careful monitoring of these events is
important so that their effects can be estimated. This effect is a confounding effect and
should be taken into account in the estimates of impact. It can never be completely taken
into account because it is never perfectly measured, especially when the effects are
mediated by dietary changes. However, it is plausible that the event did not cause the
impact if the estimate of the magnitude of the impact increases or does not change.
At the individual level, there are three ways in which some participants may stop
participating in the study: (1) they die, or leave the study area and cannot be found for
follow-up measurement; (2) they refuse to cooperate with the evaluation measurements;
or (3) they cooperate with the evaluation measurements but do not participate in the
intervention (treatment or placebo). It is crucially important to obtain the final
measurements of impact outcomes by tracking down those who have left the area, by
persuading the reluctant to participate at least in the measurement of the most important
outcome, and by continuing to measure those who stop participating in the treatment so
that they can be included in the intent-to-treat analyses. The reason why this is important
is because those who drop out of the treatment group may be different than those who
drop out of a control group. For instance, those in the treatment group who most need the
treatment because they are the poorest remain while those in the control groups leave to
seek work elsewhere. An effect of the treatment would then be to retain the poorest
diminishing the impact on final outcome, but possibly spuriously increasing the impact
on change measurement.
One can include in the intent-to-treat analyses those drop-outs for whom there is no final
data by imputing a final value that is the equivalent of "no impact”. Making this decision
depends on the plausibility that these individuals would not have suffered a negative
impact. Imputing the "no impact" values also involves plausibility analyses.
Another approach is to make a plausible case that omitting unmeasured drop-outs did not
bias the results. Two conditions are required to make the case: (1) there is no difference
in the number of dropouts, separated into reasons for dropping out; and (2) there is no
30
difference in the initial characteristics of the drop-outs, compared to those who remained
in the program. In the final analysis, one must appeal to plausibility that omitting these
data does not impair the conditions for applying probability analyses through intent-to-
treat comparisons.
Validating the causal relationship of the treatment to the intervention impact
Among the most serious threats to concluding that the intervention was responsible for an
impact is the possibility that the activities and biological factors associated with the
intervention were not identical between the intervention and control groups. The better
the placebo and the blinding, the less this is a problem. However, as discussed above, it is
difficult to develop a good placebo for programs, the blinding of recipients is also
difficult, and the blinding of measurers is almost impossible. There are several measures
that can be taken to strengthen plausibility analyses and arguments. For example, one can
conduct interviews with intervention and control group participants to support a claim
that they did not realize that they were receiving or not receiving a special program. One
can develop evidence to support the claim that a “Hawthorn effect” was not a significant
factor (Behrman and Hoddinott, 2001). The Hawthorn effect is named after a classic
study, conducted in the 1930s, which showed that simply the knowledge that one is
participating in a study or being observed by researchers changes people’s behavior. One
can correct the data for measurer biases, but other arguments are required to plausibly
compensate for inadequate blinding of measurers.
The strongest plausibility argument is the demonstration that the behaviors and activities
that were required by the program theory actually occurred at the crucial links between
the intervention and the outcome. For instance, records of program delivery can be shown
to correspond to reports from those to whom the delivery was targeted; the movement of
foods and nutrients through the household occurred as predicted; the targeted biological
beneficiary ingested the nutrients or food; and the intermediary or ancillary biological
responses were as expected, given the impact. An example of the latter (ancillary
biological response) is the demonstration that ferritin increased in an iron intervention
that improved hemoglobin.
Estimating dose-response
Plausibility that the intervention delivered by a program was responsible for the impact is
improved if one can show that the impact is related to the intervention in an expected
fashion. In addition to following program theory expectations, dose response analysis is
another way of validating the intervention. Dose response requires knowledge about
individuals' participation and utilization of the intervention. (Other uses of this data are to
describe coverage, and to make extrapolations about the effects of changing coverage on
impact).
Estimations of dose response must differentiate between actual dose response and
unconfounded dose response. Actual dose response is most important for establishing a
plausible argument that the impact is due to the intervention. However, actual dose

31
response may include confounding influences associated with participation. Estimating
unconfounded dose response is achieved by matching those who participated in the
treatment with similar individuals in the control group. The more transparent these
analyses are, the more plausible are the results.
The distribution of participation with a placebo will be similar to the distribution of
participation with a treatment, so one can match on similar levels of participation or
ingestion. Less good placebos may result in unequal distributions, but one can match on
ranked distributions, assuming that the ranks have similar confounding determinants.
Other matching procedures are less satisfactory because factors that foster participation
and that confound impact may not be measured or may be poorly measured. Some
matching methods are so sophisticated that they hide this uncertainty. Analyses that show
an “unconfounded” dose response in an RCT for which no intent-to-treat impact can be
shown is, on the face of it, so implausible that it requires a plausible explanation that can
be demonstrated by data. Such an explanation might be that randomization was destroyed
by external events, which worsened the outcome results in the treated group relative to
the control group. This example reemphasizes the importance of measuring the impacts
of these external events.
Another issue that dose response analysis can address is the matter of the optimal dose that is
necessary to observe an impact. In nutrition, the "optimal dose" that is required for a response
can be difficult to identify, given the influence of dietary interactions on biological
absorption and utilization. An RCT design provides an ideal condition for examining optimal
dose response. For example, in Bangladesh, Ekstrom and colleagues (2002) showed that the
optimal dose of iron to prevent iron deficiency anemia was half of the WHO
recommendations. Further such analyses, embedded in RCTs, are desirable to determine the
generalizability of these results.
In addition to the influence of synergistic and antagonistic biological characteristics, it is
also important to examine potential behavioral synergisms and antagonisms that might be
associated with participation. Unfortunately, such relationships are likely, particularly in
nutrition interventions. For example, mothers who have a greater level of participation in
a food distribution program may also see to it that their children eat a higher proportion
of the food than mothers who participate less. Given the importance of caregiver
behaviors in realizing the benefits of greater food availability, it is possible that the
provision of more food to those who participated less would not have changed impact.
Identifying "potential to benefit" as a means of strengthening plausibility
Plausibility is increased by the demonstration that the impact was affected by the
synergisms and antagonisms (interactions) predicted by program theory. These and other
unexpected interactions are also necessary for extrapolating dose response information,
and the RCT impact information to other situations. These analyses permit investigators
to identify those with a potential to benefit from the interventions. From the perspective
of future program targeting, this is more relevant than the usual descriptions of likely
impact that are based on "risk of poor outcome”. For example, a case-control sub-

32
analyses, embedded within an RCT for iron-fortified soy sauce in China, identified the
characteristics of women who responded to the intervention with improved iron status
(Du, 2005). Comparing responders and non-responders in the treatment group in an RCT
is a statistically efficient method to identify those with potential to benefit, much more
efficient than also using the control group in the analyses.
6. Types of Interventions
There are several different options for organizing a typology of nutrition interventions,
including: (a) according to how the intervention was delivered, (b) according to what is
delivered, (c) according to the recipient, (d) according to changes in intermediary outcome
behaviors (e.g. breastfeeding), (e) according to the impact sought (e.g. improved health), and
(f) according to whether the intervention is viewed as preventative or curative. Usual
typologies are a mix of these options. The typology we have created for this report is
organized by (a) and (b) because this is more relevant for programmatic interventions, and
because their program theories can be described as a flow of goods and services thru the
program into the household, into the biological beneficiary and leading to a biological
outcome (Figure 1). Nutrition relevant interventions occur at various places along this
pathway as described below.
Figure 1: Pathway from food sources available to a household to biological outcomes
Figure 2 concentrates on the program theory of the programmatic part of the pathway from
the inputs through program outputs to household, either by direct delivery, facilitated
purchase or by improving own production. All the interventions mentioned below function
according to this schemata except for the direct delivery to the biologically targeted
beneficiary, such as the child who is given a vitamin A dose directly into the mouth. For this
direct delivery and the delivery modes depicted in Figure 2, the quality of the program
delivery, of the coverage and of the focus (targeting) are important determinants of the
availability of food and nutrients. It is not enough that the food and nutrients be available,
they must also be accessed, which depends on knowledge, motivation and resources that
determine household nutrition seeking behaviors.
Sources of food to household
Household food
acquisition
Foods in Household
Food IntakeBiological Outcomes

33
Figure 2: Pathways from program inputs to household food availability
Figure 3 shows the steps that a household must take to obtain a household input and deliver it
to the biological beneficiary. Each of these steps depends on knowledge, motivation and
resources (e.g. time, cooking materials) although these are different from those required for
Figure 2. Finally, Figure 3 depicts the “program” theory of how foods and nutrients are
translated into a biological outcome. Again there are many determinants that affect each of
these steps - absorption may be impaired by parasitic infections or by inadequate fats (Jalal et
al, 1998). Movement from storage to the cell and cellular response to improved nutrient
availability may be decreased by concomitant deficiencies and diseases. Usual childhood
diseases do not impair nutritional status enough to affect biological outcomes if dietary
intake and absorption are satisfactory (Lutter et al, 1992). However, these diseases potentiate
poor nutrient intake, so that when a program has less than complete success in improving
intake, the impact will be reduced even further. Moreover, concomitant nutritional
deficiencies often behave synergistically. The interventions we reviewed for this report did
not explicitly address these antagonistic effects, which depend on the pattern of their
determinants in the population. Considering this pattern (context) in the program theory is
therefore as important as consideration of the simple linear program theory of the
interventions, as depicted in the figures. This consideration may lead to complementary
interventions, such as de-worming, or increasing fat intake.
Figure 3: Pathway from foods in household to food intake of a young child
Foods in
Household
Food available to
preparer
Preparer’s food choices
Food preparation
Feeding Food Intake

34
The figures and the following discussion are very schematic, and should be expanded by
using, for example, the information in Austin and Zeitlin (1981) and further developed to
be effective as a tool for planning a program and for developing its evaluation.
A. Supplementation
This type of intervention involves the provision of supplemental foods or specific
nutrients to the normal diets of high risk populations (preschool and school age children,
pregnant and lactating women). Foods and supplements are most often provided at no
cost to the recipient, and directly to the individual or to the household. In the former case,
the direct provision of supplementary foods (e.g. in a recuperation center) short cuts the
household behaviors except for those that bring the child to the centers.
A.1 Micronutrient Based: The commonly supplemented micronutrients in intervention
programs are vitamin A, iron, iodine and micronutrient combinations (that often include
zinc and B vitamins). This is often given directly to the child by program personal (e.g.
vitamin A campaigns). Sometimes it is provided as a condiment-like add-on, as is the
case with spreads and "Sprinkles" (Menon et al, 2006).
A.2 Food Based: These may consist of nutritious foods that are added to the diet (e.g.
milk provided for school lunch) or the provision of special formulated, nutrient dense
foods (e.g. "Nutramix" for complimentary feeding to infants).
A.3 Food For Work: This involves the provision of food stables (e.g. cornmeal, millet,
legumes) paid in exchange for work by recipients. Recent literature indicates that this
sometimes improves the diet of the most nutritionally vulnerable in a household, but
often does not because of countervailing household behaviors. The reasons for these
discrepancies are unclear, and need to be better elucidated for program theory to best
inform how these interventions should be implemented and evaluated.
B. Fortification
This type of intervention is designed to introduce deficient or inadequately available
nutrients into the diet by adding them to commonly consumed foods (e.g. iodization of
salt). World wide this approach has been successful, particularly in societies with good
food distribution and either highly centralized food processing (e.g. for the iodinization of
salt) or enforceable legislation for fortification. One crucial concern, for which there is
often inadequate attention, is the price accessibility of fortified foods compared to their
non-fortified equivalents (Du, 2005).

35
C. Nutrition Education
This intervention strategy focuses on educating population groups about the importance
of and means to increase intake of locally available, nutritious foods. Often the education
is specifically directed to high risk sub-populations (e.g. educating mothers about
providing locally accessible beta-carotene rich foods to young children). Education
techniques are often used in conjunction with other interventions (e.g. education
regarding the importance of vitamin A may be carried out concurrently with a vitamin A
supplementation program or a home gardening program). This intervention is synergistic
with almost every step of the program theories in Figures 1- 3. These synergisms should
be explicit and their effects measured. A major concern for some of these steps is
resource availability. For example, research into the effects of level of maternal schooling
(education) on child nutrition shows that better maternal knowledge and motivation as
proxied by maternal education are only beneficial if resources are sufficient (Reed et al,
1996).
D. Home/Community Based Horticulture
This type of intervention may also be referred to as Homestead Food Production (HFP).
These interventions target households for education and support toward household based
production of foods for home consumption and, in many cases, for the provision of
additional income.
D.1 Home Gardens: Home garden programs teach household members how to produce
nutrient-rich (e.g. beta carotene containing) vegetables and fruits. Household members
are also usually educated on the value of consuming nutritious, home-produced foods.
Often, the required inputs (seedlings, tools, fertilizers) are provided as well.
D.2 Animal Husbandry: These programs target households for the production of animal
based foods for household consumption and market sale. Eggs, poultry, fish-ponds and
other animal foods are among those subsidized for home production at the program level.
Program theory is poorly developed in the planning and evaluation of these interventions,
and therefore it has been difficult to show convincing evidence of their effectiveness.
This paucity of evidence may be more due to imperfect program theory than to
ineffectiveness.
E. Food Price Reduction Interventions
This intervention can be brought about by decreasing the costs of food production,
processing, and distribution, or by direct food subsidies. Program theory for all of these
possibilities is complicated because these interventions may result in more unintended
side effects than other types of interventions. Decreases in food prices may be attained at
the expense of those who produce process and distribute the foods, whose nutrition may
therefore deteriorate.

36
General food subsidies are so expensive that they are being abandoned. The evaluation of
targeted food subsidies (e.g. direct cost reduction of foods, food stamps) requires more
attention to evaluating programmatic and household fraudulent behavior than with other
interventions, not because they are necessarily subject to greater fraud but because of
political concerns about such behaviors in the context of nutrition interventions.
F. Conditional Cash Transfers
These interventions consist of demand side incentive money transfers provided to very
low income families, often specifically families with infants, young children and/or
pregnant or lactating women. Health-related cash transfers require that families (usually
mothers and children) attend prescribed health care programs. Recent large scale trials of
coupled education, health and nutrition conditional transfer programs have shown
excellent correspondence to the economic program theory of conditional transfer on
demand (e.g. school and clinic attendance), but much less impact on nutritional status
than would be expected from the improved demand. In general, neither the programs not
the evaluations included adequate program theory of household behavior. Implicit
assumptions were made about household behaviors, which were only discovered after the
RCT evaluation results were not as expected, and implicit expectations were made
explicit and investigated. Had assumptions about household behaviors been investigated
through formative research, program planning could have taken these into account and
the program would have been undertaken differently.
G. Integrated Nutrition Programs
Historically “integrated nutrition programs” referred to nutrition education and/or
supplementation organized around growth monitoring directed to younger and high risk
children. These programs have fallen into disrepute because of poor evaluation results,
which is not surprising, given the inadequacy of the program theory underlying these
interventions. To the very limited degree that any plausible program theory has been
investigated, it tends to support some of the basic assumptions about mothers'
comprehension of child growth and uptake of the educational information associated with
growth monitoring activities (Ruel et al, 1990, 1992).
H. Other
Many other child health, environmental or other programs specify improved nutrition as a
goal but do not institute any specific nutrition intervention activities. These include
diarrheal disease control programs, anti-helminthic programs, sanitation programs and
water improvement programs. These are not included in Table 2, which presents a full list
of nutrition interventions, organized according to the foregoing typology.

37
Table 2: Types of Interventions
Supplementation
1) Micronutrient-Based
Vitamin A
Iron
Zinc
Vitamin C
Iodine
Multiple Micro-nutrient
2) Food-Based
Formulated and Special Food
Preparations
Donated Foods
Nutrient Rich Food
Staple Foods
Food-for-Work
Fortification
Iron
Iodine
Vitamins
Multiple Micro-nutrients
Nutrition Education
Information about Breastfeeding
Information about Complementary
Feeding
Information about Pregnancy
Information about Family Diets
Information about Micronutrient and
Food Based Supplements
Other information
Home/Community-Based Horticulture
Home Gardens
Livestock/Animal Husbandry
Interventions to Reduce the Price of Food
Food Vouchers
Food Subsidies
Conditional Cash Transfers
Integrated Nutrition Programs

38
7. Beneficiaries
In this section, we consider beneficiaries of interventions from two perspectives: (1)
categories of individuals who can benefit biologically, and (2) categories of recipients
who are targeted for the delivery of goods and services. By “goods” we mean the items
that carry the potential for nutritional benefit and that must be ingested to have a
biological effect. “Services” refer to the social and behavioral inputs that are expected,
ultimately, to lead to ingestion.
Table 3: Types of Beneficiaries
Infants 0-6 Months for Exclusive Breastfeeding
Breastfeeding with Complementary Feeding
Complementary Feeding without Breastfeeding
Children Under 5 Years of Age
Children 5-12 Years of Age
Pregnant Women
Lactating Women
Or Postpartum
Women of Reproductive Age
Elderly
Other Household Members
A. Targeting those with a potential to benefit
Nutrition interventions to address undernutrition are undertaken with the expectation that
they benefit the recipients biologically. An obvious, but often under appreciated,
precondition for the effectiveness of interventions is that those who receive them must
have a potential to benefit biologically from the intervention for it to have a biological
effect. The recipients must have a nutritional deficiency that can be remedied by the
intervention. This is more likely to be the case in infancy and the second year of life, and
among pregnant and lactating women, because these are the periods of life when nutrient
requirements are greatest. Moreover, in poor populations world-wide, these are the
population sub-groups that are least likely to consume adequate and appropriate foods
when food is not sufficient.

39
The available evidence suggests that after age 2 many children, even in deprived
populations, do not benefit from nutrition interventions that are designed to improve their
growth in height and weight. However, this may not be uniformly the case across the
world. Therefore, it is essential to establish a profile of nutritional status across age
groups before the design of an intervention. If this has not been done prior to designing
the intervention, it is essential to do so before designing an evaluation of the intervention.
Cross sectional national data is widely available for height-for-age, the best overall
population indicator of general undernutrition, and for hemoglobin, the usual indicator
for iron deficiency. If such a profile reveals that children 2-5 years of age are not likely to
benefit from the intervention even though they are included as stated beneficiaries, then
those children who were exposed to the intervention only after they reached 2 years of
age should not be evaluated for impact. They can be included as a control group to
children over 2 years who had received the intervention at younger ages.
Some socio-economic factors differentially affect the availability of appropriate foods for
those with specific needs. Availability of breast milk, first as an exclusive food to age 6
months and then as part of the diet when the child is consuming complementary foods, is
particularly subject to socio-economic and cultural factors. The types of foods that are
fostered by interventions are usually designed to be appropriate for at-risk groups. One
common exception is neglecting the lactating mother, particularly when the aim is to
promote exclusive breastfeeding for 6 months. For an undernourished woman to sustain
lactation, nutritional support is essential (Cassio-Gonzalez et al, 1998), and it is also
essential that interventions to promote exclusive breastfeeding do not leave
undernourished nutritionally depleted as a consequence of accepting program advice.
Improving maternal nutrition is important not only for the production of breast milk, but
also for the mother herself, and for her next infant. These considerations extend to all
women of child bearing age if they are malnourished because they are poorly prepared
for pregnancy and lactation. In order to obtain an adequate interpretation of biological
impact, attention to these considerations should enter into the design of evaluations of
interventions to improve breastfeeding, as well as those that are aimed at improving birth
weight.
Old age is also thought to be a period when interventions might improve nutrition in poor
populations. This group is rarely an object of nutritional interventions. Children over age
2 and non-elderly adults are often targeted beneficiaries for nutritional interventions.
They usually suffer less from general malnutrition, although profiles may reveal
otherwise in specific populations. In developing these profiles, it is important to take into
account non-nutritional influences on the profile measures. For example, hemoglobin is
depressed in areas with malaria, and this depression must be considered in judging the
profile. Other non-nutritional influences on hemoglobin, such as some
hemoglobinopathies, restrict the potential for hemoglobin to respond to a nutritional
intervention to such an extent that there is actually no potential to benefit.
Another type of benefit from nutritional interventions can be characterized simply as
"improved diet”, without the specification of particular biological benefits. This is an
40
appropriate outcome to evaluate if it has been shown that a similar intervention in a
similar setting had a biological impact that is mediated through diet. In this case, the diet
is a proxy measure for a biological impact. However, this assessment is most
appropriately used for monitoring. Monitoring dietary improvement is much less onerous
than evaluating for biological outcome, in large part because those who have the potential
to improve their diet are more prevalent than those who have a biological potential to
benefit. However, as discussed below, dietary information should not be used as a proxy
for nutritional impact in evaluations.
B. Targeting for Delivery of Goods and Services
Many nutrition intervention programs use multiple levels to reach their target. In practice,
there appear to be three levels of selection for receiving goods and services: communities,
households and individuals. This may be done for only one category or for combinations
of categories, sequentially. For example, poor communities may be selected, and within
those communities households may be selected for screening, and within households only
some individuals (e.g. undernourished children) are selected (e.g. for supplementary
feeding in feeding centers). Alternatively, all households in poor communities may be
selected or all children under 2 years of age may be targeted.
Targeting for goods and services is sometimes made from the perspective of biological
potential to benefit. However, this is not always the case. Sometimes the targeting
includes recipients who do not have a biological potential to benefit, but who will assure
that the nutritional intervention reaches those with the potential. Feeding a mother who
breastfeeds benefits both mother and child. Nutrition education to a mother is meant to
lead to improved diet for the child.
Sometimes targeting for the delivery of goods and services is done on the basis of
feasibility from the perspective of the agency that is charged with delivering them. For
example, food is sometimes delivered by one agency (e.g. government) to another agency
(e.g. non-governmental agency) or to a community representative. Evaluations should
assess the coverage of the delivery system at each of these levels. Coverage includes both
availability and accessibility. These are not synonymous. Availability is usually defined
geographically in relation to the population being served. As previously mentioned,
accessibility refers to whether the available source is readily or reasonably accessible. For
example, a food distribution center may be available within easy walking distance, but
going to it requires passing through a dangerous or forbidden neighborhood. In some
cultures women may not go alone to a center, and appropriate male companions may not
be routinely available.
Table 4 shows the categories that are reported for targeted delivery of goods and services
and the types of indicators that are used to assess impact.

41
Table 4: Categories of targeting and types of indicators used to assess impact
Categories of recipients Indicators
Community Level Community development indicators
Household level Household wealth and demographic indicators
Individual level Demographic and need-based indicators
8. Impact Indicators Impact indicators are used in RCTs to ascertain the impact of the intervention. This is accomplished by subtracting the indicator results in the treatment group from the values in the control group. These same indicators are also necessary for describing the context of the program, for ascertaining the population's potential to benefit from the program, and for ascertaining whether the program met adequacy goals related to these standards and criteria.
A. Indicators of dietary intake
A review of the types of interventions and types of beneficiaries above shows that many
nutrition interventions are designed to provide nutrients directly to beneficiaries. These
are delivered in two main forms: (a) capsules or pills or (b) mixtures and food-derived
supplements (e.g. dried milk powders, micro-nutrient enriched powders, specialized
"snack foods”, spreads, etc).
Other interventions aim at improving nutrition through improved dietary intake of foods.
When the intervention is focused on improving dietary intake of specific foods or
categories of food, such as "green leafy vegetables”, measures of intake of the foods that
are being promoted could be considered as outcomes. However, as biological theory and
program theory make clear, they are always intermediary to biological outcomes and
cannot be regarded as proxies. For example, in the case of promoting green leafy
vegetables, increased consumption does not translate unit for unit into better vitamin A
status because conversion of beta-carotene to biologically usable vitamin A depends on a
complex of issues, including the characteristics of specific vegetables, other dietary
factors and other biological characteristics of individuals.
A third type of nutrition intervention, which is still relatively rare, but likely to become
more common, particularly in conjunction with other nutrition interventions, is aimed at
changing feeding behaviors. For example, there is evidence that frequency of feeding is
important to protect young children from undernutrition during the period of
complementary feeding, and that inadequate number of feeding episodes per day is
associated with growth faltering (WHO/UNICEF, 1998, Dewey and Brown, 2003). When
a complementary feeding intervention includes advice to feed more frequently or to feed
a supplement at a particular time of day (as is the case with the supplement distributed by
Oportunidades - formerly Progresa- cf. Bonvecchio et al, 2006), assessment of
beneficiary response should be part of impact assessment. However, as with the
promotion of specific foods, these cannot be regarded as proxies for biological impact.
42
Nonetheless, measuring at least selected aspects of diet is important in nutrition
intervention evaluation for several reasons:
1) At baseline to describe the "dietary" context for purposes of program planning
and external validity.
2) At follow-up for plausibility analysis to ensure that the intervention did not
merely displace nutrient sources. This is particularly important when impact is
less than expected. Dietary information may also be used to identify other dietary
factors that may be acting synergistically with the intervention.
3) As indicators of intermediary outcomes that are the most proximal in the
social/behavioral chain that leads to biological impact.
From the inception of nutritional sciences as a field of study, the measurement of dietary
intake has claimed substantial amounts of attention. Given the repetitive, but variable,
nature of dietary intake (which can be seen as requiring sampling from a "behavioral
stream") plus the fact that measurement of quantity is necessary to make assessments of
nutrient intake, and that diet is deeply embedded in a variety of social and cultural
processes, it is not surprisingly that methods for precise measurement have eluded even
the sharpest methodological minds.
Over the years, a variety of techniques have been developed, each of which has strengths
and weaknesses (see Gibson, 2005, for an excellent summary). The most common
techniques for obtaining estimates of total dietary intake of individuals are:
1. A 24 hour recall (or multiple 24 hour recalls)
2. A food frequency questionnaire (typically covering a week)
3. Direct observation (with or without weighing of portions)
4. Dietary history (over a month or longer)
The first two methods are those usually used in evaluations.
When investigators are concerned about specific categories of foods, such as animal
source foods, iron rich foods, vitamin A rich foods or complementary foods for infants,
the general techniques can be modified to focus exclusively on the foods and feeding
behaviors of particular interest (Blum et al, 1997). This is essential to interpret the
biological impact of interventions that deliver specific foods and nutrition education
related to foods and feeding behaviors.
A number of different techniques have been developed to convert dietary data about food
into nutrient and energy content. Commonly, the dietary data are converted into estimates
of nutrient intake using food composition tables (USDA, 2006), and the profile is then
43
compared to nutrient reference levels. Several different reference values of evaluation of
nutrient intakes and diets are available, including guidelines jointly issued from
FAO/WHO/UNU (1985), FAO/WHO (2002) and the Institute of Medicine (2000).
Collecting and analyzing dietary data in a fashion that yields reasonable estimates of
nutrient intake requires substantial time, skill and economic resources.
For contextual purposes, dietary information is necessary to describe the diet, but it is
inadequate to identify undernutrition. Identifying undernutrition requires anthropometry
for protein-energy undernutrition, clinical signs for iodine undernutrition, and
biochemical indicators for other nutritional deficiencies. Dietary information is essential
to explain the reasons for undernutrition identified by these other means. For similar
reasons, dietary information is inadequate to assess the biological nutritional impact of an
intervention, but it is essential in explaining why impact did or did not happen.
Recently, dietary data have been used without conversion to nutrients. Within a
population, individual intakes can be compared by means of scales or composite
measures created from food intake records (Ruel, 2003; Hoddinott, 2002). The potential
for using these measures is still under investigation.
B. Biochemical and clinical indicators of nutritional status
An indicator of nutritional status is a measure of a biological variable that is affected by
nutrition. Table 5 provides a comprehensive list of the indicators of micronutrient and
macronutrient status that are currently used by the nutrition community. These indicators
reflect nutritional status. Dietary intake is a determinant of nutritional status but is not an
indicator of nutritional status, and some of the considerations that are important for
indicators of nutritional status do not pertain to dietary intake. For instance, the
determinants of dietary intake only affect nutrition through the diet, while indicators of
nutritional status are also affected by many non-nutritional influences. Moreover, these
influences also affect the nutritional interpretation of these biological outcomes.
All indicators of nutritional status can be defined at the individual level. Individuals
whose indicators fall below (or above) some level are declared deficient (see “Individual
cut-offs for estimating population prevalences” in Table 6). The prevalences of these
deficiencies are an expression of the nutritional status of the population. Table 6 presents
some standards that are used in the assessment of severity and prevalence of specific
nutrient deficiencies. The data provided are for the evaluation of populations only.
Assessment of nutritional status in individuals requires more information.
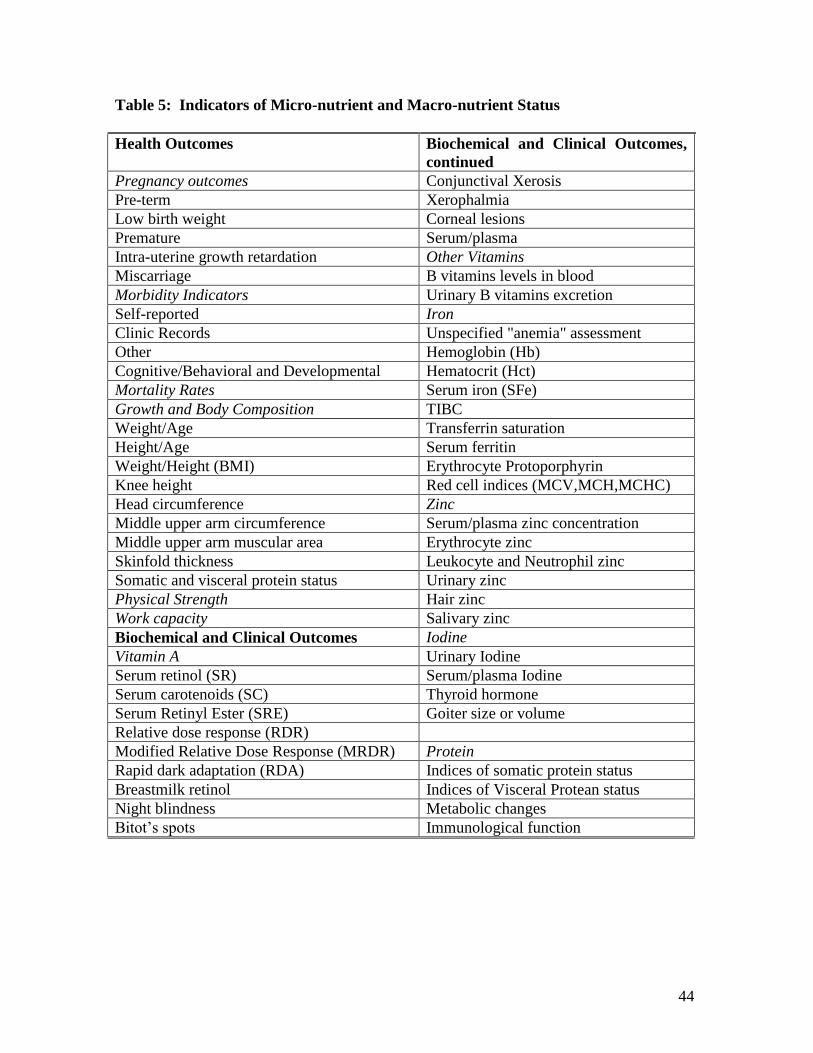
44
Table 5: Indicators of Micro-nutrient and Macro-nutrient Status
Health Outcomes Biochemical and Clinical Outcomes,
continued
Pregnancy outcomes Conjunctival Xerosis
Pre-term Xerophalmia
Low birth weight Corneal lesions
Premature Serum/plasma
Intra-uterine growth retardation Other Vitamins
Miscarriage B vitamins levels in blood
Morbidity Indicators Urinary B vitamins excretion
Self-reported Iron
Clinic Records Unspecified "anemia" assessment
Other Hemoglobin (Hb)
Cognitive/Behavioral and Developmental Hematocrit (Hct)
Mortality Rates Serum iron (SFe)
Growth and Body Composition TIBC
Weight/Age Transferrin saturation
Height/Age Serum ferritin
Weight/Height (BMI) Erythrocyte Protoporphyrin
Knee height Red cell indices (MCV,MCH,MCHC)
Head circumference Zinc
Middle upper arm circumference Serum/plasma zinc concentration
Middle upper arm muscular area Erythrocyte zinc
Skinfold thickness Leukocyte and Neutrophil zinc
Somatic and visceral protein status Urinary zinc
Physical Strength Hair zinc
Work capacity Salivary zinc
Biochemical and Clinical Outcomes Iodine
Vitamin A Urinary Iodine
Serum retinol (SR) Serum/plasma Iodine
Serum carotenoids (SC) Thyroid hormone
Serum Retinyl Ester (SRE) Goiter size or volume
Relative dose response (RDR)
Modified Relative Dose Response (MRDR) Protein
Rapid dark adaptation (RDA) Indices of somatic protein status
Breastmilk retinol Indices of Visceral Protean status
Night blindness Metabolic changes
Bitot’s spots Immunological function

45
Table 6: Cut-offs to estimate prevalence and prevalence criteria of population undernutrition for frequently used biological outcome measures.
Individual Cut-offs Population
Indicator
Individual cut-offs
Gibson
2005
page
Prevalence of inadequacy
Gibson
2005
page
Vitamin A
Serum Retinol
(umol/L)
>0.70 2- 10% - mild
10-20% - moderate
> 20% - severe
p.496
Modified
Relative Dose
Response (ratio)
>0.060 20-30% - moderate
>30% - severe
Night blindness <1% - mild
1-5% - moderate
>5% - severe
Iron Age/gender based cut-off
criteria
p. 447
Hemoglobin
(g/L)
Age in Yrs. g/L
0.5-5 <110
5-11 <115
12-13 <120
Men <130
Non-preg. Women <120
Preg. Women <110
≥ 40 - severe
20-39.9 - moderate
5.0-19.9 - mild
≤ 4.9 - normal
p.17
Serum Ferritin
(ug/L)
Age in Yrs. ug/L
1-2 <10
3-5 <10
6-11 <12
12-15 <12
≥ 16 <12
>20% indicates a population
with iron deficiency
(WHO 2004)

46
Table 6: Cut-offs to estimate prevalence and prevalence criteria of population
undernutrition for frequently used biological outcome measure (continued)
Indicator Age and gender based cut-off
criteria
Prevalence Gibson Pg.
Iodine Prevalence
Goiter
Grade 1- goiter palpable but
not visible.
Grade 2- visible goiter
Total Goiter Rate= % of
goiters > grade 1
5.0 - 19.9 Mild
20.0 - 29.9 Moderate
≥ 30 Severe
p.755
Urinary Iodine
Excretion
No more than 50%
should have a urinary
iodine concentration <
100ug/L, and no more
than 20% of the
population should have a
urinary iodine
concentration below
50ug/L.
p.759
There is some suspicion that high prevalences of hemoglobin below 90 g/L may reflect
other reasons for anemia besides iron deficiency (Stoltzfus, 1997), so it is worth reporting
the prevalences below 90 g/L separately from the prevalences of those below the cut-offs
in Table 6.
The cut-offs to describe iron deficiency in the population have been changed recently.
Transferrin receptors now replace transferrin. Iron deficiency and depletion are now
differentiated within those who have low ferritin levels as follows: low ferritin and low
transferrin receptors are classified as depleted; low ferritin but normal transferrin
receptors are classified as deficient (WHO, 2004). Indicators of iron undernutrition are
explained by the fact that lower hemoglobin is the expression of an iron deficiency that
is severe enough that the formation of hemoglobin is affected. Iron deficiency is
described both by the amount of iron in stores (which is reflected in ferritin levels), and
the avidity of transferrin to bind iron (reflected by the transferrin receptors). Transferrin

47
transports iron from storage to the cells and more transferrin receptors for iron become
available when iron becomes deficient. Measures of ferritin and transferrin receptors are
each affected by other factors than iron, but their combination deals with this
confounding.
C. Anthropometry: indicators of growth in children
The WHO publication (1995), “Physical status: The use and interpretation of
anthropometry”, describes the uses of anthropometry to identify and quantify
undernutrition for specific purposes, including describing nutritional status in a
population and responses to nutritional interventions. In addition to the extensive
guidelines in this document, Gibson (2005) provides further information about
measurement issues and techniques. Appendix D contains the WHO recommended
protocol for standardizing the anthropometrists, the people who will do the measuring.
This protocol is used extensively in this or adapted form.
Anthropometry is widely used in clinical practice to manage pregnancy. At the
population level, inadequate weight gain during pregnancy is an important indicator of
population undernutrition. Maternal anthropometry is used to ascertain the prevalence of
maternal energy undernutrition, as well as to assess the impact of interventions to
improve maternal diet.
In public health research and evaluation, the most common use of anthropometry is with
children. In undernourished populations, child growth in stature falters from about 3
months to about two years. Stature is considered the best overall measure of
undernutrition in children in this age range. There is no significant catch-up in growth of
stature thereafter. Because stunted growth is accretionary over the 3-24 month period, its
full impact is only visible at two years of age and thereafter. Consequently, the height of
children from two to five is a good, and statistically powerful, indicator of previous
malnutrition, which occurred during their first two years of their life.
When evaluations are conducted at a point at which a sufficiently large number of
children in the intervention group have reached 2 years of age, and been in a program
during the period that is most sensitive to growth faltering, relative smaller sample sizes
are required compared to evaluations that seek to identify impact before the period of
maximum effect can be observed (Shen et al, 1996).
In contrast to height and weight, other anthropometric indicators, including upper arm
and calf circumferences, skin fold thickness, weight-for-height and body mass index
(=kg/height2) are not accretionary and therefore reflect current undernutrition rather than
previous malnutrition. These are less statistically powerful for use in program evaluations
that address general undernutrition. They are also somewhat more difficult to interpret,
except in conditions of near starvation when they are the best measures - especially upper
arm circumference. The ambiguity of these indicators of current nutrition derives from
the fact that children who are growing better in stature tend to be thinner than those who
are experiencing growth faltering. Weight takes into account both faltering in stature and

48
thinness and is therefore the most widely used anthropometric measure, although it is
statistically less powerful than stature to identify impact.
There are two ways to summarize anthropometric status of children in a population: (1)
the prevalence of growth stunting and 2) mean stature.
The prevalence of growth stunting
A stunted child is one whose recumbent stature or standing height falls below the 2.5
percentile according to age and sex specific standards. This cut-off corresponds to -2 of
the difference in cm from the 50th percentile divided by the standard deviation. This
standardized difference is a Z-score. So the cut-off for counting the stunted is -2Z-score.
A population with no undernutrition will have a prevalence of 2.5% "stunted" children,
all of whom are, however, well-nourished and healthy. In moderately and severely
undernourished populations half or more of the children are stunted by 2 years of age.
The prevalence of stunted children is less at younger age groups because of the dynamics
of stunting described above.
The specification of undernutrition as height or weight below -2 Z is serious flawed
because, in a population with a high prevalence of undernutrition, many undernourished
children will be taller than -2 Z cut-off. However, if they had received adequate nutrition,
they would have been taller, and the extent of undernutrition they suffered may be equal
to those of children who are shorter, but began life with a lower genetic potential to
achieve a greater height. One can deal with this by distributional analyses, but the
prevalence results depend on assumptions about the distributions (cf. Figure 26 p220 of
WHO, 1995). On the other hand, for ascertaining a difference between intervention and
control groups or in a population measured over time, the difference between the -2 Z
score prevalences is still a powerful method.
Mean stature
Another way to summarize anthropometric data at the population level is by mean
stature. Mean indicators of nutritional status can be compared to the mean of a standard.
A mean Z-score of 0 indicates no malnutrition. A mean Z-score of -2Z is approximately
equivalent, by construction, to a stunting prevalence of 50%. One can also compare the
means across populations and across time. Comparing means is more statistically
powerful for anthropometry than comparing prevalences.
Standards for indicators of nutritional status can only be constructed if the distributions of
indicators of nutritional status are similar across healthy well-nourished populations. This
is the case for anthropometry (Martorell and Habicht, 1986) even though there is a large
variability within populations that is due to the genetic factors: tall parents have taller
children than shorter parents in healthy populations. However, the means and
distributions are fairly consistent within healthy, well-nourished populations. Age and sex
make such significant contributions to anthropometry that it is necessary to have age and
sex specific standards. On the other hand, the effects of "racial" background and altitude
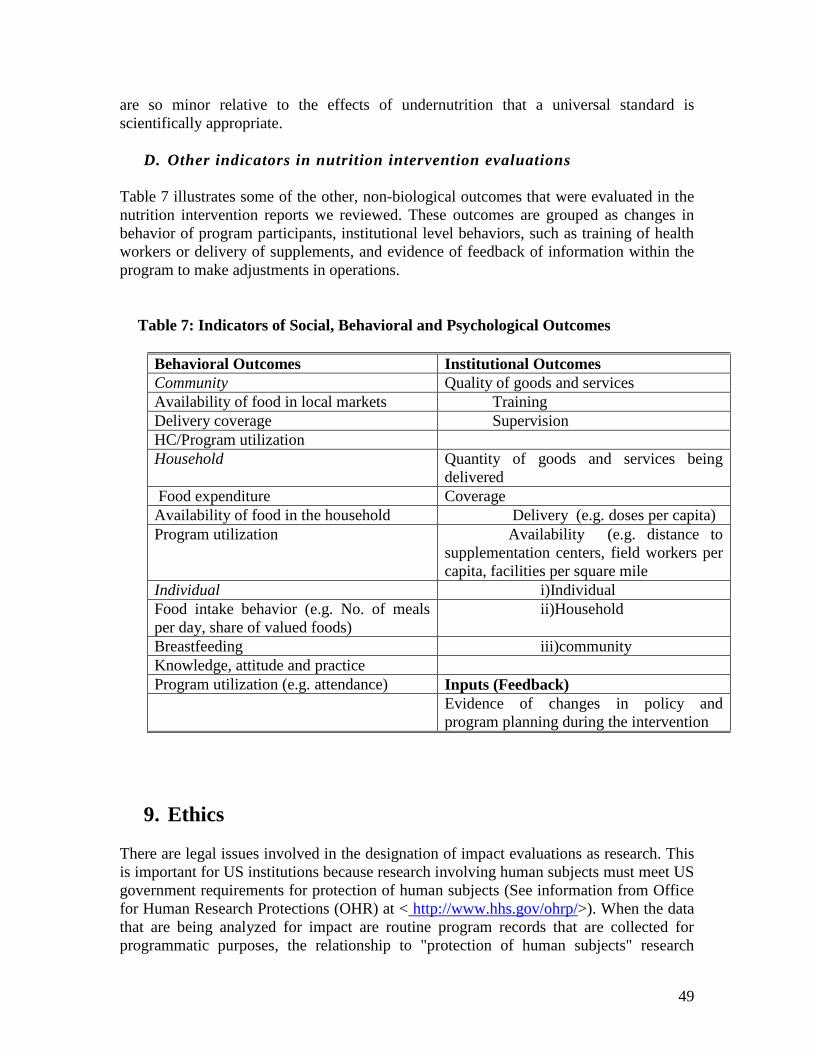
49
are so minor relative to the effects of undernutrition that a universal standard is
scientifically appropriate.
D. Other indicators in nutrition intervention evaluations
Table 7 illustrates some of the other, non-biological outcomes that were evaluated in the
nutrition intervention reports we reviewed. These outcomes are grouped as changes in
behavior of program participants, institutional level behaviors, such as training of health
workers or delivery of supplements, and evidence of feedback of information within the
program to make adjustments in operations.
Table 7: Indicators of Social, Behavioral and Psychological Outcomes
Behavioral Outcomes Institutional Outcomes
Community Quality of goods and services
Availability of food in local markets Training
Delivery coverage Supervision
HC/Program utilization
Household Quantity of goods and services being
delivered
Food expenditure Coverage
Availability of food in the household Delivery (e.g. doses per capita)
Program utilization Availability (e.g. distance to
supplementation centers, field workers per
capita, facilities per square mile
Individual i)Individual
Food intake behavior (e.g. No. of meals
per day, share of valued foods)
ii)Household
Breastfeeding iii)community
Knowledge, attitude and practice
Program utilization (e.g. attendance) Inputs (Feedback)
Evidence of changes in policy and
program planning during the intervention
9. Ethics
There are legal issues involved in the designation of impact evaluations as research. This
is important for US institutions because research involving human subjects must meet US
government requirements for protection of human subjects (See information from Office
for Human Research Protections (OHR) at < http://www.hhs.gov/ohrp/>). When the data
that are being analyzed for impact are routine program records that are collected for
programmatic purposes, the relationship to "protection of human subjects" research

50
regulations is arguable. However, when an evaluation has a baseline and other
information collecting activities, such as operational research, the data collection would
often require "protection of human subjects" procedures. Furthermore, when an
evaluation includes a control group, the program may be considered part of the
evaluation. These issues are best resolved by having an established institutional review
board that can help delineate the human protection responsibilities of the evaluation, as
distinct from those of the program.
In general, there are four basic principles that need to be taken into account in protecting
human subjects: (a) autonomy, (b) non-malfeasance, (c) beneficence and (d) justice.
These principles have evolved out of clinical trials and are well conceptualized for that
context (c.f. Beauchamp and Childress, 1983). Translating the principles to a public
health setting is challenging because they only address the protection of individuals. The
injunction of non-malfeasance is the least ambiguous, and should be specifically
addressed. Protection of autonomy is essential for some cultures, including the US, and is
strongly protected by US regulations, and implemented through the concept of "informed
consent”. This concept includes freedom to choose not to participate in parts of an
intervention, or its evaluation, without losing any of the other benefits.
The principle of beneficence causes the most confusion both within the US government
guidelines, and for policy makers and the lay public. In part the confusion is one of
terminology, because it should be called bene-feasance. The issue is whether one should
always "do good" if one knows that there is a need. The "should" is, of course,
constrained by what is feasible, but that constraint is so ill-defined that the beneficence
principle is difficult to codify for useful practice. Beneficence is commonly confused
with non-malfeasance. This is a disastrous confusion because non-malfeasance is an
imperative that can be met, while guidance on beneficence is ambiguous.
One of the major obstacles to implementing RCTs for programs is the need for control
groups. Confusing beneficence with malfeasance often precludes this possibility. One
cannot, according to the rules for protection of human subjects, appeal to a greater good
to override harm done to an individual. However, only malfeasance causes harm. Failure
of beneficence does not cause good, but it causes no harm - a crucial ethical
differentiation.
The principle of justice is the most ambiguous, even at the individual clinical level
(Beauchamp and Childress, 1983). It is even more complicated in a public health setting.
10. Conclusions In this section, we briefly summarize the results that emerged from our overview of
current evaluation practice in nutrition intervention impact research. We then outline
some issues that, in our view, need attention in future research on the impact of nutrition
51
evaluations. We focus particularly on recommendations about the organization and
conduct of nutrition evaluations, rather than on specific substantive nutritional topics.
Results
Impact evaluations of nutrition interventions use a range of methodological approaches,
from randomized intervention/control designs, with careful analysis of counterfactuals, to
simple "before/after" studies, with inadequate attention to the methodological threats to
concluding that impact could be plausibly attributed to the intervention.
The strongest demonstration that nutrition interventions can have major impacts on
biological well-being come from evaluations of well-run programs that deliver drugs,
food or nutrients directly to the intended biological beneficiary.
Small-scale, well-designed efficacy trials have demonstrated clear biological impact for
interventions that depend on behaviors of intermediaries in the pathway from intervention
to the biological beneficiary impact. Moreover, some program evaluations have
documented solid impact on non-biological intermediary outcomes, particularly
appropriate response to economic incentives in conditional cash transfer programs.
However, in large scale programs, which involve complex delivery and utilization
pathways from the intervention to the biological beneficiary, there is usually less
biological impact than would have been expected given the inputs. It is not clear whether
this is due to inadequate program implementation, quality and coverage of program
delivery, the food and nutrition-related behaviors and uptake of program delivery of
goods and education by households, and/or the household "translation" of information
into practice and foods or other goods into nutrition of beneficiaries.
As disturbing as these findings are, what is equally cause for concern is that, with rare
exceptions, the studies do not reveal why programs are less effective than well-designed
research trials suggest they should be. There is a tendency for investigators to use
sophisticated analyses to remedy the lack of impact findings or to fall back into a
discussion of "lessons learned”. What is strikingly absent is the use of an explicit
program theory that would have focused attention on the measurement of variables that
provide critical information on where and why the system is weak or failing, including an
understanding of emic conceptual structures that program staff and household behaviors.
Outstanding issues for evaluation
In recent decades, there have been important advances in all of the sciences that are
necessary for effective evaluation of nutrition programs. Understanding of research
designs and statistical procedures for data analysis has matured, and the armamentarium
of tools and techniques is impressive. Methods for feasible measurement of biological
impact in populations have also made strong advances. Methods and techniques for
quantitative and qualitative measurement of program delivery and household utilization
processes have equally advanced. In short, while there is still much to be learned about

52
"how to do it better”, there is a wealth of knowledge and skill that is not being adequately
tapped for nutrition program evaluations.
To remedy the present situation, which is not making use of the potential to use existing
resources to address critical questions, it is required a re-orientation in the organization of
nutrition evaluation research. To that end, we have outlined a set of recommendations for
discussion:
Restructure nutrition evaluations so that the development of program theory for the
evaluation is undertaken concurrently with program planning.
Promote multidisciplinary attention to developing the program theory within every
nutrition evaluation and operationalizing the measurements to assess the
components identified by the theory.
Provide adequate funding for operational research within evaluations and link the
results to the impact evaluation findings.
Give priority to program efficacy evaluations over program effectiveness
evaluations for complex nutrition interventions until there is sufficient knowledge
about how to improve programs enough to warrant effectiveness evaluations.
Restructure funding of impact evaluations so that they are implemented in a logical
sequence with clear criteria for ceasing further activities if they are not warranted,
and establish bureaucratic incentives to stop evaluations in a timely fashion.
Foster RCTs for program efficacy.
Reserve RCTs for nutrition programs that have enough external validity (and define
the conditions for this validity) that the results are widely applicable.

53
REFERENCES
Austin, J.E., Zeitlin, M.F. 1981. “Nutrition Intervention in Developing Countries: An
Overview”. Cambridge, Mass: Oelgeshclager, Gunn & Hain.
Beauchamp, T.L., Childress, J. F. 1983. "Principles of Biomedical Ethics, Second
Edition”. Oxford University Press, NY.
Behrman, J.R., Hoddinott, J. 2001. “An Evaluation of the Impact of PROGRESA on
Preschool Child Height” Food Consumption and Nutrition Division, IFPRI, March (68).
Blum, L, P.J., Pelto, G.H. Pelto and H.V. Kuhnlein. 1997. “Community Assessment of
Natural Food Sources of Vitamin A” . Boston: International Nutrition Foundation.
Bonvecchio A, Escalante E, Nava F, Villanueva M, Safdie M, Monterrubio E, Rivera JA,
Gretel Pelto GH. “Maternal knowledge and use of a micronutrient supplement was
improved with a programmatically feasible intervention in Mexico”. Submitted to J.
Nutrition.
Bryce, J., Boschi-Pinto, C., Shibuya, K., Black, R.E., and the WHO Child Health
Epidemiology Reference Group. 2005a. “WHO estimates of the causes of death in
children.” The Lancet , 365(9465),1147-1152.
Bryce, J, Victora CG, Habicht J-P, Black RE, Scherpbier RW and MCE-IMCI. Technical
Advisors. 2005b. “Programmatic pathways to child survival: results of a multi-country
evaluation of Integrated Management of Childhood Illness”. Health Policy Plan, 20: i5-
i17.
Caulfield, L.E., de Onis, M., Blossner, M., Black R.E. 2004. “Undernutrition as an
underlying cause of child deaths associated with diarrhoea, pneumonia, malaria, and
measles”. Am J Clin Nutr, 80:193-8.
Chen, J., Zhao, X., Zhang, X., Yin, S., Piao, J., Huo, J., Yu, B., Qu, N., Lu, Q., Wang, S.
& Chen, C. 2005. “Studies on the effectiveness of NaFeEDTA-fortified soy sauce for
controlling iron deficiency: A population-based intervention trial”. Food and Nutrition
Bulletin, 26: 177-186.
Cochrane, A.L. 1971. “Effectiveness and efficiency: random reflections on health
services”. The Nuffield Provincial Hospitals Trust.
Dewey, K.B, Brown, K.H. 2003. “Update on technical issues concerning complementary
feeding of young children in developing countries and implications for intervention
programs”. Geneva: WHO Global Consultation on Complementary Feeding, Special
Supplement to the Food and Nutrition Bulletin, 42(1).

54
Dickin, K.L, Dollahite JS, Habicht J-P. 2005. “Nutrition behavior change among EFNEP
participants is higher at sites that are well managed and whose front-line nutrition
educators value the program”. J Nutr, 2005 135 (8): 2199-2205.
Du, L. 2005. “Fortifying Chinese Soy Sauce with Iron: A Study of the Scientific and
Policy Aspects of a Food Fortification Program”. Unpublished Ph.D dissertation.
Division of Nutritional Sciences, Cornell University, Ithaca, NY.
Ekstrom, E-C., Hyder, S.M.Z., Chowdhury, A.M.R., Chowdhury, S.A., Lonnerdal, B.,
Habicht, J-P., and Persson, A.K. 2002. “Efficacy and trial effectiveness of weekly and
daily iron supplementation among pregnant women in rural Bangladesh: disentangling
the issues”. Am J Clin Nutr, 76(6): 1392-1400.
FAO/WHO. 2002. “Human Vitamin and Mineral Requirements”. Food and Nutrition
Division. Rome: FAO.
FAO/WHO/UNU. 1985. “Energy and Protein Requirements”. WHO Technical Report
Series. No. 274. Geneva: World Health Organization.
Gibson, R.A. 2005. "Principals of Nutritional Assessment. 2nd Edition" Oxford
University Press, NY.
Gonzalez-Cossio, T., Habicht, J-P., Rasmussen, K., and Delgado, H.L. 1998. “Impact of
Food Supplementation during Lactation on Infant Breast-Milk Intake and on the
Proportion of Infants Exclusively Breast-Fed”. Journal of Nutrition, 128(10): 1692-1702.
Grantham-McGregor, S., Fernald, L., Sethuraman, K. 1999. "Effects of health and
nutrition on cognitive and behavioural development in children in the first three years of
life: Part 1. Low birth weight, breastfeeding and protein-energy-malnutrition; Part 2.
Infections and micronutrient deficiencies: Iodine, iron and zinc”. Food Nutr Bull, 20 (1):
53-75 and 79-99.
Habicht, J-P. and Butz, W. P. 1979. “Measurement of health and nutrition effects of
large-scale nutrition intervention projects”. In: R. E. Klein, et al. (eds), Evaluating the
Impact of Nutrition and Health Programs, Plenum Publ. Corp., New York, pp. 133-
182.
Habicht, J.P., Victora, C.G., Vaughan, J.P. 1999. "Evaluation Designs for Adequacy,
Plausibility and Probability for Public Health Programme Performance and Impact." Int J
Epi, 28: 10-18.
Habicht, J-P., DaVanzo, J. and Butz, W. P. 1988. “Mother's milk and sewage: Their
interactive effects on infant mortality”. Pediatrics, 81 (3): 456-461.
Habicht, J-P. and Martorell, R. 1993. Objectives, research design, and implementation of
the INCAP longitudinal study. Food and Nutrition Bulletin, 14 (3): 176-190.
55
Heckman, J.,Smith, J.A. 1995. Assessing the case for social experiments. Journal of
Economic Perspectives, 9 (2):85-110.
Hoddinott, J. 2002. “Measuring dietary diversity: a guide. Food and Technical Assistance
Project”. (FANTA) Washington DC.
Institute of Medicine. 2000. “Dietary Reference Intakes: Applications in Dietary
Assessments”. Washington DC: National Academic Press.
Jalal, F., Nesheim, M.D., Agus, Z., Sanjur, D., and Habicht, J-P. 1998. “Serum retinol
concentrations in children are affected by food sources of b-carotene, fat intake, and
anthelmintic drug treatment”. American Journal of Clinical Nutrition, 68: 623-629.
Judge, G.G., Griffiths, W.E., Hill, R.C., Tsoung-Chou, L. 1980. “The Theory and
Practice of Econometrics”. Wiley Series in Probability and Mathematical Statistics,
Wiley and Sons, NY.
Kramer, M.S, Guo T, Platt RW, Sevkovskaya Z, Dzikovich I, Collet J-P, Shapiro S,
Chalmers B, Hodnett E, Vanilovich I, Mezen I, Ducret T, Shisko G, Bogdanovich N.
2003. “Infant growth and health outcomes associated with 3 compared with 6 mo of
exclusive breastfeeding”. Am J Clin Nutr 78:291-95.
Leeuw, F.L. 2003. “Reconstructing program theories: methods available and problems to
be solved”. Amer. J. Evaluation 24(1):5-20.
Loechl, C., Pelto, G., Ruel, M.T., Menon, P. 2004. “An operations evaluation of World
Vision’s integrated health and nutrition program in Central Plateau, Haiti”. Final Report
submitted to the Food and Nutrition Technical Assistance Project, Academy for
Educational Development. Washington, D.C.
Lutter, C. K., Habicht, J-P., Rivera, J. A. and Martorell, R. 1992. “The relationship
between energy intake and diarrheal disease in their effects on child growth: Biological
model, evidence, and implications for public health policy”. Food and Nutrition Bulletin,
14 (1): 36-42.
Maluccio, J.A., J. Hoddinott, Behrman, J.R., R. Martorell, A. Quisumbing, and. A.D.
Stein. 2005. “The impact of experimental nutritional interventions on education into
adulthood in rural Guatemala”. Food Consumption and Nutrition Division, IFPRI,
Washington D.C.
Martorell, R. and Habicht, J-P. 1986. “Growth in Early Childhood in Developing
Countries”. In: F. Falkner and J. M. Tanner (eds.), Human Growth: A Comprehensive
Treatise. Second Edition, Volume 3, Methodology: Ecological, Genetic and Nutritional
Effects on Growth, Plenum Press, New York, pp. 241-262.

56
Mason, J. and Habicht, J-P. 1984. “Stages in the Evaluation of Ongoing Programmes”.
In: D. E. Sahn, R. Lockwood and N. S. Scrimshaw (eds.) , Methods for the Evaluation of
the Impact of Food and Nutrition Programmes, The United Nations University, Tokyo,
Japan, 26-45.
McCloskey D.N. 1998. “The Rhetoric of Economics”. Second Edition. Madison:
University of Wisconsin Press.
McLaren D.S, editor. 1976. “Nutrition in the community”. London and New York:
Wiley.
Menon, P., Ruel, M.T., Loechl, C.U., Arimond, M., Habicht, J-P., Pelto, G. 2006.
“Micronutrient Sprinkles are effective at reducing anemia among children 6-24 months in
rural Haiti”. FASEB Journal. American Society for Nutrition. Abstract #375.2.
Menon, P, Loechl, C, Pelto, GH, Ruel, M. 2002. “Development of a Behavior Change
Communications Program to Prevent Malnutrition in the Central Plateau of Haiti: Results
and Challenges from a Formative Research Study”. A report submitted to the Food and
Nutrition Technical Assistance Project, Academy for Educational Development,
Washington, D.C.
Murray. D.M. 1998. “Design and Analysis of Group- Randomized Trials”. Oxford and
New York: Oxford University Press.
Nitsch, D., Molokhia, M., Smeeth,L., Destavola B.L., Whittaker JC, Leon DA. 2006.
“Limit to causal inference based on Mendelian randomization: A comparison to
randomized controlled trials”. American Journal of Epidemiology 163(5): 397-403.
Pelletier, D. L., Frongillo, Jr., E. A. and Habicht, J-P. 1993. “Epidemiologic evidence for
a potentiating effect of malnutrition on child mortality”. American Journal of Public
Health, 83(8): 1130-1133.
Penny, M.E., Creed-Kanashiro, H. C., Robert, R.C., Narro, M.R., Caulfield, L.E., Black,
R.E. 2005. "Effectiveness of an Educational Intervention Delivered Through the Health
Services to Improve Nutrition in Young Children: A Cluster-Randomized Controlled
Trial" Lancet, 365, May.
Ravallion, M. 2005 "Evaluating Anti-Poverty Programs." Development Research Group,
World Bank. In "Handbook of Agricultural Economics, Vol. 4" Eds. R.E. Evenson, P.
Schultz.
Reed, B.A., Habicht, J-P. and Niameogo, C. 1996.” The effects of maternal education on
child nutritional status depend on socio-environmental conditions”. International Journal
of Epidemiology, 25(3): 585-592.

57
Rothman, K.J., Geenland, S. 1998. Modern Epidemiology. Second Edition. Philadelphia:
Lippencott-Raven.
Rivera, J. A., Habicht, J-P. and Robson, D. S. 1991. “Effect of supplementary feeding
upon recovery from mild-to-moderate wasting in preschool children”. American Journal
of Clinical Nutrition, 54: 62-68.
Rivera, J.A., Sotres-Alvarez, D., Habicht, J.P., Shamah, T., Villalpando, S. 2004. “Impact
of the Mexican Program for Education, Health and Nutrition (PROGRESA) on Rates of
Growth and Anemia in Infants and Young Children: A Randomized Effectiveness Study”
JAMA, June 2, 291.
Ruel, M. T., Pelletier, D. L., Habicht, J-P., Mason, J. B., Chobokoane, C. S. and
Maruping, A. P. 1990. “Comparison of mothers' understanding of two child growth
charts in Lesotho”. Bulletin of the World Health Organization, 68 (4): 483-491.
Ruel, M. T., Habicht, J-P. and Olson, C. 1992. “Impact of a clinic-based growth
monitoring programme on maternal nutrition knowledge in Lesotho”. International
Journal of Epidemiology, 1992, 21(1): 59-65.
Ruel, M. 2003. “Operationalizing dietary diversity: a review of measurement issues and
research priorities”. Journal of Nutrition. Supplement: Animal source foods to improve
micronutrient nutrition and human function in developing countries: 3911S-3926S.
Rossi, P.H., Freeman, H.E., Lipsey, M.W. 1999. “Evaluation: a Systematic Approach”.
Sixth Edition Thousand Oaks and London: Sage Publications.
Savidoff, W.D, Levine, R., Birdsall, N. 2006 (in preparation). “When will we ever learn?
Recommendations to improve social development through enhanced impact evaluation”.
Washington DC, Center for Global Development.
Shen, T., Habicht, J-P. and Chang, Y. 1996. “Effect of economic reforms on child growth
in urban and rural areas of China”. The New England Journal of Medicine, 335: 400-406.
Sommer, A, West, K.P. 1996. “Vitamin A Deficiency”. Oxford: Oxford University Press.
Stoltzfus, R.J. 1997. “Rethinking anaemia surveillance”. The Lancet, 349,
Issue 9067:1764-1766.
USDA. 2006. National Nutrient Database for Standard Reference. Release 18 at
<www.nal.usda.gov/fnic/foodcomp/Data/> accessed March 21, 2006.
Victora, C.G., Habicht, J.P., Bryce, J. 2004. "Evidenced Based Public Health: Moving
Beyond Clinical Trials." Am J Pub Hlth, 94(3), March: 400-404.
58
WHO. 1995. "Physical Status: The Use and Interpretation of Anthropometry." Report of
a WHO Expert Committee. WHO Technical Series Report #854, World Health
Organization ,Geneva, Switzerland.
WHO. 1998. “Complementary feeding of young children in developing countries: A
review of current scientific knowledge”. World Health Organization, Geneva,
Switzerland: WHO.
Zlotkin, S., Arthur, P., Antwi, K.Y., Yeung, G. 2001. “Treatment of anemia with
microencapsulated ferrous fumarate plus ascorbic acid supplied as sprinkles to
complementary (weaning) foods”. Am J Clin Nutr 74:791-795.
59
Appendix A. Examples of characteristics, indicators and other features of nutrition intervention impact evaluation reports
The tables in this appendix are keyed to the bibliography of evaluations that were
gathered for this report. The numbers in the columns labeled "relevant studies" refer to
the report number in the bibliography. The bibliography is presented alphabetically, and
the reference number can be found at the end of the entry in parentheses. For example,
the first entry in the bibliography is: Aguayo V.M., Baker S.K., Crespin X., Hamani H.
“Maintaining high Vitamin A Supplementation Coverage in Children. Lessons from
Niger” HKI-Africa, Nutrition in Development Series, Issue 5, Nov. 2003(55). The
reference number for this item is 55.
To illustrate: if you are interested in evaluations of interventions that involved iron, go to
Table 1 to the section on micro-nutrients. The row labeled "iron” has references to 3
studies, and a 4th study is listed further down in the table, in the section on food
fortification, in the row labeled iron. If you are interested in studies that used hemoglobin
(a measure of iron status), go to Table 4 to the section on biochemical indicators, and you
will find reference numbers for 10 studies that evaluated hemoglobin as an impact
indicator.
Items that appear in the tables in the text but that do not appear in the tables in the
appendix are items for which we found no reference to their use in the reports we
reviewed.

60
Table 1. Types of Interventions
Intervention Type Relevant Studies
Supplementation
1) Micronutrient-Based
Vitamin A 46,55,40,47,56,26,28,25,23,15,11,16a,
51b,53
42,36.
Iron 51b, 53, 16b
Vitamin C 53 w/Fe
Iodine 51c, 30, 31,21
Multiple Micro-nutrient 43
2) Food-Based
Formulated and Special Food Preparations 74, 62, 38
Donated Foods School feeding 61, 62, 63, 41
Nutrient Rich Food 65, 77,4,22
Staple Foods 1,60,6
Food-for-Work 1,7
Fortification
Iron 29
Iodine 46, 31, 21, 20, 16c,51c,43
Vitamins 29, 12
Multiple Micro-nutrients 74 (Fe, Zn, Cu) 29
Nutrition Education
Information about Breastfeeding 77
Information about Complementary Feeding 77
Information about Pregnancy 77
Information about Family Diets 10 (child feeding),22
Information about Micronutrient and Food- Based
Supplements
55,23
Other information 39 (farming)
Home/Community-Based Horticulture
Home Gardens 39, 23,37, 24
Livestock/Animal Husbandry 23, 24, 18
Interventions to Reduce the Price of Food
Food Vouchers 1,7
Conditional Cash Transfer 2,3,5,8
Integrated Nutrition Programs 77,67,69,78, 32
NCDDP 68
Anti-helminth 76, 10, 9

61
Table 2. Types of Beneficiaries Targeted by Nutrition Interventions and
Assessment of Utilization by Those Expected to Benefit Biologically
Type of Beneficiary Relevant studies Relevant studies
that assessed
utilization
Breastfeeding &
complementary Feeding
22 22
Children Under 5 Years of
Age
67,31,73,39,68,55,40,25,11,10,24,13,38,60,53,47,65
56,2,3,5,7,26,28,15,12,9,18,31,69,1,23,14,16,72,74,8
4,6,22,36,77, 33, 22, 78
68,28,14,37,9,47,
10,39,7,3,12,65,26
22,36,55
Children 5-12 Years of Age
61,62,63,41,46,73,51,21,20,76,7,8,24,16,14,2(teens),29
76, 30
14,41,7,2,46,76
Pregnant Women
72,73,74,31,69,5,8,23,16,22,51b,46,55, 32, 22, 78 22,51b,55,78
Lactating or Postpartum
Women
73,69,5,8,23,32,12,16,22,46,78 12,22,78
Women of Reproductive Age
15,14,18,13,37, 32 14,37
Other Household Members
3,14,32 14
Households
46,73,1,2,39,3,5,37,13,16,7,51c, 78 46,37,3,51c,78
Communities
46,21
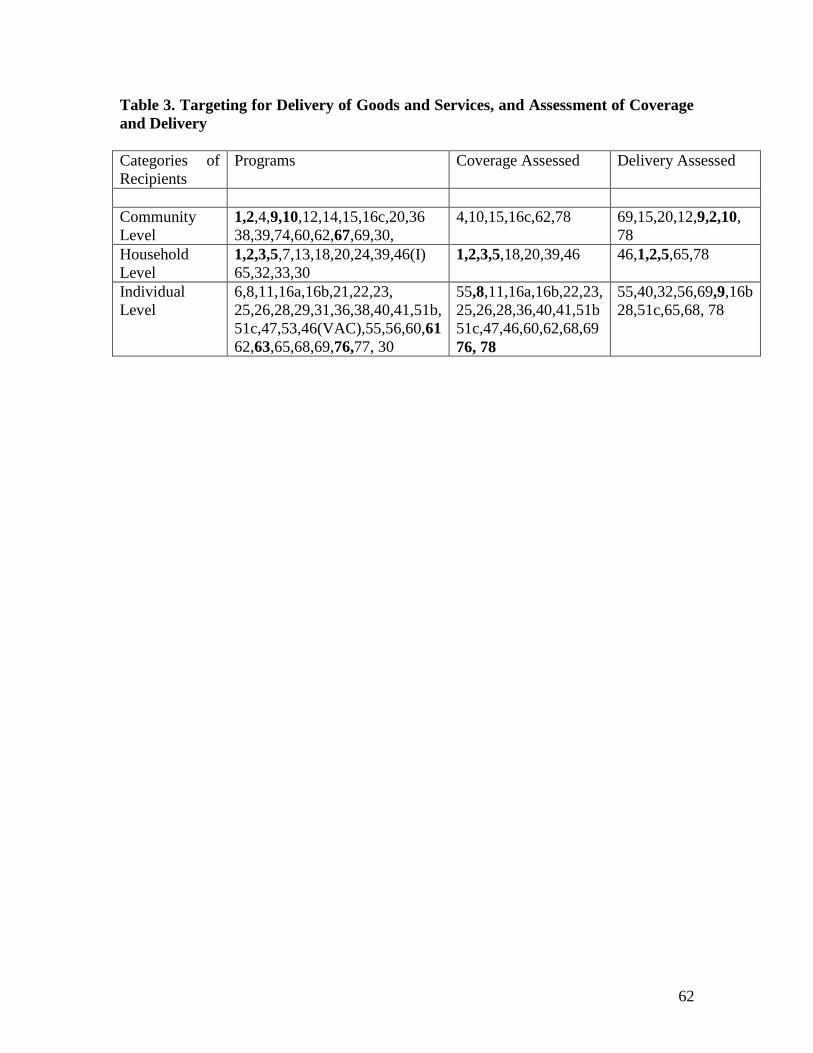
62
Table 3. Targeting for Delivery of Goods and Services, and Assessment of Coverage
and Delivery
Categories of
Recipients
Programs Coverage Assessed Delivery Assessed
Community
Level
1,2,4,9,10,12,14,15,16c,20,36
38,39,74,60,62,67,69,30,
4,10,15,16c,62,78 69,15,20,12,9,2,10,
78
Household
Level
1,2,3,5,7,13,18,20,24,39,46(I)
65,32,33,30
1,2,3,5,18,20,39,46 46,1,2,5,65,78
Individual
Level
6,8,11,16a,16b,21,22,23,
25,26,28,29,31,36,38,40,41,51b,
51c,47,53,46(VAC),55,56,60,61
62,63,65,68,69,76,77, 30
55,8,11,16a,16b,22,23,
25,26,28,36,40,41,51b
51c,47,46,60,62,68,69
76, 78
55,40,32,56,69,9,16b
28,51c,65,68, 78

63
Table 4. Indicators of Micro-nutrient and Macro-nutrient Status
Indicator Relevant studies
Health Outcomes
Pregnancy outcomes
Low birth weight 31, 78
Morbidity Indicators
Self-reported 68,67,3,25
Clinic Records 68,3
Other
Mortality Rates 68,56,15
Growth and Body
Composition
Weight/Age 7,4,31,60,63a,38,65,67,69,2,7,26,25,14,10,24,9,
22
Height/Age 73,74,31,65,76,67,1,2,7,26,25,14,24, 78, 33
Weight/Height (BMI) 31,67,2,24, 33
Middle upper arm
circumference
31b,67
Skinfold thickness 74
Biochemical and
Clinical Outcomes
Vitamin A
Serum retinol (SR) 46,26,28,25,15,24,16a,12
Plasma Retinol 47
Modified Retinol Dose
Response (MRDR)
25,12
Breastmilk retinol 16a
Bitot’s spots 39,46,25,23
Conjunctival Xerosis 23
Xerophalmia 23,16a, 36
Corneal lesions 46,25,23
Iodine
Urinary iodine (UI) 46,21,20,16b, 30
Thyroid hormone 21
Goiter size or volume 46,51b,21, 30, 20
Iron
Unspecified "anemia"
assessment
16b, 13
Hemoglobin (Hb) 73,74,62,76,29,53,2,26,14,24
Serum ferritin 72,74,76,29,26,14,24
Hair zinc 72,74
Other outcomes 21 (TSH), 76
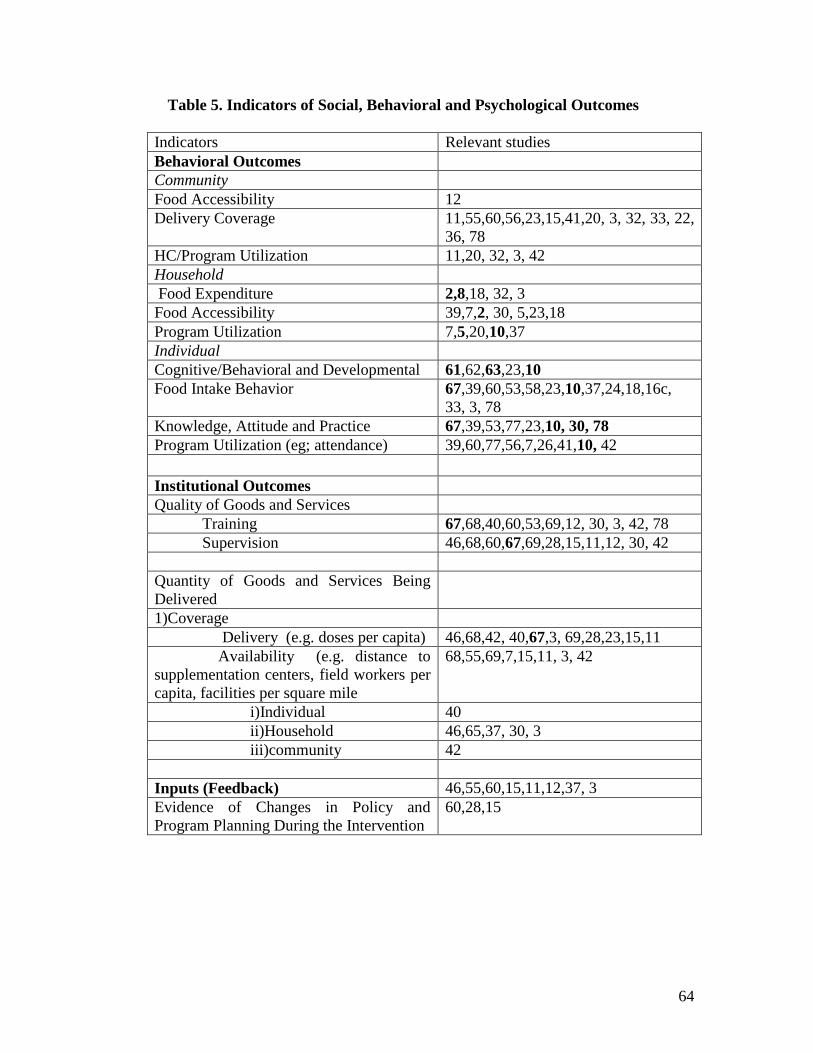
64
Table 5. Indicators of Social, Behavioral and Psychological Outcomes
Indicators Relevant studies
Behavioral Outcomes
Community
Food Accessibility 12
Delivery Coverage 11,55,60,56,23,15,41,20, 3, 32, 33, 22,
36, 78
HC/Program Utilization 11,20, 32, 3, 42
Household
Food Expenditure 2,8,18, 32, 3
Food Accessibility 39,7,2, 30, 5,23,18
Program Utilization 7,5,20,10,37
Individual
Cognitive/Behavioral and Developmental 61,62,63,23,10
Food Intake Behavior 67,39,60,53,58,23,10,37,24,18,16c,
33, 3, 78
Knowledge, Attitude and Practice 67,39,53,77,23,10, 30, 78
Program Utilization (eg; attendance) 39,60,77,56,7,26,41,10, 42
Institutional Outcomes
Quality of Goods and Services
Training 67,68,40,60,53,69,12, 30, 3, 42, 78
Supervision 46,68,60,67,69,28,15,11,12, 30, 42
Quantity of Goods and Services Being
Delivered
1)Coverage
Delivery (e.g. doses per capita) 46,68,42, 40,67,3, 69,28,23,15,11
Availability (e.g. distance to
supplementation centers, field workers per
capita, facilities per square mile
68,55,69,7,15,11, 3, 42
i)Individual 40
ii)Household 46,65,37, 30, 3
iii)community 42
Inputs (Feedback) 46,55,60,15,11,12,37, 3
Evidence of Changes in Policy and
Program Planning During the Intervention
60,28,15

65
Table 6. Types of Research Designs Used in Evaluations of Nutrition Intervention
Programs
Types of Designs Relevant
Probability Studies
Relevant Plausibility
Studies
Relevant adequacy
studies
Randomized
Controlled Trials
With Blinding 63b, 36
Without blinding 73,2,3,5,8,10,24
Blinding not
specified
1, 61,62, 63a, 32,
17, 76,67,9
Intervention Trials
without
randomization
Control/Baseline 26,19,36,47,77,57
Control/No Baseline 37, 65b 29
No Control/Baseline 7,18,16, 20,29,74 21,38,53
46i, 23,15,39
11,14
No Control/No
Baseline
72,6 74
With Blinding None are blinded
Cohort Study
Closed Prospective 65,26,60 53
Open Dynamic 68,40 29
Cross
Sectional/Prevalence
31,40,56, 7,28,25,
37
22, 72, 46a, 30, 78,
33
21,47, 69
23,41,20
13, 55,12,51, 22
Case Control 24

66
Table 7 Controlling for non-nutritional components of the intervention and for
confounding
Strategies to improve plausibility Relevant studies
Attempts to make comparison groups
similar initially
67,61,63ab,1,65,76,67,3,8,1,41,12,10,24,9,
30, 32, 33, 36, 78, 33
Blinding or other control for knowledge 63b interviewer, 36
Statistical control for initial confounding 72,31,68,63ab,40,65,76,67,69,1,7,3,26, 32
Design control for initial confounding 72,67,74,61,68,63ab,38,67,56,69,3, 30, 32,
33, 36, 78
Expected response in those with a potential
to benefit
67,73,61,63ab, 3, 32, 33,
21,40,38,56,69,1,2,26,20,12, 30
Dose response 73,31,76,26, 36
Table 8. Linking the delivery of the intervention to its utilization
by the beneficiary who can benefit biologically: relevant studies
Delivered to whom Links examined Utilized by whom
46,60,55,65,47,56,11
30, 3, 32, 42, 22
46,55,65,60,47,56,11
30, 3, 42, 22, 32
46,55,65,60,47,56,11
30, 3, 42, 22, 32

67
Table 9. Sources of Data for Nutrition Evaluations
Source of Data Relevant studies
Survey Data:
“General Purpose” Survey Data
(e.g.NHAINES, MICS)
31,68,55,46,47,56,1,28,13,16
Special Purpose Survey Data
(eg; CDD, Morbidity, special marketing
surveys)
46,68,56,1,11,41,20,12,14,10, 30
Survey for the evaluation 46,67,61,29,77,5,23,12,10,37,18,9
39,76,53,56,2,8,41,20,14,24, 3
Data Collected within the Program:
Administrative Data 68,11
1)input data
i)supplies 46,39,68,40,65,56,69,23,14,37,30,3,42,78
ii)training 67,39,40,60,69,23,14,37,30,3,42,78
iii)distribution 68,40,65,60,56,37,23,30,3,42
2)output (beneficiary) data
i)delivery/coverage 46,39,68,40,65,37,56,69,1,3,5,26,23,11,41
30,3,32,22,42
ii)growth and health status 39,74,63ab,21,40,38,22,78,33,65,60,53,56,
69,1,3,26,23,30,3,32
Specialized data collected within
program being evaluated
61,21,22,78,60,56,23
C) Data collected in other programs:
Administrative Data (hospitalization
data, health facility
2)output (beneficiary) data
i)delivery/coverage 31,56,3
ii)growth and health status 74,31,56,69,23
Table 10. Evaluations mentioning ethical considerations
Type of Ethical Consideration Mentioned Relevant studies
Received approval from appropriate human
protection review board(s)
72,74,21,65,76,26
Explicitly addresses the principles of:
Autonomy 39,74,65,26
Non-malfeasance 67,76
Beneficence 46,67,76,5,25,36
Justice 2

68
Appendix B. Impact Evaluation Reports Compiled for this Report
The references are given in alphabetic order. The coding key is in parenthesis at end of
citation.
Aguayo, V.M., Baker, S.K., Crespin, X., Hamani H. 2003. “Maintaining high Vitamin A
Supplementation Coverage in Children. Lessons from Niger”. HKI-Africa, Nutrition in
Development Series, Issue 5, Nov.(55)
Alderman, H., Seubuliba, I., Konde-Lule, J., Hall A. 2004. “Uganda: Increased Weight
Gain with Mass Deworming Given During Child Health Days in Uganda”. World Bank.
(9)
Alderman, H., Britto, B., Siddiqi, A. 2004. “Uganda: Longitudinal Evaluation of Uganda
Nutrition and Early Child Development Program”. World Bank, Feb. (10)
Attanasio, O.P., Vera-Hernandez, M. 2004. “Medium and Long Run Effects of Nutrition
and Child Care: Evaluation of a Community Nursery Program in Rural Colombia”. IFS,
Nov. (4)
Ayele, Z., Peacock, C. 2003. “Improving Access to and Consumption of Animal Source
Foods in Rural Households; The Experiences of a Woman Focused Goat Development
Program in the Highlands of Ethiopia”. J.Nutr. 133: 3981s-3986s (18)
Behrman, J.R., Hoddinott, J. 2001. “An Evaluation of the Impact of PROGRESA on
Preschool Child Height”. Food Consumption and Nutrition Division, IFPRI, March (68)
Bijlsma, M., McClean, D. 1997. “Assessment of a Take home Child Supplementary
Feeding Program in a High Density Suburb of Mutare City, Zimbabwe”. Cent Afr J of
Med, 43, (1) (38)
Bloem, M.W., Hye, A., Wijnroks, M., Ralte, A., West, K.P., Sommer, A. 1995. “The
Role of Universal Distribution of Vitamin A Capsules in Combatting Vitamin A
Deficiency in Bangladesh”. Am. J. Epi. 142;, 843-55(40)
Chitekwe, S. 2000. “Report on the Evaluation of Child Supplementary Feeding Program
Implemented From October 1999 to June 2000 in Three Districts in Zimbabwe”. APO,
Nutrition; UNICEF, Harare, Zimbabwe (60)
David, P. 2003. "Evaluating the Vitamin A Supplementation Programme in Northern
Ghana: Has it Contributed to Improved Child Survival?". Micronutrient Initiative, (56)
Directorate of Health Services, Royal Government of Bhutan. 1996. “Tracking Progress
Towards Sustainable Elimination of Iodine Deficiency Disorders in Bhutan”. ICCIDD,
UNICEF, WHO, MI, Aug (30)

69
Egbuta, J., Onyezili, F., Vanormelingen ,K. 2003. “Impact Evaluation of Efforts to
Eliminate Iodine Deficiency Dissorders in Nigeria”. Pub Hlth Nutr, 6(2):169-173 (20)
Gertler, P. 2000. “Final Report: the Impact of PROGRESA on Health”. Food
Consumption and Nutrition Division, IFPRI, Nov. (3)
Graham-McGregor, S.M., Chang, S., Walker, S.P. 1998. “Evaluation of School Feeding
Programs: Some Jamaican Examples”. Am J Clin Nutr, 67s:785s-789s (61)
Guilliford, M.C., Mahabir, D., Rocke, B., Chinn, S., Rona, R.J. 2002. “Free School Meals
and Children’s Social and Nutritional Status in Trinidad and Tobago”. Pub Hlth Nutr,
5(5): 625-630(41)
Helen Keller International. 2000. "Evaluating the Impact of the Indonesian
Complementary Food Initiative (CFI) on Reducing early Childhood Malnutrition: Final
Report". December(57)
Hendricks, M.K., le Roux, M., Fernandes, M., Irlam, J. 2003. “Evaluation of a Nutrition
Supplementation Program in the Northern Cape Province of South Africa”. Pub Hlth
Nutr 6(5): 431-437(22)
Hoddinott, J., Skoufias, E. 2003. The Impact of PROGRESA on Food Consumption.
Food Consumption and Nutrition Division, May (5)
Hop, L.T. 2003. “Programs to Improve Production and Consumption of Animal Source
Foods and Malnutrition in Vietnam”. J. Nutr. 133:4006s-4009s (13)
Houston, R. 2003. “Why They Work: An Analysis of Three Successful Public Health
Interventions: Vitamin A supplementation Programs in Ghana, Nepal and Zambia”
USAID-MOST, Jan. (11)
Jacoby, E.R., Cueto, S., Pollitt, E. 1998. “When Science and Politics Listen to Each
Other: Good Prospects From a New School Breakfast Program”. Am J Clin Nutr, 67s:
795-797(62)
Klemm, R.D.W., Villate, E.E., Tuazon-Lopez, C., Ramos, A.C. 1996. “Coverage and
Impact of Adding Vitamin A Capsules (VAC) Distribution to Annnual National
Immunization Day in the Philippines”. Helen Keller International, Manilla , Philippines
June.(36)
Layrisse, M., Garcia-Casal, M.N., Mendez-Castallano, H., Jimenez, M., et.al. 2002.
“Impact of Fortification of Flours with Iron to Reduce the Prevalence of Anemia and Iron
Deficiency Among Schoolchildren in Caracas, Venezuela: A Follow-Up”. Fd Nutr
Bull.23,(4) (29)

70
Layrisse, M., Chaves, J.F., Mendez-Castallano, H., Bosch, V., et. al. 1996. “Early
Response to the Effect of Iron Fortification in the Venezuelan Population” Am J Clin
Nutr, 64:903-907(14)
Maluccio,J.A., Flores, R. 2004. “Impact Evaluation of a Conditional Cash Transfer
Program: The Nicaraguan Red de Proteccion Social”. Food Consumption and Nutrition
Division, IFPRI July (2)
Maluccio, J.A.,Marsh D.R., Pachon, H., Schroeder, D.G., Ha, T.T., et al. 2002. “Design
of a Prospective Randomized Evaluation of an Integrated Nutrition Program in Rural
Vietnam”. Fd Nutr Bull, 23,(4) (67)
Mason, J.B., Deitchler, M., Gilman, A., Gillenwater, K., et al. 2002. “Iodine Fortification
is Related to Increased Weight for Age and Birthweight in Children in Asia” Fd Nutr
Bull, vol.23, no.3 (31)
Moench-Pfanner, R., de Pee, S., Bloem, M.W., Foote, D., Kosen, S., Webb, P. 2005.
"Food for Work Programs in Indonesia had a Limited Effect on Anemia" J Nutr. 135:
1423-1429. (79)
Mora, J.O., Bonilla, J. 2002. “Successful Vitamin A Supplementation in Nicaragua”
USAID-MOST, Sight and Life Newsletter 3. (15)
Naphayvong, S., Vongvichit, P., Deitchler, M., Knowles, J. 2001. “Programs for
Micronutrient Deficiency Control in the Laos People’s Democratic Republic”. FNRI,
IUNS-INF, “Successful Micronutrient Programs”, Vienna. (46)
Nguyen, C.K., Ha, H.K,. Tu, G., Nguyen, T.N., et al. 2002. “Control of Vitamin A
Deficiency in Vietnam: Achievements and Future Orientation” Fd Nutr. Bull, 23,(2)(23)
Ninh, N.X., Khan,,N.C., Vinh, N.D., Khoi, H.H. 2001. “Micronutrient Deficiency
Control Strategies in Vietnam” FNRI, IUNS-INF, “Successful Micronutrient Programs”
Vienna (16)
Olinto, P., Flores, R., Morris, S., Veiga, A. 2003. “The Impact of Bolsa Alimentacao
Program on Food Consumption”. Preliminary Report, IFPRI July. (8)
Pachon, H., Schroeder, D.G., Marsh, D., Dearden, K.A., Ha, T.T., Lang, T.T. 2002.
"Effect of an Integrated Child Nutrition Intervention on the Complementary Food Intake
of Young Children in Rural North VietNam". Fd Nutr Bull, 23(4)s: 59-75. (67)
Pangaribuan, R., Erhardt, J.G., Scherbaum, V. 2003. “Vitamin A Capsule Distribution to
Control Vitamin A Deficiency in Indonesia: Effect of Supplementation in Pre-school
Children and Compliance with the Programme”. Public Health Nutrition 6(2): 209-
216(26)

71
Pedro, M.R.A., Cheong, R.L., Madriaga, J.R., Barba, C.V.C. 2001. “Indicative Impact,
Policy and Program Implications of the Philippines Vitamin A Supplementation
Program”. FNRI, IUNS-INF, “Successful Micronutrient Programs” Vienna (28)
Quisumbing, A. 2003. “Food Aid and Child Nutrition in Rural Ethiopia”. Food
Consumption and Nutrition Division, International Food Policy Research institute
(IFPRI), Wash. D.C., Sept. (7)
Rivera, J.A., Sotres-Alvarez, D., Habicht, J.P., Shamah, T., Villalpando, S. 2004 “Impact
of the Mexican Program for Education, Health and Nutrition (PROGRESA) on Rates of
Growth and Anemia in Infants and Young Children: A Randomized Effectiveness Study”
JAMA, June 2, 291, (21).(47)
Salarkia, N., Hedayati, M., Mirmiran, P., Kimiagar, M., Azizi, F. 2003. “Evaluation of
the Impact of an Iodine Supplementation Programme in Severely Iodine Deficient School
Children with Hypothyroidism” Pub.Hlth Nutr. 6(6): 529-533 (21)
Santos, I.S., Gigante, D.P., Coitinho, D.C., Haisma, H., Valente ,G. 2005. “Evaluation of
the Impact of a Nutritional Program for Undernourished Children in Brazil”. Cad Suade
Publica, 21(3):776-785, May-June (65)
Schroeder, D.G., Pachon, H., Dearden, K.A., Ha, T.T., Lang, T.T., Marsh, D. 2002. "An
Integrated Child Nutrition Intervention Improved Growth of Younger, More
Malnourished Children in Nothern VietNam". Fd Nutr Bull.,23(4)s:50-58 (67)
Serlemitsos, J.A., Fusco, H. 2001. “Vitamin A Fortification of Sugar in Zambia 1998-
2001”. USAID-MOST, Aug.(12)
Schemann, J.F., Banou, A., Malvy, D., Guindo, A., Traore, L., Momo, G. 2003.
“National Immunisation Days and Vitamin A Distribution in Mali: Has the Vitamin A
Status of Pre-school Children Improved?” Pub Hlth Nutr 6(3), 233-240 (25)
Schipani, S., van der Haar, F., Sinawat, S., Maleevong, K. 2002. “Dietary Intake and
Nutritional Status of Young Children in Families Practicing Mixed Home Gardening in
Northeast Thailand”. Fd Nutr Bull, 23,(2). (24)
Stolzfus, R., Albonico, M., Chwaya, H.M., Tielsch, J.M., Schulze, K.J. 1998. “Effects of
the Zanzibar School Based Deworming Program on Iron Status of Children”. Am J Clin
Nutr, 68; 179-186 (76)
Talukder, A., Kiess, L., Huq, N., De Pee, S., Darnton-Hill, I., et. al. 2000. “Increasing the
Production and Consumption of Vitamin A Rich Fruits and Vegetables: Lessons Learned
in Taking the Bangladesh Homestead Gardening Program to a National Scale”. Fd Nutr
Bull, 21,(2):165-172 (37)

72
Torrejon, C.S., Castillo-Duran, C., Hertrampf, E.D., et al. 2004. “Zinc and Iron Nutrition
in Chilean Children Fed Fortified Milk Provided by the Complementary National Food
Program”. Nutri. 20: 177-180. (74)
Tudawe,I., Gamage, D., de Mel, S., et al. 1999. “The Mid-Term Evaluation of the
Participatory Nutrition Improvement Project”. H.Kobbekaduwa Agrarian Research and
Training Institute, Colombo, Sri Lanka (66)
UNICEF. 1999. “Final Report: South Asia Regional Evaluation of Progress Towards
Universal Salt Iodization, 1993-1998”. May (56)
UNICEF/Association of Pediatricians in the Federation of Bosnia and Herzegovina.
2000. “Intervention Program for the Prevention of Nutritive Anemia Among Children
Aged 0-6 in the Federation of Bosnia and Herzegovina”, Sarajevo. (53)
USAID – MOST. 2004. "Report on a Rapid Assessment of Vitamin A Supplementation
to Young Children and Postpartum Women in Mainland Tanzania". Helen Keller
International, July (42).
Vijayaraghavan, K., Nayak, M.U., Bamji, M.S., Ramana, G.N.V., Reddy, V. 1997.
“Home Gardening for Combatting Vitamin A Deficiency in Rural India” Fd Nutr Bull,
18, (4) (39)
Winichagoon, P., Yhoung-aree, J., Pongchareon, T. 2001. “The Current Situation and
Status of Micronutrient Policies and Programs in Thailand”, FNRI, IUNS-INF,
“Successful Micornutrient Programs” Vienna (51)
Yamano T, Alderman H, Christiaensen L. 2003. “Child Growth, Shocks and Food Aid in
Rural Ethiopia”. Foundation for Advanced Studies on International Development, Japan,
Feb.(1)

73
Appendix C. CONSORT Checklist for reporting a randomized control trial
From www.consort-statement.org
March 12, 2006
CONSORT Checklist of items to include when reporting a randomized trial
PAPER SECTION And topic
Item Description Reported on Page #
TITLE & ABSTRACT 1 How participants were allocated to interventions (e.g., "random allocation", "randomized", or "randomly assigned").
INTRODUCTION Background
2 Scientific background and explanation of rationale.
METHODS Participants
3 Eligibility criteria for participants and the settings and locations where the data were collected.
Interventions 4 Precise details of the interventions intended for each group and how and when they were actually administered.
Objectives 5 Specific objectives and hypotheses.
Outcomes 6 Clearly defined primary and secondary outcome measures and, when applicable, any methods used to enhance the quality of measurements (e.g., multiple observations, training of assessors).
Sample size 7 How sample size was determined and, when applicable, explanation of any interim analyses and stopping rules.
Randomization - Sequence generation
8 Method used to generate the random allocation sequence, including details of any restrictions (e.g., blocking, stratification)
Randomization - Allocation concealment
9 Method used to implement the random allocation sequence (e.g., numbered containers or central telephone), clarifying whether the sequence was concealed until interventions were assigned.
Randomization - Implementation
10 Who generated the allocation sequence, who enrolled participants, and who assigned participants to their groups.
Blinding (masking) 11 Whether or not participants, those administering the interventions, and those assessing the outcomes were blinded to group assignment. When relevant, how the success of blinding was evaluated.
Statistical methods 12 Statistical methods used to compare groups for primary outcome(s); Methods for additional analyses, such as subgroup analyses and adjusted analyses.
RESULTS
Participant flow
13 Flow of participants through each stage (a diagram is strongly recommended). Specifically, for each group report the numbers of participants randomly assigned, receiving intended treatment, completing the study protocol, and analyzed for the primary outcome. Describe protocol deviations from study as planned, together with reasons.
Recruitment 14 Dates defining the periods of recruitment and follow-up.
Baseline data 15 Baseline demographic and clinical characteristics of each group.
Numbers analyzed 16 Number of participants (denominator) in each group included in each analysis and whether the analysis was by "intention-to-treat". State the results in absolute numbers when feasible (e.g., 10/20, not 50%).

74
Outcomes and estimation
17 For each primary and secondary outcome, a summary of results for each group, and the estimated effect size and its precision (e.g., 95% confidence interval).
Ancillary analyses 18 Address multiplicity by reporting any other analyses performed, including subgroup analyses and adjusted analyses, indicating those pre-specified and those exploratory.
Adverse events 19 All important adverse events or side effects in each intervention group.
DISCUSSION Interpretation
20 Interpretation of the results, taking into account study hypotheses, sources of potential bias or imprecision and the dangers associated with multiplicity of analyses and outcomes.
Generalizability 21 Generalizability (external validity) of the trial findings.
Overall evidence 22 General interpretation of the results in the context of current evidence.

75
Appendix D. Standardization of Procedures For The Collection Of Anthropometric Data In The Field4
The procedures described here are aimed at helping a field investigator answer the following questions about the anthropometric data he is in the process of collecting:
(a) How do repeated but independent measurements of the same subject compare in precision? By this criterion, a worker may be truly precise and yet decidedly wrong at the same time - a not uncommon occurrence in other endeavors.
(b) How nearly correct and how accurate are the observers? In other words, how close do they come to the values of an accepted standard? Faced with this problem, the common advice to field workers is to use the average (mean) of measurements made by all observers. In reality, the supervisor and his staff all recognize the value determined by the supervisor as the most reliable. He has the greater experience, he is able to evaluate his own accuracy by standardizing his measurements with those of colleagues with whose measurements he will eventually compare his data. The pragmatic practice of accepting the supervisor's measures as a standard simplifies calculations and the interpretation of results.
(c) Finally, where are the errors being made? Is it just carelessness; is there a consistent error in taking the measurement or is the procedure itself fundamentally at fault?
This standardization procedure provides a prompt return of information, pinpointing errors so that correction may be made before sources of error become fixed. It signals when accomplishment has reached a satisfactory degree. Because observers analyze their own findings, they quickly learn to appreciate the virtue of care. The supervisor learns what features are necessarily stressed to assure precise and accurate measurements and what finesse that adds little, if anything is.
I. Data collection
Ten subjects constitute the usual standardization series. Each observer measures each subject twice in such a way as to avoid being influenced by the first measurement; otherwise agreement is likely to be spuriously good. The results of the initial measurement are noted on an appropriate record form and put aside until the second series of measurements is taken, to be made in the same order as before. Results of a standardization series on heights carried out in 4 year old children are shown in Table 1.
4 From A Guideline for the Measurement of Nutritional Impact of Supplementary
Feeding Programs Aimed at Vulnerable Groups, World Health Organization,
(WHO/FAP/79. 1), Geneva, Nov. 1979, adapted from Habicht, J-P: Estandardizacion
de methodos epidemiologicos cuantitativos sobre el terreno. Boletin de la Oficina
Sanitaria Panamericana, 1974, 76 (5): 375-384

76
II. Calculations (see Tables 2 and 4)
Step 1 - The results of duplicate measurements are entered in the first 2 columns a and b.
Step 2 - In column d the difference of a minus b is entered with its appropriate sign.
Step 3 - In column d2, a - b is squared. Instead of squaring results, the approximate
values of (a - b)2 can be read directly from a table of approximations to squares
(see Table 4) with no loss in satisfactory results. Its use also eases later steps and reduces adding errors because only those digits necessary for later analysis are recorded. Directly adding the d's would also save the squaring step, but it is less sensitive and the results are difficult to interpret.
Step 4 - Pluses and minuses of (a - b) are counted. The sum of the most frequently occurring sign constitutes the number of the numerator of a fraction where the total number of signs is the denominator. Zeros are ignored.
Step 5 - In column s, the sum of a plus b is entered.
These five steps are carried out simultaneously by all observers and the supervisor.
Step 6 - The s column of the supervisor's sheet is transferred to the sheet of each observer under column S.
Step 7 - The difference between the observer's s and the supervisor's S is entered in column (s - S) with the appropriate sign, and squared in column D
2.
Step 8 - Pluses and minuses of (s - S) are counted. The sum of the most frequently occurring sign constitutes the number of the numerator of a fraction where the total number of signs is the denominator. Zeros are ignored.
Step 9 - The sums of d2 and D
2 and the results of the sign counts are transferred to a
single sheet of paper as in Table 3.
III. Evaluation of results (see Table 3)
The following general rules apply in the analysis of results:
(a) The supervisor's d2 will usually be the smallest; his precision will be the greatest
because of his expected greater competence.
(b) Observer's d2 (inversely related to precision)
5 is arbitrarily no more than twice
(this factor f should be smaller than 2.97 for theoretical reasons) the supervisor's d
2.
(c) Observer's D2 (inversely related to accuracy)
6 is arbitrarily no more than thrice
(this factor should be smaller than 2f for theoretical reasons) the supervisor's d2.
5 Precision = ability to repeat the measurement of the same subject with the minimum
variation. Ideally d2 should be equal to zero for both supervisor and observers.
6 Accuracy = ability to obtain a measurement which will duplicate as closely as possible
that of the supervisor. Ideally observer's D2 should be equal to zero.

77
(d) The observer's D2 should be larger than his d
2. The opposite calls for special
scrutiny of the data and recalculation (see discussion of observer F, Table 3).
The first step in the evaluation is to inspect the summary of results as they are presented in Table 3, bearing in mind the 4 rules listed above. When inadequacies have been revealed (for example an observer's d
2 which is more than twice the supervisor's d
2),
the next step is to inspect the "sign" column on the worksheet (Table 2).
In theory there should be as many pluses as minuses and thus no statistically significant sign test. This is ascertained by checking the results under the "sign" column (Table 2) with the numbers given in Table 5 to see if there is any significance.
A significant sign test for the d column (Table 2) indicates a probable difference between the first and second measurements; either the observer tired or the subject changed. The latter event occurs, for example, when a nude toddler urinates unnoticed between first and second weighings. The observer often tires when many children are measured and all first heights are determined before the second measurement begins. Effort and attention tend to wane the second time around and the children may appear to have grown.
A significant sign test for the D column indicates that the performance of the observed differs from that of the supervisor, either in too large values (more pluses than minuses) or too small (more minuses than pluses); the observer has a systematic bias.
In this particular exercise, all the individual worksheets are not printed. We have drawn on the data presented in Tables 1, 2 and 3 to discuss some results.
The supervisor (Table 3) does indeed possess the greatest precision: his d2 is the
smallest. Three staff workers show adequate precision: their d2 is less than twice that of
the supervisor (588). The three other workers do not show adequate precision because their d
2 is more than twice that of the supervisor.
None of the sign tests for d are significant; so systematic differences between the first and second measurements were not to blame (Tables 3 and 5).
Inspection of the raw data (Table 1) reveals that Observer C's precision was not wholly satisfactory due to one poor duplicate. Hopefully this will not recur. Observer D's precision was poor throughout.
One Observer (A) was consistently accurate (D2 less than 882 [Table 3]); all others
were poor (D2s too high). In part, this was because of poor precision (C, D and F), and
in part because of systematic bias, as indicated by sign tests (B, D and E). Observer F's d
2 is larger than his D
2. His performance demands special attention.
Inspection of calculation worksheets (Table 2 or raw data in Table 1) further reveals that Observers D and E were doing something basically wrong; they were systematically measuring more than 7 mm too high. Observer B had the same fault, but to a lesser degree (4 mm).
Observer F's poor accuracy was due to the first four measurements. He did not gain dependable ability until the fourth child examined on the first round; thereafter, his record was satisfactory. These faults explain the discrepancy between his d
2 = 1278 and his
D2 = 1049.

78
Observers learn eventually to interpret their own standardization results and to evaluate calculation worksheets (Table 2) as a means for improved accomplishment. Under "Observations" on Summary Table 3, the supervisor verifies such conclusions by his staff members.
The above analysis can be thus recapitulated as follows:
The summarizing figures d2 and D
2 of observers, when compared to the supervisor's
d2 yield a quick assessment of work performance. If an observer's d
2 is more than
twice or his D2 is more than thrice the supervisor's d
2, individual columns are
examined. A large d2 indicates either careless measuring, fatigue or changes in the
subject over a period of time to be determined by inspection of signs or individual d's.
A large D2 indicates either carelessness, systematic bias (inspection of the signs of the
individual D's), or single differences in qualitative judgment (single large D). Once the nature of the error is identified, correction ordinarily is simple.
TABLE 1: RAW DATA IN A STANDARDIZATION TEST FOR MEASUREMENTS OF HEIGHT OF PRE-SCHOOL CHILDREN(expressed in mm) Child
Supervisor
Observer
No. A B C D E F
a b a b a b a b a b a b a b
1. 828
822 819
826
841
834
833
828
838
825
842
837
836
819
2. 838
846 846
846
842
854
849
856
850
856
861
854
860
845
3. 860
856 863
861
856
865
875
853
882
872
862
858
873
860
4. 862
860 862
850
866
855
854
864
856
869
875
865
874
854
5. 820
820 825
823
827
826
826
822
836
828
826
827
818
827
6. 856
854 857
862
855
860
856
864
862
873
864
860
858
856
7. 823
824 824
825
826
824
827
826
832
825
820
835
818
827
8. 876
876 880
875
877
875
873
878
879
887
884
882
876
874
9. 801
806 810
804
811
810
809
808
811
800
820
815
800
797
10. 853
865 858
852
859
860
857
860
856
856
866
870
852
856
a = First measurement b = Second measurement, independently made after an appropriate interval and recorded
separately.

79
TABLE 2: CALCULATIONS OF A STANDARDIZATION TEST (Data of Observer E in Table 1) Child
a b d d2 s S D D
2
1st
Measure
-
ment
2nd
Measure
-
ment
(a-b)
(a-b)2
Sign
Observe
r
(a+b)
Superviso
r
(a+b)
(s-S)
(s-S)2
Sign
1. 842 837 + 5 25 + 1679 1650 + 29 841 + 2. 861 854 + 7 49 + 1715 1684 + 31 961 + 3. 862 858 + 4 16 + 1720 1716 + 4 16 + 4. 875 865 +10 100 + 1740 1722 +18 324 + 5. 826 827 - 1 1 - 1653 1640 +13 169 + 6. 864 860 + 4 16 + 1724 1710 +14 196 + 7. 820 835 -15 225 - 1655 1647 + 8 64 + 8. 884 882 + 2 4 + 1766 1752 +14 196 + 9. 820 815 + 5 25 + 1635 1607 +28 784 + 10. 866 870 - 4 16 - 1736 1718 +18 324 +
______
_
______
_
______
_
______
_
Sums
+17 477 7/10
+177 3875 10/10
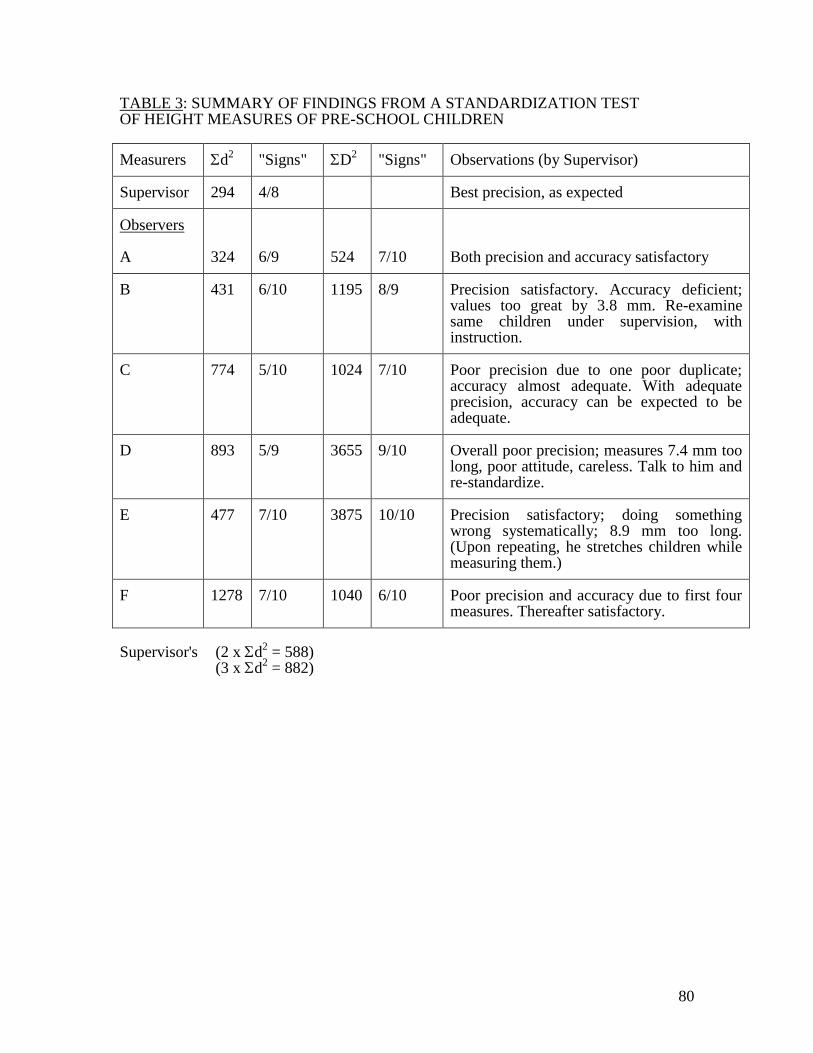
80
TABLE 3: SUMMARY OF FINDINGS FROM A STANDARDIZATION TEST OF HEIGHT MEASURES OF PRE-SCHOOL CHILDREN
Measurers d2 "Signs" D
2 "Signs" Observations (by Supervisor)
Supervisor 294 4/8 Best precision, as expected
Observers
A 324 6/9 524 7/10 Both precision and accuracy satisfactory
B 431 6/10 1195 8/9 Precision satisfactory. Accuracy deficient; values too great by 3.8 mm. Re-examine same children under supervision, with instruction.
C 774 5/10 1024 7/10 Poor precision due to one poor duplicate; accuracy almost adequate. With adequate precision, accuracy can be expected to be adequate.
D 893 5/9 3655 9/10 Overall poor precision; measures 7.4 mm too long, poor attitude, careless. Talk to him and re-standardize.
E 477 7/10 3875 10/10 Precision satisfactory; doing something wrong systematically; 8.9 mm too long. (Upon repeating, he stretches children while measuring them.)
F 1278 7/10 1040 6/10 Poor precision and accuracy due to first four measures. Thereafter satisfactory.
Supervisor's (2 x d
2 = 588)
(3 x d2 = 882)

81
TABLE 4: APPROXIMATIONS TO SQUARES WITH LESS THAN 3.5% ERROR
Number to be squared
Approximate square
Number to be squared
Approximate square
1 1 25 625 2 4 26 675 3 9 27 725 4 16 28 800 5 25 29 850
6 35 30 900 7 50 31 975 8 65 32 1025 9 80 33-34 1120
10 100 35 1200
11 120 36-37 1330 12 140 38-39 1480 13 170 40 1600 14 200 45 2000 15 225 50 2500
16 260 55 3000 17 290 60 3600 18 325 65 4300 19 360 70 4900 20 400 75 5600
21 450 80 6400 22 475 85 7200 23 525 90 8100 24 575 95 9000
100 10000

82
TABLE 5: GIVEN A PRESCRIBED NUMBER OF SUBJECTS TO BE MEASURED, HOW MANY DIFFERENCES OF THE SAME SIGN MUST OCCUR TO
RECOGNIZE A DIFFERENCE7 BETWEEN FIRST AND SECOND
MEASUREMENTS (d) OR BETWEEN SUPERVISOR AND STAFF WORKER (D)
Number of subjects Number of differences with same sign
5 At least: 5 6 6 7 7 8 7 9 8
10 9 11 9 12 10 13 10 14 11 15 12 16 12 17 13 18 13 19 14 20 15
7 Two tailed probability, P <0.1; one tailed probability, P <0.05