METHOD TO-8 METHOD FOR THE DETERMINATION OF …AND METHYLPHENOLS (CRESOLS) IN AMBIENT AIR USING HIGH...
25
Revision 1.0 September, 1986 METHOD TO-8 METHOD FOR THE DETERMINATION OF PHENOL AND METHYLPHENOLS (CRESOLS) IN AMBIENT AIR USING HIGH PERFORMANCE LIQUID CHROMATOGRAPHY 1. Scope 1.1 This document describes a method for determination of phenol and methylphenols (cresols) in ambient air. With careful attention to reagent purity and other factors, the method can detect these compounds at the 1-5 ppbv level. 1.2 The method as written has not been rigorously evaluated. The approach is a composite of several existing methods (1-3). The choice of HPLC detection system will be dependent on the requirements of the individual user. However, the UV detection procedure is considered to be most generally useful for relatively clean samples. 2. Applicable Documents 2.1 ASTM Standards D1356 - Definitions of Terms Related to Atmospheric Sampling and Analysis(4). 2.2 Other Documents U.S. EPA Technical Assistance Document (5). 3. Summary of Method 3.1 Ambient air is drawn through two midget impingers, each containing 15 mL of 0.1 N NaOH. The phenols are trapped as phenolates. 3.2 The impinger solutions are placed in a vial with a Teflon - lined ® screw cap and returned to the laboratory for analysis. The solution is cooled in an ice bath and adjusted to pH <4 by addition of 1 mL of 5% v/v sulfuric acid. The sample is adjusted to a final volume of 25 mL with distilled water. 3.3 The phenols are determined using reverse-phase HPLC with either ultraviolet (UV) absorption detection at 274 nm, electrochemical detection, or fluorescence detection. In general, the UV detection approach should be used for relatively clean samples.
Transcript of METHOD TO-8 METHOD FOR THE DETERMINATION OF …AND METHYLPHENOLS (CRESOLS) IN AMBIENT AIR USING HIGH...
Revision 1.0September, 1986
METHOD TO-8
METHOD FOR THE DETERMINATION OF PHENOLAND METHYLPHENOLS (CRESOLS) IN AMBIENT AIR USING
HIGH PERFORMANCE LIQUID CHROMATOGRAPHY
1. Scope
1.1 This document describes a method for determination of phenol and
methylphenols (cresols) in ambient air. With careful attention to
reagent purity and other factors, the method can detect these
compounds at the 1-5 ppbv level.
1.2 The method as written has not been rigorously evaluated. The
approach is a composite of several existing methods (1-3). The
choice of HPLC detection system will be dependent on the
requirements of the individual user. However, the UV detection
procedure is considered to be most generally useful for relatively
clean samples.
2. Applicable Documents
2.1 ASTM Standards
D1356 - Definitions of Terms Related to Atmospheric Sampling and
Analysis(4).
2.2 Other Documents
U.S. EPA Technical Assistance Document (5).
3. Summary of Method
3.1 Ambient air is drawn through two midget impingers, each containing
15 mL of 0.1 N NaOH. The phenols are trapped as phenolates.
3.2 The impinger solutions are placed in a vial with a Teflon - lined®
screw cap and returned to the laboratory for analysis. The
solution is cooled in an ice bath and adjusted to pH <4 by
addition of 1 mL of 5% v/v sulfuric acid. The sample is adjusted
to a final volume of 25 mL with distilled water.
3.3 The phenols are determined using reverse-phase HPLC with either
ultraviolet (UV) absorption detection at 274 nm, electrochemical
detection, or fluorescence detection. In general, the UV detection
approach should be used for relatively clean samples.

TO8-2
4. Significance
4.1 Phenols are emitted into the atmosphere from chemical operations
and various combustion sources. Many of these compounds are
acutely toxic, and their determination in ambient air is required
in order to assess human health impacts.
4.2 Conventional methods for phenols have generally employed
colorimetric or gas chromatographic techniques with relatively
large detection limits. The method described here reduces the
detection limit through use of HPLC.
5. Definitions
Definitions used in this document and in any user-prepared Standard
Operating Procedures (SOPs) should be consistent with ASTM D1356 (5).
All abbreviations and symbols are defined within this document at the
point of use.
6. Interferences
6.1 Compounds having the same retention times as the compounds of
interest will interfere in the method. Such interferences can
often be overcome by altering the separation conditions (e.g.,
using alternative HPLC columns or mobile phase compositions) or
detectors. Additionally, the phenolic compounds of interest in
this method may be oxidized during sampling. Validation
experiments may be required to show that the four target compounds
are not substantially degraded.
6.2 If interferences are suspected in a "dirty" sample, preliminary
cleanup steps may be required to identify interfering compounds by
recording infrared spectrophotometry followed by specific
ion-exchange column chromatography. Likewise, overlapping HPLC
peaks may be resolved by increasing/decreasing component
concentration of the mobile phase.
6.3 All reagents must be checked for contamination before use.
7. Apparatus
7.1 Isocratic HPLC system consisting of a mobile-phase reservoir, a
high-pressure pump, an injection valve, a Zorbax ODS or C-18
reverse-phase column, or equivalent (25 cm x 4.6 mm lD), a
variable-wavelength UV detector operating at 274 nm, and a data

TO8-3
system or strip-chart recorder (Figure l). Amperometric
(electrochemical) or fluorescence detectors may also be employed.
7.2 Sampling system - capable of accurately and precisely sampling
100-1000 mL/minute of ambient air (Figure 2).
7.3 Stopwatch.
7.4 Friction-top metal can, e.g., one-gallon (paint can) - to hold
samples.
7.5 Thermometer - to record ambient temperature.
7.6 Barometer (optional).
7.7 Analytical balance - 0.1 mg sensitivity.
7.8 Midget impingers - jet inlet type, 25-mL.
7.9 Suction filtration apparatus - for filtering HPLC mobile phase.
7.10 Volumetric flasks - 100 mL and 500 mL.
7.11 Pipettes - various sizes, 1-10 mL.
7.12 Helium purge line (optional) - for degassing HPLC mobile phase.
7.13 Erlenmeyer flask, 1 L - for preparing HPLC mobile phase.
7.14 Graduated cylinder, 1 L - for preparing HPLC mobile phase.
7.15 Microliter syringe, 100-250 uL - for HPLC injection.
8. Reagents and Materials
8.1 Bottles, 10 oz, glass, with Teflon -lined screw cap - for storing®
sampling reagent.
8.2 Vials, 25 mL, with Teflon -lined screw cap - for holding samples.®
8.3 Disposable pipettes and bulbs.
8.4 Granular charcoal.
8.5 Methanol - distilled in glass or pesticide grade.
8.6 Sodium hydroxide - analytical reagent grade.
8.7 Sulfuric acid - analytical reagent grade.
8.8 Reagent water - purified by ion exchange and carbon filtration, or
distillation.
8.9 Polyester filters, 0.22 um - Nuclepore, or equivalent.
8.10 Phenol, 2-methyl-, 3-methyl-, and 4-methylphenol - neat standards
(99+ % purity) for instrument calibration.
8.11 Sampling reagent, 0.1 N NaOH. Dissolve 4.0 grams of NaOH in
reagent water and dilute to a final volume of 1L. Store in a
glass bottle with Teflon -lined cap.®
8.12 Sulfuric acid, 5% v/v. Slowly add 5 mL of concentrated sulfuric
acid to 9S mL of reagent water.

TO8-4
8.13 Acetate buffer, 0.1M, pH 4.8 - Dissolve 5.8 mL of glacial acetic
acid and 13.6 grams of sodium acetate trihydrate in 1 L of reagent
water.
8.14 Acetonitrile - spectroscopic grade.
8.15 Glacial acetic acid - analytical reagent grade.
8.16 Sodium acetate trihydrate - analytical reagent grade.
9. Sampling
9.1 The sampling apparatus is assembled and should be similar to that
shown in Figure 2. EPA Federal Reference Method 6 uses essentially
the same sampling system (6). All glassware (e.g., impingers,
sampling bottles, etc.) must be thoroughly rinsed with methanol
and oven-dried before use.
9.2 Before sample collection, the entire assembly (including empty
sample impingers) is installed and the flow rate checked at a
value near the desired rate. ln general, flow rates of 100-1000
mL/minute are useful. Flow rates greater than 1000 mL/minute
should not be used because impinger collection efficiency may
decrease. Generally, calibration is accomplished using a soap
bubble flow meter or calibrated wet test meter connected to the
flow exit, assuming the entire system is sealed. ASTM Method D3686
describes an appropriate calibration scheme that does not require
a sealed-flow system downstream of the pump (4).
9.3 Ideally, a dry gas meter is included in the system to record total
flow, if the flow rate is sufficient for its use. lf a dry gas
meter is not available, the operator must measure and record the
sampling flow rate at the beginning and end of the sampling period
to determine sample volume. If the sampling time exceeds two
hours, the flow rate should be measured at intermediate points
during the sampling period. Ideally, a rotameter should be
included to allow observation of the flow rate without
interruption of the sampling process.
9.4 To collect an air sample, two clean midget impingers are loaded
with 15 mL of 0.1 N NaOH each and sample flow is started. The
following parameters are recorded on the data sheet (see Figure 3
for an example): date, sampling location, time, ambient
temperature, barometric pressure (if available), relative humidity
(if available), dry gas meter reading (if appropriate), flow rate,
rotameter setting, 0.1 N NaOH reagent batch number, and dry gas
meter and pump identification numbers.

QA 'Q1 % Q2 % ... QN
N
TO8-5
9.5 The sampler is allowed to operate for the desired period, with
periodic recording of the variables listed above. The total volume
should not exceed 80 L. The operator must ensure that at least
5 mL of reagent remains in the impinger at the end of the sampling
interval. (Note: for high ambient temperatures, lower sampling
volumes may be required.)
9.6 At the end of the sampling period, the parameters listed in
Section 9.4 are recorded and the sample flow is stopped. If a dry
gas meter is not used, the flow rate must be checked at the end of
the sampling interval. If the flow rates at the beginning and end
of the sampling period differ by more than 15%, the sample should
be discarded.
9.7 Immediately after sampling, the impinger is removed from the
sampling system. The contents of the impinger are emptied into a
clean 25-mL glass vial with a Teflon -lined screw-cap. The®
impinger is then rinsed with 5 mL of reagent water and the rinse
solution is added to the vial. The vial is then capped, sealed
with Teflon tape, and placed in a friction-top can containing 1-2®
inches of granular charcoal. The samples are stored in the can and
refrigerated until analysis. No degradation has been observed if
the time between refrigeration and analysis is less than 48 hours.
9.8 If a dry gas meter or equivalent total flow indicator is not used,
the average sample flow rate must be calculated according to the
following equation:
where
Q = average flow rate (mL/minute). A
Q , Q ,----Q = flow rates determined at beginning,1 2 N
end, and intermediate points during
sampling.
N = number of points averaged.

Vm '(T2&T1) × QA
1000
Vs ' Vm ×PA760
× 298273 % TA
TO8-6
9.9 The total flow is then calculated using the following equation:
where
V = total volume (L) sampled at measured temperaturem
and pressure.
T = stop time.2
T = start time.1
T -T = total sampling time (minutes).2 1
Q = average flow rate (ml/minute).A
9.10 The volume of air sampled is often reported uncorrected for
atmospheric conditions (i.e., under ambient conditions). However,
the value should be adjusted to standard conditions (25EC and 760
mm pressure) using the following equation:
where
V = total sample volume (L) at 25EC and 760 mm Hgs
pressure.
V = total sample volume (L) under ambientm
conditions. Calculated as in Section 9.9 or from
dry gas meter reading.
P = ambient pressure (mm Hg).A
T = ambient temperature (EC).A
10. Sample Analysis
10.1 Sample Preparation
10.1.1 The samples are returned to the laboratory in 25-mL
screw-capped vials. The contents of each vial are
transferred to a 25-mL volumetric flask. A 1-mL
volume of 5% sulfuric acid is added and the final
volume is adjusted to 25 mL with reagent water.
10.1.2 The solution is thoroughly mixed and then placed in a
25-ml screw-capped vial for storage (refrigerated)
until HPLC analysis.
phenol & 9.4 minuteso&cresol & 12.5 minutesm&cresol & 11.5 minutesp&cresol & 11.9 minutes
phenol & 9.4 minuteso&cresol & 12.8 minutesm/p&cresol & 11.9 minutes
TO8-7
IndividualA CombinedA
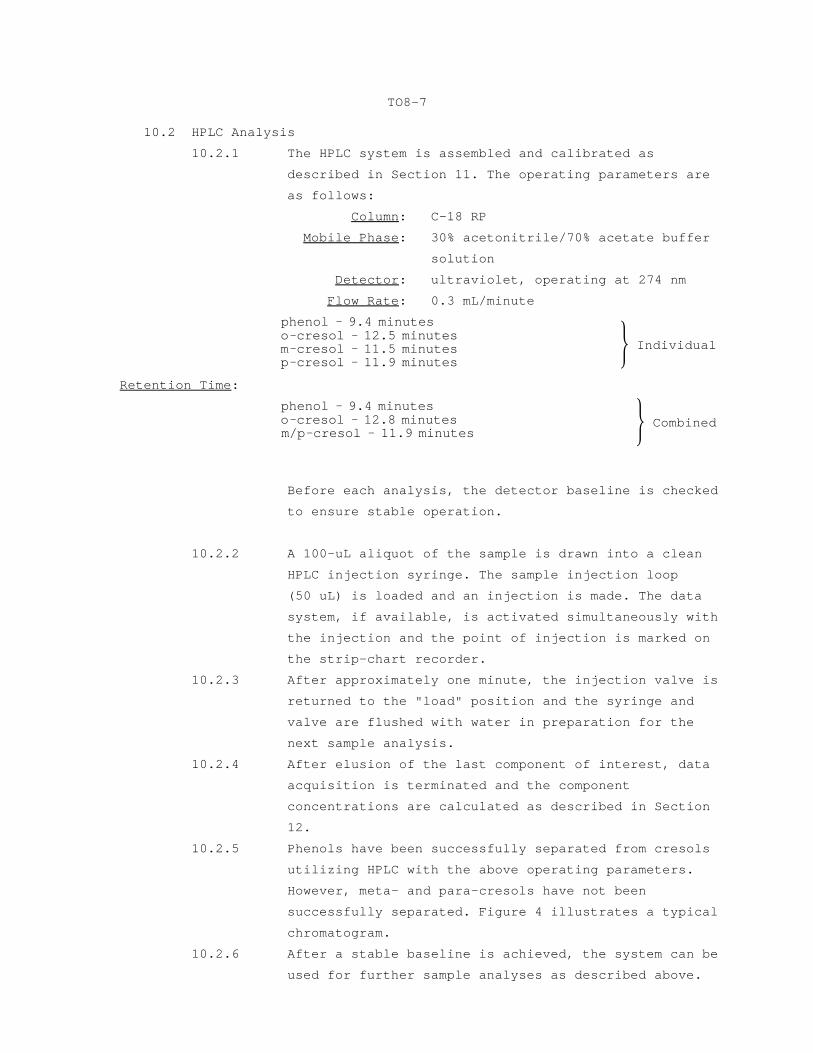
10.2 HPLC Analysis
10.2.1 The HPLC system is assembled and calibrated as
described in Section 11. The operating parameters are
as follows:
Column: C-18 RP
Mobile Phase: 30% acetonitrile/70% acetate buffer
solution
Detector: ultraviolet, operating at 274 nm
Flow Rate: 0.3 mL/minute
Retention Time:
Before each analysis, the detector baseline is checked
to ensure stable operation.
10.2.2 A 100-uL aliquot of the sample is drawn into a clean
HPLC injection syringe. The sample injection loop
(50 uL) is loaded and an injection is made. The data
system, if available, is activated simultaneously with
the injection and the point of injection is marked on
the strip-chart recorder.
10.2.3 After approximately one minute, the injection valve is
returned to the "load" position and the syringe and
valve are flushed with water in preparation for the
next sample analysis.
10.2.4 After elusion of the last component of interest, data
acquisition is terminated and the component
concentrations are calculated as described in Section
12.
10.2.5 Phenols have been successfully separated from cresols
utilizing HPLC with the above operating parameters.
However, meta- and para-cresols have not been
successfully separated. Figure 4 illustrates a typical
chromatogram.
10.2.6 After a stable baseline is achieved, the system can be
used for further sample analyses as described above.

TO8-8
10.2.7 If the concentration of analyte exceeds the linear
range of the instrument, the sample should be diluted
with mobile phase, or a smaller volume can be injected
into the HPLC.
10.2.8 If the retention time is not duplicated, as determined
by the calibration curve, you may increase or decrease
the acetonitrile/water ratio to obtain the correct
elution time, as specified in Figure 4. If the elution
time is long, increase the ratio; if it is too short,
decrease the ratio.
11.0 HPLC Assembly and Calibration
11.1 The HPLC system is assembled and operated according to Section
10.2.1.
11.2 The HPLC mobile phase is prepared by mixing 300 mL of acetonitrile
and 750 mL of acetate buffer, pH 4.8. This mixture is filtered
through a 0.22-um polyester membrane filter in an all-glass and
Teflon suction filtration apparatus. The filtered mobile phase is®
degassed by purging with helium for 10-15 minutes (100 mL/minute)
or by heating to 60EC for 5-10 minutes in an Erlenmeyer flask
covered with a watch glass. A constant back pressure restrict or
(50 psi) or short length (6-12 inches) of 0.01-inch I.D. Teflon®
tubing should be placed after the detector to eliminate further
mobile phase outgassing.
11.3 The mobile phase is placed in the HPLC solvent reservoir and the
pump is set at a flow rate of 0.3 mL/minute and allowed to pump
for 20-30 minutes before the first analysis. The detector is
switched on at least 30 minutes before the first analysis and the
detector output is displayed on a strip-chart recorder or similar
output device. UV detection at 274 nm is generally preferred.
Alternatively, fluorescence detection with 274-nm excitation at
298-nm emission (2), or electrochemical detection at 0.9 volts
(glassy carbon electrode versus Ag/AgCl) (3) may be used. Once a
stable baseline is achieved, the system is ready for calibration.
11.4 Calibration standards are prepared in HPLC mobile phase from the
neat materials. Individual stock solutions of 100 mg/L are
prepared by dissolving 10 mg of solid derivative in 100 mL of
mobile phase. These individual solutions are used to prepare
calibration standards containing all of the phenols and cresols of
interest at concentrations spanning the range of interest.

RFc 'Cc × VI
Rc
TO8-9
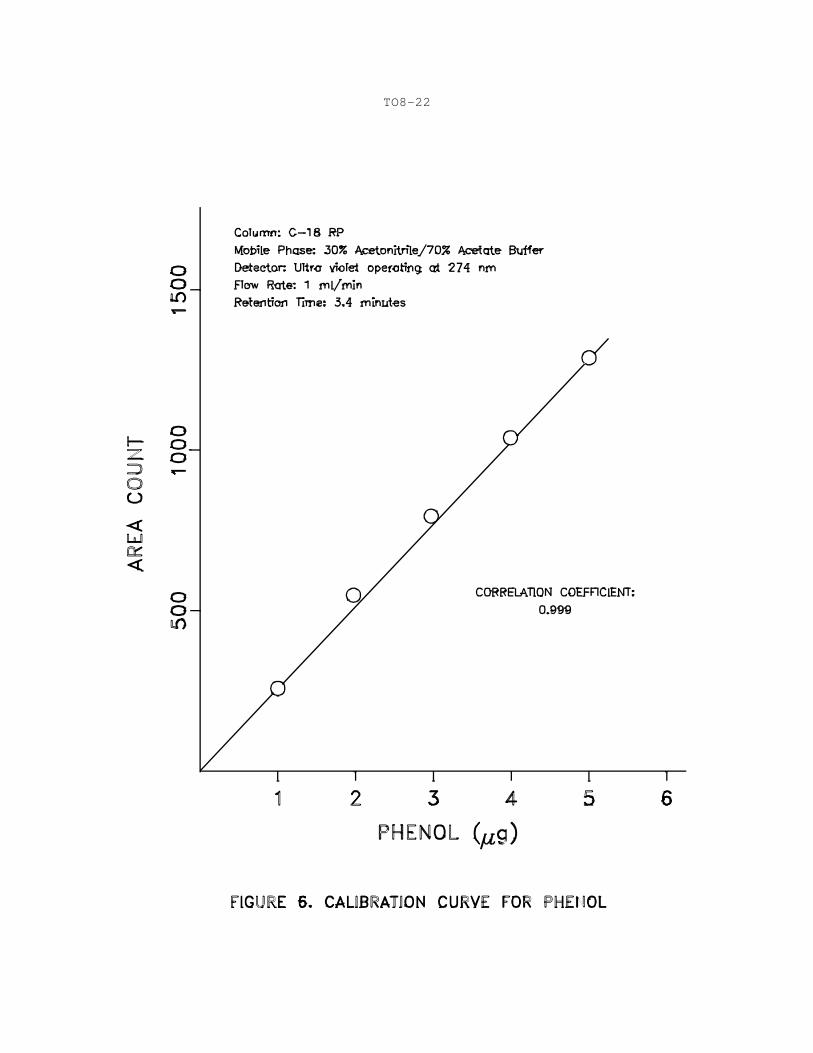
11.5 Each calibration standard (at least five levels) is analyzed three
times and area response is tabulated against mass injected.
Figures 5a through 5e illustrate HPLC response to various phenol
concentrations (1 mL/minute flow rate). All calibration runs are
performed as described for sample analyses in Section 10. Using
the UV detector, a linear response range of approximately 0.05 to
10 mg/L should be achieved for 50-uL injection volumes. The
results may be used to prepare a calibration curve, as illustrated
in Figure 6 for phenols. Linear response is indicated where a
correlation coefficient of at least 0.999 for a linear
least-squares fit of the data (concentration versus area response)
is obtained. The retention times for each analyze should agree
within 2%.
11.6 Once linear response has been documented, an intermediate
concentration standard near the anticipated levels for each
component, but at least 10 times the detection limit, should be
chosen for daily calibration. The response for the various
components should be within 10% day to day. If greater variability
is observed, recalibration may be required or a new calibration
curve must be developed from fresh standards.
11.7 The response for each component in the daily calibration standard
is used to calculate a response factor according to the following
equation:
where
RF = response factor (usually area counts) for theC
component of interest in nanograms injected/
response unit.
Cc = concentration (mg/L) of analyte in the daily
calibration standard.
VI = volume (uL) of calibration standard injected.
Rc = response (area counts) for analyte in the
calibration standard.
Wd ' RFc X Rd XVEVI
XVDVA
CA '. Wd
Vm (or Vs)× 1000
CA (ppbv) ' CA (ng/L) × 24.4MWA
TO8-10
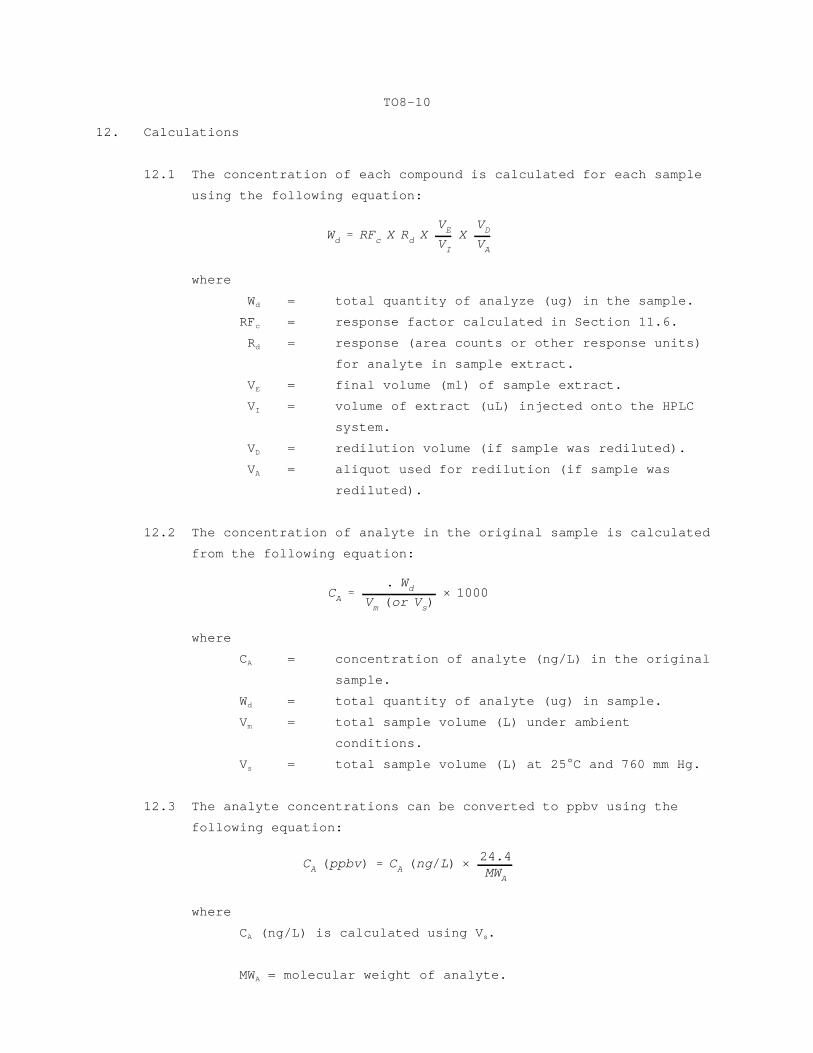
12. Calculations
12.1 The concentration of each compound is calculated for each sample
using the following equation:
where
W = total quantity of analyze (ug) in the sample.d
RF = response factor calculated in Section 11.6.c
R = response (area counts or other response units)d
for analyte in sample extract.
V = final volume (ml) of sample extract. E
V = volume of extract (uL) injected onto the HPLCI
system.
V = redilution volume (if sample was rediluted). D
V = aliquot used for redilution (if sample wasA
rediluted).
12.2 The concentration of analyte in the original sample is calculated
from the following equation:
where
C = concentration of analyte (ng/L) in the originalA
sample.
W = total quantity of analyte (ug) in sample. d
V = total sample volume (L) under ambientm
conditions.
V = total sample volume (L) at 25EC and 760 mm Hg.s
12.3 The analyte concentrations can be converted to ppbv using the
following equation:
where
C (ng/L) is calculated using V .A s
MW = molecular weight of analyte.A

N ' 5.54trW1/2
2
TO8-11
13. Performance Criteria and Quality Assurance
This section summarizes required quality assurance (QA) measures and
provides guidance concerning performance criteria that should be achieved
within each laboratory.
13.1 Standard Operating Procedures (SOPs).
13.1.1 Users should generate SOPs describing the following
activities in their laboratory: (1) assembly,
calibration, and operation of the sampling system, with
make and model of equipment used; (2) preparation,
purification, storage, and handling of sampling reagent
and samples; (3) assembly, calibration, and operation of
the HPLC system, with make and model of equipment used;
and (4) all aspects of data recording and processing,
including lists of computer hardware and software used.
13.1.2 SOPs should provide specific stepwise instructions and
should be readily available to and understood by the
laboratory personnel conducting the work.
13.2 HPLC System Performance
13.2.1 The general appearance of the HPLC chromatogram should be
similar to that illustrated in Figure 4.
13.2.2 The HPLC system efficiency and peak asymmetry factor
should be determined in the following manner: A solution
of phenol corresponding to at least 20 times the
detection limit should be injected with the recorder
chart sensitivity and speed set to yield a peak
approximately 75% of full scale and 1 cm wide at half
height. The peak asymmetry factor is determined as shown
in Figure 7, and should be between 0.8 and 1.8.
13.2.3 HPLC system efficiency is calculated according to the
following equation:
where
N = column efficiency (theoretical plates).
t = retention time (seconds) of analyte.r
W = width of component peak at half height1/2
(seconds).
A column efficiency of >5,000 theoretical plates should
be obtained.

TO8-12
13.2.4 Precision of response for replicate HPLC injections
should be ±10% or less, day to day, for calibration
standards. Precision of retention times should be ±2%,
on a given day.
13.3 Process Blanks
13.3.1 Before use, a 15-mL aliquot of each batch of 0.1 N
NaOH reagent should be analyzed as described in
Section 10. In general, analyte levels equivalent to
<5 ng/L in an 80-L sample should be achieved.
13.3.2 At least one field blank, or 10% of the field samples,
whichever is larger, should be shipped and analyzed
with each group of samples. The number of samples
within a group and/or time frame should be recorded so
that a specified percentage of blanks is obtained for
a given number of field samples. The field blank is
treated identically to the samples except that no air
is drawn through the reagent. The same performance
criteria described in Section 13.3.1 should be met for
process blanks.
13.4 Method Precision and Accuracy
13.4.1 At least one duplicate sample, or 10% of the field
samples, whichever is larger, should be collected
during each sampling episode. Precision for field
replication should be ±20% or better.
13.4.2 Precision for replicate HPLC injections should be ±10%
or better, day to day, for calibration standards.
13.4.3 At least one spiked sample, or 10% of the field
samples, whichever is larger, should be collected. The
impinger solution is spiked with a known quantity of
the compound of interest, prepared as a dilute water
solution. A recovery of >80% should be achieved
routinely.
13.4.4 Before initial use of the method, each laboratory
should generate triplicate spiked samples at a minimum
of three concentration levels, bracketing the range of
interest for each compound. Triplicate nonspiked
samples must also be processed. Spike recoveries of
>80 ±10% and blank levels of <5 ng/L (using an 80-L
sampling volume) should be achieved.

TO8-13
REFERENCES
(1) NIOSH P & CAM Method S330-1, "Phenol," National Institute ofOccupational Safety and Health, Methods Manual, Vol. 3, 1978.
(2) Ogan, K. and, Katz, E., "Liquid Chromatographic Separation ofAlkylphenols with Fluorescence and Ultraviolet Detection," Anal. Chem.,53, 160-163 (1981).
(3) Shoup, R. E., and Mayer, G. S., "Determination of Environmental Phenolsby Liquid Chromatography Electrochemistry," Anal. Chem., 54, 1164-1169(1982).
(4) Annual Book of ASTM Standards, Part 11.03, "Atmospheric Analysis,"American Society for Testing and Materials, Philadelphia, Pennsylvania,1983.
(5) Riggin, R. M., "Technical Assistance Document for Sampling and Analysisof Toxic Organic Compounds in Ambient Air," EPA-600/4-83-027, U.S.Environmental Protection Agency, Research Triangle Park, North Carolina,1983.
(6) "Method 6 Determination of SO Emissions from Stationary Sources,"2
Federal Register, Vol. 42., No. 160, August, 1977.

TO8-14

TO8-15

TO8-16

'Q1% Q
2% Q
3... QN
N×
11000 × (Sampling Time in Minutes)
TO8-17
= ______ L
SAMPLING DATA SHEET(One Sample per Data Sheet)
PROJECT: DATES(S) SAMPLED:
SITE: TIME PERIOD SAMPLED:
LOCATION: OPERATOR:
INSTRUMENT MODEL NO: CALIBRATED BY:
PUMP SERIAL NO:
SAMPLING DATA
Sample Number:
Start Time: Stop Time:
Time Reading Reading mL/min EC mm Hg Humidity, % Comments
Dry Gas Flow Ambient BarometricMeter Rotameter Rate, *Q Temperature Pressure, Relative
1.
2.
3.
4.
N.
Total Volume Data**
V = (Final - Initial) Dry Gas Meter Reading, or = _______ Lm
* Flow rate from rotameter or soap bubble calibrator (specify which).** Use data from dry gas meter if available.
FIGURE 3. EXAMPLE SAMPLING DATA SHEET

TO8-18

TO8-19

TO8-20

TO8-21
TO8-22

TO8-23

TO8-24

TO8-25