Method for the Quantification of Diamorphine and its Metabolites in ...
19
In recent years, intranasal diamorphine (DIM) has been recommended as an alternative to intravenous administration for the treatment of acute-to-severe pain in children. This provides a rapid and less painful route of administration without decreasing the effectiveness of the analgesic properties. A sensitive technique for the detection and quantitation of DIM and its metabolites is essential because of the low concentrations of DIM and metabolites in children’s plasma, which are a result of the low dose of DIM given and the limited sample volume obtained from children (0.25 mL or less). DIM can be easily hydrolyzed to 6-monoacetylmorphine (6-MAM) during sample preparation and extraction, so this must be considered when developing a solid-phase extraction (SPE) method to prevent the hydrolysis of DIM. This work was aimed at validating and developing a liquid chromatography–tandem mass spectrometry (LC–MS–MS) method with electrospray ionization for the identification and quantification of DIM and its metabolites, namely 6-MAM, MOR, M3G, M6G, and NMOR in plasma samples obtained from children who are under treatment for acute-to-severe pain. Following the addition of deuterated internal standards, analytes were extracted by SPE with Bond Elut C 18 cartridges followed by LC–MS–MS analysis. Intraday and interday precision for all analytes were determined at five concentration (1, 5, 25, 50, and 200 ng/mL), and these were found to be 2.5–13.4% and 1.8–15%, respectively. Recoveries of analytes of interest were between 81 and 109%. Calibration curves were linear for all analytes over the concentration range 0.1–50 ng/mL, and correlation coefficients were better than 0.999. Limits of detection and quantitation were 0.08–0.37 ng/mL and 0.28–1.22 ng/mL, respectively. DIM and metabolites were detected in all case samples with the exception of NMOR, which tested negative in all cases. The pharmacokinetics of DIM and its metabolites following INDIM and IVDIM administration in children have been compared for the first time in this study, which confirmed that INDIM can achieve therapeutic plasma concentrations of DIM and its active metabolites, although these are lower than those obtained with IVDIM and occur at later times after administration. Introduction Although heroin (HER) is a widely abused drug around the world, pharmaceutical diamorphine (DIM) has been used suc- cessfully for the treatment of HER-dependent patients and for the management of moderate-to-severe pain resulting from surgery or illnesses such as cancer (1–13). The advantage of using DIM in pain management is its ability to pass the blood- brain barrier easily due to the presence of two acetyl groups. DIM is more potent and faster acting than its precursor mor- phine (MOR). It also produces more euphoria and less depres- sion than morphine. The water solubility of DIM hydrochloride allows it to be injected in small volumes (3,10,14–16). After all administration routes, DIM or HER is quickly deacetylated to 6-monoacetylmorphine (6-MAM), which is con- sidered to be a specific marker of HER use. HER has a short plasma half-life, which has been reported to be between 2 and 8 min after intravenous injection (17). 6-MAM is not always found in blood because of its short half-life, which is reported to be between 10 and 40 min (18,19), but it can be detected in urine up to 8 h after heroin administration (20,21). 6-MAM is hydrolyzed to MOR, and then MOR is conjugated to form two glucuronides: morphine-3-glucuronide (M3G) and morphine- 6-glucuronide (M6G). Five percent of MOR is metabolized by N-demethylation to normorphine (NMOR). The plasma half-life of free morphine has been reported to be between 2 and 4 h in adult drug misusers, but its glucuronide can be determined in urine more than 5 days after heroin use (22–25). Eighty per- cent of heroin metabolites are eliminated within 24 h after administration (20). Method for the Quantification of Diamorphine and its Metabolites in Pediatric Plasma Samples by Liquid Chromatography–Tandem Mass Spectrometry * Ahmed Al-Asmari 1,2,† , Robert A. Anderson 1 , Susan Kidd 3 , and Alison H. Thomson 4 1 Forensic Medicine and Science, University of Glasgow, Glasgow, Scotland; 2 Poison Control and Forensic Chemistry Centre, Jeddah, Saudi Arabia; 3 Accident and Emergency Department, Royal Hospital for Sick Children, Edinburgh, Scotland; and 4 Strathclyde Institute of Pharmacy and Biomedical Sciences, University of Strathclyde, Glasgow, Scotland Reproduction (photocopying) of editorial content of this journal is prohibited without publisher’s permission. 177 Journal of Analytical Toxicology,Vol. 34, May 2010 * This paper was presented in part at the 2008 Annual Meeting of The International Association of ForensicToxicologists, Martinique, French West Indies. † Author to whom correspondence should be addressed. Poison Control and Forensic Chemistry Centre, P.O. Box 6470, Jeddah 21442, Saudi Arabia. E-mail: [email protected]. Abstract Downloaded from https://academic.oup.com/jat/article-abstract/34/4/177/785216 by guest on 08 February 2018
-
Upload
trinhkhuong -
Category
Documents
-
view
213 -
download
0
Transcript of Method for the Quantification of Diamorphine and its Metabolites in ...

In recent years, intranasal diamorphine (DIM) has beenrecommended as an alternative to intravenous administration forthe treatment of acute-to-severe pain in children. This provides arapid and less painful route of administration without decreasingthe effectiveness of the analgesic properties. A sensitivetechnique for the detection and quantitation of DIM and itsmetabolites is essential because of the low concentrations ofDIM and metabolites in children’s plasma, which are a result ofthe low dose of DIM given and the limited sample volumeobtained from children (0.25 mL or less). DIM can be easilyhydrolyzed to 6-monoacetylmorphine (6-MAM) during samplepreparation and extraction, so this must be considered whendeveloping a solid-phase extraction (SPE) method to prevent thehydrolysis of DIM. This work was aimed at validating anddeveloping a liquid chromatography–tandem mass spectrometry(LC–MS–MS) method with electrospray ionization for theidentification and quantification of DIM and its metabolites,namely 6-MAM, MOR, M3G, M6G, and NMOR in plasmasamples obtained from children who are under treatment foracute-to-severe pain. Following the addition of deuteratedinternal standards, analytes were extracted by SPE with BondElut C18 cartridges followed by LC–MS–MS analysis. Intradayand interday precision for all analytes were determined at fiveconcentration (1, 5, 25, 50, and 200 ng/mL), and these werefound to be 2.5–13.4% and 1.8–15%, respectively. Recoveriesof analytes of interest were between 81 and 109%. Calibrationcurves were linear for all analytes over the concentration range0.1–50 ng/mL, and correlation coefficients were better than0.999. Limits of detection and quantitation were 0.08–0.37ng/mL and 0.28–1.22 ng/mL, respectively. DIM and metaboliteswere detected in all case samples with the exception of NMOR,which tested negative in all cases. The pharmacokinetics of DIMand its metabolites following INDIM and IVDIM administration
in children have been compared for the first time in this study,which confirmed that INDIM can achieve therapeutic plasmaconcentrations of DIM and its active metabolites, although theseare lower than those obtained with IVDIM and occur at latertimes after administration.
Introduction
Although heroin (HER) is a widely abused drug around theworld, pharmaceutical diamorphine (DIM) has been used suc-cessfully for the treatment of HER-dependent patients and forthe management of moderate-to-severe pain resulting fromsurgery or illnesses such as cancer (1–13). The advantage ofusing DIM in pain management is its ability to pass the blood-brain barrier easily due to the presence of two acetyl groups.DIM is more potent and faster acting than its precursor mor-phine (MOR). It also produces more euphoria and less depres-sion than morphine. The water solubility of DIM hydrochlorideallows it to be injected in small volumes (3,10,14–16).
After all administration routes, DIM or HER is quicklydeacetylated to 6-monoacetylmorphine (6-MAM), which is con-sidered to be a specific marker of HER use. HER has a shortplasma half-life, which has been reported to be between 2 and8 min after intravenous injection (17). 6-MAM is not alwaysfound in blood because of its short half-life, which is reportedto be between 10 and 40 min (18,19), but it can be detected inurine up to 8 h after heroin administration (20,21). 6-MAM ishydrolyzed to MOR, and then MOR is conjugated to form twoglucuronides: morphine-3-glucuronide (M3G) and morphine-6-glucuronide (M6G). Five percent of MOR is metabolized byN-demethylation to normorphine (NMOR). The plasma half-lifeof free morphine has been reported to be between 2 and 4 h inadult drug misusers, but its glucuronide can be determined inurine more than 5 days after heroin use (22–25). Eighty per-cent of heroin metabolites are eliminated within 24 h afteradministration (20).
Method for the Quantification of Diamorphineand its Metabolites in Pediatric Plasma Samples byLiquid Chromatography–Tandem Mass Spectrometry*
Ahmed Al-Asmari1,2,†, Robert A. Anderson1, Susan Kidd3, and Alison H. Thomson41Forensic Medicine and Science, University of Glasgow, Glasgow, Scotland; 2Poison Control and Forensic Chemistry Centre,Jeddah, Saudi Arabia; 3Accident and Emergency Department, Royal Hospital for Sick Children, Edinburgh, Scotland; and4Strathclyde Institute of Pharmacy and Biomedical Sciences, University of Strathclyde, Glasgow, Scotland
Reproduction (photocopying) of editorial content of this journal is prohibited without publisher’s permission. 177
Journal of Analytical Toxicology, Vol. 34, May 2010
* This paper was presented in part at the 2008 Annual Meeting of The International Associationof Forensic Toxicologists, Martinique, French West Indies.
† Author to whom correspondence should be addressed. Poison Control and ForensicChemistry Centre, P.O. Box 6470, Jeddah 21442, Saudi Arabia. E-mail:[email protected].
Abstract
Downloaded from https://academic.oup.com/jat/article-abstract/34/4/177/785216by gueston 08 February 2018

Journal of Analytical Toxicology, Vol. 34, May 2010
178
DIM is known to act as a pro-drug and to achieve its anal-gesia via its active metabolites (3,6,26–28). However, DIM and6-MAM have been found to contribute to the initial analgesicactivity of DIM and to act on δ- and κ-receptors, which suggeststhat the early analgesic relief seen after DIM intake might bedue to DIM itself (6,26,27,29). Therefore, the concentration ofDIM at this stage should be determined. In addition, re-evalu-ation of studies with respect to the role of morphine glu-curonides in clinical analgesia after DIM or morphine intakehas been suggested (30).
DIM metabolite concentrations have been found to be in-fluenced by the route of administration (6,7). Intravenous di-amorphine (IVDIM) is considered the golden standard route ofadministration due to the rapid delivery of an accurate quan-tity of drug that can be titrated to analgesic response. However,alternative routes of administration are often preferred by drugmisusers. Drug delivery by inhalation (through smoking) orintranasally are less efficient than IVDIM administration buthave other advantages. They are “needle free”, leaving noexternal marks on the user’s body, are less expensive, andreduce the potential for HIV infection through needle sharing(6,17,31).
Children are prone to accidents, and sometimes admission tohospital and analgesia are required. In the United Kingdom, aparticular problem is childhood fractures, which result in se-vere pain and occur in 20 out of 1000 people per year (32).There are still problems encountered in finding immediatepain relief because of limitations in the “therapeutic armoury”,the route of administration and communication (33). In chil-dren, routes of administration using needles (i.e., intravenousand intramuscular injection) have been found to cause distressand pain. In addition, oral administration produces less effi-cient analgesia, and rectal administration is not ideal becauseof difficulties in obtaining consent (6,16).
In recent years, intranasal DIM (INDIM) has been recom-mended as an alternative to intravenous administration forthe treatment of acute-to-severe pain in children. This providesa less traumatic means of administering rapid, powerful anal-gesia to children in whom obtaining intravenous access may betechnically difficult and distressing. It has been reported thatthis approach does not decrease the effectiveness of analgesiabut reduces adverse effects (6,16,34,35).
Many clinicians believe that intravenous diamorphine(IVDIM) delivers more rapid and effective analgesia thanINDIM, but as yet there is no scientific evidence to support thisview. Although both IVDIM and INDIM have been used forpain relief in children’s fracture accidents in the UnitedKingdom for many years (15), as yet there has been no directcomparison between the pharmacokinetic profiles of IVDIMand INDIM in children. Pharmacokinetic data after adminis-tration of IVDIM is available, but DIM concentrations have notbeen reported, and no pharmacokinetic data after INDIM ad-ministration in children are available.
A sensitive technique for the detection and quantification ofDIM and its metabolites is essential because of the low con-centrations of DIM and metabolites in children’s plasma, whichis a result of the low dose of DIM given and the limited samplevolume obtained from children (0.25 mL or less). In addition,
DIM can be easily hydrolyzed to 6-MAM during sample prepa-ration and extraction, so prevention must be considered whendeveloping a solid-phase extraction (SPE) method.
The initial aim of this work was to develop and validate amethod for the determination of DIM and its metabolites,namely 6-MAM, MOR, M3G, M6G, and NMOR in humanplasma. The second part of this study was aimed at obtainingpharmacokinetic data for DIM and its metabolites in childrenfollowing intravenous and intranasal administration in a blindstudy. Because DIM is known to act as a pro-drug and toachieve analgesia via its metabolites, it was intended that theconcentrations of active DIM metabolites would be used toevaluate whether or not INDIM can deliver rapid and efficientanalgesia in children comparable to that obtained with IVDIM.
Materials and Methods
Reagents and standardsMethanol and acetonitrile (HPLC-grade) were obtained from
BDH (Poole, U.K.). Ammonium carbonate, formic acid, andammonium hydroxide were also purchased from BDH. Am-monium formate was obtained from Acros Organics (MorrisPlains, NJ). Bond Elut (1 mL)-C18 cartridges were purchasedfrom Varian (Palo Alto, CA).
The method was developed using human plasma obtainedfrom the Scottish National Blood Transfusion Service. Ethicalapproval for supply of time-expired blood products was given bythe given by the Ethics Committee of the Scottish Blood Trans-fusion Service in Edinburgh.
DIM, diamorphine-d9 (DIM-d9), MOR, morphine-d3 (MOR-d3), 6-monoacetylmorphine (6-MAM), and 6-monoacetyl-morphine-d3 (6-MAM-d3) was purchased from Promochem(Middlesex, U.K.). Morphine-3-glucuronide (M3G), morphine-3-glucuronide-d3 (M3G-d3), morphine-6-glucuronide (M6G),morphine-6-glucuronide-d3 (M6G-d3), and normorphine(NMOR) were obtained from Lipomed (Arlesheim, Switzer-land).
DIM, 6-MAM, and the internal standard were obtained assolutions in acetonitrile. NMOR and standards and internalstandard for MOR were obtained as solutions in methanol.Morphine glucuronides were obtained as solution inmethanol/water (1:1). All standards and internal standardswere purchased at a concentration of 0.1 mg/mL or 1 mg/mL,and each had a purity of more than 99%. Individual workingstandards were prepared at a concentration of 1 µg/mL by di-lution of the stock solutions. Working standards mixtures andinternal standards were similarly prepared.
SPETwo-hundred and fifty microliters of plasma was added
to 300 µL of 0.01 M ammonium carbonate (pH 9.3), and 25 µL(25 ng/mL) of the internal standard working solution(1 µL/mL) was added. The mixture was vortex mixed. The su-pernatant was applied to a Bond Elut C18 SPE cartridge pre-conditioned with 2 mL methanol, 1 mL of deionized water,and 2 mL of 0.01 M ammonium carbonate (pH 9.3). The SPE
Downloaded from https://academic.oup.com/jat/article-abstract/34/4/177/785216by gueston 08 February 2018

Journal of Analytical Toxicology, Vol. 34, May 2010
179
cartridge was washed twice with 1 mL 0.01 M ammonium car-bonate (pH 9.3) and then dried for 10 min. Retained drugs wereeluted with 2 mL methanol. After that, the extracts were evap-orated to dryness under nitrogen at 50°C. The residues were re-constituted with 80 µL of initial mobile phase, and then 20 µLwas injected into the LC–MS–MS instrument.
Chromatography conditionsIn the current procedure, high-performance liquid chro-
matography (HPLC) methods were carried out as described ina previous method for the analysis of opioids and their metabo-lites in autopsy blood samples (1). Chromatographic separationwas achieved using a Synergy Polar RP column (150 × 2.0mm, 4-µm particle size), protected by a guard column withidentical packing material (4 × 2.0 mm, Phenomenex, Tor-rance, CA). Gradient elution was based on a mobile phase con-sisting of 10 mM ammonium formate adjusted to pH 3 (A)and acetonitrile (B) at a flow rate of 0.3 mL/min in the first 8min, decreasing to 0.2 mL/min at 13 min for the next 13 min.After that, the initial flow rate was applied until the end of anal-ysis. The gradient conditions were initially 97% of solution Afor 3 min, decreasing to 84.5% at 8 min, to 74% at 13 min, andto 20% at 26 min. Five percent of solution A was maintainedfor the next 3 min before returning to 97% for 7 min prior tothe next injection.
InstrumentationAnalysis of DIM and their metabolites was performed using
a Thermo Finnigan LCQ DECA XP Plus ion trap instrument(San Jose, CA) equipped with a surveyor LC system interface.During the analysis, autosampler and column oven tempera-tures were maintained at 4°C and 30°C, respectively.
Ionization of analytes of interest was carried out using elec-trospray positive ion mode (ESPI). The capillary temperature,sheath gas flow rate, auxiliary gas flow rate, and collision en-ergies were optimized for each analyte separately. The sprayvoltage used was 5 kV.
Analytes and their internal standards were identified andquantified based on their retention times and the presence ofparent ion and two product ions in selected reaction moni-toring mode (SRM) with the exception of M3G and M6G,which were fragmented to a single product ion as follows:m/z 310, 328, and 370 for DIM; m/z 211, 229, and 328 for 6-MAM; 201, 229, and 268 for MOR; 254, 229, and 272 forNMOR, and m/z 286 and 462 for M3G and M6G. The LC–MS–MS chromatogram was divided into six different segments toenhance analyte responses. The MS–MS parameters are de-tailed in Table I.
LC–MS–MS optimizationIn our previous work (1), 6-MAM, MOR, M3G, M6G, and
NMOR were determined for the purpose of evaluating the roleof these metabolites in heroin fatalities. The same LC–MS–MSmethod was used for the analysis of DIM and its metabolites inthe current study. DIM was not included with target analytesin the previous method and in addition a different matrix wasused; therefore, SPE and LC–MS methods were re-evaluated.In addition, more deuterated internal standard was used for
better accuracy and to lower the risk of matrix effects. M3G-d3 and M6G-d3 were found to have crosstalk with dihydro-morphine-3-glucuronide and dihydromorphine-6-glucuronide, respectively (1). However, these internalstandards could be used with the current study along withdeuterated internal standard DIM-d9 because the co-elutingdrugs were absent from these clinical samples obtained fromchildren.
Each analyte was dissolved in organic solvent at 10 µg/mLand infused through a T-connection to the MS–MS instru-ment to obtain the best conditions and responses for LC–ESPI-MS–MS. The capillary temperature, sheath gas flow rate, aux-iliary gas flow rate, and collision energies were optimized foreach analyte separately. The spray voltage used was 5 kV. Datawere then stored as a tune page.
The LC–MS–MS chromatogram was divided into six dif-ferent time segments or retention widows, one for each analyteand its internal standard, in order to enhance analyte re-sponses. The MS–MS parameters are detailed in Table I. Deuter-ated internal standards were identified in selective ion moni-toring (SIM) in our previous method (1). In the present study,deuterated standards were identified and quantified using SRMas follows; M3G-d3 and M6G-d3 were fragmented to m/z 289,MOR-d3, 6-MAM-d3, and heroin-d9 were fragmented to m/z201, 211, and 316, respectively. Good chromatographic peakshapes were obtained for DIM metabolites at very low concen-trations in the present study as shown in Figures 1 and 2. Themajor product ion was used for quantification and the otherswere used as qualifiers. In the case of M3G and M6G for whichno other product ions were formed, 10% of survival production was used to qualify the SRM transition. In the case of DIM,three product ions can be obtained, and two of them werefound at relatively the same amount (m/z 310 and 328). Forquantification m/z 310 was used, and m/z 328 and 268 wereused as qualifier ions. The major product ions of 6-MAM andMOR are at the same mass-to-charge ratios as their corre-sponding internal standards, which were 201 and 211, respec-tively.
The SRM transition ratios were calculated on five differentdays using five different calibration curves for both high andlow concentrations. The ion intensity ratios of DIM metaboliteswere 1, 1.3, 1.6, 1.4, 2.3, 5.3, and 5.6 for DIM (m/z 310/328),DIM (m/z 310/268), 6-MAM (m/z 211/268), MOR (m/z 201/229),NMOR (m/z 254/229), M3G (m/z 286/462), and M6G (m/z286/462), respectively (Table I).
Method validationLinearity. Two calibration curves were prepared in plasma
and extracted by the described method as the study was blindwith respect to patient groups: one calibration curve coveredlow concentrations (0.1, 0.2, 0.3, 0.5, 0.75, 1, 5, and 10 ng/mL)and the other covered high concentrations (5, 10, 20, 25, 50,100, 200, and 250 ng/mL). Blanks with no internal standardsand blank plasma samples with internal standard at 25 ng/mlwere included with each run. Calibration curves plotted peak-area ratios obtained versus concentration. The linear correla-tion coefficient (r2) was obtained for each regression curve.Matrix effects and recoveries. Matrix effects and extraction
Downloaded from https://academic.oup.com/jat/article-abstract/34/4/177/785216by gueston 08 February 2018
Journal of Analytical Toxicology, Vol. 34, May 2010
180
recoveries were measured using the approach of Matuszewskiet al. (36).
For matrix effects, plasma obtained from the blood bank ofWestern Infirmary, Glasgow University were taken from sixdifferent human sources and spiked after SPE with analytesof interest at 5 and 100 ng/mL. Neat standards were dilutedin initial mobile phase and injected directly into the LC–MS–MS. Matrix effects of endogenous components were calcu-lated by comparing peak areas of these two sets of standards.
Recoveries were investigated for DIM and its metabolitesusing six different concentrations in plasma across the twocalibrations curve ranges (0.5, 1, 5 ng/mL and 25, 50, 200ng/mL). Internal standards were added after extraction, and re-coveries were calculated by comparison of the peak-area ratiosof the extracted and unextracted standards analyzed underidentical conditions.Limits of detection (LOD) and lower limits of quantitation
(LLOQ). Sensitivity of the method was evaluated by deter-mining the LOD and the LLOQ for each analyte of interest. Thelower calibration curve was used for this purpose (n = 5) com-prising spiked plasma at eight different concentrations (0.1,
0.2, 0.3, 0.5, 0.75, 1, 5, and 10 ng/mL) plus blank and blankspiked with internal standards. LODs and LLOQs were then de-termined from the calibration curve as described previously (1)and calculated using Equation 1 and 2, where YB is the inter-cept, SB is the standard error of the regression line, and m isthe gradient:
YLOD = YB + 3SB Eq. 1
LOD = (YLOD – YB)/m Eq. 2
LLOQ values were calculated using the same method butusing 10 times the standard error of the regression line:
YLLOQ = YB + 10SB Eq. 3
LLOQ = (YLLOQ – YB)/m Eq. 4
Intra- and interassay precision. Three concentrations wereused with each calibration curve as quality controls (QCs) toexamine the intra- and interassay precision. For the lower
Table I. LC–MS–MS Parameters for Diamorphine Metabolites
Parameter DIM 6-MAM MOR M3G M6G NMOR
Precursor ion (m/z) 370 328 286 462 462 272
Product ion(s) (m/z) 310, 328, 268 211, 268,226 201, 229, 268 286, 462 286, 462 254, 229
Quantifier ion (m/z) 370 → 310 328 → 211 286 → 201 462 → 286 462 → 286 272 → 229370 → 328
Qualifier ion (m/z) 370 → 268 328 → 268 286 → 229 462 → 462 462 → 462 272 → 229
SRM transition 310/328 211/268 201/229 286/462 286/462 254/229Quan/Qual
SRM transition 1 (5) 1.6 (3) 1.4 (4) 5.3 (7) 5.6 (10) 2.4 (2)ions ratio (RSD)
Internal standard (IS) DIM-d9 6-MAM-d3 MOR-d3 M3G-d3 M6G-d3 MOR-d3
IS precursor ion (m/z) 379 331 289 465 465 289
IS product ion(s) (m/z) 379 → 316 331 → 211 289 → 201 465 → 289 465 → 289 289 → 201
Sheath gas (AU) 15 25 30 20 20 25
Auxiliary gas (AU) 5 0 0 10 15 10
Capillary 285 300 300 270 270 270temperature (°C)
Collision energy (%) 38 38 38 28 30 35
Retention window no. 6 5 4 1 3 2
RT (min) 18.3 14.1 8.2 3.4 6.9 5
LOD (ng/mL) 0.08 0.1 0.1 0.1 0.1 0.1
LLOQ (ng/mL) 0.2 0.2 0.3 0.3 0.3 0.26
Downloaded from https://academic.oup.com/jat/article-abstract/34/4/177/785216by gueston 08 February 2018

Journal of Analytical Toxicology, Vol. 34, May 2010
181
concentration calibration curve, 0.5, 1, and 5 ng/mL were usedas QCs; and 25, 50, and 200 ng/mL were used as QCs with thehigher concentration calibration curve.
Intraassay precision of DIM metabolites was determinedusing QCs (n = 5) in one day. The calibration curve of each an-alyte of interest was prepared using the two calibration con-centration ranges mentioned previously. The interassay preci-sion was measured in a similar manner to the intraassayprecision on five different days.Stability. Stability was assessed using human plasma spiked
with the analytes of interest at 5 and 100 ng/mL (n = 3). Short-term temperature stability at room temperature was investi-gated for human plasma stored for 1, 2, and 4 h. Freeze-thawstability of analytes of interest was determined after four cycleson consecutive days. Autosampler stability using reconstituted
extracted sample was determined at 24 and 48 h after extrac-tion. Long-term stability was determined for analytes of in-terest at –20°C for periods of 24 h, 48 h, 1 week, and 1 month.Calibration curves were prepared for each batch of samplesusing standards spiked over two calibration curves plus blanksand blanks spiked with internal standards.Specificity. The specificity of the described method was in-
vestigated using a mixture of drugs that are routinely detectedin forensic toxicology cases (cocaine, benzoylecgonine, co-caethylene, ecgonine methyl ester, nitrazepam, 7-aminofluni-trazepam, chlordiazepoxide, diazepam, oxazepam, temazepam,amphetamine, methamphetamine, methylenedioxyam-phetamine, methylenedioxyethylamphtamine, and methylene-dioxymethamphetamine) at a concentration of 400 ng/mL inwhole blood.
In addition, 21 commonly used opioids(codeine, codeine-6-glucuronide, nor-codeine, acetylcodeine, hydromorphine,hydromorphone-3-glucuronide, dihy-drocodeine, dihydrocodeine-6-glucuro-nide, naloxone, naloxone-3-glucuronide,buprenorphine, norbuprenorphine, nor-buprenorphine-3-glucuronide, buprenor-phine-3-glucuronide, oxycodone, noroxy-codone, oxymorphone, dihydromorphine,dihydromorphine-3-glucuronide, dihy-dromorphine-6-glucuronide, and metha-done) were extracted and injected at thesame concentration to test the effect ofthe presence of opioids of similar struc-ture on the specificity and selectivity ofthe described method.
Case samplesPlasma samples were obtained from 23
children receiving DIM at the Accidentand Emergency department of a city-centre pediatric teaching hospital in Ed-inburgh. Ethical approval was obtainedfrom the regional ethics committee bythe participating pediatricians. Writteninformed consent was obtained from theparents of each child, and verbal consentwas obtained from each child.
Twenty-three sets of children’s plasmasamples were analyzed by the optimizedmethod for DIM and metabolites. The me-dian doses of DIM received by childrenwere 3.3 mg in the IVDIM group and were2.8 mg in the INDIM children group.Plasma sample volumes used for analysisranged between 0.1 and 0.25 mL. DIMand metabolites were detected in all casesamples with the exception of NMOR,which tested negative in both studygroups. Children’s body weights were inthe range of 16–59 kg. The ages of thechildren ranged from 4 to 13 years. The
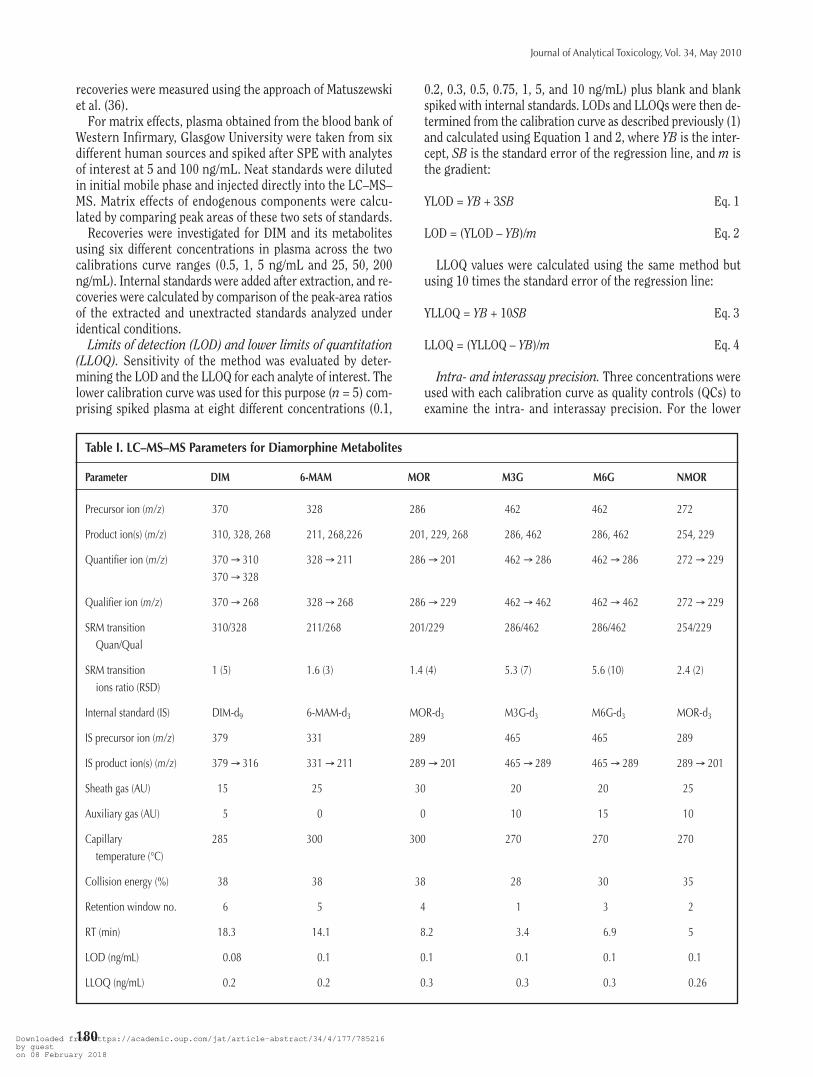
Figure 1. SRM chromatograms of morphine-3-glucuronide, normorphine, and morphine-6-glucuronide at their LLOQ concentrations.
Downloaded from https://academic.oup.com/jat/article-abstract/34/4/177/785216by gueston 08 February 2018

Journal of Analytical Toxicology, Vol. 34, May 2010
182
mean and median body weights were 31 and 33 kg in theIVDIM group and were 33 and 28 kg in the INDIM childrengroup. Plasma samples taken before DIM administration wereall negative for DIM and its metabolites in both the IVDIMand INDIM groups.
Twelve children received IVDIM (dose 0.1 mg/kg), and 11subsequent children had INDIM at the same dose in 0.2 mLnormal saline dripped into both nostrils. Sequential bloodsamples were taken at 2, 5, 10, 20, 30, and 60 min post-DIM ad-ministration. The blood tube was then centrifuged at 4000rpm for 2 min, and plasma was transferred to plain Ependorphtubes that were immediately placed in a –70°C freezer untilanalyzed.
The INDIM dose was administered in0.2 mL of sterile water dropped into bothnostrils over a period of 1 min. At themid-point of the dose (i.e., after 30 s), thetiming was commenced for the subse-quent samples. IVDM was also adminis-tered over 1 min.
Plasma samples were subsequently an-alyzed for DIM, 6-MAM, MOR, M3G, M6G,and NMOR using the method described.
Data analysisPharmacokinetic analysis was con-
ducted using the pharmacokinetic soft-ware package WinNonlin ProfessionalVersion 3.3 (Pharsight, Mountain View,CA). The elimination rate constants (k)for IV and IN plasma data were deter-mined by nonlinear regression analysisof the log-linear decline with a1/weighting (1/concentration), and theelimination half-lives were obtained from0·693/k. Area under the concentration-time curve from 0 to the last sample(AUC0–t) was determined by the trape-zoidal rule and AUC from 0 to infinity(AUC0–∞) from AUC0–t + Cz /k, where Cz isthe final concentration measurement,and k is the elimination rate constant.
Results
Method validationStability. In the present study, stability
was carefully controlled during SPE andLC–ESPI-MS–MS application. Workingstandard solutions were prepared weeklyand kept at –20°C until used. Stability ofheroin and metabolites during the ex-traction and analysis of blank plasmasamples spiked with analytes of interestwere studied. Stability results are listed inTable II. DIM and its metabolites were
subjected to short-term stability tests after 1, 2, and 4 h atroom temperature using an ice/water bath. Also, quick dilutionof plasma samples after thawing without using an ice/waterbath and transfer to SPE directly at room temperature at twoconcentrations (5 and 100 ng/mL) was investigated (Table II).Degradation of DIM was observed after 1, 2, and 4 h at roomtemperature. Most of the DIM was converted to 6-MAM afterstorage for 4 h, and degradation was less than 45% after 2 h, andless than 10% of heroin was hydrolyzed after 1 h using anice/water bath. However, degradation was also investigated atroom temperature without using an ice/water bath, when sam-ples were thawed and diluted quickly with ammonium car-bonate buffer (pH 9.3) and then submitted to SPE. Degradation
Figure 2. SRM chromatograms of morphine, 6-monoacetylmorphine, and diamorphine at their LLOQconcentrations.
Downloaded from https://academic.oup.com/jat/article-abstract/34/4/177/785216by gueston 08 February 2018

Journal of Analytical Toxicology, Vol. 34, May 2010
183
of DIM was limited to less than 4%. This method of extractionwas used for the method validation process and sample analysis.
DIM and its metabolites were found to be stable after fourfreeze-thaw cycles on consecutive days of plasma spiked atconcentrations of 5 and 100 ng/mL and frozen at –20°C. Thismethod was designed to quantify DIM and metabolites infrozen plasma samples, and the stability study was performedunder the same conditions. Analytes of interest were spikedinto blank plasma samples at low and high concentrations(5 and 100 ng/mL). The use of the lower concentration wasaimed at monitoring the degradation of DIM at low levels,which is expected to be encountered in children’s plasma sam-ples due to the low dosage in the current case study. Plasmasamples were then frozen at –20°C. Samples were analyzedafter 24 and 48 h for short-term stability and after 1 week,1 month, and 6 months for long-period stability. DIM and itsmetabolites were stable in both storage conditions.
Plasma sample extracts were reconstituted using the initialmobile phase and subjected to an autosampler stability study.No degradation of analytes of interest was observed after pe-riods of 6, 12, 24, and 48 h in the LC–MS–MS autosampler,which was set at 4°C.Linearity. Two calibration curves were applied together for
this study. Linear calibration curves were obtained with cor-relation coefficients (r2) greater than 0.999 for each analyte ofinterest, which is acceptable according to SOFT (37) andUNODC (38) guidelines.
LOD and LLOQ. LODs and LLOQs of analytes of interestwere determined in duplicate on five different days. Relativestandard deviations (RSD) of heroin and its metabolites werewithin the acceptable limit of method validation (less than 20%of LOD and less than 10% of LLOQ). LODs and LLOQs for an-alytes of interest ranged from 0.08 to 0.1 and 0.2 to 0.3, re-spectively. LOD and LLOQ of the present method are detailed inTable I (Figures 1 and 2).Matrix effects and recoveries. Matrix effects were within the
acceptable limits of method validation (± 20%) using six dif-ferent plasma sources. Percentages above 100% indicate thepresence of ion enhancement, while those below 100% indicatethe presence of ion suppression. The highest ion suppressiondetected was –14%, and the highest ion enhancement detectedwas +18%. Next, recoveries of analytes of interest were deter-mined at six different concentrations (0.5, 1, 2.5, 25, 50, and200 ng/mL) and ranged from 93 to 102, 90 to 102, 90 to 101,85 to 102, 83 to 97, and 92 to 103% for DIM, 6-MAM, MOR,M3G, M6G, and NMOR, respectively. Matrix effect results andrecoveries of analytes of interest are detailed in Tables III andIV, respectively.Precision. Intraassay and interassay precisions were mea-
sured using six different concentrations (0.5, 1, 5, 25, 50, and200 ng/mL) and were based on relative RSD. Precision wasfound to be less than 15% for both intraassay and interassayconditions (Table V). The acceptable limit for method validationis less than ±15%, except at the LLOQ value where precision
Table II. Stability of Heroin and Its Metabolites in Spiked Plasma Samples
Nominal Mean Recovery % (RSD %)Storage Time of ConcentrationConditions Storage (ng/mL) DIM 6-MAM MOR M3G M6G NMOR
Directly 4 h 5 52 (6) 134 (4) 113 (4) 102 (6) 114 (10) 115 (10)room temperature 100 39 (10) 150 (7) 115 (7) 102 (6) 117 (15) 94 (7)
2 h 5 83 (6) 113 (7) 104 (8) 101 (6) 99 (10) 108 (4)100 70 (11) 123 (3) 108 (3) 102 (9) 96 (8) 108 (13)
1 h 5 91 (5) 104 (7) 108 (5) 100 (1) 102 (11) 105 (9)100 93 (6) 109 (2) 99 (7) 102 (2) 96 (6) 97 (7)
0.5 h 5 96 (11) 94 (1) 97 (4) 101 (3) 103 (3) 92 (11)100 98 (2) 102 (3) 97 (9) 96 (6) 101 (11) 98 (5)
Freeze- 4 cycles 5 95 (7) 109 (5) 95 (8) 94 (5) 101 (2) 90 (2)and-thaw
100 92 (5) 108 (4) 98 (7) 95 (10) 103 (7) 112 (11)
Autosampler 48 h 5 97 (6) 100 (3) 100 (8) 99 (1) 102 (9) 99 (5)100 94 (2) 97 (11) 94 (9) 104 (4) 98 (3) 97 (7)
24 h 5 102 (3) 95 (9) 106 (6) 101 (7) 99 (3) 102 (9)100 98 (2) 104 (7) 101 (8) 101 (4) 95 (5) 99 (10)
Freezer –20°C 48 h 5 98 (7) 99 (12) 98 (11) 99 (11) 101 (8) 102 (7)100 95 (2) 97 (3) 96 (6) 101 (6) 95 (2) 101 (8)
Week 5 95 (8) 109 (5) 101 (4) 95 (9) 105 (3) 102 (11)100 103 (8) 101 (2) 100 (8) 93 (8) 108 (3) 96 (6)
Month 5 98 (11) 96 (2) 102 (11) 105 (2) 90 (7) 101 (2)100 95 (4) 106 (7) 94 (8) 91 (12) 103 (8) 95 (3)
6 months 5 94 (13) 99 (4) 100 (11) 92 (1) 94 (3) 96 (5)100 97 (4) 94 (4) 93 (5) 92 (2) 93 (6) 95 (12)
Downloaded from https://academic.oup.com/jat/article-abstract/34/4/177/785216by gueston 08 February 2018

Journal of Analytical Toxicology, Vol. 34, May 2010
184
should not exceed ± 20% (38–41).Specificity and selectivity. Specificity and selectivity of the
optimized method were examined using a mixture of the mostcommon drugs detected in forensic cases. Blank plasma andblank plasma spiked with internal standards were also includedwith each batch to investigate the effects of unseen endogenouscomponents on the ESPI-MS–MS responses. In addition, 23plasma blank samples provided for the pharmacokinetics ofDIM in children for this study were analyzed with the opti-mized method. Clean base lines with little or negligible matrixcomponents were found with no interferences detected from theother common drugs.
Case samplesIVDIM group. Twelve subjects received intravenous DIM (6
male and 6 female). Table VI and Figure 3 summarize the an-alytical data obtained for these cases. In most IVDIM subjects,the maximum measured concentrations of DIM, 6-MAM, andMOR were in the first samples taken after dosing at 2 min, ex-cept for cases 2, 4, and 5 which were taken at 5 min and case3 which was taken at 10 min. In case 2, no 2-min sample wasprovided and the highest concentrations were measured inthe 5-min sample. M3G and M6G reached their peak concen-trations 20 and 30 min after DIM administration, respectively.
Both DIM and 6-MAM were detected in all IVDIM samplescollected after 2–20 and 2–30 min, respectively. In some cases,trace concentrations of DIM and 6-MAM of less than 5 ng/mLwere detected 30–60 min after the DIM dose. Plasma concen-trations of DIM were measurable in many cases after 20 and 30min with concentrations in the range of 0.8–12 and 0.2–0.4ng/mL, respectively. In addition, DIM was detected in fourcases (4, 9, 10, and 19) after 60 min with concentrations in therange 0.5–1 ng/mL. The mean and median peak concentrationsof DIM in IVDIM were 706 and 364 ng/mL, respectively, whichwere detected 2 min after DIM administration.
6-MAM tested positive in many IVDIM cases after 30 min
with concentrations in the range 1–5 ng/mL and was detectedin six cases after 60 min with concentrations in the range of0.3–3 ng/mL. The mean and median peak concentrations of 6-MAM were 522 and 205 ng/mL, respectively, 2 min after DIMadministration.
MOR was detected in all cases, with the exception of thelast sample collected from case 7 at 60 min. The mean andmedian peak concentrations of MOR were 61 and 33 ng/mL2 min after DIM administration. The peak plasma concentra-tion in cases 3, 4, and 5 was delayed to 5 min. As no 2-minsample was provided for case 2, the highest MOR plasma levelwas found in the 5-min sample. Most cases showed a faster rateof MOR decrease between 2 and 5 min than after 5 min, whichis likely to reflect the initial distribution phase. In most cases,the plasma MOR concentration in the last sample (at 60 min)was higher than 4 ng/mL, with exceptions being cases 5 and 6,which had MOR levels of 0.5 and 1 ng/mL, respectively.
M3G was detectable in all IVDIM samples taken after DIMadministration with concentrations ranging from 3 to 757ng/mL but reached its maximum concentration after 20 min.The mean and median peak concentrations of M3G in IVDIMcases were 372 and 331 ng/mL, respectively. No change inM3G concentration occurred between 20 and 30 min afteradministration.
The average plasma concentration versus time profile forM6G followed the same pattern as M3G but with lower con-centrations. M6G was only detectable in three of the first sam-ples taken after IVDIM with concentrations of 0.4, 9, and 2ng/mL in cases 1, 4, and 6, respectively. The concentration ofM6G then increased in all cases to reach the peak concentrationat 20–30 min, but little or no change was observed at 60 min.M6G was detectable in the rest of the cases, apart from case 7,with concentrations ranging from 0.5 to 8 ng/mL after 5 min.INDIM group. Eleven children received INDIM (5 male and
6 female) for their treatment. Table VII and Figure 4 summa-rize the analytical data obtained for these cases. DIM and 6-
Table III. Matrix Effects From Six Different Plasma Sources
Nominal Matrix Effect % (RSD%, n = 3)Concentration
Drug (ng/mL) Source 1 Source 2 Source 3 Source 4 Source 5 Source 6
DIM 5 103 (2) 101 (2) 98 (5) 95 (5) 95 (3) 96 (5)100 104 (5) 100 (7) 97 (3) 99 (8) 106 (4) 103 (8)
6-MAM 5 95 (5) 90 (3) 111 (3) 92 (2) 100 (3) 108 (2)100 89 (11) 87 (9) 92 (4) 86 (3) 92 (6) 86 (2)
MOR 5 98 (3) 88 (5) 86 (11) 82 (4) 86 (6) 90 (7)100 96 (4) 99 (5) 94 (4) 97 (3) 118 (4) 91 (9)
M3G 5 99.5 (4) 91 (1) 95 (27) 91 (2) 97 (7) 91 (4)100 104 (5) 95 (0.5) 98 (3) 112 (4) 107 (3) 108 (0.6)
M6G 5 108 (5) 95 (2) 96 (1) 95 (3) 92 (4) 93 (2)100 102 (9) 101 (2) 100 (7) 97 (6) 102 (5) 106 (7)
NMOR 5 107 (7) 117 (4) 112 (4) 108 (2) 114 (3) 111 (10)100 104 (11) 109 (10) 94 (4) 115 (13) 111 (4) 105 (5)
Downloaded from https://academic.oup.com/jat/article-abstract/34/4/177/785216by gueston 08 February 2018

Journal of Analytical Toxicology, Vol. 34, May 2010
185
MAM were detected in all INDIM cases from the first sampleuntil 10 and 20 min after DIM administration, respectively. Insix cases, the plasma concentrations of DIM ranged from 0.2 to4 ng/mL 20 min after DIM administration. Three cases werefound positive for DIM with plasma levels lower than 1 ng/mLat 30 min, and only one case had a concentration of DIM at theLLOQ of 0.2 ng/mL at 60 min. Maximum DIM concentrationswere observed in the first samples when collected 2 min afteradministration in most subjects (Figure 5), although in fourcases, maximum observed DIM concentrations were in the 5-min samples. However, levels of DIM in plasma were very sim-ilar at 2 and 5 min after administration. The highest DIM con-centration detected was 43 ng/mL (case 22 after 2 min). The
mean and median peak concentrations of DIM were 17 and 15.5ng/mL 2 min after administration.
6-MAM concentrations in the INDIM group were lower thanthose of DIM in all cases. Maximum observed plasma concen-trations of 6-MAM were in the 5-min samples with a slow rateof decline after the first sample until 6-MAM disappeared by 60min. 6-MAM was still detectable in all 20-min plasma sampleswith the exception of cases 16 and 22 but was only detectablein three cases at 30 min at concentrations ranging from 1.5 to2 ng/mL. The mean and median peak concentrations of 6-
Table IV. Matrix Effects and Recoveries of Heroin and itsMetabolites in Spiked Plasma Samples (n = 5)
Nominal MatrixConcentration Effects Recovery
Analyte (ng/mL) (RSD %) (RSD %)
DIM 0.5 94 (8) 93 (13)1 89 (2) 92 (3)5 98 (1) 97 (6)
25 102 (4) 94 (13)50 95 (8) 102 (9)
200 98 (3) 97 (9)
6-MAM 0.5 93 (6) 95 (8)1 98 (7) 90 (4)5 94 (1) 95 (10)
25 107 (4) 102 (2)50 92 (1) 101 (9)
200 101 (7) 99 (10)
MOR 0.5 84 (4) 90 (14)1 92 (2) 96 (2)5 94 (12) 98 (8)
25 98 (5) 101 (6)50 93 (10) 99 (11)
200 107 (11) 98 (10)
M3G 0.5 99 (13) 92 (8)1 93 (2) 85 (10)5 90 (4) 96 (9)
25 97 (9) 103 (7)50 107 (2) 95 (9)
200 94 (6) 102 (11)
M6G 0.5 106 (12) 90 (13)1 96 (2) 83 (13)5 92 (6) 93 (10)
25 105 (3) 96 (7)50 100 (3) 96 (4)
200 93 (8) 97 (7)
NMOR 0.5 91 (12) 93 (6)1 101 (2) 92 (10)5 111 (14) 103 (9)
25 108 (10) 101 (8)50 96 (7) 93 (9)
200 93 (8) 97 (8)
Table V. Intraassay and Interassay Precision of Heroinand its Metabolites in Spiked Plasma Samples
Nominal Intraassay* Interassay†
Concentration (ng/mL) (ng/mL)Analyte (ng/mL) (RSD %) (RSD %)
DIM 0.5 0.51 (5) 0.5 (5)1 1.2 (10) 1 (11)5 4.7 (7) 4.9 (8)
25 24 (6) 25 (2)50 48 (5) 50 (6)
200 197 (4) 200 (2)
6-MAM 0.5 0.49 (7) 0.5 (9)1 1.1 (10) 1 (9)5 4.9 (5) 4.8 (7)
25 24 (5) 25 (5)50 51 (4) 48 (6)
200 203 (5) 200 (1)
MOR 0.5 0.51 (10) 0.5 (11)1 1.1 (6) 1 (10)5 4.7 (10) 5 (5)
25 25 (5) 25 (4)50 48 (7) 48 (8)
200 198 (5) 199 (1)
M3G 0.5 0.49 (7) 0.5 (12)1 1.1 (10) 1 (3)5 4.9 (9) 5 (3)
25 24 (3) 25 (6)50 47 (7) 49 (4)
200 203 (3) 201 (1)
M6G 0.5 0.49 (9) 0.5 (6)1 1.1 (6) 1 (11)5 4.9 (10) 4.9 (5)
25 25 (6) 25 (5)50 47 (6) 48 (7)
200 196 (2) 201 (0.6)
NMOR 0.5 0.54 (6) 0.5 (8)1 0.98 (9) 1 (11)5 4.8 (5) 4.6 (10)
25 25 (4) 25 (6)50 53 (10) 50 (7)
200 205 (2) 199 (2)
* Calculated from average measured concentrations for replicate analyses (n = 5)on the same day.
† Calculated from average measured concentrations for replicate analyses (n = 5)on five different days.
Downloaded from https://academic.oup.com/jat/article-abstract/34/4/177/785216by gueston 08 February 2018

Journal of Analytical Toxicology, Vol. 34, May 2010
186
MAM were 7.4 and 6 ng/mL after 5 min, respectively.MOR was detected in all samples collected at 5–60 min after
DIM administration. Only four cases had detectable levels ofMOR in the first sample collected at 2 min with a concentrationrange below the LLOQ to 3 ng/mL, with a mean concentrationof 0.6 ng/mL. The maximum observed plasma concentration ofMOR in this group was detected after 20 min, and little changewas observed until the curve started to decline in samples col-lected after 60 min. The mean and median peak concentrationsof MOR were 5.5 and 4 ng/mL, respectively, at 10 min after DIMadministration. Little change in the MOR level occurred be-tween 10 and 20 min with mean and median concentrations inthe range of 5.4–5.5 and 4–5 ng/mL, respectively. The plasmaMOR concentrations in the last samples, collected at 60 min,ranged from 0.8 to 8 ng/mL with mean and median concen-trations of 3 and 2 ng/mL, respectively.
M3G levels were detectable in all cases (concentrationsranged from 0.2 to 250 ng/mL) from the second sample takenafter 5 min until the last sample at 60 min with the exceptionof cases 16 and 18, which tested negative after 5 min of the DIMdose. Plasma M3G levels rose after 5 min of the DIM dose untilthe end of sampling at 60 min in a straight line, which is sup-posed to continue rising. After 5 min, all detectable M3G levelswere above the LLOQ with concentrations equal to or higherthan 1 ng/mL with the exception of case 17 (0.2 ng/mL). In case15, high levels of M3G were observed from the second samplecollected (129 ng/mL); and the maximum measured concen-tration was in the 20-min sample (250 ng/mL), which was thehighest plasma level of M3G determined in this group. Themean and median concentrations of M3G at 60 min after DIMadministration were 80 and 86 ng/mL, respectively.
The mean plasma concentration versus time profile of M6Ghad the same rising pattern as M3G but with lower concen-trations, and M6G was detectable after 20 min in all cases.M6G was detectable in four samples at 10 min with concen-trations of 0.5, 1, 0.8, and 0.7 ng/mL in cases 11, 12, 15, and22, respectively. Cases 11 and 21 had levels of M6G lowerthan the LLOQ at 2 min, but both had a concentration of 3ng/mL at 5 min. Also, the peak plasma concentration of M6Gwas not reached before the end of sampling at 60 min. Thehighest plasma concentration for M6G was found in case 12(14 ng/mL at 60 min). The mean and median concentrationsof M6G at 60 min after DIM administration were 7 and 8ng/mL, respectively.
Comparison between IVDIM and INDIMConcentrations of DIM metabolites were found to depend on
the route of administration. The concentrations of DIMmetabolites after INDIM were lower than after IVDIM at thesame dose and body weight and were in the ranges of 190–2062ng/mL and 2–43 ng/mL for IVDIM and INDIM, respectively. Themedian peak concentrations of analytes of interest after IVDIMwere achieved at 2 min for DIM, 6-MAM, and MOR, and at 20and 30 min for M3G and M6G, respectively. After INDIM, peakconcentrations were achieved for DIM at 2 min, but metabo-lites achieved their peak concentrations later: 6-MAM at 5 min,MOR at 10 min, and the glucuronides beyond the study timewindow.
Plasma levels of DIM and its initial metabolite 6-MAM werefound to share some similarities; DIM was higher than 6-MAMuntil 5 min in IVDIM and INDIM, but 6-MAM exceeded DIMafter 10 min until both analytes were completely eliminatedfrom the plasma. By contrast, some differences were found inrelative analyte concentrations between the two groups. Theplasma concentration of 6-MAM was 74% of the DIM concen-tration after 2 min of IVDIM compared to 30% of the DIMlevel after INDIM. The percentages at 5 min were 68% and73%, respectively, and at 10 min were 140% and 150%, re-spectively.
Interestingly, INDIM achieved similar DIM metabolite con-centrations to IVDIM but at later times because of a delay in ab-sorption and differences in metabolism in the nasal or gastricmucosa compared to IVDIM. For example, a mean DIM plasmalevel of 4 ng/mL was achieved following both IVDIM and INDIMadministration after 10 or 20 min, respectively. Also, the meanpeak concentration of 6-MAM after INDIM occurred at 5 minpost-dose and was the same as the mean plasma concentrationafter IVDIM at 20 min post-dose and the plasma concentrationsof M6G at 30 and 60 min after INDIM (3.5 and 7.4 ng/mL, re-spectively) were close to those at 5 and 10 min after IVDIM (3and 8.6 ng/mL, respectively).
DIM, 6-MAM, and MOR were detected simultaneously for thefirst 10 min in the IVDIM group. 6-MAM exceeded DIM after 10min, and MOR exceeded DIM and 6-MAM after 20 min whenMOR levels were 2- and 3-fold higher than DIM and 6-MAMconcentrations, respectively. In the INDIM group, the plasmaconcentration of MOR was higher than DIM and equal to 6-MAM after 10 min. The same results were obtained after 20 minof INDIM, but the level of MOR was 5 and 2.5 times higher thanDIM and 6-MAM. The mean plasma concentration of MOR 30min after INDIM (5.3 ng/mL) was similar to that obtained 60min after IVDIM (5.4 ng/mL).
In the IVDIM group, 2 min after DIM injection, the totalMOR (TMOR) concentration was made up by free morphine(FMOR, 55%), M3G (44%), and M6G (1%). After 5 min, FMORdecreased to only 15% of TMOR and at 60 min accounted forless than 2% of TMOR. M3G accounted for 83% of total MORafter 5 min of DIM dose and 92% at 60 min. FMOR and M3Gaccounted for 33% and 67% of TMOR at 2 min after INDIM, re-spectively. The M3G plasma level increased sharply after 5 minto become a major portion of TMOR, which was the same as inthe intravenous group. FMOR and M3G accounted for 3.3%and 89% of TMOR, respectively.
M6G was the minor DIM metabolite in both groups. M6Gwas formed early after 2 min of IVDIM and accounted for 1%of TMOR. After that, the percentage of M6G increased until itexceeded that of FMOR. M6G accounted for 6.3% of TMORand was three times higher than FMOR at 60 min. The samepattern was observed after INDIM, but M6G accounted for 1%of TMOR after 10 min, and M6G accounted for approximately8% of TMOR and was more than double FMOR at 60 min.
The ratios of M6G/MOR, M3G/MOR, and M3G/M6G werecalculated for both groups. Although the peak concentrationsof M6G and M3G were not determined in the intranasal group,the ratios of M3G/M6G were close to each other. They wereabout 50 at 2 or 5 min after IVDIM and INDIM, respectively,
Downloaded from https://academic.oup.com/jat/article-abstract/34/4/177/785216by gueston 08 February 2018

Journal of Analytical Toxicology, Vol. 34, May 2010
187
and then declined to 14 and 11, respectively, at 60 min. Also,the same ratio of M6G/MOR was obtained at 30 and 60 minafter IVDIM and INDIM, respectively. It is expected that theM6G/MOR ratio would be the same in both INDIM and IVDIMgroups after 60 min. The ratio of M3G/MOR increased withtime in both study groups. However, the ratio of M3G/MOR at60 min after IVDIM was twice that obtained with INDIM due tothe delayed peak concentration with INDIM.
Pharmacokinetic dataThere was difficulty in obtaining the half-life and other phar-
macokinetic data from the plasma time course of DIM after in-travenous and intranasal routes of administration. For DIM and6-MAM, only two points were used to define elimination rate(λz), or there was a very poor fit in some cases. The experi-mental data were therefore used to calculate AUCs to the lasttime point (AUCall). A summary table of the mean values of themain pharmacokinetic parameters is given in Table VIII.
Table VI. Intravenous Diamorphine Cases
Measured Concentration (ng/mL) Measured Concentration (ng/mL)Time Time
Patient No. (min) DIM 6-MAM MOR M3G M6G Patient No. (min) DIM 6-MAM MOR M3G M6G
1 0 0 0 0 0 02 2060 1880 223 50 0.45 137 121 64 330 4
10 19 30 54 680 1720 2 6 18 706 3530 0.6 3 17 757 5660 0 0.3 8 415 34
2 0 0 0 0 0 02 0 0 0 0 05 971 529 192 127 4
10 61 25 47 342 1620 12 9 31 318 1930 4 3.5 17 312 3160 0 0 7 241 19
3 0 0 0 0 0 02 228 80 14 74 05 37 23 18 167 0.8
10 9 11 19 307 520 0 3 15 343 1430 0 2 15 373 1260 0 0 9 359 19
4 0 0 0 0 0 02 430 99 20 98 95 283 116 44 403 5
10 27 38 38 582 1420 12 21 15 574 2330 2 5 10 480 2060 1 1 7 502 19
5 0 0 0 0 0 02 364 57 14 44 05 61 11 22 284 3
10 10 7 16 453 820 1 1 8 452 2030 0 0 4 383 2060 0 0 1 386 27
6 0 0 0 0 0 02 1110 487 42 54 25 125 150 24 161 3
10 9 6 11 246 720 0 1 9 245 1230 0 0 4 203 1360 0 0 0.5 171 11
7 0 0 0 0 0 02 937 768 32 3 05 24 26 8 61 0
10 5 10 5 83 1.220 4 11 3 191 1230 0 0 1.5 101 1460 0 0 0 106 13
8 0 0 0 0 0 02 260 237 22 10 05 27 34 7 118 1.4
10 4 12 9 203 420 4 9 7 310 1030 0.2 2 5 177 860 0 1 4 117 12
9 0 0 0 0 0 02 1600 1710 227 82 05 198 237 51 374 0.5
10 55 144 37 595 920 6 14 15 588 2330 0.5 6 9 583 2860 0.8 3 7 519 22
10 0 0 0 0 0 02 324 106 15 51 05 85 45 8 258 8
10 29 18 8 454 1320 4 3 7 459 1830 0.4 1 7 407 1760 0.1 0 4 311 12
19 0 0 0 0 0 02 190 205 34 6 05 36 64 22 41 1
10 0.6 21 15 80 320 0.8 6 9 107 1230 0.7 5 8 113 1660 0.5 2.5 5 98 16
20 0 0 0 0 0 02 255 118 31 8 05 58 40 20 91 4
10 6 18 15 154 620 0 5 14 172 2230 0 2 11 142 2360 0 2 12 114 21
Downloaded from https://academic.oup.com/jat/article-abstract/34/4/177/785216by gueston 08 February 2018

Journal of Analytical Toxicology, Vol. 34, May 2010
188
Discussion
Method validationAn LC–MS–MS method has been developed and found to be
sufficient for the analysis of DIM and its metabolites at lowerLLOQs than in previously published methods. In most ofthese, the LLOQ of DIM was greater than or equal to 1 ng/mL(2,42–49), and an LOD of 0.5 ng/mL was reported in twostudies using LC–APCI-MS (50) and GC–MS (51), which wasfound to be sufficient with adult subjects. The situation isdifferent with children because very low levels in plasma fromINDIM cases are expected in the range 1–10 ng/mL. Thismethod was not validated to be a routine method, which re-quired fast separations and short run-times that are not nec-essarily for some applications such as pharmacokineticsstudies.
Two calibration curves were required because the methodwas to be applied to the determination of DIM and its metabo-lites in plasma from children, which was carried out as a blindstudy. The concentrations of DIM or 6-MAM to be expected inchildren after DIM intake were not available in the literaturebut were predicted to be very low. A calibration curve ex-tending to a low level was crucial for obtaining accurate re-sults and also to avoid false-negative results. In the presentstudy, LOD and LLOQ of DIM and its metabolites were in-cluded within the calibration range, which helped in exam-ining the method sensitivity at the LLOQ with each samplebatch. This is one of the advantages of this methods over pre-viously reported methods.
In the current study, five human plasma samples were usedfor the investigation of present matrix effects and to calculaterecovery of analytes of interest. Both ion suppression and en-hancement were detected, but no effects on DIM and metabo-lites ionization were observed. This was accounted for by theuse of SPE, which provided clean extracts, the use of internalstandards for each DIM metabolite with the exception ofNMOR, which was not commercially available, and finally agood separation of analytes of interest, which made it easy to
established separate retention window for each analyte. Matrixeffects were examined at low levels, 0.5 ng/mL, which is alsothe concentration used to measure the intra- and interassayprecision of the optimized method. Recoveries were calculatedafter excluding matrix effects. Good recoveries have been ob-tained in the current study, which compared well with previousmethods.
Matrix effects are generated from non-drug related com-pounds eluting at the same time as an analyte, whereas cross-talk usually results from co-elution of an analyte with one ormore other drug-like substance, which fragment to give thesame (or similar) product ions used for identification. Cross-talk phenomena are not specifically matrix effects (52,53) butoften interfere with the quantification of the analyte. This so-called isobaric metabolic interference can also be the result ofin-source contamination or be due to degradation products ofphase I and II metabolites (53–55).
In the current procedure, similar product ions for 6-MAM,MOR, and their deuterated internal standards have been used,but this was not found to affect identification and quantifica-tion due to the differences in parent ion molecular weights.Consistent with the current work, these fragmentations havebeen used for identification and quantification of 6-MAM, MOR,and their deuterated internal standards in many previousstudies (56–58).
In the current study, despite the use of a selective mass an-alyzer the purity of internal standards was checked and foundto be free from interference; and their fragmentations werechecked by investigating the ratio between analytes and in-ternal standards. This was checked by injection of similaramounts (e.g., 25 ng/mL) of both standards and their internalstandards and calculating the intensity ratio of their ions. Aratio of one is expected in most cases, but if the ratio is higherthan one the increase could be from interfering ions from theinternal standard (59). Also, the retention time is a crucialidentification power in all chromatography systems, which isrequired to be identical to reference standards or positive con-trols that should be included in the same run; reliable and re-peatable retention time should be examined intra- and inter-
laboratory (60).Problems of co-elution are more critical
when analytes not only share the sameprecursor ion but also have the samesingle product ion. This was encounteredwith morphine glucuronide and hydro-morphone-3-glucuronide in our previousstudy (1), which have the same precursorion at m/z 462 and the same singleproduct ion at m/z 286. In that study,many of the analyzed drugs share thesame precursor ion such as MOR, hydro-morphone, and norcodeine, which allhave a pseudo-molecular ion at m/z 286.Despite the use of a selective mass ana-lyzer, these analytes also share some oftheir product ion(s), which affect the iden-tification and quantification of thesedrugs, especially if these shared product
Figure 3. Semi-log plots of mean plasma concentrations of diamorphine metabolites versus time after ad-ministration in 12 children following intravenous diamorphine.
Time (min)
Conc
entra
tion(
ng/m
L)
Downloaded from https://academic.oup.com/jat/article-abstract/34/4/177/785216by gueston 08 February 2018

Journal of Analytical Toxicology, Vol. 34, May 2010
189
ions are used as quantifier or qualifier ions, which may result indifferent SRM transition ratios. Further fragmentation to MS–MS–MS (MSn=3) can be used to produce a new product ion (61),but this was at the expense of sensitivity and would not solve theproblem of co-elution of the drugs. In this case, retention timecan play a crucial role in identification in these cases, and ana-lytes should be fully separated from each other. In addition tochromatographic separation, sample preparation also is an im-portant issue to eliminate unwanted drugs and interference(53,62). It has been suggested that derivatizing agents can beused to shift analytes from the co-elution zone to be fully sep-arated but these would lose the advantage of LC–MS in being
able to analyze metabolites directly (63,64).Peters et al. (65) recommended that method specificity can
be measured by analyzing blank samples spiked with possiblyinterfering compounds at their highest expectable concentra-tions. This approached was used in the current study, whichalso used in our previous reports (1,66,67).
In the current study, it was found that stability was the keyfactor in validation of a method for the accurate determinationof DIM. That was the conclusion of a previous study by Gold-berger et al. (42). Storage conditions and plasma sample han-dling are important because specimens should be frozen im-mediately after collection.
Table VII. Intranasal Diamorphine Cases
Measured Concentration (ng/mL) Measured Concentration (ng/mL)Time Time
Patient No. (min) DIM 6-MAM MOR M3G M6G Patient No. (min) DIM 6-MAM MOR M3G M6G
11 0 0 0 0 0 02 15.5 13 3 3 05 14 15 6 5 0.2
10 4 8 6 14 0.520 0.6 4.5 8 35 230 0 2 8 47 360 0 0 8 87 8
12 0 0 0 0 0 02 30 10 0 0 05 23 16 5 1 0
10 7 8 14 34 120 0 2 5 79 530 0 0 5 101 760 0 0 3 160 14
13 0 0 0 0 0 02 17 3.5 0 0 05 10 9 6 2.4 0
10 6 7 10 12 020 4 3 7 21 2.230 0 0 6 29 360 0 0 4 49 8
14 0 0 0 0 0 02 2.5 0 0 0 05 15 9 3.5 1 0
10 10 11 5 21 020 0 2 5 47 0.430 0 1.5 3 73 0.660 0 0 2 86 1.4
15 0 0 0 0 0 02 3.4 26 0 2 05 3.4 8 4 129 0
10 2.5 3 4 147 0.820 0.6 3 5 250 230 0 0.7 3.7 121 5.060 0 0 3.4 91 3.5
16 0 0 0 0 0 0.02 7.4 0.3 0.7 0 0.05 8 1.7 0.8 0 0.0
10 3.8 0 2.2 2 0.0
20 1 0 2.1 17 230 0.5 0 1.5 45 360 0.2 0 0.8 53 8
17 0 0 0 0 0 02 5 7 0 0 05 6 7 2 0.2 0
10 1 5 6 11 020 0 2 12 32 130 0 1 10 37 2.260 0 0 1.3 46 4
18 0 0 0 0 0 02 12 3.2 0.2 0 05 12 5 1.3 0 0
10 5 10 3.4 2 020 0.2 4 8 50 0.330 0 0 5 69 260 0 0 4 87 3
21 0 0 0 0 0 02 17 10 1 15 15 5 6 3 32 3
10 0 2.4 4 40 420 0 0.5 2.3 54 430 0 0 2 54 760 0 0 2 81 13
22 0 0 0 0 0 02 43 8 0 0 05 12 5 5 6 0
10 0.7 2 3 19 0.720 0 0 1.3 35 330 0 0 1.2 50 460 0 0 0.8 91 13
23 0 0 0 0 0 02 12 4 2 1 05 6 4 3.4 2 0
10 3 2 3.4 7 020 1.2 1.3 3.2 21 130 1 0 3 33 260 0 0 1.7 44 5
Downloaded from https://academic.oup.com/jat/article-abstract/34/4/177/785216by gueston 08 February 2018

Journal of Analytical Toxicology, Vol. 34, May 2010
190
Case samplesThe short period of sampling time (60 min) has limited the
pharmacokinetic parameters for MOR and its glucuronidesbecause the elimination profile was poorly defined; therefore,elimination half-life, clearance, and volume of distributioncould not reliably determined. In previous reports (17,68),samples were collected from time 0 to 24 h following DIM ad-ministration, which provides more data points for the elimi-nation phase of MOR and its glucuronides. However, it was dif-ficult to obtain additional plasma from children because theyoften moved through hospital sections to complete their treat-ment, and the invasive procedure of obtaining blood samplesposed ethical and practical challenges for both children and
nurses at the Accident and Emergency department.However, the numbers of patients included in the current
study were reasonable compared with published pharmacoki-netic studies following DIM administration. The first sampleswere obtained at 2 min, and these usually had the highestmeasured concentrations of DIM, indicating that peak con-centrations of DIM occurred no later than 2 min after admin-istration. In many pharmacokinetic studies, sampling startedafter 5 min, which may be insufficient in providing a full de-scription of the pharmacokinetic profile of DIM (17,69).
In the present study, pharmacokinetic parameters such asCmax, Tmax, and AUCall were calculated for the IVDIM and INDIMstudy groups. INDIM AUC profiles were lower than those ob-
tained with IVDIM subjects; for example,AUC of DIM after INDIM (Table VIII) wasonly 1.6% of the AUC obtained withIVDIM. This may suggest rapid hydrolysisof DIM following INDIM. DIM is known toconvert rapidly to 6-MAM and MOR afterIVDIM. 6-MAM and MOR were included astarget analytes but were found to havelower AUCs after INDIM: only 5% and28% during the first hour after adminis-tration compared to that of IVDIM, re-spectively.
Significant losses of DIM following in-tranasal administration due to absorptioninto the nasal mucosa or swallowing havebeen reported (28) and may lead to a de-layed appearance in plasma and to most ofthe DIM being hydrolyzed to 6-MAM andMOR before reaching the blood circulation.
In the current study, DIM and 6-MAMconcentrations were similar at 2 and 5min after INDIM, indicating that the Tmaxwas between 2 and 5 min. This may be ex-plained by the delay of reaching the bloodcirculation after INDIM between DIM ab-sorption by nasal mucosa and that ofswallowing. 6-MAM was also found tohave the same trends of formation andelimination as its parent drug, and bothhad very high hydrolysis rates shortlyafter DIM administration. Traces of bothDIM and 6-MAM could be detected up to60 min after IVDIM, although most hadhydrolyzed by 20 min following INDIM.
MOR is generated from 6-MAM andseemed to have a plateau period between20 and 30 min following IVDIM. Levels ofM3G after IVDIM were lower than those ofMOR at its Tmax (2 min) but were higherthan MOR levels at their own peak timeswith INDIM cases. Both had similar meanlevels at 5 min after INDIM administrationin most cases. This indicates that someMOR was conjugated in the liver to formM3G and M6G. M6G may achieve only
Figure 4. Semi-log plots of mean plasma concentrations of diamorphine metabolites versus time after ad-ministration in children following intranasal diamorphine.
Figure 5. SRM Chromatogram for diamorphine detected in real plasma case samples.
Time (min)
Conc
entra
tion(
ng/m
L)
Downloaded from https://academic.oup.com/jat/article-abstract/34/4/177/785216by gueston 08 February 2018

Journal of Analytical Toxicology, Vol. 34, May 2010
191
very low concentrations, lower than the LLOQ of the optimizedmethod because it was only detected in one case. This may bedue to the longer half-life and duration of morphine glu-curonides in blood, which need at least 30 min after the MORpeak concentration to reach their own Cmax. That can be seenclearly from two routes of DIM administration. The percentagesof AUC within the first hours of M3G and M6G following INDIMwere 18% and 21% of that observed with IVDIM cases, respec-tively, which meant that less than 22% of MOR and its metabo-lites were metabolized in the first hour after INDIM.
In the current study, the plasma concentration versus timeprofiles of the two morphine glucuronides were parallel fol-lowing both routes of administration, while the curves forMOR and M6G crossed over. The crossover point was foundafter 20 and 40 min of the IVDIM and INDIM routes of admin-istration (Figures 3 and 4), respectively. In IVDIM, the MORlevel decreased after the MOR peak concentration at 2 min. Bycontrast, the MOR level increased to reach its peak concentra-tion and plateau period in INDIM groups.
The mean AUC values following IVDIM and INDIM werecomparable with previous studies detailed in Table IX. In thepresent study, the AUC of DIM was 150 and 2.1 µg/L·h and was34 and 1.8 µg/L·h for 6-MAM after IVDIM and INDIM, respec-tively. AUC is dose-dependent and also depends on the time ofsample analysis. The latter factor is a limitation of the currentstudy because samples were collected for only an hour fol-lowing administration.
The AUC of 6-MAM obtained in the current study was lowerthan the AUC of DIM with both routes of administration. Thiscan be explained by the improved LLOQ for DIM in the currentmethod, which enabled DIM to be measured at lower concen-trations and over a longer time period. Also, it has been foundthat the concentration of DIM was higher than that of 6-MAMfollowing both IVDIM and INDIM in the first two samples,which also had the highest concentrations of each analyte.
Analgesia produced by DIM is usually attributed to its activemetabolite, MOR. The median MOR level followed IVDIM was33 ng/mL in the present study, which was considered enoughto produce analgesia (Table IX). Also, the level of MOR re-ported in previous work after INDIM and found to produceanalgesia was also found with INDIM cases in the presentstudy. Peak concentrations of MOR were in the range of 6.2–26
ng/mL. In the study by Cone et al. (17), levels of MOR rangedfrom 2.6 to 13.4 ng/mL at 1 h after administration and were inagreement with Skopp et al. (28), who found that the Cmax ofMOR ranged between 6.1 and 13.2 ng/mL after INDIM.
The presence of M6G at later stages was reported to be re-sponsible for DIM analgesia and found to be more effective thanMOR (70). The levels of DIM at 1 h after administration were re-ported following oral administration and DIM infusion at highDIM doses (56 and 40 mg), which resulted in MOR concentra-tions of 60 (71) and 180–200 ng/mL (72), respectively. In addi-tion, plasma MOR concentrations were within the range ob-tained in the present study following INDIM and IVDIM, whichwere 1.8–10 ng/mL (17,69,71) (Table IX). Therefore, it can beconfirmed that therapeutic levels of MOR can be achieved fol-lowing INDIM in children based on the pharmacokinetic datapresented in the current study.
The median plasma peak concentrations of DIM, 6-MAM,MOR, and M3G following INDM in this work were similar tothose reported by Cone et al. (17) and Skopp et al. (28). Data ob-tained after IVDIM were similar to those reported by Jenkins etal. (69). T½ was similar to most previous studies and ranged be-tween 3 and 5 min for DIM (Table IX). In the current study, themedian T½ for DIM after IVDIM and INDIM was 4 min and 3 min,respectively.
In previous work, it has been found that peak plasma con-centrations of DIM metabolites were lower following smoked orintranasal DIM compared to IVDIM, which was the same as inthe present work. DIM and 6-MAM were detected with bothroutes of administration, which may indicate that DIM and 6-MAM provided the analgesic effects at the early stage whenMOR levels were low or not detected, especially in INDIMcases.
In the present study, the two routes of administration can bedistinguished on the basis of the plasma metabolite concen-trations. IVDIM produces faster and higher pharmacokineticprofiles for DIM and its metabolites compared to INDIM.
Conclusions
Many methods have been reported for extraction of DIM
Table VIII. Summary of Pharmacokinetic Data Obtained in the Current Study
Mean IVDIMValues in 12 Cases Mean INDIMValues in 11 Cases
T½* Tmax† Cmax‡ AUCall§ T½ Tmax Cmax AUCallSubstance (min) (min) (ng/mL) (ng·min/mL) (min) (min) (ng/mL) (ng·min/mL) Bioavailability
DIM 4 2.0 728 9162 4 2.0 18.0 129 1.46-MAM 7 2.0 524 2054 14 5.0 9.0 109 5.3MOR 41 3.0 75.0 873 46 13.0 7.0 242 27.7M3G n.d 18.0 383 18,140 n.d 56.0 94.0 3260 17.9M6G n.d 36.0 23.0 973 n.d 57.0 8.0 208 21.4* T½ = Half-life.† Tmax = Time of maximum observed concentration.‡ Cmax = Maximum observed concentration occurring at Tmax.§ AUCall = Area under the concentration-time curve from time 0 to the last measured concentration.
Downloaded from https://academic.oup.com/jat/article-abstract/34/4/177/785216by gueston 08 February 2018

Journal of Analytical Toxicology, Vol. 34, May 2010
192
Table IX. Pharmacokinetics Data for Diamorphine and its Metabolites from Literature
Dose of No. of T½ Cmax Tmax AUCDIM Cases R* Analytes (min) (ng/mL) (min) (µg·h/L) Reference
20–60 3 IV DIM 3 ND ND 57–114 71
6–12 6 IN DIM 4.2 ND < 5 24.5 17
3–20 2 IV DIM 3.6 ND ND 56.5 686-MAM 9.3 ND ND 109
2.6–10.5 2 IH DIM 3.3 ND ND ND 686-MAM 5.4 ND ND NDMOR 18.8 ND ND ND
6 6 IN DIM 0–6 ND–23.3 4.8–15 1.5–3.6 286-MAM 0–26.4 3.8–10.6 4.8–10.2 0.9–7.1MOR 0–102 6.1–6.6 10.2–30.0 6.1–11.7M3G 0–312 32.4–82.3 30.0–180.0 112.6–412.0M6G ND ND ND
12 6 IN DIM ND–6 ND–44.3 4.8–15 3.7–6.5 286-MAM 0–28.2 4.4–17.4 4.8–10.2 1.7–10.0MOR 0–180.0 5.3–15.0 43.8–90.0 14.1–34.8M3G 0–186 88.2–137.4 60–120 381.5–906.3M6G ND ND–23.9 ND–120
6 2 IM DIM ND–5.4 45.7 4.8 ND–6 286-MAM ND–19.2 22.6 ND–4.8 ND–10.1MOR 90.0–114.0 7.9 ND–10.2 ND–16.5M3G 102.0–180.0 93.0 10.2–30.0 240.4–337.1
200 2 IV DIM 1.3 1530–2270 ND 5.2–8.8 736-MAM 46–52 4620–3400 0.7–1.5 26.3–27.2MOR 182 340–810 3.6–3.9 64.3–48.7
40–210 8 IV DIM 3.3 ND ND ND 46-MAM ND ND 2.7 NDMOR ND ND 6.4 ND
146 8 IV DIM 3 3960 ND 185 86-MAM 3 5740 0.3 257MOR ND 1569 7 128M3G ND 387 10 1469M6G ND 55 58 230
50 5 CH-D DIM ND 225.3 1 19.8 746-MAM ND 171.5 1 34.4MOR 143.0 59.9 2.0 179.3M3G 280.1 341.5 120.0 2672.7M6G 269.9 50.8 120.0 390.5
5 HE-d DIM ND 44.3 1 3.46-MAM ND 52.4 1 10.7 74MOR 127.0 37.1 2.0 108.5M3G 252.0 230.8 120.0 1646.7M6G 216.2 36.9 120.0 224.2
133–450 10 IV DIM 3.8 3119 ND 329 756-MAM 22 1731 ND 482MOR 177 829 7.8 2594M3G 276 4287 ND 32,192M6G 268 678 ND 4291
133–450 12 IH DIM 3.2 685 2 174 756-MAM 26 289 ND 177MOR 184 271 8 1043M3G, 283 2284 ND 15,865M6G 240 461 ND 2677
* Abbreviations: R, route or method of administration; IV, intravenous; IN, intranasal; IM, intramuscular; IH, inhalation; CH-D, chasing the dragon;HE-d, heating device; and ND, not determined or not reported.
Downloaded from https://academic.oup.com/jat/article-abstract/34/4/177/785216by gueston 08 February 2018

Journal of Analytical Toxicology, Vol. 34, May 2010
193
metabolites, and among these, SPE is the method of choice be-cause of producing clean extracts, good sensitivity, and min-imal matrix effects. In the present study, DIM metabolites wereextracted and analyzed using SPE and LC–ESPI-MS–MS pro-cedures. LC separation was performed using the Synergi PolarRP column (150 × 2 mm, 4 µm) and a gradient mobile phase.DIM and its metabolites were well-separated from each other.SPE was sufficient to provide clean extracts and minimize theeffect of matrix on the ionization of analytes. Results of anal-ysis of case samples obtained following IVDIM and INDIM werereported, and DIM metabolites were determined with the ex-ception of NMOR, which was found to be negative in both casegroups.
Following IVDIM, the concentrations of DIM, 6-MAM, andMOR decreased sharply whereas the rate of decrease was slowerafter INDIM. Pharmacokinetic parameters (Cmax, Tmax, T½, andAUC) were calculated for the two patient groups. These werecompared with each other and with previous studies in adultpatients. The pharmacokinetics of DIM and its metabolites fol-lowing INDIM and IVDIM administration in children have beencompared for the first time in this study, which confirmedthat INDIM can achieve therapeutic plasma concentrations ofDIM and its active metabolites, although these are lower thanthose obtained with IVDIM and occur at later times afteradministration.
References
1. A.I. Al-Asmari and R.A. Anderson. Method for quantification ofopioids and their metabolites in autopsy blood by liquid chro-matography–tandem mass spectrometry. J. Anal. Toxicol. 31: 394–408 (2007).
2. E.J. Rook, M.J. Hillebrand, H. Rosing, J. M. van Ree, and J.H. Bei-jnen. The quantitative analysis of heroin, methadone and theirmetabolites and the simultaneous detection of cocaine, acetyl-codeine and their metabolites in human plasma by high-perfor-mance liquid chromatography coupled with tandem mass spec-trometry. J. Chromatogr. B Analyt. Technol. Biomed. Life. Sci. 24:213–221(2005).
3. E.J. Rook, A.D. Huitema, W. van den Brink, J.M. van Ree, andJ.H. Beijnen. Population pharmacokinetics of heroin and its majormetabolites. Clin. Pharmacokinet. 45: 401–417 (2006).
4. K.M. Rentsch, G.A. Kullak-Ublick, C. Reichel, P.J. Meier, andK. Fattinger. Arterial and venous pharmacokinetics of intravenousheroin in subjects who are addicted to narcotics. Clin. Phar-macol. Ther. 70: 237–246 (2001).
5. D.A. Barrett, D.P. Barker, N. Rutter, M. Pawula, and P.N. Shaw.Morphine, morphine-6-glucuronide and morphine-3-glucuronide pharmacokinetics in newborn infants receiving di-amorphine infusions. Br. J. Clin. Pharmacol. 41: 531–537 (1996).
6. J.M. Kendall and V.S. Latter. Intranasal diamorphine as an alter-native to intramuscular morphine: pharmacokinetic and phar-macodynamic aspects. Clin. Pharmacokinet. 42: 501–513 (2003).
7. E.J. Rook, A. Juitema, W. Brink, J. Ree, and J. Beijnen. Pharma-cokinetics and pharmacokinetic variability of heroin and itsmetabolites: review of the literature. Curr. Clin. Pharmacol. 1:109–118 (2006).
8. F. Girardin, K.M. Rentsch, M.A. Schwab, M. Maggiorini, C. Pauli-Magnus, G.A. Kullak-Ublick, P.J. Meier, and K. Fattinger. Phar-macokinetics of high doses of intramuscular and oral heroin innarcotic addicts. Clin. Pharmacol. Ther. 74: 341–352 (2003).
9. S. Paterson, N. Lintzeris, T.B. Mitchell, R. Cordero, L. Nestor, and
J. Strang.Validation of techniques to detect illicit heroin use in pa-tients prescribed pharmaceutical heroin for the management ofopioid dependence. Addiction 100: 1832–1839 (2005).
10. F.M. Fairlie, L. Marshall, J.J. Walker, and D. Elbourne. Intramus-cular opioids for maternal pain relief in labour: a randomised con-trolled trial comparing pethidine with diamorphine. Br. J. Ob-stet. Gynaecol. 106: 1181–1187 (1999).
11. M. Teesson, J. Ross, S. Darke, M. Lynskey, R. Ali, A. Ritter, andR. Cooke. One year outcomes for heroin dependence: findingsfrom the Australian Treatment Outcome Study (ATOS). Drug Al-cohol Depend. 83: 174–180 (2006).
12. R.J. McInnes, E. Hillan, D. Clark, and H. Gilmour. Diamorphinefor pain relief in labour: a randomised controlled trial comparingintramuscular injection and patient-controlled analgesia. Bjog.111: 1081–1089 (2004).
13. A. Hallett, F. O’Higgins, V. Francis, and T.M. Cook. Patient-con-trolled intranasal diamorphine for postoperative pain: an accept-ability study. Anaesthesia 55: 532–539 (2000).
14. J. Sawynok. The therapeutic use of heroin: a review of the phar-macological literature. Can. J. Physiol. Pharmacol. 64: 1–6 (1986).
15. D.A. Barrett, A.C. Elias-Jones, N. Rutter, P.N. Shaw, andS.S. Davis. Morphine kinetics after diamorphine infusion in pre-mature neonates. Br. J. Clin. Pharmacol. 32: 31–37 (1991).
16. J.M. Kendall, B.C. Reeves, andV.S. Latter. Multicentre randomisedcontrolled trial of nasal diamorphine for analgesia in children andteenagers with clinical fractures. Br. Med. J. 322: 261–265 (2001).
17. E.J. Cone, B.A. Holicky, T.M. Grant, W.D. Darwin, and B.A. Gold-berger. Pharmacokinetics and pharmacodynamics of intranasal“snorted” heroin. J. Anal. Toxicol. 17: 327–337 (1993).
18. M.H. Hanna, S.J. Peat, M. Woodham, A. Knibb, and C. Fung.Analgesic efficacy and CSF pharmacokinetics of intrathecal mor-phine-6-glucuronide: comparison with morphine. Br. J. Anaesth.64: 547–550 (1990).
19. K. Hewett, A.H. Dickenson, and H.J. McQuay. Lack of effect ofmorphine-3-glucuronide on the spinal antinociceptive actionsof morphine in the rat: an electrophysiological study. Pain 53: 59–63 (1993).
20. R. Kaushik, B. Levine, and W.R. LaCourse. A brief review: HPLCmethods to directly detect drug glucuronides in biological ma-trices (Part I). Anal. Chim. Acta 556: 255–266 (2006).
21. E.J. Cone, P. Welch, J.M. Mitchell, and B.D. Paul. Forensic drugtesting for opiates: I. Detection of 6-acetylmorphine in urine as anindicator of recent heroin exposure; drug and assay considerationsand detection times. J. Anal. Toxicol. 15: 1–7 (1991).
22. M. Von Euler, T. Villen, J.O. Svensson, and L. Stahle. Interpreta-tion of the presence of 6-monoacetylmorphine in the absence ofmorphine-3-glucuronide in urine samples: evidence of heroinabuse. Ther. Drug Monit. 25: 645–648 (2003).
23. O.H. Drummer. Postmortem toxicology of drugs of abuse.Forensic Sci. Int. 142: 101–113 (2004).
24. L. Antonilli, F. Semeraro, C. Suriano, L. Signore, and P. Nencini.High levels of morphine-6-glucuronide in street heroin addicts.Psychopharmacol. 170: 200–204 (2003).
25. S. Pichini, I. Altieri, M. Pellegrini, P. Zuccaro, and R. Pacifici. Therole of liquid chromatography–mass spectrometry in the deter-mination of heroin and related opioids in biological fluids.MassSpectrom. Rev. 18: 119–130 (1999).
26. D.E. Selley, C.C. Cao, T. Sexton, J.A. Schwegel, T.J. Martin, andS.R. Childers. mu Opioid receptor-mediated G-protein activa-tion by heroin metabolites: evidence for greater efficacy of 6-monoacetylmorphine compared with morphine. Biochem. Phar-macol. 62: 447–455 (2001).
27. C.E. Inturrisi, M. Schultz, S. Shin, J.G. Umans, L. Angel, andE.J. Simon. Evidence from opiate binding studies that heroin actsthrough its metabolites. Life Sci. 33: 773–776 (1983).
28. G. Skopp, B. Ganssmann, E.J. Cone, and R. Aderjan. Plasma con-centrations of heroin and morphine-related metabolites after in-tranasal and intramuscular administration. J. Anal. Toxicol. 21:105–111 (1997).
29. J.K. Coller, L.L. Christrup, and A.A. Somogyi. Role of active
Downloaded from https://academic.oup.com/jat/article-abstract/34/4/177/785216by gueston 08 February 2018

Journal of Analytical Toxicology, Vol. 34, May 2010
194
metabolites in the use of opioids. Eur. J. Clin. Pharmacol. 65:121–139 (2009).
30. R. Osborne, S. Joel, and M. Slevin. Morphine intoxication inrenal failure; the role of morphine-6-glucuronide. Br. Med. J. 293:1101 (1986).
31. M.L. Smith, E.T. Shimomura, J. Summers, B.D. Paul, A.J. Jenkins,W.D. Darwin, and E.J. Cone. Urinary excretion profiles for totalmorphine, free morphine, and 6-acetylmorphine followingsmoked and intravenous heroin. J. Anal. Toxicol. 25: 504–514(2001).
32. S. Kidd, S. Brennan, R. Stephen, R. Minns, and T. Beattie. Com-parison of morphine concentration-time profiles following intra-venous and intranasal diamorphine in children. Arch. Dis. Child.94: 974–978 (2009)
33. J.A. Wilson, J.M. Kendall, and P. Cornelius. Intranasal diamor-phine for paediatric analgesia: assessment of safety and efficacy.J. Accid. Emerg. Med. 14: 70–72 (1997).
34. M.Ward, G. Minto, and J.M. Alexander-Williams. A comparisonof patient-controlled analgesia administered by the intravenous orintranasal route during the early postoperative period. Anaes-thesia 57: 48–52 (2002).
35. Clinical effectiveness committee, British Association for Emer-gency Medicine. Guideline for the Management of Pain in Chil-dren (2004). http://www.emergencymed.org.uk/BAEM/CEC/as-sets/cec_pain_in_children.pdf (accessed June 2008).
36. B.K. Matuszewski, M.L. Constanzer, and C.M. Chavez-Eng. Strate-gies for the assessment of matrix effect in quantitative bioanalyt-ical methods based on HPLC–MS/MS. Anal. Chem. 75: 3019–3030 (2003).
37. SOFT/AAFS. Forensic Toxicology Laboratory Guidelines. 2006version. http://www.soft-tox.org/docs/Guidelines%202006%202020Final.pdf.
38. UNODC. Validation of Analytical Methodology and Calibrationof Equipment used for Testing of Illicit Drugs in Seized Materialsand Biological Specimens; 2009.
39. A.C. Moffat, M.D. Ossleton, B. Widdop, and L.Y. Galichet.Clarke’s Analysis of Drugs and Poisons: Methadology and Ana-lytical Techniques, Validation of New Method. PharmaceuticalPress, London, U.K., 2004.
40. F. Bressolle, M. Bromet-Petit, and M. Audran.Validation of liquidchromatographic and gas chromatographic methods. Applica-tions to pharmacokinetics. J. Chromatogr. B. Biomed. Appl. 686:3–10 (1996).
41. F.T. Peters. Stability of analytes in biosamples—an important issuein clinical and forensic toxicology? Anal. Bioanal. Chem. 388:1505–1519 (2007).
42. B.A. Goldberger, W.D. Darwin, T.M. Grant, A.C. Allen,Y.H. Caplan, and E.J. Cone. Measurement of heroin and itsmetabolites by isotope-dilution electron-impact mass spectrom-etry. Clin. Chem. 39: 670–675 (1993).
43. B.A. Goldberger, Y.H. Caplan, T. Maguire, and E.J. Cone. Testinghuman hair for drugs of abuse. III. Identification of heroin and 6-acetylmorphine as indicators of heroin use. J. Anal. Toxicol. 15:226–231 (1991).
44. W.L. Wang, W.D. Darwin, and E.J. Cone. Simultaneous assay ofcocaine, heroin and metabolites in hair, plasma, saliva and urineby gas chromatography-mass spectrometry. J. Chromatogr. BBiomed. Appl. 660: 279–290 (1994).
45. J.G. Guillot, M. Lefebvre, and J.P.Weber. Determination of heroin,6-acetylmorphine, and morphine in biological fluids using theirpropionyl derivatives with ion trap GC–MS. J. Anal. Toxicol. 21:127–133 (1997).
46. P.P. Rop, F. Grimaldi, J. Burle, M.N. De Saint Leger, and A.Viala.Determination of 6-monoacetylmorphine and morphine inplasma, whole blood and urine using high-performance liquidchromatography with electrochemical detection. J. Chromatogr. B.Biomed. Appl. 661: 245–253 (1994).
47. M.E. Capella-Peiro, D. Bose, M. Gil-Agusti, J. Esteve-Romero,and S. Carda-Broch. Direct injection determination of ben-zoylecgonine, heroin, 6-monoacetylmorphine and morphine
in serum by MLC. J. Chromatogr. A 1073: 277–283 (2005).48. D. Bourquin, T. Lehmann, R. Hammig, M. Buhrer, and
R. Brenneisen. High-performance liquid chromatographic mon-itoring of intravenously administered diacetylmorphine and mor-phine and their metabolites in human plasma. J. Chromatogr. BBiomed. Sci. Appl. 694: 233–238 (1997).
49. R. Dams, C.M. Murphy, W.E .Lambert, and M.A. Huestis. Urinedrug testing for opioids, cocaine, and metabolites by direct in-jection liquid chromatography/tandem mass spectrometry. RapidCommun. Mass Spectrom. 17: 1665–1670 (2003).
50. P. Zuccaro, R. Ricciarello, S. Pichini, R. Pacifici, I. Altieri,M. Pellegrini, and G. D’Ascenzo. Simultaneous determination ofheroin 6-monoacetylmorphine, morphine, and its glucuronides byliquid chromatography–atmospheric pressure ionspray-mass spec-trometry. J. Anal. Toxicol. 21: 268–277 (1997).
51. P. Kintz, R. Brenneisen, P. Bundeli, and P. Mangin. Sweat testingfor heroin and metabolites in a heroin maintenance program.Clin. Chem. 43: 736–739 (1997).
52. J. Smeraglia, S.F. Baldrey, and D. Watson. Matrix effects and se-lectivity issues in LC–MS–MS. Chromatographia 55: 95–99(2002).
53. Z. Yan, N. Maher, R. Torres, C. Cotto, B. Hastings, M. Dasgupta,R. Hyman, N. Huebert, and G.W. Caldwell. Isobaric metaboliteinterferences and the requirement for close examination of rawdata in addition to stringent chromatographic separations in liquidchromatography/tandem mass spectrometric analysis of drugs inbiological matrix. Rapid Commun. Mass Spectrom. 22: 2021–2028 (2008).
54. P. Marquet. Systematic toxicological analysis with LC–MS. In Ap-plications of LC–MS in Toxicology, A. Polettini, Ed. PharmaceuticalPress, London, U.K., 2006, pp 111–130.
55. M. Vogeser and C. Seger. A decade of HPLC–MS/MS in the rou-tine clinical laboratory—goals for further developments. Clin.Biochem. 41(9): 649–662 (2008).
56. R. Karinen, J.M. Andersen, A. Ripel, I. Hasvold, A.B. Hopen,J. Morland, and A.S. Christophersen. Determination of heroinand its main metabolites in small sample volumes of whole bloodand brain tissue by reversed-phase liquid chromatography–tandem mass spectrometry. J. Anal. Toxicol. 33: 345–350 (2009).
57. M. Gergov, P. Nokua, E. Vuori, and I. Ojanpera. Simultaneousscreening and quantification of 25 opioid drugs in post-mortemblood and urine by liquid chromatography–tandem mass spec-trometry. Forensic Sci. Int. 186: 36–43 (2009).
58. K. Taylor and S. Elliott. A validated hybrid quadrupole linear ion-trap LC–MS method for the analysis of morphine and morphineglucuronides applied to opiate deaths. Forensic Sci. Int. 187: 34–41 (2009).
59. B.D. Paul, J.M. Holler, T.P. Lyons, and M.R. Past. Stable isotopes asvalid components for identification of drugs in biological speci-mens. J. Anal. Toxicol. 31: 447–452 (2007).
60. R.A. de Zeeuw and J.P. Franke. ‘General unknown’ analysis. InHandbook of Analytical Separations,Vol. 2, Ch. 16, J.B. Maciej,Ed. Elsevier Science B.V., Atlanta, GA, 2000, pp 567–599.
61. C. Baumann, M.A. Cintora, M. Eichler, E. Lifante, M. Cooke,A. Przyborowska, and J.M. Halket. A library of atmospheric pres-sure ionization daughter ion mass spectra based on wideband ex-citation in an ion trap mass spectrometer. Rapid Comm. MassSpectrom. 14: 349–356 (2000).
62. E. Gustavsson, M. Andersson, N. Stephanson, and O. Beck. Val-idation of direct injection electrospray LC–MS/MS for confirma-tion of opiates in urine drug testing. J. Mass Spectrom. 42: 881–889 (2007).
63. J.M. Halket, D. Waterman, A.M. Przyborowska, R.K. Patel,P.D. Fraser, and P.M. Bramley. Chemical derivatization and massspectral libraries in metabolic profiling by GC/MS and LC/MS/MS.J. Exp. Bot. 56: 219–243 (2005).
64. S. Gao, Z.P. Zhang, andH.T. Karnes. Sensitivity enhancement in liquidchromatography/atmospheric pressure ionization mass spectrom-etry using derivatization and mobile phase additives.J.Chromatogr.BAnalyt.Technol.Biomed.Life Sci. 825: 98–110 (2005).
Downloaded from https://academic.oup.com/jat/article-abstract/34/4/177/785216by gueston 08 February 2018

Journal of Analytical Toxicology, Vol. 34, May 2010
195
65. F.T. Peters, O.H. Drummer, and F. Musshoff. Validation of newmethods. Forensic Sci. Int. 165: 216–224 (2007).
66. A.I. Al-Asmari, R.A. Anderson, and G.A. Cooper. Oxycodone-re-lated fatalities in the west of Scotland. J. Anal. Toxicol. 33: 423–432 (2009).
67. A.I. Al-Asmari and R.A. Anderson. Comparison of nonhydrolysisand hydrolysis methods for the determination of buprenorphinemetabolites in urine by liquid chromatography–tandem massspectrometry. J. Anal. Toxicol. 39: 744–753 (2008).
68. A.J. Jenkins, R.M. Keenan, J.E. Henningfield, and E.J. Cone. Phar-macokinetics and pharmacodynamics of smoked heroin. J. Anal.Toxicol. 18: 317–330 (1994).
69. A.J. Jenkins, J.M. Oyler, and E.J. Cone. Comparison of heroinand cocaine concentrations in saliva with concentrations in bloodand plasma. J. Anal. Toxicol. 19: 359–374 (1995).
70. L. Bachs, G. Hoiseth, S. Skurtveit, and J. Morland. Heroin-usingdrivers: importance of morphine and morphine-6-glucuronideon late clinical impairment. Eur. J. Clin. Pharmacol. 62: 905–912(2006).
71. C.E. Inturrisi, M.B. Max, K.M. Foley, M. Schultz, S.U. Shin, andR.W. Houde. The pharmacokinetics of heroin in patients withchronic pain. N. Engl. J. Med. 310: 1213–1217 (1984).
72. T.B. Mitchell, N. Lintzeris, A. Bond, and J. Strang. Feasibility and
acceptability of an intranasal diamorphine spray as an alternativeto injectable diamorphine for maintenance treatment. Eur. Addict.Res. 12: 91–95 (2006).
73. E. Gyr, R. Brenneisen, D. Bourquin, T. Lehmann, D. Vonlanthen,and I. Hug. Pharmacodynamics and pharmacokinetics of intra-venously, orally and rectally administered diacetylmorphine inopioid dependents, a two-patient pilot study within a heroin-as-sisted treatment program. Int. J. Clin. Pharmacol. Ther. 38: 486–491 (2000).
74. M.G. Klous, A.D. Huitema, E.J. Rook, M.J. Hillebrand,V.M. Hen-driks, W. Van den Brink, J.H. Beijnen, and J.M. Van Ree. Phar-macokinetic comparison of two methods of heroin smoking:‘chasing the dragon’ versus the use of a heating device. Eur. Neu-ropsychopharmacol.15: 263–269 (2005).
75. E.J. Rook, J.M. van Ree, W. van den Brink, M.J. Hillebrand,A.D. Huitema,V.M. Hendriks, and J.H. Beijnen. Pharmacokineticsand pharmacodynamics of high doses of pharmaceutically pre-pared heroin, by intravenous or by inhalation route in opioid-de-pendent patients. Basic Clin. Pharmacol. Toxicol. 98: 86–96 (2006).
Manuscript received June 15, 2009;revision received December 2, 2009.
Downloaded from https://academic.oup.com/jat/article-abstract/34/4/177/785216by gueston 08 February 2018


![Analytical Methods for Quantification of Drug Metabolites ... · toxic substances is also frequently investigated [4]. In early discovery, drug metabolism input provides a basis for](https://static.fdocuments.in/doc/165x107/5e9023f06cfc092ffd26cea4/analytical-methods-for-quantification-of-drug-metabolites-toxic-substances-is.jpg)