Method for the Analysis of Cannabinoids and Terpenes in ... the 140 terpenoids identified in...
20
Giese et al.: Journal of AOAC International Vol. 98, No. 6, 2015 1503 Received May 7, 2015. Accepted by AP July 20, 2015 Corresponding author’s e-mail: [email protected] DOI: 10.5740/jaoacint.15-116 The requirements for an acceptable cannabis assay have changed dramatically over the years resulting in a large number of laboratories using a diverse array of analytical methodologies that have not been properly validated. Due to the lack of sufficiently validated methods, we conducted a single- laboratory validation study for the determination of cannabinoids and terpenes in a variety of commonly occurring cultivars. The procedure involves high- throughput homogenization to prepare sample extract, which is then profiled for cannabinoids and terpenes by HPLC-diode array detector and GC-flame ionization detector, respectively. Spike recovery studies for terpenes in the range of 0.03–1.5% were carried out with analytical standards, while recovery studies for Δ 9 -tetrahydrocannabinolic acid, cannabidiolic acid, Δ 9 -tetrahydrocannabivarinic acid, and cannabigerolic acid and their neutral counterparts in the range of 0.3–35% were carried out using cannabis extracts. In general, accuracy at all levels was within 5%, and RSDs were less than 3%. The interday and intraday repeatabilities of the procedure were evaluated with five different cultivars of varying chemotype, again resulting in acceptable RSDs. As an example of the application of this assay, it was used to illustrate the variability seen in cannabis coming from very advanced indoor cultivation operations. T he requirements for an acceptable cannabis assay have changed dramatically over the years. Historically the focus was the quantification of Δ 9 -tetrahydrocannabinol (THC; 1), the main biologically active metabolite; however, intensive research over the past few decades has identified over 150 different cannabinoids (2). Pharmacological activities for a number of these, including Δ 9 -tetrahydrocannabinolic acid (THCA), cannabidiol (CBD), cannabidiolic acid (CBDA), cannabigerol (CBG), cannabigerolic acid (CBGA), Δ 9 -tetrahydrocannabivarin (THCV), Δ 9 -tetrahydrocannabivarinic acid (THCVA), cannabidivarin (CBDV), and cannabidivarinic acid (CBDVA; 3), have been reported. Thus, quantification of these other cannabinoids is also important to understanding the pharmacological properties of cannabis. As of 2014 there have been over 545 constituents identified in cannabis (3), and apart from the cannabinoids, the 140 terpenoids (4) have garnered interest due to their organoleptic properties (4, 5), potential for chemically fingerprinting different cultivars (6–10), and putative synergistic interactions between the cannabinoids and the terpenoids (11, 12). Of the 140 terpenoids identified in cannabis, our own qualitative GC/MS surveys of California landraces, as well as analytical results from other laboratories (13, 14), published studies on the terpene profiles of cannabis cultivars (7, 9, 10), and reviews of the biological activities of terpenes (11, 12) suggest there are approximately 17 that are the most common and can be used for examining the phenotypic and/or biological properties of cannabis cultivars. Publications documenting the chemotypic profiles of various cultivars (9, 10, 15–17), analytical results obtained within our laboratory, and analytical results posted by other cannabis testing laboratories (13, 14) also provide evidence that typical concentration ranges for the cannabinoids are from 0.1 to 40% of inflorescence dry weight and terpenoids range from 0.01 to 1.5% of inflorescence dry weight. Although there are certainly other classes of metabolites present in cannabis (2, 4), the above references as well as a survey of services offered by analytical laboratories that test cannabis (13, 14, 18) suggest much of the current focus lies with the cannabinoids and terpenoids. Thus, an economical, robust, and validated method for profiling all of these analytes over their observed ranges of concentration is needed. As the number of states considering legalization of cannabis, medical or otherwise, is growing rapidly, the number of cannabis testing laboratories has also increased to keep up with demand; however, it is not always clear what standards they are held to, and this has resulted in a number of nonstandardized and nonvalidated methods being used (1, 19). While there may be a number of methods suitable for the analysis of cannabis, it is crucial for laboratories to perform rudimentary assay validation to demonstrate the assay is fit for its intended purpose. This is an absolute requirement for the confident use of any methodology, and the International Conference on Harmonization (ICH), United Nations Office on Drugs and Crime (UNDOC), and AOAC provide a number of guidance documents for this purpose (20–22). Based on the aforementioned considerations and the lack of a method that was validated for the analytes and concentration ranges of interest, we sought to develop an efficient and robust assay that covered the typical repertoire of analytes and working ranges mentioned above. A number of publications have been released over the years (10, 15, 16, 23) that have presented validated assays for several analytes present in cannabis. These validations were suitable for the stated purposes of the studies; however, they DRUG FORMULATIONS AND CLINICAL METHODS Development and Validation of a Reliable and Robust Method for the Analysis of Cannabinoids and Terpenes in Cannabis Matthew W. Giese, Mark A. Lewis, Laura Giese, and Kevin M. Smith Napro Research, Westlake Village, CA 91362
Transcript of Method for the Analysis of Cannabinoids and Terpenes in ... the 140 terpenoids identified in...

Giese et al Journal of AOAC International Vol 98 No 6 2015 1503
Received May 7 2015 Accepted by AP July 20 2015Corresponding authorrsquos e-mail mgiesenaproresearchcomDOI 105740jaoacint15-116
The requirements for an acceptable cannabis assay have changed dramatically over the years resulting in a large number of laboratories using a diverse array of analytical methodologies that have not been properly validated Due to the lack of sufficiently validated methods we conducted a single-laboratory validation study for the determination of cannabinoids and terpenes in a variety of commonly occurring cultivars The procedure involves high-throughput homogenization to prepare sample extract which is then profiled for cannabinoids and terpenes by HPLC-diode array detector and GC-flame ionization detector respectively Spike recovery studies for terpenes in the range of 003ndash15 were carried out with analytical standards while recovery studies for Δ9-tetrahydrocannabinolic acid cannabidiolic acid Δ9-tetrahydrocannabivarinic acid and cannabigerolic acid and their neutral counterparts in the range of 03ndash35 were carried out using cannabis extracts In general accuracy at all levels was within 5 and RSDs were less than 3 The interday and intraday repeatabilities of the procedure were evaluated with five different cultivars of varying chemotype again resulting in acceptable RSDs As an example of the application of this assay it was used to illustrate the variability seen in cannabis coming from very advanced indoor cultivation operations
The requirements for an acceptable cannabis assay have changed dramatically over the years Historically the focus was the quantification of
Δ9-tetrahydrocannabinol (THC 1) the main biologically active metabolite however intensive research over the past few decades has identified over 150 different cannabinoids (2) Pharmacological activities for a number of these including Δ9-tetrahydrocannabinolic acid (THCA) cannabidiol (CBD) cannabidiolic acid (CBDA) cannabigerol (CBG) cannabigerolic acid (CBGA) Δ9-tetrahydrocannabivarin (THCV) Δ9-tetrahydrocannabivarinic acid (THCVA) cannabidivarin (CBDV) and cannabidivarinic acid (CBDVA 3) have been reported Thus quantification of these other cannabinoids is also important to understanding the pharmacological properties of cannabis As of 2014 there have
been over 545 constituents identified in cannabis (3) and apart from the cannabinoids the 140 terpenoids (4) have garnered interest due to their organoleptic properties (4 5) potential for chemically fingerprinting different cultivars (6ndash10) and putative synergistic interactions between the cannabinoids and the terpenoids (11 12)
Of the 140 terpenoids identified in cannabis our own qualitative GCMS surveys of California landraces as well as analytical results from other laboratories (13 14) published studies on the terpene profiles of cannabis cultivars (7 9 10) and reviews of the biological activities of terpenes (11 12) suggest there are approximately 17 that are the most common and can be used for examining the phenotypic andor biological properties of cannabis cultivars Publications documenting the chemotypic profiles of various cultivars (9 10 15ndash17) analytical results obtained within our laboratory and analytical results posted by other cannabis testing laboratories (13 14) also provide evidence that typical concentration ranges for the cannabinoids are from 01 to 40 of inflorescence dry weight and terpenoids range from 001 to 15 of inflorescence dry weight Although there are certainly other classes of metabolites present in cannabis (2 4) the above references as well as a survey of services offered by analytical laboratories that test cannabis (13 14 18) suggest much of the current focus lies with the cannabinoids and terpenoids Thus an economical robust and validated method for profiling all of these analytes over their observed ranges of concentration is needed
As the number of states considering legalization of cannabis medical or otherwise is growing rapidly the number of cannabis testing laboratories has also increased to keep up with demand however it is not always clear what standards they are held to and this has resulted in a number of nonstandardized and nonvalidated methods being used (1 19) While there may be a number of methods suitable for the analysis of cannabis it is crucial for laboratories to perform rudimentary assay validation to demonstrate the assay is fit for its intended purpose This is an absolute requirement for the confident use of any methodology and the International Conference on Harmonization (ICH) United Nations Office on Drugs and Crime (UNDOC) and AOAC provide a number of guidance documents for this purpose (20ndash22) Based on the aforementioned considerations and the lack of a method that was validated for the analytes and concentration ranges of interest we sought to develop an efficient and robust assay that covered the typical repertoire of analytes and working ranges mentioned above
A number of publications have been released over the years (10 15 16 23) that have presented validated assays for several analytes present in cannabis These validations were suitable for the stated purposes of the studies however they
DRUG FORMULATIONS AND CLINICAL METHODS
Development and Validation of a Reliable and Robust Method for the Analysis of Cannabinoids and Terpenes in CannabisMatthew W Giese Mark A Lewis Laura Giese and Kevin M SmithNapro Research Westlake Village CA 91362
1504 Giese et al Journal of AOAC International Vol 98 No 6 2015
have some limitations with respect to current goals There are a number of methods for preparing cannabis and extracting the analytes (24) however sonication is the most common and is the method recommended by both UNDOC and the American Herbal Pharmacopoeia (AHP) for the analysis of cannabis (1 25) Methods in the AHP monograph as well as those used by DeBacker et al (15 17) and Swift et al (16) recommend drying and powdering the sample first however this would require a separate moisture determination to accurately assess the content of the initial inflorescence This process would also alter the native content of the volatile terpenes thus precluding their determination along with the cannabinoids from a single sample preparation The above methods also recommend sonication for extraction of the analytes This process can be less efficient with solid samples or large particle sizes such as bulk plant material (26) and conditions optimized for single samples can result in loss of precision and accuracy when processing multiple samples at once (as is typical in most laboratories) due to variability in power across the bath that depends on sample depth placement and number of samples in the bath (26 27) Using a probe for disruption minimizes variability but also decreases throughput while increasing the possibility for cross-contamination by the probe (26) The shake flask method used by Fischedick et al (10) avoids many of these issues but it uses a relatively large volume of solvent (100 mL1 g of sample) and requires multiple extractions We decided to evaluate high throughput homogenization (HTH) of typical inflorescences as a single sample preparation method for the analysis of both terpenoids and cannabinoids High-throughput homogenizers have been used for homogenizing microorganisms plant tissues and animal tissues and have been successful in relieving bottlenecks in a number of high-throughput screening strategies (26 28)
The two most common instrumental methods for analysis of cannabinoids are GC-flame ionization detector (FID) and HPLC-UV (1 24 25) however HPLC has been established as the method most suited for cannabinoid analysis of the native composition of the plant The cannabinoids are biosynthesized as carboxylic acids however both heat as applied from an ignition source or a GC injector and time decarboxylate the carboxylic acids and convert them to their biologically active forms (15 23 24) Derivitization as the trimethylsilyl ethers prevents this decarboxylation (1 24) but this requires extra sample processing steps Furthermore the conversion processes in the injector of a GC has been shown to be highly dependent on instrument configuration and is incomplete (29) The most accurate manner to assay the native composition of the inflorescence is to use a method that does not involve thermal stress such as HPLC (15 17 23) DeBacker et al (15) used HPLC to achieve separation of all the analytes of interest however it was a 36 min run and used mobile phases that involved buffer systems which are more inconvenient to work with in typical settings We sought to develop an HPLC method that used simple mobile phases provided shorter run times and adequately resolved all analytes of interest
Although HPLC is the method of choice for cannabinoids it is fairly well established that GC is the method of choice for small volatile organics such as the terpenoids (30 31) Additionally the large linear range of the FID makes it possible to cover the wide range of terpene concentrations (approximately 001 to 15) with a single injection A number of published
methods (9 10) document GC-FID methods that are very applicable to the analysis of terpenes in cannabis however since these methods also determined cannabinoid content the instrument cycle times were over 1 h We sought to develop a method that resolved all the analytes of interest with a shorter instrument cycle time
When it comes to method validation guidance states that methods must be validated for the analytes of interest at high medium and low concentrations that cover the desired working range (21) While the studies cited above were clearly sufficient for the stated purposes they do not cover the desired analytes or concentration ranges of interest in the current study For instance in the studies of Fischedick et al (10) THCA was validated at concentrations of 19 22 and 26 by weight and CBD at concentrations of 6 7 and 8 by weight and this does not cover the ranges or analytes mentioned above DeBacker et al (15) were able to validate all major analytes of interest by spiking cannabis extract into nettle however this covered concentration ranges by weight of 18ndash61 for THCA 10ndash33 for CBDA and 01ndash04 for CBGA These levels reflect only a portion of the analytes and concentrations of interest in current research endeavors as noted above
A key contribution by DeBacker et al (15) was to set a precedent for using cannabis extracts for validation studies Ideally the accuracy and precision of a method are assessed using certified reference materials (CRMs 20ndash22) however as noted by UNDOC (21) CRMs are rarely available for drugs of abuse This is especially true in the United States where it is a legal impossibility for most laboratories to obtain cannabinoid standards for this process This is even more problematic when concentrations of the analytes in the matrix can reach 40 by weight as noted in the references above and require large amounts of material As stated in guidance from AOAC sometimes an impure form of the analyte must be used until a pure form becomes available (22) and this is the current status of the cannabinoids in the United States Due to legal restrictions on standards the lack of official methods for comparison and the lack of validation samples we sought to expand the methods of DeBacker et al (15) to more analytes and wider working ranges so any laboratory in the United States can validate their methodology for the analytes and ranges mentioned above
Based on the previous discussion this work sought to develop an efficient and relatively rapid method for determining both cannabinoids and terpenoids in cannabis samples from a single sample preparation and to use spike recoveries to validate typical performance characteristics of the method (20ndash22) We sought to verify the specificity for the above-mentioned analytes the applicability to the desired working ranges and different matrixes and the reliability expressed in terms of accuracy and reproducibility by analyzing blanks spiked at three different concentrations covering the working range We also sought to verify intermediate precision of the assay by analyzing replicates of five different authentic samples on the same day and on 5 consecutive days
Giese et al Journal of AOAC International Vol 98 No 6 2015 1505
Experimental
Internal Standards Extraction Solution and Diluent
Denatured ethanol nonane 4-biphenyl carboxylic acid and ibuprofen were obtained from Sigma- Aldrich (St Louis MO) The Certificates of Analyses for each lot were used determine the purity and mass values were adjusted accordingly The diluent was reagent grade ethanol To prepare typical extraction solution with both 4-biphenyl carboxylic acid (BPCA) and nonane as the internal standard (ISTD) each was added to a volumetric flask that was brought up to volume with reagent grade ethanol and stirred for 3 h to give a solution that contained 01 mgmL nonane and 2 mgmL BPCA The peak area of BPCA in new batches of extraction solution was verified to be within 2 of previous batches by diluting 16 and injecting into the HPLC system in triplicate To prepare spike solution with both nonane and ibuprofen (IBU) as internal standards each was added to a volumetric flask and it was brought up to volume with reagent grade ethanol to give a solution that contained 15 mgmL nonane and 288 mgmL IBU
HTH Optimization
A 1600 Mini-G (OPS Diagnostics Lebanon NJ) was used for HTH This process was optimized for solvent volume sample mass homogenization time bead material and bead volume Optimized parameters were compared to the procedure used for the analysis of samples submitted to the University of Mississippi by the US Drug Enforcement Administration (DEA) and recommended in the AHP monograph (1) as well as to the procedure recommended by UNDOC for the analysis of cannabis (25) Two cultivars a Type I and Type II were compared to verify equivalence Sonication was then compared to the HTH procedure under typical sample loads and solvent usage with five separate cultivars
The optimized extraction procedure involved pregrinding 5 to 7 g of bulk flower samples in a stainless steel coffee grinder From this material 1000 mg (plusmn20 mg) was placed in a 50 mL BD Falcon polypropylene centrifuge tube (Amazoncom) with 1 mL 20 mm zirconia beads To the tube was added 150 mL extraction solvent via a solvent dispenser gravimetrically calibrated to deliver 15 mL ethanol and the tubes were homogenized at 1500 rpm for 6 min An aliquot was removed placed in a 20 mL centrifuge tube and centrifuged at 10 000 rpm for 5 min An aliquot of the supernatant was removed and placed in a GC vial for terpene analysis Another aliquot was placed in an HPLC vial and diluted 6-fold with diluent for quantification of the minor cannabinoids while another was placed in a separate HPLC vial and diluted 96-fold with diluent for quantification of the major cannabinoids It should be noted that pregrinding samples is only required for obtaining representative samples from large bulk sample masses If the sample size is small enough it can be placed directly in the Falcon tube for extraction
Method Validation
The method was validated with respect to selectivity linearity accuracy (recovery and percentage relative bias) and repeatability precision (RSDr) Guidelines from AOAC
INTERNATIONAL were followed (22) however guidelines from the ICH (20) and UNDOC (21) are all similar Selectivity was verified by determining retention times of standards Linearity was verified by using both the correlation coefficients and the residuals of the fitted calibration curves to verify goodness of fit Validation samples were prepared by spiking blank matrix with known amounts of terpene standards or cannabinoid extracts Accuracy (recovery) and RSDr were determined by extracting the validation samples and comparing the results to those obtained from extraction solution (no matrix present) that had been spiked with equivalent amounts of standards This was done at three different concentrations (low medium and high) covering the working range in replicate (n = 5) Accuracy is reported as recovery and acceptable limits are concentration dependent and given by AOAC (22) RSDr is determined from the RSD of the absolute measurements and acceptable values are concentration-dependent and given by AOAC and Equation 3 in the Calculations and Reporting section below (22) Trueness or bias under the reported conditions is the difference between the accepted value and the average reported value (22) In this case the trueness can be estimated as a byproduct of the recovery determinations since the true value of the validation samples is known from gravimetrically preparing them with standards or extracts Trueness is expressed in terms of relative bias
GC-FID Assay for the Terpenes
The terpenes were separated on a PerkinElmer (Waltham MA) Clarus 680 GC instrument fitted with an FID detector Elite 5MS column and Restek Corp (Bellefonte PA) Precision SkyLiner The injector temperature was set at 230degC a 15 microL injection volume was used and the split flow was set at 201 The carrier gas was hydrogen set at a flow rate of 13 mLmin and the oven temperature program was a 35 min hold at 60degC a ramp to 155degC at 35degCmin and a ramp to 300degC at 30degCmin
Terpene standards were obtained from Sigma-Aldrich and the Certificates of Analyses were used to correct mass values Calibration curves were prepared gravimetrically in diluent solution at concentrations of 1000 0815 0655 0495 0335 0175 and 0015 mgmL and an internal standard (nonane) concentration of 01 mgmL The instrument was calibrated according to the manufacturerrsquos procedures The calibration curves were obtained in triplicate on separate days In addition to requiring correlation coefficients greater than 099 the residuals were evaluated to verify the quality of the fit As is typical with standard curve fitting procedures the residuals should show a random distribution with a mean close to zero (2 32) For laboratories that do not have statistical software the residuals can be evaluated by calculating the difference of the experimental points from the fitted line and plotting these differences as a function of concentration
HPLC-Diode Array Detector (DAD) Assay of the Cannabinoids
The assay was run on a 1290 HPLC system equipped with a G4212A DAD G1316C temperature-controlled column compartment G4226A autosampler and G4204A quaternary pump Separation of the cannabinoids was achieved on a Poroshell 120 EC-C18 column (27 microm 150 times 21 mm id
1506 Giese et al Journal of AOAC International Vol 98 No 6 2015
Part No 693775-902) with a Poroshell 120 EC-C18 guard column (27 microm 5 times 21 mm id Part No 821725-911) in place (Agilent Technologies Santa Clara CA) Instrument control data acquisition and integration were achieved with OpenLab CDS ChemStation Rev C0106[61] software (Agilent Technologies) The HPLC method used a 15 microL injection volume for all calibration standards check standards and sample analyses Full spectra were recorded from 200 to 400 nm and 214 nm was used for quantification of all analytes
Mobile phases consisted of 01 formic acid (Sigma-Aldrich Part No 56302-50ML-GL) in HPLC grade water (Sigma-Aldrich Chromasolvreg Part No 270733-4L) on the A side and 01 formic acid in HPLC grade acetonitrile (Sigma-Aldrich Chromasolv Part No 34851-4L) on the B side The flow rate was 05 mLmin and the assay began with an 8 min isocratic hold at 66 B followed by a linear gradient to 95 B over 4 min 95 B was maintained for 1 min then the column was re-equilibrated at 66 B for 4 min before the next injection The total run time for the method was 17 min
Cannabinoid standards for THCA CBDA THC CBD CBG cannabichromene (CBC) Δ-8 THC and cannabinol (CBN) were obtained from Restek Corp as 10 mgmL solutions in methanol Calibration solutions for the acidic and neutral forms were prepared separately Admittedly the following procedure is generally not recommended for handling analytical standards but due to legal issues dictating how these standards are supplied it is the most practical manner to combine multiple cannabinoid standards into a single solution with an internal standard To prepare the calibration solutions 1000 microL of each was placed in a small amber vial and the solvent was evaporated under a gentle flow of argon after which the vial was placed under gentle vacuum until the theoretical weight (1 plusmn 01 mg) was obtained The residues were dissolved in a total of 4000 microL diluent to give a stock cannabinoid solution of 0250 mgmL with 02 mgmL IBU as the ISTD The stock solutions of the neutral and acidic moieties were then diluted to concentrations of 0250 0125 0063 0031 and 0016 mgmL
Each set of calibration curves was obtained in triplicate on separate days and the calibrations for the acids and neutrals were merged into a single instrumental method within the ChemStation software The single raw data set was processed to obtain both ISTD calibration curves that referenced IBU as the ISTD and external standard (ESTD) calibration curves In addition to requiring correlation coefficients greater than 099 the residuals were evaluated to verify the quality of the fit As is typical with standard curve fitting procedures the residuals should show a random distribution with a mean close to zero (2 32) For laboratories that do not have statistical software the residuals can be evaluated by calculating the difference of the experimental points from the fitted line and plotting these differences as a function of concentration This is a critical process for the cannabinoid calibration curves since the ldquotruerdquo values of the validation samples are determined empirically from the curves and this helps ensure they are not biased by nonlinearity of the calibration curves
Guidance states that an impure specimen can serve as the reference standard if CRMs are not available and there are cases where the complete characterization of products of natural origin is not possible (22) This is the case for CBGA THCVA and CBDVA as well as the neutral counterparts of the propyl analogs which are not easily obtained due to legal
restrictions For tentative identification of retention times for these analytes cultivars purported to be rich in them were obtained and analyzed by GCMS The major peaks for these analytes had retention times that were similar to those published with authentic materials (1 33) and had good correlation with mass spectral libraries The same extracts were analyzed in both heated and unheated forms and clear correlations could be seen between GCMS and HPLC-UV peak areas and peak ratios and elution orders were similar to those published with authentic materials (1 34) Based on known similarities of spectral properties and molar absorption coefficients (35) these analytes were then quantified by referencing known calibration curves CBGA and CBDVA referenced CBDA THCVA referenced THCA CBDV referenced CBD and THCV referenced THC These analytes are labeled with TI to stress the fact this was a tentative identification During the preparation of this manuscript standards for CBDV THCV and CBGA became available (Cerilliant Round Rock TX) and were used to verify the retention times and calibrate the instruments
Terpene standards were also injected to verify there were no interferences from these analytes
LOQ
Due to the impossibility of obtaining true blanks for all of the analytes the LOQs were estimated from the calibration curves of the analytes and then verified experimentally as described in ICH Q2B (20)
Matrix Blanks
Since it is not possible to obtain cannabis that is devoid of terpenes and cannabinoids blank matrixes were prepared by homogenizing cannabis samples in a stainless steel coffee grinder followed by repeated sonication of the bulk plant material in pentane and filtration This material was then placed under vacuum overnight to remove traces of solvent Extraction and analysis according to the current procedure indicated the complete absence of terpenes and residual amounts of the cannabinoids The residual cannabinoid background concentrations (THCA 0009 THC 0001 CBDA 0004 and CBGA 0044) were subtracted from those obtained in the spike recovery experiments
Terpene Validation Samples
Although guidance recommends spiking each analytical standard into a blank matrix (20ndash22) 17 terpenes at high medium and low concentrations in replicate (n = 5) would require over 250 separate evaluations To expedite this process three separate solutions containing all the terpene analytical standards were made up gravimetrically in volumetric flasks at concentrations of 5 mgmL in extraction solution
To prepare the validation samples each of these concentrated solutions were then used to volumetrically spike all the terpenes simultaneously into a conical vial containing approximately 1000 mg blank cannabis at target levels of 0025 0175 and 1500 by weight in the blank matrix For instance spiking 996 mg blank matrix with 50 microL introduced 025 mg of each terpene spiking 970 mg with 350 microL introduced 175 mg of
Giese et al Journal of AOAC International Vol 98 No 6 2015 1507
Table 1 Terpene spikes recovery repeatability precision and relative bias
Analyte introduced mg
True Wt 1000 mg RSDr Acceptable RSDr
Accuracy (recovery) Recovery limits Relative bias
Terpenoid Low (n = 5)α-Pinene 025 0025 035 35 102 85ndash110 216Camphene 025 0025 038 35 101 85ndash110 520β-Pinene 025 0025 052 35 103 85ndash110 256Myrcene 025 0025 073 35 104 85ndash110 552α-Phellandrene 025 0025 062 35 98 85ndash110 ndash216Carene 025 0025 045 35 101 85ndash110 104α-Terpinene 025 0025 082 35 96 85ndash110 ndash1184Limonene 025 0025 060 35 101 85ndash110 136β-Ocimene 025 0025 052 35 100 85ndash110 048γ-Terpinene 025 0025 067 35 102 85ndash110 ndash232Terpinolene 025 0025 042 35 96 85ndash110 ndash400Linalool 025 0025 045 35 103 85ndash110 184Fenchol 025 0025 106 35 102 85ndash110 ndash176α-Terpineol 025 0025 116 35 101 85ndash110 080β-Caryophyllene 025 0025 033 35 105 85ndash110 072α-Humulene 025 0025 059 35 102 85ndash110 216Caryophyllene oxide 025 0025 049 35 102 85ndash110 ndash656Terpenoid Medium (n = 5)α-Pinene 175 0175 006 26 100 90ndash108 226Camphene 175 0175 015 26 100 90ndash108 053β-Pinene 175 0175 020 26 101 90ndash108 184Myrcene 175 0175 032 26 101 90ndash108 354α-Phellandrene 175 0175 092 26 98 90ndash108 199Carene 175 0175 028 26 101 90ndash108 325α-Terpinene 175 0175 302 26 94 90ndash108 ndash549Limonene 175 0175 032 26 101 90ndash108 373β-Ocimene 175 0175 035 26 101 90ndash108 419γ-Terpinene 175 0175 034 26 101 90ndash108 465Terpinolene 175 0175 121 26 97 90ndash108 119Linalool 175 0175 060 26 103 90ndash108 158Fenchol 175 0175 058 26 103 90ndash108 125α-Terpineol 175 0175 066 26 104 90ndash108 211β-Caryophyllene 175 0175 053 26 103 90ndash108 233α-Humulene 175 0175 059 26 103 90ndash108 199Caryophyllene oxide 175 0175 059 26 103 90ndash108 202Terpenoid High (n = 5)α-Pinene 15 1500 018 19 100 92ndash105 ndash271Camphene 15 1500 045 19 100 92ndash105 121β-Pinene 15 1500 047 19 101 92ndash105 ndash321Myrcene 15 1500 051 19 101 92ndash105 ndash188α-Phellandrene 15 1500 041 19 99 92ndash105 144Carene 15 1500 035 19 101 92ndash105 ndash460α-Terpinene 15 1500 029 19 98 92ndash105 ndash357Limonene 15 1500 040 19 101 92ndash105 ndash221β-Ocimene 15 1500 028 19 100 92ndash105 ndash347γ-Terpinene 15 1500 039 19 100 92ndash105 ndash213Terpinolene 15 1500 021 19 99 92ndash105 ndash531Linalool 15 1500 033 19 101 92ndash105 ndash488Fenchol 15 1500 046 19 101 92ndash105 ndash381α-Terpineol 15 1500 054 19 102 92ndash105 ndash160β-Caryophyllene 15 1500 053 19 101 92ndash105 ndash513α-Humulene 15 1500 041 19 101 92ndash105 ndash275Caryophyllene oxide 15 1500 042 19 100 92ndash105 ndash649
1508 Giese et al Journal of AOAC International Vol 98 No 6 2015
each terpene and spiking 745 mg with 3 mL introduced 15 mg of each terpene In this manner the exact masses introduced (Table 1) can be converted to wt1000 mg of total mass (matrix plus total terpenes) These values are also shown in Table 1 and are the known true values in wt for the terpene validation samples
To determine accuracy (recovery) the same volumes of terpene spikes added to the blank matrixes to make the validation samples were added to empty vials (no matrix or beads) and a volume of extraction solvent was then added to each vial (both empty vials and validation samples) such that the total volume (extraction volume plus spike volume) equaled 15 mL Processing and analyzing the validation samples as described and comparing the results to the pure standards in the vial sets with no matrix present provided the percentage recovery (n = 5 at each concentration level) The absolute wt determinations at each level were used to calculate RSDr To estimate trueness reported as relative bias the average values for the validation samples were compared to the known values which had been determined gravimetrically and are listed in Table 1 All values were compared and reported as wt which can be done for the
empty vials by simply assuming 1000 mg of matrix to convert the raw result to wt
Cannabinoid Validation Samples
Obtaining reference standards for the cannabinoids in quantities required for spike recovery studies is not possible in the United Sates due to both legal and financial considerations as mentioned above Guidance (22) states that an impure specimen can serve as the reference standard if CRMs are not available and since this is the case with the cannabinoids we used a method introduced by DeBacker et al (15) and prepared our own validation samples by using concentrated forms of cannabinoid-containing extracts to spike analytes into a blank matrix When using this procedure it is critical that the linearity and the goodness of fit of calibration curves are properly assessed since the ldquotruerdquo values of these concentrated spikes are determined empirically from the calibration curves and nonlinearity of the curve can result in different ldquotruerdquo values that depend on the concentration measured
The pentane extracts generated from preparing the blanks were concentrated and provided as oils that were rich in THCA and CBGA CBDA or THCVA and THC These oils were then heated at 240degC for 15 min to decarboxylate the acidic forms
Table 2 Cannabinoid spikes recovery repeatability precision and relative bias
CannabinoidExtract
concn WtExtract
added mgAnalyte
added mgTrue Wt 1000 mg RSDr
Acceptable RSDr Recovery
Recovery limits
Relative bias
Low
THCA 672 30 20 020 41 51 10457 90ndash108 1180
CGBA(TI) 51 270 14 014 28 54 10033 90ndash108 ndash400
CBDA 731 35 25 025 06 49 9857 90ndash108 031
THCVA(TI) 91 240 22 022 14 50 10187 90ndash108 ndash445
THC 170 240 41 041 12 46 10377 90ndash108 215
CBG 38 495 19 019 05 51 10236 90ndash108 074
CBD 521 45 23 023 06 50 10213 90ndash108 035
THCV(TI) 111 270 30 030 03 48 10118 90ndash108 ndash253
Medium
THCA 672 1400 94 942 068 29 10098 95ndash102 233
CGBA(TI) 51 5000 25 253 194 35 10174 95ndash102 058
CBDA 731 1400 102 1024 028 28 10012 95ndash102 ndash146
THCVA(TI) 91 5100 46 464 142 32 10087 95ndash102 044
THC 170 5100 87 866 073 29 10209 95ndash102 685
CBG 38 7200 27 274 040 34 10277 95ndash102 693
CBD 521 3100 161 1613 042 26 10071 95ndash102 ndash030
THCV(TI) 111 5400 60 600 040 30 10339 95ndash102 ndash160
High
THCA 672 5000 336 3361 050 24 10050 95ndash102 263
CGBA(TI) 51 11700 59 591 134 31 10159 95ndash102 428
CBDA 731 4400 322 3219 071 24 10074 95ndash102 015
THCVA(TI) 91 18000 164 1636 049 26 10244 95ndash102 050
THC 170 18000 306 3058 089 24 10000 95ndash102 171
CBG 38 15900 60 604 065 30 10176 95ndash102 517
CBD 521 6690 348 3483 049 23 10125 95ndash102 ndash062
THCV(TI) 111 19200 214 2135 067 25 10521 95ndash102 ndash198
Giese et al Journal of AOAC International Vol 98 No 6 2015 1509
and provide three more extracts that were rich in CBG CBD or THCV Since there was not a clearly dominant CBGA cultivar available for extraction evaluation of CBGA was carried out with the same extract used for evaluating THCA To determine the ldquotruerdquo values of the analytes in these extracts they were each evaluated at different regions of the calibration curves by dissolving different masses of the extracts in extraction solution in volumetric flasks Since this uses unknown extracts it is an empirical procedure and sometimes several solutions need to be made up to find three that fall within the linear calibration range Good agreement between these determinations is evidence of good linearity and the averages of these determinations were taken as the ldquotruerdquo values for each of the analytes and are shown in Table 2
To prepare the validation samples the concentrates were used to gravimetrically spike blank matrix with low medium and high levels of the cannabinoids The exact masses added were dictated by the quantities of extracts that were available the concentrations of analytes present and their purity profiles For instance spiking 1000 mg blank matrix with 3 mg THCA concentrate introduced 21 mg THCA spiking 1000 mg of blank matrix with 131 mg concentrate introduced 95 mg THCA and spiking 1000 mg blank matrix with 462 mg concentrate introduced 336 mg THCA Absolute mass values were then converted to wt1000 mg of total mass (matrix plus concentrate) and these values are also shown in Table 2 These values are taken as the ldquotruerdquo values in wt for the cannabinoid validation samples
To determine accuracy (recovery) the same masses of extracts that were added to the blank matrixes to make the validation samples were added to empty vials (no matrix or beads) and a 15 mL extraction solvent was then added to each vial (both empty vials and validation samples) Processing and analyzing the validation samples as described and comparing the results to the neat extracts in the vial sets with no matrix present provided the percentage recovery The absolute wt determinations at each level were used to calculate RSDr To estimate trueness reported as relative bias the average values for the validation samples were compared to the known values which had been estimated gravimetrically and are listed in Table 2 All values are compared and reported as wt which can be done for the empty vials by simply assuming 1000 mg of sample to convert the raw result to wt
Authentic Samples for Evaluating Scope and Precision
In order to evaluate the scope and obtain a representative value for RSDr as well as intermediate precision different authentic samples containing different cannabinoid and terpene profiles were evaluated on 5 separate days as well as five times on the same day Since this number of replicates required at least 10 g sample approximately 15 g flowers were homogenized in a stainless steel coffee grinder to ensure a homogenous bulk sample for testing over the course of the study This bulk material was stored at ndash20degC between analyses The means of the analytes present should not differ significantly and the
acceptable RSDr values for the analytes are given by Equation 3 below (22)
Application of the Method
As an example of the utility of this method plants from a typical California production operation were sampled at the cultivation site to illustrate the variability that occurs with this agricultural crop in typical uncontrolled and unregulated production environments One-third of the total population was randomly chosen across the growing area for sampling Samples of flowers were taken from each plant at various vertical locations within the plant canopy The samples were allowed to dry to approximately 10 moisture at ambient temperature and then trimmed to mimic separate medical cannabis flowers that can be delivered to dispensaries as part of the same lot of material Flowers were stored at ndash20degC in sealed plastic containers until analyses
Calculations and Reporting
All instrumental assays for terpenes and cannabinoids at a single dilution ratio were configured to use the associated software packages (ChemStation C0106[61] on the Agilent 1290 and TotalChrom 632 on the Clarus 680) to calculate wt values based on ISTD calibration curves which was nonane (01 mgmL) for the terpenes and IBU (02 mgmL) for the cannabinoids For analysis of both major and minor cannabinoids which required two dilution factors the intermediate values were obtained from ESTD calibration curves and reported as Raw wt In order to correct for recovery in the sample preparation and dilution processes the final wt for each dilution factor y was calculated according to the following equation (vide infra)
119865119865119865119865119865119865119865119865119865119865119865119865119865119865119865119865119865119865119865119865 119908119908119908119908119908119908119908119908119863119863119863119863119865119865119865119865119910119910119910119910 = 119877119877119877119877119865119865119865119865119908119908119908119908 119908119908119908119908119908119908119908119908(1 + ∆)
(1)
where
∆ = (119860119860119860119860119861119861119861119861119861119861119861119861119861119861119861119861119860119860119860119860)119878119878119878119878119878119878119878119878119878119878119878119878119878119878119878119878119878119878119878119878119878119878119878119878 minus (119860119860119860119860119861119861119861119861119861119861119861119861119861119861119861119861119860119860119860119860)119870119870119870119870119870119870119870119870119870119870119870119870119870119870119870119870119870119870119870119870
(119860119860119860119860119861119861119861119861119861119861119861119861119861119861119861119861119860119860119860119860)119870119870119870119870119870119870119870119870119870119870119870119870119870119870119870119870119870119870119870119870
(2)
(ABPCA)Known is the experimentally determined peak area of BPCA at dilution factor y and (ABPCA)Sample is peak area of BPCA found in the sample at dilution factor y
Acceptable RSDr values were calculated according to the equation
RSD(r) = 2Cndash01505 (3)
where C is the analyte concentration expressed as a mass fraction Guidance states the predicted relative standard deviation (PRSD) should be Cndash01505 and acceptable values are typically frac12 to 2 times this value (22) so Equation 3 is taken as the upper limit of acceptability
1510 Giese et al Journal of AOAC International Vol 98 No 6 2015
Results and Discussion
GC-FID Analysis of the Terpenes
The GC method provided sufficient resolution of all terpenes of interest in 35 min and Table 3 provides the relative retention times The relative retention times of a number of other terpenes reported to be found in cannabis are also given to demonstrate selectivity but since these analytes were not of interest due to reasons mentioned in the introduction the instrument was not calibrated for them
Each calibration curve was obtained in triplicate Table 3 shows the average injection RSDs over the entire range correlation coefficients and the averages of the residuals (reported as the percentage difference between the experimental points and the fitted line) A complete discussion of the analysis is outside the scope of this article however correlation coefficients greater than 099 and residuals with a random distribution and a mean close to zero are indicative of an acceptable fit of the data (2 32)
This table also provides the retention times of each of the terpenes with the analytical HPLC method used for the cannabinoids to demonstrate selectivity for these components which can show up in the HPLC method when present in very high concentrations
HPLC-DAD Analysis of the Cannabinoids
The HPLC method provided sufficient resolution of the major cannabinoids of interest in 17 min (Figure 1) and the relative retention times are provided in Table 4 The upper chromatogram is an overlay of the neutral cannabinoid standards and the acidic cannabinoid standards Baseline resolution of CBGCBD and THCACBC is lost at the highest calibration level but there is still good linearity and RSDs are within acceptable limits at all concentration levels
As mentioned previously authentic standards for CBGA THCVA THCV CBDVA and CBDV are not easily obtained Rather than wait for the legal climate to change we sought tentative identifications by MS to provide a method for laboratories to quantify these important analytes A full discussion of our survey of CBGA-rich and propyl-rich cultivars is outside the scope of this publication however we worked closely with cultivators to obtain a number of cultivars with these purported analytes present in high levels of 7 to 20 which greatly facilitates their identification Since our laboratory (like many others) does not have the resources for an LCMS system to directly correlate with LC-UV we analyzed extracts of these cultivars by GCMS and tentatively identified the major analytes by their mass spectra and similarities of retention times to those derived from authentic material (33)
We then compared the chromatograms from GCMS to those from HPLC-UV and there were very clear correlations between the major peak areas as well as their ratios This was especially true of cultivars containing THCA CBDA THCVA and CBDVA where proposed biosynthetic pathways (36) suggest the relative ratios of THCACBDA and THCVACBDVA should be nearly equivalent The THCACBDA ratios were determined from authentic standards and there was good correlation with the ratios from the tentatively identified THCVACBDVA peaks Both heated and unheated extracts were analyzed by GCMS
and HPLC-UV to identify the retention times of both the acidic and decarboxylated neutral species by HPLC and again clear correlations could be seen between peak areas as well as their appearance and disappearance from decarboxylation This is especially evident with CBGA and CBG since there was good correlation between the disappearance of the CBGA peak (TI) and appearance of the CBG peak (identified from authentic standards) The central chromatogram in Figure 1 is an overlay of an unheated (blue) and heated (red) extract containing CBDVA and THCVA (color figure is available online at httpaoacpublisheringentaconnectcomcontentaoacjaoac) The disappearance of the peaks attributed to CBDVA and THCVA and the appearance of the peaks attributed to CBDV and THCV can be seen The retention times and elution orders of the decarboxylated species compared favorably with those obtained from authentic materials (34) The lower chromatogram in Figure 1 is a cultivar containing both CBDA and CBGA These were identified by GCMS (as well as authentic standard for
Table 3 Terpenoid retention times and calibration curve analysis
Analyte
GC RRT mina
HPLC RRT min R2
Mean residuals
Avg
RSD
α-Pinene 1180 4768 0999 ndash110 056
Camphene 1271 3732 0999 ndash110 072
Sabinene 1406
β-Pinene 1428 3871 0999 ndash100 072
Myrcene 1484 3153 0999 ndash093 104
α-Phellandrene 1601 3738 0999 ndash126 090
Careen 1619 4200 0999 ndash100 093
α-Terpinene 1671 3531 0999 057 088
Cymene 1738
Limonene 1754 3713 0999 ndash109 091
Cineole 1789
trans-Ocimene 1866 3041 0999 ndash048 134
γ-Terpinene 1957 3603 0999 ndash116 106
Terpinolene 2157 3568 0999 ndash108 121
Linalool 2262 0854 0999 077 208
Fenchol 2415 0382 0999 031 215
Borneol 2751
α-Terpineol 3018 0833 0999 004 210
Nerol 3114
Neral 3205
Geraniol 3299
Geranial 3407
β-Caryophyllene 4818 8439 0999 036 224
trans-Nerolidol 4886
cis-Nerolidol 5061
α-Humulene 5096 8248 0999 033 228
Caryophyllene oxide
6041 2594 0998 009 248
a RRT = Relative retention time
Giese et al Journal of AOAC International Vol 98 No 6 2015 1511
CBDA by HPLC) and when this extract was heated both peaks disappeared and gave rise to peaks identified as their neutral counterparts by authentic standards Based on these studies we tentatively identified the retention times of CBGA THCVA CBDVA THCV and CBDV analytes and these analytes are labeled with TI CBCA is missing from our analyses due to the lack of either a readily available standard or a cultivar known to be rich in CBCA Based on other analyses (23) CBCA likely elutes after THCA near the end of the run so a slight extension of the run may be required As mentioned above tentatively identified analytes were quantified by referencing the calibration curves of analytical standards with similar spectral properties (35) While this is certainly not the ideal situation it provides a path forward until analytical standards for these other important analytes become readily available
Each calibration curve obtained with analytical standards was produced in triplicate and Table 4 shows the average injection RSDs over the entire range correlation coefficients and the averages of the residuals (reported as the percentage difference between the experimental points and the fitted line) The data set from the calibration runs could be used to generate both ISTD and ESTD calibration curves (by simply selecting or deselecting the option before reprocessing results) and the parameters are shown for both Correlation coefficients greater than 099 and
residuals with a random distribution and a mean close to zero are indicative of an acceptable fit of the data (2 32)
LOQ
Due to the impossibility of obtaining authentic blanks for all the analytes the LOQs were estimated from the calibration curves ICH Q2B guidance states that the LOQ can be estimated from the calibration curve of an analyte using the formula LOQ = 10 (σm) where σ is the SD of the y-intercept and m is the slope (20) This was done for each analyte and LOQ was generally found to be in the range of 0005ndash0008 mgmL This was then tested experimentally by diluting standards to 0008 and 0004 mgmL and verifying the measured values were within 20 of the known values All the analytes satisfied the requirement at the 0008 mgmL level and this was taken as the LOQ for all of the analytes Given the standard sample mass extraction volumes and dilution ratios used for these assays this corresponds to 0012 for the terpenoids and 007 for the cannabinoids at the 16 dilution Although this was not verified for every analyte Tables 5ndash9 for the intermediate precision studies show that analytes found near these levels displayed acceptable RSDs as given by Equation 3 suggesting these LOQs are adequately defined
ISTDs in the Cannabinoid Assay
The uses and benefits of ISTDs in analytical assays and sample preparation are well established (22 37ndash39) The use of nonane as the ISTD for terpene analysis is analytically rigorous and compensates for variability in recovery and peak area in typical fashion The use of both IBU and BPCA in the cannabinoid assay however requires some discussion
Table 4 Cannabinoid retention times and calibration curve analysis
Analyte
HPLC RRT min
ISTD ESTD
R2
Mean residuals
Avg RSD
R2
Mean residuals
Avg RSD
BPCA 0570
Ibuprofen 1000
CBDVA (TI) 1418
CBDV (TI) 1575
CBDA 2249 1000 038 101 1000 008 090
CBGA (TI) 2420
CBG 2609 1000 ndash009 039 1000 ndash062 028
CBD 2727 1000 007 047 1000 ndash045 033
THCV (TI) 2919
THCVA (TI) 4064
CBN 4560 1000 037 041 1000 ndash015 042
THC 5931 1000 ndash033 038 1000 ndash086 036
D8-THC 6216 1000 ndash023 061 1000 ndash076 055
CBC 7201 1000 013 050 1000 ndash039 033
THCA 7320 1000 026 052 1000 ndash004 043
Figure 1 (Top) Acidic and neutral cannabinoid standards (Middle) Heated and unheated extracts containing THCV(A) (TI) and CBDV(A) (TI) (Bottom) Extract containing CBDA and CBGA (TI)
CBDA
CB
G
CBD
CBN
D8)THC
TH
C
CBC
THCA
THCV
A(TI)
THCV
(TI)CBDV
A(TI)
CBDV
(TI)
CBDA
CB
GA(T
I)
1512 Giese et al Journal of AOAC International Vol 98 No 6 2015
The method of using two different ISTDs for different purposes was the result of several factors encountered during method development and sample analysis (1) the availability stability cost and supplied form of cannabinoid analytical standards can make it impractical for many laboratories to prepare multiple calibration solutions with different concentrations of ISTDs (2) the linear range of the cannabinoid assay was approximately 15 orders of magnitude (0016ndash0250 mgmL) however analyte concentrations can span over 2 orders of magnitude (01ndash40 by weight) and this requires separate dilution ratios for both the minor and major cannabinoids to remain in the linear range of the calibration curve and (3) when testing unknown samples (especially water hash and extracts) the cannabinoid concentrations are unpredictable and can be even higher (as high as 80 by weight) Since the sample had already been processed the only way to bring the properly stored extraction slurry (4degC for no longer than 24 h) into the linear range for reanalysis was to use a larger dilution factor
When an assay and calibration curves are developed with an ISTD present the concentration of the ISTD in the final aliquot for analysis must remain fixed at the level used to generate the calibration curves If it is anticipated a sample is ldquotypicalrdquo and only the major cannabinoid profile is desired (25ndash36 by weight with the given mass and solvent ratios) only a single 96-fold dilution is needed In this case spiking the sample with 1 mL of ISTD spike solution adding 14 mL of diluent extracting the sample and then diluting 96-fold provides an aliquot for analysis with a theoretical 02 mgmL IBU concentration for analysis with the HPLC method that utilizes the ISTD curve
While the use of IBU as the ISTD in the aforementioned manner is analytically rigorous and is used by our laboratory at times we typically use the method described herein where BPCA is used as the ISTD In this case the surrogate is added to the sample at a fixed concentration via the extraction solution and variation in analyte recovery due to sample preparation andor dilution is estimated by the recovery of the surrogate which can then be used as a correction factor for the raw
result The instrument parameters are set to use the ESTD calibration curves and a correction factor given by Equation 1 is applied to the raw result This procedure is also analytically rigorous (22 39) and while it does not benefit generation of the calibration curves as with the first method careful method development to ensure linearity and injection precision mitigates this issue This procedure has the added benefits that it does not rely on the precision andor accuracy of ISTD spikes by different laboratory technicians and it can be applied to any dilution ratio needed by comparing the experimental peak area of the surrogate to the known peak area of the surrogate determined at each concentration
In this specific case the extraction solution with BPCA at 20 mgmL is diluted 6-fold (0333 mgmL) and 96-fold (0021 mgmL) in replicate and the average peak areas are determined The correction for recovery is then given by Equation 1 for each of those dilution factors If a processed sample is found to be outside the linear range of the calibration curve a correction factor can quickly be determined at a different dilution ratio and the properly stored extract rediluted for analysis This process is much faster than preparing new calibration solutions of expensive cannabinoid standards with ISTDs at the appropriate concentrations and recalibrating the instrument Typically the reporting methods and appropriate correction factors for several dilution factors are stored in the ChemStation software and simply applied to the individual sample dilutions as needed
To demonstrate the use of this correction a CO2 wax was analyzed for THCA by dissolving the wax in a suitable volume of extraction solution in a volumetric flask so as to not require any dilution for analysis (n = 2) and the average was taken as the ldquotruerdquo value The wax was then reanalyzed by dissolving 267 mg in 10 mL of extraction solution and diluting 96-fold in the typical manner as well as intentionally adding 20 more and 20 less of the extract (n = 5 for each) The process was then repeated by dissolving 168 mg in 100 mL of extraction solution and diluting 6-fold in the typical manner as well as introducing the same intentional dilution errors (n = 5 for each) Table 10 shows the
Table 5 ACDC analyzed on 5 different days and five times on the same day
Replicateα-
Pineneβ-
Pinene Myrcene Limonene Linaloolα-
Terpineolβ-
Caryophylleneα-
Humulene THCA CBDACBGA
(TI) CBD
D1 0384 0173 1173 0079 0020 0017 0273 0087 049 15232 068 0489
D2 0326 0153 1036 0072 0020 0017 0259 0082 050 15460 069 0472
D3 0298 0144 0975 0068 0021 0017 0256 0082 050 1532 069 048
D4 0293 0142 0962 0068 0021 0016 0253 0081 049 1523 067 048
D5a 0266 0134 0907 0065 0022 0017 0249 0080 049 15232 068 0489
D5b 0256 0131 0886 0064 0022 0017 0253 0081 050 15460 069 0472
D5c 0249 0128 0859 0063 0022 0016 0248 0079 050 1532 069 048
D5d 0247 0128 0860 0063 0023 0017 0254 0081 049 1523 067 048
D5e 0239 0124 0835 0062 0022 0017 0253 0080 049 1521 065 051
Interday avg 0313 0149 1011 0070 0021 0017 0258 0082 049 1529 067 049
RSD 143 98 101 74 41 19 36 34 09 07 25 32
Intraday avg 0251 0129 0870 0063 0022 0017 0251 0080 049 1529 067 049
RSD 40 30 32 22 09 10 11 13 09 07 25 32
Acceptable RSDr
47 53 40 59 71 74 49 58 44 27 42 44
Giese et al Journal of AOAC International Vol 98 No 6 2015 1513Ta
ble
6
Mas
ter K
ush
anal
yzed
on
5 di
ffere
nt d
ays
and
five
times
on
the
sam
e da
y
Rep
licat
eα-
Pine
neβ-
Pine
neM
yrce
neLi
mon
ene
Lina
lool
α-Te
rpin
eol
β-C
aryo
phyl
lene
α-H
umul
ene
THC
AC
BGA(
TI)
THC
D1
0
038
007
30
197
047
30
154
004
90
051
043
319
82
066
050
D2
0
032
006
30
166
040
80
139
004
50
046
039
018
44
064
049
D3
0
033
006
50
168
042
10
151
004
90
051
042
720
12
070
052
D4
0
031
006
10
155
039
10
142
004
60
048
039
618
99
066
052
D5a
0
030
005
90
149
038
20
145
004
70
049
040
519
37
065
056
D5b
0
029
005
90
147
037
70
145
004
70
049
040
519
33
063
056
D5c
0
030
006
00
148
038
20
147
004
70
050
041
619
58
065
057
D5d
0
029
005
80
143
037
00
143
004
60
049
040
519
01
068
052
D5e
0
029
005
90
144
037
50
148
004
70
050
041
719
65
064
058
Inte
rday
ave
rage
0
033
006
40
167
041
50
146
004
70
049
041
019
35
066
052
RSD
10
08
311
18
64
34
14
04
63
43
45
7
Intra
day
aver
age
0
030
005
90
146
037
70
145
004
70
049
040
919
39
065
056
RSD
1
41
11
81
31
20
91
51
61
32
84
2
Acce
ptab
le R
SDr
6
76
05
24
65
36
36
34
62
64
24
4
Tabl
e 7
Pi
nche
rrsquos C
reek
ana
lyze
d on
5 d
iffer
ent d
ays
and
five
times
on
the
sam
e da
y
Rep
licat
eα-
Pi
nene
β-
Pine
neM
yrce
neLi
mon
ene
β-
Oci
men
eLi
nalo
olFe
ncho
lα-
Te
rpin
eol
β-
Car
yoph
ylle
neα-
Hum
ulen
eC
aryo
phyl
lene
ox
ide
THC
AC
BGA
(TI)
THC
VA
(TI)
THC
CBG
D1
0
086
005
90
428
014
80
229
006
80
024
002
50
269
009
90
019
184
12
070
151
106
013
D2
0
077
005
40
380
013
60
208
006
50
024
002
40
258
009
40
020
184
72
060
156
106
013
D3
0
073
005
20
363
013
20
201
006
70
024
002
50
262
009
60
020
184
22
080
161
100
13
D4
0
070
005
00
343
012
50
191
006
50
024
002
40
253
009
30
020
181
42
030
151
080
13
D5a
0
068
004
90
334
012
40
188
006
60
024
002
40
257
009
40
022
182
32
060
151
113
013
D5b
0
067
004
90
326
012
20
185
006
50
024
002
40
254
009
40
021
181
52
060
151
118
013
D5c
0
066
004
80
317
011
90
181
006
50
024
002
40
252
009
30
020
180
62
040
151
130
13
D5d
0
066
004
70
313
011
80
178
006
40
023
002
40
249
009
20
021
184
22
050
151
130
13
D5e
0
066
004
80
314
011
90
180
006
50
024
002
40
253
009
30
022
185
62
080
161
150
13
Inte
rday
a
vera
ge
007
50
053
037
00
133
020
40
066
002
40
024
026
00
095
002
018
33
206
015
109
013
RSD
9
57
010
17
28
12
11
62
12
42
46
90
81
02
32
41
0
Intra
day
ave
rage
0
067
004
80
321
012
00
182
006
50
024
002
40
253
009
30
021
182
82
060
151
140
13
RSD
1
41
82
82
32
21
11
30
61
11
13
11
10
71
41
91
5
Acce
ptab
le
RSD
r
59
62
46
54
51
60
70
70
49
57
72
26
36
53
39
54
1514 Giese et al Journal of AOAC International Vol 98 No 6 2015Ta
ble
8
A TH
CVA
hyb
rid a
naly
zed
on 5
diff
eren
t day
s an
d fiv
e tim
es o
n th
e sa
me
day
Rep
licat
eα-
Pi
nene
β-
Pine
neM
yrce
neLi
mon
ene
β-
Oci
men
eLi
nalo
olFe
ncho
lα-
Te
rpin
eol
β-
Car
yoph
ylle
neα-
H
umul
ene
THC
AC
BDA
CBG
A (T
I)TH
CVA
(T
I)C
BDVA
(T
I)TH
CC
BDC
BGTH
CV
(TI)
CBD
V (T
I)D
1
007
70
029
035
90
109
022
70
066
001
90
019
026
10
225
368
105
80
540
811
390
480
280
090
070
04
D2
0
062
002
40
298
009
30
196
006
00
017
001
70
237
020
63
449
670
500
781
290
450
260
080
060
04
D3
0
058
002
30
278
008
90
184
006
10
017
001
80
234
020
33
469
700
510
791
300
440
270
080
070
04
D4
0
057
002
30
276
008
90
185
006
20
018
001
80
239
020
73
519
460
500
801
310
450
270
080
070
04
D5a
0
052
002
10
255
008
40
173
005
90
017
001
70
227
019
83
519
790
490
781
290
470
290
080
070
04
D5b
0
052
002
10
256
008
40
175
006
10
017
001
80
232
020
23
529
780
500
751
310
480
290
080
070
04
D5c
0
051
002
10
252
008
30
173
005
90
017
001
70
227
019
73
439
600
480
771
270
450
280
080
070
04
D5d
0
050
002
10
246
008
20
171
006
00
017
001
80
232
020
13
419
790
480
781
290
460
290
080
070
04
D5e
0
050
002
10
246
008
20
174
006
30
018
001
80
238
020
73
5110
03
050
077
134
048
030
008
007
004
Inte
rday
av
erag
e
006
10
024
029
30
093
019
30
062
001
70
018
024
00
208
352
984
051
079
131
046
027
008
007
004
RSD
15
411
913
510
310
64
65
04
45
24
92
64
43
71
63
23
73
44
02
45
3
Intra
day
aver
age
0
051
002
10
251
008
30
173
006
00
017
001
80
231
020
13
489
800
490
771
300
470
290
080
070
04
RSD
2
30
92
11
20
92
52
81
81
91
81
51
62
01
42
03
22
22
12
41
7
Acce
ptab
le
RSD
r
61
70
48
57
51
61
73
73
49
51
33
28
44
41
38
45
49
58
60
65
Tabl
e 9
Tr
ainW
reck
ana
lyze
d on
5 d
iffer
ent d
ays
and
five
times
on
the
sam
e da
y
Rep
licat
eα-
Pi
nene
β-
Pine
neM
yrce
neα-
Ph
ella
ndre
neC
aren
eα-
Te
rpin
ene
Lim
onen
eβ-
O
cim
ene
γ-
Terp
inen
eTe
rpin
olen
eLi
nalo
olα-
Te
rpin
eol
β-
Car
yoph
ylle
neα-
H
umul
ene
THC
AC
BGA
(TI)
THC
CBG
D1
0
062
010
30
342
004
90
042
003
40
141
030
50
020
093
10
035
003
40
173
004
816
97
120
115
014
D2
0
046
008
20
265
003
90
034
002
80
117
025
30
018
079
40
033
003
30
163
004
516
55
116
119
014
D3
0
041
007
60
240
003
60
032
002
50
108
023
20
018
071
30
033
003
30
160
004
516
72
118
116
014
D4
0
040
007
40
233
003
40
031
002
20
106
023
00
018
067
20
033
003
30
161
004
516
96
119
120
014
D5a
0
036
006
90
214
003
20
030
002
10
100
021
60
016
065
30
033
003
30
161
004
517
46
121
126
015
D5b
0
035
006
70
206
003
10
029
002
00
096
020
90
016
063
60
032
003
30
157
004
416
84
119
124
014
D5c
0
034
006
60
201
003
00
028
002
00
095
020
60
016
063
20
033
003
30
158
004
417
11
119
122
014
D5d
0
033
006
30
192
002
90
027
001
90
091
019
90
015
061
10
032
003
20
156
004
416
76
117
120
014
D5e
0
033
006
30
188
002
80
027
001
80
090
019
60
015
059
70
032
003
20
155
004
316
89
118
121
014
Inte
rday
av
erag
e
004
50
081
025
90
038
003
40
026
011
40
247
001
80
753
003
30
033
016
30
045
169
31
191
190
14
RSD
22
216
419
318
213
821
114
014
17
815
12
21
73
23
02
01
63
61
8
Intra
day
aver
age
0
034
006
50
200
003
00
028
002
00
094
020
50
016
062
60
033
003
30
157
004
417
01
119
123
014
RSD
4
34
05
24
73
95
14
23
93
33
51
31
11
51
51
61
31
91
8
Acce
ptab
le
RSD
r
64
58
49
65
66
69
55
49
73
42
66
66
52
63
26
39
39
53
Giese et al Journal of AOAC International Vol 98 No 6 2015 1515
results for both corrected and uncorrected values In all cases the corrected values are much closer to the true value RSDs are reduced by half and the relative error is also greatly reduced While gross errors such as an error of 20 in sample volumes still show some deviation from the true value they are still reasonable and typical dilution errors are easily compensated for as shown by the first set of dilutions This also demonstrates the ability of a single BPCA concentration to compensate for recovery at both a 6-fold (169 mg in 100 mL) and 96-fold (267 mg in 10 mL) dilution
To demonstrate the applicability to typical sample processing a sample of flowers was homogenized in a stainless steel coffee grinder and two different technicians each analyzed five separate samples in replicate (n = 5) using a different pipet technique for diluting each sample The techniques were standard with (1) prewetting the tip (2) reverse pipet (3) standard with rinsing the pipet tip in the diluent (4) multichannel pipet (5) and serial dilution (5) They were specifically instructed to show ldquoless carerdquo so this was not an evaluation of the various pipetting techniques In this case the ldquotruerdquo value was not known since it was being determined by the analyses The average values are represented as the lines in Figure 2 For the uncorrected wt values the overall average was lower and there was a clear systematic error related to the technician with technician A always generating lower values than technician B The corrected wt values however were
all very similar regardless of the pipet technique used or the technician The RSDs are shown in the lower chart and on average the RSDs using the correction factor were half of those not using the correction factor This suggests that using BPCA as a surrogate to correct for recovery was quite applicable to the typical workflow in the laboratory
If the samples generally have known analyte concentrations and ranges the linear range of the assay volumes of spike solution with IBU and dilution ratios can be tailored to use a single ISTD (IBU) in the typical fashion with the ISTD calibration curves Verifying a wider linear range for a single calibration curve would simplify the situation however a linear calibration range (as determined via analysis of both correlation coefficients and residuals) on an HPLC-UV assay over 2 orders of magnitude (for concentrations of THCA from 01 to approximately 40) can be difficult to attain Likewise once cannabinoid standards are made available in pure solid forms it will become easier to prepare multiple calibration solutions with different ISTDs and concentrations However for a laboratory processing a large amount of unknowns having a second method that used a surrogate (BPCA) to correct for recovery at any dilution factor provided a pragmatic solution that minimized variability and systematized the process while still accommodating the wide range of analyte concentrations There are some well known limitations to using a single surrogate at a single concentration to approximate the behavior of a number of analytes with a wide
Table 10 Dilution error correction with BPCA
Raw Corrected Relative error RSD
Average plusmn Average plusmn Raw Corrected Raw Corrected
ldquoTruerdquo 738 156 738 156 00 00 21 21
96-fold 683 069 736 024 ndash74 ndash02 10 03
6-fold 722 061 757 029 ndash22 26 08 04
96+20 8328 102 7388 025 128 01 12 03
6+20 8415 093 7740 014 140 49 11 02
96ndash20 5677 106 7314 038 ndash231 ndash09 19 05
6ndash20 5926 107 7354 038 ndash197 ndash04 18 05
Figure 2 Total recovery correction with authentic samples
1516 Giese et al Journal of AOAC International Vol 98 No 6 2015
range of concentrations (39) however method development and validation suggest this process performs adequately for this assay
Optimization of the HTH Parameters
For reasons mentioned earlier we sought to utilize HTH for sample preparation We sought to optimize the process with respect to bead type and bead volume extraction time extraction solvent volume and sample mass by maximizing the amounts of analytes extracted and as well as minimizing the RSDs Enough flower material to be considered compositionally equivalent for that study was reduced to a homogeneous mixture in a stainless steel coffee grinder and each condition was evaluated in triplicate Every analyte was evaluated individually however they closely mirrored the total amounts so only totals are discussed in the interest of brevity Individual analytes will be addressed in the Spike Recovery and Intermediate Precision study sections below
Table 11 shows the concentrations of analytes extracted and the RSDs for different volumes and types of beads The parameters appeared to have no statistically significant effect on the total amounts of analytes extracted and the results were essentially identical Due to the fact that 1 mL of 20 mm zirconia beads gave the lowest RSDs for both the cannabinoids and the terpenes and due to the lower cost and disposable nature of these beads they were chosen for all subsequent experiments
Table 11 shows the concentrations of analytes extracted and the RSDs for the five different extraction times that were
evaluated The parameters appeared to have no statistically significant effect on the total amounts of analytes extracted however a slight trend suggested longer times resulted in lower concentrations and higher RSD for the terpenes so 6 min was chosen as the time for all subsequent experiments
Table 11 shows the concentrations of analytes extracted and the RSDs for three different extraction volumes that were evaluated Smaller volumes were not evaluated since 1000 mg of plant material in 10 mL of solvent provided a thicker slurry that was difficult to work with Again the parameters appeared to have no statistically significant effect on the total amounts of analytes extracted While the RSD was slightly higher for the terpenes in 15 mL of solvent it was still quite low and this volume was chosen for all subsequent processing to minimize cost and waste
Table 11 shows the concentrations of analytes extracted and the RSDs for four different sample masses that were evaluated While the absolute amounts extracted all fell within the error bars the RSDs showed a clear dependence on sample size for both the cannabinoids and the terpenes This was not completely unexpected as the bulk homogenized plant material was not a fine powder and there were still pieces of stem and leaf present as well as aggregates of plant matter due to the sticky nature of the samples These factors had a much greater influence on the homogeneity of small sample sizes and affected precision in a similar manner A sample size of 1000 plusmn 20 mg was used for subsequent analyses
Table 11 Optimization of HTH parameters
Variable Total cannabinoids Wt plusmn RSD Total terpenoids Wt plusmn RSD
Bead size and volume
532 stainless (1 mL) 2027 015 08 1470 0000 00
28 mm stainless (1 mL) 2069 029 14 1483 0031 21
30 mm zirconium (1 mL) 2041 050 24 1450 0000 00
20 mm zirconium (1 mL) 2044 015 07 1440 0010 07
532 stainless (2 mL) 2083 052 25 1415 0007 05
28 mm stainless (2 mL) 2065 029 14 1420 0035 24
30 mm zirconium (2 mL) 2043 036 18 1430 0026 19
20 mm zirconium (2 mL) 2115 057 27 1400 0020 14
Extraction time min
2 2172 010 04 1557 0006 04
4 2172 013 06 1530 0010 07
6 2200 025 11 1543 0006 04
8 2213 042 19 1533 0006 04
10 2205 020 09 1490 0026 18
Solvent volume mL
15 2424 045 19 1880 0046 24
20 2445 058 24 1940 0026 14
25 2413 033 14 1920 0052 27
Sample mass mg
250 2583 069 27 1929 0064 33
500 2526 047 19 1919 0056 29
750 2566 024 09 2007 0025 13
1000 2528 017 07 2016 0011 05
Giese et al Journal of AOAC International Vol 98 No 6 2015 1517
Since none of the above variables were found to significantly influence the results it was assumed the extraction was optimized and efficient To verify this the bead beating procedure was compared to accepted sonication procedures one recommended by the AHP and used by the University of Mississippi to process samples submitted by the DEA (1) and the other recommended by UNDOC for the analysis of cannabis (25)
The AHP procedure involved macerating a 100 mg sample in 3 mL of methanolndashchloroform (9 + 1 vv) for 1 h followed by sonication for 5 min and filtration into a vial for analysis The UNDOC procedure involved 200 mg of cannabis with 20 mL of ethanol for 20 min Slight modifications to the recommended procedures had to be used for direct comparison The cannabis could not be dried and powdered since this would affect the terpene profiles and we increased the sample mass tested to 500 mg to reduce RSDs with fresh inflorescences (as demonstrated above) but retained the mass-to-solvent ratios recommended by each method Due to interfering peaks with the chloroformndashmethanol extraction BPCA correction or recovery could not be applied so raw results were reported for the AHPA method
This was carried out in triplicate for a Type I and Type II cultivar with slightly different terpene profiles Figure 3 shows bar charts of the average wt as well as the RSDs for each analyte There were no significant differences between the methods and the profiles were nearly identical with the exception of slightly lower RSDs for the HTH method The larger RSDs (gt5) were for analytes that were present at low levels (limonene was not detected with the UNDOC method due to the larger solvent volume) however they all exhibited the same general behavior Demonstrating equivalence to recommended methodologies indicates the HTH extraction was complete
The robustness of the procedure with respect to cultivar and throughput was also evaluated This is an important step since there is a very wide range of morphologically different flowers that very often contain distinct analyte profiles While it is not possible to do this for every different cultivar five cultivars were chosen to cover varying flower morphologies from loose to compact and a variety of cannabinoids and terpenes These five cultivars were extracted by both HTH and sonication procedures under typical workflow conditions in the laboratory (ie multiple samples being processed at the same time and reduced solvent volumes) and the results were compared
The results for processing samples by HTH and sonication procedures in replicate (n = 5) are shown in Figure 4 It can be seen that the relative ldquofingerprintsrdquo of each cultivar are identical for both methods indicating that all the analytes were extracted equally however total extraction for both cannabinoids and terpenes was significantly higher with bead beating than with sonication almost double for some cultivars The RSDs were also significantly lower with bead beating than with sonication and average bead beating RSDs across all cultivars was less than 2 for both cannabinoids and terpenes opposed to 212 and 165 respectively for sonication It is also seen that the RSDs for all of the analytes in each sample were of similar magnitude again indicating similar behavior of the analytes within each method and cultivar
It is important to acknowledge that some sonication parameters in the literature for the extraction of cannabinoids typically use much larger solvent to sample mass ratios which undoubtedly improves extraction efficiency However these larger ratios not only increase the amount of solvent needed for analysis but also reduce the concentrations of many terpenes in the resulting extract to levels that result in unacceptable detection limits so parameters that were optimized for HTH were used The higher RSDs noted with sonication may also have been due to different locations of sample tubes within the sonication bath as well as differing flower morphologies The HTH mitigates all of these issues and this is a critical feature of an efficient sample processing method
Terpene Spike Recovery
Table 1 shows the mass of each terpene standard introduced the true wt of each terpene in 1000 mg of matrix the accuracy (recovery) RSDr and trueness ( relative bias) for each of the terpenes at low medium and high concentrations The acceptable limit for RSDr is given by Equation 3 The acceptable values for recovery at each of the concentration ranges are also listed and are given by AOAC (22) In all cases the precision and recovery met accepted limits The relative bias is also reported which is the difference between the average measured value and the known value determined by gravimetric addition of the standards In most cases bias closely follows recovery indicating good linearity of the calibration curves preparation of the spikes and that the assay should give results close to the true values
Figure 3 Comparison of HTH to AHPA and UNDOC sonication procedures
1518 Giese et al Journal of AOAC International Vol 98 No 6 2015
A clear outlier with respect to relative bias was α-terpinene Despite acceptable recovery values there was significant negate bias compared to the others indicating the measured value is less than the value anticipated based on the mass spiked into the matrix Note that all three terpinenes (α-phellandrene α-terpinene and terpinolene) exhibited lower recoveries and bias This is a real effect and has been found to occur in extracts kept in clear vials loaded in the GC autosampler as was the case for these spike recovery studies This does not occur with standards kept in clear vials on top of the gas chromatograph for a short period (lt24 h) and the rate of decomposition in extracts is reduced dramatically when amber vials are used
All three of the terpinenes exhibited identical behavior however only terpinolene is discussed in detail due to the prevalence of terpinolene dominant cultivars Figure 5 shows the levels of terpinolene in an extract of TrainWreck at three time points 0 3 and 18 h in both clear and amber vials loaded in the gas chromatograph autosampler tray An obvious decrease in the level of terpinolene can be seen in the clear vial To explore this further terpene standards were added to diluent in a clear vial and they were added to the same volume of extract from a nonterpinolene containing cultivar in both clear and amber vials The charts show that the standards were stable but when they were diluted into extract in a clear vial there was a steady decrease in concentration This decrease was not seen when the mixture was placed in an amber vial Given the prevalence of terpinolene dominant cultivars such as TrainWreck and Jack the Ripper it is critical that extracts are placed in amber vials for analysis to obtain accurate results for the terpene profiles
Cannabinoid Spike Recovery
Table 2 shows the concentration of the desired analyte in the extract the mass of extract added to the blank matrix the mass of analyte introduced via the extract and the conversion of mg of analyte to wt1000 mg of matrix The table also lists the accuracy (recovery) RSDr and trueness ( relative bias) for each of the cannabinoids at low medium and high concentrations The acceptable limit for RSDr is also listed and this is given by Equation 3 The acceptable values for recovery at each of the concentration ranges are also listed and are given by AOAC (22) The exact levels of analytes introduced were
dictated by the amount of extract available to do the experiments as well as the purity profiles of the extracts
The precision was acceptable for all of the cannabinoids although it was relatively higher for THCA at the low concentration range This was undoubtedly due to the variable residual amounts of THCA present in the blank matrix and an average background value was subtracted out of each matrix spike Note that CBGA also exhibited a higher RSD and this analyte was also present in the blank matrix at a higher level All analytes met accepted recovery limits with the exception of THCV which was slightly over the acceptable value This was most likely due to the fact that this extract contained an even larger amount of CBD which overloaded the column and resulted in some loss of baseline resolution of those two analytes The relative bias was also quite good suggesting this assay can provide results that are reasonably close to true values
A few comments are necessary on this method of spike recovery and validation While rigorous methods for recovery andor bias use analytical standards or CRMs this is not an option for most laboratories due to legal restrictions Obtaining 400 mg of analytically pure THCA to carry out spike recovery studies with 1000 mg of matrix is neither legally nor financially feasible for laboratories within the United States There are also no accepted methodologies to which to compare nor are authentic reference standards with the analytes in the matrix at known values available The Emerald Test is an excellent first step towards verifying laboratory instrument calibration (40) however this test is on an aliquot of methanol containing 01ndash10 mgmL Δ9-THC which only covers one order of magnitude and says little about the laboratoriesrsquo sample processing techniques Having some manner to estimate the bias is useful since nonlinear calibration curves can provide satisfactory results when determining percentage recovery but those values may not say much about the deviation from the true value Similarly a systematic error in sample processing such as the pipetting error seen with technician A in Figure 2 can also provide satisfactory results for recovery yet still exhibit bias from the true value Using extracts to spike cannabinoid analytes into a matrix is a procedure introduced by DeBacker et al (15) and is in line with guidance from a number of organizations that recognize the difficulties with obtaining CRMs for drugs of abuse and state there are times an impure specimen of the may serve as reference material temporarily until a purer form
Figure 4 Comparison of HTH and sonication with five different cultivars
Giese et al Journal of AOAC International Vol 98 No 6 2015 1519
becomes available (21 22) This study extended that procedure to a more efficient sample preparation method and a wider range of analytes and concentrations Careful analysis of calibration curves careful assessment of extracts to determine the ldquotruerdquo concentrations and careful spike recovery studies provide preliminary methods for laboratories to validate their assays until more rigorous options become available
These studies are best performed with oils or shatters since waxes and water hash can display enough heterogeneity on the 3ndash4 mg scale to give higher RSDs at the low spike levels Note that in some cases the mass of the blank matrix plus the extract was over 1000 mg The plant material must be added to provide putative adsorption sites that may affect recovery and possible cellular interferences however the extra mass had no effect on the final result since conversion of the raw result from mgmL to wt for both the spike (no matrix) and the matrix spike (matrix present) assumes 1000 mg of sample In other words the raw quantitative results in mgmL were independent of blank matrix mass introduced if there were no matrix effects present or if those effects were minimized by the ISTD The concentration of the specific analyte depends only on the mass of that analyte introduced via the extract and the volume of extraction solvent and any possible change in volumes or analyte adsorption due to the extra mass introduced was accounted for by the ISTD The spike recovery results in Table 5 show it made little difference if there was no matrix present or 1000 mg of matrix present which highlights the critical nature of the ISTD in assays such as this
This is especially useful with authentic samples that have variable moisture content In theory a 1000 mg sample with 15 moisture would add 150 μL of water to the extraction solvent which dilutes the analytes Similarly extraction solvent can be absorbed by the plant matter which concentrates the analytes In both cases ISTDs compensate for these changes and provide more accurate and reliable results (22 37 39)
Intermediate Precision
Both intraday and interday precisions for the entire extraction and analysis process were determined by extracting five cultivars
five times over the course of 5 days and five times on a single day These cultivars were chosen to obtain a broad representation of analyte profiles and flower morphologies In order to start with a homogeneous sample a 20 g sample of bulk flower was homogenized on the first day for extraction and the remainder of the ground flower was stored at ndash20degC between extractions The interday analyses were carried out on Days 1ndash5 while the intraday analyses were all carried out on Day 5 (n = 5)
Tables 5ndash9 show each of the individual determinations as well as the averages and RSDs Days 1ndash5a were used to determine the interday average and precision and 5andash5e were used to determine the intraday average and precision The acceptable values for RSDr are concentration dependent and given by Equation 3 (22) As a general rule both interday and intraday precisions of the cannabinoid assay were well within accepted limits for all analytes and were generally less than 3 It is also seen that intraday precision was generally slightly better than interday precision The most notable deviations were seen with CBDA in the THV hybrid and THCATHC in Master Kush however they still met accepted limits The outliers found in Master Kush are most likely related to sample morphology as this flower was the most difficult to handle due to morphological characteristics of the sample It should be noted that while the cannabinoids are stable for short periods when stored below room temperature decomposition of the acidic species was seen at room temperature within 24 h While a chilled sample tray mitigates this issue as a general rule samples are not processed if the analysis cannot be completed within 24 h
Approximately half of the monoterpenes failed to meet acceptable interday precision limits but they passed intraday precision criteria This was a consequence of the sampling methodology where large amounts of flowers were preground and stored at ndash20degC to ensure a more homogenous sample for testing over the course of the study After grinding there was a rapid decrease of the many of the monoterpenes once flowers were homogenized in a grinder and the trichomes were ruptured This loss occurs even when stored at ndash20degC This can be seen in the table for the individual daily measurements and this decrease was most significant on Day 1 after the initial homogenization It should be noted that if Day 1 is removed from the analysis the average values are higher and the RSDs are lower and satisfy Equation 3 This is due to the fact the rate of monoterpenes loss was the greatest during the first 24 h as seen in the tables Note the cannabinoids and the less volatile terpenols and sesquiterpenes had comparable results for both intraday and interday analyses This strongly suggests that once large sample sizes are homogenized they must be extracted the same day to obtain representative assay results for the monoterpenes
This is a critical observation as typical sampling procedures for both agricultural crops and cannabis (25 41) require an initial sample size that is compositionally representative of the crop This large sample mass is subsequently homogenized so a small mass amenable to analysis can be extracted and still be considered representative of the whole Once the initial sample is homogenized it should be extracted immediately for accurate results
Plant Variability
Agricultural crops inherently have a large amount of natural variation resulting from differences in environmental
Figure 5 Decomposition of terpinolene in clear vials
1520 Giese et al Journal of AOAC International Vol 98 No 6 2015
conditions genetic background developmental stage farming practices and seasonal changes (42) which result in differences in organoleptic profile appearance nutrient composition shelf life and crop yield
The method described herein has been used not only to determine the chemotype of cannabis preparations destined for human consumption but also to gain a better understanding of the sources of variability associated with the production of cannabis in a typical indoor production facility Discussion of applying this method to look at the causes of variation is beyond the scope of this article however the relatively higher throughput can be used to look at analyte content across a typical cultivation site Cannabis is a highly variable plant and cannabinoid content in finished flowers is extremely inhomogeneous (41 43) The variability in raw materials is the principal reason medical producers such as GW Pharmaceuticals produce standardized extracts to guarantee product uniformity (43) However finished flowers remain popular products in the United States and variation in this product is an important concept for dispensaries patients and legislators to understand when interpreting test results and enacting regulations
A typical indoor California cultivation site was sampled as described in Experimental section Boxplots are a typical way to graphically represent descriptive statistics and are used for the discussion on total content while bar charts are used to display the individual analyte profiles Exact methods of cultivation andor product preparation are irrelevant since this represents typical finished flowers distributed as a ldquolotrdquo of material (vide infra) at California dispensaries
Figure 6 shows the boxplots of total cannabinoid content for seven plants that were each sampled at high medium and low heights within the canopy The total cannabinoid content across plants ranged from 12 to 25 (ww) of the dried plant material This is a relative variation of approximately 100 for plants from the same production lot Plant G is obviously an outlier so after discarding this data the range is from 198 to 249 which is still relative variation of 25 for flowers from the same lot of material The boxplots show the intraplant variability of total
cannabinoids is generally lower than the interplant variability however this does not hold true for every individual plant and it can be seen the variation in Plant B is nearly the same as interplant variation The relative cannabinoid profiles are also shown and they are identical for each plant indicating the variation in cannabinoid content is due to variation in overall cannabinoid production
The figure also shows the boxplots of the total terpene content by plant The range of total terpenes in the plants was 14ndash22 (ww) The relative variation in terpene content across these plants was approximately 90 Variation in terpene content was generally much higher than the variation in cannabinoid content In this case the total content of Plant G fell within the range of other plants however the relative terpenoid profiles show there was a down regulation of myrcene and an up regulation of pinene If all of these plants were combined into a single lot (as discussed below) inflorescences from Plant G could potentially have different properties than those from the rest of the lot This is an extreme example and in this specific case these plants exhibited morphological traits that would allow the cultivators to remove them from processing however even discarding this outlier the rest of the ldquotypicalrdquo lot displays significant inhomogeneity
There are no clear definitions as to what constitutes a lot of medical cannabis but it has been suggested that a lot is no more than approximately 2 kg (based on average yield from an indoor facility using tables) and can be distinguished by plant count (no more than 20) or defined by those of identical genetic background in the space receiving similar nutritional and environmental influences (41) While definitions will undoubtedly continue to evolve the above samples were chosen from a lot that conforms to these suggestions and these results demonstrate the potential for large differences in secondary metabolite levels in plants that constitute the same lot of material
This variation in analyte content is important to understand when interpreting test results from different analytical laboratories for the same lot of material at a given dispensary Even laboratories using identical validated testing
Figure 6 Heterogeneity of cannabinoid and terpenoid content in different flowers from the same lot
Giese et al Journal of AOAC International Vol 98 No 6 2015 1521
methodologies can obtain disparate results unless they are testing the exact same flower which is never the case In many cases the laboratory results are only as good as the sampling procedures Unless specific sampling protocols are followed collated data sets that display the ldquolot-to-lotrdquo variation in different cultivars (41) may simply be observing plant-to-plant variation within a lot
The boxplots illustrate the fact that a representative value for a lot of medical cannabis must come from a large sample size that is compositionally representative and reduced to a size amenable to testing thus homogenizing the sample followed by immediate extraction is required However real information about variation is lost when bulking samples in this manner and plants such as ldquoPlant Grdquo get hidden in the average values For true statistical power to look at variation across a single crop a high throughput method such as this is needed It may be more suitable to report a range of analyte values for a lot of material rather than a single value which is a more realistic representation of the content of pharmacologically active compounds Rather than bulking smaller samples and homogenizing them reporting a range would require the separate analysis of many smaller samples to report an average value and a range Similarly when looking at causes of variation in any crop due to environment andor gene-environment (GxE) interactions a large number of samples need to be analyzed to determine statistical significance Using properly validated analytical methods ensures laboratories are observing actual crop variation rather than deficiencies in analytical methodologies
Conclusions
Presented herein is an optimized and validated method for the analysis of both terpenes and cannabinoids in cannabis from a single sample preparation This method is only minimally affected by sample morphology and has been found to be fairly robust from a process standpoint A single sample extraction procedure which requires minimal sample handling and solvent usage provides extract that can be analyzed for both terpenes and cannabinoids by GC-FID and HPLC-DAD respectively The single GC assay for the terpenes requires 36 min and the two HPLC assays for the major and minor cannabinoids take 18 min each so a complete profile of a sample is obtained in approximately 36 min on the two separate instruments from a single sample preparation
The recovery repeatability and trueness of the method were found to be acceptable for all terpenes and cannabinoids analyzed and this was demonstrated with spike recoveries at analyte levels that reflect those found in most samples on the market today Both intraday and interday precisions of the complete extraction and analysis procedure were demonstrated on five different cultivars containing different cannabinoid contents terpene profiles and flower morphologies In most cases the RSDr values were lower than the acceptable PRSDs While interday precision was not satisfactory for the volatile monoterpenes this proved to be an artifact of the experimental design and highlighted the need for timely analysis of samples once trichomes are ruptured The throughput accuracy and precision of this assay make it amenable to assessing the development and environmental variation of this crop This is important given the inherent variability of all agricultural
crops and must be taken into consideration when evaluating the effects that cultivation production and processing techniques can have on chemotype
While the methods applied to the analysis of the terpenoids are rigorous those developed for the analysis of the cannabinoids required some decidedly nonideal procedures However this is a function of the current legal environment and rather than wait for it to change this provides pragmatic methods for typical laboratories involved in the analysis of cannabis to validate their methods through careful analysis of calibration curves and spike recoveries
References
(1) American Herbal Pharmacopoeia Cannabis Inflorescence and Leaf (2013) AHP Scottrsquos Valley CA pp 53ndash71
(2) ElSohly M amp Gul W (2014) in Handbook of Cannabis RG Pertwee (Ed) Oxford University Press Oxford UK pp 3ndash22 httpdxdoiorg101093acprofoso97801996626850030001
(3) Cascio M amp Pertwee R (2014) in Handbook of Cannabis RG Pertwee (Ed) Oxford University Press Oxford UK pp 137ndash156 httpdxdoiorg101093acprofoso 97801996626850030007
(4) Brenneisen R (2007) in Marijuana and the Cannabinoids MA ElSohly (Ed) Humana Press Totowa NJ pp 137ndash156
(5) Lockwood GB (2001) J Chromatogr A 936 23ndash31 httpdxdoiorg101016S0021-9673(01)01151-7
(6) Casano S Grassi G Martini V amp Michelozzi M (2011) Acta Hort ISHS 925 115ndash122
(7) Hillig KW (2004) Biochem Syst Ecol 32 875ndash891 httpdxdoiorg101016jbse200404004
(8) ElSohly MA Stanford DF amp Murphy TP (2007) in Marijuana and the Cannabinoids MA ElSohly (Ed) Humana Press Totowa NJ pp 51ndash66
(9) Hazekamp A amp Fischedick JT (2012) Drug Test Anal 4 660ndash667 httpdxdoiorg101002dta407
(10) Fishedick JT Hazekamp A Erkelens T Choi YH amp Verpoorte R (2010) Phytochemistry 71 2058ndash2073 httpdxdoiorg101016jphytochem201010001
(11) Russo EB (2011) Br J Pharmacol 163 1344ndash1364 httpdxdoiorg101111j1476-5381201101238x
(12) McPartland JM amp Russo EB (2001) J Cannabis Therapeut 1 103ndash132 httpdxdoiorg101300J175v01n03_08
(13) SC Labs Know Your Medicine SC Labs 2015 httpsclabs com (accessed January 27 2015)
(14) Steep Hill Strain Fingerprint Steep Hill Labs Inc 2015 httpsteephillcomstrainfingerprint (accessed July 9 2015)
(15) DeBacker B Debrus B Lebrun P Theunis L Dubois N Decock L Verstraete A Hubert P amp Charlier C (2009) J Chromatogr B 877 4115ndash4124 httpdxdoiorg101016jjchromb200911004
(16) Swift W Wong A Li KM Arnold JC amp McGregor IS (2013) PLoS ONE 8 1ndash9
(17) DeBacker B Maebe K Verstraete AG amp Charlier C (2012) J Forensic Sci 1ndash5
(18) The Werc ShopndashAnalytical Testing Laboratory The Werc Shop 2015 httpthewercshopcomservices (accessed January 27 2015)
(19) Unger P Brauninger R Hudulla C Holmes M amp Sherman B (2014 December) Standards for Cannabis Testing Laboratories httpcannabissafetyinstituteorgwp-contentuploads201501Standards-for-Cannabis-Testing-Laboratoriespdf (accessed July 9 2015)
(20) Q2B Validation of Analytical Procedures Methodology (1996) ICH httpwwwfdagovdownloadsdrugs
1522 Giese et al Journal of AOAC International Vol 98 No 6 2015
guidancecomplianceregulatoryinformationguidancesucm073384pdf (accessed October 12 2015)
(21) Guidance for the Validation of Analytical Methodology and Calibration of Equipment used for Testing of Illicit Drugs in Seized Materials and Biological Specimens (2009) UNDOC httpwwwunodocorgdocumentsscientificvalidation_Epdf (accessed October 12 2015)
(22) AOAC Guidelines for Single Laboratory Validation of Chemical Methods for Dietary Supplements and Botanicals (2002) AOAC INTERNATIONAL Rockville MD
(23) Hazekamp A (2007) in Cannabis Extracting the Medicine PrintPartners Amsterdam The Netherlands pp 91ndash106
(24) Raharjo TJ amp Verpoorte R (2004) Phytochem Anal 15 79ndash94 httpdxdoiorg101002pca753
(25) Recommended Method for the Identification and Analysis of Cannabis and Cannabis Products (2009) UNDOC httpwwwunodocorgdocumentsscientificST-NAR-40-Ebookpdf (accessed October 12 2015)
(26) Burden DW (2012) Guide to the Disrpution of Biological Samples httpopsdiagnosticscomapplicationssamplehomogenizationhomogenizationguidepart1html (accessed April 15 2014)
(27) Kulkarni VM amp Rathod VK (2014) Ultrason Sonochem 21 606ndash611 httpdxdoiorg101016jultsonch201308021
(28) Romisch-Margl W Prehn C Bogumil R Rohring C Suhre K amp Adamski J (2012) Metabolomics 8 133ndash142 httpdxdoiorg101007s11306-011-0293-4
(29) Dussy FE Hamberg C Luginbuhl M Schwerzmann T amp Briellmann TA (2005) Forensic Sci Int 149 3ndash10 httpdxdoiorg101016jforsciint200405015
(30) Mangia A amp Careri M (2001) in Current Practice of Gas Chromatography-Mass Spectrometry WMA Nissen (Ed) CRC Press New York NY pp 409ndash440 httpdxdoi org1012019781420029512pt5
(31) Lockwood GB (2001) J Chromatogr A 936 23ndash31 httpdxdoiorg101016S0021-9673(01)01151-7
(32) Prepration of Calibration Curves A Guide to Best Practice (2003) httpwwwlgcgroupcomLGCGroupmediaPDFs
Our20scienceNMI20landing20pagePublications20and20resourcesGuidesCalibration-curve-guidepdf (accessed November 10 2014)
(33) Cochran J (2015 January) CBDV and THCV or the Rxi-35Sil MS GC Column with Other Cannabinoids httpblogrestek comp=14046 (accessed July 10 2015)
(34) Cannabinoids on Raptor ARC-18 Restek 2015 httpwwwrestekcomchromatogramviewLC_GN0553 (accessed July 10 2015)
(35) Hazekamp A (2007) in Cannabis Extracting the Medicine PrintPartners Amsterdam The Netherlands pp 71ndash90
(36) deMeijer EPM Hammond KM amp Sutton A (2009) Euphytica 168 95ndash112 httpdxdoiorg101007s10681-009-9894-7
(37) Mitra S amp Brukh R (2003) in Sample Preparation Techniques in Analytical Chemistry S Mitra (Ed) John Wiley and Sons Inc Hoboken NJ pp 1ndash36 httpdxdoi org1010020471457817
(38) Snyder LR Kirkland JJ amp Glajch JL (1997) Practical HPLC Method Development John Wiley and Sons New York NY pp 643ndash684 httpdxdoiorg1010029781118592014
(39) Thompson M Ellison SLR Fajgelj A Willets P amp Wood R (1999) Pure Appl Chem 71 337ndash348 httpdxdoi org101351pac199971020337
(40) The Emerald Test (2015) Emerald Scientific LLC httpwww theemeraldtestcom (accessed July 10 2015)
(41) Sexton M amp Ziskind J (2013) Sampling Cannabis for Analytical Purposes httpliqwagovpublicationsMarijuanaBOTEC20reports1e-Sampling-Lots-Finalpdf (accessed July 10 2015)
(42) Davies HV Shepherd LV Stewart D Frank T Rohlig RM amp Engel KH (2010) Regul Toxicol Pharmacol 58 S54ndashS61 httpdxdoiorg101016jyrtph201007004
(43) Potter DJ (2013) Drug Testing Anal 58 S54ndashS61 httpdxdoiorg101002dta1531
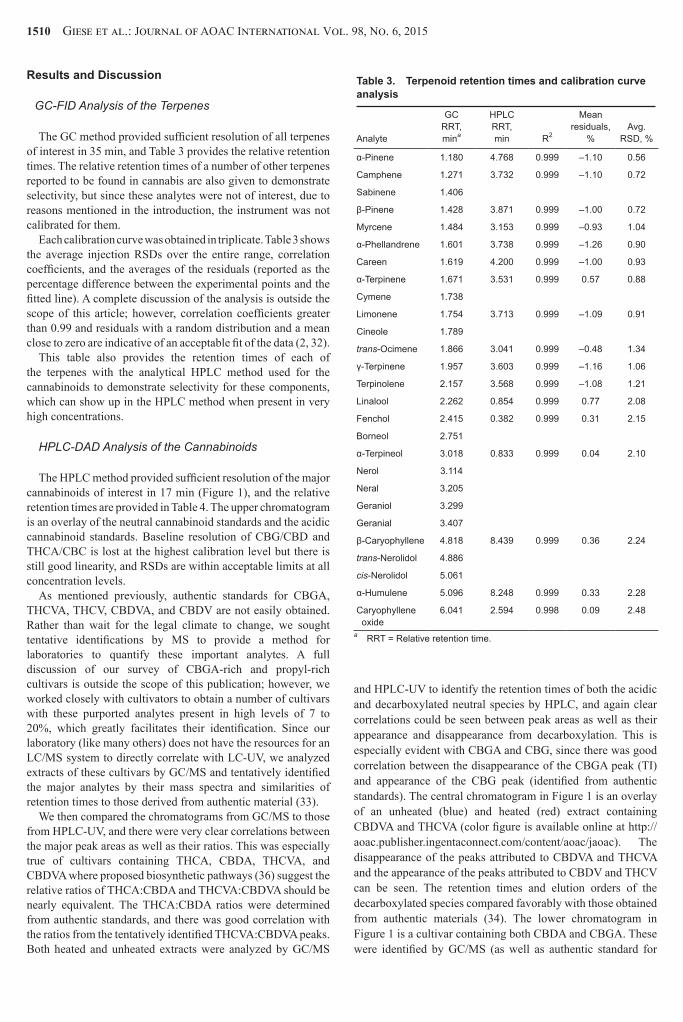
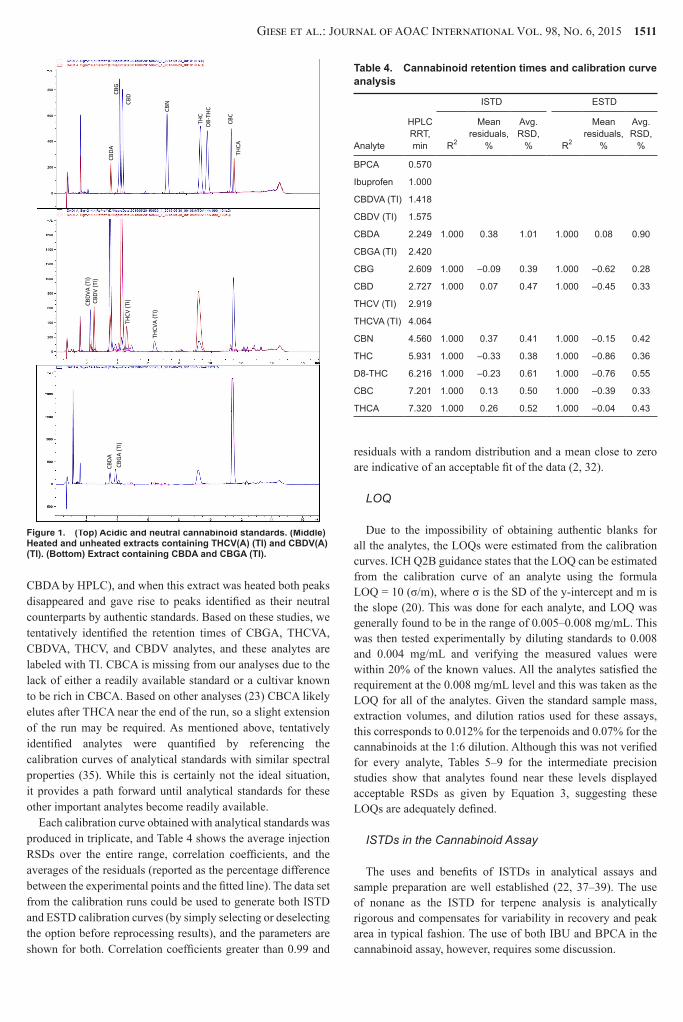
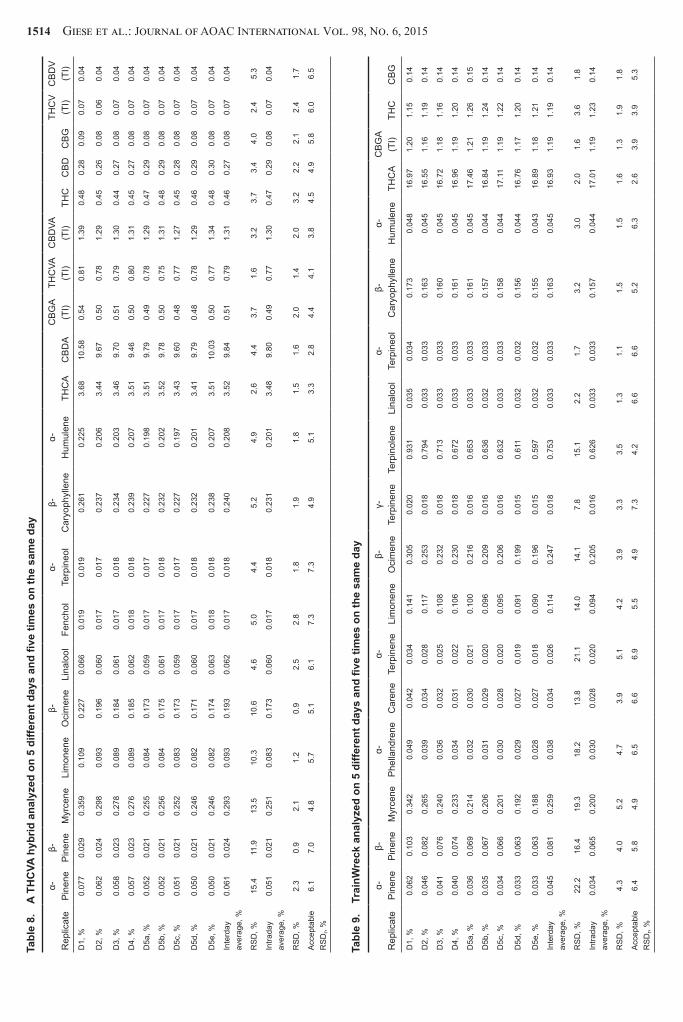
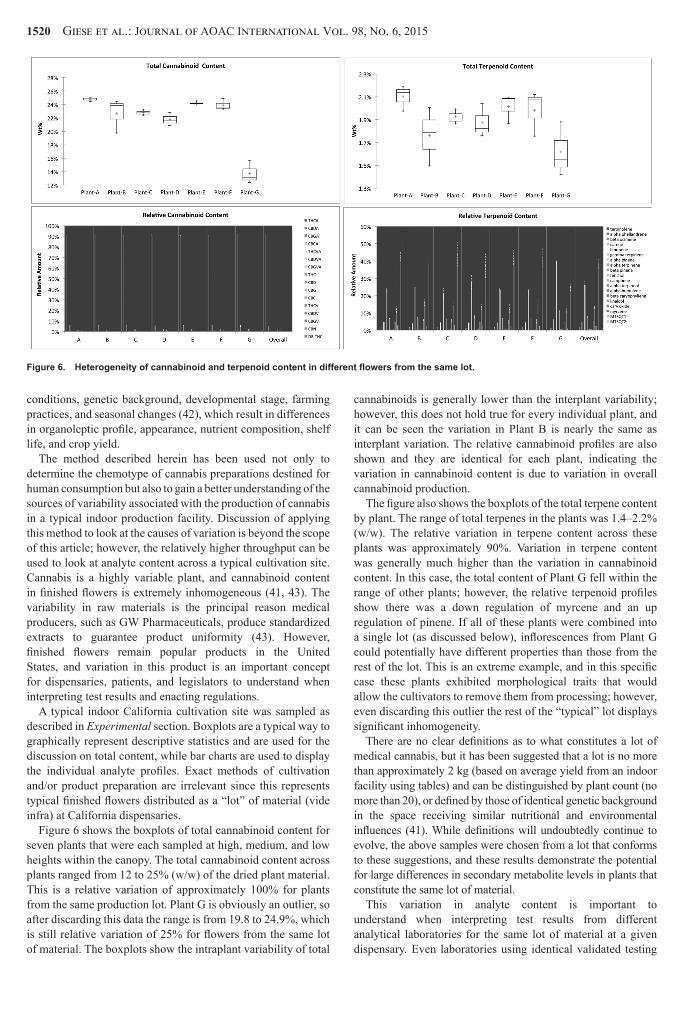