Method for determining statistical crosstalk models based on published DSL deployment data Jack...
12
Method for determining statistical crosstalk models based on published DSL deployment data Jack Douglass, Paradyne International Chair TIA TR30.3 Nov 4 to 8, 2002, ETSI TM6 TD42 024t42 Presentation [email protected]
-
Upload
yadiel-edgington -
Category
Documents
-
view
214 -
download
0
Transcript of Method for determining statistical crosstalk models based on published DSL deployment data Jack...

Method for determining statistical crosstalk models based on published DSL deployment data
Jack Douglass, Paradyne InternationalChair TIA TR30.3
Nov 4 to 8, 2002, ETSI TM6 TD42
024t42 Presentation
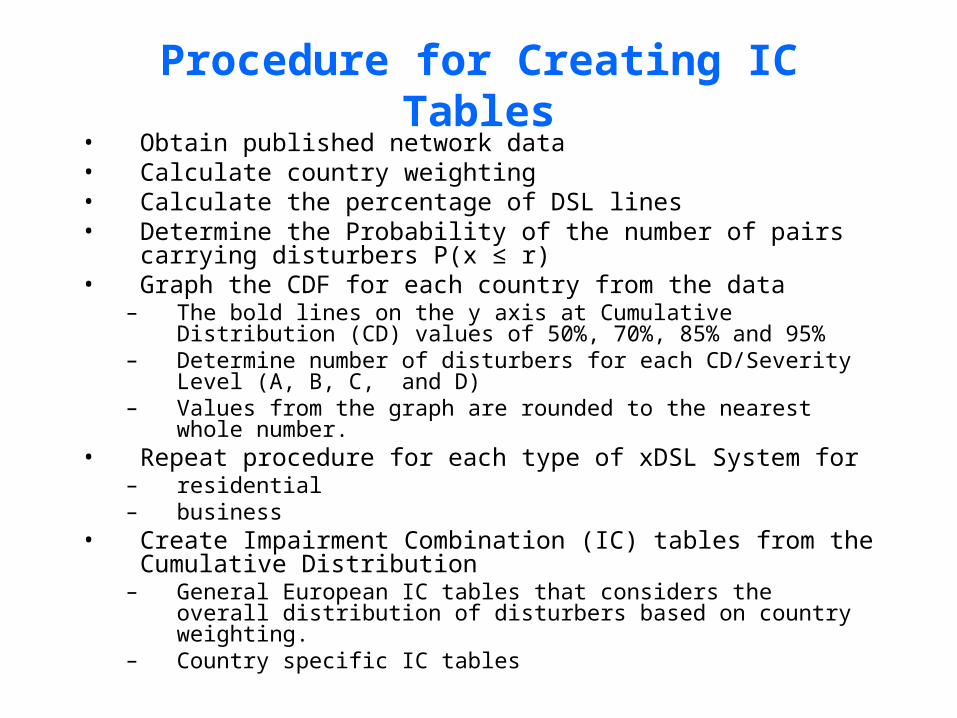
Procedure for Creating IC Tables• Obtain published network data• Calculate country weighting • Calculate the percentage of DSL lines • Determine the Probability of the number of pairs carrying disturbers
P(x ≤ r) • Graph the CDF for each country from the data
– The bold lines on the y axis at Cumulative Distribution (CD) values of 50%, 70%, 85% and 95%
– Determine number of disturbers for each CD/Severity Level (A, B, C, and D)
– Values from the graph are rounded to the nearest whole number.• Repeat procedure for each type of xDSL System for
– residential – business
• Create Impairment Combination (IC) tables from the Cumulative Distribution
– General European IC tables that considers the overall distribution of disturbers based on country weighting.
– Country specific IC tables

Distribution of DSL Lines by Country
Table 1– Distribution of ADSL lines in Western Europe by Country [Error! Bookmark not defined.]
Total Fixed Lines (000s)
% European Lines (Country Weighting)
DSL Lines (000s)
% DSL Lines
Austria 3863 2% 142 3.66% Belgium 5142 3% 394 7.66% Denmark 3638 2% 234 6.43% Finland 2850 1% 120 4.21% France 34100 18% 731 2.14% Germany 48500 25% 2570 5.30% Italy 26506 14% 550 2.08% Netherlands 9610 5% 208 2.17% Norway 3176 2% 74 2.33% Spain 16480 9% 661 4.01% Sweden 5889 3% 264 4.48% UK 33750 17% 292 0.86% Total 193504 100 6239 3.22%
Source: Point Topic, DSL World Overview 6

Cumulative Probability — 25 Pair BinderTable 1—Cumulative Probability of a number of pairs carrying disturbers P(x ≤ r) for 25 Pair Binder
No. of Pairs
Austria Belgium Denmark Finland France Germany Italy Netherlands Norway Spain Sweden UK Total
0 0.39 0.14 0.19 0.34 0.58 0.26 0.59 0.58 0.55 0.36 0.32 0.80 0.44 1 0.77 0.42 0.52 0.72 0.90 0.61 0.91 0.90 0.89 0.73 0.69 0.98 0.81 2 0.94 0.70 0.78 0.91 0.98 0.86 0.99 0.98 0.98 0.92 0.90 1.00 0.95 3 0.99 0.88 0.93 0.98 1.00 0.96 1.00 1.00 1.00 0.98 0.98 1.00 0.99 4 1.00 0.96 0.98 1.00 1.00 0.99 1.00 1.00 1.00 1.00 1.00 1.00 1.00 5 1.00 0.99 1.00 1.00 1.00 1.00 1.00 1.00 1.00 1.00 1.00 1.00 1.00 6 1.00 1.00 1.00 1.00 1.00 1.00 1.00 1.00 1.00 1.00 1.00 1.00 1.00 7 1.00 1.00 1.00 1.00 1.00 1.00 1.00 1.00 1.00 1.00 1.00 1.00 1.00 8 1.00 1.00 1.00 1.00 1.00 1.00 1.00 1.00 1.00 1.00 1.00 1.00 1.00 9 1.00 1.00 1.00 1.00 1.00 1.00 1.00 1.00 1.00 1.00 1.00 1.00 1.00
10 1.00 1.00 1.00 1.00 1.00 1.00 1.00 1.00 1.00 1.00 1.00 1.00 1.00 11 1.00 1.00 1.00 1.00 1.00 1.00 1.00 1.00 1.00 1.00 1.00 1.00 1.00 12 1.00 1.00 1.00 1.00 1.00 1.00 1.00 1.00 1.00 1.00 1.00 1.00 1.00 13 1.00 1.00 1.00 1.00 1.00 1.00 1.00 1.00 1.00 1.00 1.00 1.00 1.00 14 1.00 1.00 1.00 1.00 1.00 1.00 1.00 1.00 1.00 1.00 1.00 1.00 1.00 15 1.00 1.00 1.00 1.00 1.00 1.00 1.00 1.00 1.00 1.00 1.00 1.00 1.00 16 1.00 1.00 1.00 1.00 1.00 1.00 1.00 1.00 1.00 1.00 1.00 1.00 1.00 17 1.00 1.00 1.00 1.00 1.00 1.00 1.00 1.00 1.00 1.00 1.00 1.00 1.00 18 1.00 1.00 1.00 1.00 1.00 1.00 1.00 1.00 1.00 1.00 1.00 1.00 1.00 19 1.00 1.00 1.00 1.00 1.00 1.00 1.00 1.00 1.00 1.00 1.00 1.00 1.00 20 1.00 1.00 1.00 1.00 1.00 1.00 1.00 1.00 1.00 1.00 1.00 1.00 1.00 21 1.00 1.00 1.00 1.00 1.00 1.00 1.00 1.00 1.00 1.00 1.00 1.00 1.00 22 1.00 1.00 1.00 1.00 1.00 1.00 1.00 1.00 1.00 1.00 1.00 1.00 1.00 23 1.00 1.00 1.00 1.00 1.00 1.00 1.00 1.00 1.00 1.00 1.00 1.00 1.00 24 1.00 1.00 1.00 1.00 1.00 1.00 1.00 1.00 1.00 1.00 1.00 1.00 1.00 25 1.00 1.00 1.00 1.00 1.00 1.00 1.00 1.00 1.00 1.00 1.00 1.00 1.00

CDF — 25 Pair Binder
CDF European DSL— 25 Pair Binder
0.00
0.10
0.20
0.30
0.40
0.50
0.60
0.70
0.80
0.90
1.00
1.10
0 1 2 3 4 5 6 7 8 9 10
Number of Disturber Pairs per 25 Pair Binder
Pro
bab
ilit
y
Belgium
Denmark
Finland
France
Germany
Italy
Netherlands
Norway
Spain
Sweden
UK
Total
Austria

Cumulative Probability — 50 Pair Binder
Table 1 – Cumulative Probability of a number of pairs carrying disturbers P(x ≤ r) for 50 Pair Binder
No. of Pairs
Austria Belgium Denmark Finland France Germany Italy Netherlands Norway Spain Sweden UK Total
0 0.15 0.02 0.04 0.12 0.34 0.07 0.35 0.33 0.31 0.13 0.10 0.65 0.19 1 0.45 0.10 0.16 0.37 0.71 0.25 0.72 0.70 0.67 0.40 0.34 0.93 0.52 2 0.72 0.25 0.37 0.65 0.91 0.50 0.91 0.91 0.89 0.68 0.61 0.99 0.78 3 0.89 0.46 0.60 0.84 0.98 0.73 0.98 0.98 0.97 0.86 0.81 1.00 0.92 4 0.96 0.66 0.78 0.94 1.00 0.88 1.00 1.00 0.99 0.95 0.93 1.00 0.98 5 0.99 0.82 0.90 0.98 1.00 0.95 1.00 1.00 1.00 0.99 0.98 1.00 0.99 6 1.00 0.91 0.96 1.00 1.00 0.98 1.00 1.00 1.00 1.00 0.99 1.00 1.00 7 1.00 0.96 0.99 1.00 1.00 1.00 1.00 1.00 1.00 1.00 1.00 1.00 1.00 8 1.00 0.99 1.00 1.00 1.00 1.00 1.00 1.00 1.00 1.00 1.00 1.00 1.00 9 1.00 1.00 1.00 1.00 1.00 1.00 1.00 1.00 1.00 1.00 1.00 1.00 1.00
10 1.00 1.00 1.00 1.00 1.00 1.00 1.00 1.00 1.00 1.00 1.00 1.00 1.00 11 1.00 1.00 1.00 1.00 1.00 1.00 1.00 1.00 1.00 1.00 1.00 1.00 1.00 12 1.00 1.00 1.00 1.00 1.00 1.00 1.00 1.00 1.00 1.00 1.00 1.00 1.00 13 1.00 1.00 1.00 1.00 1.00 1.00 1.00 1.00 1.00 1.00 1.00 1.00 1.00 14 1.00 1.00 1.00 1.00 1.00 1.00 1.00 1.00 1.00 1.00 1.00 1.00 1.00 15 1.00 1.00 1.00 1.00 1.00 1.00 1.00 1.00 1.00 1.00 1.00 1.00 1.00 16 1.00 1.00 1.00 1.00 1.00 1.00 1.00 1.00 1.00 1.00 1.00 1.00 1.00 17 1.00 1.00 1.00 1.00 1.00 1.00 1.00 1.00 1.00 1.00 1.00 1.00 1.00 18 1.00 1.00 1.00 1.00 1.00 1.00 1.00 1.00 1.00 1.00 1.00 1.00 1.00 19 1.00 1.00 1.00 1.00 1.00 1.00 1.00 1.00 1.00 1.00 1.00 1.00 1.00 20 1.00 1.00 1.00 1.00 1.00 1.00 1.00 1.00 1.00 1.00 1.00 1.00 1.00 21 1.00 1.00 1.00 1.00 1.00 1.00 1.00 1.00 1.00 1.00 1.00 1.00 1.00 22 1.00 1.00 1.00 1.00 1.00 1.00 1.00 1.00 1.00 1.00 1.00 1.00 1.00 23 1.00 1.00 1.00 1.00 1.00 1.00 1.00 1.00 1.00 1.00 1.00 1.00 1.00 24 1.00 1.00 1.00 1.00 1.00 1.00 1.00 1.00 1.00 1.00 1.00 1.00 1.00 25 1.00 1.00 1.00 1.00 1.00 1.00 1.00 1.00 1.00 1.00 1.00 1.00 1.00

CDF—50 Pair BinderCDF European DSL— 50 Pair Binder
0.00
0.10
0.20
0.30
0.40
0.50
0.60
0.70
0.80
0.90
1.00
1.10
0 1 2 3 4 5 6 7 8 9 10
Number of Disturbers Pairs per 50 Pair Binder
Pro
bab
ilit
y
Austria
Belgium
Denmark
Finland
France
Germany
Italy
Netherlands
Norway
Spain
Sweden
UK
Total

Table 1 -- Cumulative Distribution of the number of pairs carrying DSL disturbers for 25 Pair Binder by Country
Austria Belgium Denmark Finland France Germany Italy Netherlands Norway Spain Sweden UK Total
Country Weighting
CD Severity
0.02 0.03 0.02 0.01 0.18 0.25 0.14 0.05 0.02 0.09 0.03 0.17 1
50% D 0 1 1 0 0 1 1 0 0 0 0 0 0 70% C 0 2 2 1 0 1 1 0 0 1 1 0 1 85% B 1 3 3 2 1 2 2 1 1 2 2 0 1 95% A 2 4 3 3 2 3 2 2 2 2 3 1 2
Table 2 -- Cumulative Distribution of the number of pairs carrying DSL disturbers for 50 Pair Binder by Country
Austria Belgium Denmark Finland France Germany Italy Netherlands Norway Spain Sweden UK Total
Country Weighting
CD Severity
0.02 0.03 0.02 0.01 0.18 0.25 0.14 0.05 0.02 0.09 0.03 0.17 1
50% D 1 3 3 2 1 2 1 1 1 1 2 0 1 70% C 2 4 4 2 1 3 1 1 1 2 2 1 2 85% B 3 5 5 3 2 4 2 2 2 3 3 1 3 95% A 4 7 6 4 3 5 3 3 3 4 5 2 4

Table 1 — Residential/Multiunit Cumulative Distribution (CD) For # Of Disturbers Of Each Type
CD Associa
ted Severit
y
ISDN BA
2B1Q
ISDN BA
4B3T
2 Mbit/s HDB3 (2-pair)
HDSL 2B1Q 392
ks/s (3-pair)
HDSL 2B1Q 584 ks/s
(2-pair)
HDSL 2B1Q 1160
ks/s (1 pair)
HDSL CAP 2320 kbit/s
( 1 pair)
ADSL over
POTS FDD
ADSL over
POTS EC
ADSL over ISDN FDD
ADSL over ISDN EC
ADSL lite
SDSL 784
kbit/s
SDSL 1505 kbit/s
SDSL 2056 kbit/s
50% D
70% C
85% B
95% A
Business Crosstalk Model
Table 2 — Business Cumulative Distribution (CD) For # Of Disturbers Of Each Type
CD Associa
ted Severit
y
ISDN BA
2B1Q
ISDN BA
4B3T
2 Mbit/s HDB3 (2-pair)
HDSL 2B1Q 392
ks/s (3-pair)
HDSL 2B1Q 584 ks/s
(2-pair)
HDSL 2B1Q 1160
ks/s (1 pair)
HDSL CAP 2320 kbit/s
( 1 pair)
ADSL over
POTS FDD
ADSL over
POTS EC
ADSL over ISDN FDD
ADSL over ISDN EC
ADSL lite
SDSL 784
kbit/s
SDSL 1505 kbit/s
SDSL 2056 kbit/s
50% D
70% C
85% B
95% A

IC Table — ResidentialTable 1 — Crosstalk Impairment Combinations for Loop XX (LOO/Length) – Residential/Multiunit
Impairment Severity A B C D Impairment LOO 5% 15% 30% 50%
NEXT Number of Interferers Exchange Injection Point
Exchange Wiring (100 m) Self-NEXT MDF ISDN BA 2B1Q ISDN BA 4B3T 2 Mbit/s HDB3 (2-pair) HDSL 2B1Q 392 ks/s (3-pair) HDSL 2B1Q 584 ks/s (2-pair) HDSL 2B1Q 1160 ks/s (1-pair) HDSL CAP 2320 kbit/s (1-pair) ADSL over POTS FDD ADSL over POTS EC ADSL over ISDN FDD ADSL over ISDN EC ADSL lite SDSL 784 kbit/s SDSL 1505 kbit/s SDSL 2056 kbit/s
Intermediate Injection Point ISDN BA 2B1Q ISDN BA 4B3T 2 Mbit/s HDB3 (2-pair) HDSL 2B1Q 392 ks/s (3-pair) HDSL 2B1Q 584 ks/s (2-pair) HDSL 2B1Q 1160 ks/s (1-pair) HDSL CAP 2320 kbit/s (1-pair) ADSL over POTS FDD ADSL over POTS EC ADSL over ISDN FDD ADSL over ISDN EC ADSL lite SDSL 784 kbit/s SDSL 1505 kbit/s SDSL 2056 kbit/s
CPE Injection Point ISDN BA 2B1Q ISDN BA 4B3T 2 Mbit/s HDB3 (2-pair) HDSL 2B1Q 392 ks/s (3-pair) HDSL 2B1Q 584 ks/s (2-pair) HDSL 2B1Q 1160 ks/s (1-pair) HDSL CAP 2320 kbit/s (1-pair) ADSL over POTS FDD ADSL over POTS EC ADSL over ISDN FDD ADSL over ISDN EC ADSL lite SDSL 784 kbit/s SDSL 1505 kbit/s SDSL 2056 kbit/s
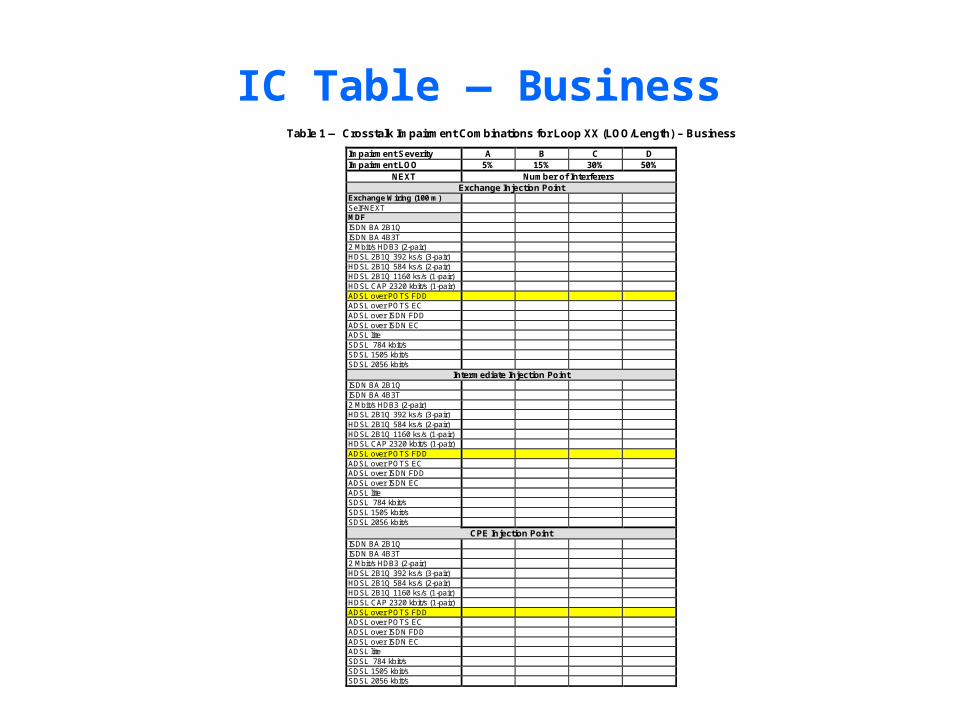
IC Table — BusinessTable 1 — Crosstalk Impairment Combinations for Loop XX (LOO/Length) – Business
Impairment Severity A B C D Impairment LOO 5% 15% 30% 50%
NEXT Number of Interferers Exchange Injection Point
Exchange Wiring (100 m) Self-NEXT MDF ISDN BA 2B1Q ISDN BA 4B3T 2 Mbit/s HDB3 (2-pair) HDSL 2B1Q 392 ks/s (3-pair) HDSL 2B1Q 584 ks/s (2-pair) HDSL 2B1Q 1160 ks/s (1-pair) HDSL CAP 2320 kbit/s (1-pair) ADSL over POTS FDD ADSL over POTS EC ADSL over ISDN FDD ADSL over ISDN EC ADSL lite SDSL 784 kbit/s SDSL 1505 kbit/s SDSL 2056 kbit/s
Intermediate Injection Point ISDN BA 2B1Q ISDN BA 4B3T 2 Mbit/s HDB3 (2-pair) HDSL 2B1Q 392 ks/s (3-pair) HDSL 2B1Q 584 ks/s (2-pair) HDSL 2B1Q 1160 ks/s (1-pair) HDSL CAP 2320 kbit/s (1-pair) ADSL over POTS FDD ADSL over POTS EC ADSL over ISDN FDD ADSL over ISDN EC ADSL lite SDSL 784 kbit/s SDSL 1505 kbit/s SDSL 2056 kbit/s
CPE Injection Point ISDN BA 2B1Q ISDN BA 4B3T 2 Mbit/s HDB3 (2-pair) HDSL 2B1Q 392 ks/s (3-pair) HDSL 2B1Q 584 ks/s (2-pair) HDSL 2B1Q 1160 ks/s (1-pair) HDSL CAP 2320 kbit/s (1-pair) ADSL over POTS FDD ADSL over POTS EC ADSL over ISDN FDD ADSL over ISDN EC ADSL lite SDSL 784 kbit/s SDSL 1505 kbit/s SDSL 2056 kbit/s

Summary
• A Statistically based European network model using the NMC methodology can be created using the procedure outlined in this document.
• Published Operating Company data is needed– Total number of lines per country– Total number of lines per country for each type of
xDSL service• Residential • Business
– Total number of lines per country for each type of xDSL service project for the year XX
• Residential • Business