METHOD 314.0 CHROMATOGRAPHY Revision 1.0 November · PDF fileThe fortification procedure is...
49
1 METHOD 314.0 DETERMINATION OF PERCHLORATE IN DRINKING WATER USING ION CHROMATOGRAPHY Revision 1.0 November 1999 Daniel P. Hautman and David J. Munch, US EPA, Office of Ground Water and Drinking Water Andrew D. Eaton and Ali W. Haghani, Montgomery Watson Laboratories NATIONAL EXPOSURE RESEARCH LABORATORY OFFICE OF RESEARCH AND DEVELOPMENT U.S. ENVIRONMENTAL PROTECTION AGENCY CINCINNATI, OHIO 45268
Transcript of METHOD 314.0 CHROMATOGRAPHY Revision 1.0 November · PDF fileThe fortification procedure is...

1
METHOD 314.0
DETERMINATION OF PERCHLORATE IN DRINKING WATER USING IONCHROMATOGRAPHY
Revision 1.0
November 1999
Daniel P. Hautman and David J. Munch, US EPA, Office of Ground Water and Drinking WaterAndrew D. Eaton and Ali W. Haghani, Montgomery Watson Laboratories
NATIONAL EXPOSURE RESEARCH LABORATORYOFFICE OF RESEARCH AND DEVELOPMENT
U.S. ENVIRONMENTAL PROTECTION AGENCYCINCINNATI, OHIO 45268

2
METHOD 314.0
DETERMINATION OF PERCHLORATE IN DRINKING WATER USING IONCHROMATOGRAPHY
1. SCOPE AND APPLICATION
1.1 This method covers the determination of perchlorate in reagent water, surface water,ground water, and finished drinking water using ion chromatography.
1.2 The single laboratory reagent water Method Detection Limit (MDL, defined in Section3.16) for the above analyte is listed in Table 1. The MDL for a specific matrix maydiffer from those listed, depending upon the nature of the sample and the specificinstrumentation employed.
1.2.1 In order to achieve comparable detection limits, an ion chromatographic systemmust utilize suppressed conductivity detection, be properly maintained, andmust be capable of yielding a baseline with no more than 5 nanosiemen (nS)noise/drift per minute of monitored response over the background conductivity.
1.3 This method is recommended for use only by or under the supervision of analystsexperienced in the use of ion chromatography and in the interpretation of the resultingion chromatograms.
1.4 When this method is used to analyze unfamiliar samples for perchlorate, anion
identification should be supported by the use of a laboratory fortified matrix sample. The fortification procedure is described in Section 9.4.1.
1.5 Users of the method data should identify data quality objectives prior to analysis. Usersof the method must demonstrate the ability to generate acceptable results, using theprocedures described in Section 9.0.
1.6 This method specifies an IC column and analytical conditions which were determinedto be the most effective for the widest array of sample matrices. Other IC procedureshave been written which incorporate similar columns and conditions, such as hydroxidebased mobile phases, low hydrophobicity IC columns, and measurement by suppressed conductivity detection.1-5 During the development of this method, these otherprocedures, as well as the columns and conditions outlined in this method, wereconcurrently investigated with comparable results for test matrices with moderate levelsof common inorganic background anions. These findings were consistent with those ofthe Inter-Agency Perchlorate Steering Committee, Analytical Subcommittee’s Report,6
published in 1998, which reported on the results of an interlaboratory validation of
3
these other Ion Chromatographic Methods. The columns and conditions identified inthis method were recommended since they bore the greatest tolerance for the highestlevels of common inorganic anion interference.
2. SUMMARY OF METHOD
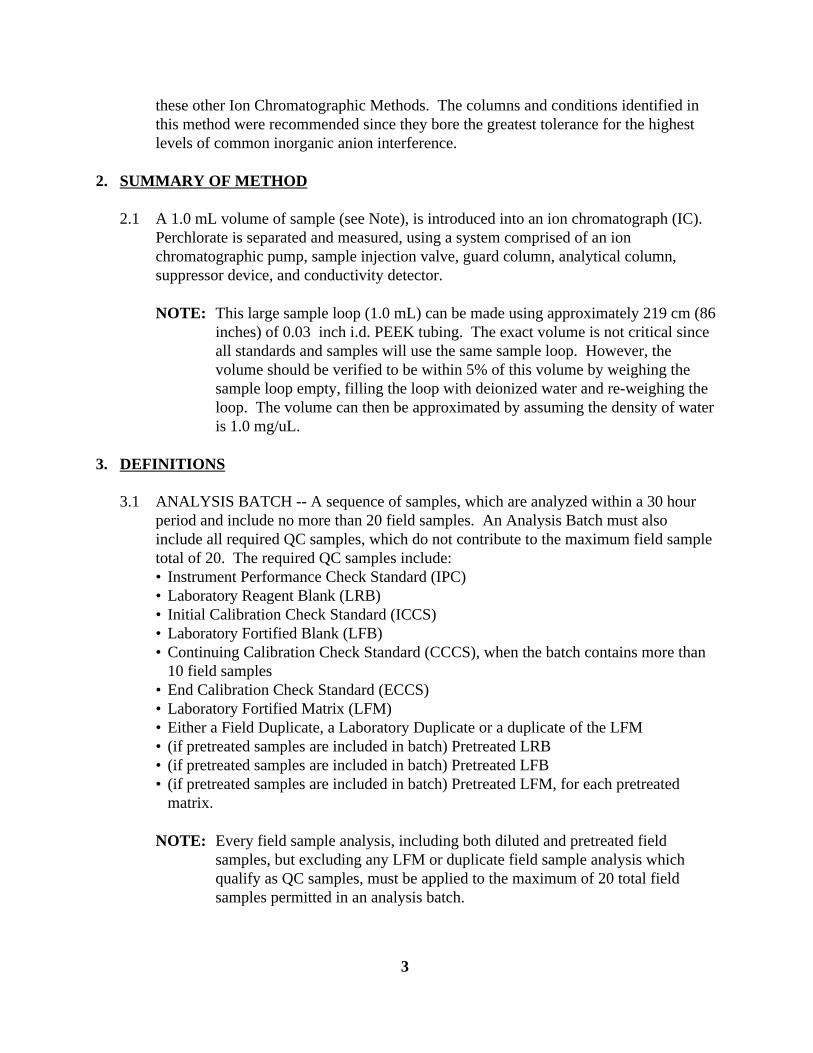
2.1 A 1.0 mL volume of sample (see Note), is introduced into an ion chromatograph (IC). Perchlorate is separated and measured, using a system comprised of an ionchromatographic pump, sample injection valve, guard column, analytical column,suppressor device, and conductivity detector.
NOTE: This large sample loop (1.0 mL) can be made using approximately 219 cm (86inches) of 0.03 inch i.d. PEEK tubing. The exact volume is not critical sinceall standards and samples will use the same sample loop. However, thevolume should be verified to be within 5% of this volume by weighing thesample loop empty, filling the loop with deionized water and re-weighing theloop. The volume can then be approximated by assuming the density of wateris 1.0 mg/uL.
3. DEFINITIONS
3.1 ANALYSIS BATCH -- A sequence of samples, which are analyzed within a 30 hourperiod and include no more than 20 field samples. An Analysis Batch must alsoinclude all required QC samples, which do not contribute to the maximum field sampletotal of 20. The required QC samples include:• Instrument Performance Check Standard (IPC)• Laboratory Reagent Blank (LRB)• Initial Calibration Check Standard (ICCS) • Laboratory Fortified Blank (LFB)• Continuing Calibration Check Standard (CCCS), when the batch contains more than
10 field samples• End Calibration Check Standard (ECCS) • Laboratory Fortified Matrix (LFM) • Either a Field Duplicate, a Laboratory Duplicate or a duplicate of the LFM• (if pretreated samples are included in batch) Pretreated LRB• (if pretreated samples are included in batch) Pretreated LFB• (if pretreated samples are included in batch) Pretreated LFM, for each pretreated
matrix.
NOTE: Every field sample analysis, including both diluted and pretreated fieldsamples, but excluding any LFM or duplicate field sample analysis whichqualify as QC samples, must be applied to the maximum of 20 total fieldsamples permitted in an analysis batch.
4
3.1.1 A field sample(s), included in the analysis batch, can be reanalyzed following the ECCS provided the 30 hr time limit for the analysis batch has not expired.The laboratory can reanalyze that sample(s) but must initially conduct a second ICCS before the reanalysis and an ECCS after the final reanalysis. The ECCSmust be completed within the 30 hr window.
3.2 CALIBRATION STANDARD (CAL) -- A solution prepared from the primary dilutionstandard solution(s) or stock standard solutions. The CAL solutions are used tocalibrate the instrument response with respect to analyte concentration.
3.3 INITIAL CALIBRATION STANDARDS -- A series of CAL solutions used to initiallyestablish instrument calibration and develop calibration curves for individual targetanions (Section 10.2).
3.4 INITIAL CALIBRATION CHECK STANDARD (ICCS) -- A CAL solution, which isanalyzed initially, prior to any field sample analyses, which verifies the previouslyestablished calibration curve. The concentration for the initial calibration checkstandard MUST be at or below the MRL (Section 3.17) level.
3.5 CONTINUING CALIBRATION CHECK STANDARDS (CCCS) -- A CAL solutionwhich is analyzed after every tenth field sample analyses, not including QC samples,which verifies the previously established calibration curve and confirms accurateanalyte quantitation for the previous ten field samples analyzed. The concentration forthe continuing calibration check standards should be either at a middle calibration levelor at the highest calibration level (Section 10.3.2).
3.6 END CALIBRATION CHECK STANDARD (ECCS) -- A CAL solution which isanalyzed after the last field sample analyses which verifies the previously establishedcalibration curve and confirms accurate analyte quantitation for all field samplesanalyzed since the last continuing calibration check. The end calibration check standardshould be either the middle or high level continuing calibration check standard (Section10.3.2).
3.7 FIELD DUPLICATES (FD) -- Two separate samples collected at the same time andplace under identical circumstances and treated exactly the same throughout field andlaboratory procedures. Analyses of field duplicates indicate the precision associatedwith sample collection, preservation and storage, as well as with laboratory procedures.
3.8 INSTRUMENT PERFORMANCE CHECK SOLUTION (IPC) -- A solution containinga specific concentration of perchlorate and other test substances (namely chloride,sulfate and carbonate) used to evaluate the performance of the instrument system withrespect to a defined set of criteria.
5
3.9 LABORATORY DUPLICATE (LD) -- Two sample aliquots (LD1 and LD2), taken inthe laboratory from a single sample bottle, and analyzed separately with identicalprocedures. Analyses of LD1 and LD2 indicate precision associated specifically withthe laboratory procedures by removing variation contributed from sample collection,preservation and storage procedures.
3.10 LABORATORY FORTIFIED BLANK (LFB) – An aliquot of reagent water, or otherblank matrix, to which a known quantity of perchlorate is added in the laboratory. TheLFB is analyzed exactly like a sample, and its purpose is to determine whether themethodology is in control, and whether the laboratory is capable of making accurate andprecise measurements.
3.11 LABORATORY FORTIFIED SAMPLE MATRIX (LFM) – An aliquot of anenvironmental field sample to which a known quantity of perchlorate is added in thelaboratory. The LFM is analyzed exactly like a sample, and its purpose is to determinewhether the sample matrix contributes bias to the analytical result (when compared tothe result for the LFB). The background concentrations of perchlorate, in the samplematrix, must be initially determined in a separate aliquot and the measured value in theLFM corrected for this background concentration.
3.12 LABORATORY REAGENT BLANK (LRB) – An aliquot of reagent water or otherblank matrix that is treated exactly as a sample including exposure to all glassware,equipment, solvents, filtration and reagents that are used with other samples. The LRBis used to determine if perchlorate or other interferences are present in the laboratoryenvironment, the reagents, or the apparatus.
3.13 LINEAR CALIBRATION RANGE (LCR) – The concentration range over which theinstrument response is linear.
3.14 MATERIAL SAFETY DATA SHEET (MSDS) – Written information provided byvendors concerning a chemical's toxicity, health hazards, physical properties, fire, andreactivity data including storage, spill, and handling precautions.
3.15 MATRIX CONDUCTIVITY THRESHOLD (MCT) – The highest permittedconductance of an unknown sample matrix, measured prior to conducting the analysis,which is used to determine when sample matrix dilution or pretreatment is required. The conductance of a sample matrix is proportional to the common anions present inthe matrix (which contribute to the level of total dissolved solids [TDS]) which cangreatly affect the integrity of this analysis. The value for this threshold is dependant onthe conditions, hardware, and state of the hardware employed. Consequently, thisthreshold is not method defined and must be determined by the individual analyticallaboratory during the Initial Demonstration of Capability (IDC) and confirmed in eachanalysis batch using the Instrument Performance Check (IPC) Solution. Matrix
6
conductivity is measured in microsiemens/cm (uS/cm) or microMhos/cm (uMhos/cm)which are considered equivalent terms.
3.16 METHOD DETECTION LIMIT (MDL) – The minimum concentration of an analytethat can be identified, measured and reported with 99% confidence that the analyteconcentration is greater than zero.7, 8
3.17 MINIMUM REPORTING LEVEL (MRL) – The minimum concentration that can bereported as a quantitated value for a target analyte in a sample following analysis. Thisdefined concentration can be no lower than the concentration of the lowest calibrationstandard and can only be used if acceptable quality control criteria for this standard aremet.
3.18 PEAK AREA TO HEIGHT RATIO (A/H) – The ratio of the peak area divided by thepeak height which is used as a tool to monitor analytical performance. This ratio isused to establish and monitor the MCT and represents an objective means of assessinganalytical performance when analyzing high conductivity matrices. A gradualdistortion of the baseline is typically observed in the retention time window forperchlorate as the matrix conductivity increases (consistent with elevated levels ofcommon anions) which will more significantly influence peak height relative to theinfluence on peak area. As the distortion of the baseline increases, this ratio increases,and the integrity of the measured perchlorate will be compromised.
3.19 PROFICIENCY TESTING (PT) or PERFORMANCE EVALUATION (PE) SAMPLE -- A certified solution of method analytes whose concentration is unknown to theanalyst. Often, an aliquot of this solution is added to a known volume of reagent waterand analyzed with procedures used for samples. Often, results of these analyses areused as part of a laboratory certification program to objectively determine thecapabilities of a laboratory to achieve high quality results.
3.20 QUALITY CONTROL SAMPLE (QCS) – A solution of method analytes of knownconcentrations that is obtained from a source external to the laboratory and differentfrom the source of calibration standards. It is used to check laboratory performancewith externally prepared test materials.
3.21 STOCK STANDARD SOLUTION (SSS) -- A concentrated solution containingperchlorate which is either prepared in the laboratory using assayed reference materialsor purchased from a reputable commercial source.
3.22 TOTAL DISSOLVED SOLIDS (TDS) -- Both organic and inorganic constituent whichare dissolved in a sample matrix and are not removed by particulate filtration.
7
4. INTERFERENCES
4.1 Method interferences may be caused by contaminants in the reagent water, reagents,glassware, and other sample processing apparatus that lead to discrete artifacts orelevated baselines in an ion chromatogram. These interferences can lead to falsepositive results for the target analyte as well as reduced detection limits as aconsequence of elevated baseline noise.
4.2 Interferences can be divided into three different categories: direct chromatographiccoelution, where an analyte response is observed at very nearly the same retention timeas the target anion; concentration dependant coelution, which is observed when theresponse of higher than typical concentrations of the neighboring peak overlap into theretention window of the target anion; and, ionic character displacement, where retentiontimes may significantly shift due to the influence of high ionic strength matrices (highmineral content or hardness) overloading the exchange sites in the column andsignificantly shortening target analyte's retention times.
4.2.1 A direct chromatographic coelution may be solved by changing columns, eluentstrength, modifying the eluent with organic solvents (if compatible with ICcolumns), changing the detection systems, or selective removal of theinterference with pretreatment. Sample dilution will have little to no effect. Theanalyst MUST verify that these changes do not induce any negative affects onmethod performance by repeating and passing all the QC criteria as described inSection 9.
4.2.2 Sample dilution may resolve some of the difficulties if the interference is theresult of either concentration dependant coelution or ionic characterdisplacement, but it must be clarified that sample dilution will alter yourMinimum Reporting Limit (MRL) by a proportion equivalent to that of thedilution. Therefore, careful consideration of project objectives should be givenprior to performing such a dilution. An alternative to sample dilution, may bedilution of the eluent as outlined in Section 11.2.6.
4.2.3 Pretreatment cartridges can be effective as a means to eliminate certain matrixinterferences. With any proposed pretreatment, the analyst must verify that thetarget analyte is not affected by monitoring recovery after pretreatment(additional pretreated LFM requirement see Section 11.1.4.6) and that nobackground contaminants are introduced by the pretreatment (additionalpretreated LRB requirement see Sections 9.3.1.1 and 11.1.4.2). With advancesin analytical separator column technology which employ higher capacity anionexchange resins, the need for these cartridges has been greatly reduced.

8
4.2.3.1 Extreme caution should be exercised in using these pretreatmentcartridges. Artifacts are known to leach from certain cartridges whichcan foul the guard and analytical columns causing loss of columncapacity indicated by shortened retention times and irreproducibleresults. Frequently compare your calibration standard chromatogramsto those of the column test chromatogram (received when the columnwas purchased) or use calibration chromatograms generated when thecolumn was initially installed, to insure proper separation and similarresponse ratios between the target analytes are observed.
4.2.3.2 If LRB background problems are encountered in the retention timewindow for perchlorate when these pretreatment cartridges have beenemployed, increase the initial reagent water rinse of the cartridge toapproximately five times the volume specified by the manufacturer.
4.3 Sample matrices with high concentrations of common anions such as chloride, sulfateand carbonate can make the analysis problematic by destabilizing the baseline in theretention time window for perchlorate. This is evidenced by observing a protractedtailing following the initial elution of the more weakly retained anions (chloride,carbonate, and sulfate) which extends into the perchlorate retention time window. These common anion levels can be indirectly assessed by monitoring the conductivityof the matrix. Consequently, all sample matrices must be monitored for conductivity(Section 11.1.2) prior to analysis. When the laboratory determined Matrix ConductivityThreshold (MCT, see Section 9.2.8) is exceeded, procedures incorporating sampledilution and/or pretreatment must be performed as specified in Sections 11.1.3 and11.1.4, respectively.
4.4 All reagent solutions (eluents, external water for ASRS suppressor, etc...) used by theinstrument must be filtered through no larger than a 0.45 um nominal pore size membrane or frit to remove particulates and prevent damage to the instrument, columnsand flow systems. Sample filtration must also be employed on every sample prior toanalysis. This applies not only to field samples but also to the laboratory reagent blank(LRB) and laboratory fortified blank (LFB). The LRB and LFB samples function ascontrols and must be filtered to confirm no bias is attributable to the filtration.5 Filterthe samples through a membrane or frit with no larger than a 0.45 um nominal poresize. Syringe mounted, cartridge type, filters work well. Filters specifically designedfor IC applications should be used.
4.5 Close attention should be given to the potential for carry over peaks from one analysiswhich will effect the proper detection of perchlorate in a second, subsequent analysis. It is the responsibility of the user to confirm that no late eluting peaks have carried overinto a subsequent analysis thereby compromising the integrity of the analytical results.
9
5. SAFETY
5.1 The toxicity or carcinogenicity of each reagent used in this method have not been fullyestablished. Each chemical should be regarded as a potential health hazard andexposure should be as low as reasonably achievable. Cautions are specifically listedbelow in Section 5.3 for hazardous materials.
5.2 Each laboratory is responsible for maintaining a current awareness file of OSHAregulations regarding the safe handling of the chemicals specified in this method. Areference file of Material Safety Data Sheets (MSDS) should be made available to allpersonnel involved in the chemical analysis. The preparation of a formal safety plan isalso advisable. Additional references on laboratory safety are available.9-12
5.3 The following chemicals have the potential to be highly toxic or hazardous, consultMSDS.
5.3.1 Sodium Hydroxide (NaOH), used in the preparation of the eluent is consideredcaustic.
6. EQUIPMENT AND SUPPLIES
6.1 Ion chromatograph (IC) -- Analytical system complete with eluent reservoirs, an ionchromatographic pump, injection valves, both guard and analytical separator columns, suppressor, conductivity detector, and computer based data acquisition system.
6.1.1 Anion guard column -- Dionex AG16 4 mm (P/N 55377), or equivalent. Thiscolumn functions as a protector of the separator column. If omitted from thesystem, the retention times will be shorter.
6.1.2 Anion separator column -- Dionex AS16, 4 mm (P/N 55376), or equivalent (see
Sections 6.1.2.1 - 6.1.2.2). The AS16, 4 mm column using the conditionsoutlined in Table 1 produced the separations shown in Figures 1 through 4.
6.1.2.1 The development of this method included investigations into theperformance of alternate 4 mm IC guard and analytical separatorcolumns which have been used for the IC analysis of perchlorate andare specified in procedures external to the U.S.EPA.1-5 These alternateguard /separator columns included the Dionex AG5 / AS5 and theDionex AG11 / AS11. The AG5 / AS5 is currently specified in thestandard operating procedure (SOP) for the IC analysis of perchlorateby the State of California, Department of Health Services.1, 5 TheAG11 / AS11 is used by several commercial labs conducting ICanalysis for perchlorate and is recognized by California as an
10
acceptable alternate to the AG5 / AS5. 2-4 A multilab validation studyincluded both of these analytical columns and indicated comparableresults could be attained.6 In U.S.EPA studies, both the AG5 / AS5and the AG11 / AS11 performed well for reagent water and simulateddrinking water samples with low to moderate common anion levels butas these levels increased, performance began to diminish for bothcolumns. The AG16 / AS16 columns could tolerate much higherlevels of these common anions and therefore it is recommended in thismethod as the column of choice. A summary of the results ofexamining these three columns for simulated matrices with variouscommon anion levels is presented in Table 4.
6.1.2.2 Any alternate, equivalent column must be characterized as hydrophilicor conversely, must be rated as having low to very lowhydrophobicity.4 This is one characteristic that is consistent for theAS5, AS11 and AS16 analytical separator columns. This requirementfor low hydrophobicity is to allow the efficient, reproducible andsymmetrical band elution of polarizable anions, such as perchlorate. If the perchlorate analysis is attempted on a hydrophobic column, suchas those typically used for the analysis of common anions,13 poorperformance will result due to very asymmetric, tailing peaks. Using amiddle to high calibration standard, conduct a typical analysis. Anyalternate column must be capable of yielding symmetrical peak elutionfor this perchlorate response as demonstrated by yielding a PeakGaussian Factor of between 0.80 and 1.15 using the followingequation,
1.83 x W(½)PGF = -----------------------
W (1/10)where, W(½) is the peak width at half height, and W (1/10) is the peak width at tenth height.
NOTE: Values for W(½) and W (1/10) can be attained through mostdata acquisition software.
6.1.3 Anion suppressor device -- The data presented in this method were generatedusing a Dionex Anion Self Regenerating Suppressor (4 mm ASRS, ULTRA,P/N 53946). An equivalent suppressor device may be utilized providedcomparable conductivity detection limits are achieved and adequate baselinestability is attained as measured by a combined baseline drift/noise of no morethan 5 nS per minute over the background conductivity. Proper suppressor

11
performance is essential to analytical data reproducibility and sensitivity of theconductivity detector.
6.1.3.1 The ASRS was set to perform electrolytic suppression at a current
setting of 300 mA using the external water mode. External water wasdelivered to the suppressor directly from a pressurized source at a flowrate of 5 mL/min
6.1.3.2 If pretreated samples (Section 11.1.4), or sample matrices whichcontain appreciable concentrations of transition metal cations (e.g., Feor Al) are frequently analyzed, cationic components may bind to thesuppressor membrane and over time effect suppressor performance. Ifthe instrument begins to have problems with reduced peak response orasymmetrical perchlorate peaks, the suppressor membranes should becleaned. As a quick and easy cleaning step, the manufacturer's ASRS"Quickstart" procedure for installing a new ASRS should befollowed.14 If this procedure does not correct the problem, follow themanufacturer's recommended cleaning procedure for removing metalcontaminants.15
6.1.4 Detector -- Conductivity cell (Dionex CD20, or equivalent) capable of providingdata as required in Section 9.2.
6.2 Data Acquisition System -- The Dionex Peaknet Data Chromatography Software wasused to generate all the data in Tables 1 through 4. Other computer based data systemsmay achieve approximately the same performance but the user should demonstrate thisby the procedures outlined in Section 9.
6.3 Conductivity Meter – Used to monitor sample matrix conductance which is directlyrelated to the common anion levels in a matrix and used to determine if samplepretreatment is required. At a minimum, this meter should be capable of measuringmatrix conductance over a range of 1 - 10,000 uS/cm.
6.4 Analytical balance -- Used to accurately weigh target analyte salt for stock standardpreparation (±0.1 mg sensitivity).
6.5 Top loading balance -- Used to accurately weigh reagents such as sodium hydroxidesolution in the preparation of eluents (±10 mg sensitivity).
6.6 Weigh boats -- Plastic, disposable - for weighing eluent reagents.
6.7 Micro beakers -- Plastic, disposable - used during sample preparation.
12
6.8 Syringes -- Plastic, disposable, 10 mL - used during sample preparation.
6.9 Pipets -- Pasteur, plastic or glass, disposable, graduated, 5 mL and 10 mL.
6.10 Bottles -- High density polyethylene (HDPE) or glass, amber or clear, 30 mL, 125 mL,250 mL. For sampling and storage of calibration solutions. Stability studies presented by the Interagency Perchlorate Steering Committee for Analytical Methods 6 andconfirmed at the EPA (see Table3A), indicate perchlorate is neither photoreactive norprone to adsorption to the walls of either HDPE plastic or glass bottles.
6.11 Particulate filters -- 0.45 micron syringe filters, specifically designed for IC applications(Gelman IC Acrodisc, PN 4485, or equivalent). These cartridges are used to removeparticulates from the sample matrix while loading the sample manually or if theautosampler employed does not filter the sample during loading.
6.12 Matrix pretreatment cartridges in the barium form -- (Dionex OnGuard-Ba cartridges,PN 046072, or equivalent.) These cartridges are conditioned according to themanufacturer’s directions and are used to reduce the matrix levels of sulfate.
6.13 Matrix pretreatment cartridges in the silver form – (Dionex OnGuard-Ag cartridgesPN 039637, or equivalent.) These cartridges are conditioned according to themanufacturer’s directions and are used to reduce the matrix levels of chloride.
6.14 Matrix pretreatment cartridges in the hydrogen form -- Dionex OnGuard-H cartridges(PN 039596) or equivalent. These cartridges are conditioned according to themanufacturer’s directions and are used to reduce cations in the sample matrix. Thisprotects the analytical column by removing silver which has leached from the Agcartridge and may indirectly minimize the effect of carbonate by removing the cationiccounter ion.
7. REAGENTS AND STANDARDS
7.1 Reagent water -- Distilled or deionized water 17.8 Mohm or better, free of the anions ofinterest. Water should contain particles no larger than 0.20 microns.
7.2 Eluent solution -- 50 mM sodium hydroxide (NaOH, [CASRN 1310-73-2]), dissolve8.0 grams of 50% (W/W) sodium hydroxide in reagent water to a final volume of 2.0 L. NOTE: This eluent solution is specific to the columns listed in Table 1. Any alternatecolumns will likely have unique and specific conditions identified by the manufacturer.
7.2.1 Solutions of NaOH are very susceptible to carbonate contamination resultingfrom adsorption of carbon dioxide from the atmosphere. This contaminationwill result in poor reproducibility of perchlorate retention times, elevated
13
instrument background conductivity, and increased baseline noise/drift. Consequently, exposure to the atmosphere should be minimized by storing theseeluent solutions in sealed reservoirs under low pressure (3 to 5 psi) helium. Inaddition, these solutions should be regularly prepared and held for no more than5 days. When refilling the eluent reservoir, completely replace old eluentsolution by emptying the old eluent, rinsing the reservoir with reagent water,and refilling with the freshly prepared eluent solution. With this eluent, thesuppressed conductivity detector background signal should be between 2 - 5 uS.
7.2.2 This eluent solution must be purged for 10 minutes with helium prior to use. This effectively removes dissolved gases which may form micro bubbles in theIC, compromising system performance and adversely effecting the integrity ofthe data. Alternatively, an in-line degas apparatus may be employed.
7.2.3 A system or apparatus which automatically generates the hydroxide eluent(Dionex EG40, or equivalent) is an acceptable alternative to physicallypreparing this hydroxide eluent.
7.3 Perchlorate stock standard solution, 1000 mg/L (1 mg/mL) – A stock standard solutionmay be purchased as a certified solution or prepared from ACS reagent grade, sodiumsalt as listed below. (NOTE: Sodium perchlorate represents a molar weight fraction of81.2 % perchlorate anion)
7.3.1 Perchlorate (ClO4
-) 1000 mg/L -- Dissolve 0.1231 g sodium perchlorate(NaClO4, CASRN [7601-89-0] in reagent water and dilute to 100 mL in avolumetric flask.
NOTE: Stability of standards -- Perchlorate stock standards, stored at roomtemperature, appear to be very stable and may be stable for an extended periodof time. However, specified expiration dates should be marked on eachprepared stock standard as part of any laboratory’s quality control program. Inthis regard, it is recommended that stock standards for perchlorate be held forno more than 12 months and an expiration date should be clearly specified onthe label.
7.4 Mixed Common Anion Stock Solution - containing the anions chloride, sulfate andcarbonate each at 25 mg/mL anion concentration. This solution is used to preparesimulated common anion samples in the determination of the MCT (Section 9.2.8).
7.4.1 Dissolve the following salts in reagent water to a final volume of 25.0 mL:1.0 g sodium chloride (NaCl, CASRN [7647-14-5]) = 0.61 g Cl-
0.93 g sodium sulfate (Na2SO4, CASRN [7757-82-6]) = 0.63 g SO4=
1.1 g sodium carbonate (Na2CO3, CASRN [497-19-8]) = 0.62 g CO3=

14
7.5 Conductivity Meter Calibration Solution
7.5.1 Potassium Chloride (KCl), 745 mg/L (total salt weight) -- Dissolve 0.745 gpotassium chloride (KCl, [CASRN 7447-40-7]) in reagent water and dilute to afinal volume of 1.00 L in a volumetric flask. On a properly functioning andcalibrated conductivity meter, the reference conductance for this solution is1410 uS/cm at 25 oC.16
8. SAMPLE COLLECTION, PRESERVATION AND STORAGE
8.1 Samples may be collected in plastic or glass bottles. All bottles must be thoroughlycleaned and rinsed with reagent water. The volume collected should be sufficient toinsure a representative sample, allow for replicate analysis and laboratory fortifiedmatrix analysis, if required, and minimize waste disposal.
8.2 Samples do not need to be shipped iced or stored cold in a refrigerator but every effortshould be taken to protect the samples from temperature extremes. A thermallyinsulated sampling kit, designed to fit sampling bottles securely during shipment,should be used to protect the samples from these temperature extremes.
8.3 Sample preservation and holding times for the anions are as follows:Analyte Preservation Holding TimePerchlorate None required 28 days
NOTE: Perchlorate has been shown to be stable for more than 28 days6 but extendedholding time studies (beyond 35 days) were not conducted by EPA. Typically, when analytes are believed to be stable, a 28 day holding time isestablished as a sufficient time period to permit a laboratory to conduct theanalysis.
9. QUALITY CONTROL
9.1 Each laboratory using this method is required to operate a formal quality control (QC)program. The requirements of this program consist of an initial demonstration oflaboratory capability, and subsequent analysis in each analysis batch (Section 3.1) of an Instrument Performance Check Standard (IPC), Laboratory Reagent Blank (LRB),Initial Calibration Check Standard (ICCS), Laboratory Fortified Blank (LFB),Continuing and End Calibration Check Standards (CCCS/ECCS), Laboratory FortifiedSample Matrix (LFM) and either a Field, Laboratory or LFM duplicate sample analysis. This section details the specific requirements for each of these QC parameters. The QCcriteria discussed in the following sections are summarized in Section 17, Table 5 and

15
6. The laboratory is required to maintain performance records that define the quality ofthe data that are generated.
9.2 INITIAL DEMONSTRATION OF CAPABILITY
9.2.1 The Initial Demonstration of Capability (IDC) -- This is used to characterizeinstrument and laboratory performance prior to performing analyses by thismethod. The QC requirements for the IDC discussed in the following sectionare summarized in Section 17, Table 5.
9.2.2 Initial demonstration of low system background -- See Section 9.3.1.
9.2.3 Initial Demonstration of Accuracy (IDA) -- Prepare and analyze 7 replicateLFBs fortified at 25.0 ug/L. Calculate the mean measured concentration (C0) ofthe replicate values as follows.
(C1 + C2 + C3 + ....Cn )C0 = -------------------------------
nwhere,
C0 = Mean recovered concentration of the replicate analysis.C1, C2, ...Cn = Recovered concentrations of the replicate 1,2...n. n = 7
To pass the IDA, the value derived for C0 must be within ± 10% of the truevalue or between 22.5 ug/L and 27.5 ug/L.
9.2.4 Initial Demonstration of Precision (IDP) -- Using the data generated for Section9.2.3, calculate the percent relative standard deviation (%RSD) of the replicateanalysis, as indicated below. To pass the IDP, the %RSD must be less than10%.
(Sn-1)%RSD = ---------- x 100
(C0)where,
Sn-1 = sample standard deviation (n-1) of the replicate analyses.C0 = mean recovered concentration of the replicate analysis.
9.2.5 Quality Control Sample (QCS) – After calibration curves have initially beenestablished or have been re-established, or as required to meet data qualityneeds, verify both the calibration and acceptable instrument performance withthe preparation and analyses of an external/second source QCS. If thedetermined concentrations are not within ± 10% of the stated values,

16
performance of the determinative step of the method is unacceptable. Thesource of the problem must be identified and corrected before either proceedingwith the IDC or continuing with on-going analyses.
9.2.6 Method Detection Limit (MDL) – An MDL must be established using reagentwater (blank) fortified at a concentration of three to five times the estimatedinstrument detection limit.7, 8 To determine MDL values, take seven replicatealiquots of the fortified reagent water and process through the entire analyticalmethod over a three day period. These seven MDL replicate analyses may beperformed gradually over three days or may represent data that has beencollected, at a consistent MDL estimated concentration, over a series of morethan three days. Perform all calculations defined in the method and report theconcentration values in the appropriate units. Calculate the MDL as follows:
MDL = (t) x (Sn-1)
where,t = student's t value for a 99% confidence level and a standard deviation
estimate with n-1 degrees of freedom [t = 3.14 for seven replicates]Sn-1 = sample standard deviation (n-1) of the seven replicate analyses.
9.2.6.1 MDLs should be periodically verified, but MUST be initiallydetermined when a new operator begins work or whenever there is asignificant change in the background, or instrument response.
NOTE: Do not subtract blank values when performing MDL calculations.
9.2.7 Minimum Reporting Level (MRL) – The MRL is the threshold concentration ofan analyte that a laboratory can expect to accurately quantitate in an unknownsample. The MRL should be established at an analyte concentration eithergreater than three times the MDL or at a concentration which would yield aresponse greater than a signal to noise ratio of five. Setting the MRL too lowmay cause repeated QC failure upon analysis of the ICCS. Although thelowest calibration standard may be below the MRL, the MRL must neverbe established at a concentration lower than the lowest calibrationstandard.
9.2.8 Matrix Conductivity Threshold (MCT) – The MCT is an individual laboratorydefined value which must be determined by preparing a series of sequentiallyincreasing, common anion fortified, reagent water samples each contain aconstant perchlorate concentration. Initially, a reagent water prepared LFB,containing no common anions, must be analyzed which contains perchlorate at asuggested concentration of 25 ug/L perchlorate. Next, the series of sequentially
17
increasing anionic solutions are prepared, each containing perchlorate at asuggested concentration of 25 ug/L, which also containing the individualcommon anions of chloride, sulfate and carbonate, all included at uniformincreasing concentrations of 200, 300, 400, 500, 600, 800, and 1000 mg/L foreach anion. A concentration of 25 ug/L perchlorate has been suggestedassuming the MRL has been set in the range of 3.0 ug/L to 5.0 ug/L. If alaboratory’s MRL is higher, choose a perchlorate concentration for this exerciseat approximately 5 times that MRL.
9.2.8.1 Prepare the mixed common anion stock solution (see Section 7.4)containing chloride, sulfate and carbonate, each at 25 mg/mL.
9.2.8.2 Prepare a perchlorate secondary stock dilution standard at 1.00 mg/L
from the 1000 mg/L perchlorate stock standard (Section 7.3) bydiluting 0.50 mL of the stock solution to a final volume of 500 mL.
9.2.8.3 Prepare the LFB at suggested perchlorate concentration of 25 ug/L bydiluting 0.625 mL of the perchlorate secondary stock dilution standard(Section 9.2.8.2) to a final volume of 25.0 mL.
9.2.8.4 Next, prepare the series of common anion fortified reagent watersamples by adding 0.20 mL, 0.30 mL, 0.40 mL, 0.50 mL, 0.60 mL,0.80 mL, and 1.00 mL of the mixed common anion stock solution(Section 7.4) into separate 25 mL volumetric flasks. Next, add 0.625mL of the perchlorate secondary stock dilution standard (Section9.2.8.2) to each 25 mL volumetric flask and dilute to volume withreagent water to yield a final perchlorate concentration of 25.0 ug/L.
9.2.8.5 Measure and record the conductance of each of these preparedsolutions on a calibrated conductivity meter (This meter must becalibrated as described in Section 10.4 prior to measuringconductance). To use as a relative reference conductance, the 400mg/L mixed anion sample, which contains chloride at 400 mg/L,sulfate at 400 mg/L and carbonate at 400 mg/L, should display aconductance of between 3200 uS/cm and 3700 uS/cm.
9.2.8.6 Analyze each solution, recording the peak area to height (A/H) ratioand the quantified concentration of perchlorate. In many dataacquisition and instrument control software, the peak area to heightratio is a definable parameter which can be specified for printout onthe analysis report.
18
9.2.8.7 Both the A/H ratio and quantified perchlorate concentration for theLFB and the 200 mg/L mixed common anion solution should bereproducibly consistent but as the common anion levels increase, theA/H ratio will also begin to increase as the peak height is distorted andreduced. As the peak is distorted, the area will also eventually begin tobe distorted and the quantitated concentration will be reduced, but thisis typically secondary, with the ratio of peak area to height initiallypredicting this pending quantitation problem.
9.2.8.8 Calculate the A/H ratio percent difference (PDA/H) between the averageA/H ratio for the LFB (A/HLFB) and the average A/H ratios for eachmixed common anion solutions (A/HMA) using the following equation.
*(A/HLFB - A/HMA)*
PDA/H = -------------------------------- X 100A/HLFB
9.2.8.9 As the conductivity of the matrices increase, the PDA/H will increase. The MCT is the matrix conductance where the PDA/H exceeds 20%. To derive the MCT, perform a linear regression on these data byplotting PDA/H (as the independent variable, x) versus the matrixconductance (as the dependent variable, y). The resulting regressiondata should yield an r2 value of > 0.95. (See Figure 5) Record the“constant” (intercept value) and the “X-coefficient” (slope) andcalculate the MCT as follows,
MCT = (20%) x (X-coefficient) + (constant)
NOTE: Be careful to consistently apply percentages as either wholenumbers or as fractional values (20% = 0.20) for both the regressionanalysis and the MCT calculation.
9.2.8.10 As an alternate to the regression analysis, the laboratory can choose toestablish their MCT at the conductance level of the highest mixedanion solution which yielded a PDA/H value below the 20 % threshold.
9.2.8.11 As a final procedure, the laboratory should confirm their perchlorateMRL in a mixed common anion solution which reflects a conductancenear (within +/- 10%) that specified as the MCT. This solution mustcontain perchlorate, at the laboratory determined MRL, as well as thecommon anions chloride, sulfate and carbonate, prepared consistentwith the instruction for the mixed anion solutions in this section and ata concentration estimated to generate a conductance near the MCT.
19
The conductance of this solution must be measured at within ±10% ofthe MCT and following the analysis, the recovered perchlorate must bebetween 70 - 130% of the MRL concentration. If the MRL recoveryfails this criteria, the MCT should be lowered by 10% and this MRLverification must be repeated.
9.2.8.12 Prior to conducting any field sample analysis, the conductivity of thatmatrix must be determined. When the conductance of a field sample isabove the MCT, sample dilution or pretreatment, as described inrespective Sections 11.1.3 and 11.1.4 must be performed.
9.3 ASSESSING LABORATORY PERFORMANCE - The following items must beincluded in every analysis batch (Section 3.1).
9.3.1 Laboratory Reagent Blank (LRB) – An LRB must be prepared and treatedexactly as a typical field sample including exposure to all glassware, equipment,solvents, filtration and reagents that are used with field samples. Data producedare used to assess instrument performance of a blank sample and evaluatecontamination from the laboratory environment. Values that exceed ½ the MRLindicate a laboratory or reagent contamination is present. The source of thecontamination must be determined prior to conducting any sample analysis. Any sample included in an automated analysis batch which has an invalid LRB,indicated by a quantitated perchlorate that exceeds ½ the MRL, must bereanalyzed in a subsequent analysis batch after the contamination problem isresolved.
9.3.1.1 When sample matrices have been pretreated to reduce the risk of highcommon anion interference (Section 11.1.4), a second LRB must beprepared, pretreated in exactly the same manner, and analyzed toconfirm no background effects from the pretreatment process arepresent. If an analysis batch only contains pretreated samples, thenonly a pretreated LRB is required.
9.3.2 Instrument Performance Check (IPC) -- The MCT, which was determined aspart of the IDC in Section 9.2.8, must be verified through the analysis of an IPC. The IPC is three tiered and is used to verify the state of the IC system, over time,to quantitate perchlorate in highly ionic matrices. This must be conducted witheach analysis batch since over time, column performance can change.
9.3.2.1 Prepare a mixed common anion solution which reflects a conductancenear (within +/- 10%) that specified as the MCT. This solution mustbe prepared consistent with the instruction in Section 9.2.8, andcontaining the common anions chloride, sulfate and carbonate as well
20
as perchlorate at a suggested concentration of 25 ug/L. Thisperchlorate concentration has been specified assuming the MRL hasbeen set in the range of 3.0 ug/L to 5.0 ug/L. If a laboratory’s MRL ishigher, chose a perchlorate concentration for this exercise atapproximately 5 times that MRL.
9.3.2.2 Confirm the conductance of the IPC and analyze it as the initial samplein the analysis batch. If, after several weeks of storage, the measuredconductance of this solution has shifted by more than 10% from theoriginal measured value, prepare a fresh IPC solution. Following the analysis, calculate the PDA/H (Section 9.2.8.8), by comparing the peakarea to height ratio of this IPC mixed anion standard (A/HMA) for thisanalysis batch to the value that was derived for the LFB (A/HLFB) eitherin the original IDC or in the previous analysis batch. As the first tiercriteria, the value for PDA/H must be less than 25% before proceedingwith the analysis batch.
9.3.2.3 At the second tier criteria, the measured recovery for perchlorate in thisIPC must fall between 80% and 120 % (20.0 ug/L to 30.0 ug/L for a 25ug/L fortification).
9.3.2.4 As a third tier and final criteria for the IPC, the laboratory must closelymonitor the perchlorate retention time for this analysis. Smallvariations in retention time can be anticipated when a new solution ofeluent is prepared but if sudden shifts of more than 5% are observed inthe perchlorate retention time, some type of instrument problem maybe present. Potential problems include improperly prepared eluent,erroneous method parameters programmed such as flow rate or someother system problem. The observed retention time for perchlorateshould closely replicate the times established when the column wasoriginally installed. As a column ages, it is normal to see a gradualshift and shortening of retention times, but if after several years of use,extensive use over less than a year, or use with harsh samples, thisretention time has noticeably shifted to any less than 80% of theoriginal recorded value, the column requires cleaning (according tomanufacturer’s instructions) or replacement. A laboratory shouldretain a historic record of retention times for perchlorate to provideevidence of an analytical column’s continued performance.
9.3.2.5 If any of the conditions defined in Section 9.3.2.2 through 9.3.2.4 arenot met, the MCT must be repeated and revised to a more appropriatelower matrix conductivity threshold or the source of the problem mustbe determined and the IPC reanalyzed.
21
9.3.3 Laboratory Fortified Blank (LFB) – Prepare a secondary dilution stock using thesame stock solution used to prepare the calibration standards. This separate,secondary dilution stock is used as a concentrate to fortify the LFB and theLFMs (Section 9.4.1). An external source stock or QCS, which is used to verifythe accuracy of the calibration curve when it was initially prepared (Section10.2.5), should not be used to prepare this secondary dilution stock. Laboratories are required to analyze a LFB (filtered as if it were a field sample)with each analysis batch immediately following the ICCS. The LFB must beprepared with the same solution used to prepare the LFM and should beprepared at concentrations no greater than ten times the highest concentrationobserved in any field sample and should be varied to reflect the range ofconcentrations observed in field samples. By analyzing the LFB initially, acontrol check is performed on the concentrated solution used to prepare theLFM. If any deviations in the perchlorate concentration are present, it will bereflected in the LFB and not exclusively attributed to a matrix upon analysis ofthe LFM. Calculate accuracy as percent recovery (Section 9.4.1.3). Therecovery for perchlorate must fall in the range of 85 - 115% prior to analyzingsamples. If the LFB recovery for an analysis batch does not meet these recoverycriteria the data are considered invalid, and the source of the problem should beidentified and resolved before continuing analyses.
9.3.3.1 When sample matrices have been pretreated to reduce the risk of highcommon anion interference (Section 11.1.4), a second LFB must beprepared, pretreated in exactly the same manner, and analyzed toconfirm no background effects or recovery bias induced by thepretreatment are present. If an analysis batch only contains pretreatedsamples, then only a pretreated LFB is required.
9.4 ASSESSING ANALYTE RECOVERY AND DATA QUALITY - The following mustbe included in every analysis batch (Section 3.1).
9.4.1 Laboratory Fortified Sample Matrix (LFM) – The laboratory must add a knownamount of each target analyte to a minimum of 5% of the collected field samplesor at least one with every analysis batch, whichever is greater. Samples whichexceed the MCT must either be diluted (Section 11.1.3) or pretreated to reducethe common anion levels (Section 11.1.3). Samples which are pretreated haveadditional LFM requirements described in Section 11.1.4.6, and must befortified before pretreatment. For a LFM to be valid, the target analyteconcentrations must be greater than the native level and should adhere to therequirement outlined in Section 9.4.1.2. It is recommended that the solutionsused to fortify the LFM be prepared from the same stocks used to prepare thecalibration standards and not from external source stocks. This will remove the
22
bias contributed by an externally prepared stock and focus on any potential biasintroduced by the field sample matrix.
9.4.1.1 The fortified concentration must be equal to or greater than the nativesample concentration. Fortified samples that exceed the calibrationrange must be diluted to be within the linear range. In the event thatthe fortified level is less than the observed native level of theunfortified matrix, the recovery should not be calculated. This is dueto the difficulty in calculating accurate recoveries of the fortifiedconcentration when the native sample concentration to fortifiedconcentration ratio is greater than one.
9.4.1.2 For normal drinking waters, the LFM typically should be prepared inthe range of 20 - 50 ug/L. The LFM should not be prepared atconcentration greater than ten times the highest concentration observedin any field sample and should be varied to reflect the range ofconcentrations expected in field samples.
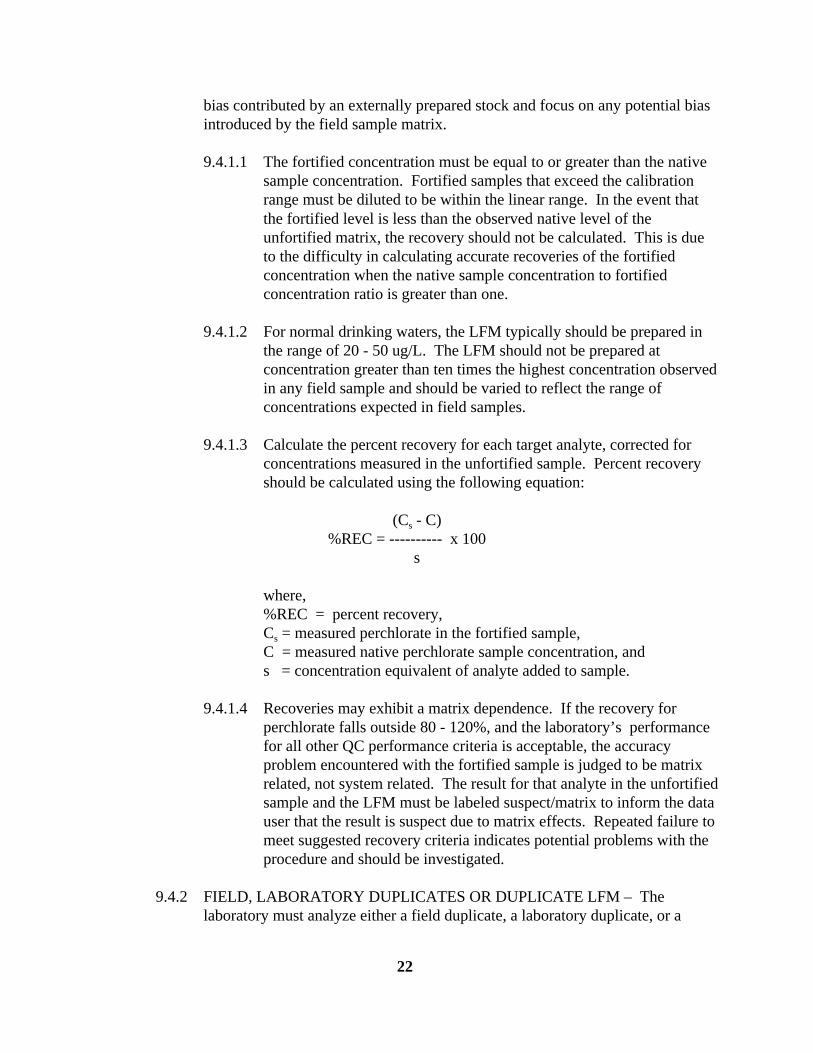
9.4.1.3 Calculate the percent recovery for each target analyte, corrected forconcentrations measured in the unfortified sample. Percent recoveryshould be calculated using the following equation:
(Cs - C)%REC = ---------- x 100
s
where,%REC = percent recovery, Cs = measured perchlorate in the fortified sample,C = measured native perchlorate sample concentration, ands = concentration equivalent of analyte added to sample.
9.4.1.4 Recoveries may exhibit a matrix dependence. If the recovery forperchlorate falls outside 80 - 120%, and the laboratory’s performancefor all other QC performance criteria is acceptable, the accuracyproblem encountered with the fortified sample is judged to be matrixrelated, not system related. The result for that analyte in the unfortifiedsample and the LFM must be labeled suspect/matrix to inform the datauser that the result is suspect due to matrix effects. Repeated failure tomeet suggested recovery criteria indicates potential problems with theprocedure and should be investigated.
9.4.2 FIELD, LABORATORY DUPLICATES OR DUPLICATE LFM – The
laboratory must analyze either a field duplicate, a laboratory duplicate, or a
23
duplicate LFM for a minimum of 5% of the collected field samples or at leastone with every analysis batch, whichever is greater. The sample matrix selectedfor this duplicate analysis must contain measurable concentrations of the targetanions in order to establish the precision of the analysis set and ensure thequality of the data. Without prior knowledge or strong suspicion that anunknown sample has measurable perchlorate concentrations, the best alternativeis to analyze a duplicate LFM.
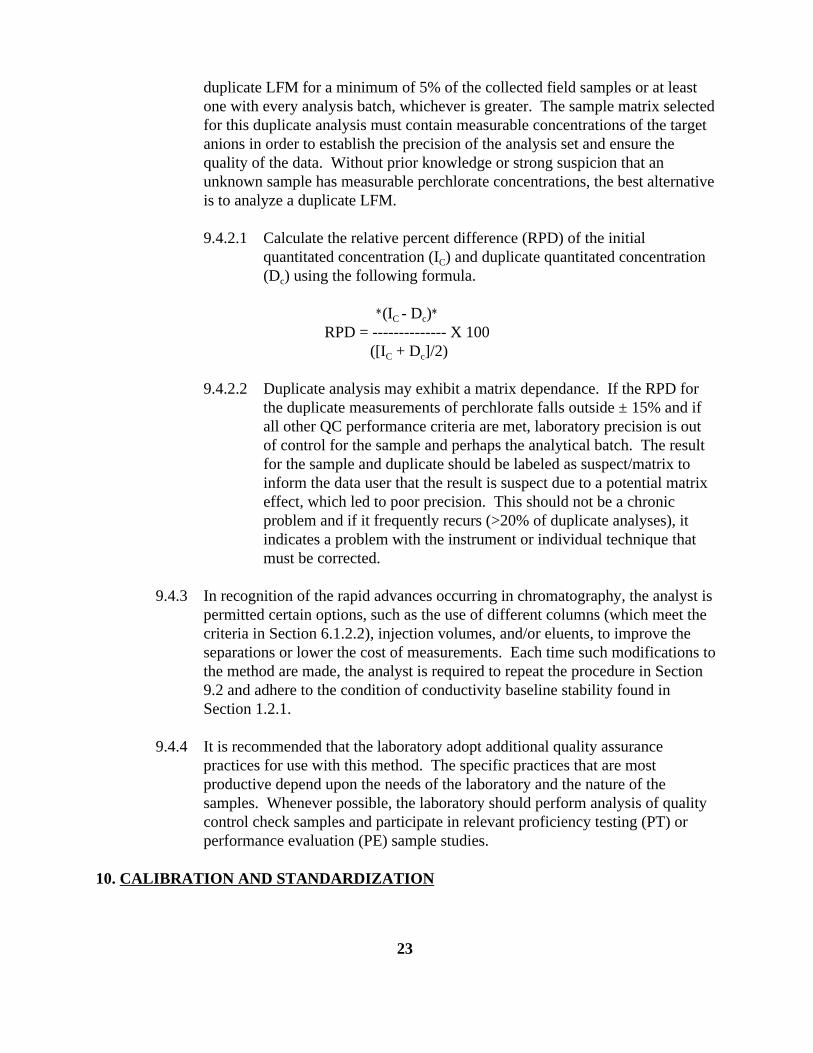
9.4.2.1 Calculate the relative percent difference (RPD) of the initialquantitated concentration (IC) and duplicate quantitated concentration(Dc) using the following formula.
*(IC - Dc)*
RPD = -------------- X 100 ([IC + Dc]/2)
9.4.2.2 Duplicate analysis may exhibit a matrix dependance. If the RPD forthe duplicate measurements of perchlorate falls outside ± 15% and ifall other QC performance criteria are met, laboratory precision is outof control for the sample and perhaps the analytical batch. The resultfor the sample and duplicate should be labeled as suspect/matrix toinform the data user that the result is suspect due to a potential matrixeffect, which led to poor precision. This should not be a chronicproblem and if it frequently recurs (>20% of duplicate analyses), itindicates a problem with the instrument or individual technique thatmust be corrected.
9.4.3 In recognition of the rapid advances occurring in chromatography, the analyst ispermitted certain options, such as the use of different columns (which meet thecriteria in Section 6.1.2.2), injection volumes, and/or eluents, to improve theseparations or lower the cost of measurements. Each time such modifications tothe method are made, the analyst is required to repeat the procedure in Section9.2 and adhere to the condition of conductivity baseline stability found inSection 1.2.1.
9.4.4 It is recommended that the laboratory adopt additional quality assurancepractices for use with this method. The specific practices that are mostproductive depend upon the needs of the laboratory and the nature of thesamples. Whenever possible, the laboratory should perform analysis of qualitycontrol check samples and participate in relevant proficiency testing (PT) orperformance evaluation (PE) sample studies.
10. CALIBRATION AND STANDARDIZATION
24
10.1 Demonstration and documentation of acceptable initial calibration is required prior tothe IDC and before any samples are analyzed, and is required intermittently throughoutsample analysis to meet required QC performance criteria outlined in this method andsummarized in Table 6. Initial calibration verification is performed using a QCS aswell as with each analysis batch using an initial, continuing (when more than 10 fieldsamples are analyzed), and end calibration check standards. The procedures forestablishing the initial calibration curve are described in Section 10.2. The proceduresto verify the calibration with each analysis batch is described in Section 10.3.
10.2 INITIAL CALIBRATION CURVE
10.2.1 Establish ion chromatographic operating parameters equivalent to thoseindicated in Table 1.
10.2.2 Estimate the Linear Calibration Range (LCR) -- The LCR should cover the
expected concentration range of the field samples and should not extend overmore than two orders of magnitude in concentration. The restriction of twoorders of magnitude is prescribed since beyond this it is difficult to maintainlinearity throughout the entire calibration range.
10.2.2.1 If quantification is desired over a larger range, then two separatecalibration curves should be prepared.
10.2.2.2 A minimum of three calibration standards are required for a curve thatextends over a single order of magnitude and a minimum of fivecalibration standards are required if the curve covers two orders ofmagnitude.
10.2.2.3 Since the anticipated concentration range for perchlorate in actual fieldsamples is expected to cover two orders of magnitude, the use of atleast five calibration standards in the range 4 - 400 µg/L isrecommended.
10.2.3 Prepare the calibration standards by carefully adding measured volumes of the stock standard (Section 7.3) to a volumetric flask and diluting to volume withreagent water.
10.2.4 Inject 1.0 mL of each calibration standard. Tabulate peak area responses against
the perchlorate concentration. The results are used to prepare a calibrationcurve. Acceptable calibration is confirmed after reviewing the curve forlinearity (second order fits are also acceptable) and passing the criteria for theinitial calibration check standard in Section 10.3.1. Alternately, if the ratio ofarea to concentration (response factor) is constant over the LCR (indicated by <

25
15% relative standard deviation), linearity through the origin can be assumedand the average ratio or response factor can be used in place of a calibrationcurve.
10.2.4.1 Peak areas must be used as a measure of response since they have beenfound to be more consistent, in terms of quantitation, than peakheights. Peak height can tend to be suppressed as a result of highlevels of common anions in a given matrix which can compete forexchange sites leading to peak broadening. Using peak areas, it is theanalyst’s responsibility to review all chromatograms to insure accuratebaseline integration of target analyte peaks, since poorly drawnbaselines will significantly influence peak areas.
10.2.5 After establishing or reestablishing calibration curves, the accuracy of thiscalibration must be verified through the analysis of a QCS or externallyprepared second source. The QCS should be prepared at a concentration nearthe middle of the calibration curve. As specified in Section 9.2.5, determinedconcentrations must fall within ± 10% of the stated values.
10.3 CONTINUING CALIBRATION VERIFICATION -- Initial calibrations may be stable forextended periods of time. Once the calibration curve has been established it MUST beverified for each analysis batch, prior to conducting any field sample analysis using anInitial Calibration Check Standard. Continuing Calibration Check Standards and EndCalibration Check Standards are also required as described in the sections below.
10.3.1 INITIAL CALIBRATION CHECK STANDARD (ICCS) – For each analysisbatch the calibration must initially be verified prior to analyzing any samples.The lowest level standard used to prepare the linear calibration curve must beused. In cases where the analyst has chosen to set the MRL above the loweststandard, a standard at a concentration equal to the MRL is acceptable. Percentrecovery for the ICCS must be in the range or 75 - 125% before continuing theanalysis batch and conducting any sample analyses.
10.3.2 CONTINUING CALIBRATION CHECK/END CALIBRATION CHECKSTANDARDS (CCCS/ECCS) -- Continuing calibration check standards MUSTbe analyzed after every tenth field sample analysis and at the end of the analysisbatch as an end calibration check standard. If more than 10 field samples areincluded in an analysis batch, the analyst must alternate between the middle andhigh continuing calibration check standard levels.
10.3.2.1 The percent recovery for perchlorate in the CCCS/ECCS must bebetween 85 - 115%.
10.3.2.2 If during the analysis batch, the measured concentration for perchlorate

26
in the CCCS or ECCS differs by more than the calibration verificationcriteria shown above, or if the perchlorate peak retention time shiftsoutside the retention time window (as defined in Section 11.2.4), allsamples analyzed after the last acceptable check standard areconsidered invalid and must be reanalyzed. The source of the problemmust be identified and resolved before reanalyzing the samples orcontinuing analyses.
10.3.2.3 In the case where the end calibration fails to meet performance criteria,but the initial and middle calibration checks are acceptable, thesamples bracketed by the acceptable calibrations may be reported. However, all field samples between the middle and end calibrationchecks MUST be reanalyzed.
10.4 CONDUCTIVITY METER CALIBRATION -- Prior to conducting the MCT andcoinciding with each analysis batch, conductivity meter calibration must be verified orestablished using a standard KCl solution (Section 7.5).
10.4.1 Thoroughly rinse the conductivity electrode with reagent water. Place theelectrode in the reagent water, turn on the meter and confirm the conductance ofthis blank is < 1 uS/cm.
10.4.2 Pour approximately 15 mL of the standard KCl solution (Section 7.5) into aplastic disposable micro beaker (Section 6.7) and place the electrode into thesolution. The reference conductance for this solution is 1410 uS/cm at 25 oC.16 The conductivity meter must yield a conductance between 1380 uS/cm and 1440uS/cm to be in calibration.
10.4.3 If the conductivity meter fails calibration, recalibrate the unit per manufacture’sinstruction and repeat the procedure in 10.4.2 as if the standard solution were anunknown matrix.
11. PROCEDURE
11.1 SAMPLE PREPARATION
11.1.1 Samples do not need to be refrigerated but if samples are held refrigerated as astandard practice for sample control, ensure the samples have come to roomtemperature prior to conducting sample analysis.
11.1.2 MATRIX CONDUCTANCE VERIFICATION - Prior to conducting theanalysis of a field sample matrix, the conductance of that matrix must bemeasured. Matrix conductivity is directly related to the common anion levels

27
which, at high concentrations, can influence the integrity of the perchlorateanalysis.
11.1.2.1 Verify conductivity detector calibration by following the procedureoutlined in Section 10.4.
11.1.2.2 Pour approximately 15 mL of sample into a plastic disposable microbeaker (Section 6.7) and reseal the sample bottle to protect the sampleintegrity.
11.1.2.3 Place the electrode into the matrix and measure the conductivity.
11.1.2.4 If the conductance is less than the MCT, continue to Section 11.1.5.
11.1.2.5 If the conductance is greater than the MCT, the matrix requiresdilution or pretreatment prior to analysis. The dilution procedure isfound in Section 11.1.3. Pretreatment is described in Section 11.1.4.
11.1.2.6 Discard this aliquot of sample and be certain to thoroughly rinse theelectrode with reagent water between each matrix conductivitymeasurement.
11.1.3 MATRIX DILUTION - If matrix conductivity is less than the MCT, go toSection 11.1.5.
11.1.3.1 A sample can be analyzed once diluted with reagent water to aconductance below the MCT. The exact magnitude of this dilutionwill adversely increase the MRL by an equivalent proportion.
11.1.3.2 Knowing the matrix conductance exceeds the MCT, estimate theproportion required for the dilution by dividing the measured matrixconductance by the MCT. Round up to the next whole number anddilute the sample by a proportion equivalent to this value. Forexample, if the established MCT is 6100 uS/cm and a samplereflecting a conductance of 8000 uS/cm was measured, dilute thesample with reagent water by a factor of 2.
11.1.3.3 Measure the conductance of the diluted sample to confirm it is nowbelow the MCT. Analyze the sample as specified in Section 11.1.5with the understanding that the MRL has now been elevated by aproportion equivalent to the dilution.
11.1.3.4 If perchlorate is measured above the elevated MRL, back calculate

28
actual field sample concentration and report. If no perchlorate ismeasured above the elevated MRL and analysis or project objectivesrequired monitoring below the concentration of the elevated MRL,proceed to Section 11.1.4 and pretreat the matrix.
11.1.4 PRETREATMENT FOR MATRICES WHICH EXCEED THE MCT – Ifmatrix conductivity is less than the MCT, go to Section 11.1.5. If sampledilution did not yield the required results, sample pretreatment should beemployed. When the MCT is exceeded, it is most often due to a high levels ofcommon anions (chloride, sulfate, and carbonate) in a particular matrix. If theanalyst were to attempt the IC analysis of this particular matrix, the commonanions present in the sample would distort the baseline and negatively affect theaccurate quantitation of perchlorate. To effectively reduce a significant amountof these anions which contribute to the high conductivity reading, a series ofpretreatment cartridges must be employed. For this pretreatment, threecartridges are attached in series in the following order: Ba, Ag, and H. It isrecommended that all three cartridges be employed unless the analyst hasspecific knowledge that a matrix primarily has high levels of a specific commonanion.
11.1.4.1 Individually and thoroughly rinse each pretreatment cartridge withreagent water in order to insure all residual background contaminantsare removed from the cartridge. Perform this rinse per manufacturer’sinstructions.
11.1.4.2 Prior to pretreating any field samples, prepare and pretreat both anLRB and an LFB. These pretreated quality control samples arerequired when an analysis batch contains a matrix which must bepretreated. This pretreatment is conducted by placing the cartridges inthe following prescribed series (–>Ba–>Ag–>H). The pretreated LRB and LFB are used to verify that no background interference orbias is contributed by the pretreatment. If a response is observed inthe pretreated LRB, triple or quadruple the volume of reagent waterrinse suggested by the manufacturer in Section 11.1.4.1 and repeatuntil a blank measures no more than ½ the MRL. If this additionalrinsing procedure is required, it must be consistently applied to all thecartridges prior to conducting any matrix pretreatment.
11.1.4.3 Filter 3 mL of sample through the series of rinsed, stacked cartridgesas an initial sample rinse (Ba, Ag and H) at a flow rate of 1.0 mL/ minor less (approximately one drop every 3 to 4 seconds). This flow rateis critical to the pretreatment and must be carefully followed. Discardthis fraction and begin collecting the pretreated sample aliquot of

29
collected sample.
11.1.4.4 When sufficient volume has been collected, measure the conductanceof the pretreated sample aliquot being certain the conductivity meter’sprobe has been thoroughly rinsed and excess water has been shakenfrom the tip. If the conductance is now below the MCT, the sample isready for analysis. If the conductance is still above the MCT, the flowrate through the pretreatment cartridge is likely too fast and thepretreatment should be repeated with new cartridges. In someinstances, double pretreatment cartridges may need to be applied. When this pretreatment is performed properly, U.S.EPA has found70% to 95% reduction in matrix conductance with good recoveries forperchlorate.
11.1.4.5 Place this aliquot of pretreated sample into an autosampler vial asdescribed in Section 11.1.3.
11.1.4.6 In order to ensure data quality, all samples which fail the MCT andhave been selected for pretreatment, as described in Section 11.1.4,must also be used to prepare an LFM. This LFM must be fortifiedwith perchlorate at concentrations close to, but greater than, the leveldetermined in the native sample prior to the pretreatment. Initially, thepretreated sample is analyzed and perchlorate level is determined. Then, a second aliquot of sample must be fortified with perchlorate,pretreated to reduce the high common anion levels, and analyzed toassess perchlorate recovery from that matrix. This additional QC isrequired to rule out matrix effects and to confirm that the laboratoryperformed the pretreatment step appropriately. If the perchloraterecovery falls outside the acceptance range of 80 - 120% (Section9.4.1.4), that particular sample should be reported assuspect/matrix.
11.1.4.7 The pretreatments prescribed above are effective at reducing thechloride and sulfate content of a sample matrix but will not reducematrix concentrations of other anions such as nitrate or phosphate.
11.1.5 Pour approximately 15 mL of sample into a micro beaker (Section 6.7) andreseal the sample bottle to protect the sample integrity. Using a Luer lock,plastic 10 mL syringe, withdraw approximately 10 mL of sample from the micro beaker and attach a 0.45 µm particulate filter (Section 6.11), which hasbeen demonstrated to be free of ionic contaminants, directly to the syringe. Filter the sample into an autosampler vial or manually load the injection loopinjecting a fixed amount of filtered, well mixed sample. If using a manually

30
loaded injection loop, flush the loop thoroughly between sample analysis usingsufficient volumes of each new sample matrix.
11.1.5.1 If the autosampler vials or vial caps are designed to automatically filterthe sample matrix as the sample is loaded on the IC system, thisfiltration procedure can be omitted and the sample can be directlytransferred to the autosampler vial.
11.2 SAMPLE ANALYSIS
11.2.1 Table 1 summarizes the recommended operating conditions for the ionchromatograph. Included in this table is the estimated retention time forperchlorate which has been achieved by this method. Other columns,chromatographic conditions or detectors may be used if the requirements ofSections 1.2.1, 6.1.2.2 and 9.2 are met.
11.2.2 Establish a valid initial calibration and verify this calibration by conducting a
QCS as described in Section 10.2 and complete the IDC (Section 9.2). Initially,analyze the IPC solution, followed by the LRB. Then confirm the IC systemcalibration by analyzing an ICCS (Section 10.3.1) and, if required, recalibrate asdescribed in Section 10.2. Lastly, analyze the LFB.
11.2.3 Inject 1.0 mL of each filtered sample. Use the same size loop for standards andsamples. An automated constant volume injection system may also be used.Record the resulting peak size in area units and retention time for each analyte.
11.2.4 The width of the retention time window used to make identifications should be
based upon measurements of actual retention time variations of standardsmeasured over several days. Three times the standard deviation of retentiontime may be used as a suggested window size but the retention time windowshould not extend beyond ± 5% of the retention time for perchlorate. Theexperience of the analyst should weigh heavily in the interpretation of thesechromatograms.
11.2.5 If the response of a sample analyte exceeds the calibration range, the sample
must be diluted with an appropriate amount of reagent water and reanalyzed. Ifthis is not possible then three new calibration concentrations must be employedto create a separate high concentration calibration curve, one standard near theestimated concentration and the other two bracketing around an intervalequivalent to approximately ± 25% the estimated concentration. The responsegenerated by these three new high concentration calibration standards must notexceed the upper linear range for the conductivity detector. The latter procedure
31
involves significantly more time than a simple sample dilution therefore, it isadvisable to collect sufficient sample to allow for sample dilution and samplereanalysis, if required.
11.2.6 Should more complete resolution be needed between perchlorate and a
coeluting, shoulder peak, the eluent (Section 7.2) may be diluted. This willspread out the peaks, causing later elution of perchlorate. Analysts are advisedto carefully evaluate any of these eluent dilutions since when these eluentchanges are incorporated, other coelutions may be encountered which were notinitially evident. Additionally, the analyst must verify that this dilution does notnegatively affect performance by repeating and passing all the QC criteria inSection 9, and by reestablishing a valid initial calibration curve (Section 10.2).
11.2.6.1 Eluent dilution will reduce the overall response of an anion due tochromatographic band broadening which will be evident by shortenedand broadened peaks. This will adversely effect the MDLs for eachanalyte.
11.3 AUTOMATED ANALYSIS WITH METHOD 314.0
11.3.1 Laboratories conducting analyses on large numbers of samples often preparelarge analysis batches that are run in an automated manner. When conductingautomated analyses, careful attention must be paid to ensure sufficient volumeof eluent in the reservoir is available to sustain extended operation. In order toensure their data are of acceptable quality, laboratories must ensure that all QCperformance criteria are met throughout the analysis batch through subsequentcareful inspection of the data.
11.3.2 Analysis sequences must be carefully constructed to meet required QCspecifications and frequency (Table 6). To help with this task, an acceptablesequence for a sample analysis batch, with all the method-required QC, is shownin Table 7. This schedule is included only as an example of a hypotheticalanalysis batch which contains normal sample matrices as well as samples whichhave failed the MCT. Within this analysis batch, references to exactconcentrations for the ICCS, CCCS and ECCS are for illustrative purposes only.
11.3.3 Table 7 may be used as a guide when preparing analysis batches. Additionalbatches may be added sequentially on to the end of these types of schedules aslong as all QC samples, which define an individual batch (IPC, LRB, ICCS,LFB, LFM, etc.) are individually reanalyzed with each successive serial batchand the QC criteria for these analyses are continually met (from the IPC throughECCS).

32
12. DATA ANALYSIS AND CALCULATIONS
12.1 Identify perchlorate in the sample chromatogram by comparing the retention time of asuspect peak within the retention time window to the actual retention time of a knownanalyte peak in a calibration standard. If the perchlorate retention time has slightlyshifted (generally towards shorter times) since the initial calibration, but is still withinacceptance criteria and are reproducible during the analysis batch, the analyst shoulduse the retention time in the daily calibration check standards to confirm the presence orabsence of perchlorate anion.
12.1.1 If a low concentration of perchlorate is suspected in an unknown sample, but theretention time has drifted to the edge of the retention time window, a low levelperchlorate LFM, prepared at nearly the same concentration as the suspect peak,should be prepared from this sample matrix to confirm the matrix inducedretention time shift. If the fortified sample reveals a split or shouldering peakresponse, the low concentration in the unfortified sample is likely an interferantand should not be reported as perchlorate.
12.2 Compute sample concentration using the initial calibration curve generated in Section10.2.
12.3 Report ONLY those values that fall between the MRL and the highest calibrationstandards. Samples with a perchlorate response which exceeds the highest calibrationstandard concentration must be diluted and reanalyzed. When this is not possible thealternate calibration procedures described in Section 11.2.5 must be followed. Sampleswith perchlorate identified but quantitated below the concentration established by thelowest calibration standard, may be reported as “trace present” above the MDL butbelow the minimum reporting limit (MRL) and therefore not reported as a quantitatedconcentration.
12.4 Report results in µg/L.
13. METHODS PERFORMANCE
13.1 Table 1 gives the standard conditions, typical retention time, single laboratory MCT andsingle laboratory MDL in reagent water, as determined for perchlorate. This retentiontime is graphically indicated in the chromatograms in Figures 1 through 4.
13.2 Table 2 shows the precision and accuracy of the perchlorate measurement at twofortified concentrations, in reagent water, simulated high ionic strength water (HIW),simulated high organic content water (HOW), ground water, untreated surface waterand treated surface water. The mean perchlorate recovered concentration (accuracyrelative to the fortified level) and the precision (expressed as %RSD of the replicateanalysis) are tabulated. The HIW was designed to simulate a high ionic strength field

33
sample and the HOW designed to simulate a high organic content field sample. TheHIW was prepared from reagent water which was fortified with the common anions ofchloride at 400 mg/L, carbonate at 600 mg/L, and sulfate at 500 mg/L. The HOW wasprepared from reagent water fortified with 10.0 mg/L fulvic acid.
13.3 Table 3 shows the stability data for perchlorate held for 35 days and stored undervarious conditions. Conditions investigated included sample bottle construction(HDPE plastic vs. glass), storage condition (refrigerated vs. held at room temperature)and various matrices including some with a measured perchlorate concentrationassumed to contain microbiological constituents acclimated to the presence of theanion. Matrices without perchlorate were fortified at 25 ug/L. Each data point in thistable represents the mean percent recovery following triplicate analyses. These datawere used to formulate the holding times shown in Section 8.3.
13.4 Table 4, in conjunction with the chromatograms overlaid in Figure 4 as well as thelinear regression plots in Figure 5, show the results of the single laboratory MCTdetermination. The data presented in Table 4 and graphically illustrated in Figure 5,show results for not only the AS16 but also the AS11 and AS5. The chromatogramshown in Figure 4 were generated using the AS16 column.
14. POLLUTION PREVENTION
14.1 Pollution prevention encompasses any technique that reduces or eliminates the quantityor toxicity of waste at the point of generation. Numerous opportunities for pollutionprevention exist in laboratory operation. The EPA has established a preferred hierarchyof environmental management techniques that places pollution prevention as themanagement option of first choice. Whenever feasible, laboratory personnel should usepollution prevention techniques to address their waste generation. When wastes cannotbe feasiblely reduced at the source, the Agency recommends recycling as the next bestoption.
14.2 Quantity of chemicals purchased should be based on expected usage during its shelf-life and the disposal cost of unused material. Actual reagent preparation volumesshould reflect anticipated usage and reagent stability.
14.3 For information about pollution prevention that may be applicable to laboratories andresearch institutions, consult "Less is Better: Laboratory Chemical Management forWaste Reduction," available from the American Chemical Society's Department ofGovernment Regulations and Science Policy, 1155 16th Street N.W., Washington D.C.20036, (202) 872-4477.
15. WASTE MANAGEMENT
15.1 The Environmental Protection Agency requires that laboratory waste managementpractices be conducted consistent with all applicable rules and regulations. Excess

34
reagents, samples and method process wastes should be characterized and disposed ofin an acceptable manner. The Agency urges laboratories to protect the air, water, andland by minimizing and controlling all releases from hoods and bench operations,complying with the letter and spirit of any waste discharge permit and regulations, andby complying with all solid and hazardous waste regulations, particularly the hazardous waste identification rules and land disposal restrictions. For further information onwaste management consult the "Waste Management Manual for Laboratory Personnel,"available from the American Chemical Society at the address listed in Section 14.3.
16. REFERENCES
1. “Determination of Perchlorate by Ion Chromatography.” State of California, Department ofHealth Services, Sanitation and Radiation Laboratories Branch, Rev. No. 0 (June 3, 1997).
2. “Analysis of Low Concentrations of Perchlorate in Drinking Water and Ground Water byIon Chromatography.” Application Note 121, Dionex Corporation, Sunnyvale, CA (1998).
3. “Perchlorate by Ion Chromatography, Modified EPA 300.0 Using IonPac AS11.” StandardOperating Procedure, Montgomery Watson Laboratories (March 17, 1998).
4. Jackson, P.E.; Laikhtman, M.; and Rohrer, J.S. “Determination of Trace Level Perchloratein Drinking Water and Ground Water by Ion Chromatography,” Journal of ChromatographyA, 850 (1999), 131-135.
5. Okamoto, H.S.; Rishi, D.K.; Steeber, W.R.; Baumann, F.J.; and Perera, S.K. “Using IonChromatography to Detect Perchlorate,” Journal AWWA, Vol. 91 (October 1999), 73-84.
6. Inter-Agency Perchlorate Steering Committee, Analytical Subcommittee Report (1998). Report on the interlaboratory validation of IC methods for perchlorate.
7. Glaser, J.A.; Foerst, D.L.; McKee, G.D..; Quave, S.A. and Budde, W.L. "Trace Analysesfor Wastewater," Environmental Science and Technology, Vol. 15, Number 12, page 1426,December, 1981.
8. Code of Federal Regulations 40, Pt. 136, Appendix B (July 1, 1998).
9. “OSHA Safety and Health Standards, General Industry,” (29CFR1910). Occupational Safetyand health Administration, OSHA 2206, (Revised, Jan. 1976).
10. ASTM Annual Book of Standards, Part II, Volume 11.01, D3370-82, “Standard Practice forSampling Water,” American Society for Testing and Materials, Philadelphia, PA, 1986.
11. “Carcinogens-Working with Carcinogens,” Publication No. 77-206, Department of Health,
35
Education, and Welfare, Public Health Service, Center for Disease control, National Instituteof Occupational Safety and health, Atlanta, Georgia, August 1977.
12. “Safety In Academic Chemistry laboratories,” 3rd Edition, American Chemical SocietyPublication, Committee on Chemical Safety, Washington, D.C., 1979.
13. U.S. EPA Method 300.1. EPA Document number: EPA/600/R-98/118. NTIS numberPB98-169196 INZ.
14. "Anion Self-Regenerating Suppressor (ASRS) Quickstart Procedure", Document Number031368-01, Dionex Corporation, Sunnyvale, CA, March,1988.
15. "Installation Instructions and Troubleshooting Guide for the Anion Self-RegeneratingSuppressor-Ultra", Document Number 031367, Rev. 03, Section 5.1, Dionex Corporation,Sunnyvale, CA, December, 1988.
16. CRC Handbook of Chemistry and Physics. Standard Solutions for Calibrating ConductivityCells, p. D-166, 70th Ed., 1989-1990, CRC Press, Boca Raton, Florida.
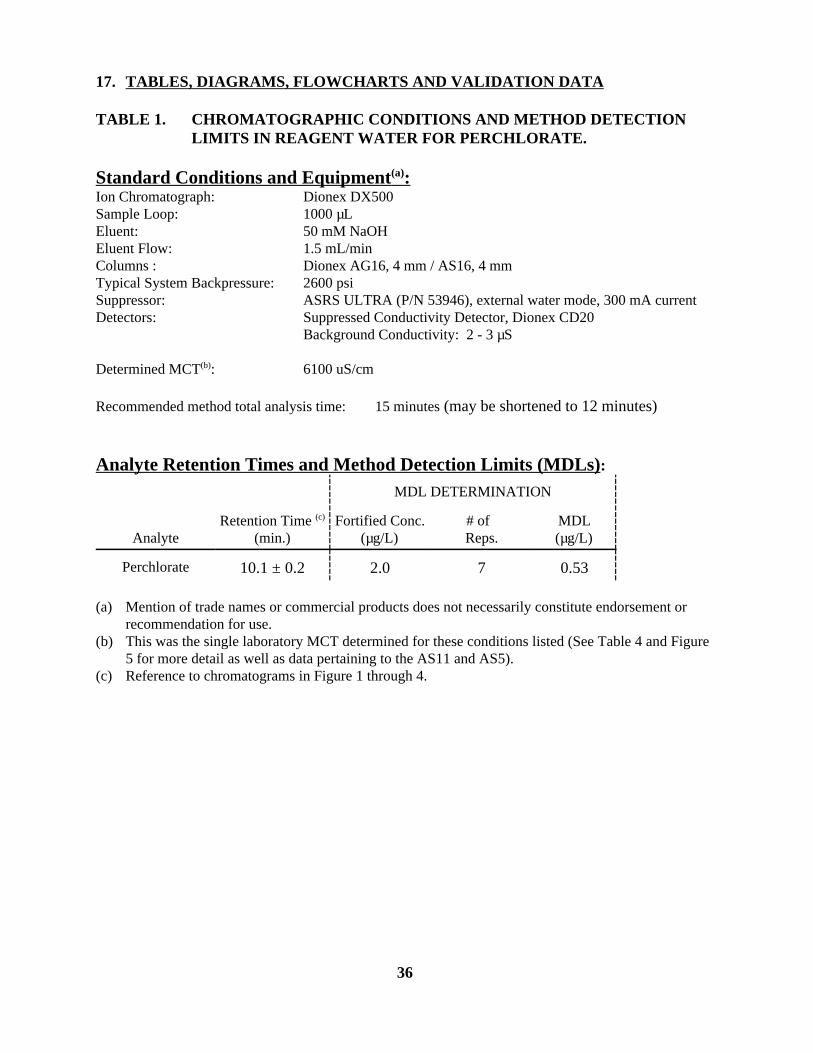
36
17. TABLES, DIAGRAMS, FLOWCHARTS AND VALIDATION DATA
TABLE 1. CHROMATOGRAPHIC CONDITIONS AND METHOD DETECTIONLIMITS IN REAGENT WATER FOR PERCHLORATE.
Standard Conditions and Equipment(a):Ion Chromatograph: Dionex DX500Sample Loop: 1000 µLEluent: 50 mM NaOHEluent Flow: 1.5 mL/minColumns : Dionex AG16, 4 mm / AS16, 4 mmTypical System Backpressure: 2600 psiSuppressor: ASRS ULTRA (P/N 53946), external water mode, 300 mA current Detectors: Suppressed Conductivity Detector, Dionex CD20
Background Conductivity: 2 - 3 µS
Determined MCT(b): 6100 uS/cm
Recommended method total analysis time: 15 minutes (may be shortened to 12 minutes)
Analyte Retention Times and Method Detection Limits (MDLs):
MDL DETERMINATION
AnalyteRetention Time (c)
(min.)Fortified Conc.
(µg/L)# of Reps.
MDL(µg/L)
Perchlorate 10.1 ± 0.2 2.0 7 0.53
(a) Mention of trade names or commercial products does not necessarily constitute endorsement orrecommendation for use.
(b) This was the single laboratory MCT determined for these conditions listed (See Table 4 and Figure5 for more detail as well as data pertaining to the AS11 and AS5).
(c) Reference to chromatograms in Figure 1 through 4.

37
TABLE 2. SINGLE LABORATORY PRECISION AND RECOVERY FORPERCHLORATE IN VARIOUS MATRICES
Matrix
MatrixConductivity
uS/cm
UnfortifiedConc.(µg/L)
Fortified Conc.(µg/L)
# of Reps.
Mean(µg/L)
Mean%REC SD(n-1) %RSD
Reagent Water ~ 1 <MRL(a) 4.00 8 4.04 101% 0.43 10.6%
25.0 8 26.2 105% 0.89 3.4%
Synthetic HighInorganic Water (b)
4200 <MRL 4.00 8 3.42 86% 0.27 7.9%
25.0 8 24.1 96% 0.46 1.9%
Synthetic HighOrganic Water (c)
5.0 <MRL 4.00 8 3.84 96% 0.38 10.0%
25.0 8 25.7 103% 1.12 4.4%
Ground Water(high TDS)
710 <MRL 4.00 8 4.22 106% 0.54 12.8%
25.0 8 26.5 106% 0.62 2.3%
Untreated SurfaceWater
460 <MRL 4.00 8 4.46 112% 0.24 5.4%
25.0 8 28.3 113% 0.29 1.0%
ChlorinatedSurface Water
460 <MRL 4.00 8 4.18 105% 0.23 5.6%
25.0 8 28.0 112% 0.63 2.3%
(a) <MRL =analyte was not detected above the laboratory minimum reporting level (MRL) of 4.0 ug/L.(b) Synthetic High Inorganic Water was prepared from reagent water and contained synthetic high TDS
or common anion levels of 400 mg/L chloride, 500 mg/L sulfate and 600 mg/L carbonate.(c) Synthetic High Organic Water contained 10 mg/L fulvic acid (extracted and crystallized from
untreated surface water) fortified into reagent water.
Note: These data were collected using the equipment and conditions listed in Table 1.
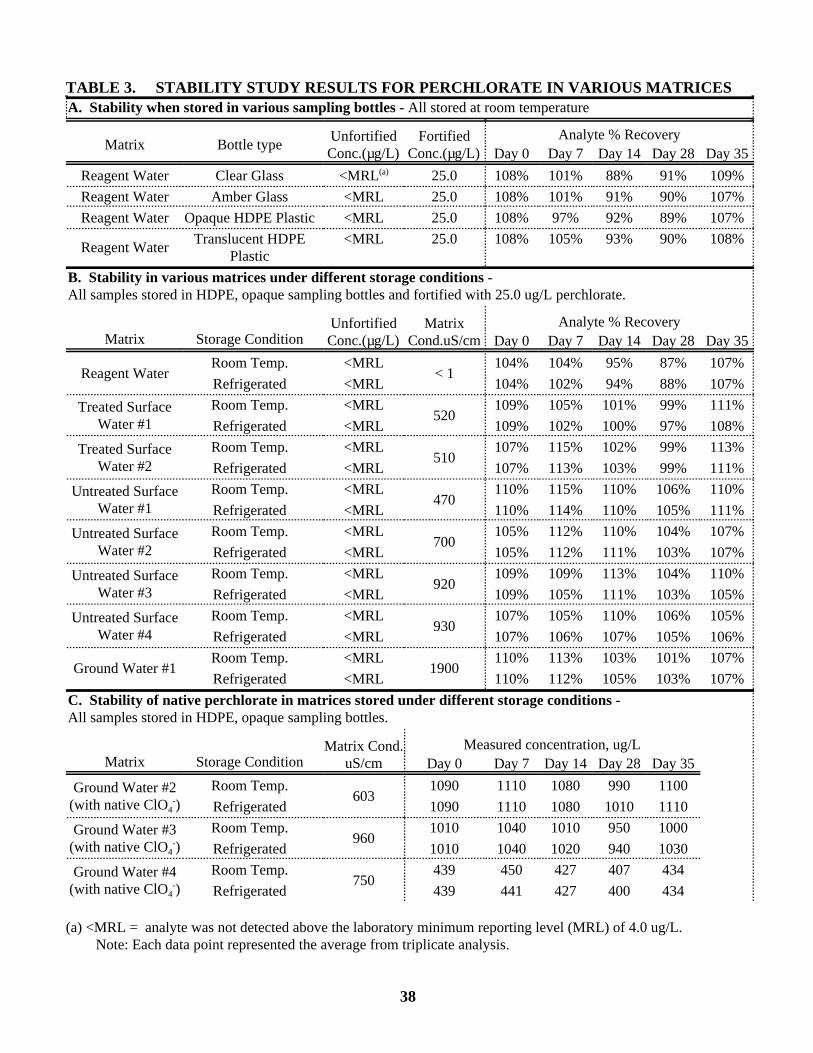
38
TABLE 3. STABILITY STUDY RESULTS FOR PERCHLORATE IN VARIOUS MATRICESA. Stability when stored in various sampling bottles - All stored at room temperature
Matrix Bottle typeUnfortifiedConc.(µg/L)
FortifiedConc.(µg/L)
Analyte % RecoveryDay 0 Day 7 Day 14 Day 28 Day 35
Reagent Water Clear Glass <MRL(a) 25.0 108% 101% 88% 91% 109%
Reagent Water Amber Glass <MRL 25.0 108% 101% 91% 90% 107%
Reagent Water Opaque HDPE Plastic <MRL 25.0 108% 97% 92% 89% 107%
Reagent WaterTranslucent HDPE
Plastic<MRL 25.0 108% 105% 93% 90% 108%
B. Stability in various matrices under different storage conditions - All samples stored in HDPE, opaque sampling bottles and fortified with 25.0 ug/L perchlorate.
Matrix Storage ConditionUnfortifiedConc.(µg/L)
MatrixCond.uS/cm
Analyte % RecoveryDay 0 Day 7 Day 14 Day 28 Day 35
Reagent WaterRoom Temp. <MRL
< 1104% 104% 95% 87% 107%
Refrigerated <MRL 104% 102% 94% 88% 107%
Treated SurfaceWater #1
Room Temp. <MRL520
109% 105% 101% 99% 111%
Refrigerated <MRL 109% 102% 100% 97% 108%
Treated SurfaceWater #2
Room Temp. <MRL510
107% 115% 102% 99% 113%
Refrigerated <MRL 107% 113% 103% 99% 111%
Untreated SurfaceWater #1
Room Temp. <MRL470
110% 115% 110% 106% 110%
Refrigerated <MRL 110% 114% 110% 105% 111%
Untreated SurfaceWater #2
Room Temp. <MRL700
105% 112% 110% 104% 107%
Refrigerated <MRL 105% 112% 111% 103% 107%
Untreated SurfaceWater #3
Room Temp. <MRL920
109% 109% 113% 104% 110%
Refrigerated <MRL 109% 105% 111% 103% 105%
Untreated SurfaceWater #4
Room Temp. <MRL930
107% 105% 110% 106% 105%
Refrigerated <MRL 107% 106% 107% 105% 106%
Ground Water #1Room Temp. <MRL
1900110% 113% 103% 101% 107%
Refrigerated <MRL 110% 112% 105% 103% 107%
C. Stability of native perchlorate in matrices stored under different storage conditions - All samples stored in HDPE, opaque sampling bottles.
Matrix Storage ConditionMatrix Cond.
uS/cmMeasured concentration, ug/L
Day 0 Day 7 Day 14 Day 28 Day 35
Ground Water #2(with native ClO4
-)Room Temp.
6031090 1110 1080 990 1100
Refrigerated 1090 1110 1080 1010 1110
Ground Water #3(with native ClO4
-)Room Temp.
9601010 1040 1010 950 1000
Refrigerated 1010 1040 1020 940 1030
Ground Water #4(with native ClO4
-)Room Temp.
750439 450 427 407 434
Refrigerated 439 441 427 400 434
(a) <MRL = analyte was not detected above the laboratory minimum reporting level (MRL) of 4.0 ug/L.Note: Each data point represented the average from triplicate analysis.

39
TABLE 4. SINGLE LABORATORY RESULTS FOR THE DETERMINATION OFMCT - Determination on the AS16, AS11 and the AS5.
AS16 Studies - Perchlorate fortified at 25 ug/LSample Conductivity
uS/cmRTmin.
MeasuredClO4-, ug/L
%Rec Area Height A/H ratio PDA/H
LFB < 1 10.3 25.3 101% 20268 1151 17.6 0.00%MA(50)(a) 540 10.3 26.0 104% 20799 1135 18.3 4.07%MA(100) 932 10.3 26.3 105% 21060 1144 18.4 4.54%MA(200) 1770 10.2 26.2 105% 20998 1112 18.9 7.24%MA(400) 3570 10.2 25.2 101% 20170 1028 19.6 11.4%MA(600) 5010 (b) 10.2 24.2 97% 19307 954 20.2 14.9%MA(800) 6450 10.1 25.1 100% 20038 932 21.5 22.1%MA(1000) 7820 10.2 24.3 97% 19400 878 22.1 25.5%
AS11(c) Studies - Perchlorate fortified at 25 ug/LSample Conductivity
uS/cmRTmin.
MeasuredClO4-, ug/L
%Rec Area Height A/H ratio PDA/H
LFB < 1 8.9 25.0 100% 25213 1591 15.8 0.00%MA(50)(a) 540 8.9 25.2 101% 25445 1515 16.8 5.98%MA(100) 932 9.0 25.0 100% 25192 1486 17.0 6.98%MA(200) 1770 (b) 9.0 24.1 96% 24340 1384 17.6 11.0%MA(400) 3570 9.0 23.6 94% 23855 1243 19.2 21.1%MA(600) 5010 9.0 22.7 91% 22922 1101 20.8 31.4%MA(800) 6450 8.9 19.9 80% 20243 870 23.3 46.8%MA(1000) 7820 8.8 17.0 68% 17407 678 25.7 62.0%
AS5(d) Studies - Perchlorate fortified at 25 ug/LSample Conductivity
uS/cmRTmin.
MeasuredClO4-, ug/L
%Rec Area Height A/H ratio PDA/H
LFB < 1 9.7 22.75 91.0% 30348 1780 17.0 0.00%MA(50)(a) 540 9.7 24.89 99.6% 33505 1751 19.1 12.2%MA(100) 932 9.7 23.72 94.9% 31776 1721 18.5 8.30%MA(200) 1770 (b) 9.7 22.99 92.0% 30704 1591 19.3 13.2%MA(400) 3570 9.6 23.51 94.0% 31474 1478 21.3 24.9%MA(600) 5010 9.6 23.84 95.4% 31948 1441 22.2 30.0%MA(800) 6450 9.6 21.01 84.0% 27792 1214 22.9 34.3%MA(1000) 7820 9.6 22.95 91.8% 30650 1183 25.9 52.0%
(a) “MA” indicates mixed common anion solution with each anion (chloride, sulfate and carbonate)included in the sample matrix at the parenthetical mg/L concentration for each anion.
(b) If the regression analysis is not performed on these data, 5010 uS/cm, 1770 uS/cm and 1770 uS/cmwould be the default MCT for the AS16, AS11 and AS5, respectively, as described in Section 9.2.8.10. See Figure 5 for a graphical representation of this data, applying a regression analysis of PDA/H vsmatrix conductivity for the AS16, AS11 and AS5.
(c) AS11 conditions: See reference #2 and #3.(d) AS5 conditions: See reference #1.

40
TABLE 5. INITIAL DEMONSTRATION OF CAPABILITY QC REQUIREMENTS.Requirements prior to beginning any analysis batch
Reference Requirement Specification and Frequency Acceptance Criteria
Sect. 9.2.2 9.3.1
InitialDemonstration ofLow SystemBackground
Analyze a method blank (LRB) anddetermine that all target analytes arebelow ½ of the proposed MRL prior toperforming the IDC.
The LRB concentrationmust be #½ of theproposed MRL.
Sect. 9.2.3 InitialDemonstration ofAccuracy (IDA)
Analyze 7 replicate LFBs fortified withperchlorate at 25 ug/L. Calculate themean recovered concentration (C0)See Equation in Section 9.2.3.
The C0 must be ± 10% oftrue value.
Sect. 9.2.4 InitialDemonstration ofPrecision (IDP)
Calculate percent relative standarddeviation (%RSD)of IDA replicates.See Equation in Section 9.2.4.
The %RSD must be #10%
Sect. 9.2.5 Quality ControlSample (QCS)
Initially, upon reestablishing calibrationor at least quarterly analyze a QCS froman external/second source.
The QCS must be ± 10%of the true value.
Sect. 9.2.6 MethodDetection Limit(MDL)Determination
Select a fortifying level at 3-5 times theestimated instrument detection limit. Analyze 7 replicate LFBs over multipledays and calculate MDL using equation inSection 9.2.6 - do not subtract blank
Sect. 9.2.7 MinimumReporting Level(MRL)
An MRL should be established forperchlorate during the IDC.
The low CAL standard canbe lower than the MRL,but the MRL MUST be nolower than the low CALstandard
Sect. 9.2.8
Sect.9.2.8.11
MatrixConductivityThreshold (MCT)
MRL verification
Prepare a series of LFB samples, eachcontaining a suggested perchlorateconcentration of 25 ug/L, at sequentiallyincreasing fortified levels of commonanions. Measure sample conductance andanalyze each, calculate average A/H ratiosand PDA/H (using equation in Section9.2.8.8). Perform linear regression tocalculate MCT (using equation in Section9.2.8.9) or follow step outlined in Section9.2.8.10.
Verify the MRL in a solution prepared atthe MCT.
MCT, based upon linear regression, is point wherePDA/H equals 20%.
Alternatively, the MCT isset at the highest measured conductance observed inthe last fortified MCTsample to yield a PDA/H
value below 20%.
Prepared within ±10% ofthe MCT. Perchlorate recovery mustbe 70- 130% of the MRL.
TABLE 6. QUALITY CONTROL REQUIREMENTS (SUMMARY).
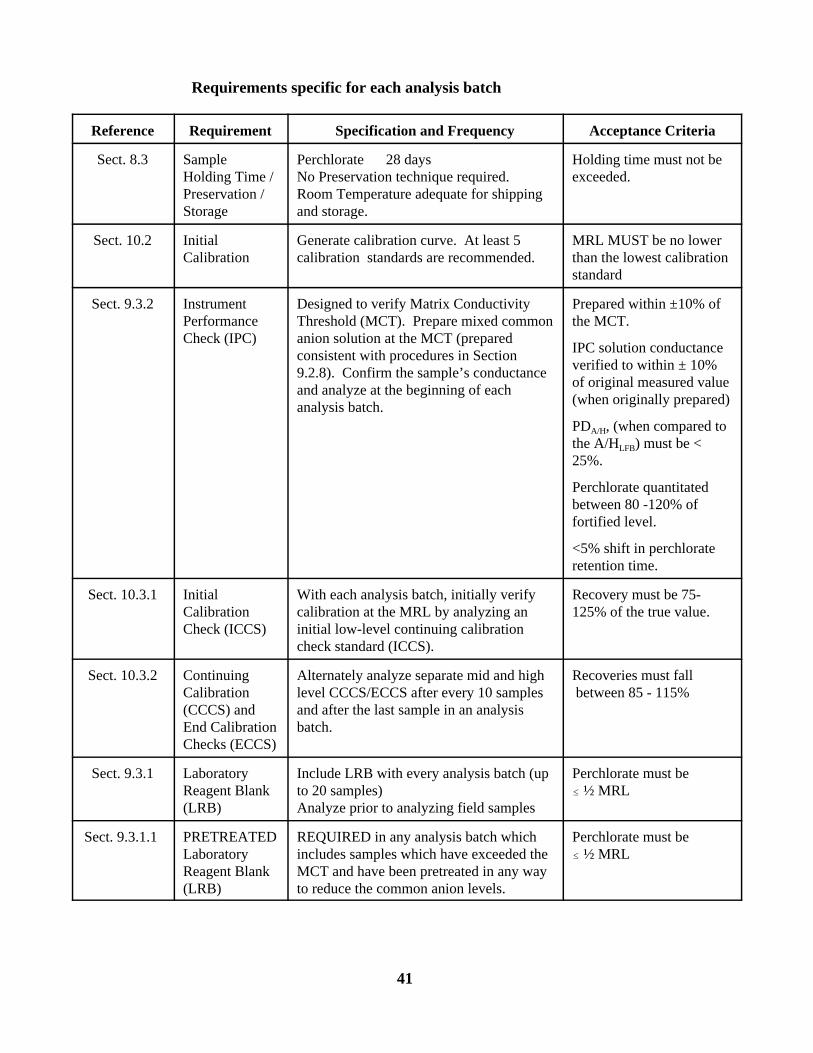
41
Requirements specific for each analysis batch
Reference Requirement Specification and Frequency Acceptance Criteria
Sect. 8.3 SampleHolding Time /Preservation /Storage
Perchlorate 28 daysNo Preservation technique required.Room Temperature adequate for shippingand storage.
Holding time must not beexceeded.
Sect. 10.2 InitialCalibration
Generate calibration curve. At least 5calibration standards are recommended.
MRL MUST be no lowerthan the lowest calibrationstandard
Sect. 9.3.2 InstrumentPerformanceCheck (IPC)
Designed to verify Matrix ConductivityThreshold (MCT). Prepare mixed commonanion solution at the MCT (preparedconsistent with procedures in Section9.2.8). Confirm the sample’s conductanceand analyze at the beginning of eachanalysis batch.
Prepared within ±10% ofthe MCT.
IPC solution conductanceverified to within ± 10%of original measured value(when originally prepared)
PDA/H, (when compared tothe A/HLFB) must be <25%.
Perchlorate quantitatedbetween 80 -120% offortified level.
<5% shift in perchlorateretention time.
Sect. 10.3.1 InitialCalibrationCheck (ICCS)
With each analysis batch, initially verifycalibration at the MRL by analyzing aninitial low-level continuing calibrationcheck standard (ICCS).
Recovery must be 75-125% of the true value.
Sect. 10.3.2
ContinuingCalibration(CCCS) andEnd CalibrationChecks (ECCS)
Alternately analyze separate mid and highlevel CCCS/ECCS after every 10 samplesand after the last sample in an analysisbatch.
Recoveries must fall between 85 - 115%
Sect. 9.3.1 LaboratoryReagent Blank(LRB)
Include LRB with every analysis batch (upto 20 samples)Analyze prior to analyzing field samples
Perchlorate must be # ½ MRL
Sect. 9.3.1.1 PRETREATEDLaboratoryReagent Blank(LRB)
REQUIRED in any analysis batch whichincludes samples which have exceeded theMCT and have been pretreated in any wayto reduce the common anion levels.
Perchlorate must be # ½ MRL
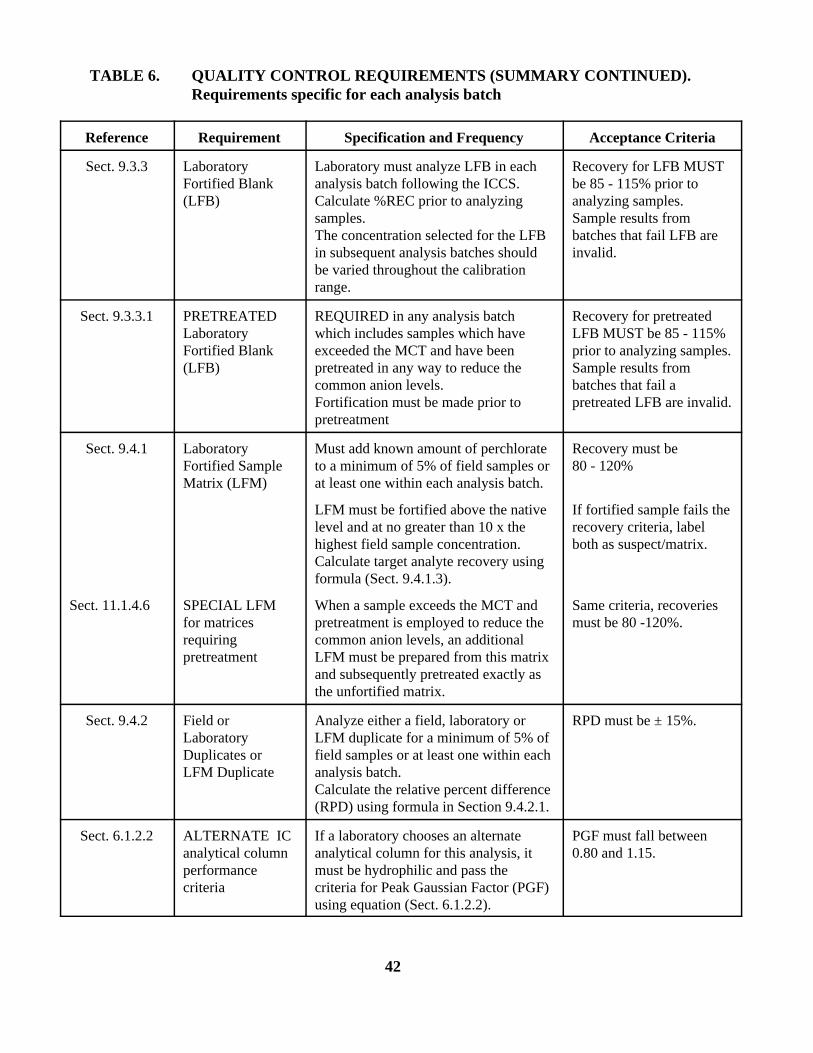
42
TABLE 6. QUALITY CONTROL REQUIREMENTS (SUMMARY CONTINUED).Requirements specific for each analysis batch
Reference Requirement Specification and Frequency Acceptance Criteria
Sect. 9.3.3 LaboratoryFortified Blank(LFB)
Laboratory must analyze LFB in eachanalysis batch following the ICCS. Calculate %REC prior to analyzingsamples. The concentration selected for the LFBin subsequent analysis batches shouldbe varied throughout the calibrationrange.
Recovery for LFB MUSTbe 85 - 115% prior toanalyzing samples. Sample results frombatches that fail LFB areinvalid.
Sect. 9.3.3.1 PRETREATEDLaboratoryFortified Blank(LFB)
REQUIRED in any analysis batchwhich includes samples which haveexceeded the MCT and have beenpretreated in any way to reduce thecommon anion levels.Fortification must be made prior topretreatment
Recovery for pretreatedLFB MUST be 85 - 115%prior to analyzing samples. Sample results frombatches that fail apretreated LFB are invalid.
Sect. 9.4.1
Sect. 11.1.4.6
LaboratoryFortified SampleMatrix (LFM)
SPECIAL LFMfor matricesrequiringpretreatment
Must add known amount of perchlorateto a minimum of 5% of field samples orat least one within each analysis batch.
LFM must be fortified above the nativelevel and at no greater than 10 x thehighest field sample concentration. Calculate target analyte recovery usingformula (Sect. 9.4.1.3).
When a sample exceeds the MCT and pretreatment is employed to reduce thecommon anion levels, an additionalLFM must be prepared from this matrixand subsequently pretreated exactly asthe unfortified matrix.
Recovery must be 80 - 120%
If fortified sample fails therecovery criteria, labelboth as suspect/matrix.
Same criteria, recoveriesmust be 80 -120%.
Sect. 9.4.2 Field orLaboratoryDuplicates orLFM Duplicate
Analyze either a field, laboratory orLFM duplicate for a minimum of 5% offield samples or at least one within eachanalysis batch.Calculate the relative percent difference(RPD) using formula in Section 9.4.2.1.
RPD must be ± 15%.
Sect. 6.1.2.2 ALTERNATE ICanalytical columnperformancecriteria
If a laboratory chooses an alternateanalytical column for this analysis, itmust be hydrophilic and pass thecriteria for Peak Gaussian Factor (PGF)using equation (Sect. 6.1.2.2).
PGF must fall between0.80 and 1.15.
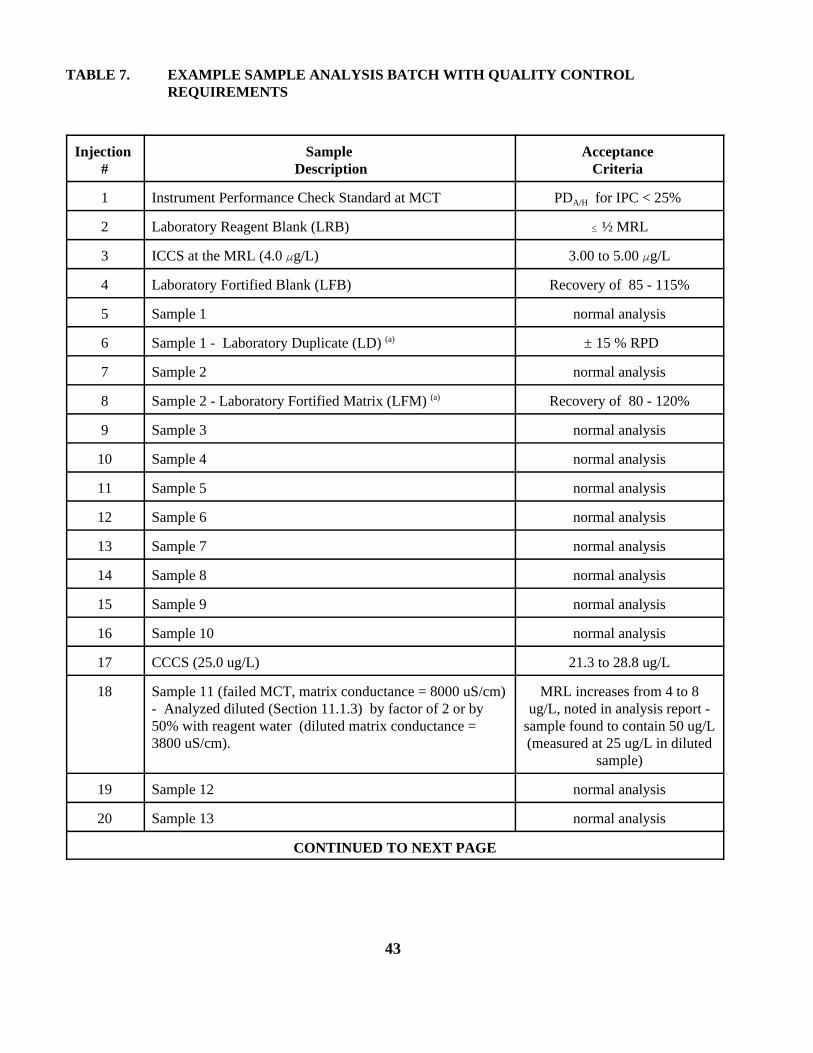
43
TABLE 7. EXAMPLE SAMPLE ANALYSIS BATCH WITH QUALITY CONTROLREQUIREMENTS
Injection #
Sample Description
Acceptance Criteria
1 Instrument Performance Check Standard at MCT PDA/H for IPC < 25%
2 Laboratory Reagent Blank (LRB) # ½ MRL
3 ICCS at the MRL (4.0 Fg/L) 3.00 to 5.00 Fg/L
4 Laboratory Fortified Blank (LFB) Recovery of 85 - 115%
5 Sample 1 normal analysis
6 Sample 1 - Laboratory Duplicate (LD) (a) ± 15 % RPD
7 Sample 2 normal analysis
8 Sample 2 - Laboratory Fortified Matrix (LFM) (a) Recovery of 80 - 120%
9 Sample 3 normal analysis
10 Sample 4 normal analysis
11 Sample 5 normal analysis
12 Sample 6 normal analysis
13 Sample 7 normal analysis
14 Sample 8 normal analysis
15 Sample 9 normal analysis
16 Sample 10 normal analysis
17 CCCS (25.0 ug/L) 21.3 to 28.8 ug/L
18 Sample 11 (failed MCT, matrix conductance = 8000 uS/cm)- Analyzed diluted (Section 11.1.3) by factor of 2 or by50% with reagent water (diluted matrix conductance =3800 uS/cm).
MRL increases from 4 to 8ug/L, noted in analysis report -
sample found to contain 50 ug/L(measured at 25 ug/L in diluted
sample)
19 Sample 12 normal analysis
20 Sample 13 normal analysis
CONTINUED TO NEXT PAGE
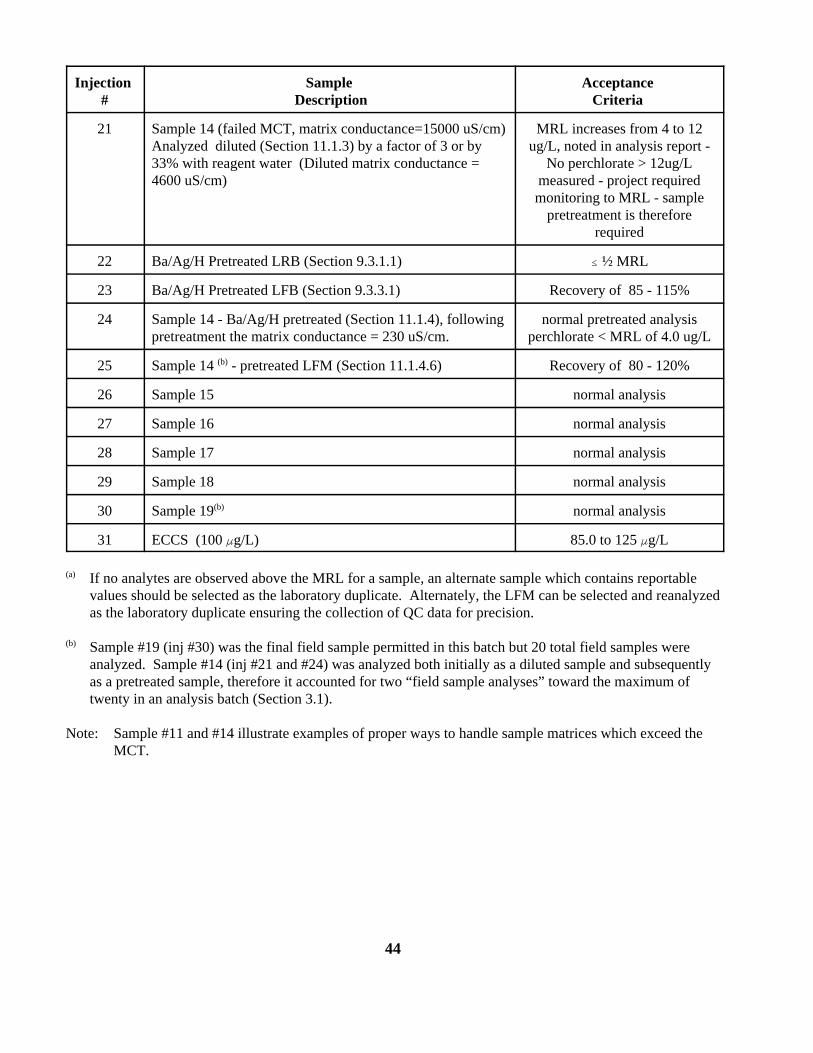
44
Injection #
Sample Description
Acceptance Criteria
21 Sample 14 (failed MCT, matrix conductance=15000 uS/cm)Analyzed diluted (Section 11.1.3) by a factor of 3 or by33% with reagent water (Diluted matrix conductance =4600 uS/cm)
MRL increases from 4 to 12ug/L, noted in analysis report -
No perchlorate > 12ug/Lmeasured - project requiredmonitoring to MRL - sample
pretreatment is thereforerequired
22 Ba/Ag/H Pretreated LRB (Section 9.3.1.1) # ½ MRL
23 Ba/Ag/H Pretreated LFB (Section 9.3.3.1) Recovery of 85 - 115%
24 Sample 14 - Ba/Ag/H pretreated (Section 11.1.4), followingpretreatment the matrix conductance = 230 uS/cm.
normal pretreated analysisperchlorate < MRL of 4.0 ug/L
25 Sample 14 (b) - pretreated LFM (Section 11.1.4.6) Recovery of 80 - 120%
26 Sample 15 normal analysis
27 Sample 16 normal analysis
28 Sample 17 normal analysis
29 Sample 18 normal analysis
30 Sample 19(b) normal analysis
31 ECCS (100 Fg/L) 85.0 to 125 Fg/L
(a) If no analytes are observed above the MRL for a sample, an alternate sample which contains reportablevalues should be selected as the laboratory duplicate. Alternately, the LFM can be selected and reanalyzedas the laboratory duplicate ensuring the collection of QC data for precision.
(b) Sample #19 (inj #30) was the final field sample permitted in this batch but 20 total field samples wereanalyzed. Sample #14 (inj #21 and #24) was analyzed both initially as a diluted sample and subsequentlyas a pretreated sample, therefore it accounted for two “field sample analyses” toward the maximum oftwenty in an analysis batch (Section 3.1).
Note: Sample #11 and #14 illustrate examples of proper ways to handle sample matrices which exceed theMCT.

45
0 2.00 4.00 6.00 8.00 10.00 12.00 14.00-0.100
-0.050
0
0.050
0.100
0.150
0.200
Con
d D
et R
esp,
uS
Perchlorate at 4.0 ug/L in Reagent Water
12 - ClO4-
3
M inutes
FIGURE 1. CHROMATOGRAM OF LOW LEVEL PERCHLORATE (4.0 ug/L) IN REAGENT WATER (Conditions as indicated in Table 1)
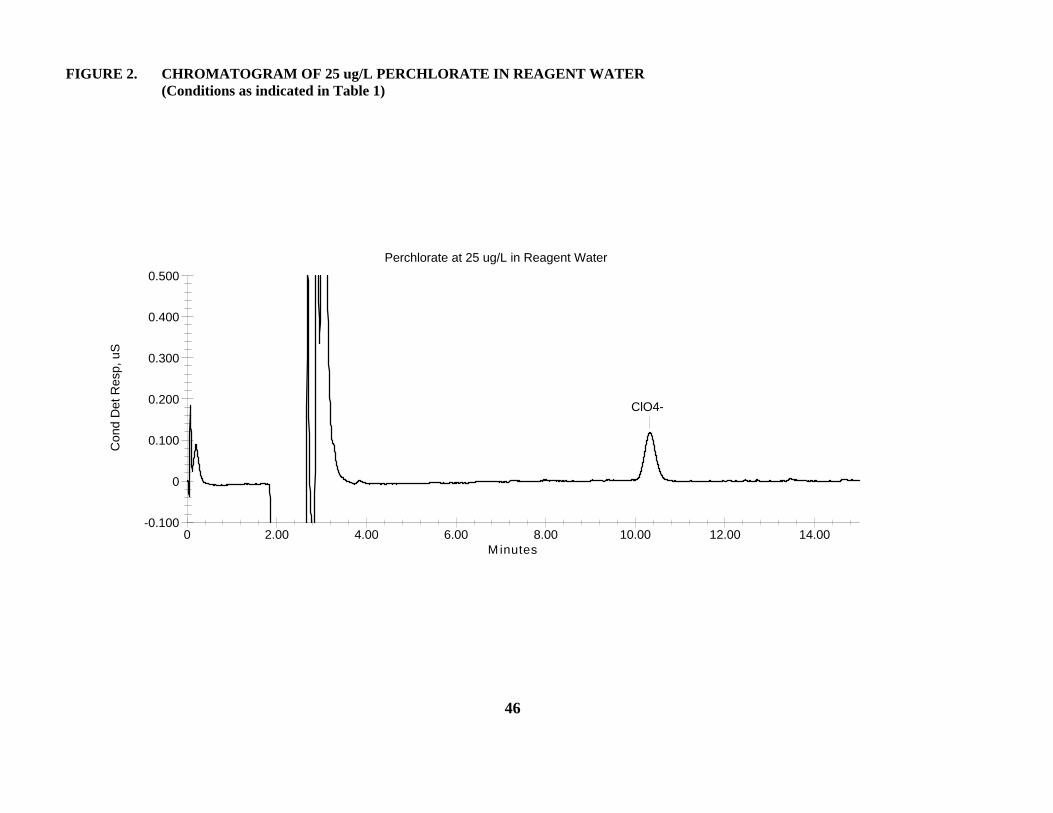
46
0 2.00 4.00 6.00 8.00 10.00 12.00 14.00-0.100
0
0.100
0.200
0.300
0.400
0.500
Con
d D
et R
esp,
uS
Perchlorate at 25 ug/L in Reagent Water
ClO4-
M inutes
FIGURE 2. CHROMATOGRAM OF 25 ug/L PERCHLORATE IN REAGENT WATER (Conditions as indicated in Table 1)
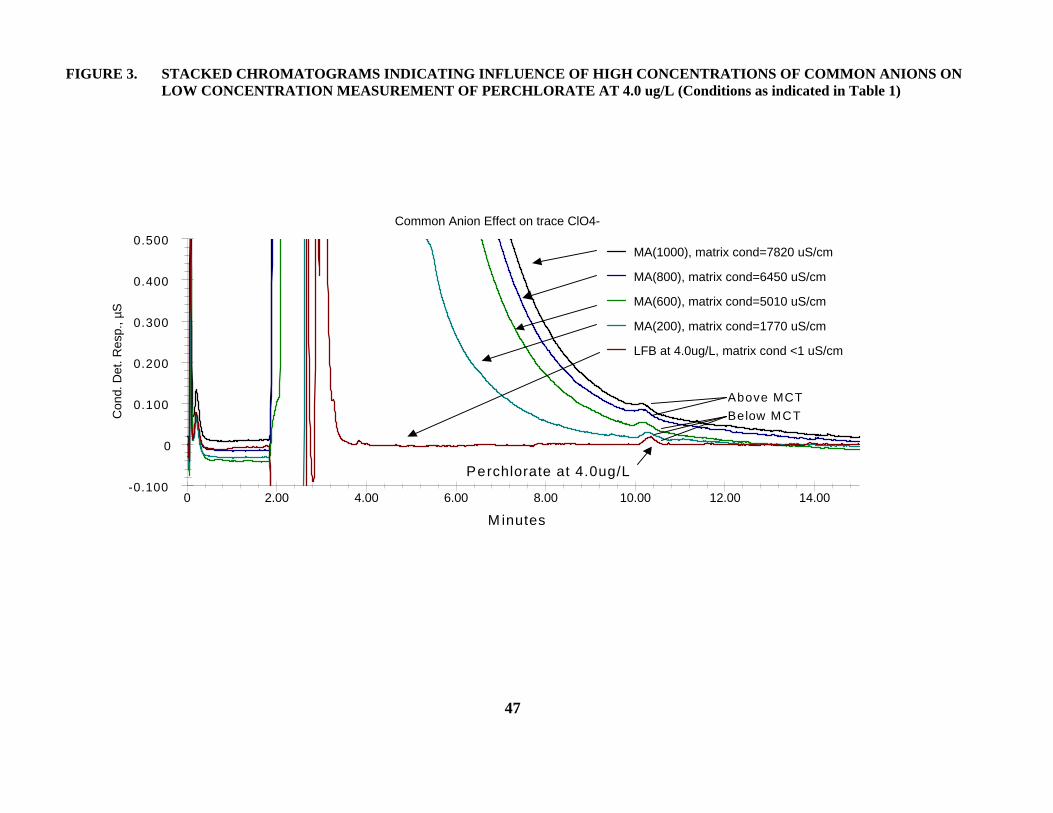
47
0 2.00 4.00 6.00 8.00 10.00 12.00 14.00
Minutes
µS
Common Anion Effect on trace ClO4-
MA(1000), matrix cond=7820 uS/cm
MA(800), matrix cond=6450 uS/cm
MA(600), matrix cond=5010 uS/cm
MA(200), matrix cond=1770 uS/cm
LFB at 4.0ug/L, matrix cond <1 uS/cm
Perchlorate at 4.0ug/L
Above MCT Below MCT
-0.100
0
0.100
0.200
0.300
0.400
0.500
Con
d. D
et. R
esp.
, µS
M inutes
FIGURE 3. STACKED CHROMATOGRAMS INDICATING INFLUENCE OF HIGH CONCENTRATIONS OF COMMON ANIONS ONLOW CONCENTRATION MEASUREMENT OF PERCHLORATE AT 4.0 ug/L (Conditions as indicated in Table 1)
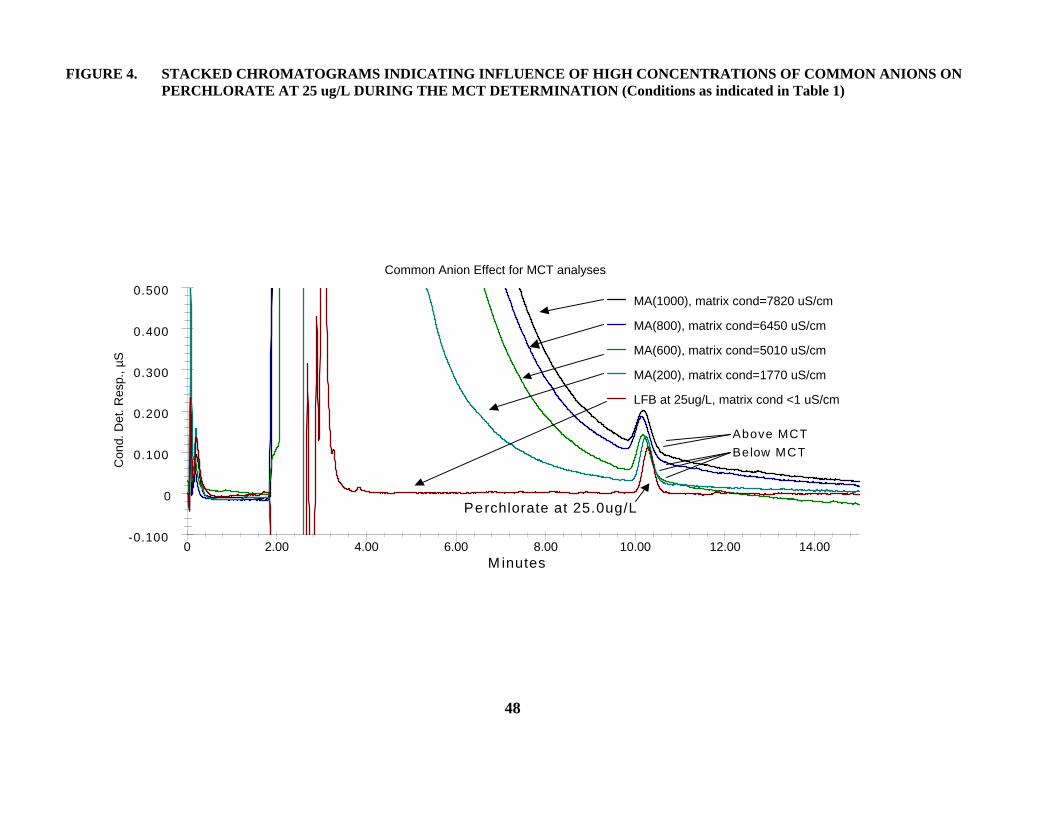
48
0 2.00 4.00 6.00 8.00 10.00 12.00 14.00
Con
d D
et R
esp,
uS
Common Anion Effect for MCT analyses
MA(1000), matrix cond=7820 uS/cm
MA(800), matrix cond=6450 uS/cm
MA(600), matrix cond=5010 uS/cm
MA(200), matrix cond=1770 uS/cm
LFB at 25ug/L, matrix cond <1 uS/cm
Perchlorate at 25.0ug/L
Above MCT Below MCT
-0.100
0
0.100
0.200
0.300
0.400
0.500
-0.100
0
0.100
0.200
0.300
0.400
0.500
Con
d. D
et. R
esp.
, µS
M inutes
FIGURE 4. STACKED CHROMATOGRAMS INDICATING INFLUENCE OF HIGH CONCENTRATIONS OF COMMON ANIONS ONPERCHLORATE AT 25 ug/L DURING THE MCT DETERMINATION (Conditions as indicated in Table 1)
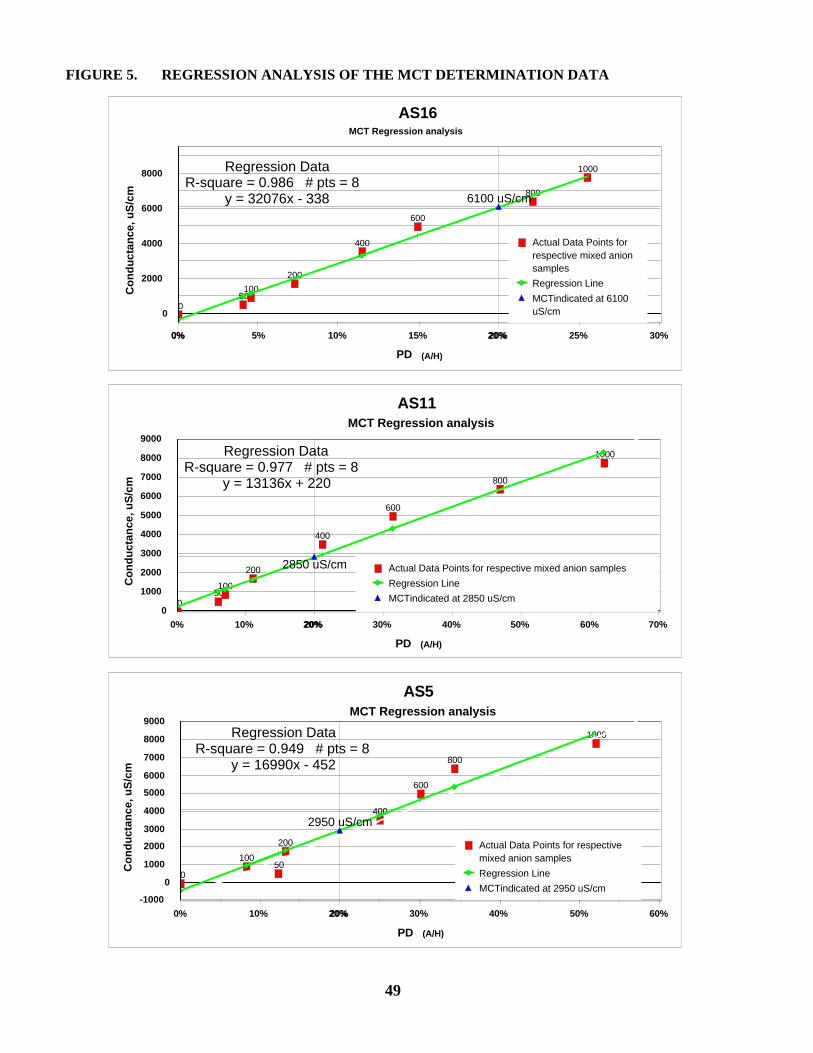
49
050100
200
400
600
800
1000
6100 uS/cm
0% 5% 10% 15% 20% 25% 30%0% 20%
(A/H)PD
0
2000
4000
6000
8000
Co
nd
uct
ance
, uS
/cm
Actual Data Points forrespective mixed anionsamples
Regression Line
MCTindicated at 6100uS/cm
Regression DataR-square = 0.986 # pts = 8
y = 32076x - 338
AS16MCT Regression analysis
050100
200
400
600
800
1000
2850 uS/cm
0% 10% 20% 30% 40% 50% 60% 70%20%
(A/H)PD
0
1000
2000
3000
4000
5000
6000
7000
8000
9000
Co
nd
uct
ance
, uS
/cm
Actual Data Points for respective mixed anion samples
Regression Line
MCTindicated at 2850 uS/cm
Regression DataR-square = 0.977 # pts = 8
y = 13136x + 220
AS11MCT Regression analysis
050
100
200
400
600
800
1000
2950 uS/cm
0% 10% 20% 30% 40% 50% 60%20%
(A/H)PD
-1000
0
1000
2000
3000
4000
5000
6000
7000
8000
9000
Co
nd
uct
ance
, uS
/cm
Actual Data Points for respectivemixed anion samples
Regression Line
MCTindicated at 2950 uS/cm
Regression DataR-square = 0.949 # pts = 8
y = 16990x - 452
AS5MCT Regression analysis
FIGURE 5. REGRESSION ANALYSIS OF THE MCT DETERMINATION DATA