Methane Emissions from U.S. Natural Gas Gathering ...
18
Methane Emissions from U.S. Natural Gas Gathering Facilities and Processing Plants: EPA GHGI Implications Anthony Marchese 1,* , Daniel Zimmerle 2 , Allen Robinson 3 and R. Subramanian 3 , 1 Department of Mechanical Engineering, Colorado State University, 2 The Energy Institute, Colorado State University, 3 Department of Mechanical Engineering, Carnegie Mellon University * Principal Investigator, http://www.engr.colostate.edu/~marchese Stakeholder Workshop on EPA GHG Data: Petroleum and Natural Gas Systems November 19, 2015
Transcript of Methane Emissions from U.S. Natural Gas Gathering ...

Methane Emissions from U.S. Natural Gas Gathering Facilities and Processing Plants: EPA GHGI Implications
Anthony Marchese1,*, Daniel Zimmerle2, Allen Robinson3
and R. Subramanian3, 1Department of Mechanical Engineering, Colorado State University, 2The Energy Institute, Colorado State University, 3Department of Mechanical Engineering, Carnegie Mellon University
* Principal Investigator, http://www.engr.colostate.edu/~marchese
Stakeholder Workshop on EPA GHG Data: Petroleum and Natural Gas SystemsNovember 19, 2015

2
PartnersEnvironmental Defense Fund, Anadarko Petroleum, Access Midstream, Williams, SWN, Hess, DCP Midstream*
Total Partner Facility Inventory738 gathering facilities
28 processing plants
Study TeamColorado State University (Anthony Marchese, Dan Zimmerle)Carnegie Mellon University (Allen Robinson)Aerodyne Research (Scott Herndon)
*DCP provided access to one randomly chosen processing plant but did not provide funding.
Methane Emissions from U.S Gathering and ProcessingStudy Team

3
The gathering and processing sectors are defined as all NG industry assets and operations that take place between two custody transfer points: the well site delivery meter and the receipt meter to the transmission sector
Gathering and Processing Systems = gathering pipelines, gathering compressor/booster stations and processing plants
Methane Emissions from Gathering and ProcessingSector Definition
Well SiteMidstream
Gathering & Processing
M M
M
Distribution System
Transmission System
Storage
Exploration&
Production
Gathering&
Processing
Transmission&
StorageDistribution
Processing Plant
Gathering Lines
Gathering Facility
Gathering pipelines were not measured as part of this study

4
Study Partner AssetsStudy partner assets included 738 gathering facilities and 28 Subpart KKK processing plants located in 13 U.S. states.
115 ° W 110 ° W
105° W 100° W 95° W 90° W 85° W 80° W 75° W
70° W 5 ° N
30 ° N
35 ° N
40 ° N
45 ° N
50 ° N
C1C2
C3
C4
C5
C6
C7
C8
C9
C10
C11
C12
C13
C14
C15
C16
C17
C18C19
C20
Methane Emissions from U.S Gathering and ProcessingField Campaign

5
115 ° W 110 ° W
105° W 100° W 95° W 90° W 85° W 80° W 75° W
70° W 5 ° N
30 ° N
35 ° N
40 ° N
45 ° N
50 ° N
C1C2
C3
C4
C5
C6
C7
C8
C9
C10
C11
C12
C13
C14
C15
C16
C17
C18C19
C20
Methane Emissions from U.S Gathering and ProcessingField CampaignComprehensive MeasurementsFacility-level CH4 emissions were acquired from 16 processing plants and 114 gathering facilities in 13 U.S. states in 20 weeks.
6
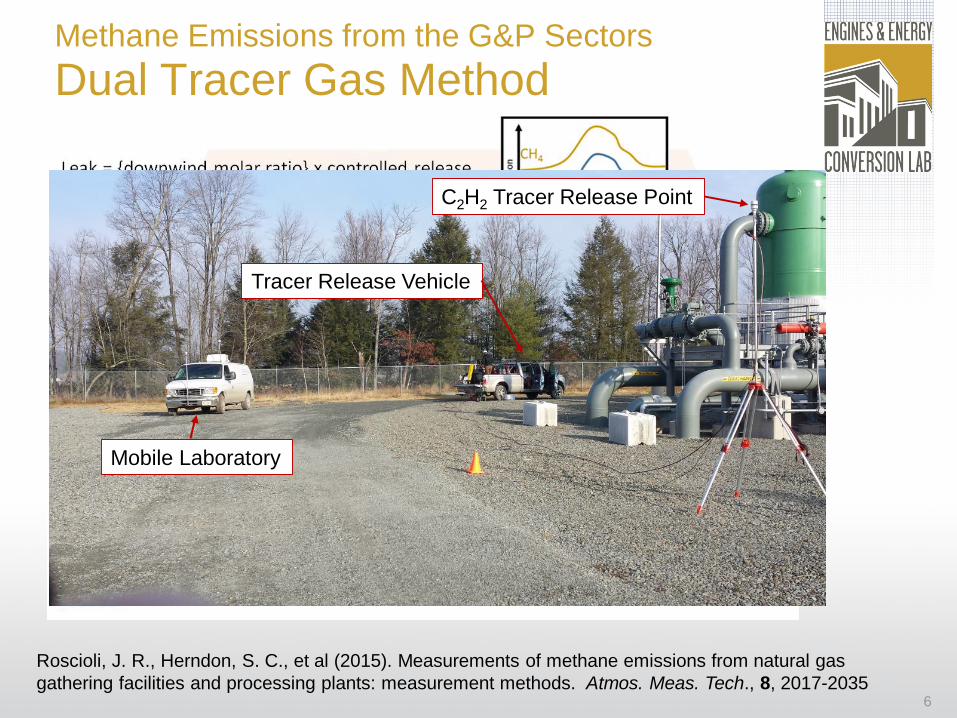
Methane Emissions from the G&P SectorsDual Tracer Gas Method
Roscioli, J. R., Herndon, S. C., et al (2015). Measurements of methane emissions from natural gas gathering facilities and processing plants: measurement methods. Atmos. Meas. Tech., 8, 2017-2035
C2H2 Tracer Release Point
Mobile Laboratory
Tracer Release Vehicle

7
Facility0 10 20 30 40 50 60 70 80 90 100 110 120 130
Faci
lity-
Leve
l CH
4 Em
issi
ons
(kg/
hr)
0
100
200
300
400
500
600
700
FLER (kg/hr)
0 10 20 30 40 50 60 70 80 90 100 110 120 130
CH
4 Em
issi
ons
/ CH
4 Thr
ough
put
0.0001
0.001
0.01
0.1
tnFLER (%)
P
CC/D
D
C/D/T
D/T
10 %
1 %
0.1%
0.01%
Methane Emissions from the G&P SectorsFacility-Level CH4 Emission Rates
Facility-Level Methane Emissions (kg/hr) and Loss Rate(%)
Mitchell, A.L., Zimmerle, D., Marchese, A.J., Robinson, A.L. et al. Measurements of Methane Emissions from Natural Gas Gathering Facilities and Processing Plants: Measurement Results. Environ. Sci. Technol.,49 (5) 3219-3227.
Median Loss Rate 0.42%
Gathering: 56 kg/hr/facility
Median Loss Rate 0.08%
Processing: 170 kg/hr/facility

8
Facility0 10 20 30 40 50 60 70 80 90 100 110 120 130
Faci
lity-
Leve
l CH
4 Em
issi
ons
(kg/
hr)
0
100
200
300
400
500
600
700
FLER (kg/hr)
0 10 20 30 40 50 60 70 80 90 100 110 120 130
CH
4 Em
issi
ons
/ CH
4 Thr
ough
put
0.0001
0.001
0.01
0.1
tnFLER (%)
P
CC/D
D
C/D/T
D/T
10 %
1 %
0.1%
0.01%
Methane Emissions from the G&P SectorsFacility-Level CH4 Emission Rates
• 9% Emitter (660 kg/hr)• Mid-Size C/D Station (9.5 MMscfd) • Three (3) 1150 HP recips• Noticeable venting from PW Tanks
Mitchell, A.L., Zimmerle, D., Marchese, A.J., Robinson, A.L. et al. Measurements of Methane Emissions from Natural Gas Gathering Facilities and Processing Plants: Measurement Results. Environ. Sci. Technol.,49 (5) 3219-3227.
High Emitters: 25 facilities had methane loss rates > 1%
1%

9
• 9% Emitter (660 kg/hr)• Mid-Size C/D Station (9.5 MMscfd) • Three (3) 1150 HP recips• Noticeable venting from PW Tanks
At 22 of the 114 sampled gathering facilities, substantial venting was observed from liquids storage tanks and the methane emissions from these gathering facilities was 3X compared to facilities in which substantial tank venting was not observed.
Methane Emissions from the G&P SectorsFacility-Level CH4 Emission Rates

10
Methane Emissions from the G&P Sectors“Back of the Envelope” Estimates
Gathering Facilities• (0.42% CH4 loss rate) x (421 Tg CH4 gathered in 2012) ≈ 1770 Gg• ( ≈ 4500 facilities) x (56 kg/hr/facility) ≈ 2200 Gg
Subpart KKK Processing Plants• (0.08% CH4 loss rate) x (287 Tg CH4 processed in 2012) ≈ 230 Gg• ( ≈ 600 facilities) x (170 kg/hr/facility) ≈ 890 Gg
Median loss rates (%) and facility-level emission factors (kg/hr/facility) can provide order of magnitude estimates of how the emissions might scale nationally.
Even without a sophisticated model, the experimental results indicate that methane emissions from gathering facilities are substantial (≈ 30% of entire NG supply chain methane emissions).

11
Natural Gas Throughput (MMscfd)0.1 1 10 100 1000
CH
4 Em
issi
ons
/ CH
4Thr
ough
put (
%)
1e-4
1e-3
1e-2
1e-1 PD C/D/TC/DC
10 %
1 %
0.1%
0.01%
Natural Gas Throughput (MMscfd)0.1 1 10 100 1000
Faci
lity
Leve
l CH
4 Em
issi
ons
(kg/
hr)
1
10
100
1000
Methane Emissions from the G&P SectorsDevelopment of National Estimate
Issues for Scale Up:• Facility size varies over several orders of magnitude (0.1 to 1000 MMscfd)• Emissions vary with throughput.• Large variation in emissions for a given throughput range.• Natural gas can flow through multiple gathering/boosting stations during
transit from the production site to transmission.
Scale Up of CH4 Measurements to National Estimate
Scale up to a national estimate requires:• Accurate facility count of all gathering facilities and processing plants• Average natural gas throughput (MMscfd) or proxy such as installed
compressor engine power for each facility
12
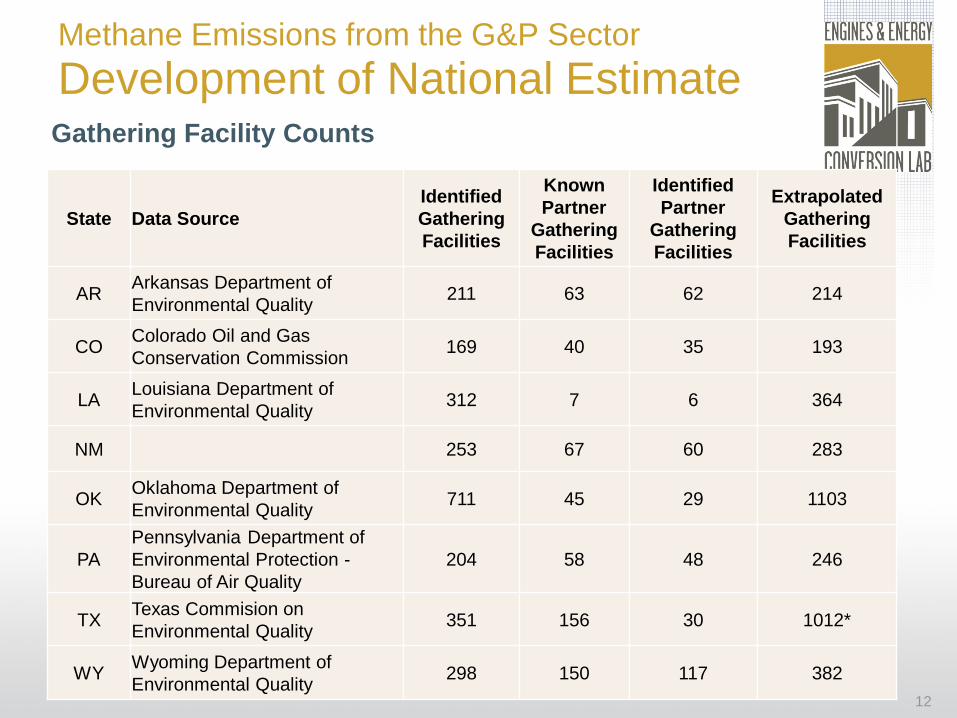
Gathering Facility Counts
Methane Emissions from the G&P SectorDevelopment of National Estimate
State Data SourceIdentified Gathering Facilities
Known Partner
Gathering Facilities
Identified Partner
Gathering Facilities
Extrapolated Gathering Facilities
AR Arkansas Department of Environmental Quality 211 63 62 214
CO Colorado Oil and Gas Conservation Commission 169 40 35 193
LA Louisiana Department of Environmental Quality 312 7 6 364
NM 253 67 60 283
OK Oklahoma Department of Environmental Quality 711 45 29 1103
PAPennsylvania Department of Environmental Protection -Bureau of Air Quality
204 58 48 246
TX Texas Commision on Environmental Quality 351 156 30 1012*
WY Wyoming Department of Environmental Quality 298 150 117 382

13
Methane Emissions from the G&P SectorsDevelopment of National Estimate
Total Facility Horsepower
102 103 104Faci
lity
Leve
l CH
4 Em
issi
ons
(SC
FM)
0.1
1
10
100
1000
CC/DC/D/T
Total Site Horsepower0 5000 10000 15000 20000 25000 30000
Pro
babi
lity
0.0
0.2
0.4
0.6
0.8
1.0
Installed Engine Power (HP), State Si Installed Engine Power (HP) of SampledGathering Facilities
Monte Carlo Simulation Scheme (Gathering)• Installed compressor engine power is used as a proxy for facility
natural gas throughput.• For each facility in a state database, an emissions value is randomly
drawn from among the 10 sampled facilities with closest HP.• Experimental uncertainty and uncertainty in facility count included.• Process is repeated for 50,000 iterations.
Annual CH4 Emissions (Gg)20 40 60 80 100 120
Frac
tile
0.0
0.2
0.4
0.6
0.8
1.0
Annual gathering methane emissions (Gg) and confidence intervals predicted for each state in the model from median and 97.5% confidence intervals.
Colorado: 69 (+25/-21) Gg of CH4 from 193 (+46/-35) facilities

14
Monte Carlo Simulation: Gathering Results
Methane Emissions from the G&P SectorsDevelopment of National Estimate
Total annual emission of methane (Gg) from all gathering facilities in the states of AR, CO, LA, OK, PA, TX and WY, and extrapolated U.S. results.
State Number of Gathering Facilities
Annual Emission of CH4 from Gathering
Facilities (Gg)
2012 CH4Gathered (Gg)
Modeled CH4 Loss Rate (%)
AR 214 (+43/-38) 53 (+20/-25) 19,723 0.27% (+0.10%/-0.08%)CO 193 (+46/-35) 69 (+25/-21) 28,261 0.25% (+0.09%/-0.07%)LA 364 (+62/-124) 104 (+42/-36) 50,207 0.21% (+0.08%/-0.07%)NM 282 (+82/-82) 96 (+40/-33) 20,215 0.47% (+0.20%/-0.16%)OK 1103 (+132/-132) 322 (+56/-52) 34,263 0.94% (+0.16%/-0.15%)PA 247 (+22/-7) 70 (+16/-14) 37,676 0.19% (+0.04%/-0.04%)TX 1012 (+304/-101) 616 (+124/-118) 126,552 0.49% (+0.10%/-0.09%)WY 382 (+77/-66) 86 (+25/-22) 34,414 0.25% (+0.07%/-0.06%)
Total States in Model 3,797 (+768/-587) 1,417 (+158/-154) 351,310 0.40% (+0.05%/-0.04%)
Total U.S. 4,549 (+921/-703) 1,697 (+189/-185) 420,906 0.40% (+0.05%/-0.04%)

15
Processing
Methane Emissions from the G&P SectorsComparison to EPA GHGI2014 EPA Inventory of CH4 emissions (Gg) for processing plants under normal operation is 851 Gg, which is higher than our estimate of 506 Gg (+55/-52 Gg)
Activity Activity Data Activity Units
Emission Factor
(Potential)
Emission Factor (units)
Calculated Potential
CH4 Emissions
(Mg)
2012 Voluntary
Reductions (Mg)
2012 Regulatory Reductions
(Mg)
2012 Calculated Net CH4
Emissions (Mg)
% Total Net
EmissionsNormal Fugitives
Plants 606 plants 7906 Scfd/ plant 33,680.5 (5,068.2) 28,612.3 3.21% Reciprocating Comp. 5,624 compressors 11,196 Scfd/ comp 442,633.5 (66,606.5) 376,027.0 42.17% Centrifugal Comp. (wet seals) 658 compressors 51,370 Scfd/ comp 237,724.1 (35,772.2) 201,951.9 22.65% Centrifugal Comp. (dry seals) 248 compressors 25,189 Scfd/ comp 43,936.6 (6,611.5) 37,325.1 4.19%
Vented and Combusted Normal Operation
Compressor ExhaustGas Engines 40,403 MMHPhr/year 0.24 scf/HPhr 186,750.5 (6,100.0) 180,650.5 20.26%Gas Turbines 47,907 MMHPhr/year 0.01 scf/HPhr 5,259.3 (791.4) 4,467.9 0.50%
AGR Vents 307 AGR units 6,083 scfd/AGR 13,134.2 (1,976.4) 11,157.8 1.25%Kimray Pumps 1,463,675 MMscf/yr 178 scf/MMscf 5,010.8 (754.0) 4,256.8 0.48%Dehydrator Vents 13,186,262 MMscf/yr 122 scf/MMscf 30,869.7 (9,300.0) (16,300.0) 5,269.7 0.59%Pneumatic Devices 606 plants 164,721 scfy/plant 1,922.6 (289.3) 1,633.3 0.18%
Routine Maintenance Blowdowns/Venting 606 plants 4,060 Mscfy/plant 47,386.5 (7,130.6) 40,255.9 4.51%
Regulatory Reductions (Gg) (16.3) Voluntary Reductions (Gg) (140.4) Total Reductions (Gg) Total Potential Emissions (Gg) 1,048.3Total Net Methane Emissions from Processing (Gg) 891.6 100%Total Net Emission from Processing less Routine Maintenance (Gg) 851.4
Majority of CH4emissions in processing inventory are from compressor fugitives and exhaust.
Observations from the field campaign suggest differences in reciprocating and centrifugal compressor activity data:
• 3890 reciprocating• 1473 centrifugal
16
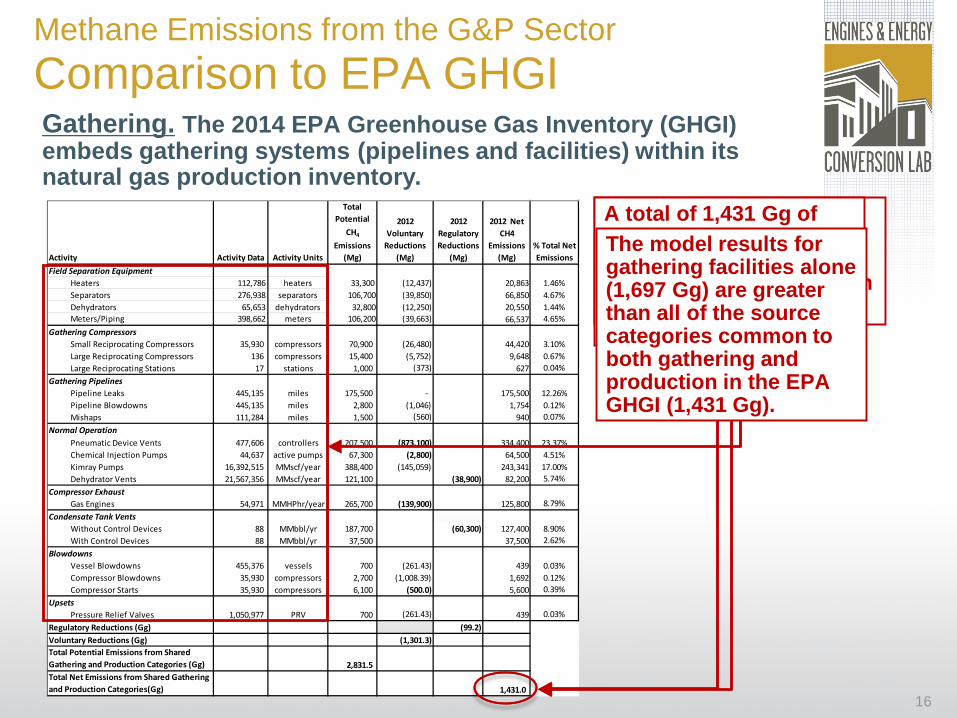
Gathering. The 2014 EPA Greenhouse Gas Inventory (GHGI) embeds gathering systems (pipelines and facilities) within its natural gas production inventory.
Methane Emissions from the G&P SectorComparison to EPA GHGI
Activity Activity Data Activity Units
Total Potential
CH4
Emissions (Mg)
2012 Voluntary
Reductions (Mg)
2012 Regulatory Reductions
(Mg)
2012 Net CH4
Emissions (Mg)
% Total Net Emissions
Field Separation EquipmentHeaters 112,786 heaters 33,300 (12,437) 20,863 1.46%Separators 276,938 separators 106,700 (39,850) 66,850 4.67%Dehydrators 65,653 dehydrators 32,800 (12,250) 20,550 1.44%Meters/Piping 398,662 meters 106,200 (39,663) 66,537 4.65%
Gathering Compressors Small Reciprocating Compressors 35,930 compressors 70,900 (26,480) 44,420 3.10%Large Reciprocating Compressors 136 compressors 15,400 (5,752) 9,648 0.67%Large Reciprocating Stations 17 stations 1,000 (373) 627 0.04%
Gathering Pipelines Pipeline Leaks 445,135 miles 175,500 - 175,500 12.26%Pipeline Blowdowns 445,135 miles 2,800 (1,046) 1,754 0.12%Mishaps 111,284 miles 1,500 (560) 940 0.07%
Normal Operation Pneumatic Device Vents 477,606 controllers 1,207,500 (873,100) 334,400 23.37%Chemical Injection Pumps 44,637 active pumps 67,300 (2,800) 64,500 4.51%Kimray Pumps 16,392,515 MMscf/year 388,400 (145,059) 243,341 17.00%Dehydrator Vents 21,567,356 MMscf/year 121,100 (38,900) 82,200 5.74%
Compressor Exhaust Gas Engines 54,971 MMHPhr/year 265,700 (139,900) 125,800 8.79%
Condensate Tank Vents Without Control Devices 88 MMbbl/yr 187,700 (60,300) 127,400 8.90%With Control Devices 88 MMbbl/yr 37,500 37,500 2.62%
Blowdowns Vessel Blowdowns 455,376 vessels 700 (261.43) 439 0.03%Compressor Blowdowns 35,930 compressors 2,700 (1,008.39) 1,692 0.12%Compressor Starts 35,930 compressors 6,100 (500.0) 5,600 0.39%
Upsets Pressure Relief Valves 1,050,977 PRV 700 (261.43) 439 0.03%
Regulatory Reductions (Gg) (99.2) Voluntary Reductions (Gg) (1,301.3) Total Potential Emissions from Shared Gathering and Production Categories (Gg) 2,831.5 Total Net Emissions from Shared Gathering and Production Categories(Gg) 1,431.0
We tabulated all source categories in the EPA GHGI production inventory common to both gathering and production.
A total of 1,431 Gg of methane emissions are attributed source categories common to both gathering and production.
The model results for gathering facilities alone (1,697 Gg) are greater than all of the source categories common to both gathering and production in the EPA GHGI (1,431 Gg).

17
Methane Emissions from the G&P SectorComparison to EPA GHGIGathering. The 2014 EPA Greenhouse Gas Inventory (GHGI) embeds gathering systems (pipelines and facilities) within its natural gas production inventory.
Activity Activity Data Activity Units
Mass Emission
Factor (Net)
Mass Emission Factor Units
2012 Net CH4
Emissions (Mg)
% Total Net Emissions for
Gathering Sector
% Total Net Emissions
for Gathering Facilities
Field Separation EquipmentHeaters 4,549 heaters 0.1850 Mg/heater 841 0.21% 0.37%Separators 6,784 separators 0.2414 Mg/sep 1,637 0.41% 0.73%Dehydrators 5,187 dehydrators 0.3130 Mg/dehy 1,624 0.40% 0.72%Meters/Piping 13,886 meters 0.1669 Mg/meter 2,318 0.57% 1.03%
Gathering Compressors Small Reciprocating Compressors 25,575 compressors 1.2363 Mg/comp 31,619 7.83% 14.00%Large Reciprocating Compressors 136 compressors 70.9445 Mg/comp 9,648 2.39% 4.27%Large Reciprocating Stations 17 stations 36.8543 Mg/station 627 0.16% 0.28%
Gathering Pipelines Pipeline Leaks 445,135 miles 0.3943 Mg/mile 175,500 43.44% Pipeline Blowdowns 445,135 miles 0.0039 Mg/mile 1,754 0.43% Mishaps 111,284 miles 0.0084 Mg/mile 940 0.23%
Normal Operation Pneumatic Device Vents 54,588 controllers 0.7002 Mg/cont 38,220 9.46% 16.93%Chemical Injection Pumps 9,098 active pumps 1.4450 Mg/pump 13,147 3.25% 5.82%Kimray Pumps 1,295,226 MMscf/year 0.0148 Mg/MMscf 19,227 4.76% 8.52%Dehydrator Vents 1,704,107 MMscf/year 0.0038 Mg/MMscf 6,495 1.61% 2.88%
Compressor Exhaust Gas Engines 39,128 MMHPhr/year 2.2885 Mg/MMHPhr 89,545 22.17% 39.66%
Condensate Tank Vents Without Control Devices 3 MMbbl/yr 1447.7273 Mg/MMbbl 4,343 1.08% 1.92%With Control Devices 3 MMbbl/yr 426.1364 Mg/MMbbl 1,278 0.32% 0.57%
Blowdowns Vessel Blowdowns 4,549 vessels 0.0010 Mg/vessel 4 0.00% 0.00%Compressor Blowdowns 25,575 compressors 0.0471 Mg/comp 1,204 0.30% 0.53%Compressor Starts 25,575 compressors 0.1559 Mg/comp 3,986 0.99% 1.77%
Upsets Pressure Relief Valves 13,647 PRV 0.0004 Mg/PRV 6 0.00% 0.00%
Total Net Emissions from Gathering (Gg) 404.0 Total Net Emissions from Gathering Facilities (Gg) 225.8
We then used field observations to estimate the fraction of the combined inventory to assign to “gathering”.
Based on this approach, we estimate that only 404 Gg of the combined GHGI inventory is attributed to gathering sector, of which on 226 Gg is attributed to gathering facilities.
The relatively small fraction of activity data assigned to “gathering” is consistent with Allen et al (2015) observations that suggest a high volume of equipment at production sites:• 124,000 heaters• 495,000 separators• 36,000 dehydrators• 12,000 compressors• 1,608,000 pneumatic
controllers • 247,000 liquid tanks

18
Comparison of national estimate of CH4 emissions from U.S. natural gas gathering systems and processing plants with 2014 EPA GreenhouseGas Inventory and 2013 EPA Greenhouse Gas Reporting Program.
Methane Emissions from the G&P SectorsComparison to EPA Programs