Methane Emissions From Gassy Coals in Storage Silos
18
Bureau of Mines Report of Investigations/l978 Methane Emissions From Gassy Coals in Storage Silos UNITED STATES DEPARTMENT OF THE INTERIOR
Transcript of Methane Emissions From Gassy Coals in Storage Silos
Bureau of Mines Report of Investigations/l978
Methane Emissions From Gassy Coals
in Storage Silos
UNITED STATES DEPARTMENT OF THE INTERIOR
Report of I n v e s t i g a t i o n s 8269
Methane Emissions From Gassy Coals
in Storage Silos
By J . E. Motta, J. C. I,aScola, and Fred N . Kissell
UNII'EID S T A T E S D E P A R T M E N T OF T H E I N T E R I O R Cecil I>. Andrus , Sec re t a ry
BUREAU OF MINES
T h i s publ icat ion has been cataloged as fo l lows:
hla.tta, Joscpli I.:
Methane emissions from gassy coals in storage s i los ' by J. E. Matta, J. C. LaScola, and Fred N. Kissell. !Washing- ton] : U.S. Dept. of the Interior, Bureau of Mines, 1978.
1.i 1'. : d i a g r a ~ n s : 2- cnl. (I<cj>ort uf i n v c s t i g ; l t i o n s - I3urr,lu 01 5 l i n c s : 8269)
13ibliopr:lphy: p. 11.
I . (:o;ll S t o r a g r . 2. 13ituniinotrs cn;ll - S t o r . 1 ~ ~ . Z , J l i * t l l : i ~ ~ c ~ 4. \ l i n e g : l s e s A I. I - ;~Scnl; l , J o h n ('., jo int ;ltrtlior, 1 1 . K i s s c l l , Frcd N., joint author. 111. I ; n i t e d S t n t r s . t3urc.1~1 c > f \ l i n e s . I \ ' . . , 1 i t l e . \'. S e r i e s : [Iniced S t n t r s . 13ureau ol \ l i n e s . I<cport of i n \ . e s t i g . x t i o n s - 13urcau of \ l i n e s : 82(10.
TN23.U7 no. 8269 622.06173
I:.S. 1)cyt. o f t h e Int. Librilry
CONTENTS Page
. . . . . . . . . . . . . . . . . . . . . . . . . . . . . . . . . . . . . . . . . . . . . . . . . . . . . . . . . . . . . . . . . Abs t r ac t 1 . . . . . . . . . . . . . . . . . . . . . . . . . . . . . . . . . . . . . . . . . . . . . . . . . . . . . . . . . . . . . I n t r o d u c t i o n 1
. . . . . . . . . . . . . . . . . . . . . . . . . . . . . . . . . . . . . . . . . . . . . . . . . . . . . . . . . S i l o v e n t i l a t i o n 3 S i l o usage . . . . . . . . . . . . . . . . . . . . . . . . . . . . . . . . . . . . . . . . . . . . . . . . . . . . . . . . . . . . . . . 3 Conveyor b e l t g rab samples . . . . . . . . . . . . . . . . . . . . . . . . . . . . . . . . . . . . . . . . . . . . . . . 4
. . . . . . . . . . . . . . . . . . . . . . . . . . . . . . Methane concen t r a t i on above t h e s t o r e d p i l e 8 . . . . . . . . . . . . . . . . . . . . . . . . . . . . . Methane c o n c e n t r a t i o n w i t h i n t h e s t o r e d p i l e 10
. . . . . . . . . . . . . . . . . . . . . . . . . . . . . . . . . . . . . . . . . . . . . . . . . . . . . . . . . . . . . . Conclusions 11 References . . . . . . . . . . . . . . . . . . . . . . . . . . . . . . . . . . . . . . . . . . . . . . . . . . . . . . . . . . . . . . . 12 Appendix . . -Theoret ical c a l c u l a t i o n of t h e gas emission from a c o a l s i l o .. 13
ILLUSTRATIONS
. . . . . . . . . . . . . . . . . . . . . . . . . . 1 . Gas emi t ted from conveyor b e l t grab samples 4 2 . Gas emi t ted from grab sample a t Fede ra l No . 2 mine ( log- log p l o t ) . . . . 6 3 . Calcu la ted gas emission from a c o a l s i l o u s ing t h e Fede ra l No . 2
grab sample and assuming a c o n s t a n t 8 - h o u r f i l l i n g r a t e . . . . . . . . . . . . 7 4 . Methane c o n c e n t r a t i o n g r a d i e n t i n c o a l s i l o .......................... 8 5 . Average methane c o n c e n t r a t i o n i n s i l o ve r sus gas emi t ted w i t h i n
24 hours from t h e corresponding grab sample . . . . . . . . . . . . . . . . . . . . . . . . 9
TABLE S
1 . General in format ion concerning s i l o s i n v e s t i g a t e d .................... 2 ....................................... 2 . Gas emission from grab samples 5
METHANE EMISSIONS FROM GASSY COALS IN STORAGE SILOS
by
Jm E, Matta, Jm C. LaScola, and Fred N. K i ssel I
ABSTRACT
The methane gas emit ted from c o a l samples c o l l e c t e d from the conveyor b e l t s dumping i n t o s i l o s was measured by the Bureau of Mines. Approximately 50 p c t of the t o t a l gas desorbed i n t o a sealed can wi th in 1 week was r e l eased during the f i r s t 24 hours . No simple c o r r e l a t i o n between the gass iness of the c o a l s to red and the methane concent ra t ion i n the s i l o open space above the c o a l was found. This was probably because the g a s s i e r coa l s were s tored i n open-top s i l o s , which were b e t t e r v e n t i l a t e d . Although the methane concentra- t i o n i n the open space above the c o a l p i l e was l e s s than 1 p c t f o r a l l 34 s i l o s inves t iga t ed , a methane measurement i n the c o a l p i l e showed t h a t high methane concent ra t ions can e x i s t . The methane r e l eased i n t h e p i l e appears t o accumulate and not l i b e r a t e f r e e l y i n t o t h e open space above the coa l p i l e . Probably t h i s gas i s r e l eased during reclaiming ope ra t ions , but f u r t h e r r e sea rch i s requi red t o s u b s t a n t i a t e t h i s claim.
INTRODUCTION
Coal can be s to red i n a number of ways It can be s to red under water , i n open p i t s , b ins , bunkers, s t o c k p i l e s , and s i l o s . The cu r ren t t rend i s t o s t o r e c o a l i n s t o c k p i l e s o r s i l o s a t t h e mine s i t e , so t h a t a p rede te r - mined quan t i ty can be s to red and e a s i l y loaded i n t o r a i l r o a d c a r s . I n t h e p a s t , coa l was gene ra l ly loaded i n t o r a i l r o a d c a r s the day i t was mined; how- eve r , the use of the u n i t t r a i n , which a f fo rds reduced t r a n s p o r t a t i o n r a t e s f o r t r a i n l o a d s or p a r t i a l t r a in loads of coa l , has made temporary s tockp i l ing a t the mine a necess i ty ( 7 ) . I n a d d i t i o n t o convenience i n handling the c o a l , t he use of s i l o s lessens t h e p o s s i b i l i t y of phys ica l and chemical changes i n the c o a l , thereby preserving the u t i l i z a t i o n va lue of the f u e l .
l ~ e s e a r c h p h y s i c i s t . 2 ~ a t h e m a t i c i a n . 3 Physica l research s c i e n t i s t .
A l l au thors a r e wi th P i t t sbu rgh Mining and Sa fe ty Research Center, Bureau of Mines, P i t t sbu rgh , Pa.
4 ~ n d e r l i n e d numbers i n parentheses r e f e r t o items i n the l i s t of re ferences preceding the appendix.
Subbituminous c o a l can be s t o r e d wi thout much deg rada t ion i n a c losed b i n w i t h minimum a i r c i r c u l a t i o n , a slow r a t e of temperature change of t h e b i n i n t e r i o r , and a low tempera ture ( 5 ) . However, when gaseous bituminous c o a l i s s t o r e d i n a con- f i n e d space such a s a s i l o , methane accumulat ion can become an explos ion hazard . The Eng l i sh were aware of t h i s problem a s e a r l y a s 1875 when t h e Royal Commission inqu i r ed i n t o t h e spontaneous combustion of c o a l and gas explos ions i n s h i p s (6) . Current Fede ra l r e g u l a t i o n s (8) r e q u i r e s t h e methane con ten t i n t h e a i r of any s t r u c t u r e , enc losu re , o r o t h e r f a c i l i t y t o be l e s s t h a n 1 . 0 v o l - p c t . As deeper and g a s - s i e r c o a l s a r e mined, problems a s s o c i a t e d w i t h methane accumulat ions i n s i l o s w i l l i n c r e a s e .
The purpose of t h e p re sen t i n v e s t i g a t i o n was t o s tudy t h e p o s s i b i l i t y of a haz- a rd r e s u l t i n g from methane accumulat ions i n s i l o s . Methane concen t r a t ions were mea- sured i n t h e open space above the c o a l and i n t h e c o a l p i l e . Coal samples were c o l l e c t e d from t h e conveyor b e l t t h a t dumps t h e c o a l i n t o t h e s i l o . The gas emi t t ed from t h e samples was measured t o determine t h e r e l a t i o n s h i p between t h e g a s s i n e s s of t he c o a l s t o r e d and t h e methane c o n c e n t r a t i o n i n t h e s i l o . This i n fo rma t ion i s r e l e - v a n t because improper s t o r a g e inay r e s u l t i n h igh methane c o n c e n t r a t i o n s . Now, w i t h even deeper and more gas sy coalbeds being mined and w i t h t h e growing p r a c t i c e of s h o r t - and long-term s t o r a g e of f i n e c o a l , t h e explos ion hazard due t o methane emis- s i o n i s worthy of i n v e s t i g a t i o n . Most of t h e s i l o s i n v e s t i g a t e d i n t h i s s t u d y s t o r e l a r g e q u a n t i t i e s of c o a l e x t r a c t e d from mines t h a t emit l a r g e volumes of methane ( t a b l e 1) and, t h e r e f o r e , methane accumulat ions i n t hese s i l o s a r e p o s s i b l e i f s u f - f i c i e n t v e n t i l a t i o n i s no t main ta ined .
TABLE 1. - General informat ion concerning s i l o s i n v e s t i g a t e d
Mine
Loveridge No. 2 2 . . . F e d e r a l No. 2 . . Val ley Camp No. 3 . . A l l i s o n . . . . . . . . . . . . . . . . .
Do.. . . . . . . . . . . . . . . . . .
Nelms No. I . . . . . . . . Nelms No. 2 . . . . . . . .
Do . . . . . . . . . . . . . . . . . . . .
B e a t r i c e . . . . . . . . . . .
Virginia-Pocahontas No. 1.
Virginia-Pocahontas No. 2 .
Virginia-Pocahontas No. 3 .
Virginia-Pocahontas No. 4 .
Oak Grove . . . . . . . . . .
Number of
s i l o s
1 2 1 1 1
1 1 6
1
1
1
1
1
1
Seam
P i t t s b u r g h . . . . . . . . . . . . . . do . . . . . . . .
. . . . . do . . . . . . . . do . . . . . . . .
. d o . . . . . . . .
Lower F reepor t . . . . . . do . . . . . . . .
do . . . . . . . .
Pocahontas No. 3 . . . . . . do . . . . . . . .
. . . . . do . . . . . . . .
. . . . .do . . . . . . . .
. . . . .do. . . . . . . .
Mary Lee. . . . . . .
Coal s t o r e d
Clean . . Raw.. . . . Clean. . Raw . . . . . . Clean . .
. . . . Raw Raw. . . . Crushed
Raw. . . . .
Raw. . . .
Raw. . . . .
Raw.. . . .
Raw. . . . .
Raw. . . .
Dai ly mine
produc- t i o n , tons 9,200 4,000 4,200 4,500 4,500
4,500 - -
3,300
3,000
1,100
2,400
850
800
Type of top
Closed .do . .
. . d o . . d o . .
. . do . .
. . d o . .
. . d o . . Open..
. d o . .
. . d o . .
.do. .
.do. .
.do. . Closed w i t h f a n .
Mine methane
emission, MM cu f t /
day 11 .6 8 . 1 2 . 0
. 2
.2
2 . 1 .4 .4
5 . 6
3 . 9
3 . 4
3 . 3
1 . 9
1 . 3
Capaci ty of each
s i l o , tons
10,000 2,500
10,000 6,800
17,400
5,000 2,500 2,000
2,000
2,000
2,000
5,000
5,000
6,000
SILO VENTILATION
S i l o s can be d iv ided i n t o two types accord ing t o t h e i r type of v e n t i l a - t ion- -open t op and c lo sed top . Open-top s i l o s a l low l a r g e a i r movements above t he c o a l p i l e , t h u s reducing t h e hazard of a methane explos ion . However, open- t o p s i l o s provide no p r o t e c t i o n a g a i n s t p r e c i p i t a t i o n , and we t t i ng of some c o a l s i n c r e a s e s t h e chance of spontaneous combustion. Furthermore, t h e move- ment of l a r g e volumes of a i r through a s i l o can r e a d i l y e n t r a i n d u s t i n t o t h e atmosphere.
Although c losed- top s i l o s provide t h e p r o t e c t i o n n o t a f fo rded by open-top s i l o s , methane may accumulate above t he c o a l p i l e dur ing s t o r a g e of gassy c o a l s . V e n t i l a t i o n i s provided by v a r i o u s types of openings a t t h e top of the s i l o . Na tu ra l l y v e n t i l a t e d s i l o s depend upon wind t o move a i r through t h e openings, a l though some s i l o s employ exhaust f ans t o i n s u r e s u f f i c i e n t a i r movement.
Typ ica l l y , v e n t i l a t i o n of c lo sed - top s i l o s i s through r e c t a n g u l a r ho l e s approximately 1 by 2 f e e t , spaced a long t h e o u t e r edge of t h e s i l o immediately below t h e conc re t e r o o f . This scheme i s s u b j e c t t o s l i g h t v a r i a t i o n s . For example, i n t h e s i l o a t Nelms No. 1 mine, t h e s i d e ven t ho l e s a r e expanded i n t o a s i n g l e 18-inch-high s l i t , s t a r t i n g a t t h e p o i n t where t h e conveyor b e l t c r o s s e s t h e s i d e of t h e s i l o , t o a p o i n t halfway around t h e c i rcumference . Some s i l o s have round, covered d u c t s , 4 t o 10 inches i n d iameter , t h a t p ro - t r u d e through t h e roof t o provide a d d i t i o n a l openings f o r v e n t i l a t i o n . Open- i ngs on t h e roof such a s access ho l e s , i n s p e c t i o n h o l e s , and open space around t h e t r a n s f e r p o i n t and conveyor b e l t a l s o enhance a i r c i r c u l a t i o n .
When a i r movement due t o t h e p r e v a i l i n g wind i s i n s u f f i c i e n t o r methane emiss ion i s high, exhaust f ans a r e mounted on t op of t h e s i l o . I n a de s ign used a t t he OakGrovemine, e i g h t I-beams suppor t t he conc re t e r o o f . To i n s u r e adequate v e n t i l a t i o n , 8 - by 16-inch v e n t ho l e s appear on one s i d e of t h e s i l o on ly , one f o r each of t h e n ine spaces between t h e I-beams. On t h e o t h e r s i d e of t h e s i l o , a meta l duc t pa s se s up through t h e roof from each space and mani- f o l d s i n t o a 30- inch exhaust f a n powered by a 13.4-bhp motor. A i r sweeps through t h e s i l o and flows p a r a l l e l a long t h e I-beams a t a t o t a l r a t e of 16,600 c u f t l m i n .
A compromise between an open- and c losed- top arrangement i s used a t t h e Nelms No. 2 mine. Here, a c l u s t e r of s i x open-top s i l o s i s covered by a s l a n t e d meta l roof mounted high above t h e t op edge. This a l lows f r e e a i r movement whi le p rov id ing f a i r p r o t e c t i o n a g a i n s t p r e c i p i t a t i o n .
SILO USAGE
Coal f r e s h l y mined from a working f ace may be t empora r i l y s t o r e d under- ground i n smal l ba tches and t hen brought t o t he s u r f a c e . I n a t y p i c a l p ro - c e s s i n g ope ra t i on where s i l o s a r e used, c o a l i s conveyed by b e l t and dropped i n t o t h e t op of t h e raw c o a l s i l o dur ing each mining s h i f t . Coal i s unloaded from t h e raw-coal s i l o through f eede r s i n t h e s i l o base , onto a conveyor b e l t , and i n t o t h e p r e p a r a t i o n p l a n t a t a cont inuous r a t e determined by t h e c a p a c i t y
of t h e p l a n t . Since the p l a n t capac i ty i s usua l ly l a rge enough t o handle a f u l l day ' s mine product ion i n one p l a n t s h i f t , c o a l does no t normally remain i n t h e raw c o a l s i l o more than 24 hours. Af ter processing, t he c o a l i s con- veyed by b e l t to the c lean-coal s i l o where it w i l l be loaded onto a u n i t t r a i n . Unit t r a i n s a r e loaded a s o f t e n a s d a i l y o r a s seldom a s weekly.
CONVEYOR BELT GRAB SAMPLES
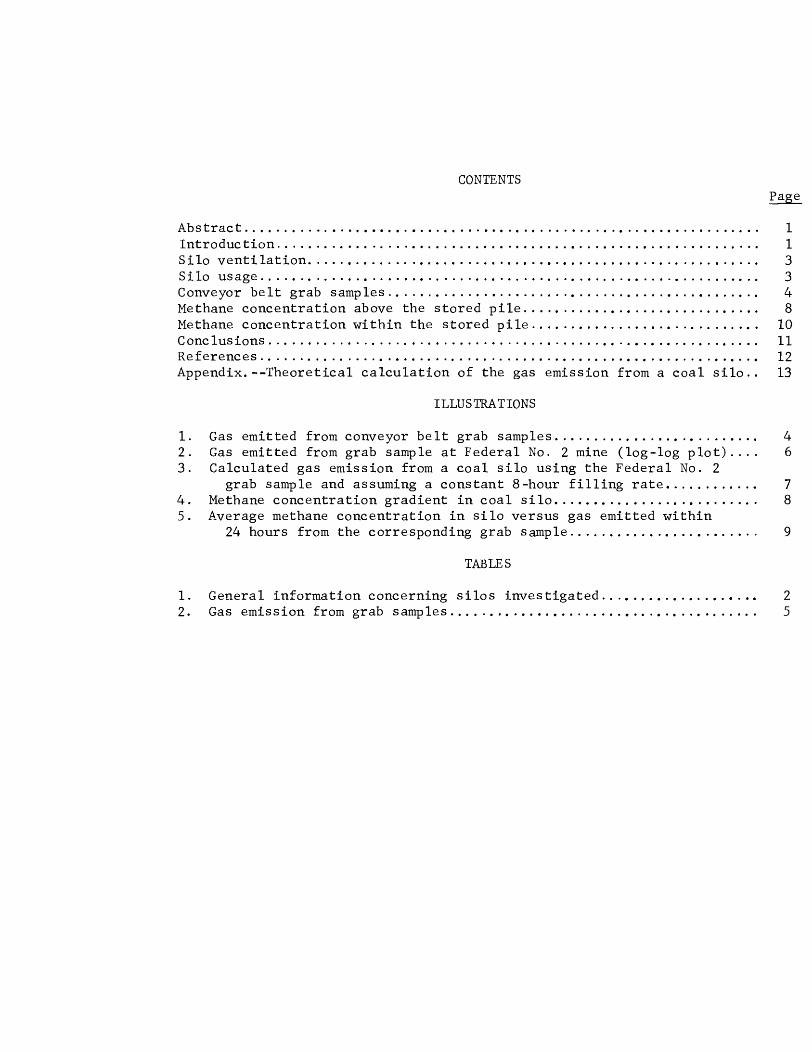
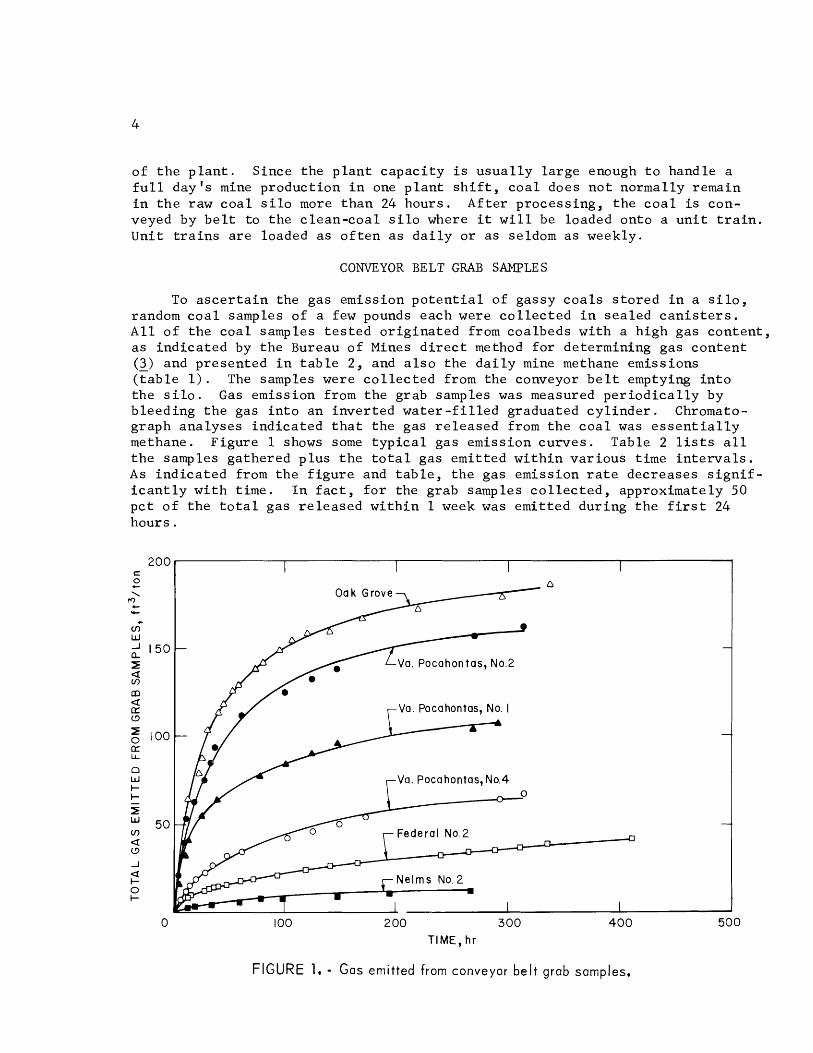
To a s c e r t a i n the gas emission p o t e n t i a l of gassy c o a l s s to red i n a s i l o , random c o a l samples of a few pounds each were c o l l e c t e d i n sea led c a n i s t e r s . A l l of t he coa l samples t e s t e d o r ig ina ted from coalbeds with a high gas content , a s indica ted by t h e Bureau of Mines d i r e c t method f o r determining gas content (3) and presented i n t a b l e 2 , and a l s o the d a i l y mine methane emissions ( t a b l e 1). The samples were c o l l e c t e d from the conveyor b e l t emptying i n t o the s i l o . Gas emission from the grab samples was measured p e r i o d i c a l l y by bleeding t h e gas i n t o an inver ted w a t e r - f i l l e d graduated c y l i n d e r . Chromato- graph analyses indica ted t h a t t he gas re leased from t h e c o a l was e s s e n t i a l l y methane. Figure 1 shows some t y p i c a l gas emission curves . Table 2 l i s t s a l l t h e samples gathered p lus t h e t o t a l gas emit ted wi th in var ious time i n t e r v a l s . A s i nd ica t ed from the f i g u r e and t a b l e , t h e gas emission r a t e decreases s i g n i f - i c a n t l y wi th time. I n f a c t , f o r the grab samples c o l l e c t e d , approximately 50 pc t of t h e t o t a l gas r e l eased wi th in 1 week was emit ted during t h e f i r s t 24 hours .
I I I
Va. Pocahontas, No.2
Va. Pocahontas, No. I
Va. Pocahontas, No.4 0
-,
100 2 0 0 3 0 0 400 TIME, h r
FIGURE 1. - G a s e m i t t e d f r o m c o n v e y o r b e l t g r a b s a m p l e s .
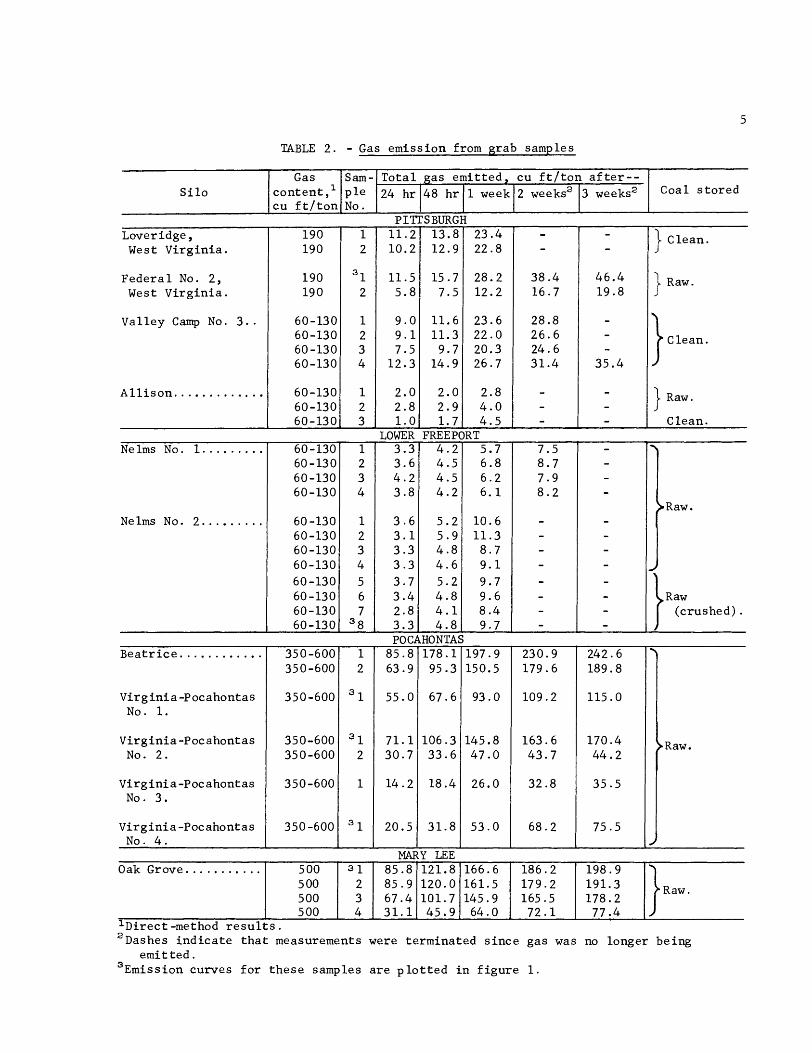
TABLE 2 . - Gas emiss ion from g r a b samples
2 ~ a s h e s i n d i c a t e t h a t measurements were t e rmina ted s i n c e gas was no longer be ing e m i t t e d .
3 ~ m i s s i o n curves f o r t h e s e samples a r e p l o t t e d i n f i g u r e 1.
S i l o T o t a l gas e m i t t e d , c u f t / t o n a f t e r - - Gas
c o n t e n t , ' c u f t / t o n
PITTSBURGH
Sam- p l e No.
3 weeks2 24 hr 1 week 48 h r
- -
38 .4 1 6 . 7
28.8 26 .6 24.6 31.4
- - -
2 weeks2
1 1 . 2 10.2
11 .5 5 . 8
9 . 0 9 . 1 7 .5
12 .3
2 .0 2 . 8 1 . 0
1 2
3l 2
1 2 3 4
1 2 3
Loveridge, West V i r g i n i a .
F e d e r a l No. 2, West V i r g i n i a .
Va l ley Camp No. 3 . .
A l l i s o n . . . . . . . . . . . . .
LOWER FREEPORT
- -
46.4 1 9 . 8
! } 35.4
- - -
190 190
190 19 0
60-130 60-130 60-130 60-130
60-130 60-130 60-130
} c l e a n .
} Raw.
Clean.
) Raw.
Clean.
13.8 12.9
15.7 7 .5
11.6 11.3
9 .7 14.9
2 .0 2 .9 1 .7
NelmsNo. 1 . . . . . . . . .
. . . . . . . Nelms No. 2 . .
23.4 22.8
28.2 12.2
23.6 22 .0 20.3 26.7
2 .8 4 . 0 4 . 5
60-130 60-130 60-130 60-130
60-130 60-130 60-130 60-130 60-130 60-130 60-130 60-130
4 . 2 4 . 5 4 . 5 4 . 2
5 . 2 5 . 9 4 . 8 4 . 6 5 . 2 4 . 8 4 . 1 4 . 8
POCAHONTAS
7 . 5 8 . 7 7 .9 8 . 2
; - -
5.7 6 . 8 6 . 2 6 . 1
10 .6 1 1 . 3
8 . 7 9 . 1 9 .7 9 . 6 8 . 4 9 .7
B e a t r i c e . . . . . . . . . . . .
Virginia-Pocahontas No. 1.
Vi rg in ia -Pocahontas No. 2 .
Virginia-Pocahontas No. 3 .
Virginia-Pocahontas No. 4 .
1 2 3 4
1 2 3 4 5 6 7
3 8
; I - -
3 . 3 3 . 6 4 . 2 3 . 8
3 . 6 3 . 1 3 . 3 3 . 3 3 . 7 3 . 4 2 . 8 3 . 3
350-600 350-600
350-600
350-600 350-600
350-600
350-600
Raw.
.
MARY LEE Oak Grove. . . . . . . . . . .
1 2
1
1 2
1
1
178 .1
67.6
106 .3 33 .6
18.4
31 .8
8 5 . 8 63.9
55.0
7 1 . 1 3 0 . 7
1 4 . 2
20.5
l ~ i r e c t -method r e s u l t s .
500 5 00 500 500
197.9 9 5 . 3 1 5 0 . 5
93 .0
145.8 47.0
26.0
5 3 . 0
31 2 3 4
230.9 179.6
109.2
163.6 43 .7
32 .8
68 .2
121.8 120.0 101.7 45 .9
85 .8 8 5 . 9 67 .4 3 1 . 1
242.6 189.8
115.0
170.4 4 4 . 2
3 5 . 5
75 .5
166.6 161.5 145.9 64 .0
0 Raw.
186.2 179.2 165.5 7 2 . 1
198 .9 191.3 178.2 77.4
} Raw.
According t o Miiller ( 4 ) , - t h e t o t a l gas emi t t ed , Q , c a n be expressed a s f o l lows :
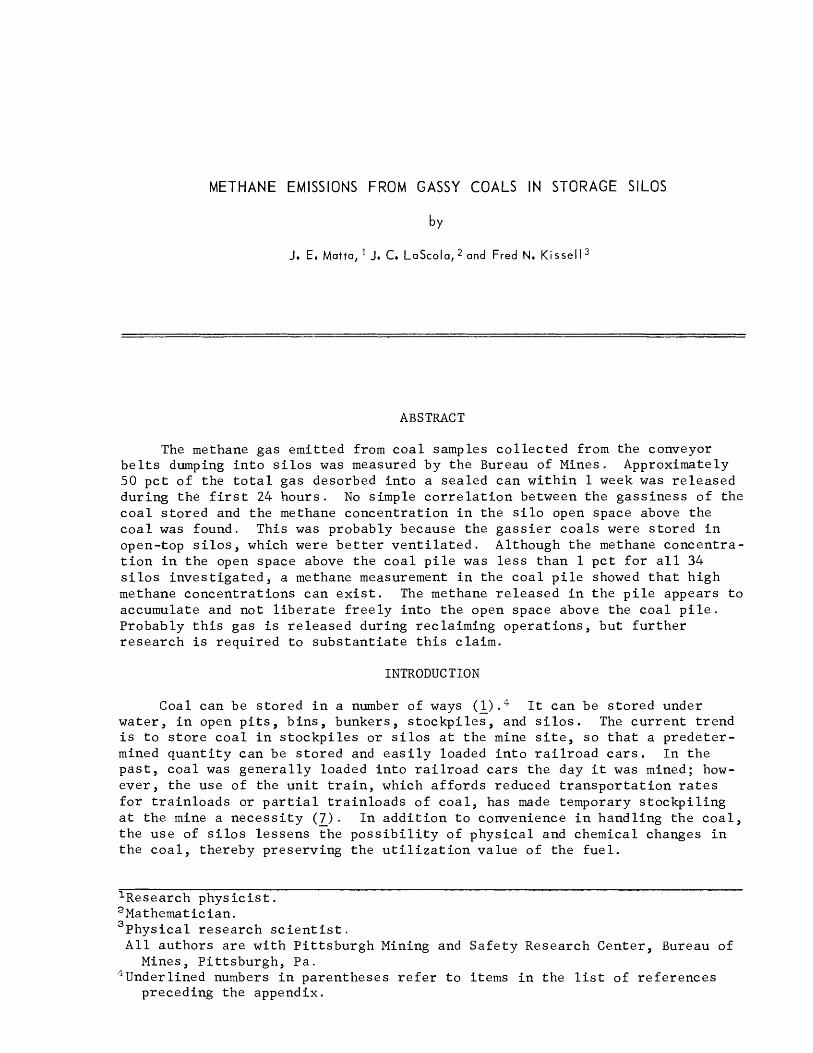
where a i s a c o n s t a n t , F i s t h e c o a l tonnage, t i s t h e t ime , and t h e exponent x ranges from 0.3 f o r c o a l s i z e under 8 mm t o 0 .7 f o r g r a i n s i z e between 25 t o 120 mm. F igure 2 i s a log- log p l o t of t h e gas emi t ted pe r t o n dur ing t h e f i r s t 48 hours f o r t h e Fede ra l No. 2 sample shown i n f i g u r e 1. Here, t h e i n i - t i a l t ime, t = 0, i s t h e t ime when t h e c o a l i s t aken from the s i l o b e l t . The s l o p e of t h e dashed l i n e , 0 .54 , corresponds t o t h e exponent x f o r t h i s c o a l . The b e s t f i t t o t h e o t h e r f i v e emission curves shown i n f i g u r e 1 r e s u l t e d i n exponents t h a t ranged from 0 .4 t o 0 . 8 . Although the se v a l u e s a r e c o n s i s t e n t w i t h those ob ta ined by Miiller, it should be noted t h a t Miiller chose t h e t ime of c u t t i n g t h e c o a l a s t = 0. The choice of i n i t i a l t ime does a f f e c t t h e exponent . For example, ignor ing t h e f i r s t 2 hours of gas emission from t h e Fede ra l No. 2 g rab sample, which would be equ iva l en t t o an a d d i t i o n a l 2-hour de l ay i n t r a n s p o r t i n g t h e c o a l t o t h e s i l o b e l t a l t e r e d t h e exponent t o 0 .68 .
I 2 4 6 8 10 20 30 405060 TIME, hr
F IGURE 2. - Gas emi t ted from grab sample a t Federa l No. 2 mine ( log- log lot).
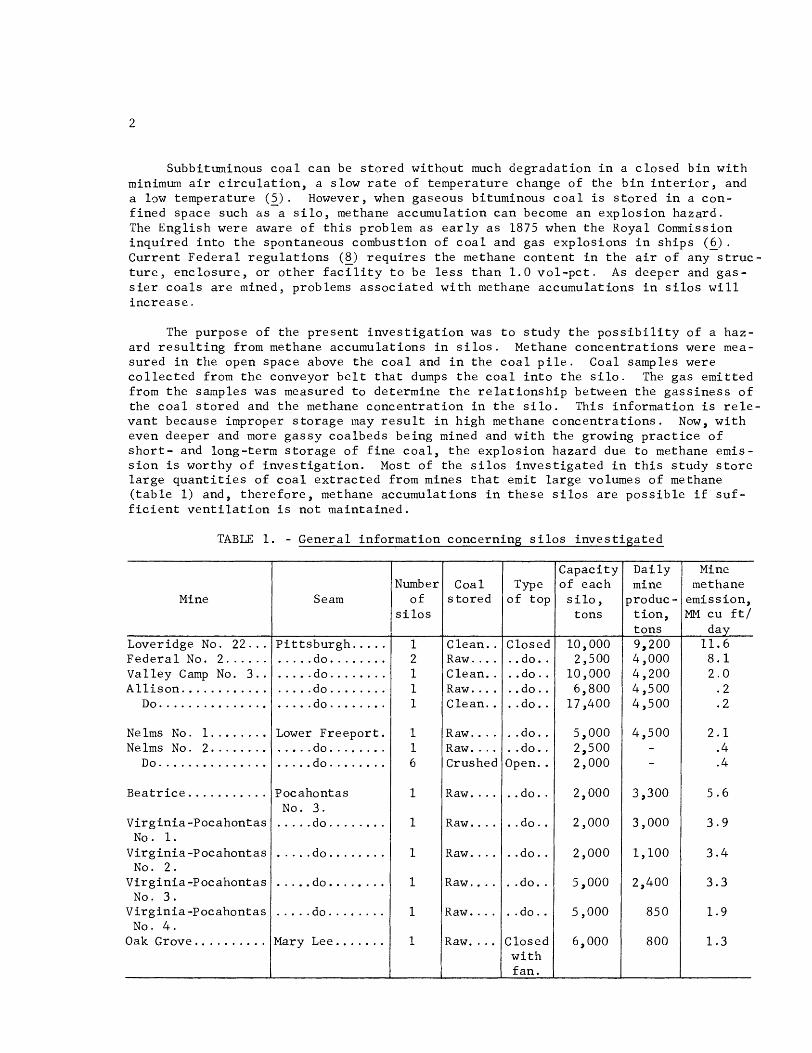
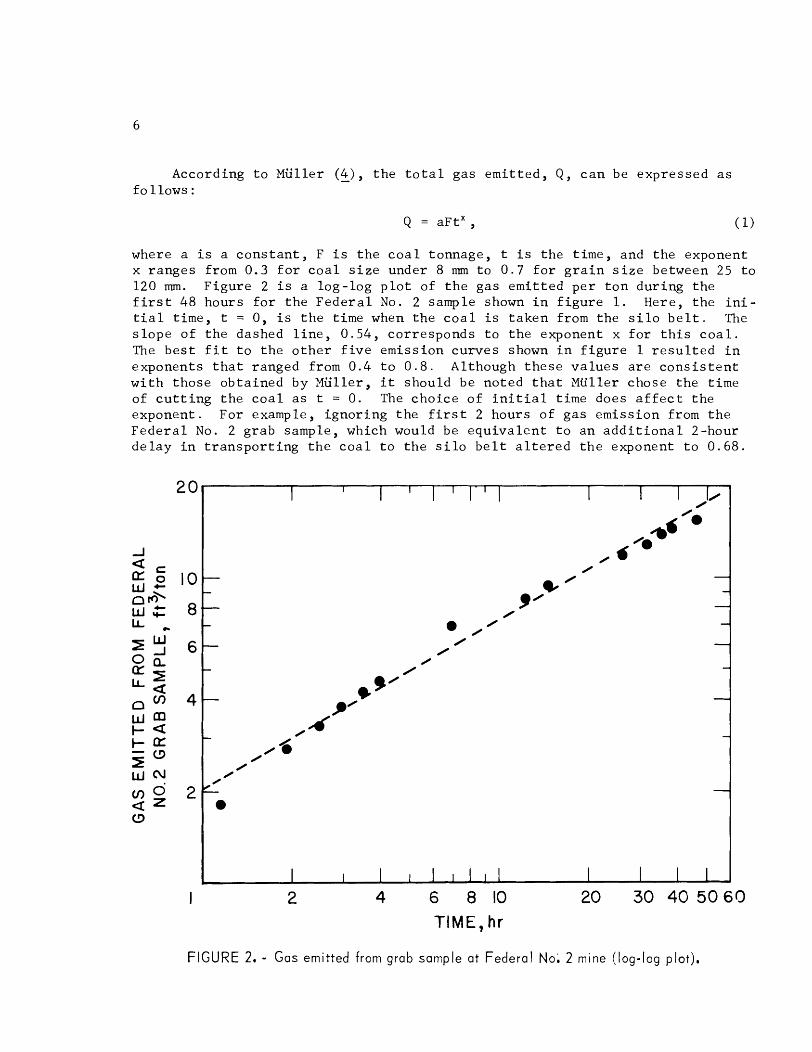
The grab-sample emission curve i n f i g u r e 2 can be used t o es t imate gas emission from the Federa l No. 2 s i l o . Using t h i s emission r a t e f o r t he c o a l and assuming t h a t an empty s i l o i s f i l l e d a t a cons tant r a t e over an 8-hour s h i f t , t he methane emission r a t e from t h e s tored c o a l i s shown i n f i g u r e 3 . Also superimposed i s t he q u a n t i t y of c o a l s tored versus time. The d e r i v a t i o n of t h i s emission curve i s presented i n the appendix. The emission r a t e inc reases wi th time t o the 0.54 power u n t i l the s i l o i s f i l l e d , t hen it begins t o decrease . The h ighes t emission r a t e occurs when the s i l o i s j u s t f i l l e d ; t h a t i s , when the coa l i s g a s s i e s t and t h e quan t i ty s to red i s maximum. Although the maximum gas emission r a t e i s only about 40 cfm, t h i s could r e s u l t i n a l a rge methane concent ra t ion i n a s h o r t time i f proper v e n t i l a t i o n i s not provided.
0 120 240 360 480 600 720 840 960
TIME, min
FIGURE 3. - Calcu la ted gas emission from a coal s i l o using the Federal No. 2 grab sample and
assuming a constant 8-hour f i l l i n g rate.
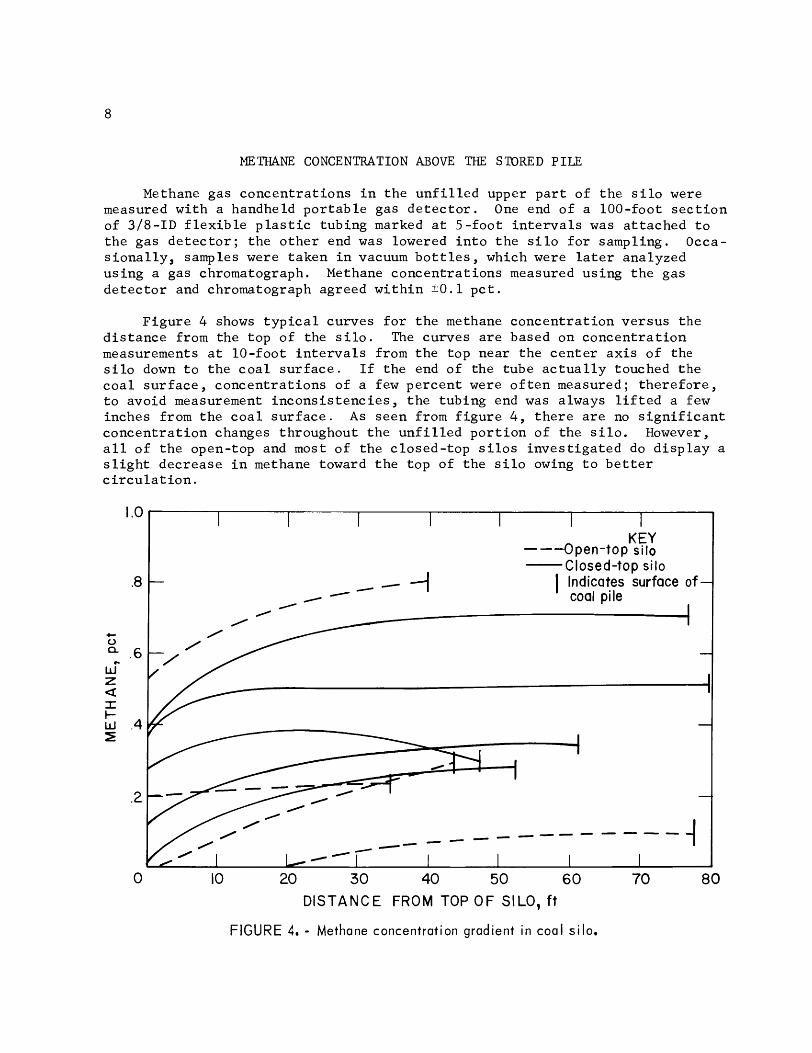
METHANE CONCENTRATION ABOVE THE STORED PILE
Methane gas concent ra t ions i n the u n f i l l e d upper p a r t of t he s i l o were measured with a handheld po r t ab le gas d e t e c t o r . One end of a 100-foot s e c t i o n of 318-ID f l e x i b l e p l a s t i c tubing marked a t 5- foot i n t e r v a l s was a t tached t o t h e gas d e t e c t o r ; t he o the r end was lowered i n t o t h e s i l o f o r sampling. Occa- s i o n a l l y , samples were taken i n vacuum b o t t l e s , which were l a t e r analyzed using a gas chromatograph. Methane concent ra t ions measured using t h e gas de tec to r and chromatograph agreed wi th in '0.1 p c t .
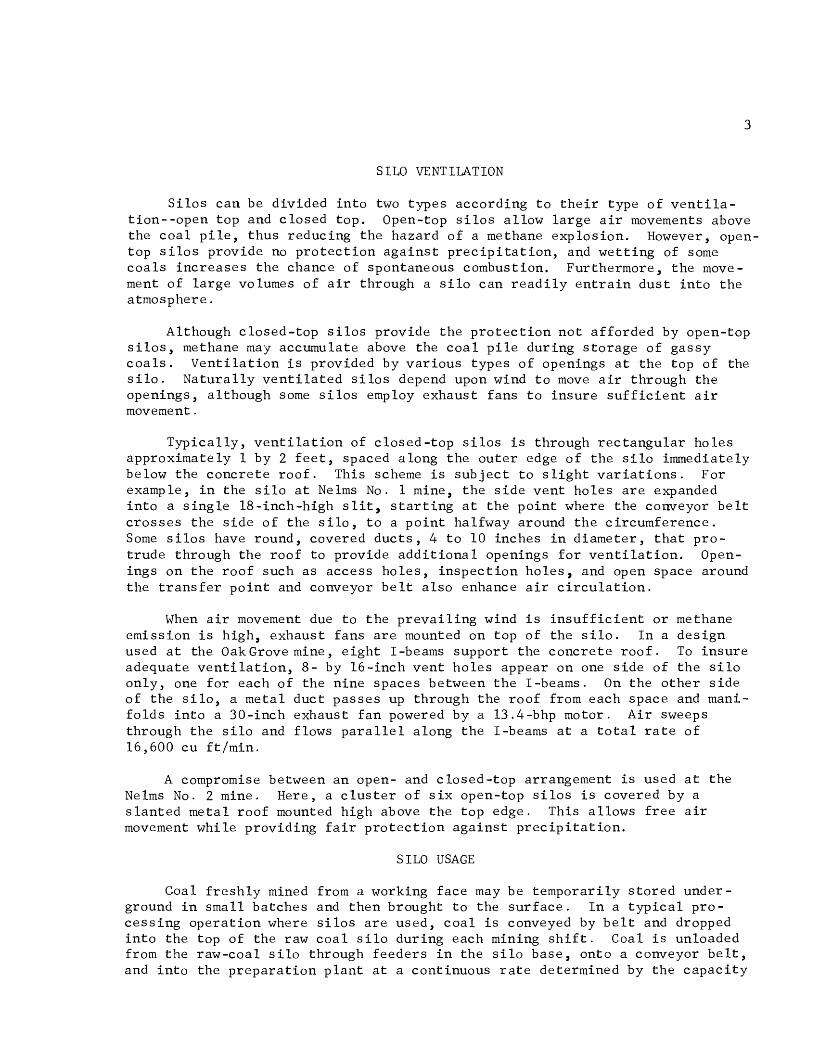
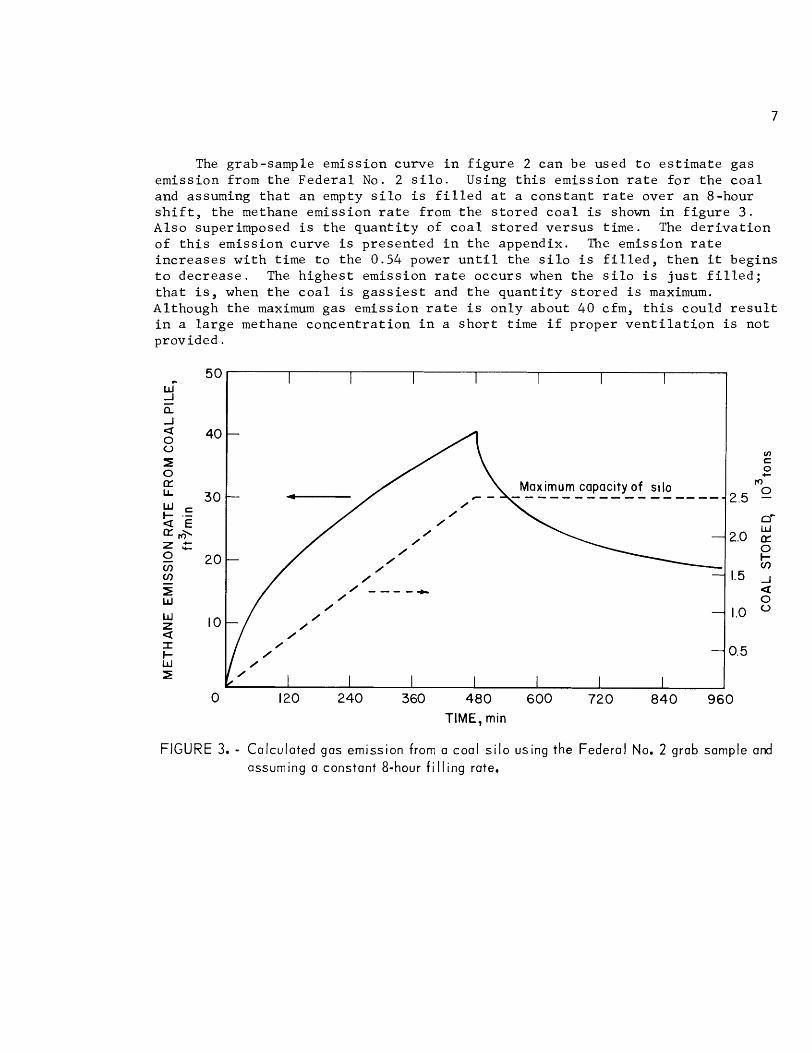
F igure 4 shows t y p i c a l curves f o r t h e methane concent ra t ion versus t h e d i s t ance from the top of the s i l o . The curves a r e based on concent ra t ion measurements a t 10-foot i n t e r v a l s from t h e top near the cen te r a x i s of the s i l o down t o the c o a l su r face . I f t he end of the tube a c t u a l l y touched t h e coa l su r face , concent ra t ions of a few percent were o f t e n measured; t he re fo re , t o avoid measurement incons i s t enc ie s , t h e tubing end was always l i f t e d a few inches from t h e c o a l su r face . A s seen from f i g u r e 4 , t h e r e a r e no s i g n i f i c a n t concent ra t ion changes throughout t h e u n f i l l e d po r t ion of the s i l o . However, a l l of t h e open-top and most of t he closed-top s i l o s inves t iga t ed do d i s p l a y a s l i g h t decrease i n methane toward t h e top of t he s i l o owing t o b e t t e r c i r c u l a t i o n .
0 10 20 30 40 50 60 70 80
DISTANCE FROM TOP OF SILO, f t
I
FIGURE 4. - Methane concentration gradient in coal s i lo.
KEY ---Open-top silo
Closed-top silo - -- -1 I Indicates surface o f -
/ /
/ coal pile
I I -
I -
I I
-
- -------- -I I
I I
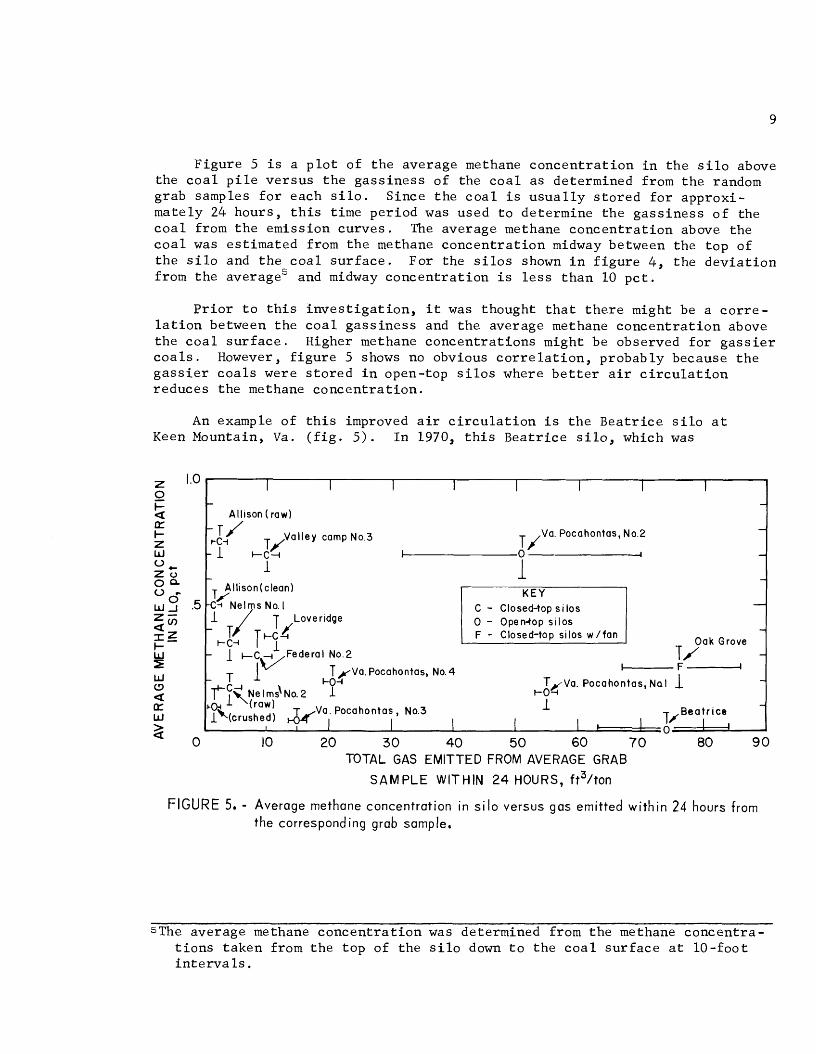
Figu re 5 i s a p l o t of t h e average methane c o n c e n t r a t i o n i n t h e s i l o above t h e c o a l p i l e v e r s u s t h e ga s s ine s s of the c o a l a s determined from t h e random grab samples f o r each s i l o . S ince t h e c o a l i s u s u a l l y s t o r e d f o r approxi - mately 24 hours , t h i s t ime per iod was used t o determine t h e ga s s ine s s o f the c o a l from t h e emission cu rves . The average methane concen t r a t i on above t h e c o a l was es t imated from t h e methane concen t r a t i on midway between the t op of t h e s i l o and t h e c o a l s u r f a c e . For t he s i l o s shown i n f i g u r e 4, t h e d e v i a t i o n from t h e average5 and midway concen t r a t i on i s l e s s t han 10 p c t .
P r i o r t o t h i s i n v e s t i g a t i o n , i t was thought t h a t t h e r e might be a c o r r e - l a t i o n between t h e c o a l ga s s ine s s and t h e average methane c o n c e n t r a t i o n above t h e c o a l s u r f a c e . Higher methane concen t r a t i ons might be observed f o r g a s s i e r c o a l s . However, f i g u r e 5 shows no obvious c o r r e l a t i o n , probably because t h e g a s s i e r c o a l s were s t o r e d i n open-top s i l o s where b e t t e r a i r c i r c u l a t i o n reduces t h e methane concen t r a t i on .
An example of t h i s improved a i r c i r c u l a t i o n i s t h e Bea t r i c e s i l o a t Keen Mountain, Va. ( f i g . 5 ) . I n 1970, t h i s Bea t r i c e s i l o , which was
I 1 1 I I I I 1 - -
y i s o n (raw) - -
Val ley camp No.3 T / Va. Pocahontas, No.2
TJ - 1 I-c-l I 0 I -
1 - - T ~ l l i s o n ( c l e a n )
1 -C+ Nelms No. I
0 - Open-top s i los Closed-top silos w / fan
- T / O ~ ~ Grove -
L F -
T ,Va. Pocahontas. No l 1 - I-o<
(raw) 1 - t 1 I r a o
TOTAL GAS EMITTED FROM AVERAGE GRAB S A M P L E WITHIN 2 4 HOURS, ft3/ton
FIGURE 5. - Average methane concentration in s i l o versus gas emitted wi th in 24 hours from
the correspond ing grab sample.
5The average methane c o n c e n t r a t i o n was determined from t h e methane concent ra - t i o n s t aken from t h e t op of t h e s i l o down t o t h e c o a l s u r f a c e a t 10- foo t i n t e r v a l s .
o r i g i n a l l y cons t ruc t ed a s a c lo sed - top s i l o , exploded. Subsequently, i t was r e c o n s t r u c t e d a s an open-top s i l o , and c u r r e n t t e s t s i n d i c a t e d e s s e n t i a l l y no methane above t h e c o a l .
ME THANE CONCENTRATION W I T H I N THE STORED PILE
To i n v e s t i g a t e t h e methane concen t r a t i on i n t h e c o a l p i l e , a s e c t i o n of po lye thy lene tub ing was extended halfway down i n t o an empty c losed- top s i l o , where i t was bur ied by c o a l a s t h e s i l o was f i l l e d over a n 8-hour p e r i o d . About 2 hours a f t e r t h e s i l o was f i l l e d , a methane c o n c e n t r a t i o n of about 14 p c t was measured i n t h e c o a l p i i e . This i s s i m i l a r t o what one would e s t i m a t e from a methane c a l c u l a t i o n assuming no v e n t i l a t i o n .
Assuming no v e n t i l a t i o n i n t o t h e c o a l p i l e , t h e pe rcen t of methane con- c e n t r a t i o n , C , which i s i n i t i a l l y ze ro , i s governed by t h e fol lowing r e l a t i o n :
where Q , , V , and t a r e t h e gas emission r a t e , f r e e space i n t h e c o a l p i l e , and t ime , r e s p e c t i v e l y . For t he s i l o s t u d i e d , V i s approximately 5 0 , 0 0 0 ~ cu f t , and t he average methane emission during t h e f i r s t 10 hours was about 20 cu f t / m i n . The average methane emission was determined from the random grab samples t aken from t h i s s i l o and us ing equa t i on A-13, g iven i n t h e appendix. Equat ion 2 p r e d i c t s a n approximate methane concen t r a t i on of 21 p c t a f t e r 10 hours .
The f a i r agreement between t h e c a l c u l a t e d and measured concen t r a t i on i n t h e c o a l p i l e i n d i c a t e s t h a t t h e r e was l i t t l e v e n t i l a t i o n throughout t h e p i l e . The methane concen t r a t i on above t h e c o a l p i l e was l e s s t h a n 0 .5 p c t . It appears t h a t a l though t h e methane concen t r a t i on above t he c o a l i s low, l a r g e concen t r a t i ons i n t h e c o a l p i l e may e x i s t .
As noted e a r l i e r , when i n v e s t i g a t i n g t h e a i r space above t h e c o a l p i l e , i f t h e sampling-tube end a c t u a l l y touched t h e c o a l p i l e , methane measurements of a few pe rcen t were ob t a ined . Also, a t some of t h e s i l o s v i s i t e d , t h e workers noted t h a t s i m i l a r methane concen t r a t i ons a r e de t ec t ed below t h e s i l o i n t h e v i c i n i t y of t h e f eede r s when c o a l i s being unloaded from t h e s i l o . S imi l a r problems have been r epo r t ed dur ing s t o c k p i l e ope ra t i ons (7 ) , f u r t h e r i n d i c a t i n g t h a t t h e r e can be high methane concen t r a t i ons w i t h i n tKe c o a l p i l e .
Large methane concen t r a t i ons i n t h e c o a l p i l e might gene ra t e an exp los ive atmosphere below the s i l o dur ing rec la iming ope ra t i ons i f proper v e n t i l a t i o n i s n o t main ta ined . A t t he Val ley Camp No. 3 mine i n West V i rg in i a , two 10,000- cu f t / m i n exhaust f ans f o r c e a i r i n t o t h e v i c i n i t y of t h e f e e d e r s , reduc ing t h e methane c o n c e n t r a t i o n below 1 p c t dur ing rec la iming ope ra t i ons . The f a n s o p e r a t e s imul taneous ly w i th t h e conveyor b e l t t h a t unloads c o a l ou t of t he s i l o .
^The f r e e space i n t h e c o a l p i l e was determined by c a l c u l a t i n g t h e empty v o l - ume of the s i l o minus t h e volume of c o a l s t o r e d us ing 1 . 3 g/cu cm a s t he d e n s i t y .
Although t h i s i n v e s t i g a t i o n was designed t o s tudy t h e p o s s i b i l i t y of hazardous methane concen t r a t i ons i n and above the c o a l p i l e , it appears now t h a t a followup s tudy of the s i l o rec la iming a r e a i s a l s o war ran ted .
CONC LUS IONS
1. Even f o r s t o r e d gassy c o a l s , open-top s i l o s appear t o provide s u f f i - c i e n t v e n t i l a t i o n above t he c o a l t o keep t he methane c o n c e n t r a t i o n f a r below 1 p c t . I f degrada t ion of the c o a l i s a concern, a s l a n t e d meta l roof of t h e s o r t used a t t he Nelms No. 2 mine can prov ide p r o t e c t i o n whi le main ta in ing good v e n t i l a t i o n .
2 . High methane concen t r a t i ons can e x i s t i n t he c o a l p i l e . It i s pos- s i b l e t h a t t h i s gas i s r e l e a s e d dur ing rec la iming o p e r a t i o n s , r e s u l t i n g i n h igh concen t r a t i ons below t h e s i l o i f t h i s a r e a i s no t v e n t i l a t e d p rope r ly . However, t o s u b s t a n t i a t e t h i s , f u r t h e r r e s e a r c h i s r e q u i r e d .
Bark ley , J . *R. The S t o r a g e o f C o a l . BuMines I C 7235, 1943, 14 pp.
F l i igge , G . Methane Gas Emiss ions Dur ing Mining and Hau l ing . G luckauf , v . 25 , May 1972, 7 p p .
K i s s e l l , F . N . , C . M. McCulloch, and C . H . E l d e r . The D i r e c t Method o f De te rmin ing C o n t e n t s of Coalbeds f o r V e n t i l a t i o n Design. BuMines R I 7767, 1973, 17 pp .
Mii l le r , H . R e s t g a s i n h a l t und Ausgasung d e r F z r d e r k o h l e ( R e s i d u a l and E m i t t e d Gas Dur ing Coal H a u l a g e ) . Ph.D. D i s s e r t a t i o n , Tech. Univ. B e r l i n , B e r l i n , Germany, 1966, 162 p p .
P a r r y , V . F . , and J . B . Goodman. S t o r a g e of Subbi tuminous Coa l i n B i n s . BuMines R I 3587, 1941, 1 0 pp.
Rowan, T. Spontaneous Combustion and E x p l o s i o n s O c c u r r i n g i n C o a l Cargoes : T h e i r T rea tmen t and P r e v e n t i o n . E. and F . N . Spon, London, 1882, 97 pp .
S t a h l , R . W . , and C . J . D a l z e l l . Recommended S a f e t y P r e c a u t i o n s f o r A c t i v e Coa l S t o c k P i l i n g and Rec la iming O p e r a t i o n s . BuMines I C 8256, 1965, 7 p p .
U.S. Code o f F e d e r a l R e g u l a t i o n s . T i t l e 30--Minera l R e s o u r c e s ; C h a p t e r I-- Mining Enforcement and S a f e t y A d m i n i s t r a t i o n ; Subchap te r 0- -Coal Mine H e a l t h and S a f e t y ; P a r t 77--Mandatory S a f e t y S t a n d a r d s , S u r f a c e Coa l Mines and S u r f a c e Work Areas of Underground Coal Mines . F e d e r a l R e g i s t e r , v . 39 , No. 126, June 28 , 1974, pp . 24006-24008.
3 T i t l e e n c l o s e d i n p a r e n t h e s e s i s t r a n s l a t i o n from t h e language i n which t h e i t e m was o r i g i n a l l y p u b l i s h e d .
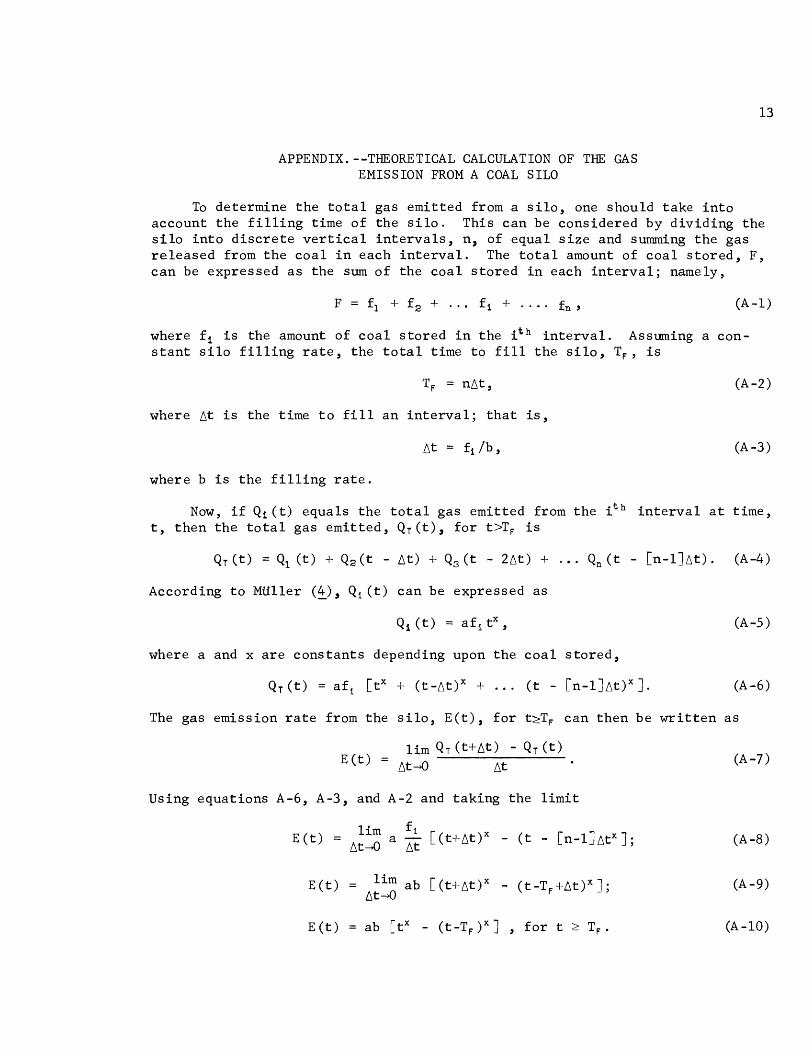
APPENDIX. - -THEORE TICAL CALCULATION OF THE GAS EMISSION FROM A COAL SILO
To determine t h e t o t a l gas emit ted from a s i l o , one should take i n t o account the f i l l i n g time of the s i l o . This can be considered by d iv id ing the s i l o i n t o d i s c r e t e v e r t i c a l i n t e r v a l s , n, of equal s i z e and summing the gas r e l eased from t h e c o a l i n each i n t e r v a l . The t o t a l amount of c o a l s to red , F, can be expressed a s the sum of the coa l s to red i n each i n t e r v a l ; namely,
where f i i s the amount of c o a l s to red i n the ith i n t e r v a l . Assuming a con- s t a n t s i l o f i l l i n g r a t e , the t o t a l time t o f i l l t h e s i l o , T F , i s
where A t i s the time t o f i l l an i n t e r v a l ; t h a t i s ,
where b i s t h e f i l l i n g r a t e .
Now, i f Qi ( t ) equals t he t o t a l gas emitted from the ith i n t e r v a l a t t ime, t , then t h e t o t a l gas emi t ted , Q r ( t ) , f o r t>TF i s
Q~ ( t ) = Ql ( t ) + Q2 ( t - At) + Q3 ( t - 2At) + . . . Qn ( t - [ n - l l ~ t ) . (A-4)
According t o Miiller (4) , - Q , ( t ) can be expressed a s
Qi ( t ) = a f , tX,
where a and x a r e cons tants depending upon the c o a l s to red ,
Q T ( t ) = a f , [tX + ( t - ~ t ) ~ + . . . ( t - [ n - l ] ~ t ) ~ 1. (A-6)
The gas emission r a t e from the s i l o , E ( t ) , f o r t>TF can then be w r i t t e n a s
Using equat ions A-6, A-3, and A-2 and tak ing the l i m i t
E ( t ) = ab [tX - ( t -TF) ' ] , f o r t r T F .
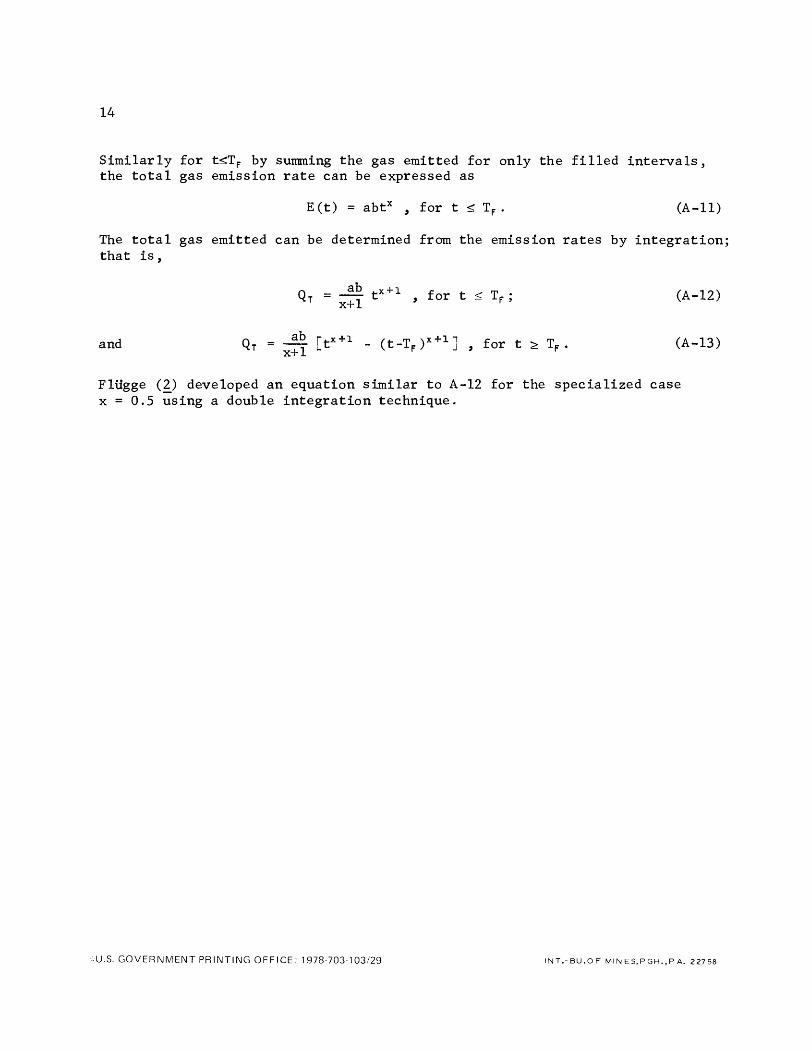
S i m i l a r l y f o r t<TF by summing t h e gas emitted f o r only t h e f i l l e d i n t e r v a l s , t he t o t a l gas emission r a t e can be expressed a s
E ( t ) = ab tX , f o r t s TF . (A-11)
The t o t a l gas emit ted can be determined from t h e emission r a t e s by i n t e g r a t i o n ; t h a t i s ,
ab Q~ = - t x + l , f o r t I TF;
x+l (A-12)
and ab [tX+l - ( t -T,)X+l] , f o r t 2 T F . QT =
Fliigge (2) developed an equat ion s i m i l a r t o A-12 f o r t he spec ia l i zed case x = 0.5 us ing a double i n t e g r a t i o n technique.
-U.S. GOVERNMENT PRINTING OFFICE: 1978-703-103129