Methane Emission Management Emission... · Presentation at the KMG III Annual General Directors HSE...
12
Methane Emission Management: Regional and international experiences Presentation at the KMG III Annual General Directors HSE Leadership forum «GREAT SAFETY LEADERSHIP» Astana 28 th June 2017 Torleif Haugland , Carbon Limits
Transcript of Methane Emission Management Emission... · Presentation at the KMG III Annual General Directors HSE...

Methane Emission Management: Regional and international experiences
Presentation at the KMG III Annual General Directors HSE Leadership forum
«GREAT SAFETY LEADERSHIP»
Astana 28th June 2017
Torleif Haugland , Carbon Limits

Carbon Limits – Methane and Gas flaring experience
CARBON LIMITS – METHANE AND GAS FLARING PROJECTS
- Consulting company based in Oslo
- 10 years + experience on GHG emissions in the
oil and gas sector in 20 + countries
- Provide a number of services including emission
reduction project identification and assessment
- Worked on methane emissions for the last 5
Years
SOME OF OUR CURRENT CLIENTS AND PARTNERS
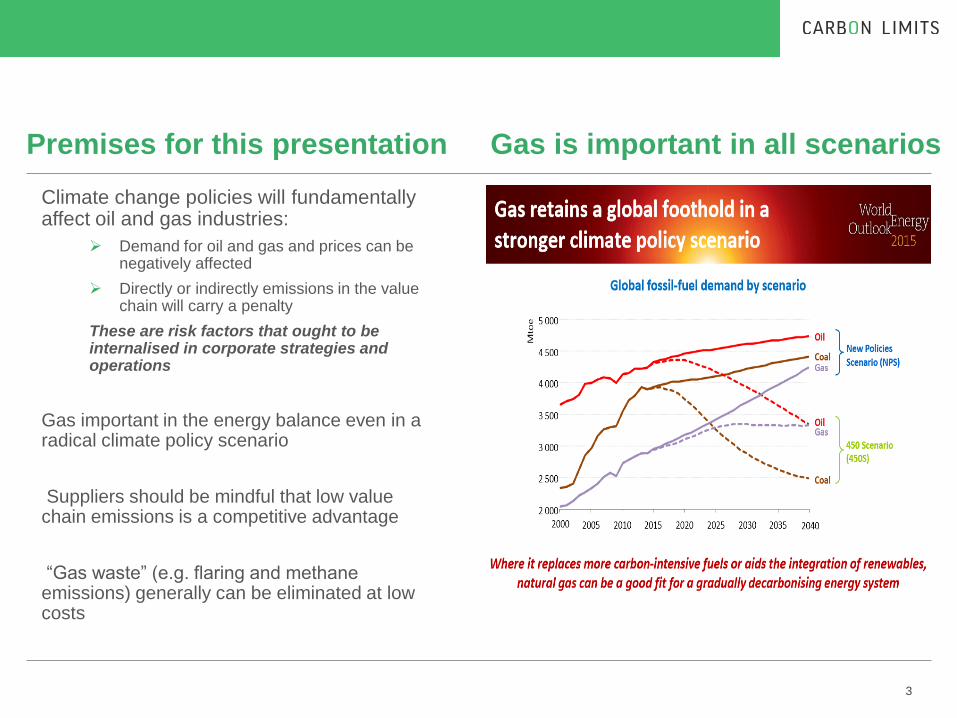
Gas is important in all scenarios
3
Premises for this presentation
Climate change policies will fundamentally affect oil and gas industries:
Demand for oil and gas and prices can be negatively affected
Directly or indirectly emissions in the value chain will carry a penalty
These are risk factors that ought to be internalised in corporate strategies and operations
Gas important in the energy balance even in a radical climate policy scenario
Suppliers should be mindful that low value chain emissions is a competitive advantage
“Gas waste” (e.g. flaring and methane emissions) generally can be eliminated at low costs

0
200
400
600
800
1000
1200
1400
1600
1800
Gas flaring Venting and Fugitiveemissions
But much gas is wasted and creates environmental pressures
4
Wasted energy: 250 bcm/year
4% of global greenhouse gas emissions
Direct emissions of methane:
equals Norway’s production of natural gas, worlds 7th largest producer
30 billion US$ per annum in lost revenues
Direct methane
emissions
Mill
ion
t C
O2
eq

Gas does not always have lower emissions than coal
5
Factors that matter:
Distance to end use markets
Efficiency of compressors and
other upstream
Leak rates

Current methane
emissions by region
6
However current methane emissions
are uncertain due to the lack of
measurement data in a number of
regions
0
50
100
150
200
250
300
350
400
450
Russia Caspian US EU
MtC
O2eq
(G
WP
100 y
ears
)
2012 2020 2030
Reducing emissions
is cost-effective
0% 20% 40% 60% 80% 100%
Canada
Mexico
Kazakhstan
US
Economic abatement potential Other abatement potential
Past studies have demonstrated that a large
share of the abatement potential is economic
or low abatement cost (<10 USD/tCO2eq).
Main opportunities are country specific but
include:
• Liquid storage tanks
• Repairs of fugitives leaks
• Compressors seals,
• …
* Caspian includes Kazakhstan,
Azerbaijan and Turkmenistan
** Kazakhstan contributes to around
35% - 40% of the caspian methane

Methane Mitigation Opportunities at KMG
7
Methane Mitigation Opportunity
In total, KMG’s mitigation opportunity is
~132 MM m3/year, or
~2.3 million tons of CO2/year,
in global warming potential.
Major Identified Sources for KMG
MM m3/y tCO2eq/y
Leaks (A) 15,6 250 000
Storage tanks (B) 34 610 000
Centrif. Compress. (C) 25,4 450 000
Blowdown sources (D) 45,7 830 000
Others 11,5 160 000
Total 132 2 300 000

Methane emission reduction
projects for KMG
8
Project type
A - Leak detection and repair (LDAR)
B - Vapor Recovery Units Storage Tanks
By project By KMG total By project By KMG total
Capex range Less than
200kUS$
1,3 million US$
(~ 10 companies x
$120
kUSD/equipment
set)
200k to 1 million
US$
per tank farm
8 million US$
(~ 40 tank farms x
$200k/tank farm)
Payback time A few months 2 years 1 to 4 years 4 years
EP, KTG, KTO, RM EP, RM
MM m3/y tCO2eq/y
Leaks (A) 15,6 250 000
Storage tanks (B) 34 610 000
Centrif. Compress. (C) 25,4 450 000
Blowdown sources (D) 45,7 830 000
Others 11,5 160 000
Total 132 2 300 000

Methane emission reduction
projects for KMG
9
Project type
C - Wet Seal Compressors
D -Mobile Compressors
By
project By KMG total By project By KMG total
Capex range
100k to 1 million
US$
per compressor
2,7 million US$
(~109K USD x
25 KC)
6 million per unit
60 million US$
(10 mobile compressor
stations X $6M USD/MCS) -
to avoid blowdown during
the 5 pipeline repairs per
year
Payback
time 1 to 5 years 3 years 10 to 12 years 12 years
KTG KTG
MM m3/y tCO2eq/y
Leaks (A) 15,6 250 000
Storage tanks (B) 34 610 000
Centrif. Compress. (C) 25,4 450 000
Blowdown sources (D) 45,7 830 000
Others 11,5 160 000
Total 132 2 300 000

10
0
200
400
600
800
1000
1200
LDAR,1 MMm3 saved
VRU,1.3 MMm3 saved
Wet seal degassing,1 MMm3 saved
Net p
rese
nt va
lue
, th
ou
sa
nd
US
D
IRR
66% IRR
45%
IRR
38%
CAPEX
Project returns
Add returns with 5
USD/tonne CO2e
Based on CL measurements and assessment of sites in Kazakhstan
Even with modest valuation, GHG benefits are substantial
compared to the value of recoverable gas. Project cases in Kazakhstan.
Value of natural gas versus value of GHG benefits at US$ 5 per tonne CO2e in methane emission reduction
projects.

Old and new opportunities for selling “carbon credit off-sets”
2020 2012 2019 2021 2029
Offsets (CDM or ISO) to be sold at voluntary
market or into national ETS schemes
Voluntary offset schemes
Paris Agreement Article 6 schemes UERs
Article 6 of the Paris Agreement: Two schemes
Article 6.4 - a project based mechanism, probably with similarities to the CDM, but modified and possibly
simplified. Still, with approval and issuance procedures managed by UNFCC.
Article 6.2 – “Internationally Transferable Mitigation Outcomes” (ITMOs). Bilateral agreements on
transactions between countries (Paris Agreement Parties). General oversight by UNFCCC to ensure
environmental integrity and that “double counting” does not occur. “Bottom-up” approach.
UERs: Carbon credits under the EU Fuel Quality Standards.
Fuel supplier in the EU are obliged to reduce carbon intensity by 6% from 2010 to 2020. They can blend in bio-fuel
and use hydrogen and electricity, and /or they can obtain carbon credits from upstream projects

Final remarks
12
International climate policy will fundamentally
impact framework conditions for oil and gas sector
operations. Creates risks and opportunities
End use consumers will increasingly consider
supply chain emissions of the products they buy.
There will be a call for documentation of carbon
footprint of oil and gas supplies.
KMG has ample opportunities for supply chain
emission reductions, of which a large part can be
done at no net-costs.
Opportunities exist for monetizing emission
reductions, and documentation of emission
reduction efforts have considerable reputational
value.