Meter Any Wire, Anywhere by Virtualizing the Voltage...
6
Meter Any Wire, Anywhere by Virtualizing the Voltage Channel Thomas Schmid † , David Culler ‡ , Prabal Dutta † † Computer Science & Engineering Division ‡ Computer Science Division University of Michigan University of California, Berkeley Ann Arbor, MI 48109 Berkeley, CA 94720 {thschmid, prabal}@eecs.umich.edu [email protected] Abstract AC power meters require both voltage and current to be sampled concurrently to obtain real, reactive, and apparent power. Typically, the two measurements are taken in close physical proximity and fed into a single power metering de- vice. In this paper, we explore the viability of decoupling the voltage and current channels, and placing them in phys- ically disparate locations. Such decoupling could ease the installation of metering infrastructure and enable new sens- ing scenarios. However, decoupling the voltage and current channels raises a new question: how should they be recom- bined? Of the various approaches, we propose the voltage channel be virtualized: a voltage sensor measures the volt- age magnitude, frequency, and phase, typically near the root of a circuit branch. The extracted phase is time-stamped rela- tive to a global clock and disseminated wirelessly, along with the magnitude and frequency measurements, to power meters throughout the network. The power meters synthesize a suit- ably scaled replica of the voltage waveform locally, based on the parameters reported by the voltage sensor, and combine it with locally-measured current readings. This paper demon- strates – through empirical characterization of the line volt- ages, a proof-of-concept power meter implementation, and house-scale evaluation – that the design holds promise and offers substantially lower measurement errors than other dis- tributed power metering approaches for non-resistive loads. Categories and Subject Descriptors H.4 [Information Systems Applications]: General General Terms Design, Measurement, Performance Keywords Energy metering, power factor measurement, time syn- chronization, wireless sensing Permission to make digital or hard copies of all or part of this work for personal or classroom use is granted without fee provided that copies are not made or distributed for profit or commercial advantage and that copies bear this notice and the full citation on the first page. To copy otherwise, to republish, to post on servers or to redistribute to lists, requires prior specific permission and/or a fee. BuildSys’10, November 2, 2010, Z¨ urich, Switzerland. Copyright c 2010 ACM 978-1-4503-0458-0/10/11/02...$10.00 1 Introduction Today, in-building power measurements are usually cen- tralized (e.g. in breaker box) or distributed (e.g. at a plug load). The former provides full coverage over the aggregate load while the latter provides detailed coverage of only in- strumented loads [8, 11]. In this paper, we argue that these two design points are too restrictive, and that a richer set of emerging power metering options [9, 13] would be greatly aided if only the current and voltage channels could be de- coupled and placed individually at physically distinct loca- tions. However, na¨ ıvely placing current and voltage sensors throughout a house is not practical today because these sig- nals must be recombined to obtain power measurements. For example, allocating line losses to the responsible loads in a house requires measuring voltage at the service entry point but current at the load (measuring both current and voltage at the load fails to account for wiring losses in the house). As another example, measuring whole house cur- rent is easy if measured outdoors, using a split-core current transformer attached to the service drip loop, but voltage is difficult to access outdoors. Conversely, voltage is easy to measure indoors, but access to whole house current may be difficult since feeds are often encased in conduits or hidden behind circuit breaker panels. A power meter that allows the current and voltage channels to be decoupled and virtualized enables these and many other measurement scenarios. To explore these new measurement scenarios, we present a distributed power meter that decouples the current and volt- age channels, allowing each to be measured in the most ex- pedient manner for a particular application, and recombines them using a low-rate wireless channel. Our design mea- sures the magnitude, frequency, and phase of the line volt- age using a voltage sensor typically placed near the the root of the circuit subtree (e.g. near a building’s service meter). The voltage sensor disseminates the voltage parameters over a wireless network to one or more power meters (e.g. a drip loop meter or plug load meter). The power meters locally synthesize a suitably scaled replica of the voltage waveform, based on the parameters reported by the voltage sensor, and combine the synthesized voltage with current measurements from a locally-connected current sensor to compute real, re- active, and apparent power. Among its many benefits, this design enables novel sensing scenarios, simplifies installa- tion, and can proportionally allocate wiring losses to loads.
Transcript of Meter Any Wire, Anywhere by Virtualizing the Voltage...

Meter Any Wire, Anywhere by Virtualizing the Voltage Channel
Thomas Schmid†, David Culler‡, Prabal Dutta†
†Computer Science & Engineering Division ‡Computer Science DivisionUniversity of Michigan University of California, BerkeleyAnn Arbor, MI 48109 Berkeley, CA 94720
{thschmid, prabal}@eecs.umich.edu [email protected]
AbstractAC power meters require both voltage and current to be
sampled concurrently to obtain real, reactive, and apparentpower. Typically, the two measurements are taken in closephysical proximity and fed into a single power metering de-vice. In this paper, we explore the viability of decouplingthe voltage and current channels, and placing them in phys-ically disparate locations. Such decoupling could ease theinstallation of metering infrastructure and enable new sens-ing scenarios. However, decoupling the voltage and currentchannels raises a new question: how should they be recom-bined? Of the various approaches, we propose the voltagechannel be virtualized: a voltage sensor measures the volt-age magnitude, frequency, and phase, typically near the rootof a circuit branch. The extracted phase is time-stamped rela-tive to a global clock and disseminated wirelessly, along withthe magnitude and frequency measurements, to power metersthroughout the network. The power meters synthesize a suit-ably scaled replica of the voltage waveform locally, based onthe parameters reported by the voltage sensor, and combine itwith locally-measured current readings. This paper demon-strates – through empirical characterization of the line volt-ages, a proof-of-concept power meter implementation, andhouse-scale evaluation – that the design holds promise andoffers substantially lower measurement errors than other dis-tributed power metering approaches for non-resistive loads.Categories and Subject Descriptors
H.4 [Information Systems Applications]: GeneralGeneral Terms
Design, Measurement, PerformanceKeywords
Energy metering, power factor measurement, time syn-chronization, wireless sensing
Permission to make digital or hard copies of all or part of this work for personal orclassroom use is granted without fee provided that copies are not made or distributedfor profit or commercial advantage and that copies bear this notice and the full citationon the first page. To copy otherwise, to republish, to post on servers or to redistributeto lists, requires prior specific permission and/or a fee.
BuildSys’10, November 2, 2010, Zurich, Switzerland.
Copyright c© 2010 ACM 978-1-4503-0458-0/10/11/02...$10.00
1 IntroductionToday, in-building power measurements are usually cen-
tralized (e.g. in breaker box) or distributed (e.g. at a plugload). The former provides full coverage over the aggregateload while the latter provides detailed coverage of only in-strumented loads [8, 11]. In this paper, we argue that thesetwo design points are too restrictive, and that a richer set ofemerging power metering options [9, 13] would be greatlyaided if only the current and voltage channels could be de-coupled and placed individually at physically distinct loca-tions. However, naıvely placing current and voltage sensorsthroughout a house is not practical today because these sig-nals must be recombined to obtain power measurements.
For example, allocating line losses to the responsibleloads in a house requires measuring voltage at the serviceentry point but current at the load (measuring both currentand voltage at the load fails to account for wiring losses inthe house). As another example, measuring whole house cur-rent is easy if measured outdoors, using a split-core currenttransformer attached to the service drip loop, but voltage isdifficult to access outdoors. Conversely, voltage is easy tomeasure indoors, but access to whole house current may bedifficult since feeds are often encased in conduits or hiddenbehind circuit breaker panels. A power meter that allows thecurrent and voltage channels to be decoupled and virtualizedenables these and many other measurement scenarios.
To explore these new measurement scenarios, we presenta distributed power meter that decouples the current and volt-age channels, allowing each to be measured in the most ex-pedient manner for a particular application, and recombinesthem using a low-rate wireless channel. Our design mea-sures the magnitude, frequency, and phase of the line volt-age using a voltage sensor typically placed near the the rootof the circuit subtree (e.g. near a building’s service meter).The voltage sensor disseminates the voltage parameters overa wireless network to one or more power meters (e.g. a driploop meter or plug load meter). The power meters locallysynthesize a suitably scaled replica of the voltage waveform,based on the parameters reported by the voltage sensor, andcombine the synthesized voltage with current measurementsfrom a locally-connected current sensor to compute real, re-active, and apparent power. Among its many benefits, thisdesign enables novel sensing scenarios, simplifies installa-tion, and can proportionally allocate wiring losses to loads.
servicecap
serv
ice
mas
t
serviceentrance
conductors
driploop
service dropconductors
splices
currenttransformers
(a) Drip loop sensing. (b) Line losses.
-0.6
-0.4
-0.2
0
0.2
0.4
0.6
-40 -20 0 20 40-200
-150
-100
-50
0
50
100
150
200
Cu
rren
t [A
]
Vo
ltag
e [V
]
Time [ms]
Current and Voltage Profile of an Apple 85-Watt Macbook
Current Voltage
(c) MacBook power profile.
Load
Voltage Measurement(Yellow, Red)
CT(Blue)
Voltage SensorNode
Synthesizing Voltage Node(Green)
Time Sync &Freq. Information
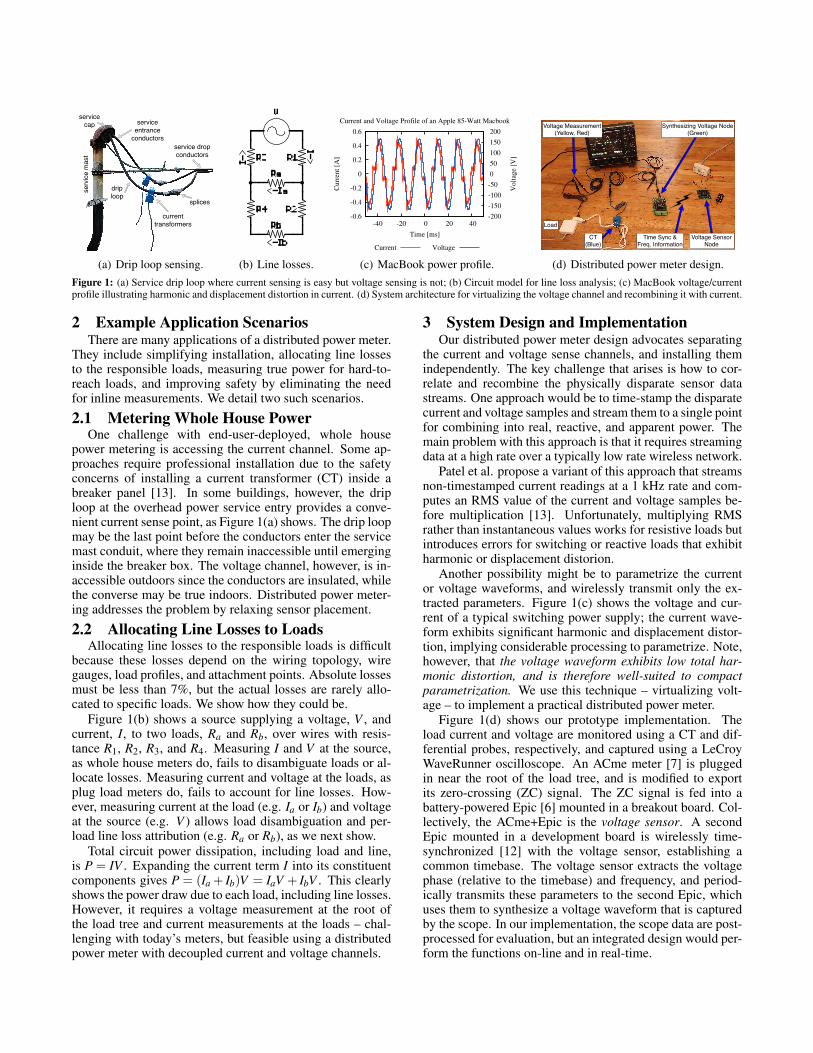
(d) Distributed power meter design.Figure 1: (a) Service drip loop where current sensing is easy but voltage sensing is not; (b) Circuit model for line loss analysis; (c) MacBook voltage/currentprofile illustrating harmonic and displacement distortion in current. (d) System architecture for virtualizing the voltage channel and recombining it with current.
2 Example Application ScenariosThere are many applications of a distributed power meter.
They include simplifying installation, allocating line lossesto the responsible loads, measuring true power for hard-to-reach loads, and improving safety by eliminating the needfor inline measurements. We detail two such scenarios.
2.1 Metering Whole House PowerOne challenge with end-user-deployed, whole house
power metering is accessing the current channel. Some ap-proaches require professional installation due to the safetyconcerns of installing a current transformer (CT) inside abreaker panel [13]. In some buildings, however, the driploop at the overhead power service entry provides a conve-nient current sense point, as Figure 1(a) shows. The drip loopmay be the last point before the conductors enter the servicemast conduit, where they remain inaccessible until emerginginside the breaker box. The voltage channel, however, is in-accessible outdoors since the conductors are insulated, whilethe converse may be true indoors. Distributed power meter-ing addresses the problem by relaxing sensor placement.
2.2 Allocating Line Losses to LoadsAllocating line losses to the responsible loads is difficult
because these losses depend on the wiring topology, wiregauges, load profiles, and attachment points. Absolute lossesmust be less than 7%, but the actual losses are rarely allo-cated to specific loads. We show how they could be.
Figure 1(b) shows a source supplying a voltage, V , andcurrent, I, to two loads, Ra and Rb, over wires with resis-tance R1, R2, R3, and R4. Measuring I and V at the source,as whole house meters do, fails to disambiguate loads or al-locate losses. Measuring current and voltage at the loads, asplug load meters do, fails to account for line losses. How-ever, measuring current at the load (e.g. Ia or Ib) and voltageat the source (e.g. V ) allows load disambiguation and per-load line loss attribution (e.g. Ra or Rb), as we next show.
Total circuit power dissipation, including load and line,is P = IV . Expanding the current term I into its constituentcomponents gives P = (Ia + Ib)V = IaV + IbV . This clearlyshows the power draw due to each load, including line losses.However, it requires a voltage measurement at the root ofthe load tree and current measurements at the loads – chal-lenging with today’s meters, but feasible using a distributedpower meter with decoupled current and voltage channels.
3 System Design and ImplementationOur distributed power meter design advocates separating
the current and voltage sense channels, and installing themindependently. The key challenge that arises is how to cor-relate and recombine the physically disparate sensor datastreams. One approach would be to time-stamp the disparatecurrent and voltage samples and stream them to a single pointfor combining into real, reactive, and apparent power. Themain problem with this approach is that it requires streamingdata at a high rate over a typically low rate wireless network.
Patel et al. propose a variant of this approach that streamsnon-timestamped current readings at a 1 kHz rate and com-putes an RMS value of the current and voltage samples be-fore multiplication [13]. Unfortunately, multiplying RMSrather than instantaneous values works for resistive loads butintroduces errors for switching or reactive loads that exhibitharmonic or displacement distorion.
Another possibility might be to parametrize the currentor voltage waveforms, and wirelessly transmit only the ex-tracted parameters. Figure 1(c) shows the voltage and cur-rent of a typical switching power supply; the current wave-form exhibits significant harmonic and displacement distor-tion, implying considerable processing to parametrize. Note,however, that the voltage waveform exhibits low total har-monic distortion, and is therefore well-suited to compactparametrization. We use this technique – virtualizing volt-age – to implement a practical distributed power meter.
Figure 1(d) shows our prototype implementation. Theload current and voltage are monitored using a CT and dif-ferential probes, respectively, and captured using a LeCroyWaveRunner oscilloscope. An ACme meter [7] is pluggedin near the root of the load tree, and is modified to exportits zero-crossing (ZC) signal. The ZC signal is fed into abattery-powered Epic [6] mounted in a breakout board. Col-lectively, the ACme+Epic is the voltage sensor. A secondEpic mounted in a development board is wirelessly time-synchronized [12] with the voltage sensor, establishing acommon timebase. The voltage sensor extracts the voltagephase (relative to the timebase) and frequency, and period-ically transmits these parameters to the second Epic, whichuses them to synthesize a voltage waveform that is capturedby the scope. In our implementation, the scope data are post-processed for evaluation, but an integrated design would per-form the functions on-line and in real-time.
-200
-100
0
100
200
-20 -10 0 10 20
Volt
age
[V]
Time [ms]
Total Load 0.5 kWh
C1C2
C3C4
(a) Light 0.5 kWh total load.
-200
-100
0
100
200
-20 -10 0 10 20
Volt
age
[V]
Time [ms]
Circuit 1 Loaded with 1.4 kWh
C1C2
C3C4
(b) Large 1.4 kWh load near C1.
-200
-100
0
100
200
-20 -10 0 10 20
Volt
age
[V]
Time [ms]
On independend Circuit 2.4 kWh Load
C1C2
C3C4
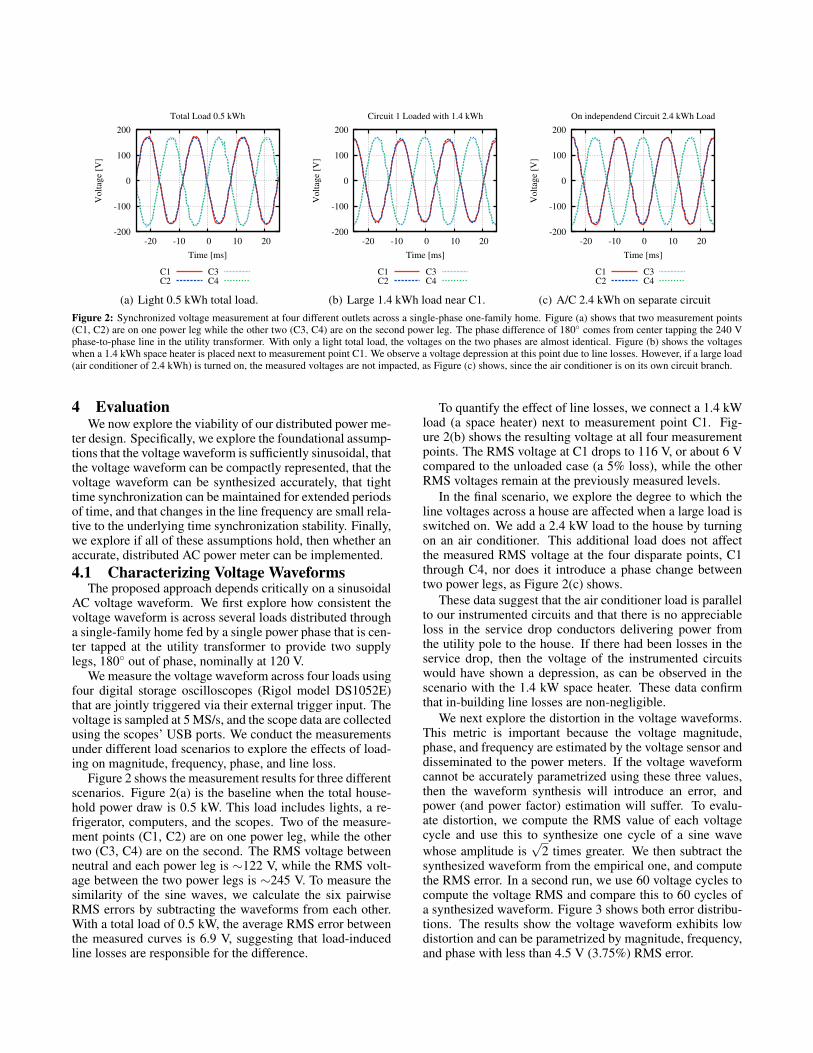
(c) A/C 2.4 kWh on separate circuitFigure 2: Synchronized voltage measurement at four different outlets across a single-phase one-family home. Figure (a) shows that two measurement points(C1, C2) are on one power leg while the other two (C3, C4) are on the second power leg. The phase difference of 180◦ comes from center tapping the 240 Vphase-to-phase line in the utility transformer. With only a light total load, the voltages on the two phases are almost identical. Figure (b) shows the voltageswhen a 1.4 kWh space heater is placed next to measurement point C1. We observe a voltage depression at this point due to line losses. However, if a large load(air conditioner of 2.4 kWh) is turned on, the measured voltages are not impacted, as Figure (c) shows, since the air conditioner is on its own circuit branch.
4 EvaluationWe now explore the viability of our distributed power me-
ter design. Specifically, we explore the foundational assump-tions that the voltage waveform is sufficiently sinusoidal, thatthe voltage waveform can be compactly represented, that thevoltage waveform can be synthesized accurately, that tighttime synchronization can be maintained for extended periodsof time, and that changes in the line frequency are small rela-tive to the underlying time synchronization stability. Finally,we explore if all of these assumptions hold, then whether anaccurate, distributed AC power meter can be implemented.4.1 Characterizing Voltage Waveforms
The proposed approach depends critically on a sinusoidalAC voltage waveform. We first explore how consistent thevoltage waveform is across several loads distributed througha single-family home fed by a single power phase that is cen-ter tapped at the utility transformer to provide two supplylegs, 180◦ out of phase, nominally at 120 V.
We measure the voltage waveform across four loads usingfour digital storage oscilloscopes (Rigol model DS1052E)that are jointly triggered via their external trigger input. Thevoltage is sampled at 5 MS/s, and the scope data are collectedusing the scopes’ USB ports. We conduct the measurementsunder different load scenarios to explore the effects of load-ing on magnitude, frequency, phase, and line loss.
Figure 2 shows the measurement results for three differentscenarios. Figure 2(a) is the baseline when the total house-hold power draw is 0.5 kW. This load includes lights, a re-frigerator, computers, and the scopes. Two of the measure-ment points (C1, C2) are on one power leg, while the othertwo (C3, C4) are on the second. The RMS voltage betweenneutral and each power leg is ∼122 V, while the RMS volt-age between the two power legs is ∼245 V. To measure thesimilarity of the sine waves, we calculate the six pairwiseRMS errors by subtracting the waveforms from each other.With a total load of 0.5 kW, the average RMS error betweenthe measured curves is 6.9 V, suggesting that load-inducedline losses are responsible for the difference.
To quantify the effect of line losses, we connect a 1.4 kWload (a space heater) next to measurement point C1. Fig-ure 2(b) shows the resulting voltage at all four measurementpoints. The RMS voltage at C1 drops to 116 V, or about 6 Vcompared to the unloaded case (a 5% loss), while the otherRMS voltages remain at the previously measured levels.
In the final scenario, we explore the degree to which theline voltages across a house are affected when a large load isswitched on. We add a 2.4 kW load to the house by turningon an air conditioner. This additional load does not affectthe measured RMS voltage at the four disparate points, C1through C4, nor does it introduce a phase change betweentwo power legs, as Figure 2(c) shows.
These data suggest that the air conditioner load is parallelto our instrumented circuits and that there is no appreciableloss in the service drop conductors delivering power fromthe utility pole to the house. If there had been losses in theservice drop, then the voltage of the instrumented circuitswould have shown a depression, as can be observed in thescenario with the 1.4 kW space heater. These data confirmthat in-building line losses are non-negligible.
We next explore the distortion in the voltage waveforms.This metric is important because the voltage magnitude,phase, and frequency are estimated by the voltage sensor anddisseminated to the power meters. If the voltage waveformcannot be accurately parametrized using these three values,then the waveform synthesis will introduce an error, andpower (and power factor) estimation will suffer. To evalu-ate distortion, we compute the RMS value of each voltagecycle and use this to synthesize one cycle of a sine wavewhose amplitude is
√2 times greater. We then subtract the
synthesized waveform from the empirical one, and computethe RMS error. In a second run, we use 60 voltage cycles tocompute the voltage RMS and compare this to 60 cycles ofa synthesized waveform. Figure 3 shows both error distribu-tions. The results show the voltage waveform exhibits lowdistortion and can be parametrized by magnitude, frequency,and phase with less than 4.5 V (3.75%) RMS error.

0
0.05
0.1
0.15
0.2
3.6 3.7 3.8 3.9 4 4.1 4.2 4.3 4.4 4.5
Fra
ctio
n o
f M
easu
rem
ents
RMS Voltage Error [V]
RMS Error Between Offline Synthesized and Measured AC Voltage
1 Cycle Estim. 60 Cycle Estim.
Figure 3: RMS error distribution between the AC line voltage and a syn-thesized waveform. We use either 1 or 60 cycles to estimate the RMS ofthe line voltage for synthesizing a waveform with the same amplitude andphase. While the difference is minor, using 60 cycles for RMS estimationachieves a smaller RMS error than using per-cycle calculations because thephase noise is reduced by averaging.
10
100
1000
0.1 1 10 100 1000
All
an D
evia
tio
n [
pp
m]
τ [s]
Allan Deviation of AC Line Frequency
Figure 4: Allan deviation of the line frequency. The Allan deviation mea-sures the degree of variation in a signal over a time window τ. We observethat the Allan deviation rapidly decreases initially, achieving a minimum atabout one second, before increasing. Over very large time frames (hours todays) the frequency is controlled by the grid operators to achieve a long-term60 Hz average, but for our purposes, averaging over one second suffices.
4.2 Synthesizing Voltage WaveformsA power meter must be accurately time-synchronized and
have the ability to synthesize a sinusoidal waveform basedon the magnitude, frequency, and phase reported by a voltagesensor. The accuracy of the synthesized waveform dependson the time synchronization accuracy, as well as the mea-surement accuracy at the meter. We use a modified versionof the Flooding Time Synchronization Protocol (FTSP) [12]with a 32,768 Hz timebase. Prior work has shown that byusing modern radios, a regression history of four values, anda resynchronization period of 10 s, accuracies of < ±1 tick(< ±30.5 µs for a 32,768 Hz clock) can be achieved. Thisfigure translates to less than ±0.2% phase error.
While this establishes the required time synchronizationinterval, we still must determine how often the voltage sensorshould disseminate the voltage parameters to power meters.To explore this question, we analyze the Allan deviation ofline frequency. The Allan deviation is a measure of the fre-quency stability of a periodic signal over a time window τ.
0
0.01
0.02
0.03
0.04
0.05
0.06
0.07
0.08
0.09
0.1
-80 -60 -40 -20 0 20 40 60 80 100
Fra
ctio
n o
f M
easu
rem
ents
Signal Synth. Error [µs]
Error Between Synthesized and Measured AC Line Zero Crossings
Figure 5: Histogram of the phase error in the synthesized waveform. Avoltage sensor measures the zero crossing times of the AC voltage and pe-riodically sends these timestamps to a time-synchronized power meter thatsynthesizes a corresponding waveform of zero crossings. This histogramshows the phase errors resulting from the power meter’s synthesis of thezero crossing signal based on a 32,768 Hz timebase.
Figure 4 shows the Allan deviation of the line frequency.We produce this figure by measuring the zero crossing rateof the line voltage using an 8 MHz oscillator. Since the mea-surement is performed in an air-conditioned room with min-imal temperature variations, the oscillator frequency is as-sumed to be stable. The data show the minimum Allan de-viation occurs over a 1 s window, balancing phase noise andlong-term frequency variation contributions. Thus, for theremainder of our experiments, the voltage sensor distributesmagnitude, frequency, and phase parameters of the voltagewaveform every second. The parameters we report are theaverage value of the measurements observed over each sec-ond; the phase is measured relative to the global time pro-vided by FTSP, which resynchronizes with a 10 s period.
An important measure of our system is the accuracy withwhich a node can synthesize the zero crossing times mea-sured by a voltage sensor. To explore this question, weprogram a node to output the estimated zero crossings bytoggling a GPIO line. To precisely toggle the pin, we usethe timer capabilities of the TI MSP430 used in our system.The voltage sensor extracts and transmits the frequency andphase information of the zero crossings every second. Fig-ure 5 shows a histogram of the time difference between theactual line zero crossings and the synthesized zero crossings.This difference is measured over 33,000 AC cycles usingan oscilloscope. The data show a bimodal error distributionwith one large peak near 5 µs and a second small peak near16 µs, the latter of which may be due to timer quantization.
We next use the synthesized zero crossings to trigger aDMA transfer of a precomputed sine wave to a DAC out-put. Using an all-hardware approach reduces the risk ofmissed interrupts and increases the timing accuracy of thesynthesized signal. We use an oscilloscope to concurrentlycapture the AC line voltage and the synthesized DAC sig-nal. Figure 6 shows the two waveforms, and their difference.Figure 7 shows a histogram of the errors. The synthesizedwaveform is scaled offline using the ratio between the RMSvoltage of the synthesized waveform and the AC line signal.

-200
-150
-100
-50
0
50
100
150
200
0 5 10 15 20 25 30 35-20
-15
-10
-5
0
5
10
15
20
Sig
nal
s [V
]
Err
or
[V]
Time [ms]
Comparison of Synthesized Sine Wave and Measured AC Line
AC VoltageSynthesized Signal
Error
Figure 6: Comparing the scaled, synthesized voltage waveform generatedby a power meter and the actual AC line voltage. The power meter uses syn-chronization data supplied by the voltage sensor to generate a synchronizedsinusoidal waveform using a DAC. The synthesized waveform is scaled of-fline using the RMS of both signals. The RMS of the error between thetwo signals is 6.8 V. The sharpness and periodicity of the error waveformsuggests a third-order harmonic riding on a first-order phase offset error.
0
0.01
0.02
0.03
0.04
0.05
0.06
0.07
-20 -15 -10 -5 0 5 10 15 20 25
Fra
ctio
n o
f M
easu
rem
ents
Signal Synth. Error [V]
RMS Error Between Synthesized and Measured AC Sine Wave
Figure 7: Voltage synthesis error distribution. The errors are bimodal withpeaks near -5 and 5 V. The errors are due in part to time synchronizationerrors and in part to the presence of a third harmonic in the voltage signal.Although the errors are nearly symmetric with approximately zero-mean,they still may not cancel once multiplied with the current waveform.
These results suggest that a remote node can synthesizethe voltage waveform to within 5-10% accuracy given a volt-age sensor that transmits frequency, phase, and magnitudeevery second, and that a time synchronization process with aresynchronization interval of 10 seconds exists. We next in-vestigate how these synthesis and timing errors impact powerand power factor estimation.4.3 Macroscale Evaluation
To measure the error introduced by using the synthesizedwaveform rather than empirical one, we conduct two experi-ments. We compare the true power (P= IV ) and RMS power(Prms = IrmsVrms) by calculating them from traces obtainedwith an oscilloscope, and by sampling the synthesized sig-nals. We connect the voltage sensor to an unloaded circuitin a different room and transmit phase and frequency everysecond. We use a current transformer to measure the currentdrawn of a 150 W light bulb and a 85 W MacBook. Concur-rently, the oscilloscope measures the synthesized waveformgenerated from a DAC output.
Trace True Synth Synth RMS RMSPower Power Error Power Error
MacBook 1 88.4 W 87.4 W 1.1% 94.4 W 6.7%MacBook 2 88.3 W 87.2 W 1.2% 94.1 W 6.5%MacBook 3 88.6 W 87.4 W 1.3% 94.5 W 6.7%MacBook 4 88.4 W 87.3 W 1.2% 94.3 W 6.7%
Bulb 1 98.5 W 98.0 W 0.5% 99.1 W 0.6%Bulb 2 98.5 W 97.7 W 0.8% 99.1 W 0.6%Bulb 3 98.4 W 97.6 W 0.8% 99.0 W 0.6%Bulb 4 98.3 W 97.7 W 0.6% 98.9 W 0.6%
Table 1: Comparison of measured and synthesized power calculation.
We collect several 2 s long traces sampled at 5 MS/s andcalculate the true AC power from direct measurement, thetrue power by using the synthesized waveform, and the RMSpower for both the light bulb and MacBook. Table 1 showsthe results. Using the synthesized voltage waveform resultsin an average error of 1.2% in estimating the true power drawof the MacBook, and 0.7% average error for the light bulb.As the MacBook is a switching load, RMS power estimationoverestimates the power drawn by more than 6.5%, showingthat the RMS approach previously advocated [13] introducessubstantial errors for reactive or switching loads.
4.4 LimitationsOur hardware relies on 32,768 Hz crystal as a time ref-
erence. Switching to a higher speed clock will increasesynchronization accuracy, and thus reduce the phase errorbetween the synthesized and measured voltage waveforms.Additionally, a better DAC triggering mechanism would re-duce jitter in the start of the DMA transfer. With the currenthardware, it is not possible to trigger a DMA transfer on atimer capture event and then switch over to a clock signal forthe rest of the transfer. A more advanced DAC and DMApair, potentially even specialized hardware, could offer suchsupport and reduce the RMS error significantly.
We currently do not transmit RMS voltage measurementsfrom the voltage sensor to the power meter. The scaling ofthe synthesized sine wave is currently performed offline, butwe sketch how the scaling could be performed online. In-stead of changing the sine wave output on the DAC0, wecould use a second output (DAC1) as reference voltage tothe first DAC0. Thus, DAC0 is only concerned with generat-ing a sine wave at the right frequency, while DAC1 scales theamplitude of that signal. This method significantly reducesthe processing load on the microcontroller and obviates theneed to rescale the sine wave table stored in memory for ev-ery change in the RMS voltage.
5 Related WorkA number of commercial and research power meters have
been developed for plug load energy monitoring, with manymore on the way. Commercial plug load meters include theKill-A-Watt [1], Plogg [2], and Watts Up [5] devices. Re-search plug load meters include the ACme [7], Plug [10],and Smart-Socket [15] devices. Nearly all of these metersare plugged into a wall socket and measure the voltage andcurrent of an attached load to compute true and RMS power.Their integrated design does not permit easily decouplingthe current and voltage channels, limiting their measurementscenarios.

Several commercial and research power meters have beendeveloped for whole house monitoring as well. Blue LineInnovations’ PowerCost Monitor [3] clamps to an existingWatt-Hour meter typically installed on the outside of a build-ing. PowerCost tracks energy consumption using either anoptical output port on an electronic meter, or by countingrevolutions of a spinning disk on a mechanical meter, makingit unable to support the more interesting metering topologieswe envision. The Energy Detective (TED) [4] uses split-corecurrent transformers (CTs) that are installed inside a circuitbreaker box. The current sensors are connected to a measur-ing transmitting unit (MTU), which also exposes two wiresthat connect to phase A, and neutral, to measure the line volt-age. These wires are also used to power the MTU and trans-mit post-processed, low-rate data over the in-building powerlines to a gateway or display unit. Since the MTU uses thevoltage channel for measurement, power, and data, it is notamenable to interfacing with a synthesized, logic-level volt-age waveform, rendering voltage virtualization impractical.
Patel et al. designed a whole house, contactless powermeter that is architecturally similar to our work [13]. Theirdesign uses a pair of magnetometers to estimate current flowin the two bus bars of a circuit breaker box using a custom,peel-and-stick sensor. The sensor is externally powered buttransmits its readings wirelessly at 1 kHz to a Bluetooth-enabled PC. The PC computes RMS current, which it thenmultiplies with the RMS voltage obtained from the ACmains. By averaging the current and voltage measurements,their approach does not require the two channels to be tightlysynchronized, but the approach is also susceptible to powercalculation errors. Computing RMS current and voltage andonly then multiplying the values may work for resistive loadsbut will introduce errors for switching loads (with harmonicpower factors) and reactive loads (with displacement powerfactors). We show that their approach of using RMS cur-rent and voltage to ompute power overestimates the averagepower by over 6% for a MacBook but our approach does not.
Finally, synchronized phasor measurement units (syn-chrophasors or PMUs) are devices that can extract currentand voltage phase relative to a GPS clock with 1 µs accu-racy [14]. PMUs are expensive devices used to monitor grid-scale operation to identify voltage sags and phase offsets thatcould indicate pending grid instability. Our design sharessome similarities with synchrophasors, but it does not re-quire GPS clocks, perform DFT or symmetrical componenttransformations, or support wide-area deployment.
6 ConclusionWe present a distributed power meter that decouples the
voltage and current sense channels, and recombines themwirelessly for power calculations. Disaggregating the powermeter in this manner allows us to install voltage and currentsensors in individually optimal locations, and it also supportsa one-to-many relationship between the sensors. This de-sign supports dense, accurate, in-building power metering:any wire, anywhere can be instrumented quickly and non-invasively to provide real and reactive power measurements.Since a circuit need not be broken, nor must live wires betapped, this approach is safe, inexpensive, and practical.
7 AcknowledgmentsSpecial thanks to Mani Srivastava for his many insightful
comments and to the anonymous reviewers for their feed-back. This material is based upon work supported by NSFAwards #CNS-0964120 and #CPS-0932209. NSF supportwas also provided under Award #CNS-1019343 to the CRAfor the CIFellows Project. This work was supported in partby an SNSF Fellowship and an MSR Graduate Fellowship.8 References[1] Kill-a-watt. http://www.p3international.com/products/
special/P4400/P4400-CE.html, 2010.
[2] Plogg Wireless Energy Management.http://www.plogginternational.com, 2010.
[3] PowerCost Monitor.http://www.bluelineinnovations.com/Products/, 2010.
[4] TED: The Energy Detective.http://www.theenergydetective.com/, 2010.
[5] Watts Up Meters.https://www.wattsupmeters.com/secure/products.php?pn=0,2010.
[6] P. Dutta, J. Taneja, J. Jeong, X. Jiang, and D. Culler. A buildingblock approach to sensornet systems. In SenSys’08: In Proceedingsof the Sixth ACM Conference on Embedded Networked SensorSystems, Nov. 2008.
[7] X. Jiang, S. Dawson-Haggerty, P. Dutta, and D. Culler. Design andimplementation of a high-fidelity ac metering network. In IPSN ’09:Proceedings of the 2009 International Conference on InformationProcessing in Sensor Networks, pages 253–264, Apr. 2009.
[8] X. Jiang, M. Van Ly, J. Taneja, P. Dutta, and D. Culler. Experienceswith a high-fidelity wireless building energy auditing network. InSenSys’09: Proceedings of the 7th ACM Conference on EmbeddedNetworked Sensor Systems, pages 113–126, Nov. 2009.
[9] Y. Kim, T. Schmid, Z. M. Charbiwala, and M. B. Srivastava.Viridiscope: design and implementation of a fine grained powermonitoring system for homes. In Ubicomp ’09: Proceedings of the11th international conference on Ubiquitous computing, pages245–254, 2009.
[10] J. Lifton, M. Feldmeier, Y. Ono, C. Lewis, and J. A. Paradiso. Aplatform for ubiquitous sensor deployment in occupational anddomestic environments. IPSN’07: Proceedings of the 6thinternational conference on Information processing in sensornetworks, Apr. 2007.
[11] A. Marchiori and Q. Han. Using circuit-level power measurements inhousehold energy management systems. In BuildSys’09:Proceedings of First ACM Workshop on Embedded Sensing Systemsfor Energy-Efficiency in Buildings, Nov. 2009.
[12] M. Maroti, B. Kusy, G. Simon, and A. Ledeczi. The flooding timesynchronization protocol. In Sensys’04: Proceedings of the 2nd ACMConference on Embedded Networked Sensor Systems, pages 39–49,Nov. 2004.
[13] S. N. Patel, S. Gupta, and M. S. Reynolds. The design and evaluationof an end-user-deployable, whole house, contactless powerconsumption sensor. In CHI’10: Proceedings of ACM Conference onHuman Factors in Computing Systems, Apr. 2010.
[14] A. G. Phadke. Synchronized phasor measurements-a historicaloverview. In Transmission and Distribution Conference andExhibition 2002: Asia Pacific. IEEE/PES, volume 1, pages 476 –479, 6-10 2002.
[15] B. Priyantha, A. Kansal, M. Goraczko, and F. Zhao. Tiny webservices: Design and implementation on interoperable and evolvablesensor networks. In Sensys’08: Proceedings of the 6th ACMConference on Embedded Networked Sensor Systems, Nov. 2008.