METEOROLOGY SEVERE STORMS · METEOROLOGY SEVERE STORMS . ... you will find that much of the...
22
METEOROLOGY SEVERE STORMS 2011 SCIENCE OLYMPIAD SUMMER INSTITUTE PHOENIX, ARIZONA Presented by: Mark A. Van Hecke East China, Michigan National Event Supervisor Earth/Space Science Event Trainer [email protected]
Transcript of METEOROLOGY SEVERE STORMS · METEOROLOGY SEVERE STORMS . ... you will find that much of the...
METEOROLOGY SEVERE STORMS
2011 SCIENCE OLYMPIAD SUMMER INSTITUTE PHOENIX, ARIZONA
Presented by: Mark A. Van Hecke
East China, Michigan
National Event Supervisor Earth/Space Science Event Trainer
Severe Storms Weather is a subject that intrigues students everywhere and affects all of us in our daily lives. Most days are planned with the expectation that the weather is going to do certain things, and our plans often change when the weather does. As I am writing this presentation, a thunderstorm is moving from the West, so it’s probably best that I head indoors. The 2011 Science Olympiad Division B Meteorology event will focus on ‘Severe Storms.’ More specifically, the term implies the basic principles of weather and may include the following topics:
• A general knowledge of the Earth’s atmosphere including air masses, fronts, cyclones, and anticyclones, weather maps, weather stations, isopleths, meteograms and composition/structure of the atmosphere.
• Weather radar, Doppler radar, infrared and visible satellite water images. • Global circulation patterns. • Thunderstorms-all types • Mid-latitude cyclones • Tornadoes • Hurricanes • Saffir-Simpson, Fujita & E-Fujita Scales • Lightning (sprites and jets.) hail; and other associated storm hazards • Storm tracks across North America
The term ‘Severe Storms as it is described in the 2011 rules parameters given above therefore focuses on the mechanics of Earth’s atmosphere and how it creates severe weather events. This presentation will therefore begin with a discussion of the Earth’s atmosphere, energy budget, cloud types and formation, precipitation, atmospheric heating and circulation and the formation of air masses. As coaches, you will find that much of the material used to prepare your students for the ‘Everyday Weather’ Meteorology event will remain useful in preparing students for the 2008 competition. Origin of the Earth’s Atmosphere The origin of Earth’s atmosphere is still subject to lots of debate and speculation. One thing we can be fairly certain of is that when the Earth was formed some five billion years ago, it was probably too hot to retain any of the gases that it had in its primordial atmosphere. Earth’s first atmosphere most likely consisted of helium, hydrogen, ammonia and methane. What probably happened over a period of thousands of years is that volcanoes emitted copious amounts of water vapor, carbon dioxide and nitrogen- the same gases emitted by volcanoes today. This expulsion of gases from Earth’s interior is a process known as outgassing. The water vapor expelled by the hot, volcanic Earth in turn created clouds, which produced rain. Over time, the rain would accumulate in basins as rivers, lakes and oceans. These basins in turn acted as sinks for accumulated carbon dioxide, which later became locked into deposits of limestone and other sedimentary rocks. Nitrogen, which is not chemically active, accumulated in the atmosphere. Significant amounts of oxygen probably did not exist in Earth’s early atmosphere. Only when anaerobic bacteria dwelling in Earth’s oceans developed the ability to split water molecules apart by using the energy of sunlight could significant amounts of oxygen accumulate in the atmosphere. It was the sequential and simultaneous interaction of these processes that appears to have produced the modern atmospheric composition of 78% nitrogen and 21% oxygen.

Structure of Earth’s Atmosphere Think of the Earth’s atmosphere as being just like one of those multi-layered Jell-O deserts that you had at your last family reunion. As shown below, the Earth’s atmosphere also has a layered structure.
Troposphere The troposphere is where all the weather action takes place. It is a region of rising and falling packets of air moving vertically. Note the thin buffer zone on the diagram that is found between the troposphere and the next atmospheric layer- the stratosphere. Stratosphere The stratosphere located above the troposphere has a very high concentration of ozone- a reactive form of oxygen. You’ve probably flown up into the lower levels of the stratosphere above the clouds on an airplane. The skies are always clear in the stratosphere because you are ‘above the clouds’ and there is nothing blocking the Sun’s light. Unlike the troposphere, airflow in the stratosphere is mostly horizontal. The stratosphere is primarily responsible for absorption of ultraviolet radiation from the Sun. Only when oxygen is produced in the atmosphere can an ozone layer form, preventing an intense flux of ultraviolet radiation from reaching the Earth’s surface, where it is hazardous to living things. The Mesosphere, Ionosphere and Exosphere Above the stratosphere is the mesosphere. In the mesosphere, temperatures drop with increasing altitude to about -100°C- colder than Antarctica’s lowest recorded temperature. The mesosphere is also the layer in which most meteors burn up as they enter Earth’s atmosphere. Ice clouds or noctilucent clouds (NLC) formed in the mesosphere can been seen at sunset when the Sun is from 4° to 16° below the horizon.
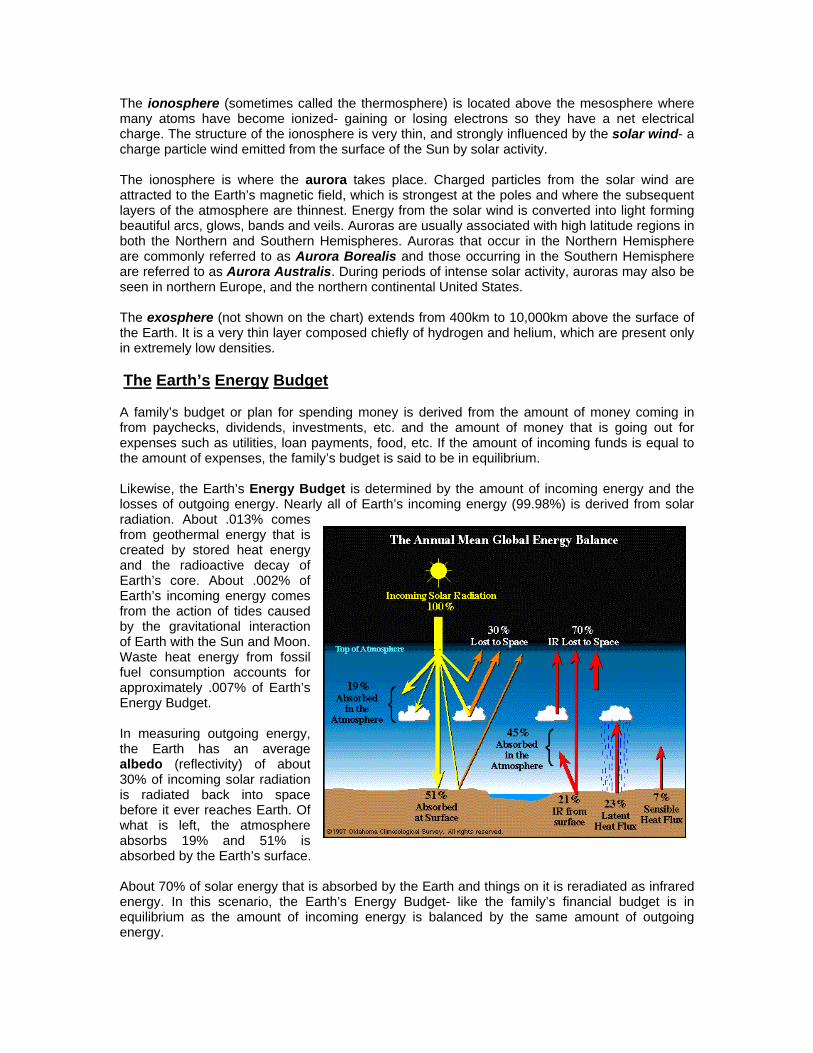
The ionosphere (sometimes called the thermosphere) is located above the mesosphere where many atoms have become ionized- gaining or losing electrons so they have a net electrical charge. The structure of the ionosphere is very thin, and strongly influenced by the solar wind- a charge particle wind emitted from the surface of the Sun by solar activity. The ionosphere is where the aurora takes place. Charged particles from the solar wind are attracted to the Earth’s magnetic field, which is strongest at the poles and where the subsequent layers of the atmosphere are thinnest. Energy from the solar wind is converted into light forming beautiful arcs, glows, bands and veils. Auroras are usually associated with high latitude regions in both the Northern and Southern Hemispheres. Auroras that occur in the Northern Hemisphere are commonly referred to as Aurora Borealis and those occurring in the Southern Hemisphere are referred to as Aurora Australis. During periods of intense solar activity, auroras may also be seen in northern Europe, and the northern continental United States. The exosphere (not shown on the chart) extends from 400km to 10,000km above the surface of the Earth. It is a very thin layer composed chiefly of hydrogen and helium, which are present only in extremely low densities. The Earth’s Energy Budget A family’s budget or plan for spending money is derived from the amount of money coming in from paychecks, dividends, investments, etc. and the amount of money that is going out for expenses such as utilities, loan payments, food, etc. If the amount of incoming funds is equal to the amount of expenses, the family’s budget is said to be in equilibrium. Likewise, the Earth’s Energy Budget is determined by the amount of incoming energy and the losses of outgoing energy. Nearly all of Earth’s incoming energy (99.98%) is derived from solar radiation. About .013% comes from geothermal energy that is created by stored heat energy and the radioactive decay of Earth’s core. About .002% of Earth’s incoming energy comes from the action of tides caused by the gravitational interaction of Earth with the Sun and Moon. Waste heat energy from fossil fuel consumption accounts for approximately .007% of Earth’s Energy Budget. In measuring outgoing energy, the Earth has an average albedo (reflectivity) of about 30% of incoming solar radiation is radiated back into space before it ever reaches Earth. Of what is left, the atmosphere absorbs 19% and 51% is absorbed by the Earth’s surface. About 70% of solar energy that is absorbed by the Earth and things on it is reradiated as infrared energy. In this scenario, the Earth’s Energy Budget- like the family’s financial budget is in equilibrium as the amount of incoming energy is balanced by the same amount of outgoing energy.
Heat retention in the atmosphere also explains seasonal changes in weather in the Northern and Southern Hemispheres. In the Northern Hemisphere, between late July and late August, the amount of heat retained by the atmosphere each day and the amount that is lost is in equilibrium. As the amount of daylight and the intensity of solar radiation continue to decrease after the Summer Solstice, the atmosphere retains less solar energy by late August than is received. This trend continues through late January- even after the Winter Solstice in late December. The declination of the Northern Hemisphere away from the Sun is still too great to allow the atmosphere to begin to retain sufficient heat energy. Snow and ice on the Earth’s surface during the winter months increase the amount of albedo, as solar radiation is reflected away from Earth’s surface before it can be absorbed. In the northern states, this is why the weather usually stays cold after the first snowfall accumulation. By late January however, the atmosphere again reaches a state of equilibrium, as the amount of insolation- the amount of heat energy retained by the atmosphere once again equals the amount that is lost. This is caused by the increased amount of daylight and increased intensity of solar radiation reaching the Northern Hemisphere. By late February, the atmosphere in the Northern Hemisphere begins to retain more heat energy each day than is lost to irradiation. This trend will continue until late July when after the Summer Solstice, the amount of heat irradiated each day is equivalent to the amount retained creating a state of equilibrium. This sequential heating and cooling of the Earth’s atmosphere and surface in its Northern and Southern Hemispheres is responsible for seasonal weather patterns that affect different regions of the world in different ways. Radiation Budget The term radiation budget is used to refer to the balance between incoming radiation from the Sun and the outgoing thermal, or longwave and reflected shortwave energy from Earth. On a global scale, the budget is balanced as the amount of energy coming in is ‘spent’ as solar radiation is transformed into latent heat, or even into kinetic energy. Energy transfers in the oceans as well as the atmosphere balance the radiation budget. Locally, this balance is not balanced, as tropical regions retain more insolation, while less is retained in higher latitudes. As we will learn, this accounts for differences in the temperature and pressure of air masses that originate in both regions affecting weather throughout the planet. Water in the Atmosphere The atmosphere of our planet, like most every place on the planet is laden with water. In temperate and tropical regions of earth, water exists primarily in liquid form. In the poles and higher latitudes, much of Earth’s water exists as solid ice locked away in alpine or continental glaciers. The physical composition of Earth’s atmosphere consists primarily of water vapor. Humidity refers to the amount of water vapor that is n the air. This water vapor exists in a gaseous state. The process in which water changes from a liquid into a gaseous state is evaporation. Each water molecule that becomes water vapor also takes with it a parcel of heat energy from the surface it evaporates from. This process is known as evaporative cooling. Evaporative cooling explains why you may feel a chill after swimming as water evaporates off the surface of your skin, taking with it heat energy from your body. During the spring months when the amount of daylight is increasing and the declination of the hemisphere is tilting towards the Sun, the intensity of solar radiation increases causing ice
crystals in the upper troposphere to melt and fall to the Earth as rain. As the water is exposed to increased solar radiation it evaporates and returns to the atmosphere in a gaseous state- as water vapor. The humidity of the atmosphere increases as spring turns into summer. Measurement of the vapor content of air is made through an instrument known as a hygrometer. Measurements of humidity are often expressed as a percentage, which is termed relative humidity. Complete saturation of the air (100% relative humidity) occurs when the amount of water vapor in the air is equal to the amount of water vapor that the air can hold. If the relative humidity is less than 100%, this means that the amount of water vapor in the air is not equal to the amount that it could hold. Aerosols Aerosols are tiny solid particles such as ice crystals, smoke, sea salt crystals, dust and volcanic emissions that are suspended in the air. Aerosols may also include tiny droplets of liquid water that form fog. Aerosols are sometimes referred to as particulates. Aerosols interact directly and indirectly with Earth’s radiation budget. Aerosols directly affect weather and climate by scattering sunlight directly into space. Indirectly, aerosols in the lower troposphere can modify the size of cloud particles and the ways in which clouds reflect and absorb sunlight, as we will learn later. Volcanic aerosols significantly affect Earth’s weather and climate as the sulfur dioxide gas spewed forth by active volcanoes as they erupt converts to droplets of sulfuric acid in the stratosphere within a week to several months following an eruption. Once formed, these aerosols will stay in the atmosphere for about two years reflecting sunlight and reducing the amount of energy that reaches Earth’s lower atmosphere and surface. Major volcanic eruptions can significantly affect weather patterns over a short period of time. The eruption of Mt. Pinatubo in the Philippines in 1991 produced an aerosol cloud that covered much of the Northern Hemisphere within a year after the eruption significantly reducing temperatures and increasing rainfall amounts the following summer. Intense dust storms over desert regions of Africa and Asia may also have a significant effect on weather and climate as sand and dust is carried to altitudes as high as 15,000 feet. Sand and dust absorb solar radiation as well as reflect it. The warmer air created by higher concentrations of dust and sand- without the enhanced ability of the air to hold more water vapor is believed to suppress the formation of rain-carrying storm clouds. This is probably explains the phenomenon of desertification- the expansion of desert regions. The third type of aerosols is derived from human activities such as the burning of fossil fuels, and deforestation. Sulfate aerosols produced by such human activities increase the concentration of aerosols, especially in the Northern Hemisphere, where industrial activities are more concentrated. Higher concentrations of sulfate aerosols reflect sunlight back into space and cause clouds to produce smaller size droplets. Cloud Formation Clouds are really nothing more than small droplets of water and ice crystals that clump together within the atmosphere. They then may produce precipitation in the form of liquid water and/or ice crystals that fall to the Earth’s surface. Rising air is an important process in the formation of clouds. Let’s imagine a block of air rising upward through the atmosphere. If you recall from our discussion of the troposphere, the movement of air in this layer tends to be vertical.
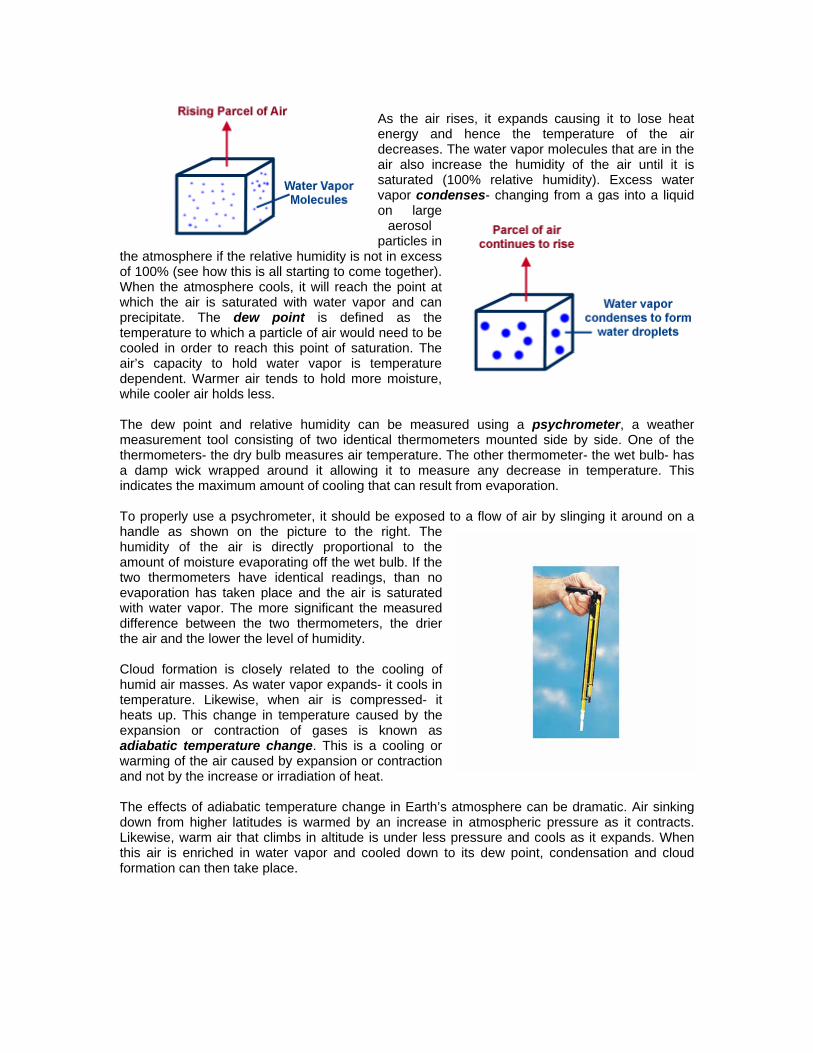
As the air rises, it expands causing it to lose heat energy and hence the temperature of the air decreases. The water vapor molecules that are in the air also increase the humidity of the air until it is saturated (100% relative humidity). Excess water vapor condenses- changing from a gas into a liquid on large
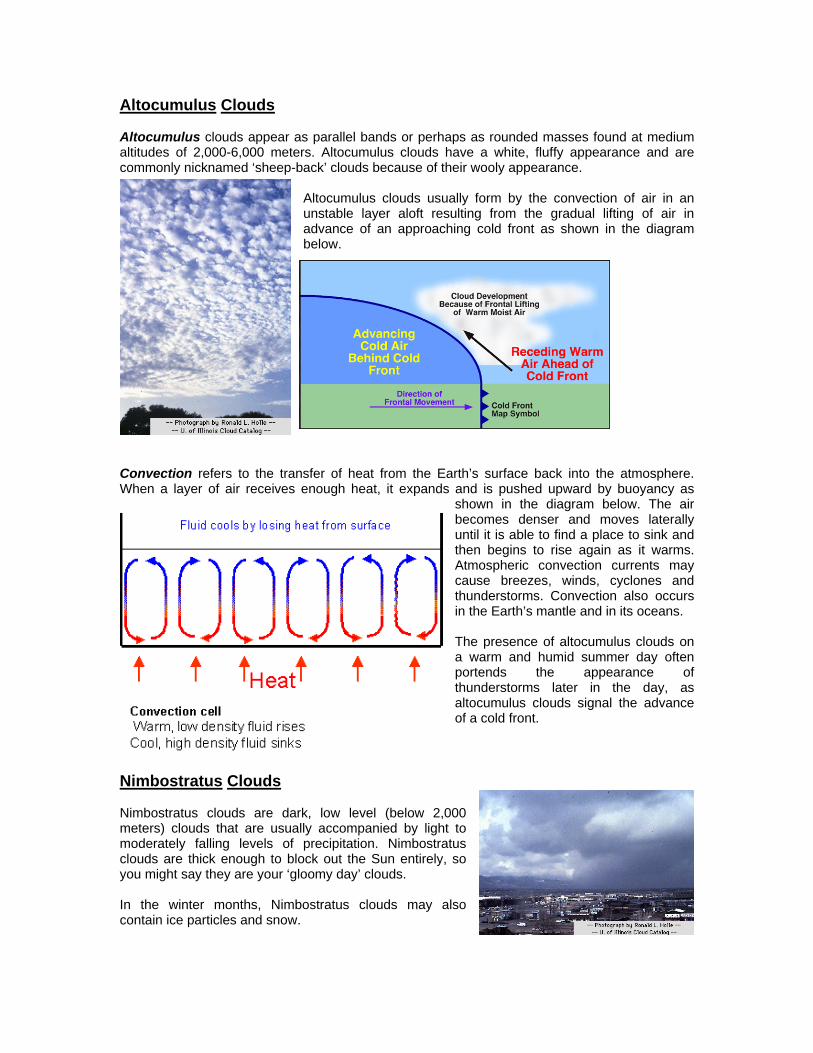
aerosol particles in
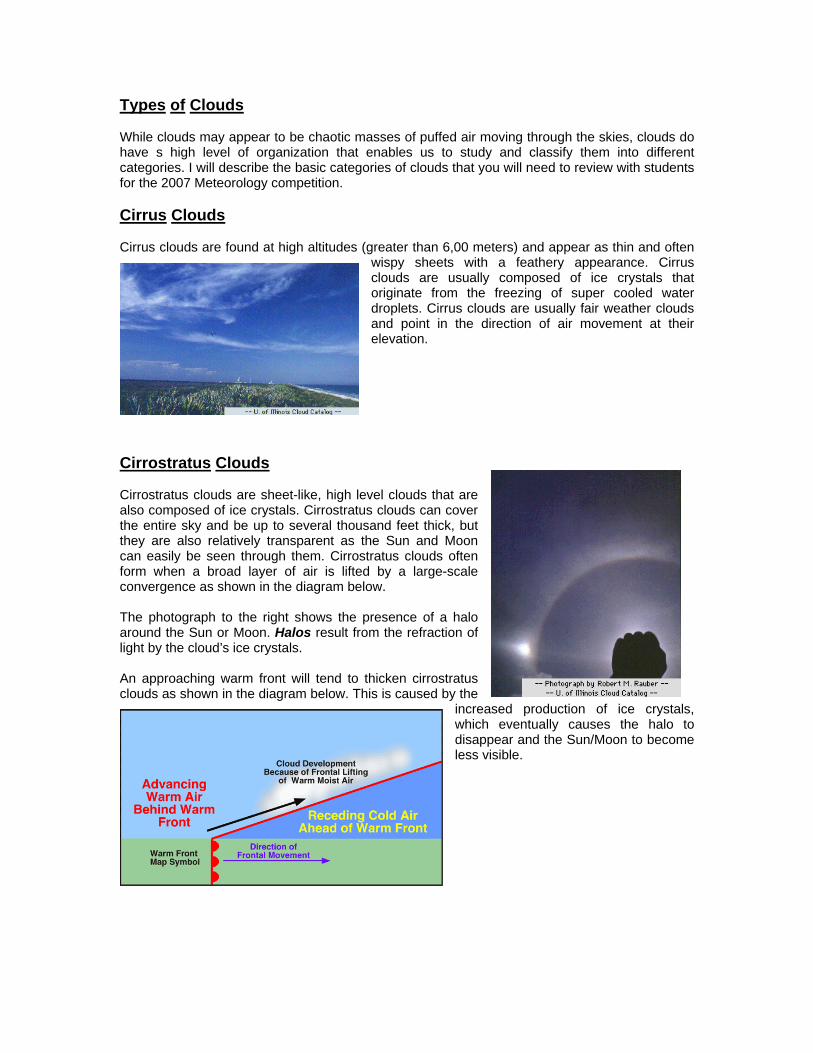
the atmosphere if the relative humidity is not in excess of 100% (see how this is all starting to come together). When the atmosphere cools, it will reach the point at which the air is saturated with water vapor and can precipitate. The dew point is defined as the temperature to which a particle of air would need to be cooled in order to reach this point of saturation. The air’s capacity to hold water vapor is temperature dependent. Warmer air tends to hold more moisture, while cooler air holds less. The dew point and relative humidity can be measured using a psychrometer, a weather measurement tool consisting of two identical thermometers mounted side by side. One of the thermometers- the dry bulb measures air temperature. The other thermometer- the wet bulb- has a damp wick wrapped around it allowing it to measure any decrease in temperature. This indicates the maximum amount of cooling that can result from evaporation. To properly use a psychrometer, it should be exposed to a flow of air by slinging it around on a handle as shown on the picture to the right. The humidity of the air is directly proportional to the amount of moisture evaporating off the wet bulb. If the two thermometers have identical readings, than no evaporation has taken place and the air is saturated with water vapor. The more significant the measured difference between the two thermometers, the drier the air and the lower the level of humidity. Cloud formation is closely related to the cooling of humid air masses. As water vapor expands- it cools in temperature. Likewise, when air is compressed- it heats up. This change in temperature caused by the expansion or contraction of gases is known as adiabatic temperature change. This is a cooling or warming of the air caused by expansion or contraction and not by the increase or irradiation of heat. The effects of adiabatic temperature change in Earth’s atmosphere can be dramatic. Air sinking down from higher latitudes is warmed by an increase in atmospheric pressure as it contracts. Likewise, warm air that climbs in altitude is under less pressure and cools as it expands. When this air is enriched in water vapor and cooled down to its dew point, condensation and cloud formation can then take place.
Types of Clouds While clouds may appear to be chaotic masses of puffed air moving through the skies, clouds do have s high level of organization that enables us to study and classify them into different categories. I will describe the basic categories of clouds that you will need to review with students for the 2007 Meteorology competition. Cirrus Clouds Cirrus clouds are found at high altitudes (greater than 6,00 meters) and appear as thin and often
wispy sheets with a feathery appearance. Cirrus clouds are usually composed of ice crystals that originate from the freezing of super cooled water droplets. Cirrus clouds are usually fair weather clouds and point in the direction of air movement at their elevation.
Cirrostratus Clouds Cirrostratus clouds are sheet-like, high level clouds that are also composed of ice crystals. Cirrostratus clouds can cover the entire sky and be up to several thousand feet thick, but they are also relatively transparent as the Sun and Moon can easily be seen through them. Cirrostratus clouds often form when a broad layer of air is lifted by a large-scale convergence as shown in the diagram below. The photograph to the right shows the presence of a halo around the Sun or Moon. Halos result from the refraction of light by the cloud’s ice crystals. An approaching warm front will tend to thicken cirrostratus clouds as shown in the diagram below. This is caused by the
increased production of ice crystals, which eventually causes the halo to disappear and the Sun/Moon to become less visible.
Altocumulus Clouds Altocumulus clouds appear as parallel bands or perhaps as rounded masses found at medium altitudes of 2,000-6,000 meters. Altocumulus clouds have a white, fluffy appearance and are commonly nicknamed ‘sheep-back’ clouds because of their wooly appearance.
Altocumulus clouds usually form by the convection of air in an unstable layer aloft resulting from the gradual lifting of air in advance of an approaching cold front as shown in the diagram below.
Convection refers to the transfer of heat from the Earth’s surface back into the atmosphere. When a layer of air receives enough heat, it expands and is pushed upward by buoyancy as
shown in the diagram below. The air becomes denser and moves laterally until it is able to find a place to sink and then begins to rise again as it warms. Atmospheric convection currents may cause breezes, winds, cyclones and thunderstorms. Convection also occurs in the Earth’s mantle and in its oceans. The presence of altocumulus clouds on a warm and humid summer day often portends the appearance of thunderstorms later in the day, as altocumulus clouds signal the advance of a cold front.
Nimbostratus Clouds Nimbostratus clouds are dark, low level (below 2,000 meters) clouds that are usually accompanied by light to moderately falling levels of precipitation. Nimbostratus clouds are thick enough to block out the Sun entirely, so you might say they are your ‘gloomy day’ clouds. In the winter months, Nimbostratus clouds may also contain ice particles and snow.
Stratocumulus Clouds Stratocumulus clouds are low-level clouds that develop below 2,000 meters that generally appear as low, lumpy layers of clouds. Although they are usually fair-weather clouds, stratocumulus clouds are sometimes accompanied by low-intensity precipitation such as drizzle. Stratocumulus clouds often vary in color from dark to light gray with breaks of clear sky in between them. Fair Weather Cumulus and Cumulonimbus Clouds Fair weather cumulus clouds develop vertically at altitudes of 500 meters or above. These clouds have the appearance of floating cotton and often have a lifetime of around 5-40 minutes. Fair-weather cumulus clouds may occur as individual or isolated groups of clouds. Fair weather cumulus clouds are fueled by thermals- buoyant bubbles of air that rise upward from the Earth’s surface. As they rise, the water vapor within these air parcels cools and condenses. Evaporation along the cloud edges cools the air around it making it heavier and producing a sinking motion or subsidence outside of the cloud. While appearing innocent enough, cumulus clouds can very quickly develop into their alter-ego cumulonimbus clouds associated with thunderstorms. Cumulonimbus clouds are fueled by strong convective updrafts sometimes at speeds of over 50 knots. The tops of these clouds are quite high often reaching 12,000 meters or higher. Lower levels of cumulonimbus clouds consist mainly of water droplets, while at higher elevations where temperatures are below 0°C, ice crystals are predominant. Other Types of Clouds Fog occurs when the base of a cloud extends all the way to the ground. Fog often forms with the cooling of warm humid air, the movement of warm humid air over a cool surface- such as snow-covered ground. Other fogs may form on clear, cool nights when the surface cools quickly by radiation causing a layer of air near the surface to drop below the dew point. Fogs may also form when humid air rushes up a mountaintop and cools and condenses rapidly. Heavy fog can reduce ground visibility significantly making it difficult to drive or operate watercraft. Most fogs usually burn up within a couple of hours after sunrise.
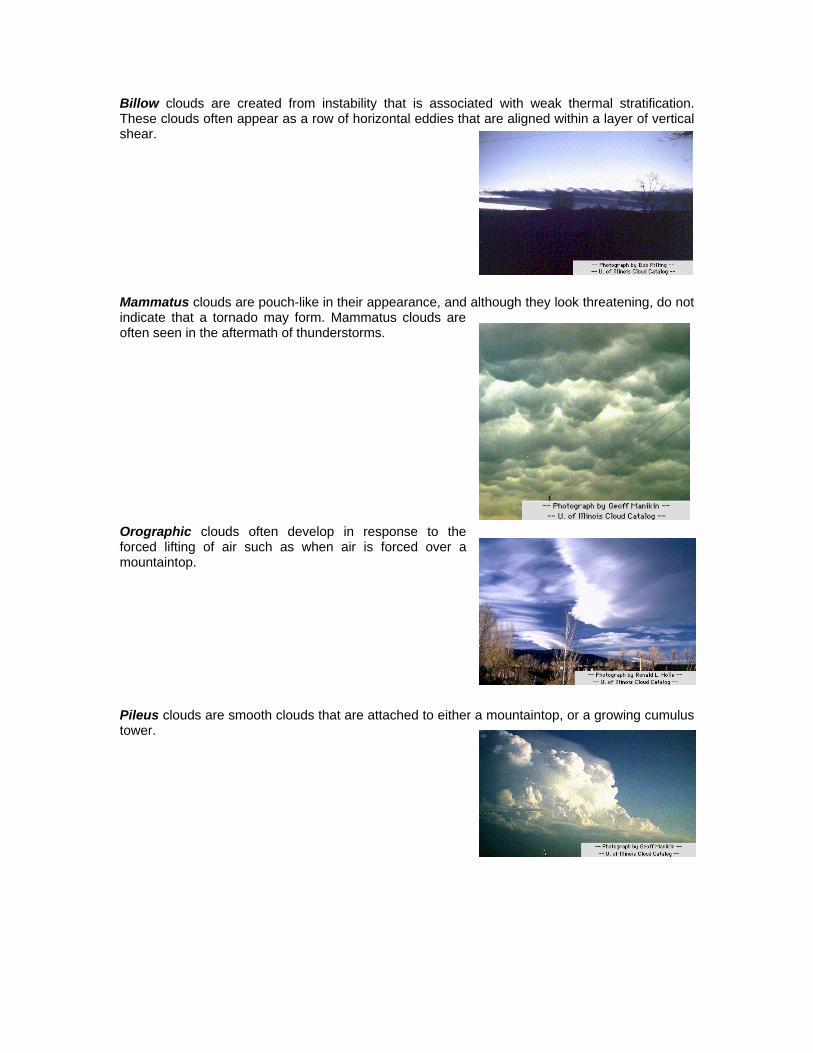
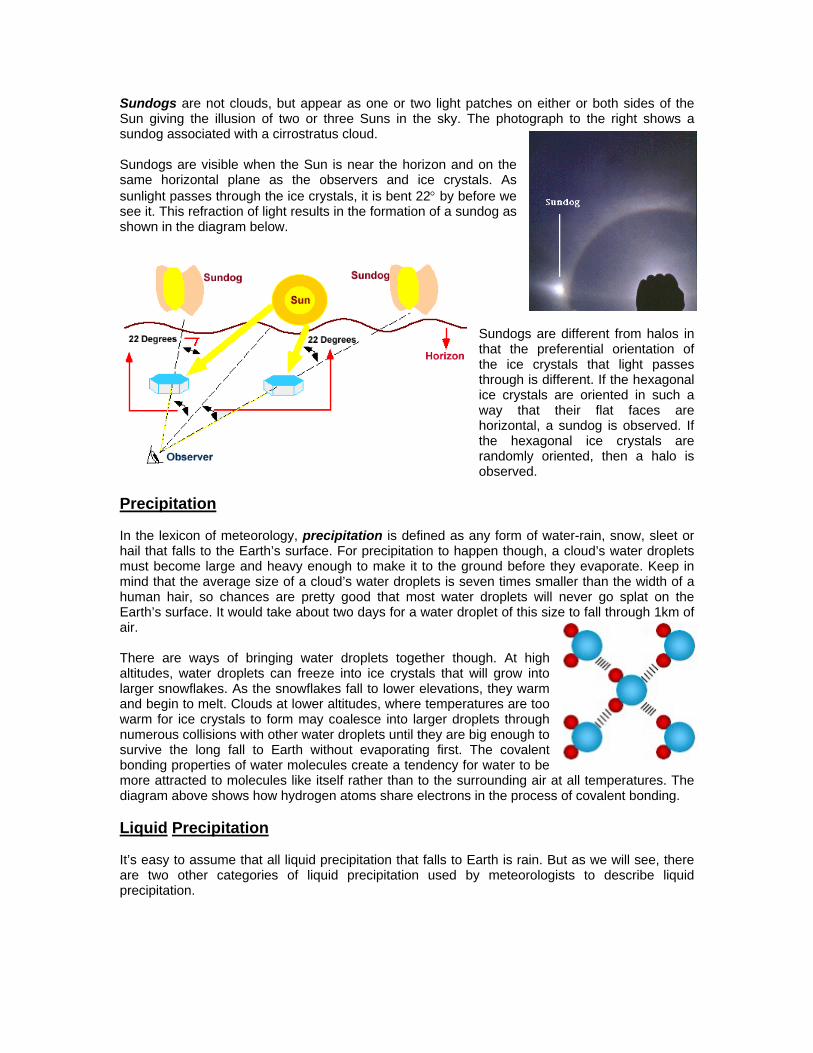
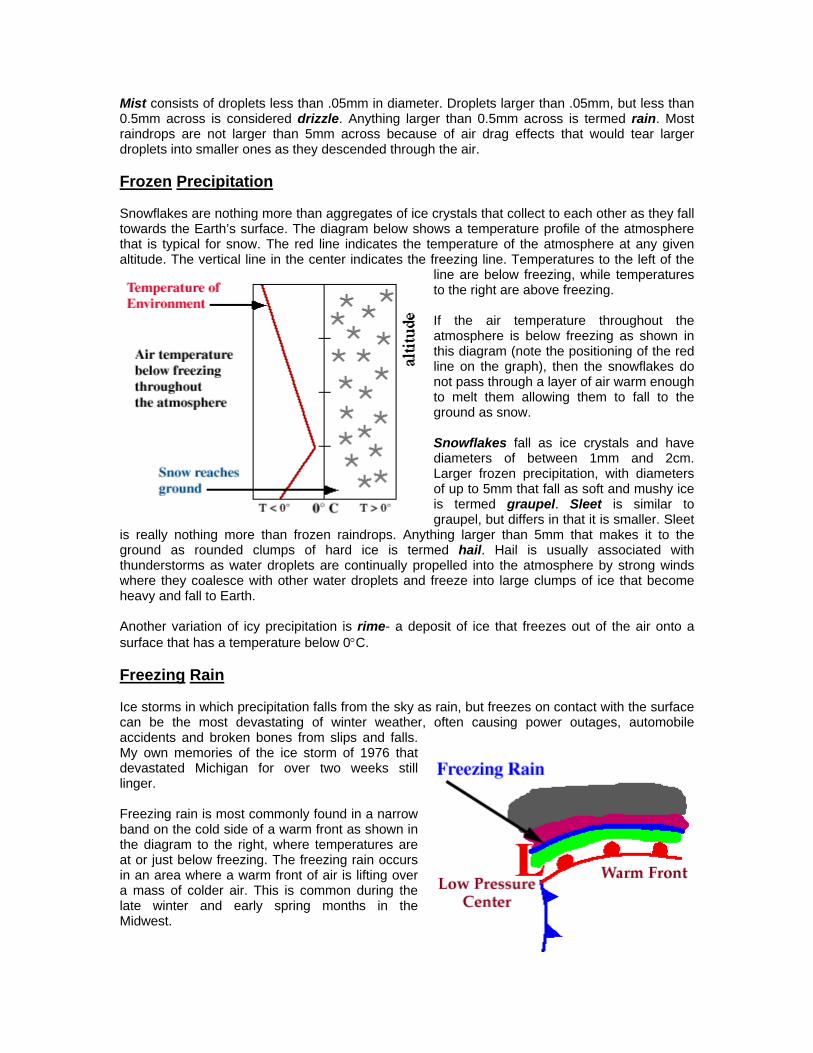
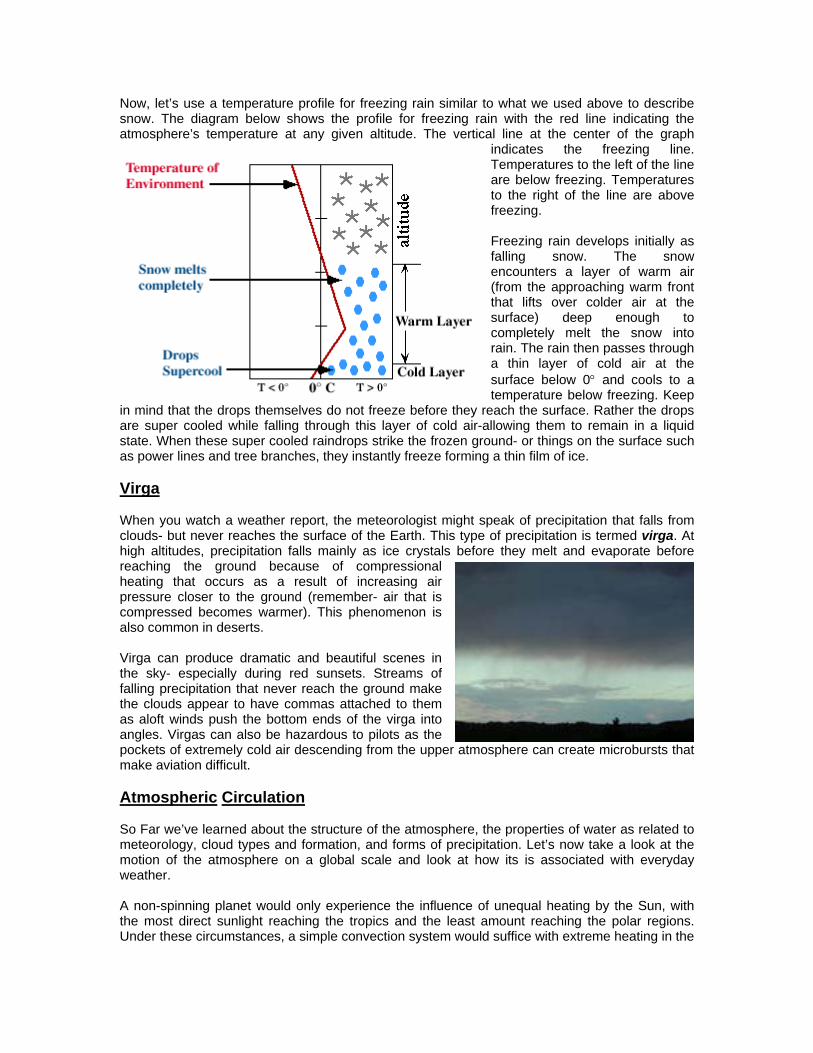
Billow clouds are created from instability that is associated with weak thermal stratification. These clouds often appear as a row of horizontal eddies that are aligned within a layer of vertical shear. Mammatus clouds are pouch-like in their appearance, and although they look threatening, do not indicate that a tornado may form. Mammatus clouds are often seen in the aftermath of thunderstorms. Orographic clouds often develop in response to the forced lifting of air such as when air is forced over a mountaintop. Pileus clouds are smooth clouds that are attached to either a mountaintop, or a growing cumulus tower.
Sundogs are not clouds, but appear as one or two light patches on either or both sides of the Sun giving the illusion of two or three Suns in the sky. The photograph to the right shows a sundog associated with a cirrostratus cloud. Sundogs are visible when the Sun is near the horizon and on the same horizontal plane as the observers and ice crystals. As sunlight passes through the ice crystals, it is bent 22° by before we see it. This refraction of light results in the formation of a sundog as shown in the diagram below.
Sundogs are different from halos in that the preferential orientation of the ice crystals that light passes through is different. If the hexagonal ice crystals are oriented in such a way that their flat faces are horizontal, a sundog is observed. If the hexagonal ice crystals are randomly oriented, then a halo is observed.
Precipitation In the lexicon of meteorology, precipitation is defined as any form of water-rain, snow, sleet or hail that falls to the Earth’s surface. For precipitation to happen though, a cloud’s water droplets must become large and heavy enough to make it to the ground before they evaporate. Keep in mind that the average size of a cloud’s water droplets is seven times smaller than the width of a human hair, so chances are pretty good that most water droplets will never go splat on the Earth’s surface. It would take about two days for a water droplet of this size to fall through 1km of air. There are ways of bringing water droplets together though. At high altitudes, water droplets can freeze into ice crystals that will grow into larger snowflakes. As the snowflakes fall to lower elevations, they warm and begin to melt. Clouds at lower altitudes, where temperatures are too warm for ice crystals to form may coalesce into larger droplets through numerous collisions with other water droplets until they are big enough to survive the long fall to Earth without evaporating first. The covalent bonding properties of water molecules create a tendency for water to be more attracted to molecules like itself rather than to the surrounding air at all temperatures. The diagram above shows how hydrogen atoms share electrons in the process of covalent bonding. Liquid Precipitation It’s easy to assume that all liquid precipitation that falls to Earth is rain. But as we will see, there are two other categories of liquid precipitation used by meteorologists to describe liquid precipitation.
Mist consists of droplets less than .05mm in diameter. Droplets larger than .05mm, but less than 0.5mm across is considered drizzle. Anything larger than 0.5mm across is termed rain. Most raindrops are not larger than 5mm across because of air drag effects that would tear larger droplets into smaller ones as they descended through the air. Frozen Precipitation Snowflakes are nothing more than aggregates of ice crystals that collect to each other as they fall towards the Earth’s surface. The diagram below shows a temperature profile of the atmosphere that is typical for snow. The red line indicates the temperature of the atmosphere at any given altitude. The vertical line in the center indicates the freezing line. Temperatures to the left of the
line are below freezing, while temperatures to the right are above freezing. If the air temperature throughout the atmosphere is below freezing as shown in this diagram (note the positioning of the red line on the graph), then the snowflakes do not pass through a layer of air warm enough to melt them allowing them to fall to the ground as snow. Snowflakes fall as ice crystals and have diameters of between 1mm and 2cm. Larger frozen precipitation, with diameters of up to 5mm that fall as soft and mushy ice is termed graupel. Sleet is similar to graupel, but differs in that it is smaller. Sleet
is really nothing more than frozen raindrops. Anything larger than 5mm that makes it to the ground as rounded clumps of hard ice is termed hail. Hail is usually associated with thunderstorms as water droplets are continually propelled into the atmosphere by strong winds where they coalesce with other water droplets and freeze into large clumps of ice that become heavy and fall to Earth. Another variation of icy precipitation is rime- a deposit of ice that freezes out of the air onto a surface that has a temperature below 0°C. Freezing Rain Ice storms in which precipitation falls from the sky as rain, but freezes on contact with the surface can be the most devastating of winter weather, often causing power outages, automobile accidents and broken bones from slips and falls. My own memories of the ice storm of 1976 that devastated Michigan for over two weeks still linger. Freezing rain is most commonly found in a narrow band on the cold side of a warm front as shown in the diagram to the right, where temperatures are at or just below freezing. The freezing rain occurs in an area where a warm front of air is lifting over a mass of colder air. This is common during the late winter and early spring months in the Midwest.
Now, let’s use a temperature profile for freezing rain similar to what we used above to describe snow. The diagram below shows the profile for freezing rain with the red line indicating the atmosphere’s temperature at any given altitude. The vertical line at the center of the graph
indicates the freezing line. Temperatures to the left of the line are below freezing. Temperatures to the right of the line are above freezing. Freezing rain develops initially as falling snow. The snow encounters a layer of warm air (from the approaching warm front that lifts over colder air at the surface) deep enough to completely melt the snow into rain. The rain then passes through a thin layer of cold air at the surface below 0° and cools to a temperature below freezing. Keep
in mind that the drops themselves do not freeze before they reach the surface. Rather the drops are super cooled while falling through this layer of cold air-allowing them to remain in a liquid state. When these super cooled raindrops strike the frozen ground- or things on the surface such as power lines and tree branches, they instantly freeze forming a thin film of ice. Virga When you watch a weather report, the meteorologist might speak of precipitation that falls from clouds- but never reaches the surface of the Earth. This type of precipitation is termed virga. At high altitudes, precipitation falls mainly as ice crystals before they melt and evaporate before reaching the ground because of compressional heating that occurs as a result of increasing air pressure closer to the ground (remember- air that is compressed becomes warmer). This phenomenon is also common in deserts. Virga can produce dramatic and beautiful scenes in the sky- especially during red sunsets. Streams of falling precipitation that never reach the ground make the clouds appear to have commas attached to them as aloft winds push the bottom ends of the virga into angles. Virgas can also be hazardous to pilots as the pockets of extremely cold air descending from the upper atmosphere can create microbursts that make aviation difficult. Atmospheric Circulation So Far we’ve learned about the structure of the atmosphere, the properties of water as related to meteorology, cloud types and formation, and forms of precipitation. Let’s now take a look at the motion of the atmosphere on a global scale and look at how its is associated with everyday weather. A non-spinning planet would only experience the influence of unequal heating by the Sun, with the most direct sunlight reaching the tropics and the least amount reaching the polar regions. Under these circumstances, a simple convection system would suffice with extreme heating in the
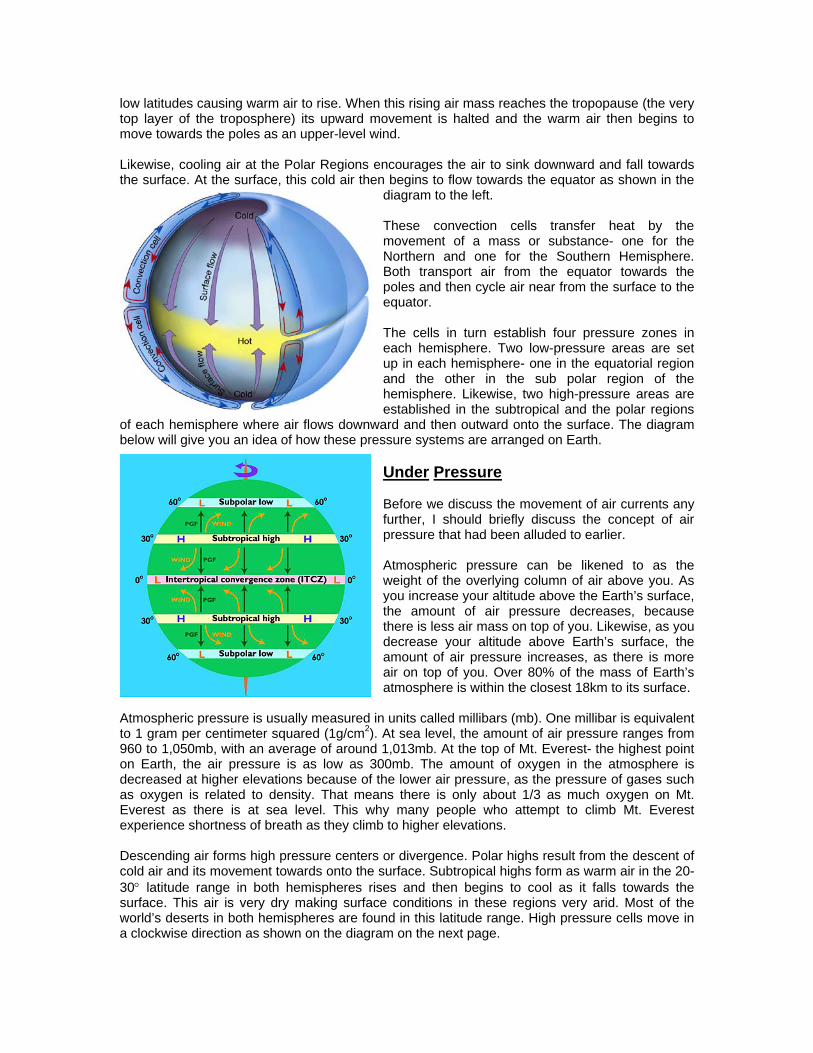
low latitudes causing warm air to rise. When this rising air mass reaches the tropopause (the very top layer of the troposphere) its upward movement is halted and the warm air then begins to move towards the poles as an upper-level wind. Likewise, cooling air at the Polar Regions encourages the air to sink downward and fall towards the surface. At the surface, this cold air then begins to flow towards the equator as shown in the
diagram to the left. These convection cells transfer heat by the movement of a mass or substance- one for the Northern and one for the Southern Hemisphere. Both transport air from the equator towards the poles and then cycle air near from the surface to the equator. The cells in turn establish four pressure zones in each hemisphere. Two low-pressure areas are set up in each hemisphere- one in the equatorial region and the other in the sub polar region of the hemisphere. Likewise, two high-pressure areas are established in the subtropical and the polar regions
of each hemisphere where air flows downward and then outward onto the surface. The diagram below will give you an idea of how these pressure systems are arranged on Earth.
Under Pressure Before we discuss the movement of air currents any further, I should briefly discuss the concept of air pressure that had been alluded to earlier. Atmospheric pressure can be likened to as the weight of the overlying column of air above you. As you increase your altitude above the Earth’s surface, the amount of air pressure decreases, because there is less air mass on top of you. Likewise, as you decrease your altitude above Earth’s surface, the amount of air pressure increases, as there is more air on top of you. Over 80% of the mass of Earth’s atmosphere is within the closest 18km to its surface.
Atmospheric pressure is usually measured in units called millibars (mb). One millibar is equivalent to 1 gram per centimeter squared (1g/cm2). At sea level, the amount of air pressure ranges from 960 to 1,050mb, with an average of around 1,013mb. At the top of Mt. Everest- the highest point on Earth, the air pressure is as low as 300mb. The amount of oxygen in the atmosphere is decreased at higher elevations because of the lower air pressure, as the pressure of gases such as oxygen is related to density. That means there is only about 1/3 as much oxygen on Mt. Everest as there is at sea level. This why many people who attempt to climb Mt. Everest experience shortness of breath as they climb to higher elevations. Descending air forms high pressure centers or divergence. Polar highs result from the descent of cold air and its movement towards onto the surface. Subtropical highs form as warm air in the 20-30° latitude range in both hemispheres rises and then begins to cool as it falls towards the surface. This air is very dry making surface conditions in these regions very arid. Most of the world’s deserts in both hemispheres are found in this latitude range. High pressure cells move in a clockwise direction as shown on the diagram on the next page.
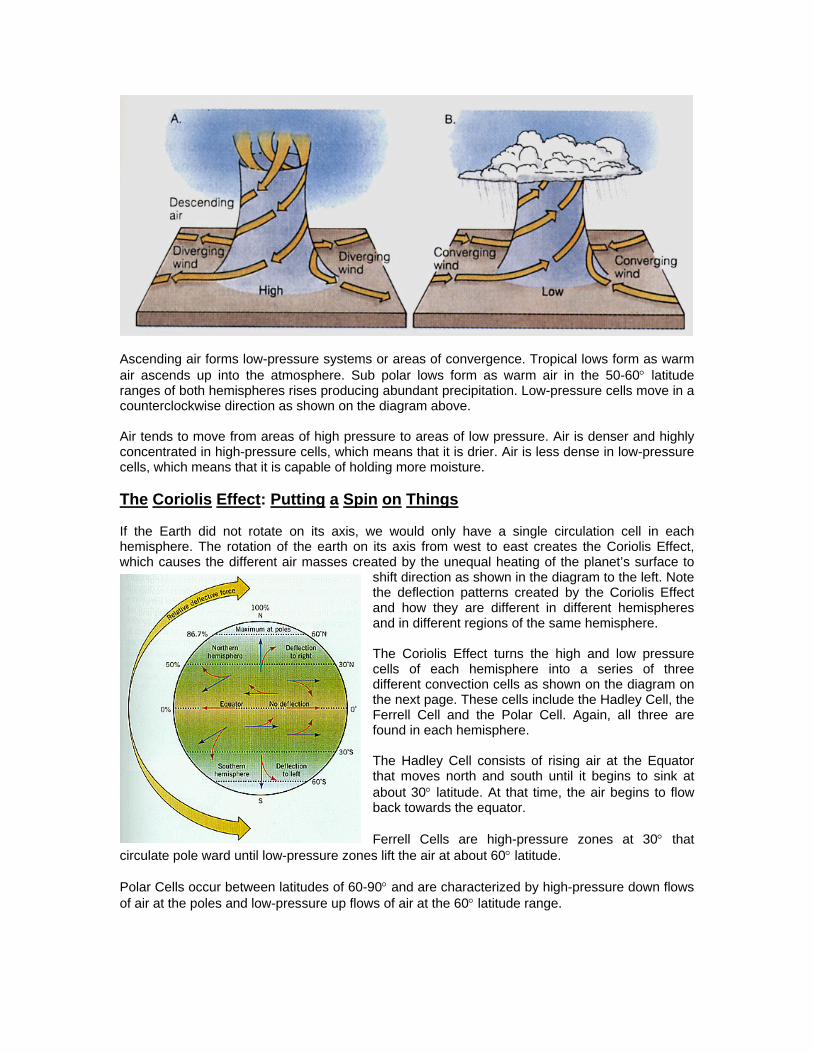
Ascending air forms low-pressure systems or areas of convergence. Tropical lows form as warm air ascends up into the atmosphere. Sub polar lows form as warm air in the 50-60° latitude ranges of both hemispheres rises producing abundant precipitation. Low-pressure cells move in a counterclockwise direction as shown on the diagram above. Air tends to move from areas of high pressure to areas of low pressure. Air is denser and highly concentrated in high-pressure cells, which means that it is drier. Air is less dense in low-pressure cells, which means that it is capable of holding more moisture. The Coriolis Effect: Putting a Spin on Things If the Earth did not rotate on its axis, we would only have a single circulation cell in each hemisphere. The rotation of the earth on its axis from west to east creates the Coriolis Effect, which causes the different air masses created by the unequal heating of the planet’s surface to
shift direction as shown in the diagram to the left. Note the deflection patterns created by the Coriolis Effect and how they are different in different hemispheres and in different regions of the same hemisphere. The Coriolis Effect turns the high and low pressure cells of each hemisphere into a series of three different convection cells as shown on the diagram on the next page. These cells include the Hadley Cell, the Ferrell Cell and the Polar Cell. Again, all three are found in each hemisphere. The Hadley Cell consists of rising air at the Equator that moves north and south until it begins to sink at about 30° latitude. At that time, the air begins to flow back towards the equator. Ferrell Cells are high-pressure zones at 30° that
circulate pole ward until low-pressure zones lift the air at about 60° latitude. Polar Cells occur between latitudes of 60-90° and are characterized by high-pressure down flows of air at the poles and low-pressure up flows of air at the 60° latitude range.
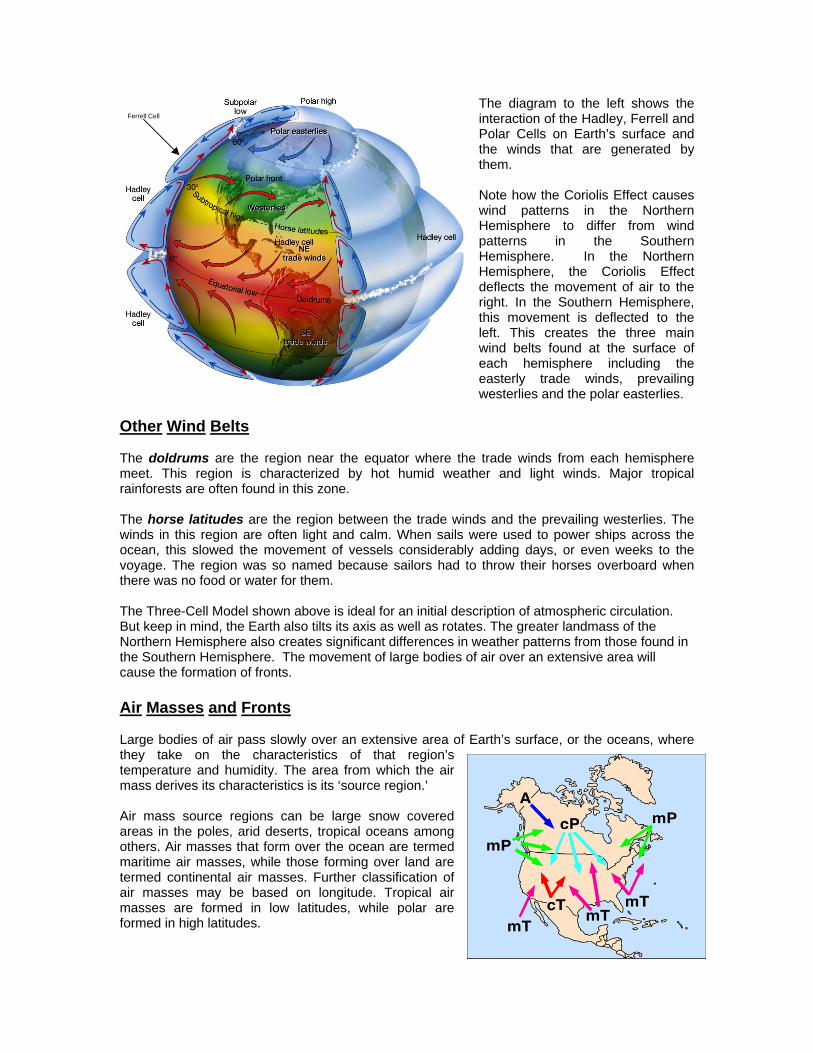
The diagram to the left shows the interaction of the Hadley, Ferrell and Polar Cells on Earth’s surface and the winds that are generated by them. Note how the Coriolis Effect causes wind patterns in the Northern Hemisphere to differ from wind patterns in the Southern Hemisphere. In the Northern Hemisphere, the Coriolis Effect deflects the movement of air to the right. In the Southern Hemisphere, this movement is deflected to the left. This creates the three main wind belts found at the surface of each hemisphere including the easterly trade winds, prevailing westerlies and the polar easterlies.
Other Wind Belts The doldrums are the region near the equator where the trade winds from each hemisphere meet. This region is characterized by hot humid weather and light winds. Major tropical rainforests are often found in this zone. The horse latitudes are the region between the trade winds and the prevailing westerlies. The winds in this region are often light and calm. When sails were used to power ships across the ocean, this slowed the movement of vessels considerably adding days, or even weeks to the voyage. The region was so named because sailors had to throw their horses overboard when there was no food or water for them. The Three-Cell Model shown above is ideal for an initial description of atmospheric circulation. But keep in mind, the Earth also tilts its axis as well as rotates. The greater landmass of the Northern Hemisphere also creates significant differences in weather patterns from those found in the Southern Hemisphere. The movement of large bodies of air over an extensive area will cause the formation of fronts. Air Masses and Fronts Large bodies of air pass slowly over an extensive area of Earth’s surface, or the oceans, where they take on the characteristics of that region’s temperature and humidity. The area from which the air mass derives its characteristics is its ‘source region.’ Air mass source regions can be large snow covered areas in the poles, arid deserts, tropical oceans among others. Air masses that form over the ocean are termed maritime air masses, while those forming over land are termed continental air masses. Further classification of air masses may be based on longitude. Tropical air masses are formed in low latitudes, while polar are formed in high latitudes.
Ferrell Cell
To make things even more interesting, meteorologists will combine the two classification categories as shown on the previous page into the following descriptions:
Air Mass Classification
Description of Air Mass
Continental Tropical (Ct)
Formed over land at low latitudes
Maritime Tropical (Mt)
Formed over sea at low latitudes
Continental Polar (Cp)
Formed over land at high latitudes
Maritime Polar (Mp)
Formed over water at high latitudes
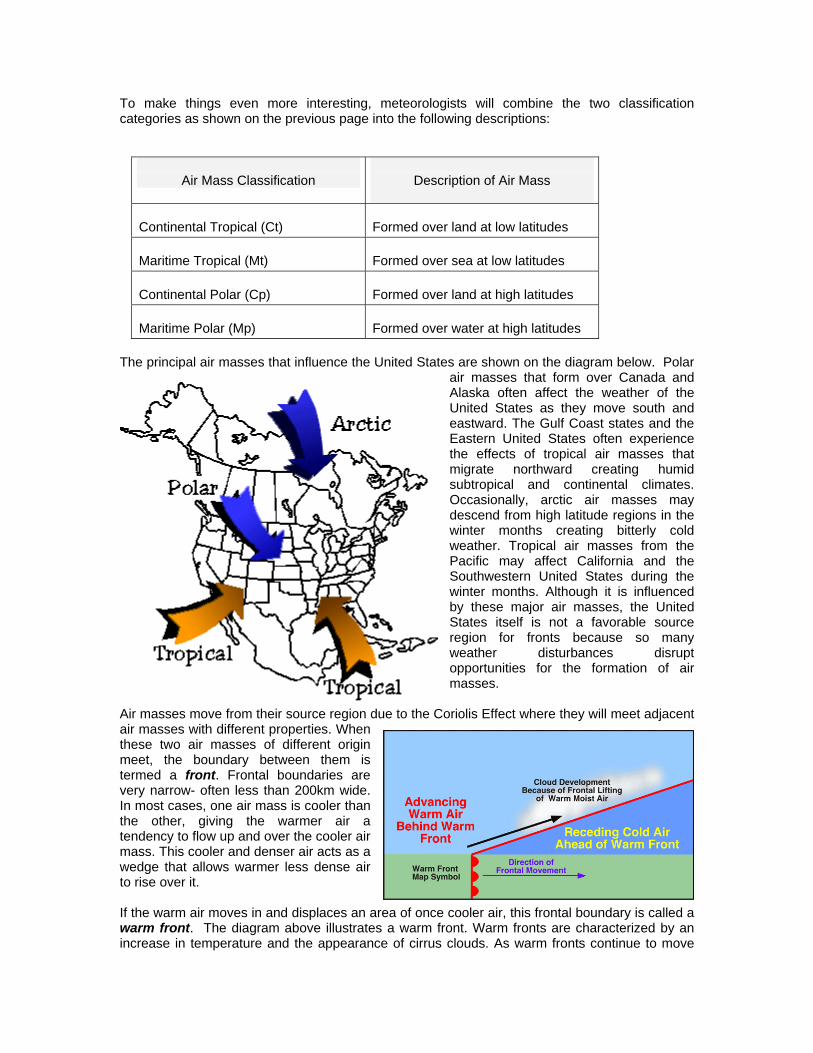
The principal air masses that influence the United States are shown on the diagram below. Polar
air masses that form over Canada and Alaska often affect the weather of the United States as they move south and eastward. The Gulf Coast states and the Eastern United States often experience the effects of tropical air masses that migrate northward creating humid subtropical and continental climates. Occasionally, arctic air masses may descend from high latitude regions in the winter months creating bitterly cold weather. Tropical air masses from the Pacific may affect California and the Southwestern United States during the winter months. Although it is influenced by these major air masses, the United States itself is not a favorable source region for fronts because so many weather disturbances disrupt opportunities for the formation of air masses.
Air masses move from their source region due to the Coriolis Effect where they will meet adjacent air masses with different properties. When these two air masses of different origin meet, the boundary between them is termed a front. Frontal boundaries are very narrow- often less than 200km wide. In most cases, one air mass is cooler than the other, giving the warmer air a tendency to flow up and over the cooler air mass. This cooler and denser air acts as a wedge that allows warmer less dense air to rise over it. If the warm air moves in and displaces an area of once cooler air, this frontal boundary is called a warm front. The diagram above illustrates a warm front. Warm fronts are characterized by an increase in temperature and the appearance of cirrus clouds. As warm fronts continue to move
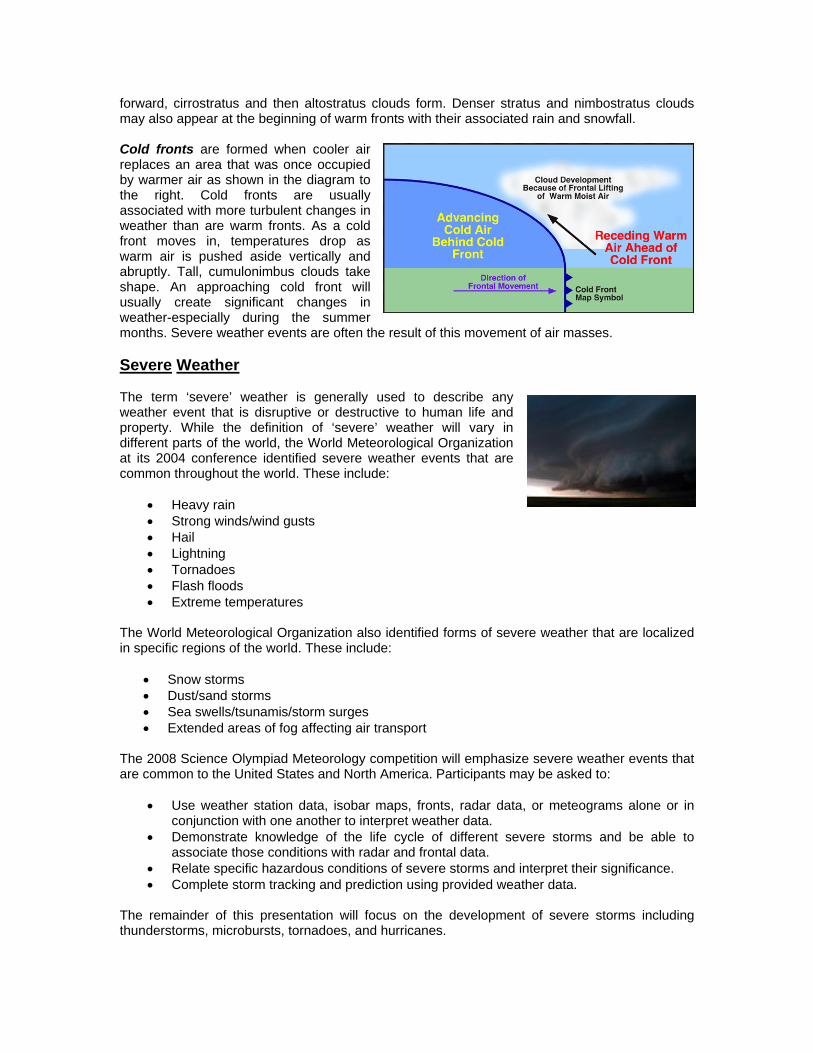
forward, cirrostratus and then altostratus clouds form. Denser stratus and nimbostratus clouds may also appear at the beginning of warm fronts with their associated rain and snowfall. Cold fronts are formed when cooler air replaces an area that was once occupied by warmer air as shown in the diagram to the right. Cold fronts are usually associated with more turbulent changes in weather than are warm fronts. As a cold front moves in, temperatures drop as warm air is pushed aside vertically and abruptly. Tall, cumulonimbus clouds take shape. An approaching cold front will usually create significant changes in weather-especially during the summer months. Severe weather events are often the result of this movement of air masses. Severe Weather The term ‘severe’ weather is generally used to describe any weather event that is disruptive or destructive to human life and property. While the definition of ‘severe’ weather will vary in different parts of the world, the World Meteorological Organization at its 2004 conference identified severe weather events that are common throughout the world. These include:
• Heavy rain • Strong winds/wind gusts • Hail • Lightning • Tornadoes • Flash floods • Extreme temperatures
The World Meteorological Organization also identified forms of severe weather that are localized in specific regions of the world. These include:
• Snow storms • Dust/sand storms • Sea swells/tsunamis/storm surges • Extended areas of fog affecting air transport
The 2008 Science Olympiad Meteorology competition will emphasize severe weather events that are common to the United States and North America. Participants may be asked to:
• Use weather station data, isobar maps, fronts, radar data, or meteograms alone or in conjunction with one another to interpret weather data.
• Demonstrate knowledge of the life cycle of different severe storms and be able to associate those conditions with radar and frontal data.
• Relate specific hazardous conditions of severe storms and interpret their significance. • Complete storm tracking and prediction using provided weather data.
The remainder of this presentation will focus on the development of severe storms including thunderstorms, microbursts, tornadoes, and hurricanes.
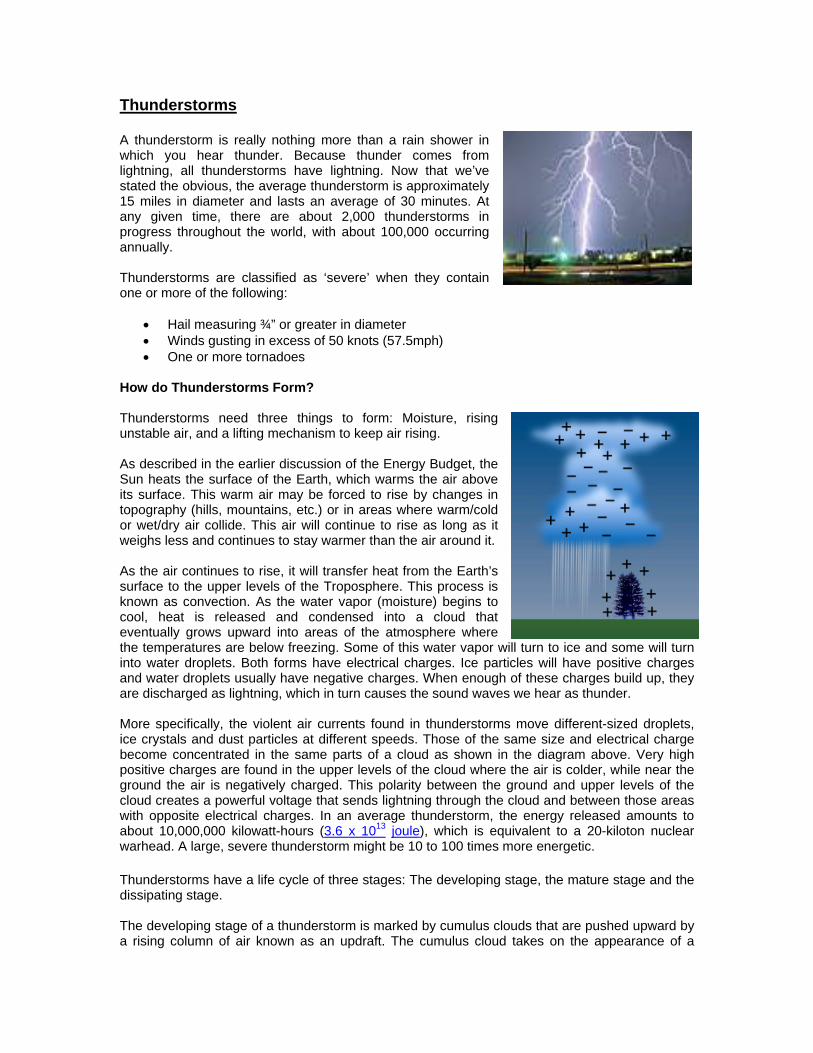
Thunderstorms A thunderstorm is really nothing more than a rain shower in which you hear thunder. Because thunder comes from lightning, all thunderstorms have lightning. Now that we’ve stated the obvious, the average thunderstorm is approximately 15 miles in diameter and lasts an average of 30 minutes. At any given time, there are about 2,000 thunderstorms in progress throughout the world, with about 100,000 occurring annually. Thunderstorms are classified as ‘severe’ when they contain one or more of the following:
• Hail measuring ¾” or greater in diameter • Winds gusting in excess of 50 knots (57.5mph) • One or more tornadoes
How do Thunderstorms Form? Thunderstorms need three things to form: Moisture, rising unstable air, and a lifting mechanism to keep air rising. As described in the earlier discussion of the Energy Budget, the Sun heats the surface of the Earth, which warms the air above its surface. This warm air may be forced to rise by changes in topography (hills, mountains, etc.) or in areas where warm/cold or wet/dry air collide. This air will continue to rise as long as it weighs less and continues to stay warmer than the air around it. As the air continues to rise, it will transfer heat from the Earth’s surface to the upper levels of the Troposphere. This process is known as convection. As the water vapor (moisture) begins to cool, heat is released and condensed into a cloud that eventually grows upward into areas of the atmosphere where the temperatures are below freezing. Some of this water vapor will turn to ice and some will turn into water droplets. Both forms have electrical charges. Ice particles will have positive charges and water droplets usually have negative charges. When enough of these charges build up, they are discharged as lightning, which in turn causes the sound waves we hear as thunder. More specifically, the violent air currents found in thunderstorms move different-sized droplets, ice crystals and dust particles at different speeds. Those of the same size and electrical charge become concentrated in the same parts of a cloud as shown in the diagram above. Very high positive charges are found in the upper levels of the cloud where the air is colder, while near the ground the air is negatively charged. This polarity between the ground and upper levels of the cloud creates a powerful voltage that sends lightning through the cloud and between those areas with opposite electrical charges. In an average thunderstorm, the energy released amounts to about 10,000,000 kilowatt-hours (3.6 x 10¹³ joule), which is equivalent to a 20-kiloton nuclear warhead. A large, severe thunderstorm might be 10 to 100 times more energetic. Thunderstorms have a life cycle of three stages: The developing stage, the mature stage and the dissipating stage. The developing stage of a thunderstorm is marked by cumulus clouds that are pushed upward by a rising column of air known as an updraft. The cumulus cloud takes on the appearance of a
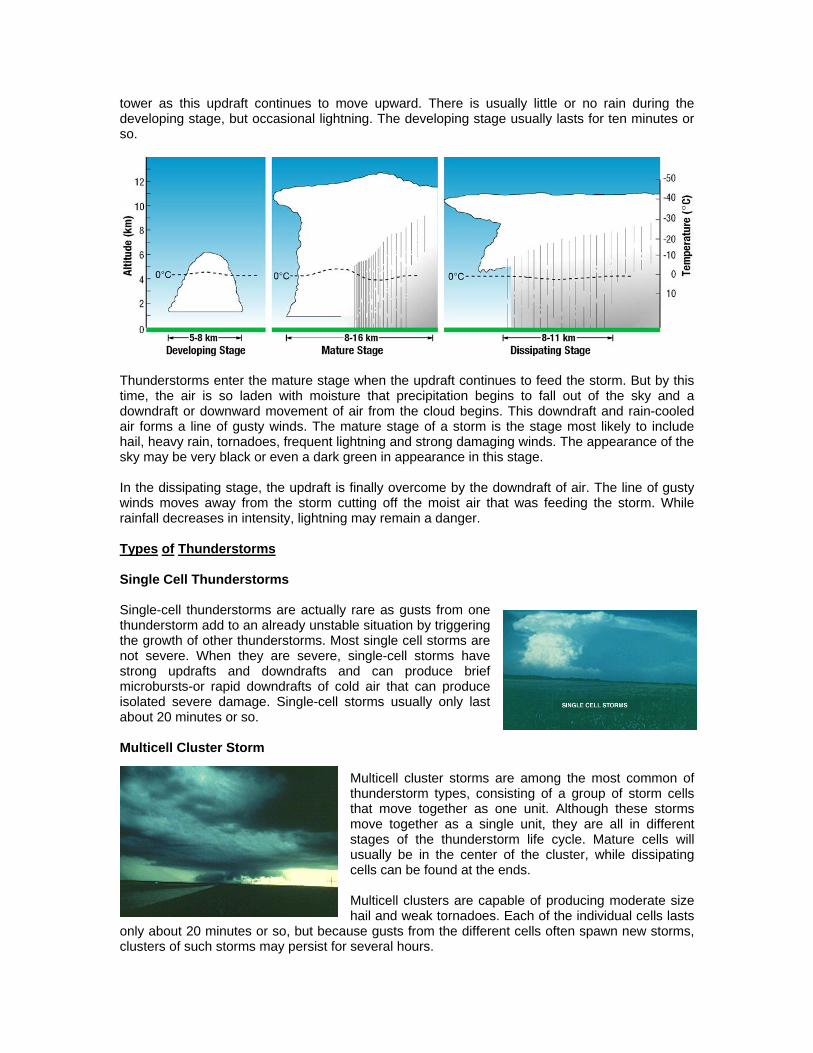
tower as this updraft continues to move upward. There is usually little or no rain during the developing stage, but occasional lightning. The developing stage usually lasts for ten minutes or so.
Thunderstorms enter the mature stage when the updraft continues to feed the storm. But by this time, the air is so laden with moisture that precipitation begins to fall out of the sky and a downdraft or downward movement of air from the cloud begins. This downdraft and rain-cooled air forms a line of gusty winds. The mature stage of a storm is the stage most likely to include hail, heavy rain, tornadoes, frequent lightning and strong damaging winds. The appearance of the sky may be very black or even a dark green in appearance in this stage. In the dissipating stage, the updraft is finally overcome by the downdraft of air. The line of gusty winds moves away from the storm cutting off the moist air that was feeding the storm. While rainfall decreases in intensity, lightning may remain a danger. Types of Thunderstorms Single Cell Thunderstorms Single-cell thunderstorms are actually rare as gusts from one thunderstorm add to an already unstable situation by triggering the growth of other thunderstorms. Most single cell storms are not severe. When they are severe, single-cell storms have strong updrafts and downdrafts and can produce brief microbursts-or rapid downdrafts of cold air that can produce isolated severe damage. Single-cell storms usually only last about 20 minutes or so. Multicell Cluster Storm
Multicell cluster storms are among the most common of thunderstorm types, consisting of a group of storm cells that move together as one unit. Although these storms move together as a single unit, they are all in different stages of the thunderstorm life cycle. Mature cells will usually be in the center of the cluster, while dissipating cells can be found at the ends. Multicell clusters are capable of producing moderate size hail and weak tornadoes. Each of the individual cells lasts
only about 20 minutes or so, but because gusts from the different cells often spawn new storms, clusters of such storms may persist for several hours.
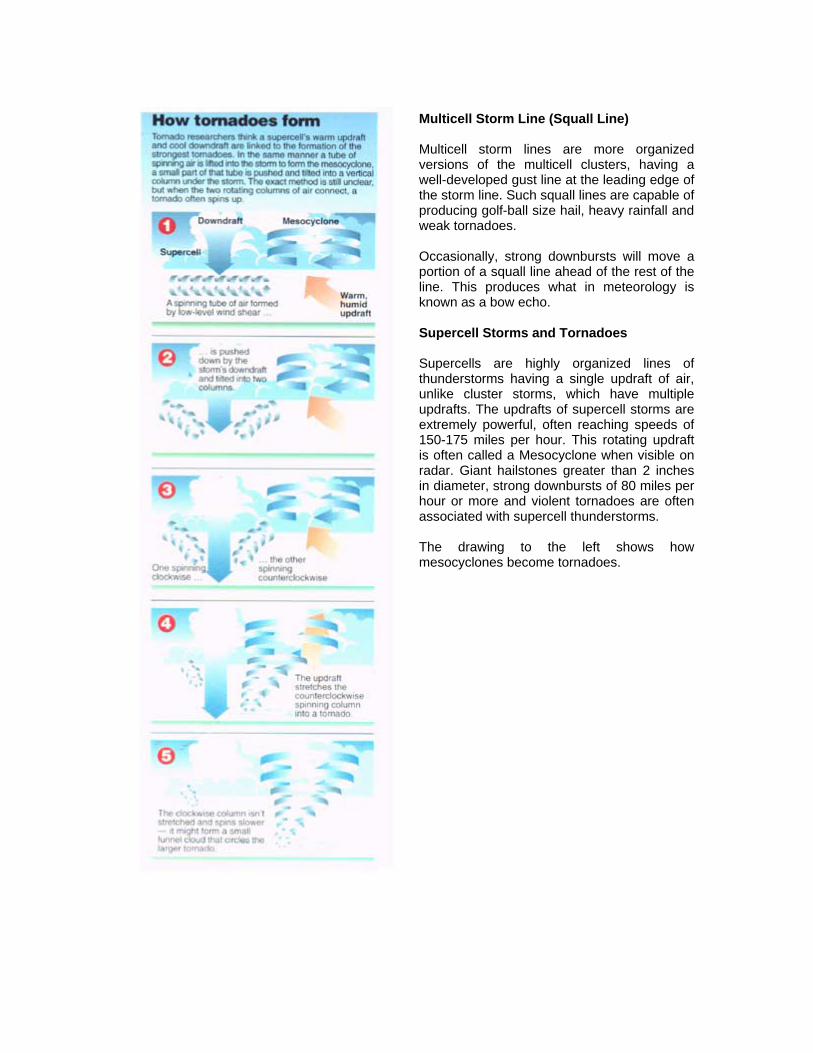
Multicell Storm Line (Squall Line) Multicell storm lines are more organized versions of the multicell clusters, having a well-developed gust line at the leading edge of the storm line. Such squall lines are capable of producing golf-ball size hail, heavy rainfall and weak tornadoes. Occasionally, strong downbursts will move a portion of a squall line ahead of the rest of the line. This produces what in meteorology is known as a bow echo. Supercell Storms and Tornadoes Supercells are highly organized lines of thunderstorms having a single updraft of air, unlike cluster storms, which have multiple updrafts. The updrafts of supercell storms are extremely powerful, often reaching speeds of 150-175 miles per hour. This rotating updraft is often called a Mesocyclone when visible on radar. Giant hailstones greater than 2 inches in diameter, strong downbursts of 80 miles per hour or more and violent tornadoes are often associated with supercell thunderstorms. The drawing to the left shows how mesocyclones become tornadoes.