Metapopulations I. So far, we have looked at populations with the assumption of geographic closure:...
23
Metapopulations I. far, we have looked at populations wit the assumption of geographic closure: no immigration, no emigration What if we relax that assumption?
-
date post
21-Dec-2015 -
Category
Documents
-
view
217 -
download
2
Transcript of Metapopulations I. So far, we have looked at populations with the assumption of geographic closure:...
Metapopulations I.
So far, we have looked at populations with the assumption of geographic closure:no immigration, no emigration
What if we relax that assumption?

What is a metapopulation?
“Set of local populations occupying anarray of habitat patches and linked bythe movements of individuals”
Movement: emigration and immigrationnot back-and-forth movementsof individuals


Example of metapopulation: spotted owls in southern CA
(Ricklefs and Miller 2000 p. 331)

Origin
The term was first used by RichardLevins in 1969 and 1970
Levins’ model looked at patch occupancy:colonization and extinction events
Also known as the “classical” model or“blinking light” model
What was the persistence time of themetapopulation overall?

Does the idea work?
Many species seem to have ametapopulation structure….
Butterflies
Pool Frogs
Furbish’s LousewortPikas
Bull Trout
Acorn Woodpeckers

Different kinds of patchy populations….
•Classic metapopulation (Levins)
•Mainland-island metapopulationmigrant flow from big patch to small
•Patchy population (too much migrationfor a metapopulation)
•Separate populations (no migration at all,or very little)

An illustration:
(from Harrison and Taylor 1997)

A closer look at the classical model
dP/dt = mP(1-P) – eP
P: number of occupied patches
e: extinction rate
m: colonization rate
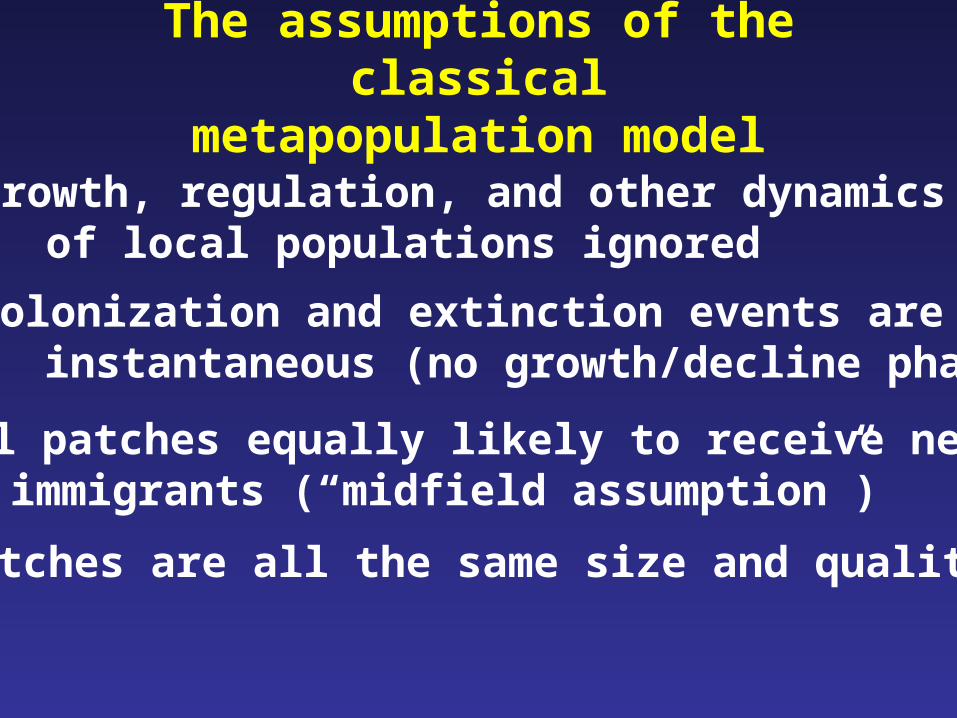
The assumptions of the classicalmetapopulation model
•Growth, regulation, and other dynamicsof local populations ignored
•Colonization and extinction events areinstantaneous (no growth/decline phase)
•All patches equally likely to receive newimmigrants (“midfield assumption”)
•Patches are all the same size and quality

The classical model
Immigrants only matter when they colonize an empty patch
Is a patch occupied, or not?
How long will the metapopulation persist?

What if we add some realism?
Most of the time, the distance betweenpatches does matter
Size also matters- patch size and distancefrom another patch also interact
Isolated patches that are also large arerelatively more likely to be occupiedthan small isolated patches
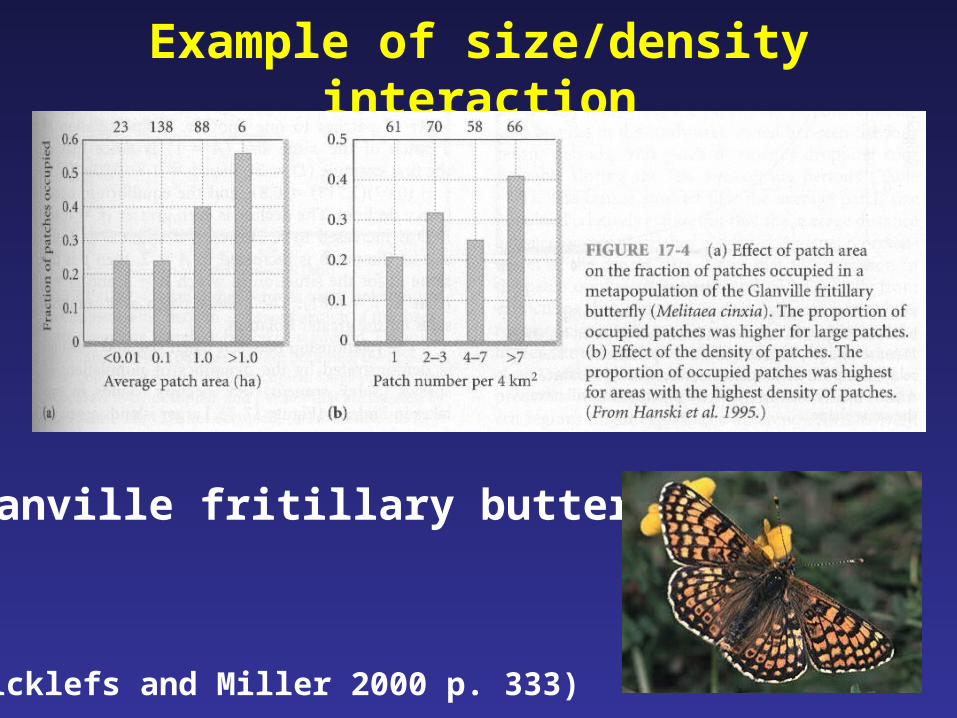
Example of size/density interaction
Glanville fritillary butterfly
(Ricklefs and Miller 2000 p. 333)

Example of size/isolation interaction
Common shrew(sorex araneus)
(Ricklefs and Miller 2000, p. 335)

The Rescue Effect
Populations may be saved fromextinction by arrival of immigrants
Example: acorn woodpecker populationin New Mexico

Acorn Woodpeckers
Population persistencedepends on immigrantsfrom populations whose
dynamics vary independently

Source-sink dynamics
Some patches are inherently betterquality than others
These patches support growingpopulations that produce emigrants
Other patches are poorer quality,and populations can only bemaintained by immigration

Example: Eastern Kingbird
Metapopulation in Charlotte Valley, NY
Inhabited upland, floodplain, and riparianzone habitats
Demographic rates and movementsamong breeding populations werestudied for 10 years
M. Murphy. 2000. Cons. Biol. 15:737-748.

Example: Eastern Kingbirds
Survival was highestin floodplain, butproductivity waslowest there
Riparian subpopulation was stable, butother two were declining
(M. Murphy. 2001. Ecology 82:1304-1318)

Example: Eastern Kingbirds
Modeling suggestedthat metapopulationoverall is a sink.
If riparian survival Increased slightly, the
Entire metapopulation would be sustained.
(M. Murphy, 2001. Cons Biol. 15:737-748)

Example: Eastern Kingbirds
Murphy suggestedthat creek habitat actedas a “pseudosink”
A pseudosink is a patch with density-dependent effects on demographic ratesso it seems unsustainable; if densitydeclined, demographic rates would improve

Another Example
Demographic rates in a patch may varynot only with density, but with environmental conditions-
A patch may be a source one year,and a sink the next.
Burrowing owls at NAS Lemoore, CA

Burrowing owls (again)
Population Growth of Burrowing Owls
0
10
20
30
40
50
60
70
80
90
1997 1998 1999 2000
Year
Nu
mb
er o
f N
ests
0
0.3
0.6
0.9
1.2
1.5Number of Nests
Population growth rate
(Gervais 2002)