Metaphor Research in the 21st Century: A Bibliographic ...
20
Computer Science and Information Systems 18(1):303–321 https://doi.org/10.2298/CSIS201109059Z Metaphor Research in the 21st Century: A Bibliographic Analysis Dongyu Zhang 1 , Minghao Zhang 1 , Ciyuan Peng 2 , Jason J. Jung 2 , and Feng Xia 3? 1 School of Software, Dalian University of Technology, Dalian 116620, China [email protected], [email protected] 2 Department of Computer Engineering, Chung-Ang University, Seoul 156-756, Korea [email protected], [email protected] 3 School of Engineering, IT and Physical Sciences, Federation University Australia, Ballarat 3353, Australia [email protected] Abstract. Metaphor is widely used in human communication. The cohort of schol- ars studying metaphor in various fields is continuously growing, but very few work has been done in bibliographical analysis of metaphor research. This paper exam- ines the advancements in metaphor research from 2000 to 2017. Using data re- trieved from Microsoft Academic Graph and Web of Science, this paper makes a macro analysis of metaphor research, and expounds the underlying patterns of its development. Taking into consideration sub-fields of metaphor research, the internal analysis of metaphor research is carried out from a micro perspective to reveal the evolution of research topics and the inherent relationships among them. This paper provides novel insights into the current state of the art of metaphor research as well as future trends in this field, which may spark new research interests in metaphor from both linguistic and interdisciplinary perspectives. Keywords: metaphor, literature analysis, statistical analysis, scholarly big data. 1. Introduction Metaphor is an indispensable part of human communication. According to empirical stud- ies, every three sentences in natural language uses a metaphor [38,43]. It is not only a universal linguistic phenomenon but also a means for people to understand and cog- nize [29]. Humans frequently use one concept in metaphors to describe another concept for reasoning. For instance, in the metaphorical utterance: ‘experience is a treasure,’ we use ‘treasure’ to describe ‘experience’ to emphasize that ‘experience’ can be valuable. A metaphor has been viewed as a mapping system that conceptualizes one domain (target) in terms of another (source) [29]. In particular, along with the rapid explosion of social me- dia applications such as Facebook and Twitter, metaphorical texts and information have increased dramatically. It seems to be very common for Internet users to use vivid and col- orful metaphorical expressions on social media on a variety of topics including, products, services, public events, tidbits of their life, etc. An increasing number of researchers have studied metaphor from different perspec- tives in fields like linguistics [47,41,37,52], psychology [35,27,33,20], neuroscience [1,22,15,17], ? Corresponding author
Transcript of Metaphor Research in the 21st Century: A Bibliographic ...

Computer Science and Information Systems 18(1):303–321 https://doi.org/10.2298/CSIS201109059Z
Metaphor Research in the 21st Century: A BibliographicAnalysis
Dongyu Zhang1, Minghao Zhang1, Ciyuan Peng2, Jason J. Jung2, and Feng Xia3?
1 School of Software, Dalian University of Technology, Dalian 116620, [email protected], [email protected]
2 Department of Computer Engineering, Chung-Ang University, Seoul 156-756, [email protected], [email protected]
3 School of Engineering, IT and Physical Sciences, Federation University Australia, Ballarat3353, [email protected]
Abstract. Metaphor is widely used in human communication. The cohort of schol-ars studying metaphor in various fields is continuously growing, but very few workhas been done in bibliographical analysis of metaphor research. This paper exam-ines the advancements in metaphor research from 2000 to 2017. Using data re-trieved from Microsoft Academic Graph and Web of Science, this paper makes amacro analysis of metaphor research, and expounds the underlying patterns of itsdevelopment. Taking into consideration sub-fields of metaphor research, the internalanalysis of metaphor research is carried out from a micro perspective to reveal theevolution of research topics and the inherent relationships among them. This paperprovides novel insights into the current state of the art of metaphor research as wellas future trends in this field, which may spark new research interests in metaphorfrom both linguistic and interdisciplinary perspectives.
Keywords: metaphor, literature analysis, statistical analysis, scholarly big data.
1. Introduction
Metaphor is an indispensable part of human communication. According to empirical stud-ies, every three sentences in natural language uses a metaphor [38,43]. It is not onlya universal linguistic phenomenon but also a means for people to understand and cog-nize [29]. Humans frequently use one concept in metaphors to describe another conceptfor reasoning. For instance, in the metaphorical utterance: ‘experience is a treasure,’ weuse ‘treasure’ to describe ‘experience’ to emphasize that ‘experience’ can be valuable. Ametaphor has been viewed as a mapping system that conceptualizes one domain (target) interms of another (source) [29]. In particular, along with the rapid explosion of social me-dia applications such as Facebook and Twitter, metaphorical texts and information haveincreased dramatically. It seems to be very common for Internet users to use vivid and col-orful metaphorical expressions on social media on a variety of topics including, products,services, public events, tidbits of their life, etc.
An increasing number of researchers have studied metaphor from different perspec-tives in fields like linguistics [47,41,37,52], psychology [35,27,33,20], neuroscience [1,22,15,17],
? Corresponding author
304 Zhang et al.
management [54,39,13,2], and computer science [48,36,55,19]. Since metaphor researchhas been developing dramatically, it is necessary to review the current situation, the devel-opment and trends of metaphor research, as well as studying how metaphor research hasevolved through time. This may make contributions to some novel and interesting studiesof metaphors from both linguistic and interdisciplinary perspectives as well as exploringthe related underlying mechanism. Previous studies have shown that quantitative analysiscan explain the nature of a particular discipline or field and changes in research focusover time [34,8]. Researchers can use some information platforms, such as AMiner [50],Google Scholar [10], Microsoft Academic Services [51], and many other scientific onlinesystems [49]. These information platforms contain useful data, including but not limitedto authors, papers, and references, and they can carry out statistical analysis. So far, basedon the above academic systems, a large number of related works have applied quantita-tive analysis techniques in scientometrics. [25] used bibliographic analysis to summarizehuman interactions. [24] reviewed various studies using online social networks to identifypersonality, as reported in the literature. [8] made a quantitative assessment of mappingthe intellectual structure and development of computer-supported cooperative work. [31]used complex network topology to study the evolution of artificial intelligence. Also, [45]made contributions to the research in the field of transportation.
Numerous theories and technologies of literature analysis based on big scholarly datahave been proposed [53,32,56,26]. However, so far, few people have collected bibliomet-rics data to analyze metaphor quantitatively and to comprehend its internal structure aswell as evolution. To fill this gap, in this paper, we carry out a bibliometric analysis ofthe development of metaphor research in the early 21st century, based on the followingfour aspects. First, we analyze the development of metaphor research by counting the in-crement of the number of publications over time. Second, we emphasize influence andcitation patterns to distinguish the behavioral dynamics of citation. Third, we try to quan-tify milestones during this period through identification of the characteristics of influentialpapers, researchers, and institutions. Finally, we explore the internal structure of metaphorresearch by analyzing the evolution of themes and mutual attraction.
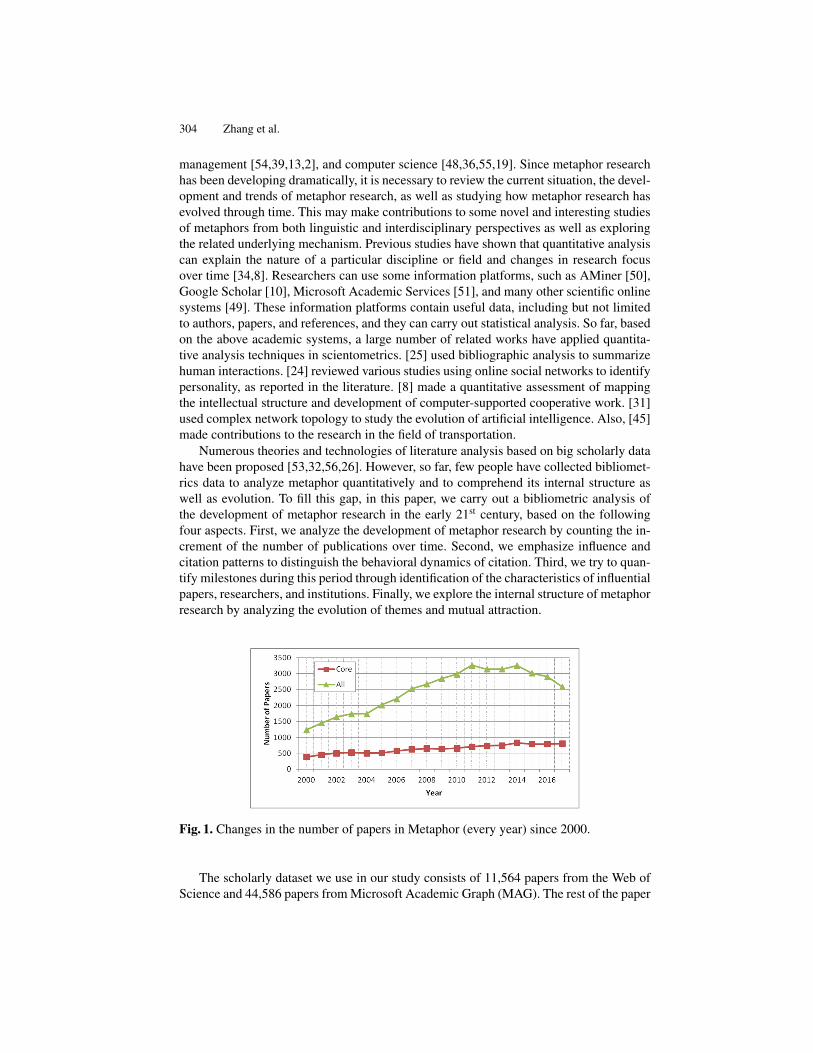
Fig. 1. Changes in the number of papers in Metaphor (every year) since 2000.
The scholarly dataset we use in our study consists of 11,564 papers from the Web ofScience and 44,586 papers from Microsoft Academic Graph (MAG). The rest of the paper

Metaphor Research in the 21st Century 305
Fig. 2. The number of authors every years.
is organized as follows. Section 2 provides the methodologies and models we use for ouranalysis. Section 3 introduces the experimental results we obtained from our literatureanalysis. Section 4 concludes the paper and provides some directions for the future.
2. Methods
In this section, we first introduce the data set we use to analyze metaphors: core data setsand extended data sets. Then we introduce several indicators for measuring the importanceof authors and institutions in the field of metaphor research and their calculation methods.Finally, we introduce the division of the field of metaphor research.
2.1. Datasets
For conducting experiment, we employ MAG data set (http://research.microsoft.com/en-us/projects/mag/) —a widely used and one of the best databases for em-pirical research in scientometrics and citation analysis [42,51]. Hence, to investigate thecurrent state of metaphor research, we extract the papers from the MAG data set, whichcontains six entities: affiliations, authors, conferences, fields of study, journals, and pa-pers. The new MAG data set contains new relationships in the field of study with pa-pers. First, we limit the publication time of the articles to 2000 and beyond. Then, fromthese papers, we select articles that comprise at least one of the following six words intheir title or abstract: metaphor, metaphorical, metaphorically, Metaphor, Metaphorical,or Metaphorically. We use all the extracted papers as our extended data set containing44,586 articles, of which 1,872 are conference papers. Because the number of conferencepapers was inadequate, we do not consider its particularity, and we do not give it anyspecial treatment.
Additionally, we found all the journals related to metaphors from the Web of Sciencedatabase (http://isiknowledge.com), of which there are about a thousand. Weextract these journals as a list of our core journals. Then, based on the list of core journals,we extract the articles published in the core journals from the papers of the extended dataset as our core data set. It contains 11,564 articles.
We use the same statistics and calculations for both the core data set and the extendeddata set.

306 Zhang et al.
Fig. 3. The growth rate of authors as well as total publications every two years.
Fig. 4. The average number of authors per paper.
2.2. Indicators and calculation methods
We consider the following indicators to assess the relevance of authors as well as publi-cations in this field.
– Measuring research output by measurement: We assume that the coredata set or the extended data set is P , and we use statistical methods to calculatethe total number of articles in the data set denoted as |P |, total number of authors∑p∈P |Ap|, total number of citations
∑p∈P |Cip|, and total number of references∑
p∈P |Rp|. We then calculate the average number of authors per paper∑
p∈P|Ap|
|P | ,
the average number of citations per paper∑
p∈P|Cip|
|P | , the average number of refer-
ences per paper∑
p∈P|Rp|
|P | , and the average number of papers per author |P |∑p∈P|Ap|
(|Ap| represents the total number of authors of the paper, |Cip| represents the totalnumber of citations of the paper, and |Rp| represents the total number of referencesof the paper).
– self-citation rate: In addition, to reflect the dynamics of the researcher’sreference behavior, we use the most rigorous self-guided definition as our evaluationheight, that is, if both referenced papers have at least one mutual author, then there are

Metaphor Research in the 21st Century 307
Table 1. Ranking of papers based on the total number of citations received in2000-2017in core dataset papers.No. Title Citations Published Year
1 Knowledge and organization: A social-practice perspective[5] 2,044 20012 The network structure of social capital[6] 1,922 20003 Adaptive subgradient methods for online learning and stochastic
optimization[12]1,609 2011
4 From metaphor to measurement: Resilience of what to what?[7] 1,348 20015 Community resilience as a metaphor, theory, set of capacities, and
strategy for disaster readiness[35]1,279 2008
6 Social and psychological resources and adaptation[23] 1,234 20027 Relational frame theory: A post-Skinnerian account of human lan-
guage and cognition[21]1,185 2001
8 Modern social imaginaries[46] 1,150 20029 Where mathematics comes from: How the embodied mind brings
mathematics into being[30]993 2000
10 The evolution of foresight: What is mental time travel and is itunique to humans?[44]
800 2007
11 A thorough benchmark of density functional methods for gen-eral main group thermochemistry, kinetics, and noncovalentinteractions[16]
724 2011
12 Self-control relies on glucose as a limited energy source: Willpoweris more than a metaphor[14]
723 2007
13 Scale-free networks provide a unifying framework for the emer-gence of cooperation[40]
696 2005
14 The surveillant assemblage[18] 692 200015 Metaphoric structuring: Understanding time through spatial
metaphors[4]685 2000
two references between these references. The paper is self-cited by the author. It can
be computed as∑
r∈R|Ar|
|R| , where |R| is the total number of references of the paperand |Ar| is the number of author self-citation. Similarly, a self-journal (conference)is when the paper and one or more of its references are published in the same journal
(conference). This can be computed as∑
r∈R|Jr|
|Jr| , where |R| is the total number ofreferences in the paper and |Jr| is the number of journal (conference) self-citations.Self-affiliation is when the paper and one or more of its references come from same
affiliation. This can be computed as∑
r∈R|Affr||R| , where |R| is the total number of
references in the paper and |Jr| is the number of journal (conference) self-citations.
2.3. The inner structure of metaphor
– Topic exploration: The study of metaphor is not an independent discipline,but an interdisciplinary science. The MAG data set constructs the domain into a forestof six-layered tree structures. The new MAG data set also contains new relationships

308 Zhang et al.
Fig. 5. The average productivity of Metaphor scientists.
Fig. 6. Changes in references.
in the field of study. Therefore, we can easily divide the topic of metaphor research.In the end, we choose the root node of each tree as the topic of metaphor research.The core data set and the extended data set have the same 19 topics: psychology, so-ciology, computer science, economics, medicine, biology, mathematics, philosophy,engineering, business, history, physics, political science, chemistry, geography, ge-ology, art, environmental science, and materials science. We also select the top 50secondary fields with the largest number of articles for our subsequent analysis.
– The relevance of the topics: To investigate the relevance of the topicsfurther, given the two topics A and B, we calculate the probability of B occurringgiven A’s occurrence as follows.First, we compute the probability of Topics A and B’s occurrence as PA = NA
N andPB = NB
N , where |NA| and |NB | represent the total number of papers belong toTopic A and Topic B, respectively. |N | is the total number of papers.Second, we calculate the probability of Topics A and B appearing simultaneously asPAB = NAB
N , where |NAB | is the number of articles simultaneously belongs to TopicA and Topic B, respectively.Finally, we obtain the probability that A appears under the condition that B appearsby P (A|B) = PAB
PB.
Using the above method, we calculate the probability relationships between the top50 secondary fields containing the largest number of articles for later analysis work.

Metaphor Research in the 21st Century 309
Fig. 7. Average number of references per paper.
Fig. 8. The average age differences between the cited paper and the citing paper.
– Proportion of the topic in different years: To observe the evo-lution of the topic over time, we use θ[t]k [31] to represent the proportion of the topick at t year. It can be seen that θ is the average topic distribution in all articles. Thisindicator allows us to quantify the importance of topics over a specific period. Wecompute the indicator in the root field.
– Popular topics: To measure the trend of a field over time, we calculate the
variety index between two periods with rk =
∑2017
t=2010θ[t]
k∑2009
t=2000θ[t]
k
. We compute the indicator
in the root field. When rk > 1, this field is more popular in 2010-2017 than in 2000-2009. While rk < 1, the research in this field reduced in 2010-2017. Further, whenrk = 1, there is no change.
– Network of topic co-presence: Article co-citation analysis is often usedto identify developments in the field of research by exploring common citation re-lationships between references as a basis for assessing and planning scientific andtechnical research. In a visual network map, the lines in the document co-citationnetwork represent the frequency with which other publications in the same data setrefer to both publications. Based on the similarities of the research, the networkcan be divided into different groups. [31] conducted an experiment of joint cita-tion analysis to reveal the evolution of the field of social simulation. Following their

310 Zhang et al.
Fig. 9. The number of citations per year and the average number of papers cited.
steps, we use this method to build a topic coexistence network to discover the in-terconnection patterns between them. Based on the correlations of the subjects PA,PB , and PAB , which we compute before, we calculate the coexistence coefficientco =
P 2AB
min(PA,PB)∗mean(PA,PB) . Therefore, we choose themes with co(A,B) > 0.1
to build coexistence. We calculate the index between the top 50 secondary fields con-taining the largest number of articles for later analysis work.
3. Results
3.1. Evolution of metaphor
As Fig. 1 shows, in the whole development process of metaphor research, the numberof papers on metaphor published every year continues to increase in both the core dataset and the whole data set. This finding shows that metaphor research has become moreand more popular in recent years. Could this be the result of an increase in the numberof researchers? To verify this conjecture, as shown in Fig. 2, we analyze the number ofauthors in the data set, and we found that the growth rate of authors has the same trend asthe number of papers, but it is slightly higher (Fig. 3). We conclude that the increase inthe number of authors might stimulate an increase in the number of metaphorical papers.
Fig. 10. Institutional self-citation rate, Paper self-citation rate, and Conference andjournal self-citation rate.

Metaphor Research in the 21st Century 311
Table 2. Ranking of papers based on the total number of citations received in 2000-2017in all dataset papers.No. Title Citations Published Year
1 Knowledge and organization: A social-practice perspective [5] 2,044 20012 The network structure of social capital[6] 1,922 20003 Adaptive subgradient methods for online learning and stochastic
optimization[12]1,609 2011
4 From metaphor to measurement: Resilience of what to what?[7] 1,348 20015 Community resilience as a metaphor, theory, set of capacities, and
strategy for disaster readiness[35]1,279 2008
6 Social and psychological resources and adaptation[23] 1,234 20027 Relational frame theory: A post-Skinnerian account of human lan-
guage and cognition[21]1,185 2001
8 Modern social imaginaries[46] 1,150 20029 Negotiation as a metaphor for distributed problem solving[9] 1,092 200310 Where mathematics comes from: How the embodied mind brings
mathematics into being[30]993 2000
11 Animation: Can it facilitate?[3] 928 200212 Model-driven data acquisition in sensor networks[11] 848 200413 The evolution of foresight: What is mental time travel and is it
unique to humans? [44]800 2007
14 A thorough benchmark of density functional methods for generalmain group thermochemistry, kinetics, and noncovalent interac-tions. [16]
724 2011
15 Self-control relies on glucose as a limited energy source: Willpoweris more than a metaphor [14]
723 2007

312 Zhang et al.
Since some conferences are held every two years, the number of papers and the overallresults are affected. The primary purpose of conferences is to provide opportunities forscientists to communicate and to understand what others are doing. They can publish theirresearch results as soon as possible, which is very important for timely subjects. Journalpapers, by contrast, have a longer review cycle, which can lead to fluctuations in growthrates. Most of the data in our statistics come from journal papers, and a small part comefrom conference papers. Although we put the two types of papers together for statisticalanalysis, to explain the development of this discipline better, we analyze the growth rateby using the data from every two years as a unit.
Besides, Fig. 4 plots the average number of authors per paper over time, and a clear up-ward trend can be seen from the fit curve, indicating that collaborative papers are becom-ing more common. We also observe that the average number of publications per authordeclined over time (Fig. 5), indicating that average productivity was weakening duringthis period.
Table 3. Ranking of authors based on the average number of citations per paper during2000-2017 (Core dataset Author).No. Name Organization Citation Paper Citations
per Paper
1 John Seely Brown PARC 2044 1 20442 Paul Duguid University of California, Berkeley 2044 1 20443 John C. Duchi Stanford University 1609 1 16094 Elad Hazan Princeton University 1609 1 16095 Yoram Singer Hebrew University of Jerusalem 1609 1 16096 Steve Carpenter University of Wisconsin-Madison 1348 1 13487 Nick Abel Commonwealth Scientific and In-
dustrial Research Organisation1348 1 1348
8 J. Marty Anderies Commonwealth Scientific and In-dustrial Research Organisation
1348 1 1348
9 Brian Walker Commonwealth Scientific and In-dustrial Research Organisation
1348 1 1348
10 Rose L. Pfefferbaum Phoenix College 1279 1 127911 Karen Fraser Wyche University of Oklahoma Health Sci-
ences Center1279 1 1279
12 Betty Pfefferbaum University of Oklahoma Health Sci-ences Center
1279 1 1279
13 Fran H. Norris Dartmouth College 1279 1 127914 Susan P. Stevens Dartmouth College 1279 1 127915 Stevan E. Hobfoll Rush University Medical Center 1234 1 1234
3.2. Impact and citation analysis
A dramatic increase in the number of references (Fig. 6) indicates that researchers aremore focused on the work of others. The reason for this phenomenon may be the increase

Metaphor Research in the 21st Century 313
in the number of references per paper and the increase in the number of published papers(Fig. 1). From Fig. 7, we can see the change in the average number of references foreach paper from 2000 to 2017. In the core data set, the average number of references perpaper increased from 16 in 2000 to 32 in 2017. Papers in all data sets have the same trend(from 9 in 2000 to 15 in 2015). Fig. 8 shows the average and the maximum age differencebetween the cited paper and the citation. We can see that the age difference in the referencecited by researchers shows a prolonged and tortuous growth trend. The main reason forthis phenomenon is that scholars cite papers in different ways: one is mainly referring toclassic papers, and another refers to the latest papers. In 2012, [28] first used deep learningto classify high-resolution images, confirming that deep convolutional neural networks aresuperior to traditional machine learning techniques. More and more scholars are trying tokeep abreast of the latest developments, which reduces the average age difference betweencitations and cited papers, and which restricts the impact of reference classic papers.
(a) Total dataset (b) Core dataset
Fig. 11. The overview of Metaphor citation relationships between 2000 and 2017. Thelines represent the citation relationships among the top 50 most-cited institutions.
In general, the more recently published papers are, the fewer the people who read andcite them, the shorter the time of citations, and the lesser the impact. For example, if apaper published today is not known to anyone, it will not be cited. Therefore, the averagenumber of citations per paper should decrease as publication time approaches. However,as shown in Figure 9, there are still years with increased citations, such as 2001, 2006, and2011, indicating that the papers published in those years are more influential than otheryears.
3.3. Identifying influential Papers/ Researchers/ Institutions
Figure 10 shows three average self-citation rates: institutional self-citation, paper self-citation, and journal and conference self-citation. In recent years, there has been no ob-vious growth trend in these areas. As time goes by, scientists are increasingly citing selfpapers, which may be the reason for the increase in the number of references to a paper.
We use citations to quantify the importance of paper/res-earcher/institution in metaphorresearch. For example, we consider the most cited papers from 2000 to 2017 as the mostinfluential papers. Table 1 and Table 2 show the ranking of papers from 2000 to 2017

314 Zhang et al.
Table 4. Ranking of authors based on the average number of citations per paper during2000-2017 (All dataset Author).No. Name Organization Citation Paper Citations
per Paper
1 John Seely Brown PARC 2044 1 20442 Paul Duguid University of California, Berkeley 2044 1 20443 John C. Duchi Stanford University 1609 1 16094 Elad Hazan Princeton University 1609 1 16095 Yoram Singer Hebrew University of Jerusalem 1609 1 16096 Steve Carpenter University of Wisconsin-Madison 1348 1 13487 Nick Abel Commonwealth Scientific and In-
dustrial Research Organisation1348 1 1348
8 J. Marty Anderies Commonwealth Scientific and In-dustrial Research Organisation
1348 1 1348
9 Rose L. Pfefferbaum Phoenix College 1279 1 127910 Karen Fraser Wyche University of Oklahoma Health Sci-
ences Center1279 1 1279
11 Betty Pfefferbaum University of Oklahoma Health Sci-ences Center
1279 1 1279
12 Fran H. Norris Dartmouth College 1279 1 127913 Susan P. Stevens Dartmouth College 1279 1 127914 Stevan E. Hobfoll Rush University Medical Center 1234 1 123415 Bryan Roche Maynooth University 1185 1 1185
based on total citations. By ranking the papers of the two data sets, respectively, the com-parison shows that the first eight papers are the same. From the ranking of these papers,we can identify the key issues and keywords in different periods. For example, many so-cial studies in these papers indicate that scholars have invested a lot of time and energy inexploring the relationship between metaphor and society.
Table 3 and Table 4 list the top 15 researchers who cited the most times, as well asthe total number of papers they published, the total number of citations, and their affil-iations. Although some researchers have published very few papers, they have achievedhigh citation rates. The quantified top 15 authors with strong influence do not changemuch between the two data sets.
Research institutions can be seen as clusters of researchers. Table 5 lists the top 15institutions based on average citations per paper, total number of authors who have pub-lished in top journals/conferences, total number of citations, and total number of articlespublished in top journals/conferences, in addition to standard deviation of citations (SD)per author and institution. The lower the SD value, the closer the point in the data setis to the average. This can help readers to understand the importance of the target au-thor/institution better. We can see that most of the influential institutions located in NorthAmerica, Asia, Europe, and Oceania.
Fig. 11 shows the world map embedded with the top 50 most cited institutions andtheir citation relationships with each other. This can be seen as an overview of citationrelationships between influential institutions. According to the citation ranking of papers,

Metaphor Research in the 21st Century 315
Table 5. Ranking of institutions based on the average number of citations per paper from2000-2017.No. Institution Number
of Re-searchers
TotalNumber
ofCitations
Total Numberof
Publications
Avg No. ofCitations per
Paper
StandardDeviation
1 University of California,Berkeley
82 5,636 83 67.90361446 254.5490328
2 Stanford University 69 4,744 75 63.25333333 216.18492423 Harvard University 112 3,822 101 37.84158416 77.585788994 University of Chicago 52 3,524 51 69.09803922 270.07038015 University of Toronto 94 3,042 91 33.42857143 56.177524746 University of Melbourne 68 2,823 59 47.84745763 122.03360387 McGill University 61 2,776 56 49.57142857 160.23118048 University of
Wisconsin-Madison52 2,747 46 59.7173913 199.2495546
9 Princeton University 34 2,691 38 70.81578947 259.629658810 Northwestern University 67 2,680 59 45.42372881 92.85123511 University of British
Columbia85 2,574 77 33.42857143 90.10248968
12 University of California,Los Angeles
70 2,519 57 44.19298246 82.73396232
13 Lancaster University 74 2,433 88 27.64772727 73.8967965914 University of California,
San Diego65 2,422 63 38.44444444 131.9994841
15 University of Arizona 46 2,261 39 57.97435897 136.5078535

316 Zhang et al.
(a) Total dataset (b) Core dataset
Fig. 12. Co-presence network of topics.
influential institutions are distributed in Asia, Europe, North America, and Oceania. Aswe can see from the figures, citation relations exist widely between North America andEurope. This shows that the dissemination of knowledge is becoming more and moreglobal, and the way it is referenced is also very different. The size of the solid region onthe map represents the relative number of agencies cited, and it can be seen that mostagencies cited are located in North America. This may be because these institutions getmore citations than others.
3.4. Internal structure
Metaphor is not a single topic; it also contains many themes, which are both independentand interactive. To understand metaphor research in-depth, we can divide metaphors intomultiple topics by utilizing the existing fields in the dataset. At least the 19 topics withthe broadest scope can be divided according to the Level 0 domain.
Fig. 12 shows the topic co-occurrence network structure as defined in Section 2.Metaphors bring together different topics. For better visualization, we select the top 50topics with the largest number of papers in the Level-1 field. Fig. 12(a) is the topic co-occurrence network of the total data set, which is composed of 779 lines and 50 nodes.Fig. 12(b) shows the topic co-occurrence network of the core data set, which is composedof 1,238 lines and 50 nodes. The weight of the lines in the network graph is the coex-istence coefficient calculated in the second section, and the degree of topic connectiondetermines the size of the nodes so that the graph can reflect the internal topic structure ofmetaphor to some extent. The co-occurrence networks of the two data sets are much thesame. As shown in the figures, in a paper, it is possible to include topics such as socialscience, social psychology, and pedagogy. This shows that metaphors contain a variety oftopics, their impact, life cycle, and development are different, but they are all interactive.Cross-domain research will promote the continuous development of metaphor.

Metaphor Research in the 21st Century 317
(a) Total dataset (b) Core dataset
Fig. 13. Cross-reference network of topics.
Also, we apply the methods described above. We divide metaphors into 50 differentthemes, which are organized by metaphors. Fig. 13 depicts these topics and their refer-ences to each other. Unlike the co-occurrence network mentioned above, the weights oflines in the cross-reference network are measured according to the number of papers onthe cited topic. Nodes of the same color belong to the same Level-0 field. For example,in Fig. 14, the green nodes consist of the sub-fields of computer science in the Level-0,such as natural language processing, artificial intelligence, and multimedia, and the bluenodes comprise the sub-field of psychology such as social psychology, pedagogy, andcognitive psychology. Through the connections of different color nodes, it is easy to seethat metaphor research is cross-domain rather than independent.
In addition, to reorganize the topic dynamically, as defined in the previous section,we took θ[t]k over the evolution of topic k. Fig. 14 shows the topic change over time in19 domains at Level 0 from 2000 to 2017. These topics are ranked from bottom to topin terms of popularity. From the core data sets, it can be seen that metaphor researchfocuses more on topics such as psychology and sociology, and it pays less attention toenvironmental science, materials science, and other topics. This figure also clearly reflectsthe evolution of the topics, some of which have been declining over time, while othershave received much attention.
To investigate the popularity of topics further, we use the rk defined in Section 2 toevaluate these topics. Table 6 lists rk estimates for all topics in descending order. Thehottest topics are chemistry, business, and physics.
4. Conclusion
In this paper, we undertook a bibliographic analysis of metaphor research in the 21 stcentury. To reflect the universality of the law, we took 11,564 articles from the Web ofScience as the core data set, and 44,586 papers from MAG as the whole data set. We

318 Zhang et al.
Fig. 14. The evolution of core datasets’ topics over time.
Table 6. Increase index for popular topics.Topic rk Topic rk Topic rk
Chemistry 2.02 Medicine 0.96 Geography 0.77Business 1.10 Mathematics 0.94 Economics 0.74Physics 1.07 Computer Science 0.85 Sociology 0.74Geology 0.99 Political Science 0.82 Materials Science 0.73
Art 0.30 Philosophy 0.38 History 0.58Environmental Science 0.69
perform the same calculations and compare the results of the two data sets. We conductstatistical analyses of the titles, authors, institutions, and reference data of each paper. Wealso provide a relatively comprehensive review of metaphor development over the past 18years.
We found that the results of the two data sets are roughly the same. From the perspec-tive of publications, authors, citations, and references, metaphor research generally showsan upward trend. From the perspective of changes in reference behavior, the developmenttrend of metaphor is open and popular, which is reflected over time. The number of ref-erences is increasing, and cross-domain metaphor research is becoming more and morecommon. From the changes in the number of citations and publications, we observe thatthe trend of cooperation is becoming more and more obvious, and the average produc-tivity of each researcher is declining. To quantify the development of metaphor studiesbetter, we use the average number of citations of each paper per author/author/institutionas an indicator of its importance, ranking the importance of the paper/author/institution,and screening out excellent papers, authors, and countries in the field of metaphor re-search. Finally, we explore the internal structure of metaphors, and we conclude that thefield contains a variety of complex and changing themes, with differences and connec-tions between them. These findings reveal the evolution of potential patterns and themesin the metaphorical world, helping researchers continue to explore the field and providingthem with novel insights.

Metaphor Research in the 21st Century 319
Acknowledgments. This work is partially supported by National Natural Science Foundation ofChina under Grants No. 62076051. We would like to thank Wei Zhang for help with experiments.
References
1. Aziz-Zadeh, L., Damasio, A.: Embodied semantics for actions: Findings from functional brainimaging. Journal of Physiology-Paris 102(1-3), 35–39 (2008)
2. Belhassen, Y., Caton, K., Vahaba, C.: Boot camps, bugs, and dreams: Metaphor analysis ofinternship experiences in the hospitality industry. Journal of Hospitality, Leisure, Sport &Tourism Education 27, 100228 (2020)
3. Betrancourt, M., Tversky, B., Morrison, J.: Animation: can it facilitate. Int. J. of Human Com-puter Studies 57(4), 247–262 (2002)
4. Boroditsky, L.: Metaphoric structuring: Understanding time through spatial metaphors. Cogni-tion 75(1), 1–28 (2000)
5. Brown, J.S., Duguid, P.: Knowledge and organization: A social-practice perspective. Organiza-tion science 12(2), 198–213 (2001)
6. Burt, R.S.: The network structure of social capital. Research in organizational behavior 22,345–423 (2000)
7. Carpenter, S., Walker, B., Anderies, J.M., Abel, N.: From metaphor to measurement: resilienceof what to what? Ecosystems 4(8), 765–781 (2001)
8. Correia, A., Paredes, H., Fonseca, B.: Scientometric analysis of scientific publications in cscw.Scientometrics 114(1), 31–89 (2018)
9. Davis, R., Smith, R.G.: Negotiation distributed as a metaphor for problem solving. LectureNotes in Computer Science 2650, 51–97 (2003)
10. Delgado Lopez-Cozar, E., Orduna-Malea, E., Martın-Martın, A.: Google Scholar as a DataSource for Research Assessment, pp. 95–127. Springer (2019)
11. Deshpande, A., Guestrin, C., Madden, S.R., Hellerstein, J.M., Hong, W.: Model-driven dataacquisition in sensor networks. In: Proceedings of the thirtieth international conference on verylarge data bases. pp. 588–599 (2004)
12. Duchi, J., Hazan, E., Singer, Y.: Adaptive subgradient methods for online learning and stochas-tic optimization. Journal of Machine Learning Research 12, 2121–2159 (2011)
13. Fortin, I.: Entrepreneurial gravity: An additional metaphor of tie structure. Academy of Man-agement Proceedings 2020(1), 12468 (2020)
14. Gailliot, M.T., Baumeister, R.F., DeWall, C.N., Maner, J.K., Plant, E.A., Tice, D.M., Brewer,L.E., Schmeichel, B.J.: Self-control relies on glucose as a limited energy source: willpower ismore than a metaphor. Journal of personality and social psychology 92(2), 325 (2007)
15. Garson, J.: The origin of the coding metaphor in neuroscience. Behavioral and Brain Sciences42 (2019), e227
16. Goerigk, L., Grimme, S.: A thorough benchmark of density functional methods for gen-eral main group thermochemistry, kinetics, and noncovalent interactions. Physical ChemistryChemical Physics 13(14), 6670–6688 (2011)
17. Gulli, R.A.: Beyond metaphors and semantics: A framework for causal inference in neuro-science. Behavioral and Brain Sciences 42 (2019), e230
18. Haggerty, K.D., Ericson, R.V.: The surveillant assemblage. The British journal of sociology51(4), 605–622 (2000)
19. Hall Maudslay, R., Pimentel, T., Cotterell, R., Teufel, S.: Metaphor detection using context andconcreteness. In: Proceedings of the Second Workshop on Figurative Language Processing. pp.221–226. Association for Computational Linguistics, Online (Jul 2020)
20. Hatton, H., Porter, J.: The power of metaphorical language in treaty diplomacy. Tech. rep., forWorld report of languages 2019, Report by United Nations General Assembly 2019 Year ofIndigenous Languages Awaiting confirmation of publication Open Access

320 Zhang et al.
21. Hayes, S.C., Barnes-Holmes, D., Roche, B.: Relational frame theory. Springer (2001)22. Hellberg, D.: Funny in the bones: The neural interrelation of humor, irony, and metaphor as
evolved mental states. Interdisciplinary Literary Studies 20(3), 237–254 (2018)23. Hobfoll, S.E.: Social and psychological resources and adaptation. Review of general psychol-
ogy 6(4), 307–324 (2002)24. Kaushal, V., Patwardhan, M.: Emerging trends in personality identification using online social
networks—a literature survey. ACM Transactions on Knowledge Discovery from Data (TKDD)12(2), 15 (2018)
25. Kong, X., Ma, K., Hou, S., Shang, D., Xia, F.: Human interactive behavior: A bibliographicreview. IEEE Access 7, 4611–4628 (2018)
26. Kong, X., Shi, Y., Yu, S., Liu, J., Xia, F.: Academic social networks: Modeling, analysis, miningand applications. Journal of Network and Computer Applications 132, 86 – 103 (2019)
27. Kopp, R.R.: Metaphor therapy: Using client generated metaphors in psychotherapy. Routledge(2013)
28. Krizhevsky, A., Sutskever, I., Hinton, G.E.: Imagenet classification with deep convolutionalneural networks. In: Advances in neural information processing systems. pp. 1097–1105 (2012)
29. Lakoff, G., Johnson, M.: Metaphors we live by (1980)30. Lakoff, G., Nunez, R.E.: Where mathematics comes from: How the embodied mind brings
mathematics into being. Basic Books (2001)31. Liu, J., Kong, X., Xia, F., Bai, X., Wang, L., Qing, Q., Lee, I.: Artificial intelligence in the 21st
century. IEEE Access 6, 34403 – 34421 (2018)32. Liu, J., Xia, F., Wang, L., Xu, B., Kong, X., Tong, H., King, I.: Shifu2: A network repre-
sentation learning based model for advisor-advisee relationship mining. IEEE Transactions onKnowledge and Data Engineering (2019)
33. Markowitz, D.M.: The deception faucet: A metaphor to conceptualize deception and its detec-tion. New Ideas in Psychology 59, 100816 (2020)
34. Meyer, M., Lorscheid, I., Troitzsch, K.G.: The development of social simulation as reflected inthe first ten years of jasss: a citation and co-citation analysis. Journal of Artificial Societies andSocial Simulation 12(4), 12 (2009)
35. Norris, F.H., Stevens, S.P., Pfefferbaum, B., Wyche, K.F., Pfefferbaum, R.L.: Community re-silience as a metaphor, theory, set of capacities, and strategy for disaster readiness. Americanjournal of community psychology 41(1-2), 127–150 (2008)
36. Parde, N., Nielsen, R.D.: Exploring the terrain of metaphor novelty: A regression-based ap-proach for automatically scoring metaphors. In: Thirty-Second AAAI Conference on ArtificialIntelligence (2018)
37. Piekkari, R., Tietze, S., Koskinen, K.: Metaphorical and interlingual translation in moving or-ganizational practices across languages. Organization Studies 41(9), 1311–1332 (2020)
38. Richards, I.A., Constable, J.: The philosophy of rhetoric. Oxford University Press (1965)39. Rincon-Ruiz, A., Rojas-Padilla, J., Agudelo-Rico, C., Perez-Rincon, M., Vieira-Samper, S.,
Rubiano-Paez, J.: Ecosystem services as an inclusive social metaphor for the analysis and man-agement of environmental conflicts in colombia. Ecosystem Services 37 (2019), 100924
40. Santos, F.C., Pacheco, J.M.: Scale-free networks provide a unifying framework for the emer-gence of cooperation. Physical Review Letters 95(9), 098104 (2005)
41. Semino, E.: Corpus linguistics and metaphor, pp. 463–476. Cambridge University Press (2017)42. Sinha, A., Shen, Z., Song, Y., Ma, H., Eide, D., Hsu, B.j.P., Wang, K.: An overview of microsoft
academic service (mas) and applications. In: Proceedings of the 24th international conferenceon world wide web. pp. 243–246 (2015)
43. Steen, G.: A method for linguistic metaphor identification: From MIP to MIPVU. John Ben-jamins Publishing (2010)
44. Suddendorf, T., Corballis, M.C.: The evolution of foresight: What is mental time travel, and isit unique to humans? Behavioral and brain sciences 30(3), 299–313 (2007)

Metaphor Research in the 21st Century 321
45. Sun, L., Yin, Y.: Discovering themes and trends in transportation research using topic modeling.Transportation Research Part C: Emerging Technologies 77, 49–66 (2017)
46. Taylor, C.: Modern social imaginaries. Public culture 14(1), 91–124 (2002)47. Tendahl, M., Gibbs Jr, R.W.: Complementary perspectives on metaphor: Cognitive linguistics
and relevance theory. Journal of pragmatics 40(11), 1823–1864 (2008)48. Tsvetkov, Y., Boytsov, L., Gershman, A., Nyberg, E., Dyer, C.: Metaphor detection with cross-
lingual model transfer. In: Proceedings of the 52nd Annual Meeting of the Association forComputational Linguistics. pp. 248–258 (2014)
49. Visser, M., van Eck, N.J., Waltman, L.: Large-scale comparison of bibliographic data sources:Scopus, Web of Science, Dimensions, Crossref, and Microsoft Academic. arXiv e-printsarXiv:2005.10732 (May 2020)
50. Wan, H., Zhang, Y., Zhang, J., Tang, J.: Aminer: Search and mining of academic social net-works. Data Intelligence 1(1), 58–76 (2019)
51. Wang, K., Shen, Z., Huang, C., Wu, C.H., Dong, Y., Kanakia, A.: Microsoft academic graph:When experts are not enough. Quantitative Science Studies 1(1), 396–413 (2020)
52. Wang, R., Sun, K.: Bodo winter, sensory linguistics: Language, perception and metaphor. FoliaLinguistica 54(1), 269 – 275 (2020)
53. Wang, W., Liu, J., Xia, F., King, I., Tong, H.: Shifu: Deep learning based advisor-advisee rela-tionship mining in scholarly big data. In: Proceedings of the 26th international conference onworld wide web companion. pp. 303–310 (2017)
54. Woodside, J.M.: Organizational health management through metaphor: a mission-based ap-proach. Journal of health organization and management 32(3), 374–393 (2018)
55. Wu, C., Wu, F., Chen, Y., Wu, S., Yuan, Z., Huang, Y.: Neural metaphor detecting with cnn-lstm model. In: Proceedings of the Workshop on Figurative Language Processing. pp. 110–114(2018)
56. Xia, F., Wang, W., Bekele, T.M., Liu, H.: Big scholarly data: A survey. IEEE Transactions onBig Data 3(1), 18–35 (2017)
Dongyu Zhang received the Master degree in applied linguistics from Leicester Univer-sity, UK, and the PhD degree from Dalian University of Technology, Dalian, China. She iscurrently a Full Professor in School of Software, Dalian University of Technology, Dalian,China. Her research interests include natural language processing, sentiment analysis, andsocial computing. She is a member of the Association for Computational Linguistics andthe China Association of Artificial Intelligence.
Minghao Zhang received the Bachelor degree in cyber engineering from Dalian Uni-versity of Technology, Dalian, China. He is pursuing a Master degree in Software Engi-neering at Dalian University of Technology, Dalian, China. His research interests includemetaphor identification and sentiment analysis.
Ciyuan Peng is an MSc student in the Department of Computer Engineering, Chung-Ang University, Seoul, Korea. She received the BSc degree from the School of Computerand Information Science, Chongqing Normal University, Chongqing, China in 2018. Herresearch topics include sentiment analysis, natural language processing, data mining, deeplearning, and knowledge engineering.
Jason J. Jung is a Full Professor in Chung-Ang University, Seoul, Korea, since Septem-ber 2014. Before joining CAU, he was an Assistant Professor in Yeungnam University,

322 Zhang et al.
Korea since 2007. He was a postdoctoral researcher in INRIA Rhone-Alpes, France in2006, and a visiting scientist in Fraunhofer Institute (FIRST) in Berlin, Germany in 2004.He received the B.Eng. in Computer Science and Mechanical Engineering from Inha Uni-versity in 1999. He received M.S. and Ph.D. degrees in Computer and Information En-gineering from Inha University in 2002 and 2005, respectively. His research topics areknowledge engineering on social networks by using many types of AI methodologies,e.g., data mining, machine learning, and logical reasoning. Recently, he have been work-ing on intelligent schemes to understand various social dynamics in large scale socialmedia.
Feng Xia received the BSc and PhD degrees from Zhejiang University, Hangzhou, China.He is currently an Associate Professor and Discipline Leader in School of Engineering, ITand Physical Sciences, Federation University Australia. Dr. Xia has published 2 books andover 300 scientific papers in international journals and conferences. His research interestsinclude data science, social computing, and systems engineering. He is a Senior Memberof IEEE and ACM.
Received: November 09, 2020; Accepted: December 20, 2020.