Metals Monitor - Great American Group -- Auctions,...
21
Metals Monitor
Transcript of Metals Monitor - Great American Group -- Auctions,...
1 February 2015 — Metals Monitor
1
Metals Monitor
1 February 2015 — Metals Monitor
1 Trend Tracker
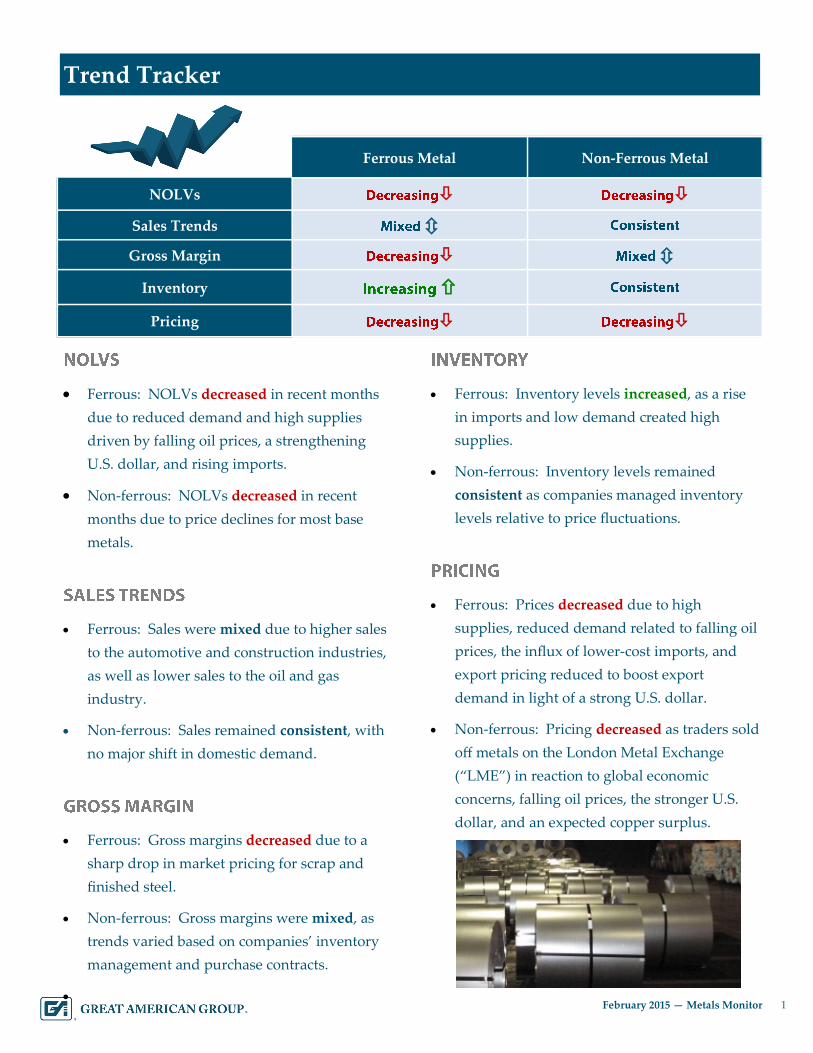
Ferrous: NOLVs decreased in recent months
due to reduced demand and high supplies
driven by falling oil prices, a strengthening
U.S. dollar, and rising imports.
Non-ferrous: NOLVs decreased in recent
months due to price declines for most base
metals.
Ferrous: Sales were mixed due to higher sales
to the automotive and construction industries,
as well as lower sales to the oil and gas
industry.
Non-ferrous: Sales remained consistent, with
no major shift in domestic demand.
Ferrous: Gross margins decreased due to a
sharp drop in market pricing for scrap and
finished steel.
Non-ferrous: Gross margins were mixed, as
trends varied based on companies’ inventory
management and purchase contracts.
Ferrous: Inventory levels increased, as a rise
in imports and low demand created high
supplies.
Non-ferrous: Inventory levels remained
consistent as companies managed inventory
levels relative to price fluctuations.
Ferrous: Prices decreased due to high
supplies, reduced demand related to falling oil
prices, the influx of lower-cost imports, and
export pricing reduced to boost export
demand in light of a strong U.S. dollar.
Non-ferrous: Pricing decreased as traders sold
off metals on the London Metal Exchange
(“LME”) in reaction to global economic
concerns, falling oil prices, the stronger U.S.
dollar, and an expected copper surplus.
Ferrous Metal Non-Ferrous Metal
NOLVs
Sales Trends
Gross Margin
Inventory
Pricing
2 February 2015 — Metals Monitor
2 Overview
The new year began on a rocky note for the metals market, with
January 2015 pricing for steel and base metals falling in the wake
of plunging oil prices. Moreover, steel prices weakened amid a
flood of cheap imports and excess capacity, while prices for
many non-ferrous metals felt the sting of a slowing Chinese
economy.
Crude oil pricing has dropped over 50% since
July 2014, prompting a production slowdown
in the energy sector, which accounts for
nearly 10% of U.S. steel consumption. With
reduced drilling activity, Baker Hughes, Inc.
(“Baker Hughes”) will slash jobs by nearly
7,000 workers. As a result, energy companies
are cutting purchases of steel pipes, which are
produced with flat rolled steel coil.
United States Steel Corporation (“U.S. Steel”)
plans to temporarily idle pipe manufacturing
plants and lay off a number of workers, and
certain other producers are following suit,
including TMK IPSCO and Evraz, Inc.
(“Evraz”). Tenaris SA also plans to reduce
production and lay off nearly 500 workers at
three U.S. plants due to low oil prices and
high U.S. imports of oil country tubular goods
(“OCTG”) from South Korea.
Declining oil prices have also spurred
investors to sell off metals commodities,
negatively impacting industrial metals prices
in recent months.
U.S. imports of finished steel are expected to
account for 28% of the finished steel market
for 2014, reaching an all-time record,
according to the American Iron and Steel
Institute (“AISI”). In January 2015, finished
steel imports swelled to nearly 3.9 million
tons, a 19.7% increase from the prior month’s
total, as indicated by the U.S. Commerce
Department.
The flow of imports is expected to remain
strong until at least the second quarter, as
mills had previously raised domestic prices at
a significant premium compared to global
prices, and American Metals Market
(“AMM”) reported the global steel industry’s
excess capacity is 25% above global steel
demand.
Excess capacity remains a major risk for the
steel market. Steelmakers have announced
the addition of capacity out to 2020, revealing
continued growth in investment, although
some capacity is slated to be removed over
the next decade. Against the current dour
backdrop of surplus supplies, many steel
mills are idling production of flat products to
head off further price declines.
3 February 2015 — Metals Monitor
3 Overview
For base metals, China’s economy is a
significant factor driving market conditions.
China is the world’s largest consumer of
industrial metals, accounting for nearly 40%
of consumption.
However, China’s recent double-digit growth,
which was a boon for the industrial metals
market, proved unsustainable. Growth is
expected to slow to 7% in 2015. The Russian
government is also causing concern, as the
effects of depressed crude oil prices and a
declining Russian currency remain to be seen.
Fortunately, the U.S. economy, at least, is on
the mend. Domestic unemployment is low,
equity markets are robust, and the U.S. dollar
is strong.
In addition, many other metals end-markets –
not counting the energy market – are
demonstrating solid improvement, with the
automotive market flourishing. The current
gloomy outlook therefore has room for some
optimism down the line.
Worthington Industries, Inc.
(“Worthington”) is seeking to acquire
Rome Strip Steel Co., a producer of cold
rolled strip steel, for approximately $55.5
million. The acquisition will add a third
cold rolled steel production facility to
Worthington’s collection, boosting overall
production capacity while expanding
Worthington’s ability to process close-
tolerance material with custom service
finishes.
Constellium NV (“Constellium”)
completed its acquisition of Wise Metals
Intermediate Holdings LLC (“Wise
Metals”), a producer of aluminum sheet
products for the beverage can industry, for
approximately $455 million in cash plus
the assumption of $945 million in debt
obligations. The acquisition is expected to
increase Constellium’s exposure to the
North American market, and will result in
increased investment in Wise Metals’
capacity.
Halliburton Co. is acquiring Baker
Hughes, a competing oilfield services
company, for $35 billion. Both companies
posted strong year-end sales results in
2014 but are now laying off workers as the
recent slowdown in drilling activity,
driven by falling oil prices, is poised to
hurt their 2015 performance. Weakening
drilling activity will reduce demand for
OCTG and other metal products used in
oil and gas exploration.
4 February 2015 — Metals Monitor
4 Overview
The automotive industry is a significant consumer of steel
and aluminum. The drop in gas prices in recent months,
driven by falling crude oil prices, contributed to positive
consumer sentiment toward new vehicle purchases,
particularly trucks and SUVs. Easier access to credit and
improved confidence in the economy also aided the rush
of buyers to the dealerships over the past three months.
In January 2015, auto sales reached a seasonally adjusted
annual sales rate of 16.7 million, which was well above the
January 2014 rate of 15.3 million and marked the highest
January annual rate since 2006, according to Autodata.
January sales totaled 1.2 million vehicles, climbing nearly
14% versus the same month in 2014. Nearly half of the
sales were comprised of pickup trucks, vans, and SUVs.
The “Big Three” Detroit automakers all enjoyed a double-
digit sales increase in January 2015 versus 2014, with
General Motors Company leading the pack at nearly 18%.
Ford Motor Company and Fiat Chrysler Automobiles
posted sales increases of 15.6% and 14%, respectively.
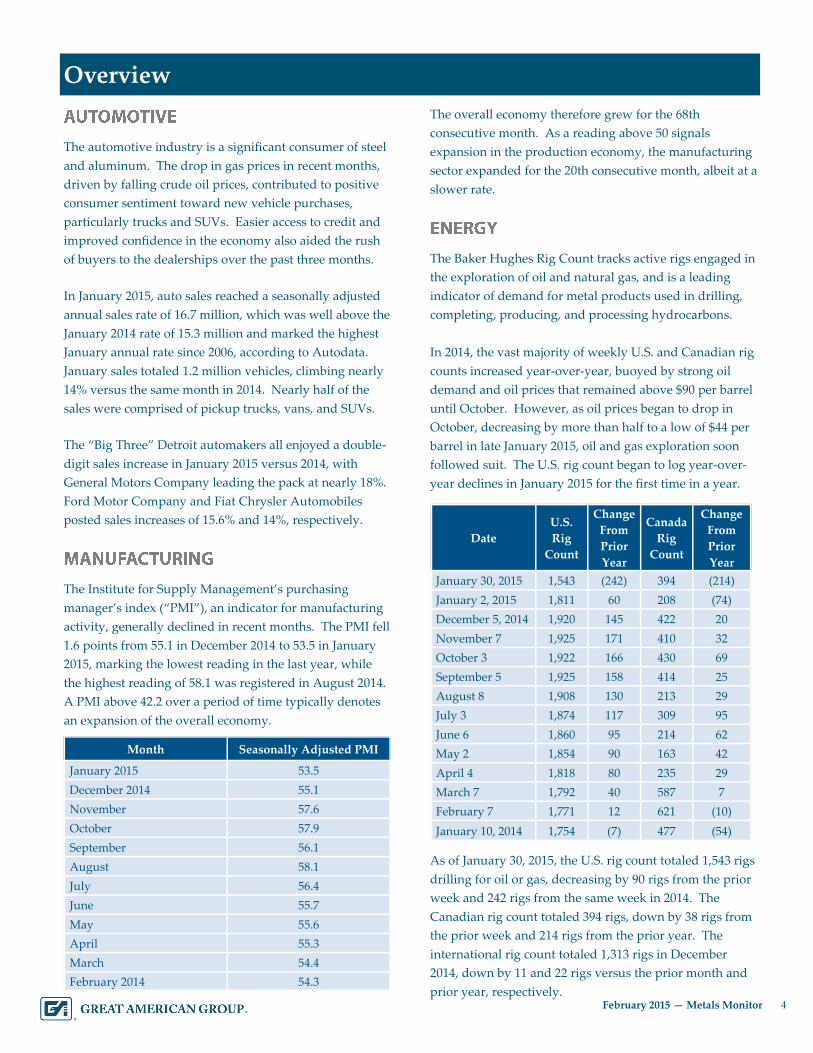
The Institute for Supply Management’s purchasing
manager’s index (“PMI”), an indicator for manufacturing
activity, generally declined in recent months. The PMI fell
1.6 points from 55.1 in December 2014 to 53.5 in January
2015, marking the lowest reading in the last year, while
the highest reading of 58.1 was registered in August 2014.
A PMI above 42.2 over a period of time typically denotes
an expansion of the overall economy.
The overall economy therefore grew for the 68th
consecutive month. As a reading above 50 signals
expansion in the production economy, the manufacturing
sector expanded for the 20th consecutive month, albeit at a
slower rate.
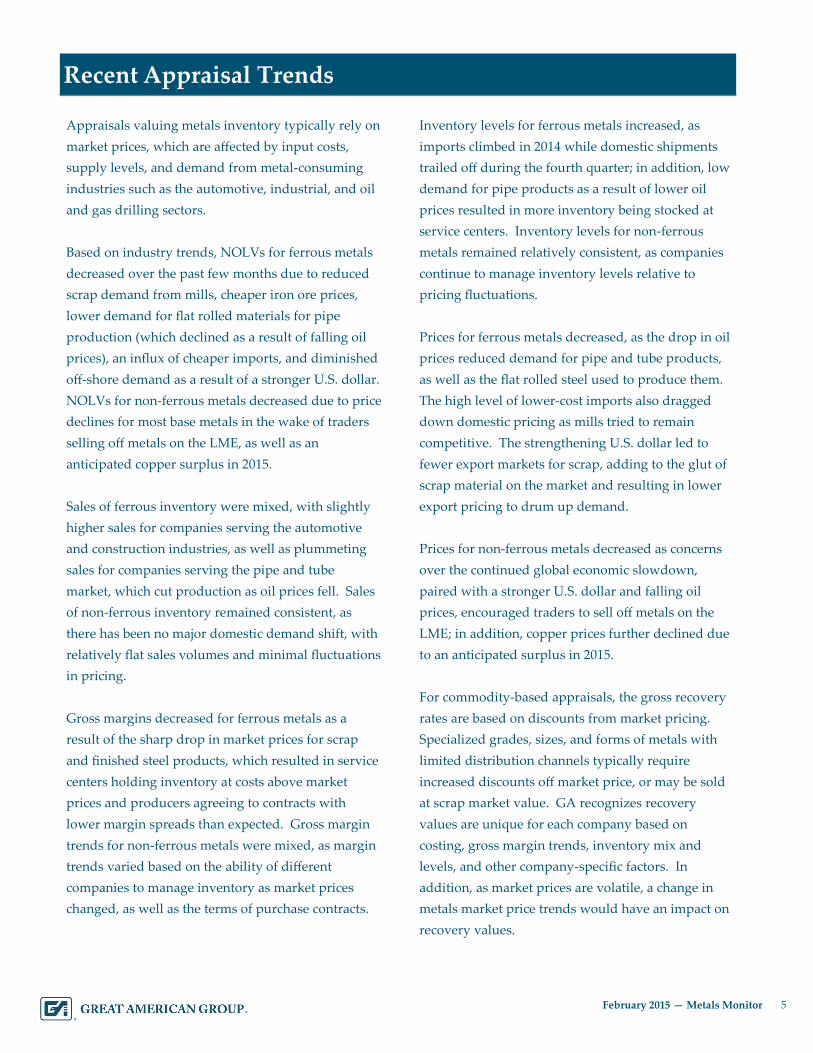
The Baker Hughes Rig Count tracks active rigs engaged in
the exploration of oil and natural gas, and is a leading
indicator of demand for metal products used in drilling,
completing, producing, and processing hydrocarbons.
In 2014, the vast majority of weekly U.S. and Canadian rig
counts increased year-over-year, buoyed by strong oil
demand and oil prices that remained above $90 per barrel
until October. However, as oil prices began to drop in
October, decreasing by more than half to a low of $44 per
barrel in late January 2015, oil and gas exploration soon
followed suit. The U.S. rig count began to log year-over-
year declines in January 2015 for the first time in a year.
As of January 30, 2015, the U.S. rig count totaled 1,543 rigs
drilling for oil or gas, decreasing by 90 rigs from the prior
week and 242 rigs from the same week in 2014. The
Canadian rig count totaled 394 rigs, down by 38 rigs from
the prior week and 214 rigs from the prior year. The
international rig count totaled 1,313 rigs in December
2014, down by 11 and 22 rigs versus the prior month and
prior year, respectively.
Month Seasonally Adjusted PMI
January 2015 53.5
December 2014 55.1
November 57.6
October 57.9
September 56.1
August 58.1
July 56.4
June 55.7
May 55.6
April 55.3
March 54.4
February 2014 54.3
Date
U.S.
Rig
Count
Change
From
Prior
Year
Canada
Rig
Count
Change
From
Prior
Year
January 30, 2015 1,543 (242) 394 (214)
January 2, 2015 1,811 60 208 (74)
December 5, 2014 1,920 145 422 20
November 7 1,925 171 410 32
October 3 1,922 166 430 69
September 5 1,925 158 414 25
August 8 1,908 130 213 29
July 3 1,874 117 309 95
June 6 1,860 95 214 62
May 2 1,854 90 163 42
April 4 1,818 80 235 29
March 7 1,792 40 587 7
February 7 1,771 12 621 (10)
January 10, 2014 1,754 (7) 477 (54)
5 February 2015 — Metals Monitor
5 Recent Appraisal Trends
Appraisals valuing metals inventory typically rely on
market prices, which are affected by input costs,
supply levels, and demand from metal-consuming
industries such as the automotive, industrial, and oil
and gas drilling sectors.
Based on industry trends, NOLVs for ferrous metals
decreased over the past few months due to reduced
scrap demand from mills, cheaper iron ore prices,
lower demand for flat rolled materials for pipe
production (which declined as a result of falling oil
prices), an influx of cheaper imports, and diminished
off-shore demand as a result of a stronger U.S. dollar.
NOLVs for non-ferrous metals decreased due to price
declines for most base metals in the wake of traders
selling off metals on the LME, as well as an
anticipated copper surplus in 2015.
Sales of ferrous inventory were mixed, with slightly
higher sales for companies serving the automotive
and construction industries, as well as plummeting
sales for companies serving the pipe and tube
market, which cut production as oil prices fell. Sales
of non-ferrous inventory remained consistent, as
there has been no major domestic demand shift, with
relatively flat sales volumes and minimal fluctuations
in pricing.
Gross margins decreased for ferrous metals as a
result of the sharp drop in market prices for scrap
and finished steel products, which resulted in service
centers holding inventory at costs above market
prices and producers agreeing to contracts with
lower margin spreads than expected. Gross margin
trends for non-ferrous metals were mixed, as margin
trends varied based on the ability of different
companies to manage inventory as market prices
changed, as well as the terms of purchase contracts.
Inventory levels for ferrous metals increased, as
imports climbed in 2014 while domestic shipments
trailed off during the fourth quarter; in addition, low
demand for pipe products as a result of lower oil
prices resulted in more inventory being stocked at
service centers. Inventory levels for non-ferrous
metals remained relatively consistent, as companies
continue to manage inventory levels relative to
pricing fluctuations.
Prices for ferrous metals decreased, as the drop in oil
prices reduced demand for pipe and tube products,
as well as the flat rolled steel used to produce them.
The high level of lower-cost imports also dragged
down domestic pricing as mills tried to remain
competitive. The strengthening U.S. dollar led to
fewer export markets for scrap, adding to the glut of
scrap material on the market and resulting in lower
export pricing to drum up demand.
Prices for non-ferrous metals decreased as concerns
over the continued global economic slowdown,
paired with a stronger U.S. dollar and falling oil
prices, encouraged traders to sell off metals on the
LME; in addition, copper prices further declined due
to an anticipated surplus in 2015.
For commodity-based appraisals, the gross recovery
rates are based on discounts from market pricing.
Specialized grades, sizes, and forms of metals with
limited distribution channels typically require
increased discounts off market price, or may be sold
at scrap market value. GA recognizes recovery
values are unique for each company based on
costing, gross margin trends, inventory mix and
levels, and other company-specific factors. In
addition, as market prices are volatile, a change in
metals market price trends would have an impact on
recovery values.
6 February 2015 — Metals Monitor
6 Carbon Steel
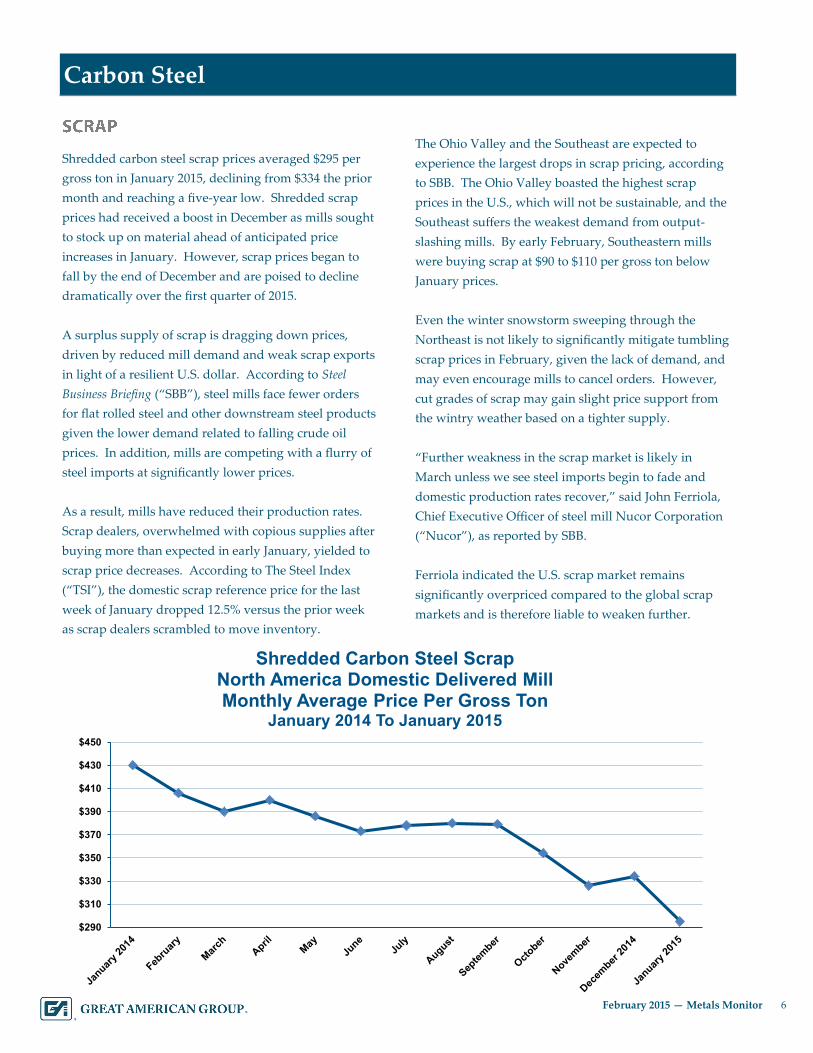
Shredded carbon steel scrap prices averaged $295 per
gross ton in January 2015, declining from $334 the prior
month and reaching a five-year low. Shredded scrap
prices had received a boost in December as mills sought
to stock up on material ahead of anticipated price
increases in January. However, scrap prices began to
fall by the end of December and are poised to decline
dramatically over the first quarter of 2015.
A surplus supply of scrap is dragging down prices,
driven by reduced mill demand and weak scrap exports
in light of a resilient U.S. dollar. According to Steel
Business Briefing (“SBB”), steel mills face fewer orders
for flat rolled steel and other downstream steel products
given the lower demand related to falling crude oil
prices. In addition, mills are competing with a flurry of
steel imports at significantly lower prices.
As a result, mills have reduced their production rates.
Scrap dealers, overwhelmed with copious supplies after
buying more than expected in early January, yielded to
scrap price decreases. According to The Steel Index
(“TSI”), the domestic scrap reference price for the last
week of January dropped 12.5% versus the prior week
as scrap dealers scrambled to move inventory.
The Ohio Valley and the Southeast are expected to
experience the largest drops in scrap pricing, according
to SBB. The Ohio Valley boasted the highest scrap
prices in the U.S., which will not be sustainable, and the
Southeast suffers the weakest demand from output-
slashing mills. By early February, Southeastern mills
were buying scrap at $90 to $110 per gross ton below
January prices.
Even the winter snowstorm sweeping through the
Northeast is not likely to significantly mitigate tumbling
scrap prices in February, given the lack of demand, and
may even encourage mills to cancel orders. However,
cut grades of scrap may gain slight price support from
the wintry weather based on a tighter supply.
“Further weakness in the scrap market is likely in
March unless we see steel imports begin to fade and
domestic production rates recover,” said John Ferriola,
Chief Executive Officer of steel mill Nucor Corporation
(“Nucor”), as reported by SBB.
Ferriola indicated the U.S. scrap market remains
significantly overpriced compared to the global scrap
markets and is therefore liable to weaken further.
$290
$310
$330
$350
$370
$390
$410
$430
$450
Shredded Carbon Steel ScrapNorth America Domestic Delivered MillMonthly Average Price Per Gross Ton
January 2014 To January 2015
7 February 2015 — Metals Monitor
7 Carbon Steel
In the week ended January 31, 2015, domestic raw steel
production totaled 1,782,000 net tons, slipping 2.4%
versus the prior week and 2.3% from the same week in
2014. The AISI reported that capability utilization
reached 75.4%, down slightly from 75.9% the previous
week and 75.8% the prior year.
Production decreased further in early February, falling
0.7% from the prior week and 3.0% from the prior year
to reach 1,769,000 net tons, with capability utilization
dropping to 74.8%.
Adjusted year-to-date production through February 7,
2015 totaled 9,877,000 net tons at a capability utilization
rate of 76.9%, down 0.3% from 9,903,000 net tons during
the same period in 2014, when the capability utilization
rate was 75.8%. Utilization rates above 80% typically
denote optimal profitability.
The recent decline in utilization reflects excess capacity,
which has driven major steel mills to idle their plants.
Week Ended
Production
(Million
Net Tons)
Change vs.
Prior Year
January 4, 2014 1.82 0.6%
February 1 1.80 (1.9%)
March 1 1.86 (0.7%)
April 5 1.76 (3.9%)
May 10 1.83 0.5%
June 21 1.85 3.1%
July 17 1.90 2.2%
August 30 1.86 3.0%
September 27 1.84 (1.5%)
October 25 1.84 0.2%
November 29 1.84 0.5%
December 27, 2014 1.75 (2.3%)
2014 Year-to-Date
Through December 27 95.5 0.7%
January 3, 2015 1.86 2.4%
January 10 1.90 4.1%
January 31 1.78 (2.3%)
February 7, 2015 1.77 (3.0%)
2015 Year-to-Date
Through February 7 9.88 (0.3%)
8 February 2015 — Metals Monitor
8 Carbon Steel
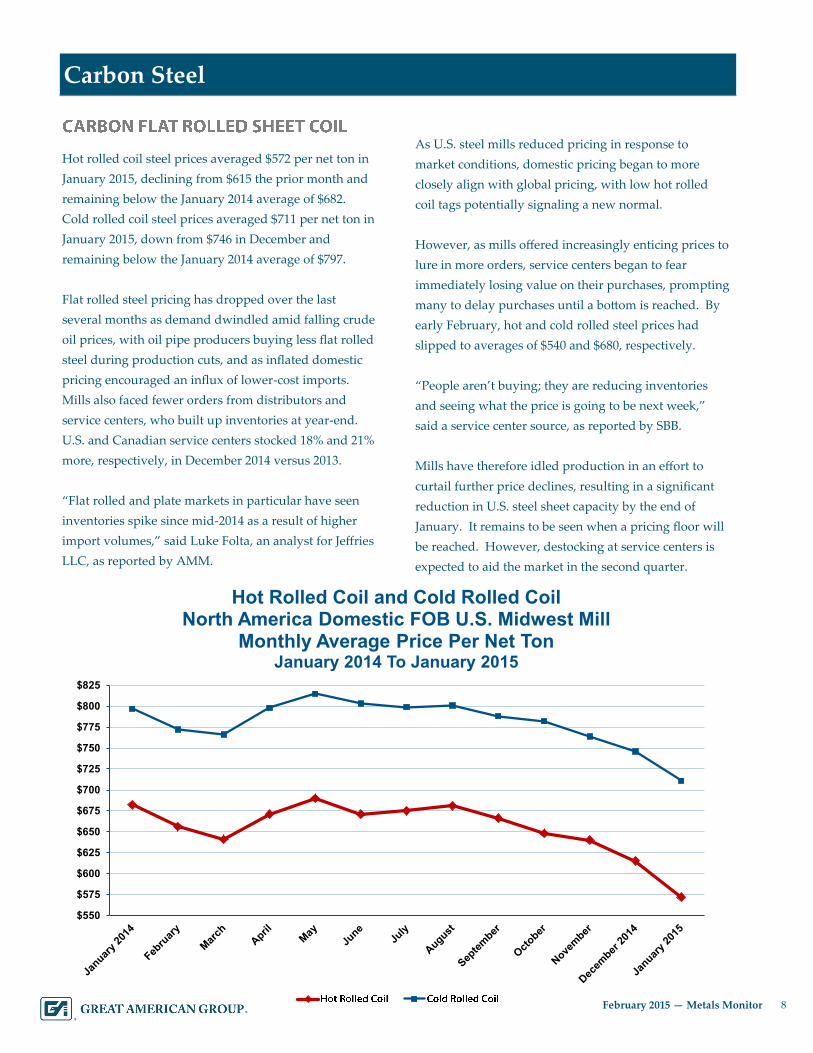
Hot rolled coil steel prices averaged $572 per net ton in
January 2015, declining from $615 the prior month and
remaining below the January 2014 average of $682.
Cold rolled coil steel prices averaged $711 per net ton in
January 2015, down from $746 in December and
remaining below the January 2014 average of $797.
Flat rolled steel pricing has dropped over the last
several months as demand dwindled amid falling crude
oil prices, with oil pipe producers buying less flat rolled
steel during production cuts, and as inflated domestic
pricing encouraged an influx of lower-cost imports.
Mills also faced fewer orders from distributors and
service centers, who built up inventories at year-end.
U.S. and Canadian service centers stocked 18% and 21%
more, respectively, in December 2014 versus 2013.
“Flat rolled and plate markets in particular have seen
inventories spike since mid-2014 as a result of higher
import volumes,” said Luke Folta, an analyst for Jeffries
LLC, as reported by AMM.
As U.S. steel mills reduced pricing in response to
market conditions, domestic pricing began to more
closely align with global pricing, with low hot rolled
coil tags potentially signaling a new normal.
However, as mills offered increasingly enticing prices to
lure in more orders, service centers began to fear
immediately losing value on their purchases, prompting
many to delay purchases until a bottom is reached. By
early February, hot and cold rolled steel prices had
slipped to averages of $540 and $680, respectively.
“People aren’t buying; they are reducing inventories
and seeing what the price is going to be next week,”
said a service center source, as reported by SBB.
Mills have therefore idled production in an effort to
curtail further price declines, resulting in a significant
reduction in U.S. steel sheet capacity by the end of
January. It remains to be seen when a pricing floor will
be reached. However, destocking at service centers is
expected to aid the market in the second quarter.
$550
$575
$600
$625
$650
$675
$700
$725
$750
$775
$800
$825
Hot Rolled Coil and Cold Rolled CoilNorth America Domestic FOB U.S. Midwest Mill
Monthly Average Price Per Net TonJanuary 2014 To January 2015
9 February 2015 — Metals Monitor
9 Carbon Steel
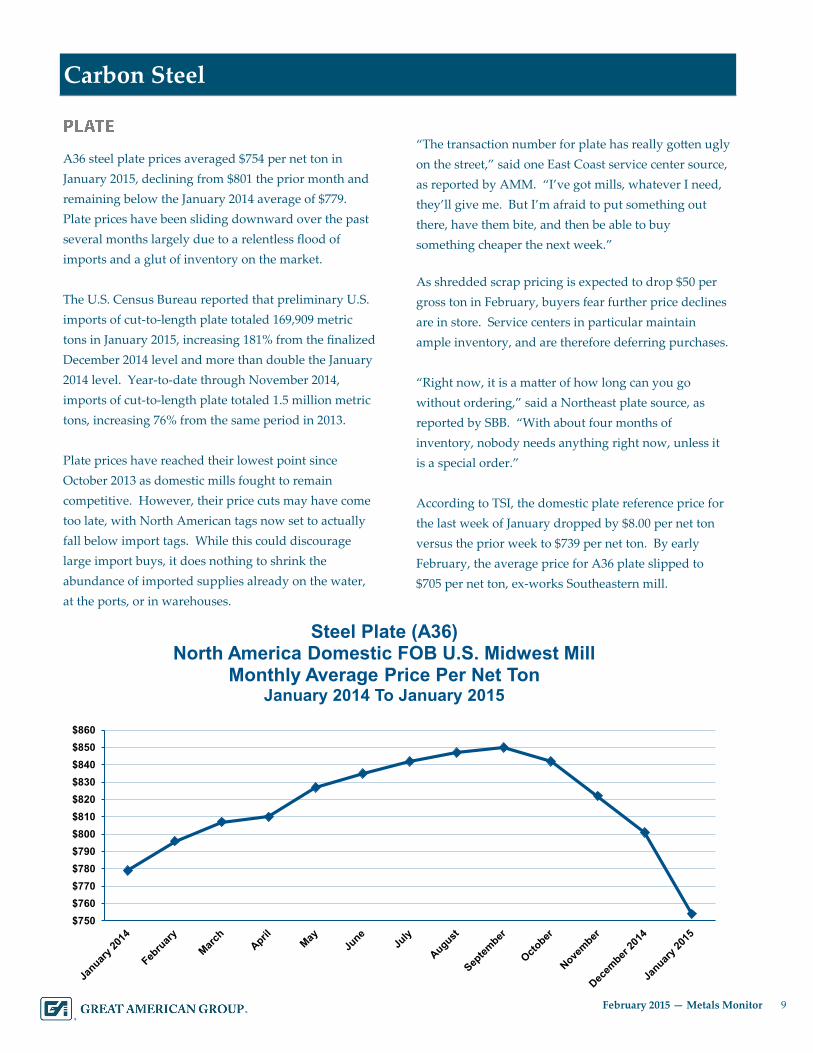
A36 steel plate prices averaged $754 per net ton in
January 2015, declining from $801 the prior month and
remaining below the January 2014 average of $779.
Plate prices have been sliding downward over the past
several months largely due to a relentless flood of
imports and a glut of inventory on the market.
The U.S. Census Bureau reported that preliminary U.S.
imports of cut-to-length plate totaled 169,909 metric
tons in January 2015, increasing 181% from the finalized
December 2014 level and more than double the January
2014 level. Year-to-date through November 2014,
imports of cut-to-length plate totaled 1.5 million metric
tons, increasing 76% from the same period in 2013.
Plate prices have reached their lowest point since
October 2013 as domestic mills fought to remain
competitive. However, their price cuts may have come
too late, with North American tags now set to actually
fall below import tags. While this could discourage
large import buys, it does nothing to shrink the
abundance of imported supplies already on the water,
at the ports, or in warehouses.
“The transaction number for plate has really gotten ugly
on the street,” said one East Coast service center source,
as reported by AMM. “I’ve got mills, whatever I need,
they’ll give me. But I’m afraid to put something out
there, have them bite, and then be able to buy
something cheaper the next week.”
As shredded scrap pricing is expected to drop $50 per
gross ton in February, buyers fear further price declines
are in store. Service centers in particular maintain
ample inventory, and are therefore deferring purchases.
“Right now, it is a matter of how long can you go
without ordering,” said a Northeast plate source, as
reported by SBB. “With about four months of
inventory, nobody needs anything right now, unless it
is a special order.”
According to TSI, the domestic plate reference price for
the last week of January dropped by $8.00 per net ton
versus the prior week to $739 per net ton. By early
February, the average price for A36 plate slipped to
$705 per net ton, ex-works Southeastern mill.
$750
$760
$770
$780
$790
$800
$810
$820
$830
$840
$850
$860
Steel Plate (A36)North America Domestic FOB U.S. Midwest Mill
Monthly Average Price Per Net TonJanuary 2014 To January 2015
10 February 2015 — Metals Monitor
10 Carbon Steel
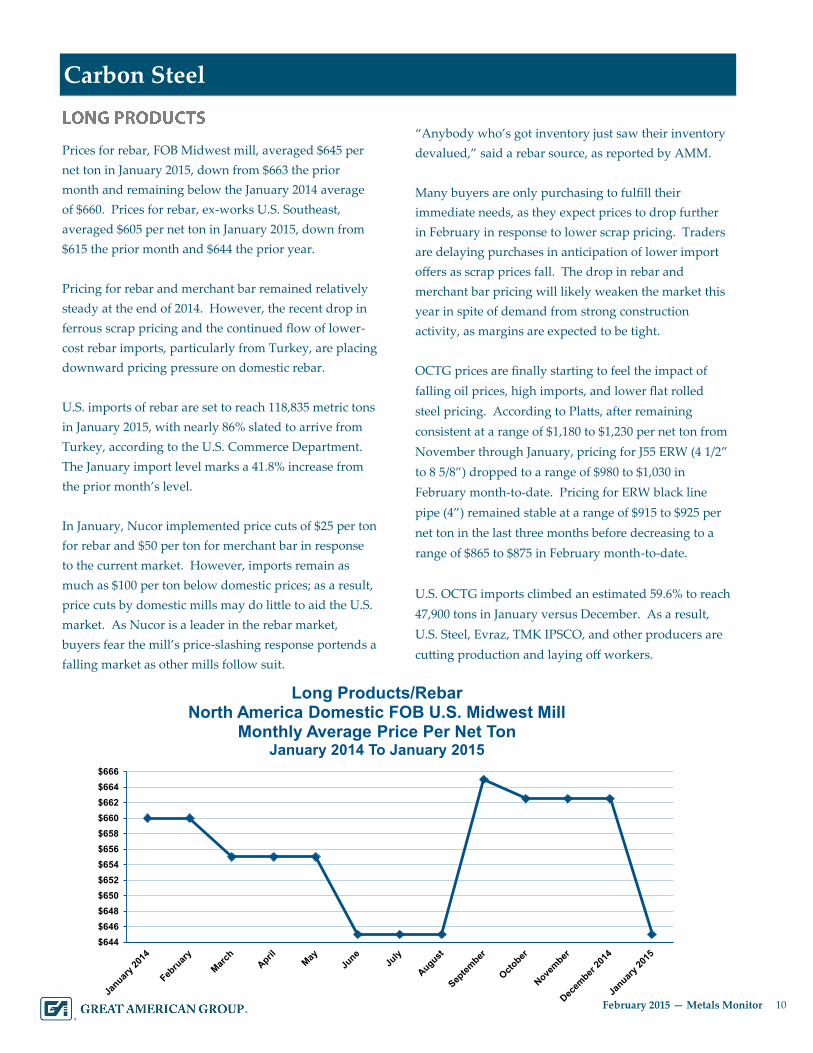
Prices for rebar, FOB Midwest mill, averaged $645 per
net ton in January 2015, down from $663 the prior
month and remaining below the January 2014 average
of $660. Prices for rebar, ex-works U.S. Southeast,
averaged $605 per net ton in January 2015, down from
$615 the prior month and $644 the prior year.
Pricing for rebar and merchant bar remained relatively
steady at the end of 2014. However, the recent drop in
ferrous scrap pricing and the continued flow of lower-
cost rebar imports, particularly from Turkey, are placing
downward pricing pressure on domestic rebar.
U.S. imports of rebar are set to reach 118,835 metric tons
in January 2015, with nearly 86% slated to arrive from
Turkey, according to the U.S. Commerce Department.
The January import level marks a 41.8% increase from
the prior month’s level.
In January, Nucor implemented price cuts of $25 per ton
for rebar and $50 per ton for merchant bar in response
to the current market. However, imports remain as
much as $100 per ton below domestic prices; as a result,
price cuts by domestic mills may do little to aid the U.S.
market. As Nucor is a leader in the rebar market,
buyers fear the mill’s price-slashing response portends a
falling market as other mills follow suit.
“Anybody who’s got inventory just saw their inventory
devalued,” said a rebar source, as reported by AMM.
Many buyers are only purchasing to fulfill their
immediate needs, as they expect prices to drop further
in February in response to lower scrap pricing. Traders
are delaying purchases in anticipation of lower import
offers as scrap prices fall. The drop in rebar and
merchant bar pricing will likely weaken the market this
year in spite of demand from strong construction
activity, as margins are expected to be tight.
OCTG prices are finally starting to feel the impact of
falling oil prices, high imports, and lower flat rolled
steel pricing. According to Platts, after remaining
consistent at a range of $1,180 to $1,230 per net ton from
November through January, pricing for J55 ERW (4 1/2”
to 8 5/8”) dropped to a range of $980 to $1,030 in
February month-to-date. Pricing for ERW black line
pipe (4”) remained stable at a range of $915 to $925 per
net ton in the last three months before decreasing to a
range of $865 to $875 in February month-to-date.
U.S. OCTG imports climbed an estimated 59.6% to reach
47,900 tons in January versus December. As a result,
U.S. Steel, Evraz, TMK IPSCO, and other producers are
cutting production and laying off workers.
$644
$646
$648
$650
$652
$654
$656
$658
$660
$662
$664
$666
Long Products/RebarNorth America Domestic FOB U.S. Midwest Mill
Monthly Average Price Per Net TonJanuary 2014 To January 2015
11 February 2015 — Metals Monitor
11 Tin
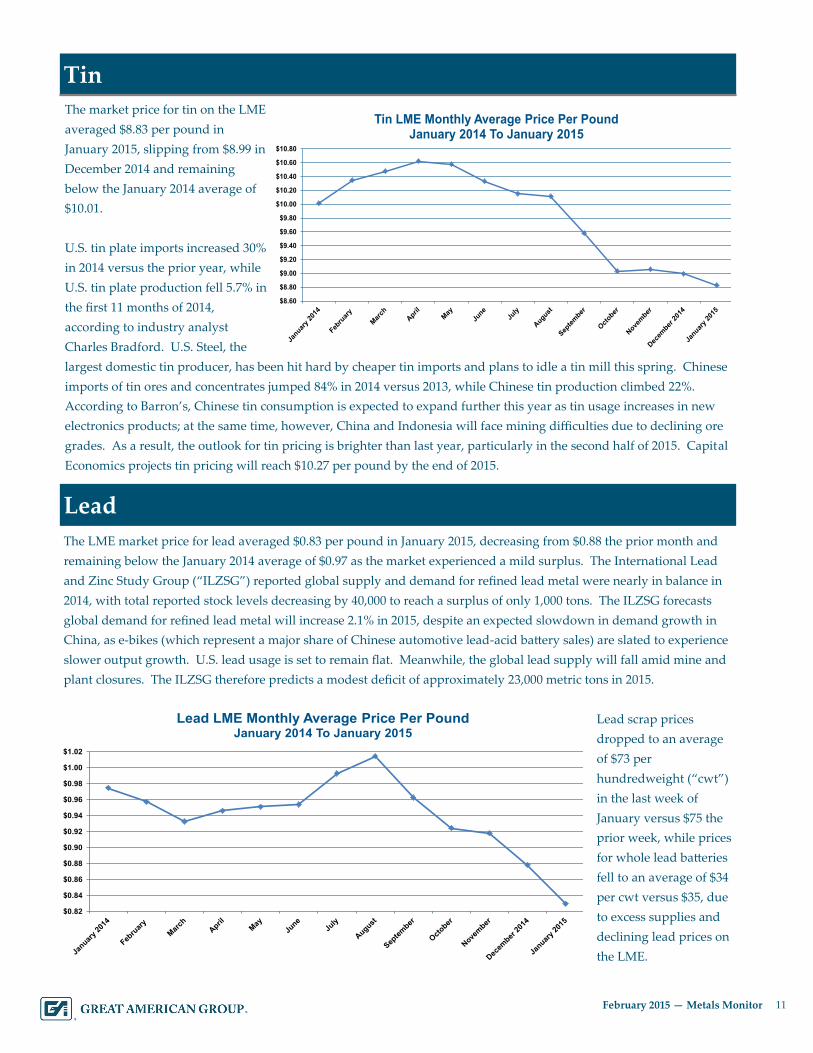
The market price for tin on the LME
averaged $8.83 per pound in
January 2015, slipping from $8.99 in
December 2014 and remaining
below the January 2014 average of
$10.01.
U.S. tin plate imports increased 30%
in 2014 versus the prior year, while
U.S. tin plate production fell 5.7% in
the first 11 months of 2014,
according to industry analyst
Charles Bradford. U.S. Steel, the
largest domestic tin producer, has been hit hard by cheaper tin imports and plans to idle a tin mill this spring. Chinese
imports of tin ores and concentrates jumped 84% in 2014 versus 2013, while Chinese tin production climbed 22%.
According to Barron’s, Chinese tin consumption is expected to expand further this year as tin usage increases in new
electronics products; at the same time, however, China and Indonesia will face mining difficulties due to declining ore
grades. As a result, the outlook for tin pricing is brighter than last year, particularly in the second half of 2015. Capital
Economics projects tin pricing will reach $10.27 per pound by the end of 2015.
The LME market price for lead averaged $0.83 per pound in January 2015, decreasing from $0.88 the prior month and
remaining below the January 2014 average of $0.97 as the market experienced a mild surplus. The International Lead
and Zinc Study Group (“ILZSG”) reported global supply and demand for refined lead metal were nearly in balance in
2014, with total reported stock levels decreasing by 40,000 to reach a surplus of only 1,000 tons. The ILZSG forecasts
global demand for refined lead metal will increase 2.1% in 2015, despite an expected slowdown in demand growth in
China, as e-bikes (which represent a major share of Chinese automotive lead-acid battery sales) are slated to experience
slower output growth. U.S. lead usage is set to remain flat. Meanwhile, the global lead supply will fall amid mine and
plant closures. The ILZSG therefore predicts a modest deficit of approximately 23,000 metric tons in 2015.
Lead scrap prices
dropped to an average
of $73 per
hundredweight (“cwt”)
in the last week of
January versus $75 the
prior week, while prices
for whole lead batteries
fell to an average of $34
per cwt versus $35, due
to excess supplies and
declining lead prices on
the LME.
Lead
$8.60
$8.80
$9.00
$9.20
$9.40
$9.60
$9.80
$10.00
$10.20
$10.40
$10.60
$10.80
Tin LME Monthly Average Price Per PoundJanuary 2014 To January 2015
$0.82
$0.84
$0.86
$0.88
$0.90
$0.92
$0.94
$0.96
$0.98
$1.00
$1.02
Lead LME Monthly Average Price Per PoundJanuary 2014 To January 2015
12 February 2015 — Metals Monitor
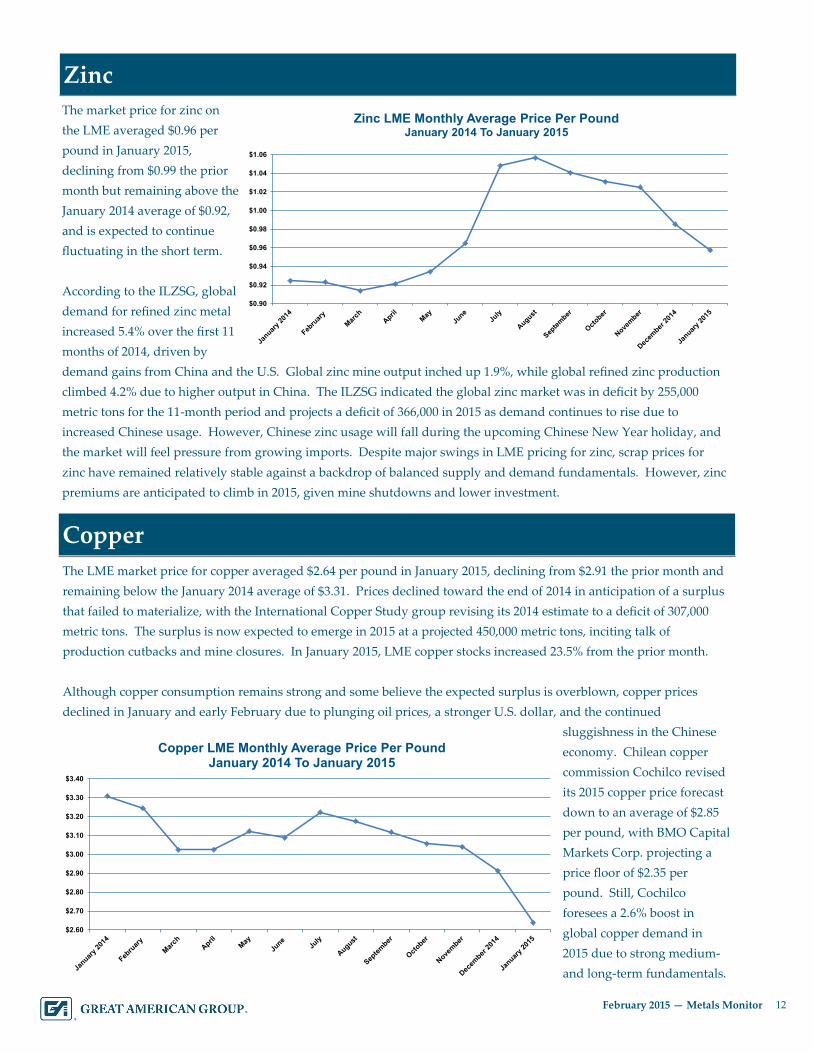
12 Zinc
The market price for zinc on
the LME averaged $0.96 per
pound in January 2015,
declining from $0.99 the prior
month but remaining above the
January 2014 average of $0.92,
and is expected to continue
fluctuating in the short term.
According to the ILZSG, global
demand for refined zinc metal
increased 5.4% over the first 11
months of 2014, driven by
demand gains from China and the U.S. Global zinc mine output inched up 1.9%, while global refined zinc production
climbed 4.2% due to higher output in China. The ILZSG indicated the global zinc market was in deficit by 255,000
metric tons for the 11-month period and projects a deficit of 366,000 in 2015 as demand continues to rise due to
increased Chinese usage. However, Chinese zinc usage will fall during the upcoming Chinese New Year holiday, and
the market will feel pressure from growing imports. Despite major swings in LME pricing for zinc, scrap prices for
zinc have remained relatively stable against a backdrop of balanced supply and demand fundamentals. However, zinc
premiums are anticipated to climb in 2015, given mine shutdowns and lower investment.
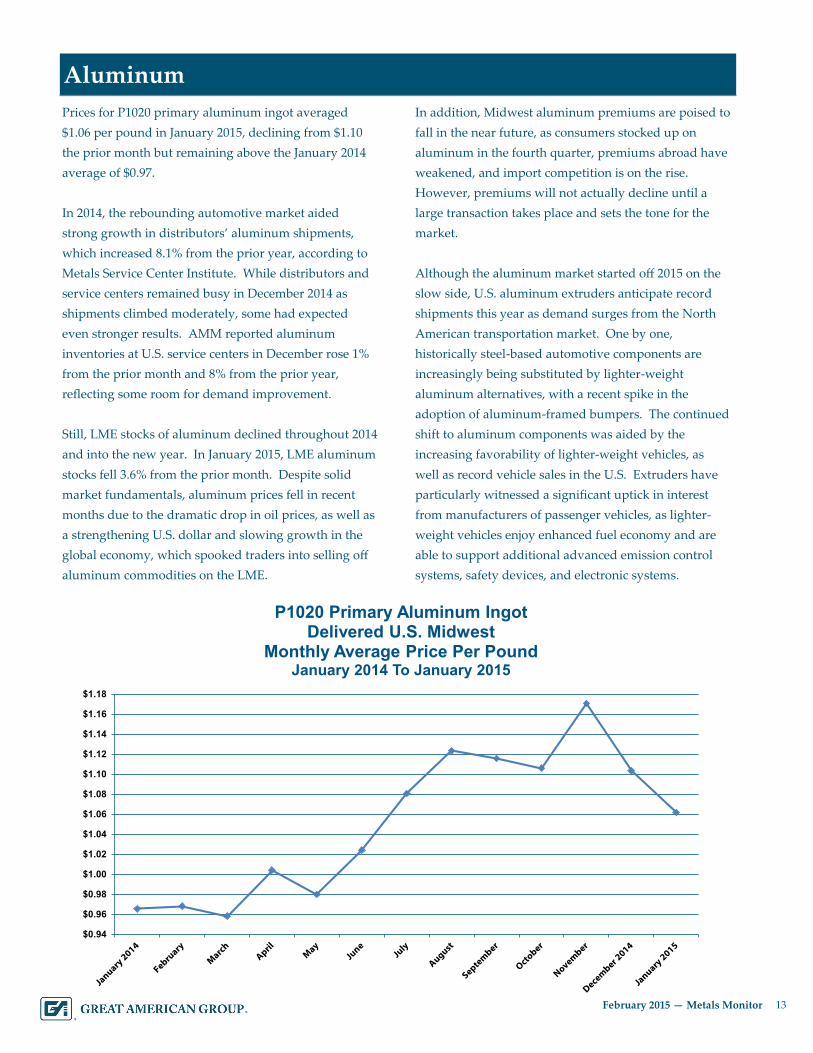
The LME market price for copper averaged $2.64 per pound in January 2015, declining from $2.91 the prior month and
remaining below the January 2014 average of $3.31. Prices declined toward the end of 2014 in anticipation of a surplus
that failed to materialize, with the International Copper Study group revising its 2014 estimate to a deficit of 307,000
metric tons. The surplus is now expected to emerge in 2015 at a projected 450,000 metric tons, inciting talk of
production cutbacks and mine closures. In January 2015, LME copper stocks increased 23.5% from the prior month.
Although copper consumption remains strong and some believe the expected surplus is overblown, copper prices
declined in January and early February due to plunging oil prices, a stronger U.S. dollar, and the continued
sluggishness in the Chinese
economy. Chilean copper
commission Cochilco revised
its 2015 copper price forecast
down to an average of $2.85
per pound, with BMO Capital
Markets Corp. projecting a
price floor of $2.35 per
pound. Still, Cochilco
foresees a 2.6% boost in
global copper demand in
2015 due to strong medium-
and long-term fundamentals.
Copper
$0.90
$0.92
$0.94
$0.96
$0.98
$1.00
$1.02
$1.04
$1.06
Zinc LME Monthly Average Price Per PoundJanuary 2014 To January 2015
$2.60
$2.70
$2.80
$2.90
$3.00
$3.10
$3.20
$3.30
$3.40
Copper LME Monthly Average Price Per PoundJanuary 2014 To January 2015
13 February 2015 — Metals Monitor
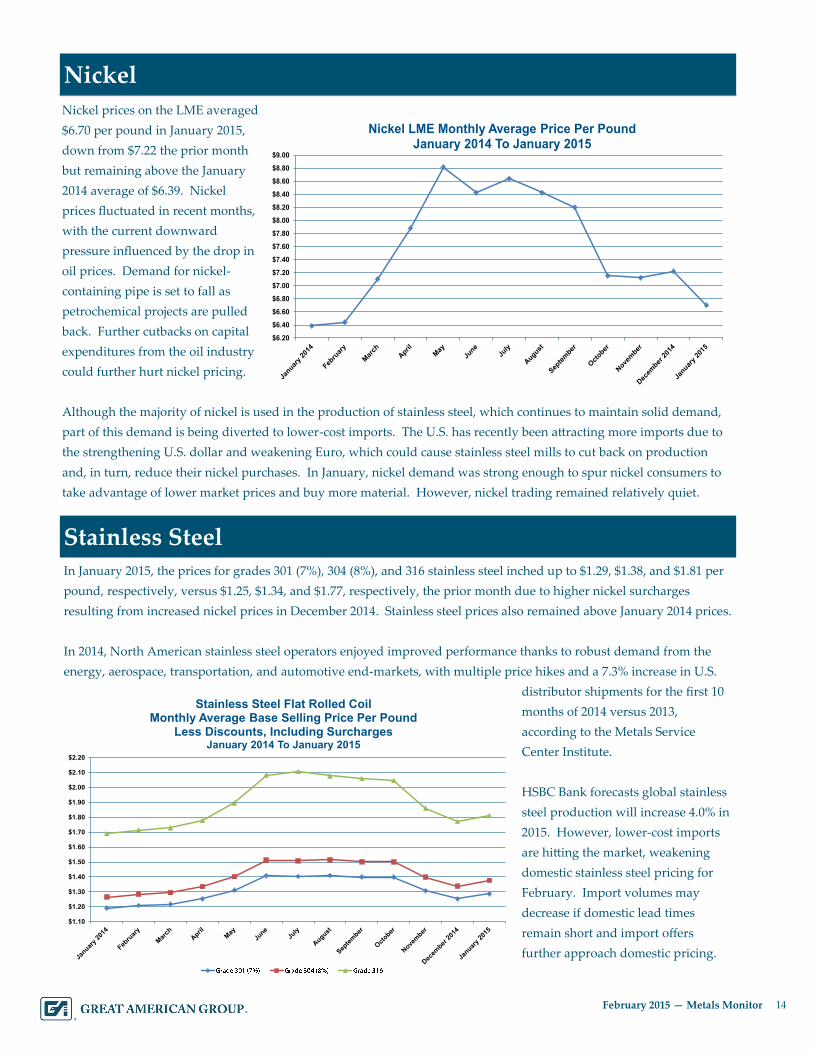
13 Aluminum
Prices for P1020 primary aluminum ingot averaged
$1.06 per pound in January 2015, declining from $1.10
the prior month but remaining above the January 2014
average of $0.97.
In 2014, the rebounding automotive market aided
strong growth in distributors’ aluminum shipments,
which increased 8.1% from the prior year, according to
Metals Service Center Institute. While distributors and
service centers remained busy in December 2014 as
shipments climbed moderately, some had expected
even stronger results. AMM reported aluminum
inventories at U.S. service centers in December rose 1%
from the prior month and 8% from the prior year,
reflecting some room for demand improvement.
Still, LME stocks of aluminum declined throughout 2014
and into the new year. In January 2015, LME aluminum
stocks fell 3.6% from the prior month. Despite solid
market fundamentals, aluminum prices fell in recent
months due to the dramatic drop in oil prices, as well as
a strengthening U.S. dollar and slowing growth in the
global economy, which spooked traders into selling off
aluminum commodities on the LME.
In addition, Midwest aluminum premiums are poised to
fall in the near future, as consumers stocked up on
aluminum in the fourth quarter, premiums abroad have
weakened, and import competition is on the rise.
However, premiums will not actually decline until a
large transaction takes place and sets the tone for the
market.
Although the aluminum market started off 2015 on the
slow side, U.S. aluminum extruders anticipate record
shipments this year as demand surges from the North
American transportation market. One by one,
historically steel-based automotive components are
increasingly being substituted by lighter-weight
aluminum alternatives, with a recent spike in the
adoption of aluminum-framed bumpers. The continued
shift to aluminum components was aided by the
increasing favorability of lighter-weight vehicles, as
well as record vehicle sales in the U.S. Extruders have
particularly witnessed a significant uptick in interest
from manufacturers of passenger vehicles, as lighter-
weight vehicles enjoy enhanced fuel economy and are
able to support additional advanced emission control
systems, safety devices, and electronic systems.
$0.94
$0.96
$0.98
$1.00
$1.02
$1.04
$1.06
$1.08
$1.10
$1.12
$1.14
$1.16
$1.18
P1020 Primary Aluminum IngotDelivered U.S. Midwest
Monthly Average Price Per PoundJanuary 2014 To January 2015
14 February 2015 — Metals Monitor
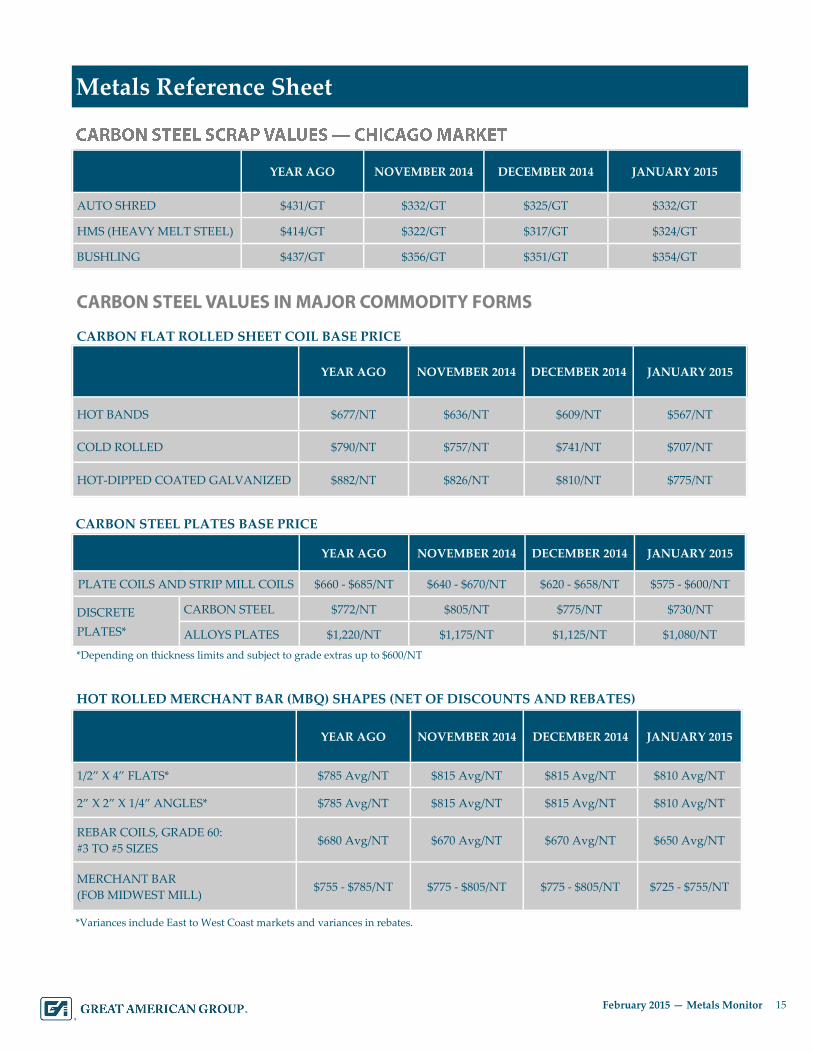
14 Nickel
Nickel prices on the LME averaged
$6.70 per pound in January 2015,
down from $7.22 the prior month
but remaining above the January
2014 average of $6.39. Nickel
prices fluctuated in recent months,
with the current downward
pressure influenced by the drop in
oil prices. Demand for nickel-
containing pipe is set to fall as
petrochemical projects are pulled
back. Further cutbacks on capital
expenditures from the oil industry
could further hurt nickel pricing.
Although the majority of nickel is used in the production of stainless steel, which continues to maintain solid demand,
part of this demand is being diverted to lower-cost imports. The U.S. has recently been attracting more imports due to
the strengthening U.S. dollar and weakening Euro, which could cause stainless steel mills to cut back on production
and, in turn, reduce their nickel purchases. In January, nickel demand was strong enough to spur nickel consumers to
take advantage of lower market prices and buy more material. However, nickel trading remained relatively quiet.
In January 2015, the prices for grades 301 (7%), 304 (8%), and 316 stainless steel inched up to $1.29, $1.38, and $1.81 per
pound, respectively, versus $1.25, $1.34, and $1.77, respectively, the prior month due to higher nickel surcharges
resulting from increased nickel prices in December 2014. Stainless steel prices also remained above January 2014 prices.
In 2014, North American stainless steel operators enjoyed improved performance thanks to robust demand from the
energy, aerospace, transportation, and automotive end-markets, with multiple price hikes and a 7.3% increase in U.S.
distributor shipments for the first 10
months of 2014 versus 2013,
according to the Metals Service
Center Institute.
HSBC Bank forecasts global stainless
steel production will increase 4.0% in
2015. However, lower-cost imports
are hitting the market, weakening
domestic stainless steel pricing for
February. Import volumes may
decrease if domestic lead times
remain short and import offers
further approach domestic pricing.
Stainless Steel
$6.20
$6.40
$6.60
$6.80
$7.00
$7.20
$7.40
$7.60
$7.80
$8.00
$8.20
$8.40
$8.60
$8.80
$9.00
Nickel LME Monthly Average Price Per PoundJanuary 2014 To January 2015
$1.10
$1.20
$1.30
$1.40
$1.50
$1.60
$1.70
$1.80
$1.90
$2.00
$2.10
$2.20
Stainless Steel Flat Rolled CoilMonthly Average Base Selling Price Per Pound
Less Discounts, Including SurchargesJanuary 2014 To January 2015
15 February 2015 — Metals Monitor
15 Metals Reference Sheet
YEAR AGO NOVEMBER 2014 DECEMBER 2014 JANUARY 2015
AUTO SHRED $431/GT $332/GT $325/GT $332/GT
HMS (HEAVY MELT STEEL) $414/GT $322/GT $317/GT $324/GT
BUSHLING $437/GT $356/GT $351/GT $354/GT
CARBON FLAT ROLLED SHEET COIL BASE PRICE
YEAR AGO DECEMBER 2014 JANUARY 2015 NOVEMBER 2014
HOT BANDS $677/NT $609/NT $567/NT $636/NT
COLD ROLLED $790/NT $741/NT $707/NT $757/NT
HOT-DIPPED COATED GALVANIZED $882/NT $810/NT $775/NT $826/NT
CARBON STEEL PLATES BASE PRICE
YEAR AGO NOVEMBER 2014 DECEMBER 2014 JANUARY 2015
PLATE COILS AND STRIP MILL COILS $660 - $685/NT $640 - $670/NT $620 - $658/NT $575 - $600/NT
DISCRETE
PLATES*
CARBON STEEL $772/NT $805/NT $775/NT $730/NT
ALLOYS PLATES $1,220/NT $1,175/NT $1,125/NT $1,080/NT
HOT ROLLED MERCHANT BAR (MBQ) SHAPES (NET OF DISCOUNTS AND REBATES)
YEAR AGO JANUARY 2015 NOVEMBER 2014 DECEMBER 2014
1/2” X 4” FLATS* $785 Avg/NT $810 Avg/NT $815 Avg/NT $815 Avg/NT
2” X 2” X 1/4” ANGLES* $785 Avg/NT $810 Avg/NT $815 Avg/NT $815 Avg/NT
REBAR COILS, GRADE 60:
#3 TO #5 SIZES $680 Avg/NT $650 Avg/NT $670 Avg/NT $670 Avg/NT
MERCHANT BAR
(FOB MIDWEST MILL) $755 - $785/NT $775 - $805/NT $725 - $755/NT $775 - $805/NT
*Variances include East to West Coast markets and variances in rebates.
*Depending on thickness limits and subject to grade extras up to $600/NT
16 February 2015 — Metals Monitor
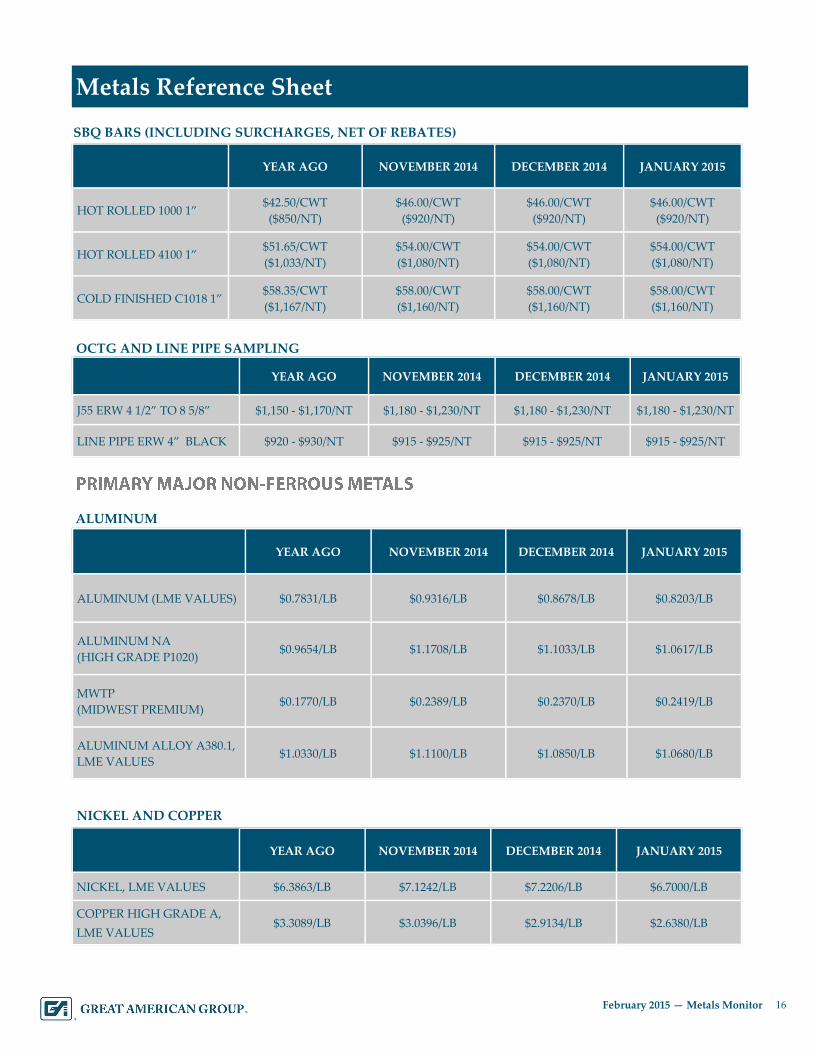
16 Metals Reference Sheet
YEAR AGO NOVEMBER 2014 DECEMBER 2014 JANUARY 2015
ALUMINUM (LME VALUES) $0.7831/LB $0.9316/LB $0.8678/LB $0.8203/LB
ALUMINUM NA
(HIGH GRADE P1020) $0.9654/LB $1.1708/LB $1.1033/LB $1.0617/LB
MWTP
(MIDWEST PREMIUM) $0.1770/LB $0.2389/LB $0.2370/LB $0.2419/LB
ALUMINUM ALLOY A380.1,
LME VALUES $1.0330/LB $1.1100/LB $1.0850/LB $1.0680/LB
ALUMINUM
YEAR AGO NOVEMBER 2014 DECEMBER 2014 JANUARY 2015
NICKEL, LME VALUES $6.3863/LB $7.1242/LB $7.2206/LB $6.7000/LB
COPPER HIGH GRADE A,
LME VALUES $3.3089/LB $3.0396/LB $2.9134/LB $2.6380/LB
NICKEL AND COPPER
YEAR AGO DECEMBER 2014 NOVEMBER 2014 JANUARY 2015
J55 ERW 4 1/2” TO 8 5/8” $1,150 - $1,170/NT $1,180 - $1,230/NT $1,180 - $1,230/NT $1,180 - $1,230/NT
LINE PIPE ERW 4” BLACK $920 - $930/NT $915 - $925/NT $915 - $925/NT $915 - $925/NT
YEAR AGO NOVEMBER 2014 DECEMBER 2014 JANUARY 2015
HOT ROLLED 1000 1” $42.50/CWT
($850/NT)
$46.00/CWT
($920/NT)
$46.00/CWT
($920/NT)
$46.00/CWT
($920/NT)
HOT ROLLED 4100 1” $51.65/CWT
($1,033/NT)
$54.00/CWT
($1,080/NT)
$54.00/CWT
($1,080/NT)
$54.00/CWT
($1,080/NT)
COLD FINISHED C1018 1” $58.35/CWT
($1,167/NT)
$58.00/CWT
($1,160/NT)
$58.00/CWT
($1,160/NT)
$58.00/CWT
($1,160/NT)
OCTG AND LINE PIPE SAMPLING
SBQ BARS (INCLUDING SURCHARGES, NET OF REBATES)
17 February 2015 — Metals Monitor
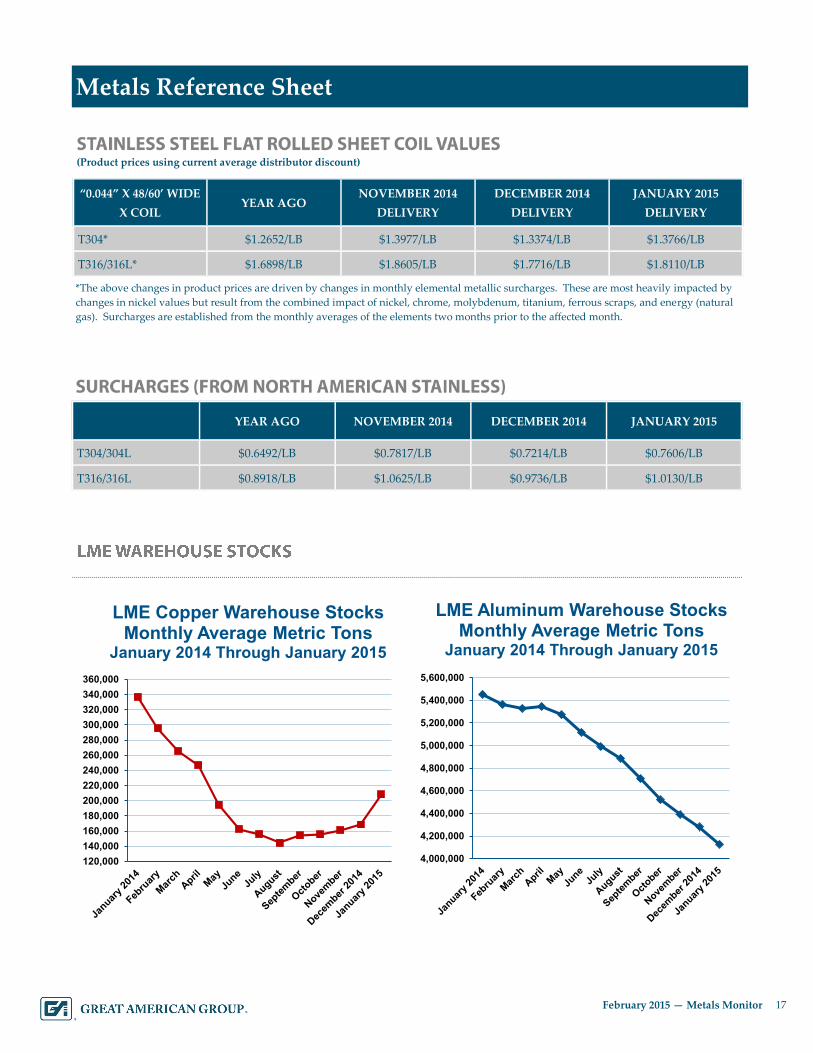
17 Metals Reference Sheet
(Product prices using current average distributor discount)
“0.044” X 48/60’ WIDE
X COIL YEAR AGO
NOVEMBER 2014
DELIVERY
DECEMBER 2014
DELIVERY
JANUARY 2015
DELIVERY
T304* $1.2652/LB $1.3977/LB $1.3374/LB $1.3766/LB
T316/316L* $1.6898/LB $1.8605/LB $1.7716/LB $1.8110/LB
*The above changes in product prices are driven by changes in monthly elemental metallic surcharges. These are most heavily impacted by
changes in nickel values but result from the combined impact of nickel, chrome, molybdenum, titanium, ferrous scraps, and energy (natural
gas). Surcharges are established from the monthly averages of the elements two months prior to the affected month.
YEAR AGO NOVEMBER 2014 JANUARY 2015 DECEMBER 2014
T304/304L $0.6492/LB $0.7817/LB $0.7606/LB $0.7214/LB
T316/316L $0.8918/LB $1.0625/LB $1.0130/LB $0.9736/LB
120,000
140,000
160,000
180,000
200,000
220,000
240,000
260,000
280,000
300,000
320,000
340,000
360,000
LME Copper Warehouse StocksMonthly Average Metric Tons
January 2014 Through January 2015
4,000,000
4,200,000
4,400,000
4,600,000
4,800,000
5,000,000
5,200,000
5,400,000
5,600,000
LME Aluminum Warehouse StocksMonthly Average Metric Tons
January 2014 Through January 2015
18 February 2015 — Metals Monitor
18 Experience
GA has worked with and appraised a number of companies within the metals industry, including industry leaders in
steel and aluminum production and processing. GA’s extensive record of metals inventory valuations also features
appraisals for companies throughout the entire metal supply chain, including foreign and domestic metal- and steel-
producing mills; metal converters that produce tubing and pipe, as well as expanded, grating, and perforated metal
types; metal service centers/processors as well as distributors; structural and custom fabricators and stampers;
manufacturers that utilize metals as raw materials; and scrap yards, recyclers, dealers, and brokers.
Over the past three months, GA performed appraisals of
companies with annual revenues ranging from $30
million to $1.1 billion, including the following sampling:
A master distributor of stainless steel products;
A processor of steel and electrical steel;
A contract processor of flat rolled steel;
A manufacturer of steel-based construction products;
A fabricator of architectural aluminum products;
A manufacturer of metal-based boiler systems;
A manufacturer of metal industrial rack systems;
A manufacturer of metal roofing products;
A manufacturer of metal-based industrial fasteners;
A manufacturer of ductile and gray iron castings;
A processor and service center for flat rolled steel; and
A leading recycler of ferrous and non-ferrous metals.
GA’s extensive appraisal experience also includes
valuations of the following major businesses in the
metals industry:
Globally recognized vertically integrated steel tube
manufacturers;
A vertically integrated aluminum producer including
both the upstream and downstream sides of the
industry, with over $1 billion in sales annually and
over $130 million in inventory;
One of the U.S.’s largest scrap recycling processors,
with nearly $550 million in sales annually; and
Well-known service centers across the nation, including
a multi-division full line steel service center consisting
of over 50 locations across the U.S., with $2.6 billion in
annual sales and over $500 million in inventory.
Moreover, GA has liquidated a number of companies with metal products, including Advanced Composites,
Aluminum Skylight & Specialty Corporation, Anello Corporation, Apex Pattern, Balox Fabricators, BJS Industries,
Buckner Foundry, Crown City Plating, GE Roto Flow, Laird Technology, Maddox Metal Works, Miller Pacific
Steel, R.D. Black Sheet Metal, Valley Brass Foundry, and Southline Steel.
GA has also been involved in liquidations of metalworking equipment for companies such as Adams Campbell
Company, CAMtech Precision Manufacturing, Inc., Gregg Industries, Inc., International Piping Systems, Heat
Transfer Products, PMC Machining and Manufacturing, Sherrill Manufacturing, Trans-Matic Manufacturing,
Veristeel, Inc., and Weiland Steel, Inc.
In addition to our vast appraisal and liquidation experience, GA maintains a staff of experienced metals experts
with personal contacts within the metals industry that we utilize for insight and perspective on recovery values.
GA additionally maintains appraisal experience involving precious metals and specialty metals, allowing GA to
provide experience-based valuations across the entire metals industry. The metal products that GA has appraised
have maintained applications throughout a wide variety of industries, including the automotive, construction,
aerospace, industrial machinery and equipment, and appliance and electrical equipment markets.
19 February 2015 — Metals Monitor
19 Monitor Information
The Metals Monitor provides market value trends in both
ferrous and non-ferrous metals. The commodity nature of
steel scrap, aluminum ingot, copper cathode, and nickel often
results in volatile market values. Our quarterly Metals Monitor
reflects pricing and market trends over the prior quarter, as
well as forward-looking projections, in order to reflect
significant developments in the metals markets.
The Metals Monitor includes a sampling covering most metals projects. GA’s metals expertise
is not confined to use on pure metals projects, but is always utilized in assuring the accuracy
and insight for all manufacturing projects where metals are the primary or significant raw
materials, regardless of the sector of the finished products. This assures that all appraisals
from GA reflect the full scope of our experience and insight. GA internally tracks additional
specialty and tool steels, all raw materials for steel, specialty steel, and primary aluminum
production and manufacturing, but we are mindful to adhere to your request for a simple
reference document. Should you need any further information or wish to discuss recovery
ranges for a particular segment, please feel free to contact your GA Business Development
Officer.
GA’s Metals Monitor provides market value and industry trend information for a variety of
metals products. The information contained herein is based on a composite of GA’s industry
expertise, contact with industry personnel, industry publications, liquidation and appraisal
experience, and data compiled from a variety of well-respected sources believed to be reliable.
We do not guarantee the completeness of such information or make any representation as to
its accuracy.
20 February 2015 — Metals Monitor
20 Appraisal & Valuation Team
About Great American Group Great American Group is a leading provider of asset disposition solutions and valuation and appraisal services to a wide range
of retail, wholesale, and industrial clients, as well as lenders, capital providers, private equity investors, and professional
services firms. In addition to the Metals Monitor, GA also provides clients with industry expertise in the form of monitors for
the chemicals and plastics, food, and building products sectors, among many others. GA also offers various industry monitors
via its subsidiary, GA Europe Valuations Limited. For more information, please visit www.greatamerican.com.
Great American Group, LLC is a wholly owned subsidiary of B. Riley Financial, Inc. (OTCBB: RILY), which provides
collaborative financial services and solutions through several subsidiaries, including: B. Riley & Co. LLC, a leading investment
bank which provides corporate finance, research, and sales & trading to corporate, institutional and high net worth individual
clients; Great American Group, LLC, a leading provider of advisory and valuation services, asset disposition and auction
solutions, and commercial lending services; B. Riley Asset Management, LLC, a provider of investment products to
institutional and high net worth investors; and MK Capital Advisors, LLC, a multi-family office practice and wealth
management firm focused on the needs of ultra-high net worth individuals and families.
B. Riley Financial, Inc. is headquartered in Los Angeles with offices in major financial markets throughout the United States
and Europe. For more information on B. Riley Financial, Inc., please visit www.brileyfin.com.
Headquarters
21860 Burbank Blvd. Suite 300 South
Woodland Hills, CA 91367 800-45-GREAT www.greatamerican.com
Mike Marchlik
National Sales & Marketing Director
(818) 746-9306
David Seiden
Executive Vice President, Southeast Region
(770) 551-8114
Ryan Mulcunry
Executive Vice President - Northeast Region, Canada & Europe
(617) 692-8310
Bill Soncini
Senior Vice President, Midwest Region
(312) 777-7945
Drew Jakubek
Managing Director, Southwest Region
(972) 265-7981
Jennie Kim
Vice President, Western Region
(818) 746-9370
Ken Bloore
Chief Operating Officer
(818) 884-3737
Michael Petruski
Executive Vice President, General Manager
(818) 884-3737
Greg Trilevsky
Senior Appraiser—Metals and Manufacturing
(909) 559-8135
Alex Tereszcuk
Senior Appraiser—Metals and Manufacturing
(336) 854-7859
Dan Tracy
Senior Appraiser—Metals and Manufacturing
(412) 953-6357
John Little
Senior Appraiser—Scrap Recycling
(864) 630-4799
Ryan Lutz
Senior Project Manager—Metals Specialist
(781) 429-4052
Daniel Williams
Managing Director, New York Region
(646) 381-9221