METALLURGICAL INVESTIGATION OF PREMATURE …
135
METALLURGICAL INVESTIGATION OF PREMATURE FAILURES FOR 316L AUSTENITIC STAINLESS STEEL PIPES by Mohammed Al Muaisub B.Sc., King Fahd University of Petroleum and Minerals, 2007 A THESIS SUBMITTED IN PARTIAL FULFILLMENT OF THE REQUIREMENTS FOR THE DEGREE OF MASTER OF APPLIED SCIENCE in THE FACULTY OF GRADUATE AND POSTDOCTORAL STUDIES (Materials Engineering) THE UNIVERSITY OF BRITISH COLUMBIA (Vancouver) May 2018 © Mohammed Al Muaisub, 2018
Transcript of METALLURGICAL INVESTIGATION OF PREMATURE …

METALLURGICAL INVESTIGATION OF PREMATURE FAILURES FOR 316L
AUSTENITIC STAINLESS STEEL PIPES
by
Mohammed Al Muaisub
B.Sc., King Fahd University of Petroleum and Minerals, 2007
A THESIS SUBMITTED IN PARTIAL FULFILLMENT OF
THE REQUIREMENTS FOR THE DEGREE OF
MASTER OF APPLIED SCIENCE
in
THE FACULTY OF GRADUATE AND POSTDOCTORAL STUDIES
(Materials Engineering)
THE UNIVERSITY OF BRITISH COLUMBIA
(Vancouver)
May 2018
© Mohammed Al Muaisub, 2018

ii
The following individuals certify that they have read, and recommend to the Faculty of Graduate
and Postdoctoral Studies for acceptance, the thesis entitled:
Metallurgical investigation of premature failures for 316L austenitic stainless steel pipes
submitted by Mohammed Al Muaisub in partial fulfillment of the requirements for
the degree of Master of Applied Science
in Materials Engineering
Examining Committee:
Edouard Asselin, Materials Engineering
Supervisor
Tom Troczynski, Materials Engineering
Supervisory Committee Member
Daan Maijer, Materials Engineering
Supervisory Committee Member

iii
ABSTRACT
This thesis analyzed and investigated the premature failures of pipes made from type
316L austenitic stainless steels. Multiple leaks were observed in scattered locations of a
piping network of around 10 km after only 4 months in service transferring ammonium
sulfate solution. The initial investigation indicated that the piping network was constructed
3 years earlier. After the construction, the stainless steel pipes were hydrotested to
ensure the joints integrity. However, the piping network was not properly drained and
dried after the hydrotest which resulted in water stagnation for the complete idle period
between construction and commissioning. Therefore, an electrochemical, chemical,
mechanical and metallurgical testing and analyses were conducted to determine the
damage mechanism which consequently caused these failures. I have conducted
electrochemical tests on a 316L stainless steel electrode in chloridized ammonium sulfate
solution to determine its corrosivity. The electrochemical tests showed that the corrosion
rates of 316L SS in ammonium sulfate solution is very low. This conclusion was supported
by other laboratory studies at higher temperature and by the industrial corrosion tables
published online. Also, two spools from the piping network that experienced the failures
were analyzed using stereoscope, optical microscope, scanning electron
microscopy/energy dispersive spectrometry, X-ray fluorescence and carbon/sulfur
analyzer, tensile testing and microhardness testing. The results of these tests indicated
that the pipes were leaking at the 6 O’clock position near the weld and heat affected zone
areas. The morphology of the attack illustrated a narrow opening with large sub-surface
cavity and tunneling initiated from the internal surface of the pipes. The weld joints
displayed weld defects in terms of root concavity and lack of penetration. The

iv
metallurgical investigation strongly suggests that the pipes failed due to Microbiologically
Influenced Corrosion (MIC). During the idle period of 3 years, the stagnant untreated
water in the closed system was an appropriate environment for bacterial growth leading
to severe damage at the welding joints and the base metal.

v
LAY SUMMARY
This thesis discussed and investigated an interesting type of failure that many industrial
plants, as well as commercial and residential buildings, might experience in their water
system network. Pipes, or even equipment, made of stainless steel, might fail in an
accelerated manner due to bacteria. The scientific term for this type of failure is
Microbiologically Influenced Corrosion (MIC). These bacteria do not “eat” the metal per
se, but they are directly or indirectly involved in chemical and electrochemical reactions
that increase the rate of the attack on the steel components. It is reported that MIC is a
rather common type of corrosion damage that might represent up to 20% of the total
corrosion failures in stainless steel systems.

vi
PREFACE
This thesis is original, independent work by the author, Mohammed Al Muaisub. The
electrochemical tests and analysis that were presented in Chapter 5 is based on my work
in the Corrosion Lab in UBC. The metallurgical, chemical and mechanical tests in Chapter
7 were conducted in the laboratory of the sponsoring company. The following was
extracted from the analytical and research work which is presented in the thesis.
Conference:
Mohammed Al Muaisub, Akram Alfantazi, "Premature Failure of 316L Stainless
Steel Pipes Due to MIC", 2nd NACE European Area Conference, 27-29 May 2018,
Genoa, Italy (Poster Presentation - Submitted and Accepted)

vii
TABLE OF CONTENTS
ABSTRACT ..................................................................................................................... iii
LAY SUMMARY .............................................................................................................. v
PREFACE .......................................................................................................................vi
TABLE OF CONTENTS ................................................................................................. vii
LIST OF TABLES ............................................................................................................xi
LIST OF FIGURES ......................................................................................................... xii
LIST OF SYMBOLS, ABBREVIATIONS, AND NOMENCLATURE ............................... xvi
ACKNOWLEDGEMENTS ........................................................................................... xviii
1 INTRODUCTION ...................................................................................................... 1
2 BACKGROUND ........................................................................................................ 3
3 LITERATURE REVIEW .......................................................................................... 10
3.1 Austenitic Stainless Steels ............................................................................... 10
3.2 Pitting Corrosion in Type 316L SS ................................................................... 13
3.2.1 Critical Factors in Pitting Corrosion ........................................................... 14
3.2.1.1 Surface Environment ................................................................................. 15
3.2.1.2 Potential ..................................................................................................... 16
3.2.1.3 Alloy Composition ...................................................................................... 16
3.2.1.4 Temperature .............................................................................................. 17
3.2.1.5 Surface Condition ...................................................................................... 18

viii
3.2.2 Corrosion in Ammonium Sulfate Solution .................................................. 18
3.2.3 Pitting Corrosion in Potable and Sea Water .............................................. 20
3.3 Microbiologically Influenced Corrosion (MIC) ................................................... 22
3.3.1 Susceptible Materials to MIC ..................................................................... 23
3.3.2 Mechanisms of MIC Bacteria Types .......................................................... 24
3.3.2.1 Sulfate Reducing Bacteria (SRB) .............................................................. 25
3.3.2.2 Iron Oxidizing Bacteria (IOB) ..................................................................... 27
3.3.3 Morphology of the MIC Attack ................................................................... 27
3.3.4 Locations of MIC Failures .......................................................................... 28
3.3.5 Effect of Water Quality on MIC .................................................................. 31
4 OBJECTIVES ......................................................................................................... 33
5 ELECTROCHEMICAL TESTING ON 316L SS IN AMMONIUM SULFATE
SOLUTION .................................................................................................................... 34
5.1 Specimen Preparation ...................................................................................... 34
5.2 Electrolyte Composition ................................................................................... 35
5.3 Corrosion Cell Setup ........................................................................................ 35
5.4 Electrochemical Techniques ............................................................................ 36
5.4.1 Open Circuit Potential (OCP) ..................................................................... 36
5.4.2 Potentiodynamic Polarization Test ............................................................ 36
5.5 Results and Discussion of the Electrochemical Tests on 316L SS Electrode .. 37

ix
5.5.1 Effect of Increasing Chloride Concentration .............................................. 37
5.5.2 Effect of Increasing Ammonium Sulfate Concentration ............................. 42
5.5.3 Effect of Increasing the Scan Rate of the Anodic Polarization Test ........... 43
6 TESTING PROCEDURE FOR THE FAILED 316L SS PIPES ................................ 45
6.1 Visual Examination ........................................................................................... 45
6.2 Chemical Testing ............................................................................................. 46
6.2.1 Chemical Analysis of the Process Sample ................................................ 46
6.2.2 X-Ray Fluorescence and Carbon/Sulfur Analyses ..................................... 46
6.3 Mechanical Testing .......................................................................................... 48
6.3.1 Tensile Tests ............................................................................................. 48
6.3.2 Hardness Tests ......................................................................................... 50
6.4 Metallurgical Testing ........................................................................................ 51
6.4.1 Samples Preparation for Metallography Tests ........................................... 51
6.4.2 Stereoscope and Optical Microscope Analyses ......................................... 52
6.4.3 Scanning Electron Microscopy and Energy-Dispersive X-Ray Spectroscopy
Analyses ................................................................................................................. 53
7 RESULTS AND DISCUSSION FOR THE FAILED 316L SS PIPES ....................... 55
7.1 Visual Examination ........................................................................................... 55
7.2 Chemical Testing ............................................................................................. 64
7.2.1 Chemical Analysis of the Process Samples ............................................... 64

x
7.2.2 X-Ray Fluorescence and Carbon/Sulfur Analyses ..................................... 64
7.3 Mechanical Testing .......................................................................................... 65
7.3.1 Tensile Tests ............................................................................................. 65
7.3.2 Hardness Tests ......................................................................................... 66
7.4 Metallurgical Testing ........................................................................................ 68
7.4.1 Stereoscope and Optical Microscope Analyses ......................................... 68
7.4.2 Scanning Electron Microscopy and Energy-Dispersive X-Ray Spectroscopy
Analyses ................................................................................................................. 72
7.5 Effect of Welding on MIC Initiation ................................................................... 88
7.6 Effect of Hydrostatic testing procedure on MIC Initiation .................................. 89
7.7 Effect of the Idle period between construction and commissioning on MIC
propagation ................................................................................................................ 90
8 CONCLUSIONS AND RECOMMENDATIONS ....................................................... 92
8.1 Summary of the Findings from the Conducted Laboratory Tests ..................... 92
8.2 Summary of Key Observations from the Investigation ..................................... 95
8.3 Recommendations to Avoid the Reoccurrence of the Failure .......................... 96
8.4 Suggested Future Work ................................................................................... 97
BIBLIOGRAPHY ........................................................................................................... 99
APPENDIX .................................................................................................................. 114

xi
LIST OF TABLES
Table 12.1: Process and Operation Parameters ............................................................. 5
Table 22.2: Findings of the Conducted NDT Methods by the Plant Inspectors ............... 6
Table 33.1: Chemical Composition of Type 304L and 316L SS (ASTM A312, 2016). .. 12
Table 43.2: Mechanical Properties of 304L and 316L Austenitic Stainless Steels. (ASTM
A312/A312M, 2016) ...................................................................................................... 12
Table 53.3: Pitting Resistance Equivalent Number for type 304L and 316L Stainless
Steels ............................................................................................................................ 17
Table 65.1: Testing Environment and Conditions .......................................................... 35
Table 76.1: The Dimensions of the Specimens Used in the Tensile Tests .................... 49
Table 87.1: pH and chloride concentrations in 3 process samples ............................... 64
Table 97.2: XRF and carbon-sulfur analysis for the two failed pipes ............................. 65
Table 107.3: Tensile tests results illustrate that both samples meet the mechanical
properties requirements for the type 316L SS. .............................................................. 66
Table 117.4: Microhardness values for the failed sample including the weld area, HAZ
and parent metal. .......................................................................................................... 67
Table 127.5: Qualitative EDS analysis for the S1 spot. Note the high carbon content
suggesting the presence of bacteria.............................................................................. 80
Table 137.6: Qualitative EDS analysis for the S2 spot. ................................................. 81
Table 147.7: Qualitative EDS analysis for deposit Area. ............................................... 83
Table 157.8: Qualitative EDS analysis for the area specified in Figure 7.31. ................ 86
Table 167.9: Qualitative EDS analysis for the area specified in the following Fig 7.32. 86

xii
LIST OF FIGURES
Figure 12.1: Photographs of the leaking pipes. Note that the pinholes located at or near
the weld joints. Note the white flaky deposits from the leaked ammonium sulfate
solution. ........................................................................................................................... 7
Figure 22.2: Photographs of the leaking pipes. Note that the pinholes here are located
at the parent metal. ......................................................................................................... 8
Figure 32.3: Photographs of two X-Ray films generated using RT inspection method at
the weld joints pinholes’ locations. Note the rounded indications alongside the weld
area. ................................................................................................................................ 9
Figure 55.1: Open Circuit Potential of 316L SS in 2 – 4 g/l of chloride in 100 g/l
ammonium sulfate solution ............................................................................................ 38
Figure 65.2: Open Circuit Potential of 316L SS in 6 – 8 g/l of chloride in 100 g/l
ammonium sulfate solution ............................................................................................ 38
Figure 75.3: Open Circuit Potential of 316L SS in 400 g/l ammonium sulfate solution .. 39
Figure 85.4: The effect of increasing chloride content from 2 - 4 g/l in 100 g/l ammonium
sulfate on the 316L working electrode ........................................................................... 40
Figure 95.5: The effect of increasing chloride content from 6 - 8 g/l in 100 g/l ammonium
sulfate on the 316L working electrode ........................................................................... 41
Figure 105.6: The effect of presence of the chloride ions on the corrosion behaviour of
the 316L working electrode in 400 g/l ammonium sulfate solution ................................ 41
Figure 115.7: Open Circuit Potential of 316L SS in chloridised ammonium sulfate
solution at 1 g/l of NaCl ................................................................................................. 42

xiii
Figure 125.8: The effect of increasing the ammonium sulfate concentration from 100 to
400 g/l on the 316L working electrode........................................................................... 43
Figure 135.9: Anodic polarization curves show the effect of increasing the scan rate in
the experiment on the measured potentials and current densities. ............................... 44
Figure 146.1: The Tensile Test Sample. Note the actual dimensions in Table 6.1. ....... 49
Figure 157.1: Photograph of the failed spool in as received condition. Note that the
pinhole located at the weldment area. ........................................................................... 56
Figure 167.2: Photograph of the other failed spool in as-received condition. Note that
the pinhole here is located at the parent metal. ............................................................. 56
Figure 177.3: A Close-up view of the failed spool showing the pinhole at the fusion line.
...................................................................................................................................... 58
Figure 187.4: A Close-up view of the failed spool showing the pinhole at the parent
metal. ............................................................................................................................ 58
Figure 197.5: Close-up view of the internal surface of the failed spool. ........................ 59
Figure 207.6: Photograph shows the pinhole and the subsurface tunneling after
sectioning the spool circumferentially. Note the close-up views of the pinhole mouth at
the ID. ............................................................................................................................ 60
Figure 217.7: A Close-up view of the sectioned spool near the pinhole. ....................... 61
Figure 227.8: Photograph shows the internal surface of the failed spool. ..................... 62
Figure 237.9: Close-up view shows the multiple pits initiated at the incomplete root
penetration area of the weld as indicated in Figure 5.8. ................................................ 62
Figure 247.10: Tensile test results show the tensile and yield strength of the two
samples. ........................................................................................................................ 66

xiv
Figure 257.11: Photomacrograph showing the exact location of the indentations for the
microhardness testing. .................................................................................................. 68
Figure 267.12: Photograph shows a prepared and hot mounted sample of the localized
damage at the weld area. .............................................................................................. 69
Figure 277.13: Photomicrograph shows the localized attack in as polished-condition. . 70
Figure 287.14: Photomicrograph shows the localized attack in as etched-condition. .... 70
Figure 297.15: Photomicrograph of the 316L SS spool sample away from the pinhole in
as-polished condition. .................................................................................................... 71
Figure 307.16: Photomicrograph of the 316L SS sample away from the pinhole in as-
etched condition. ........................................................................................................... 72
Figure 317.17: SEM image at low magnification showing the cross-section photograph
of the subsurface cavity and tunneling. 20x Magnification. ........................................... 73
Figure 327.18: SEM image showing the cross-section photograph of the subsurface
cavity. Note the preferential attack mechanism. 70x Magnification ............................... 74
Figure 337.19: SEM image showing the cross-section photograph of the subsurface
cavity. Note the preferential attack mechanism. 100x Magnification ............................. 74
Figure 347.20: SEM photomicrographs showing the cross-section of the subsurface
cavity. Note the preferential attack mechanism. 250x Magnification ............................. 75
Figure 357.21: Photographs show the morphology of MIC attack on the fusion line of SS
weldment. Note the dendritic attack as pointed by (D) compared to nondendrite area on
(A). The Image on the right shows the MIC attack of the fusion line and the weld area.
(Jack, 2002) .................................................................................................................. 76

xv
Figure 367.22: SEM image shows the pinhole in as received condition. Magnification
25x. ............................................................................................................................... 77
Figure 377.23: A Magnified SEM image of the same location of Figure 7.9. Note the
dimension of the pits openings. Magnification 100x. ..................................................... 77
Figure 387.24: SEM image shows the same previous pinhole at higher magnification
(200x). Note the clear preferential attack mechanism at the edge of the pit. ................. 78
Figure 397.25: SEM images of the cross-section of the pinhole in as-received condition.
Note the irregular shape suggesting bacteria presence. Mag. 1200x and 2000x. ......... 79
Figure 407.26: A form of bacterial cells in a colony at a magnification of 2700x. (Dexter,
2003) ............................................................................................................................. 80
Figure 417.27: EDS analysis for the S1 spot in Figure 7.12. Note the high carbon peak.
...................................................................................................................................... 80
Figure 427.28: EDS analysis for the S2 spot in Figure 7.12. Notice the high iron peak
and the low carbon peak. .............................................................................................. 81
Figure 437.29: SEM Image shows deposits on the internal surface of the pipe. ........... 82
Figure 447.30: EDS analysis of the doposits as shown in Figure 7.29. ......................... 83
Figure 457.31: EDS analysis (Above) for the pinhole in as-received condition (Below). 85
Figure 467.32: EDS analysis (Above) for the pinhole in another location in as-received
condition (Below). .......................................................................................................... 87

xvi
LIST OF SYMBOLS, ABBREVIATIONS, AND NOMENCLATURE
T Temperature
icorr Corrosion Current Density
Ecorr Corrosion Potential
Ep Pitting Potential
Er Repassivation Potential
MAWP Maximum Allowable Working Pressure
RT Radiographic Testing
UT Ultrasonic Testing
NDT Non-Destructive Testing
MIC Microbiologically Influenced Corrosion
UDC Under-Deposit Corrosion
NPS Nominal Pipe Size
ID Inner Diameter
OD Outer Diameter
(NH4)2SO4 Ammonium Sulfate Solution
NaCl Sodium Chloride
NACE National Association of Corrosion Engineers
API American Petroleum Institute
ASTM American Society For Testing Materials
XRF X-Ray Fluorescence
SEM Scanning Electron Microscopy
EDS Energy Dispersive X-Ray Spectrometer
NH3 Ammonia
H2SO4 Sulfuric Acid
Ø Diameter

xvii
SS Stainless Steel
ppm Parts Per Million
PREN Pitting Resistance Equivalent Number
CPT Critical Pitting Temperature
Cl SCC Chloride Induced Stress Corrosion Cracking
SRB Sulfate Reducing Bacteria
H2S Hydrogen Sulfide
IOB Iron Oxidizing Bacteria
CMIC Chemical Microbiologically Influenced Corrosion
EMIC Electrical Microbiologically Influenced Corrosion
HAZ Heat Affected Zone
WPS Welding Procedure Specification
OCP Open Circuit Potential
PDP Potentiodynamic Polarization
ACS American Chemical Society
Ag/AgCl The Silver/Silver Chloride Reference Electrode
LVDT Linear Variable Differential Transformer
PT Dye Penetrant Test
OM Optical Microscope
ISO International Organization for Standardization
ASM American Society for Metals
HRB Rockwell Hardness Scale B
HV Vickers Hardness
TDS Total Dissolved Solids
TSS Total Suspended Solids

xviii
ACKNOWLEDGEMENTS
I offer my continuing gratefulness to my supervisor Dr. Alfantazi for his guidance and
support that helped me in my graduate study. His feedback and patience helped me to
complete successfully my thesis and thus my Master Degree in Materials Engineering.
I would like also to thank Dr. Asselin, Dr. Maijer, Dr. Poole and Dr. Troczynski who served
as the examining committee members for my thesis. Their constructive feedback
tremendously helped me to improve my thesis. My thanks goes to the faculty, staff and
my fellow students in materials engineering department who I learned a lot from them all.
Special thanks to my colleagues Matlub, Ibrahim and Mohammed who assisted and
motivated me on a continuous basis.
Also, thanks to my former manager in SABIC Mr. Ali Al-Hazemi who provided the support
and encouragement to continue my higher education. Finally, thanks to Saudi Basic
Industries Corporation (SABIC) who supported me financially to continue my graduate
studies abroad in the University of British Columbia (UBC).

1
1 INTRODUCTION
In petrochemical industries, one of the major roles of metallurgical and corrosion
engineers is to investigate and analyze different types of failures that were experienced
in piping and pipe fittings, tanks, vessels, and rotating equipment in the plants. One of the
main objectives of such investigations is to clearly define and identify the possible
damage mechanisms that contributed to the failure. Also, an equally important objective
of any such investigation is to propose mitigation methods or remedial actions in order to
avoid the reoccurrence of the failure in the future.
Conducting a failure analysis is a complex process that requires broad knowledge of
different technical disciplines and the use of different techniques. For example, it is
essential to know the difference between an indicator, a cause, a damage mechanism
and a consequence. Although the previously mentioned terminologies might overlap, it
is critical to be able to recognize them during the failure analysis process in order to
determine the suitable course of action that will help prevent the repetition of the failure
in the future. (Scutti, 2002)
Recently, a petrochemical plant experienced a major incident in one of the main pipes
that carries ammonium sulfate solution. There were multiple leaks due to localized attack
in different locations along the pipe. This localized attack was in the form of numerous
pits in the heat-affected zone and base metal. The pit morphologies and locations, as well
as the history of the implemented hydrotesting procedure and water flushing activities,

2
suggested that the probable damage mechanism was Microbiologically Influenced
Corrosion (MIC). Since the total length of the pipes is around 10 kilometers and its
material of construction is type 316L austenitic stainless steel (SS), the financial impact
of this failure was several million dollars. In addition, the piping network was just 4 months
in service at the time of failure. All of these facts indicated that this was a high-value failure
analysis project. Moreover, because of the widespread leaks, such an investigation
became a high priority due to the adverse effects on maintaining the continuous operation
of the plant.
So, the question here is why did a newly commissioned 316L stainless steel pipe system
leak in multiple locations after only 4 months in service? In addition, how did it happen?
Therefore, the aim of this study is to investigate and analyze the damage mechanism of
the newly installed 316L stainless steel pipe system. Moreover, a thorough review of the
literature was presented on the localized damage mechanisms of austenitic stainless
steels with a specialized focus on Microbiologically Influenced Corrosion (MIC). In
addition, the literature review chapter highlights the adverse effect of the weldment and
prolonged water stagnation on the corrosion behaviour. Also, a detailed collection of data
and discussion were presented in the background chapter about the pre-commissioning
and commissioning procedures, the process and operating parameters and the
conducted Non-Destructive Tests (NDT) conducted by the plant inspectors.

3
2 BACKGROUND
It is crucial, as a part of the metallurgical failure investigation process, to collect all the
information and documents that are related to the failure in question. This important step
is required since the failure may not be a direct consequence of a single cause.
Understanding this point will broaden the horizon of the failure analyst trying to unearth
all possible causes that might contribute to the failure at hand. For example, when a tube
failed due to stress corrosion cracking, two conditions should be present in order to have
this damage mechanism. The first condition is the presence of an environment where
there should be chemical or electrochemical reactions take place on the surface of the
material i.e. corrosion mechanism. The second condition is residual or applied tensile
stresses. Without these conditions, stress corrosion cracking is not possible.
Therefore, in this chapter, all related information about the failed pipes was presented.
This information and data includes the material of construction of the failed pipes, the
location of the failure in the plant site, Non-Destructive Testing (NDT) results conducted
on the site, construction and commissioning related data, and finally, process and
operating parameters.
The pipes material of construction, which are intended to transfer ammonium sulfate
solution, are made from type 316L austenitic stainless steel. The nominal pipe size “NPS”
is 3 inch schedule 10, i.e. the pipe outer diameter is 3.5 inch and the pipe thickness is
0.12 inch (3.05 mm). The pipes were in service for only 4 months. However, the piping

4
was first constructed 3 years earlier. The pipes were joined together by welding using
ER316L as the filler material which has similar chemical composition to the base metal.
The industrial standard used for the pipe installation required that upon completion of
construction, and to ensure the integrity of the pipes, hydrostatic testing should be carried
out as part of the pre-commissioning procedure. The main purpose of the hydrostatic
testing, or in short hydrotesting, is to ensure that the pipe system can be operated at the
Maximum Allowable Working Pressure (MAWP). Another purpose is to ensure that there
are no major defects in both the material and the welded joints. After hydrotesting, the
pipes should be drained, dried, purged with nitrogen and kept in this preserved condition
for the entire extended idle period.
Plant documents showed that hydrotesting was conducted. However, the water quality
and proper draining and drying were not controlled and monitored. In addition, during the
3 year idle period, purging with an inert gas like nitrogen was not performed.
The quality of the water used for the hydrotesting should follow the specified guideline.
Seawater and raw/well waters should not be used. Even potable water could only be used
if was treated to ensure that chloride, oxygen and microorganisms were minimal. During
the review of the background information on this failure, no document was found
pertaining to the type or the quality of the water used.

5
Table 2.1 shows the process media and the operating parameters for the solution
transferred through the pipes after commissioning the plant.
Table 12.1: Process and Operation Parameters
Description Value
1 Process concentration 10% ± 1.0 wt. ammonium sulfate and 0.2% Urea
2 Ammonium sulfate pH 3.5 as a set value with performance limit between 3-4
3 Ammonium sulfate
density
1050 Kg/m3 normal/set value with performance limit of
1000-1100 Kg/m3
4 Temperature 45oC – 50oC
5 Pressure 3 – 4 Kg/cm2g (42.7 – 56.9 psi)
In this plant, ammonium sulfate is produced from a chemical reaction between ammonia
and sulfuric acid, as shown in the reaction below:
2𝑁𝐻3 + 𝐻2𝑆𝑂4 = (𝑁𝐻4)2𝑆𝑂4
When the concentration of the ammonium sulfate solution reached 10% wt., the solution
is pumped to an ammonium sulfate crystallization unit through a number of pipes. In that
unit, ammonium sulfate crystals are produced. The failed pipes were part of the piping
circuits that carried the produced solution to the ammonium crystallization unit. As part of
evaluating the criticality of the leakage, the plant inspectors conducted a series of NDT
methods on the leaking pipes in situ as shown in Table 2.2.

6
Table 22.2: Findings of the Conducted NDT Methods by the Plant Inspectors
NDT Method Findings
1
External
Visual
Inspection
Multiple pinholes leaks were observed in the weldments and in
the parent pipe. All the leaks were located at the bottom of the
pipe, 6 O’clock position. No jetting or dripping of fluid was noticed
from the leak locations and only minor wetness & solid deposit
(white flaky deposit) was observed around the leak location. Also,
all the weld joints on the line were found to be with minor rust.
However, no other abnormality noticed on the line. See Figures
2.1 and 2.2.
2 Ultrasonic
Testing (UT)
Ultrasonic Testing (UT) to measure the pipe thickness was
carried out and all the readings were found to be acceptable; for
3” Pipe Ø: UT readings are between 2.8 mm to 3.20 mm against
3.05 mm Nominal Thickness.
3 Radiographic
Testing (RT)
Rounded indications (of size 3~6 mm dia) and elongated
indications (up to 10 mm long) were observed in many weld joints
along the circumference. No other abnormality noticed on the
line. See Figure 2.3.

7
Figure 12.1: Photographs of the leaking pipes. Note that the pinholes located at or near the weld joints. Note the white flaky deposits from the leaked ammonium sulfate solution.
Weld Joint
Weld Joint
Pinhole
Pinhole
The white buildup deposits are from
the leaked ammonium sulfate
The white buildup deposits are from
the leaked ammonium sulfate

8
Figure 22.2: Photographs of the leaking pipes. Note that the pinholes here are located at the parent metal.
Pinhole
Pinhole
The white buildup deposits are from
the leaked ammonium sulfate

9
Figure 32.3: Photographs of two X-Ray films generated using RT inspection method at the weld joints pinholes’ locations. Note the rounded indications alongside the weld area.
The light-colored region is the
circumferential weld joining the pipes
Indications of weld defects
Indications of weld defects

10
3 LITERATURE REVIEW
Based on the background of this failure, the 316L stainless steel pipes experienced
localized corrosion attack. Also, the abnormal idle time between construction and
commissioning is anticipated to play a significant role in the failure mechanisms.
Moreover, since the pinholes were located at or near the welded area, this indicates that
welding procedure/parameters could also contribute to this failure.
In this chapter, the published literature was reviewed in the following areas: localized
attack of 316L SS in the form of pitting corrosion, the corrosion behaviour of 316L SS in
ammonium sulfate solution, the corrosion of weldments in stainless steel, the MIC attack
of 316L SS and its common relation with hydrostatic testing in terms of the water quality,
the procedure, and the aftermath of the extended idle period.
3.1 Austenitic Stainless Steels
Since petrochemical industrial equipment and piping deal with different chemicals and
service environments with different operating parameters i.e. temperature, pressure, pH,
flow rate, etc., it became necessary to select suitable materials of construction that can
maintain such conditions. Austenitic stainless steels can withstand processes with
temperatures varying between cryogenic levels up to 600 oC. In addition, they are suitable
to be used in severe corrosive environments (Davis, 2006).

11
The family of austenitic stainless steels comprises many alloys with different chemical
compositions. Generally, they are classified as a family of iron based alloys that have
more than 50% of Iron, between 16% to 26% of chromium and less than 35% of nickel
(Demeri, 2013). The two most common alloys in this category are 304L SS and 316L SS,
where the “L” stands for low carbon content. The advantage of using the L grades is to
maintain the corrosion resistance of the material by reducing its susceptibility to
sensitization (AWS D10.4, 1986). The sensitization occurs due to the precipitation of the
chromium carbide along the austenite grain boundaries which results in depleting the
adjacent boundaries from chromium that will increase the susceptibility to corrosion (Kutz,
2002).
The 304L and 316L SS differ in the chromium and nickel contents, which increase the
corrosion resistance and the hardenability of the materials, respectively. Yet, the major
difference between the two alloys is the addition of molybdenum in the composition for
the resistance to halogen acids. Molybdenum increases the pitting resistance of the
material from oxidizing chlorides. Table 3.1 shows the chemical composition of the two
alloys. (Kelly, 2002)

12
Table 33.1: Chemical Composition of Type 304L and 316L SS (ASTM A312/A312M, 2016).
Grade
Weight, %, maximum, unless otherwise indicated
C Mn Si P S Cr Ni Mo
TP 304L 0.035 2.00 1.00 0.045 0.030 18.0-20.0 8.0-13.0 ---
TP 316L 0.035 2.00 1.00 0.045 0.030 16.0-18.0 10.0-14.0 2.00-3.00
As for the mechanical properties, austenitic stainless steels normally have superior
toughness, higher rates of work hardening and low yield strength with high ductility when
compared against ferritic or martensitic stainless steels (Cramer, 2005). Table 3.2 shows
the mechanical properties of the 304L and 316L austenitic stainless steels. Notice that
the minimum requirements for the tensile and yield strengths are affected by the carbon
content.
Table 43.2: Mechanical Properties of 304L and 316L Austenitic Stainless Steels. (ASTM A312/A312M, 2016)
Grade UNS Designation. Tensile
strength, min ksi [MPa]
Yield strength, min
ksi [MPa]
Elongation in 2 in. or 50 mm (or 4D), min, %
Longitudinal Transverse
TP304 S30400 75 [515] 30 [205] 35 25
TP304L S30403 70 [485] 25 [170] 35 25
TP316 S31600 75 [515] 30 [205] 35 25
TP316L S31603 70 [485] 25 [170] 35 25
As mentioned earlier, one of the main purposes for the use of austenitic stainless steel is
its ability to resist a corrosive attack in certain environments. Olsson (2003) stated that
the presence of the passive layers on stainless steel surfaces gives such material its
13
superior corrosion resistance characteristic (Olsson, 2003). It is worth noting that these
passive layers on the stainless steel surfaces are influenced by the alloying elements in
the chemical composition (Olsson, 2003). Once the bare surface is exposed to the
environment, the chemical reaction between them results in a thin and resistant film made
of chromium oxide that drives the corrosion rate to very low level (Olefjord, 1980).
Generally, various damage mechanisms could take place on piping and equipment made
from type 316L austenitic stainless steels. In rare cases, stainless steel could experience
uniform corrosion. However, the most common forms of corrosion are as follows: pitting,
crevice corrosion, intergranular corrosion, galvanic corrosion, microbiologically influenced
corrosion, high-temperature corrosion, stress corrosion cracking, and erosion (Dillon,
2015).
In the subsequent sections, a greater focus was placed on one of the major forms of
localized corrosion, which is pitting corrosion. Then, in a separate section, a detailed
literature review was presented on Microbiologically Influenced Corrosion (MIC).
3.2 Pitting Corrosion in Type 316L SS
In the beginning, it is critical to correctly characterize the localized corrosion and pitting
as to whether they are corrosion forms or distinctive damage mechanisms. In order to do
so, localized corrosion and pitting should be defined first. Localized corrosion is generally
a loss of metal that occurs in isolated areas on surfaces that are generally uncorroded.

14
On the other hand, pitting could be classified as an extreme form of localized corrosion
and can be defined as loss of metal with a common morphology of a V shape, i.e.
penetrates deeply with a narrow surface opening. Therefore, pitting should be considered
as a corrosion form rather than separate damage mechanism. This is mainly due to the
various damage mechanisms that exhibit pitting as the morphology of the attack (Dillon,
2015).
As mentioned previously, stainless steels are selected to be used in many static and
rotating equipment due to a thin oxide layer called the passive film in nanometer-scale
which is formed on the surface and significantly lower the corrosion rate. However, the
passive layers can breakdown in localized locations. When this happens, it results in an
accelerated corrosion of the underlying metal which then causes pitting. The criticality of
these pits could be understood by their consequences. For example, main structural
components could fail due to major localized thickness loss that adversely affect the
minimum required thickness to maintain the working pressure. Also, pits could lead to
major components failure by acting as initiation sites for different cracking mechanisms.
(Frankel, 2003)
3.2.1 Critical Factors in Pitting Corrosion
There are various factors influencing pitting corrosion. Such factors include surface
environment, surface condition, metal composition, potential and temperature. Critical
surface environment factors include ion concentrations, inhibitor concentrations, and pH.

15
Other fundamental aspects of the pitting corrosion are the stochastic nature of the
processes and the different stages of the localized attack. Therefore, in this section, a
thorough review was presented on these critical factors. (Frankel, 2003)
3.2.1.1 Surface Environment
Generally, pitting corrosion is a result of the attack of aggressive anion species on the
oxide passive layer (Frankel, 2003). Such attack is exhibited as localized damage due to
the passive layer breakdown (Frankel, 2003). Moreover, it was well established in the
early stages of studying the pitting corrosion that the severity of this type of corrosion is
strongly correlated with the bulk chloride concentrations (Leckie, 1966). This is due to the
fact that chloride is an anion of a strong acid where a number of metal cations show
significant solubility in chloride solutions (Galvele, 1981). Generally, type 316L stainless
steel is suitable for use at ambient or near ambient temperature for low concentrations of
chloride, i.e. in the range of 200 – 1000 ppm (Grubb, 2005).
The corrosion inhibitor needs to be introduced first prior to the initiation of any pits.
Controlling the pitting using corrosion inhibitor once the pit started might not solve the
problem. Pitting is thought to be autocatalytic in nature which means that once the pit
initiated and started growing, the localized environment is changed in a way that promotes
further growth of the pit (Frankel, 2003).

16
3.2.1.2 Potential
All metals and alloys have characteristic potentials. Generally, for a typical austenitic
stainless steel potentiodynamic polarization test result., the scan starts from lower
potentials to higher potentials where a pit will initiate when the potential reaches the pitting
potential (EP). The pit will carry on to propagate with high current density until the potential
lowers to reach the repassivation potential (ER) where the passive film will reproduce,
thus significantly lowering the current density. (ASTM International Standard G61 - 86,
2014)
3.2.1.3 Alloy Composition
As highlighted by Szklarska-Smialowska (2004), the composition of the alloy and the
microstructure could be controlled to decrease the susceptibility of the material for pitting.
Moreover, the physical and chemical imperfections of the materials which are formed
during the production of most engineering alloys could lead to the pits development.
Various elements like molybdenum, chromium, nitrogen and nickel were stated to have a
significant effect on improving the pitting resistance of stainless steels. (Szklarska-
Smialowska, 2004)
It is worth noting that a simplified yet effective equation was introduced to determine the
pitting resistance of various materials based on the alloying elements composition. The
Pitting Resistance Equivalent Number (PREN) could be calculated based on the following
equation: (Cleland, 1996)
𝑃𝑅𝐸𝑁 = 𝐶𝑟 (𝑤𝑡. %) + 3.3𝑀𝑜 (𝑤𝑡. %) + 16𝑁 (𝑤𝑡. %)

17
Lorenz first introduced the basic form of this equation in 1969 as follows: (Lorenz, 1969)
𝑃𝑅𝐸𝑁 = 𝐶𝑟 + 3.3𝑀𝑜
However, it was noticed that nitrogen plays a significant role in the pitting resistance when
added as an alloying element. Therefore, Truman in 1987 fine-tuned the PREN equation
to be the currently most used format as highlighted earlier with the addition of 16N
(Truman, 1987). Table 3.3 illustrates the PREN values for the materials listed in Table
3.1.
Table 53.3: Pitting Resistance Equivalent Number for type 304L and 316L Stainless Steels
Grade UNS Designation Cr Mo PREN
TP 304L S30403 18.0 – 20.0 --- 18 – 20
TP 316L S31603 16.0 – 18.0 2.0 – 3.0 22.6 – 27.9
3.2.1.4 Temperature
Temperature role in determining the pitting resistance is vital. Based on many studies, a
new correlation with pitting potential was introduced which was labeled as Critical Pitting
Temperature (CPT) where it derived from the stipulated experimental procedure for each
metal and alloy. It was found that in artificial seawater, for example, the pitting potential
decreases when the solution temperature increases. Therefore, materials that
demonstrate higher CPT tend to have higher resistance to pitting corrosion. (Ovarfort,
1989; Arnvig, 1996)

18
3.2.1.5 Surface Condition
Another mostly unconsidered critical factor for pitting corrosion is the material surface
condition where materials with rougher surface exhibit higher susceptibility and rate for
pitting corrosion. It was reported that a stainless steel sample of type 302 that was finished
to 120-grit had a pitting potential of about 150 mV lower than a sample that was finished
to 1200-grit in chloride containing environment. (Laycock, 1997)
Moreover, Sedriks (1996) demonstrated in his publication “Corrosion of Stainless Steels”
that multiple applied treatments like heating, grinding and abrasive blasting could
detrimentally affect the pitting resistance. As for the heat treatment, if applied improperly,
it could result in a chromium-depleted region that introduced a preferential site for pitting
due to the lower corrosion resistance. Furthermore, another side effect of improper heat
treatment is the heat tint oxide that also becomes a preferred site for pitting to initiate.
(Sedriks, 1996)
3.2.2 Corrosion in Ammonium Sulfate Solution
A limited number of papers and studies were found discussing and investigating the
electrochemical and corrosion behaviours of 316L stainless steels in ammonium sulfate
solutions at low temperature environment. One of the earliest published studies on the
corrosion behaviour in ammonium sulfate solution was conducted by Sugibayashi in
1954. Although the article was published in the Japanese language, the summary was
translated into English. It was found that the corrosion rate of 18-8 steel, i.e. 304 SS,

19
decreases at temperatures below 80 oC and significantly increases at temperatures
higher than 90 oC. They also reported that when the 18-8 material was modified by the
addition of molybdenum, the corrosion rate decreased. In particular, with the addition of
2.65 % Mo, the corrosion rate decreased to less than 5% of that measured for 18-8 based
on a 7-day immersion test, i.e. corrosion loss in weight of 0.11 mg/cm2 vs. 2.6 mg/cm2
(Sugibayashi, 1954).
Another early study on the corrosion behaviour of ammonium sulfate solution at
evaporative conditions was conducted by Lebedev (1974). The laboratory tests were
conducted in a harsh environment to simulate the worst-case scenario in the industrial
setting where the ammonium sulfate solution was at a boiling temperature and at pH of
5. The Kh18N10T and Kh17N13M2T materials, equivalent to 304 and 316 stainless steels
were exposed to such conditions for up to 4.5 months. It was found that the corrosion rate
of Kh18N10T is 0.11 mm/year whereas for Kh17N13M2T, the corrosion rate was 0.07
mm/year. Such findings coincide with the previously mentioned study that shows the
better corrosion resistance of 316 SS comparing to 304 SS. (Lebedev, 1974)
On another note, one of the closely related studies was conducted by Ghahreman (2012),
on 316L and 317L SS alloys in chloride containing ammonium sulfate (3.56 M) solution
at 100 oC. It was found that in naturally aerated condition, 316L is adequate material in
neutral and slightly acidic environments i.e. pH between 5.4 and 7.4 with the presence of
chloride at 0.12 M. (Ghahreman, 2012)

20
The same goes while reviewing the industrial guidelines, Outokumpu, a large corrosion
resistant alloy manufacturer, has published online its own corrosion tables for materials
exposed to different solutions at different concentrations and temperatures. The corrosion
tables showed that at any ammonium sulfate concentration, the corrosion rates of 304L,
316L and 317L is lower than 0.1 mm/year when the temperature is between 20 oC and
the boiling point.
Moreover, Sandvik, which is a well-known Swedish company manufacturing stainless
steel products among others, has also published its own corrosion tables in the public
domain. Their laboratory corrosion tests were performed with pure chemicals and water
almost saturated with air. They have also concluded that at any ammonium sulfate
concentration, the corrosion rates of 3R12, 3R60, and 18Cr13Ni3Mo, which are
equivalent to 304L, 316L and 317L, respectively, are lower than 0.1 mm/year when the
temperature is between 20 oC and the boiling point.
3.2.3 Pitting Corrosion in Potable and Sea Water
It is critical to review the literature regarding pitting corrosion in potable and seawater.
This is required since the pipes were exposed to water during the hydrotesting and with
improper draining and drying following the testing, residue water was stagnant for an
extended period. Also, based on the background info, it was not clear which type of water
was used. Therefore, it is important to briefly review the literature on this subject.

21
There are three main factors that should be considered when studying pitting corrosion
in potable and seawater systems. These factors are chloride concentrations, temperature,
and velocity. As for the chloride concentrations, it was briefly highlighted earlier that 316L
stainless steels could be used for a range of 200 – 1000 ppm at around ambient
temperature (Grubb, 2005). However, at a higher temperature, the required chloride
concentrations to cause chloride induced pitting corrosion or chloride Induced Stress
Corrosion Cracking (Cl SCC) is lower (Grubb, 2005). It is worth noting that for Cl SCC,
the industrial practice is that no practical minimum limit of chloride is required to initiate
such a damage mechanism. This is due to the well-established knowledge that there are
circumstances where chloride concentrates such as during alternating exposure to dry-
wet conditions. When this happens, Cl SCC could occur at elevated temperatures
exceeding 140 oF (60 oC) (API 571, 2011).
Moreover, the second factor, temperature, should be considered and analyzed prior to
recommending materials in seawater applications. Similar to the critical pitting
temperature (CPT), critical crevice corrosion temperature (CCT) must be studied and
measured using ASTM G 48 – 11 “Standard Test Methods for Pitting and Crevice
Corrosion Resistance of Stainless Steels and Related Alloys by Use of Ferric Chloride
Solution”. Such test methods are used to compare and rank the different types of stainless
steels and their resistance to pitting and crevice corrosion. (Kovack, 1997)

22
As for the third factor, velocity, it is one of the most critical factors that should not be
overlooked during the design, construction and commissioning stages. It was reported
that at stagnant, intermittent or low water flow i.e. the velocity is less than 1.5 m/s,
stainless steels would develop localized corrosion (Grubb, 2005). One of the causes for
the development of localized corrosion is the formation of a microbial slime layer that
causes biofouling (John Grubb, 2005). Another reason is the precipitation of deposits due
to low/stagnant flow which creates Under Deposit Corrosion (UDC).
3.3 Microbiologically Influenced Corrosion (MIC)
Microbiologically Influenced Corrosion (MIC) was first officially recognized by the National
Association of Corrosion Engineers (NACE) to be the designated terminology to describe
this type of failure (Javaherdashti, 2008). Yet, in literature, various terms were used to
describe it, such as microbiologically induced corrosion, microbial corrosion, biocorrosion
and biodeterioration. It may seem more appropriate to address it as Biologically
Influenced Corrosion since the culprit here is not only microorganisms but also algae that
can be seen by the unaided-eye which can have detrimental effect resulting in under-
deposit corrosion. However, it is advisable to follow NACE and the literature norm. So, in
this thesis, this type of corrosion is referred to as Microbiologically Influenced Corrosion
(MIC).

23
3.3.1 Susceptible Materials to MIC
MIC attack was reported to be the cause of failure in many types of materials. However,
greater focus was directed towards materials that are extensively used in industrial
applications. Therefore, it is reported that iron based alloys, copper based alloys, nickel
based alloys and aluminum based alloys were among the most reported, studied and
investigated materials in regard to their susceptibility to MIC. Moreover, in general,
studies show that titanium and titanium based alloys are almost immune. (Jack, 2002)
Filip found that some types of bacteria even attack plastics (Filip, 1992). This highlights
the fallacy in the common impression that non-metallic materials are superior substitutes
to metallic materials.
Javaherdashti explained that the widespread reports of MIC could be a result of some
kind of a chemical response (Javaherdashti, 2008). However, it seems that trying to
correlate the MIC attack to some materials is not a practical approach since focusing the
research to understand the attachment of the planktonic cells to any material’s surface to
be sessile cells and the following microbial colonization is more logical. In other words, if
the bacteria are present in an environment that provides nutrients to colonization growth,
then the surface underneath this slime or biofilm will provide a localized environment or
a concentration cell that is significantly different from the bulk stream, irrespective of the
chemical composition of the base material. As such, the different bacteria that have
oxidizing, reducing or producing mechanisms, provide a wide range of localized corrosive

24
media that attack different types of materials. Such an explanation is supported by
Groysman (2010) who stated that the surface material has almost no effect on the biofilm
attachment and growth since microorganisms attach to different metallic and non-metallic
materials within 30 seconds of exposure with almost the same rate (Groysman, 2010).
The next section highlights in detail the specific damage mechanisms of different types
of bacteria.
3.3.2 Mechanisms of MIC Bacteria Types
During the research for industrial case studies where the damage mechanism was
attributed to MIC, many stipulated that Sulfate Reducing Bacteria (SRB) or Iron Oxidizing
Bacteria (IOB) were the responsible types of bacteria. However, as highlighted by
Geissler in the paper “Do not Just Blame the SRBs and APBs for MIC”, it stated the long
common belief of blaming the bacteria which generate hydrogen sulfide (H2S) or organic
acids as part of their metabolism to be responsible for MIC attacks. However, it is not only
these two types that could cause MIC (Geissler, 2015). A NACE publication about the
selection, application and evaluation of biocides in the oil and gas industry lists eight (8)
different types of bacteria in oilfield environments: acid producers, iron oxidizers, iron
reducers, general heterotrophs, methanogens, nitrate reducers, sulfur oxidizers, and
sulfur reducers (NACE, 2006). The reason behind the mainstream focus on the two
aforementioned types of bacteria to be studied, analyzed and linked to MIC was the fact
that laboratory culturing of such types are easier than the rest (Geissler, 2015).

25
Nevertheless, in this thesis literature review, the focus was on studying the mechanisms
of Sulfate Reducing Bacteria (SRB) and Iron Oxidizing Bacteria (IOB). This is due to the
significant similarities between this failure in question and other failures that occurred in
the industry with similar environment and materials of construction.
3.3.2.1 Sulfate Reducing Bacteria (SRB)
Sulfate Reducing Bacteria (SRB) were comprehensively and frequently studied and
analyzed to understand their corrosive effect on many metallic materials under different
environmental conditions. Yet, other groups like thiosulfate-reducing bacteria, nitrate-
reducing bacteria, acetogenic bacteria and methanogenic archaea were also suspected
to be influencing the corrosion behaviour of iron and iron based alloys. Nevertheless, SRB
was normally identified as the primary cause of failures attributed to MIC. This conception
was based on the following three aspects, as highlighted and quoted below by Enning
(2014):
“First, anoxic sulfate-rich environments (e.g., anoxic seawater) are particularly
corrosive.”
“Second, SRB and their characteristic corrosion product iron sulfide are
ubiquitously associated with anaerobic corrosion damage.”
“Third, no other physiological group produces comparably severe corrosion
damage in laboratory-grown pure cultures.” (Enning, 2014)

26
Therefore, a hypothesis of MIC SRB corrosion should be corroborated by comparing the
SRB mechanism and the other previously mentioned types of bacteria’s mechanism
based on these three aspects.
For SRB to take place, there are two different scenarios that should be highlighted. These
scenarios are Chemical Microbiologically Influenced Corrosion (CMIC) and Electrical
Microbiologically Influenced Corrosion (EMIC). The former starts with the attack on iron
by hydrogen sulfide which is the CMIC. The latter is when sulfate reducing bacteria attack
the iron by the direct utilization of the metal itself which happens by the direct electron
uptake, i.e. EMIC. It is worth mentioning that such scenario where noticed only on few
strains of SRB that were studied in the last few years (Enning, 2014).
Enning in an earlier publication assumed that EMIC is wide spread and has significant
technical relevance (Enning, 2012). Thus, CMIC and EMIC are considered the main
processes for the corrosion of iron by sulfate reducing bacteria (Enning, 2014).
Nevertheless, SRB attack can be further aggravated when oxygen ingresses in the
system (Lee, 1995). Oxygen ingress could result in the formation of corrosive sulfur
species due to the partial oxidation of dissolved hydrogen sulfide and iron sulfide deposits
at the surface of the steel component (Nielsen, 1993).

27
3.3.2.2 Iron Oxidizing Bacteria (IOB)
Iron oxidizing bacteria, or iron bacteria for short, utilize Fe(II) as an energy source, which
oxidizes ferrous iron to ferric iron. The main feature of iron oxidizing bacteria like
Gallionella is their vital part in concentrating the chloride ions under the tubercules
because of the reaction of the chloride ions with the produced ferric ions by the iron
oxidizing bacteria. As such, the localized environment under the tubercules consequently
become very acidic. (Javaherdashti, 2013)
3.3.3 Morphology of the MIC Attack
The morphology of MIC attack is one of the most discussed, studied, argued and also
debated in the academic and industrial research communities. Some authors confirmed
their failure investigation to be due to MIC solely based on the morphology of the attack.
Others have supported their hypothesis of MIC failure by conducting bacteria cell count
or other methods to analyze microbial presence and growth. Such methods are briefly
described in a later section.
Borenstein (2002) analyzed a failure case of austenitic stainless steel pipe in contact with
untreated stagnant water for 9 months. The through-wall pitting was sectioned and they
found a large subsurface cavity with a small opening from the surface. In order to ensure
that this type of attack was due to nothing but MIC, the authors used low chloride water
since the presence of chloride will most likely trigger a localized attack in the form of pitting
or crevice corrosion. (Borenstein, 2002)

28
It should be noted that the morphology of the MIC attack might be different when
comparing carbon steel to stainless steels. In a laboratory investigation of carbon steel
failed by MIC due to hydrotest water remaining in the pipes for an extended period of
time, the pit morphology was different. Unlike the narrow opening and tunneling, pits
caused by MIC in carbon steel are rather shallow and large. Sometimes exhibiting a
morphology called cup-shaped pits. (Huang, 2012)
It is worth mentioning that the above two references are not the only ones. Such
observations became well accepted identification of MIC pits such that many industrial
standards, guidelines and reports highlighting MIC morphology of the attack in stainless
steel is a wide subsurface cavity with a narrow opening whereas for carbon steel is cup-
shaped pits within pits. This was highlighted in the American Petroleum Institute
Recommended Practice (API 571) titled “Damage Mechanisms Affecting Fixed
Equipment in the Refining Industry”.
3.3.4 Locations of MIC Failures
Recognizing the probable or potential locations of MIC attacks are extremely beneficial
to understand and readily identify any future damage due to MIC in order to better prevent
or minimize their criticality and adverse consequences. As such, this section highlights
the abundant industrial and academic studies about MIC attack locations.

29
Prior to reviewing the literature on this subject, it is imperative to define the word
“weldment”. The term “weldment” includes the weld area, the heat affected zone (HAZ)
and the adjunct parent metal, as noted by NACE/ASTM G193 “Standards Terminology
and Acronyms Relating to Corrosion”. Therefore, with this in mind, this section reviews
the publications based on the aforementioned definition. (NACE/ASTM, 2012)
Davis in his book “Corrosion of Weldments” explained that MIC usually occurs at or near
the weld area and the heat affected zone. Kobrin in his article “Microbiologically
Influenced Corrosion of Stainless Steels by Water Used for Cooling and The Hydrostatic
Testing” identified that for weld defects like lack of penetration and root concavity, such
defects are normally the preferred sites for attachment and growth of microbial colonies.
(Kobrin, 1997)
As a general concept, MIC is not the only damage mechanism that attacks stainless steels
at the weld area. Cramer and Covino have listed other damage mechanisms such as
pitting corrosion, crevice corrosion, sensitization, Chloride Stress Corrosion Cracking (Cl
SCC) and caustic embrittlement. There are many causes of the stainless steel weldment
being the target of many damage mechanisms. Such reasons are:
During the welding process, the material exhibits a heating and cooling cycle
which consequently affects the weldment microstructure and chemical
composition. In this case, the corrosion resistance of non-filler welds will be
lower than of the base metal. This is also true when using filler material for

30
welding that is the same in chemical composition to the base metal. (Cramer,
2003)
The selected heat input and the welder workmanship will change how the
weldment solidifies, which, if done improperly, may reduce the corrosion
resistance. (Streicher, 1978)
The corrosion of stainless steel weldments based on the aforementioned causes could
be abated through the proper material selection of the base metal, by quality monitoring
the welding practices and workmanship, and by using a suitable filler material. (Cramer,
2003)
Furthermore, Planktonic bacteria are presumably attracted to the weld area, fusion line
or the heat affected zone (HAZ). Therefore, improper welding practices increase the
chances of MIC initiation either by introducing heat oxide tent or by root concavity or lack
of weld filler penetration which result in welding defect and a preferred zone for bacteria
to attach to the surface and form the biofilm layer that later causes the MIC. (Cramer,
2003)
As highlighted earlier, it is critical to shed some light on why microorganisms prefer to
attach themselves and colonize in the weldment area. One explanation for this issue is
that due to welding, the surface roughness and even the chemical composition are
different in a way that attracts the bacteria, or microorganisms in general, to colonize the

31
pipe internal surface that is in contact with water. Another explanation suggests that even
if the weld area and base metal have the same chemical composition and there is no
welding defect, bacteria tend to also attach to the weldment area because of residual
stresses introduced by the welding. (Cramer, 2003)
3.3.5 Effect of Water Quality on MIC
The quality of water which is used in hydrostatic testing is critical to the prevention of MIC
at the equipment and piping commissioning stages. To ensure the suitability of water for
the intended hydrostatic testing, a number of parameters should be controlled including
chloride content, bacteria count, oxygen concentration, and pH. Therefore, this section
discusses, in brief, the two main parameters: chloride concentration and the bacteria
count.
In general, the variations of the previously mentioned parameters could be explained by
the type of water used and the subsequent treatment that was applied, if implemented.
For example, potable water does have lower chloride concentration and bacteria count
than seawater. As for the aquifer and well water, it depends on the geographical location,
as in near industrial or marine environment, and the depth of the wells. Depending on the
type of water used in hydrotesting, the severity of potential MIC could be correlated.
Dexter (2003) stressed that the first encounter of material to the possible microorganisms
is during the hydrostatic testing right after the piping fabrication in the shop. He continued

32
that, usually, the type of water used is untreated fresh well waters that have a
considerable amount of bacteria, like Gallionella, which is blamed for causing MIC attacks
on stainless steels. Therefore, the best line of defense is to treat the type of water used
for hydrotesting by biocides. (Dexter, 2003)
As for which type of biocides should be used to prevent the microbial presence in the
water, the oxidizing biocides are generally considered for such use. In particular, chlorine
and ozone are the most chemicals used in the cooling water systems (Rice, 1991).
However, due to regulation pertaining to the use of chlorine, ozone is increasingly used
over it since only minimal rates of dosing are required compared to chlorine (Videla,
1995). As a common industrial practice highlighted by Javeherdashti, it was stipulated to
control the bacteria count to 1000 cells/mL prior to using the water for hydrotesting
purposes. As such, the water is classified as a low corrosive type (Javeherdashti, 2013).

33
4 OBJECTIVES
Based on the review of the literature and the presented background information about the
failure of 316L SS pipes in ammonium sulfate solution in a premature manner, the
objectives in this thesis are:
Conduct electrochemical tests i.e. open circuit potential and potentiodynamic
polarization tests on 316L Stainless Steel electrodes in ammonium sulfate solution
at various chloride concentrations and different ammonium sulfate concentrations.
The objective of these tests is to prove that the material is suitable under conditions
that are similar to the service of the failed pipes and to add evidence to the theory
that the corrosion occurred before the pipes were put into service.
Confirm that the pipe material meets the nominal chemical composition of 316L
stainless steel and that it is not mechanically different from standard 316L.
Perform a detailed failure analysis.

34
5 ELECTROCHEMICAL TESTING ON 316L SS IN AMMONIUM
SULFATE SOLUTION
Several electrochemical tests in ammonium sulfate solution were conducted to simulate
the actual conditions of the process of the failed piping. Open Circuit Potential (OCP)
and Potentiodynamic Polarization (PDP) were conducted at different ammonium sulfate
concentrations and various chloride concentrations. The purpose was to evaluate if the
ammonium sulfate solution which was transported inside the piping was corrosive to the
piping material of construction, 316L SS. Thus, this chapter includes the testing method
and the discussion of the results on 316L SS electrodes.
5.1 Specimen Preparation
A cylindrical sample was cut into coin-shape from a 316L SS rod. A Teflon insulated wire
was attached to the back of the sample using conductive epoxy. The sample was then
mounted in cold-cure epoxy.
Grinding was performed to the mounted sample to remove first the thin layer of epoxy,
that sometimes exist due to imperfect handling of the resin, in order to have a uniform
and planar surface. Then, further grinding/polishing was done to 1200 grit silicon carbide
paper to remove any course scratches. Polishing was then done with 6 um and then 1
um diamond suspension. Finally, the specimen was washed with methanol, rinsed with
demineralized water and then dried with an air jet.

35
5.2 Electrolyte Composition
Ammonium sulfate solution (NH4)2SO4 was prepared using white granular (99% min.)
Ammonium sulfate ACS grade and demineralized water. Sodium chloride (NaCl) was
added to the solution at different concentrations. Table 5.1 show the prepared and tested
electrolyte composition. Note that all the tests conducted in naturally aerated solutions at
room temperature.
Table 65.1: Testing Environment and Conditions
Testing
Material
Conducted Electrochemical
Tests
Testing Conditions
(NH4)2SO4 NaCl
1 316L SS
Open Circuit Potential and
Potentiondynamic Polarization 100 g/l
2 – 4 g/l
(at 1 g/l increment)
2 316L SS
Open Circuit Potential and
Potentiondynamic Polarization 100 g/l
6 – 8 g/l
(at 1 g/l increment)
3 316L SS
Open Circuit Potential and
Potentiondynamic Polarization 400 g/l 0 and 1 g/l
5.3 Corrosion Cell Setup
A standard three-electrode corrosion cell was used to conduct the electrochemical tests.
A 1-liter of the ammonium sulfate solution was added to the cell followed by immersing
the prepared sample of 316L SS as the working electrode opposite to the counter
electrode made from graphite. Also, a silver chloride (Ag-AgCl) electrode was installed

36
acting as a reference electrode. A “VersaSTAT-4” potentiostat/galvanostat of Princeton
Applied Science was used to perform the open circuit potential and the potentiodynamic
polarization tests in order to analyze the corrosion behaviour of the 316L SS in the
intended service.
5.4 Electrochemical Techniques
5.4.1 Open Circuit Potential (OCP)
The OCP, sometimes called the corrosion potential, is defined as the potential difference
of the working electrode compared to the reference electrode when no current is applied.
The OCP tests of ammonium sulfate solution of different concentrations, 100 g/l and 400
g/l, and various chloride concentrations, 0 to 10 g/l of NaCl, were carried out at room
temperature. The measured values of the voltage in reference to the Silver-Silver chloride
electrode were plotted against the time in seconds.
5.4.2 Potentiodynamic Polarization Test
The method of potentiodynamic polarization is to change the working electrode potential
and measure the corresponding current as a function of potential/voltage. Based on the
test findings, the corrosion current density can be determined. The potentiodynamic
polarization tests were conducted following the OCP tests under the same conditions as
highlighted in the previous Table 5.1. Only anodic polarization tests were conducted. The
scan rate was set at 1 mV per 6 seconds i.e. 0.167 mV/s. Additionally, at exactly the same
concentrations and testing parameters, two anodic polarization tests on 316L SS
electrode were conducted while only varying the scan rate from 0.167 mV/s to 1 mV/s.

37
5.5 Results and Discussion of the Electrochemical Tests on 316L SS
Electrode
5.5.1 Effect of Increasing Chloride Concentration
Figures 5.1 – 5.3 illustrate the OCP test results for the 316L Stainless Steel working
electrode in naturally aerated ammonium sulfate solution at pH of 5.4 with various chloride
concentrations as a function of time. Figure 5.1 illustrates the noticeable increase in the
open circuit potential when increasing the chloride content from 2 g/l to 4 g/l in 10%
ammonium sulfate solution. Figure 5.2 tells a slightly different story when the chloride
content was increased from 6 g/l to 8 g/l while maintaining the other parameters at the
same values. Although the measured potential at the beginning of the test showed a
significant difference between the different chloride concentrations, when the time passed
and reached the 3600 s mark, the open circuit potential of 316L stainless steel for the
different chloride concentrations almost converged. Looking closer, the open circuit
potentials increased at a millivolt (mV) level with the increase of chloride content. As for
Figure 5.3, the open circuit potentials in 40% ammonium sulfate solution were measured
to compare the effect of adding 1 g/l of chloride with the same solution without the
presence of chloride. The results showed that the OCP increased with the addition of
chloride, which is consistent with the previous OCP tests.

38
Figure 45.1: Open Circuit Potential of 316L SS in 2 – 4 g/l of chloride in 100 g/l ammonium sulfate solution
Figure 55.2: Open Circuit Potential of 316L SS in 6 – 8 g/l of chloride in 100 g/l ammonium sulfate solution
-0.3
-0.2
-0.1
0
0.1
0.2
0.3
0.4
0.5
0 500 1000 1500 2000 2500 3000 3500 4000
Op
en C
ircu
it P
ote
nti
al (
V v
s. A
g/A
gCl
Elec
tro
de)
Time (s)
2 g/l NaCl
3 g/l NaCl
4 g/l NaCl
-0.2
-0.15
-0.1
-0.05
0
0.05
0.1
0.15
0 500 1000 1500 2000 2500 3000 3500 4000
Op
en C
ircu
it P
ote
nti
al (
V v
s. A
g/A
gCl
Elec
tro
de)
Time (s)
6 g/l NaCl
7 g/l NaCl
8 g/l NaCl

39
Figure 65.3: Open Circuit Potential of 316L SS in 400 g/l ammonium sulfate solution
Figures 5.4 – 5.6 illustrate the potentiodynamic polarization results on 316L SS while
increasing the chloride concentration. Figure 5.4 shows that in 10 wt.% of ammonium
sulfate solution, increasing the chloride from 2 g/l to 4 g/l causes a noticeable shift to
higher corrosion potentials and corrosion current densities. In Figure 5.5, with the same
ammonium sulfate concentration, further increasing the chloride content from 6 g/l to 8 g/l
increased the corrosion current densities on the 316L SS electrode. Moreover, at 400 g/l
of ammonium sulfate solution, Figure 5.6, two tests were conducted to see the effect of a
chloride-free solution and chloridized solution with 1 g/l NaCl. The results illustrated an
increase in the corrosion potentials and corrosion current densities while adding the
chloride to the solution. These tests showed that with the addition of chloride in the
solution, the corrosion current density increases. Specifically, the corrosion current
-0.1
-0.05
0
0.05
0.1
0.15
0.2
0.25
0 1000 2000 3000 4000
Op
en C
ircu
it P
ote
nti
al (
V v
s. A
g/A
gCl
Elec
tro
de)
Time (s)
No Chloride Added
1 g/l NaCl

40
density for the 316L SS electrode in chloridized solution with 1 g/l NaCl was 1.74 µA/cm2.
Therefore, the corrosion rate was 0.8 mpy i.e. 0.02 mm/year. This very low corrosion rate
agrees with the previously conducted studies highlighted in the literature review chapter.
Figure 75.4: The effect of increasing chloride Content from 2 - 4 g/l in 100 g/l ammonium sulfate on the 316L working electrode
-0.6
-0.4
-0.2
0
0.2
0.4
0.6
0.8
1
1.2
1.4
1.00E-09 1.00E-08 1.00E-07 1.00E-06 1.00E-05 1.00E-04
Po
ten
tial
(V
vs.
Silv
er C
hlo
rid
e El
ectr
od
e)
Current Density (A/cm2)
100 + 2
100 + 3
100 + 4

41
Figure 85.5: The effect of increasing chloride content from 6 - 8 g/l in 100 g/l ammonium sulfate on the 316L working electrode
Figure 95.6: The effect of presence of the chloride ions on the corrosion behaviour of the 316L working electrode in 400 g/l ammonium sulfate solution
-0.4
-0.2
0
0.2
0.4
0.6
0.8
1
1.2
1.4
1.00E-09 1.00E-08 1.00E-07 1.00E-06 1.00E-05 1.00E-04 1.00E-03
Po
ten
tial
(V
vs.
Ag/
AgC
l Ele
ctro
de)
Current Density (A/cm2)
100 + 6
100 + 7
100 + 8
-0.5
0
0.5
1
1.5
1.00E-10 1.00E-09 1.00E-08 1.00E-07 1.00E-06 1.00E-05 1.00E-04 1.00E-03 1.00E-02
Po
ten
tial
(V
vs.
Ag/
AgC
l Ele
ctro
de)
Current Density (A/cm2)
0 g/l of Cl
1 g/l of Cl

42
5.5.2 Effect of Increasing Ammonium Sulfate Concentration
OCP experiments to measure the effect of the increase of ammonium sulfate
concentration rather than the chloride concentration on 316L SS were also conducted.
Figure 5.7 shows the open circuit potential of 316L SS in chloridised ammonium sulfate
solution at 1 g/l of NaCl. When the ammonium sulfate concentration increased from 10%
to 40%, the open circuit potential was significantly increased. The potentiodynamic
polarization tests, Figure 5.8, showed that when increasing the ammonium sulfate
concentration from 100 g/l to 400 g/l in the test solution, the corrosion potentials and the
corrosion current densities increased.
Figure 105.7: Open Circuit Potential of 316L SS in chloridised ammonium sulfate solution at 1 g/l of NaCl
-0.25
-0.2
-0.15
-0.1
-0.05
0
0.05
0.1
0.15
0 500 1000 1500 2000 2500 3000 3500 4000
Op
en C
ircu
it P
ote
nti
al (
V v
s. A
g/A
gCl
Elec
tro
de)
Time (s)
400 g/l AS
100 g/l AS

43
Figure 115.8: The effect of increasing the ammonium sulfate concentration from 100 to 400 g/l on the 316L working electrode
5.5.3 Effect of Increasing the Scan Rate of the Anodic Polarization
Test
At exactly the same concentrations and testing parameters, two anodic polarization tests
on 316L SS electrode were carried out while only varying the scan rate from 0.167 mV/s
to 1 mV/s. The ammonium sulfate concentration was 100 g/l with 5 g/l of NaCl. Figure 5.9
illustrates the effect of increasing the scan rate six times. The test results shows that
increasing the scan rate altered the measured results as the passive film had more time
to form at the slower scan rate. In an industrial setting, the passive film would have ample
time to form so the corrosion rate shown here (0.8 mpy) may actually be an overestimate.
-0.6
-0.4
-0.2
0
0.2
0.4
0.6
0.8
1
1.2
1.4
1.6
1.00E-10 1.00E-09 1.00E-08 1.00E-07 1.00E-06 1.00E-05 1.00E-04 1.00E-03
Po
ten
tial
(V
vs.
Ag/
AgC
l Ele
ctro
de)
Current Density (A/cm2)
100 g/l AS with 1 g/l NaCl400 g/l AS with 1 g/l NaCl

44
Figure 125.9: Anodic Polarization Curves show the effect of increasing the scan rate in the experiment on the measured potentials and current densities.
-0.4
-0.2
0
0.2
0.4
0.6
0.8
1
1.2
1.4
1.00E-09 1.00E-08 1.00E-07 1.00E-06 1.00E-05 1.00E-04 1.00E-03
Po
ten
tial
(V
vs.
Ag/
AgC
l Ele
ctro
de)
Current Density (A/cm2)
Slow Scan Rate
High Scan Rate

45
6 TESTING PROCEDURE FOR THE FAILED 316L SS PIPES
Conducting a proper investigation of the failed equipment usually results in significant
information about the critical factors that led to the failure. This wealth of knowledge aids
in avoiding the recurrence of the failure. Hence, in order to properly organize a thorough
failure analysis, it is essential to have a basic understanding of the various procedural
steps which are utilized during the metallurgical laboratory investigation. Therefore, in this
chapter, an in-depth explanation is presented for the conducted tests on the failed pipes
through metallographic, chemical and mechanical testing analyses.
6.1 Visual Examination
One of the first and foremost steps in any metallurgical failure investigation is the visual
examination. Visual examination can help to identify, in broader terms, the
fractured/damaged surface characteristics and any visible surface defects. During this
step, no destructive test is used. All of the following tests were conducted at the
sponsoring Company analytical laboratories.
Although dye penetrant test (PT) is considered a non-destructive testing (NDT) method
and is usually conducted during the visual examination step of the failed sample, such a
test was not conducted during this examination due to two reasons. First, PT is normally
used to clearly show all the locations of pits and surface cracks, which is not necessary
for this failure at hand since the failure and pits are visible by the unaided eye. The second
reason is that the PT may contaminate the surface if an EDS analysis, as part of the

46
scanning electron microscope, is carried out in an as-received condition, which is the
case in our investigation.
Therefore, prior to destructive sampling, many photographic records of key observations
were taken. Such records are referred to as macrophotographs, which usually utilize
magnifications between 1x and 50x. These photographs were taken using digital camera
and stereomicroscope, i.e. a low-power binocular optical microscope, with the proper light
sources.
6.2 Chemical Testing
6.2.1 Chemical Analysis of the Process Sample
Three samples from the ammonium sulfate process were obtained from the same unit of
the failed pipes. The samples were analyzed to determine the pH and the chloride
contents. The chloride concentration in the samples was analyzed using Ion
Chromatography, Dionex model DX-500. The analysis was conducted at the facilities of
the sponsoring Company.
6.2.2 X-Ray Fluorescence and Carbon/Sulfur Analyses
One of the essential starting points in the metallurgical investigation of the failures is the
identification and confirmation of the chemical composition of the failed sample. As in the
case of the failure at hand, the background information showed that the material of

47
construction was in fact 316L stainless steel. Therefore, X-Ray Fluorescence (XRF) and
Carbon/Sulfur analyses were conducted. All of the following tests were conducted at the
sponsoring Company analytical laboratories.
XRF is an analytical technique which is used for solid samples to illustrate the
concentrations of the elements. XRF spectrometers operate by irradiating the solid
sample with an X-ray beam of a high energy in order to excite the characteristic X-rays
from the elements that are present in the solid sample. In this investigation, the Bruker
S4 Pioneer XRF spectrometer was utilized.
For Carbon/Sulfur analysis, the LECO CS-600 Automated Analyzer was utilized. This
analyzer is designed for the prompt determination of carbon and sulfur in various
materials such as ferrous and non-ferrous alloys, and some non-metallic materials.
The analyzer operation concept is straightforward. Since the majority of metals and their
alloys burns in oxygen when heated to significantly elevated temperatures, the carbon
oxidizes to carbon dioxide (CO2) and sulfur converts to sulfur dioxide (SO2). The installed
Infrared detectors then measure the CO2 and SO2. Moreover, in order to increase the
speed and the accuracy, high-frequency induction heated furnaces are used.

48
6.3 Mechanical Testing
In order to find if the failed pipe meets the stipulated mechanical properties as per ASTM
A312 “Standard Specification for Seamless, Welded, and Heavily Cold Worked Austenitic
Stainless Steel Pipes”, it is necessary to conduct the required mechanical testing.
Therefore, this section covers the most commonly used mechanical tests: tensile test and
micro-hardness test. All of the following tests were conducted at the sponsoring Company
analytical laboratories.
6.3.1 Tensile Tests
Tensile testing is utilized to supplement microscopy and confirm its results in the
investigation of the components’ failures. The tensile test indicates the level of the ductility
and the strength.
Two pipe samples were cut and prepared to determine the tensile strength and
elongation. The specimens’ dimensions were as stipulated in the Figure 6.1 and Table
6.1 below.

49
Figure 136.1: The Tensile Test Sample. Note the actual dimensions in Table 6.1.
Table 76.1: The Dimensions of the Specimens Used in the Tensile Tests
Parameters Measured Values
1 The Width of Reduced Section 12.5 mm
2 Thickness 3.0 mm
3 Gauge Length 50.0 mm
4 The Width of Grip Section 20.0 mm
5 Grip Section 50.0 mm
6 Overall Length 200.0 mm
The tensile tests were conducted at two rates. The first rate purpose was to identify the
yield properties where the strain rate of 0.015 mm/mm/min up to 2.0% of tensile strain.
The second rate was used to identify the tensile properties where the strain rate of 0.402
mm/mm/min up until the complete and final fracture.
The tensile tests were conducted using a 50kN Instron Universal Tester at room
temperature of 21.7°C. The strain was calculated by 50 mm extensometer up to 2% strain

50
followed by Linear Variable Differential Transformer (LVDT) of the test machine. In the
next chapter, Results and Discussion, the test results are presented and discussed.
6.3.2 Hardness Tests
Hardness testing is one of the fastest, most effective and inexpensive tests used in failure
investigations. Hardness is the measure of the resistance of a material to the indentation.
Although there are several types of hardness test, Vickers Microhardness test was utilized
in this investigation. The main reason behind selecting this type is due to its very narrow
indenter which determines the localized hardness measurements and differentiates
between local hard spots and the surrounding area.
The purpose of a microhardness test is to determine the hardness of the material in very
localized areas. As in this current investigation, the microhardness tests were conducted
across the pipe cross-sectional area which includes: weld area, Heat Affected Zone (HAZ)
and base metal.
The principles governing the hardness testing is basically the same whether Rockwell
Testing or Vickers Microhardness was used. An indenter is pressed into the material by
known weights on a level system. The depth of penetration and the covered diamond-
shaped area are then measured and the hardness value of the material can be calculated.

51
The Vickers indentor is a standard square-based diamond pyramid with 136o angle α
between opposite faces and 146o angle between opposite edge of the pyramid. The type
of the utilized machine is Buehler MMT 7 Microhardness Tester.
The tests were conducted at room temperature (18.4°C) and the load was 300 gf. The
tests were conducted according to the following methods:
1. Standard Guide for Preparation of Metallographic Specimens – ASTM E3
2. Standard Test Method for Microindentation Hardness of Materials – ASTM E384
6.4 Metallurgical Testing
6.4.1 Samples Preparation for Metallography Tests
As stated previously, the first step in the metallographic analysis is to select a sample that
is representative of the materials to be tested. Then, the second step is to prepare the
metallographic specimens. Generally, five major operations are involved in preparing the
metallographic specimens: sectioning, mounting, grinding, polishing, etching. It is vital to
carefully implement such operations in order to ensure that the tested specimens were
not altered due to improper preparation practices. Incorrect preparation techniques may
negatively affect the microstructure and could result in inaccurate findings which points
to an incorrect cause of failure.

52
After sectioning and grinding, polishing was conducted. The goal of polishing is to remove
the scratches and the heavily deformed layer that was caused by grinding. Polishing is
the last step for metallographic specimens’ preparation prior to the microscopic
examination. After polishing, the specimen is cleaned by solvents for two purposes:
examining the polished surface using optical microscope followed by SEM/EDS and
etching the polished surface in order to examine under the optical microscope in as-
etched condition.
Therefore, in order to analyze the failed samples at hand, two samples were cut and
mounted by compression molding, followed by grit silicon carbide grinding from 120 µm
to 600 µm. Successively, the samples surfaces’ were polished using diamond abrasive
(6 µm).
6.4.2 Stereoscope and Optical Microscope Analyses
Optical metallography is the examination of materials using visible light to illustrate
magnified images of the micro and macrostructures. Microscopy is basically the
microstructural examination at magnifications of approximately 50x or higher. However,
macroscopy, i.e. macro-structural examination or simply stereoscope, involves
magnifications of 50x or lower. Microscopy and Macroscopy can both be utilized for as
received, as polished or as etched specimen evaluation.

53
6.4.3 Scanning Electron Microscopy and Energy-Dispersive X-Ray
Spectroscopy Analyses
SEM/EDS was used for the characterization of the metal structures and chemical
compositions, as well as in analyzing the fracture surfaces. An Oxford INCA 250 EDS
installed on a Quanta 200 SEM system was utilized for the analysis of the failure.
Magnifications from 25x to 2000x were employed in the analysis of multiple specimens.
Both types of specimens, i.e. the mounted and polished specimens and the as-received
samples were analyzed. The as-received samples without polishing or even cleaning
were studied intensively for two purposes: to illustrate the damaged surface morphology
and to analyze the chemical composition of any deposits or matters that may be
discovered during the process. Utilizing the capabilities of SEM, the surface morphology
was revealed in order to identify defects’ characteristics due to the high resolution and
depth of field of the SEM.
It is important to note that the x-ray peak energies for different elements might overlap.
Such an issue might lead to incorrect identification of elements, especially for 316L SS.
An example of peak overlap is between molybdenum and sulfur. Since 316L SS contain
2-3% of Mo, the EDS quantitative analysis might show sulfur around this weight
percentage. Missing this critical understanding of the peak overlaps might derail the
investigation to totally different direction by assuming high amount of sulfur present in the
material, for example. Another common peak overlaps are for Mo and Nb, Ti and V, Cr
and Mn, and Cr and oxygen. See Annex B of ISO 22309 “Microbeam Analysis -

54
Quantitative Analysis using Energy-Dispersive Spectrometry (EDS) for Elements with an
Atomic Number of 11 (Na) or Above”. (ISO 22309, 2011)

55
7 RESULTS AND DISCUSSION FOR THE FAILED 316L SS PIPES:
FAILURE ANALYSIS
In this chapter, all data and information derived from the failure analysis and laboratory
tests are presented. Moreover, a detailed analysis and careful interpretation of the test
results is described.
7.1 Visual Examination
Two samples from the 3-inch diameter failed pipe (spools) where received for the
metallurgical examination. A general overview of the received spools is shown in Figures
7.1 & 7.2. Meshed-like marking was observed covering part of the external surface of the
spools. The pinhole leak location is almost at the center of the meshed-like marking. After
inquiring from the plant inspectors, they highlighted that such markings are due to quick
fixes, i.e. using metallic clamps with rubber pads, in order to stop the leak while the line
was in operation to avoid interrupting the plant production by isolating the damaged pipe
which requires an unplanned shutdown.

56
Figure 147.1: Photograph of the failed spool in as received condition. Note that the
pinhole located at the weldment area.
Figure 157.2: Photograph of the other failed spool in as-received condition. Note that
the pinhole here is located at the parent metal.
Pinhole Location
Tensile Test Sample
Tensile Test Sample

57
Although the pinholes located at or near the 6 o’clock position in both spools, the vicinity
of the pinholes are not consistent. The pinhole in one of the spools is located near the
weldment while the other is in the parent metal, Figures 7.3 & 7.4. Such observation would
indicate that such failures are not only due to welding defects. On the other hand, this
observation may also indicate that the causes of the pinholes might not be the same.

58
Figure 167.3: A Close-up view of the failed spool showing the pinhole at the fusion line.
Figure 177.4: A Close-up view of the failed spool showing the pinhole at the parent metal.
2.8 cm pipe section
was cut - see Fig. 12
2.6 cm pipe
section was
cut - see
Fig. 10

59
Figure 7.5 shows the internal surface of the failed spool. The close-up view illustrates
discoloration and staining on the surface. The white deposits are from the ammonium
sulfate solution.
Figure 187.5: Close-up view of the internal surface of the failed spool.
Furthermore, a closer view of the lower portion of the spool indicated an interesting
finding, Figures 7.6 & 7.7. The spool was cut near the pinhole location and a subsurface
cavity, sometimes called tunneling, was observed. The tunneling indication coupled with
the extended idle period of 3 years where water was stagnant suggest that the probable

60
cause of failure is Microbiological Influenced Corrosion “MIC” as documented in many
published reports.
Figure 197.6: Photograph shows the pinhole and the subsurface tunneling after sectioning the spool circumferentially. Note the close-up views of the pinhole mouth at
the ID.

61
Figure 207.7: A Close-up view of the sectioned spool near the pinhole.
Moreover, the visual examination of the internal surface showed the morphology of the
weld, see Figures 7.8 & 7.9. A closer view of the weld illustrated weld defects like a lack
of penetration and root concavity. This is an indication of poor weld quality which could
be attributed to improper welding procedure and/or poor workmanship.

62
Figure 217.8: Photograph shows the internal surface of the failed spool.
Figure 227.9: Close-up view shows the multiple pits initiated at the incomplete root penetration area of the weld as indicated in Figure 7.8.
Incomplete Root Penetration (Weld Defect)
Complete Root Penetration (Proper Weld)
Pits
Pits at the weld - see Fig. 7.9

63
Another observation from the visual examination is related to the origin of the pinholes. It
is essential to determine whether the pinholes initiated from the internal surface or the
external surface. A closer view of both surfaces highlighted that there are multiple
separated pinholes found on the inner surface but only one from the outer side. Such
finding indicates that the pitting was initiated from the inner surface.
Finally, the photographs clearly illustrated multiple pits located few millimeters away from
the weld, in the Heat Affected Zone (HAZ). Also, other pits located at the weld in the area
that was affected by lack of penetration. Davis (2006) explained that MIC usually occurs
at or near the weld and the heat affected zone. This investigation revealed that most of
the pinhole leaks were located at the weld and HAZ. Kobrin, in his article
“Microbiologically Influenced Corrosion of Stainless Steels by Water Used for Cooling and
The Hydrostatic Testing” identified that for weld defects like lack of penetration and root
concavity, such defects are normally the preferred sites for attachment and growth of
microbial colonies. This was clearly illustrated as the pits located in such areas in Figure
23. (Davis, 2006; Kobrin, 1997)

64
7.2 Chemical Testing
7.2.1 Chemical Analysis of the Process Samples
Three samples from the ammonium sulfate process were obtained from the same unit of
the failed pipes. The samples were analyzed to determine the pH and the chloride
contents. Table 7.1 below highlights the findings.
Table 87.1: pH and chloride concentrations in 3 process samples
Parameter Unit Sample 1 Sample 2 Sample 3
pH --- 3.0 3.80 3.2
Chloride ppm 0.06 0.03 0.15
These results illustrate that chloride is in a very low amount the in the ammonium sulfate
process. When compared with the electrochemical tests that I have conducted in UBC
corrosion lab, the conducted tests were at 10,000 ppm of chloride. Moreover, even at
10,000 ppm of Cl, the 316L stainless steel is adequate for the service. Therefore, the
ammonium sulfate process with low chloride content did not cause the corrosion failure
at hand.
7.2.2 X-Ray Fluorescence and Carbon/Sulfur Analyses
The provided failed samples were analyzed using XRF and C/S analyses. The results
confirmed that the material of the pipe is SS 316L, see Table 7.2 below. Note that the
carbon and sulfur were analyzed using LECO CS-600 Automated Analyzer.

65
Table 97.2: XRF and carbon-sulfur analysis for the two failed pipes
Sample # 1 Sample # 2 Nominal Composition wt. %
Elements Conc. % Conc. % Max. unless otherwise indicated
C* 0.019 0.018 0.035
Al 0.033 0.045
Si 0.528 0.474 1.00
P 0.016 0.019 0.045
S* 0.016 0.016 0.030
Ti 0.006 0.018
V 0.059 0.058
Cr 17.236 17.313 16.0 – 18.0
Mn 1.381 1.555 2.00
Fe Balance Balance
Ni 10.294 10.200 10.0 – 14.0
Cu 0.111 0.112
Nb 0.008 0.008
Mo 2.074 2.110 2.00 – 3.00
7.3 Mechanical Testing
7.3.1 Tensile Tests
As stipulated in the previous chapter regarding the steps to properly conduct the tensile
testing, Figure 7.10 and Table 7.3 illustrate the test results. The two samples both show
that the tensile strength, yield strength, and elongation are all exceeding the minimum
requirements. Thus, the material of the examined spool is in compliance with the
mechanical properties stipulated in ASTM A312 Type 316L. Therefore, it is safe to
assume that the mechanical properties of the pipe are not compromised and that the
material in itself did not contribute to the failure at hand.

66
Figure 237.10: Tensile test results show the tensile and yield strength of the two samples.
Table 107.3: Tensile tests results illustrate that both samples meet the mechanical properties requirements for the type 316L SS.
Grade UNS
Designation
Tensile strength, min
MPa
Yield strength, min
MPa
Elongation in 2 in. or 50 mm (or 4D), min,
%
TP316L S31603 485 170 35
Sample 1 - 645 405 54.9
Sample 2 - 640 407 53.4
7.3.2 Hardness Tests
Microhardness test was conducted and the results are stated in Table 7.4 and Figure
7.11. The results of the microhardness tests showed values ranging between 169 and
187 HV. These values are not exceeding the maximum requirement of the hardness

67
values of austenitic stainless steel type 316L as stipulated in ASM International Handbook
“Minimum Room-Temperature Mechanical Properties of 304L and 316L Austenitic
Stainless Steels” (ASM International Handbook, 1990). The maximum hardness values
of 316L SS is 95 HRB, which is equivalent to 213 HV. As stated previously, all the
hardness values are below the maximum hardness value of the pipes.
Table 117.4: Microhardness values for the failed sample including the weld area, HAZ and parent metal.
Readings, µm
Indentation No. D1 D2 Hardness (HV)
8 @ 1 mm Interval 54.2 55.1 186.2
7 54.2 55.5 184.9
6 53.8 55.1 187.6
5 54.1 55.5 185.2
4 57 57.6 169.4
3 57.2 56.5 172.1
2 56.2 55.7 177.7
1 56.7 57 172.1
0 (Center of the Weld) 57.1 57 170.9
1 55.7 55.6 179.6
2 (Pinhole Area) -- -- --
3 56 55.5 178.9
4 56.3 56.6 174.5
5 55.3 56.8 177
6 55.5 55.1 181.9
7 55.8 55.2 180.6

68
Figure 247.11: Photomacrograph showing the exact location of the indentations for the microhardness testing.
7.4 Metallurgical Testing
7.4.1 Stereoscope and Optical Microscope Analyses
Two samples were cut from the failed spools and prepared through grinding, mounting,
and polishing to be examined using the optical microscope. Figures 7.12 -7.14 showed a
large subsurface cavity with only a small opening to the internal surface. This finding
indicates that the pinhole was originally initiated from the internal surface. Also, it supports
the evidence that this failure is due to MIC. As it was stated in the literature review chapter,
the pit morphology caused by MIC tends to be a narrow opening with a wide subsurface
cavity and tunneling at the pits sites. Although this is not a definite way to identify MIC as
pits with similar morphology could be formed by other damage mechanisms as well, the
100
110
120
130
140
150
160
170
180
190
200
-9 -7 -5 -3 -1 1 3 5 7 9
Har
dn
ess
(HV
)
Location in the Weldment (mm)
Hardness Readings Across the Weldment

69
metallurgical findings along with the piping commissioning history suggest that the
damage mechanism here is Microbiologically Influenced Corrosion (MIC). Further tests
such as biological and chemical analyses could be conducted to strengthen this
conclusion. However, the objective here is to focus on the metallurgical examination and
pinpoint to MIC failures based on the conducted tests in this regard.
Figure 257.12: Photograph shows a prepared and hot mounted sample of the localized damage at the weld area.
OD
ID

70
Figure 267.13: Photomicrograph shows the localized attack in as polished-condition.
Figure 277.14: Photomicrograph shows the localized attack in as etched-condition.

71
Another sample which was prepared for metallography was selected away from the
location of the pits to examine the microstructure of the base material. Figures 7.15 &
7.16 show the photomicrographs in as-polished and as-etched conditions, respectively.
The photomicrographs indicated normal microstructure without any abnormal inclusions.
Such findings indicate that the base metal is in sound condition and did not contribute to
this failure.
Figure 287.15: Photomicrograph of the 316L SS spool sample away from the pinhole in as-polished condition.

72
Figure 297.16: Photomicrograph of the 316L SS sample away from the pinhole in as-etched condition.
7.4.2 Scanning Electron Microscopy and Energy-Dispersive X-Ray
Spectroscopy Analyses
A Scanning Electron Microscope equipped with EDS elemental analyzer was utilized in
order to identify the morphology of the pitting in as received condition as well as the cross-
sectional profile through the pit.
The sample in Figure 7.8 with the pinhole located in the weldment was further investigated
using SEM. No cleaning was performed prior to placing the sample inside the SEM
chamber in order to avoid losing any vital evidence that helps further in the investigation.

73
Thus, Figure 7.17 shows the cross-section photograph of the subsurface cavity and
tunneling at 20x magnification. At higher magnifications, 70x, 100x, and 250x, as in
Figures 7.18, 7.19, and 7.20, respectively, the SEM photographs show an interesting
damage called preferential attack mechanism in the weld metal precipitates. As
highlighted by Jack (2002), the morphology of the MIC attack in stainless steel weldments
is preferential phase attack where he described it as “interdendritic attack”, see Figure
7.21. Such description fits the examined photomicrograph in my analysis of the failure
under SEM at the fusion line. This type of failure is usually related to preferential attacks
on either ferrite or austenite. Figures 7.18 - 7.20 illustrate the interdendritic attack at the
fusion line of the stainless steel weldment which show similar to Jack analyzed failure.
Figure 307.17: SEM image at low magnification showing the cross-section photograph of the subsurface cavity and tunneling. 20x Magnification.

74
Figure 317.18: SEM image showing the cross-section photograph of the subsurface cavity. Note the preferential attack mechanism. 70x Magnification
Figure 327.19: SEM image showing the cross-section photograph of the subsurface cavity. Note the preferential attack mechanism. 100x Magnification

75
Figure 337.20: SEM photomicrographs showing the cross-section of the subsurface
cavity. Note the preferential attack mechanism. 250x Magnification
A
B

76
Figure 347.21 has been removed due to copyright restrictions. It was a picture that shows the morphology of MIC attack on the fusion line of SS weldment. Jack compared between the dendritic attack to the nondendrite area. Original source: Thomas R. Jack,
Biological Corrosion Failures, ASM Handbook, Volume 11, 2002.
This preferential attack was also found during the analysis of the internal surface of the
other failed sample in as-received condition. Figure 7.22, illustrates a photograph of a pit
that is located at the fusion line. At higher magnification, Figures 7.23 and 7.24 show
again the preferential attack in the direction of the rolling.

77
Figure 357.22: SEM image shows the pinhole in as received condition. Magnification 25x.
Figure 367.23: A Magnified SEM image of the same location of Figure 7.22. Note the dimension of the pits openings. Magnification 100x.
Fusion Line
Weld Area HAZ

78
Figure 377.24: SEM image shows the same previous pinhole at higher magnification (200x). Note the clear preferential attack mechanism at the edge of the pit.
Furthermore, the second sample was analyzed using EDS to reveal the elemental
analysis at the critical locations. Figure 7.25 shows a high magnification of the same
location as in Figure 7.20-A. As shown in Figure 7.25-B, two spot analyses, S1 and S2,
were conducted at a distinctive feature. The EDS results are demonstrated in Figures
7.27 & 7.28 and Tables 7.5 & 7.6. One unanticipated finding was that the analysis of spot
S1 revealed a high amount of carbon around 60%, while S2 spot shows a lower amount
of Carbon. It is encouraging to compare this Figure with that found by Dexter who
highlighted that this is the shape of bacteria, Figure 7.26 (Dexter, 2003). Therefore, the
high carbon content coupled with the distinct shape suggest the presence of bacteria that
could cause this failure. While such a shape could simply be atmospheric carbon-
containing dust, the shape and location provide some evidence that this is bacterial
remnants.

79
Figure 387.25: SEM images of the cross-section of the pinhole in as-received condition. Note the irregular shape suggesting bacteria presence. Mag. 1200x and 2000x.
A
B
S1
S2

80
Figure 397.26 has been removed due to copyright restrictions. It was a photomicrograph of a form of bacterial cells in a colony at a magnification of 2700x.
Original source: Stephen C. Dexter, Microbiologically Influenced Corrosion, ASM Handbook, Volume 13A, ASM International, 2003.
Figure 407.27: EDS analysis for the S1 spot in Figure 7.25. Note the high Carbon peak.
Table 127.5: Qualitative EDS analysis for the S1 spot. Note the high Carbon content suggesting the presence of bacteria.
Element Wt% At%
C 59.92 74.10
O 21.50 19.96
Si 00.36 00.19
Mo 01.42 00.22
Ca 09.57 03.55
Cr 03.10 00.89
Fe 04.13 01.10
Matrix Correction ZAF

81
Figure 417.28: EDS analysis for the S2 spot in Figure 7.25. Notice the high Iron peak and the low Carbon peak.
Table 137.6: Qualitative EDS analysis for the S2 spot.
Element Wt% At%
C 08.75 24.27
O 14.57 30.35
Si 00.58 00.69
Mo 06.26 02.18
Cr 20.94 13.42
Fe 46.12 27.52
Ni 02.78 01.58
Matrix Correction ZAF

82
Figure 7.30 and Table 7.7 illustrate the EDS analysis of a deposit on the internal surface
of the pipe as shown in Figure 7.29. The elemental analysis showed high sulfur content
in the deposit. The presence of sulfur-containing deposit suggests that the type of bacteria
involved in the Microbiologically Influenced Corrosion (MIC) is Sulfate Reducing Bacteria
(SRB). As discussed in the literature chapter, MIC failures in the stainless steel pipes
were commonly attributed to SRB.
Figure 427.29: SEM Image shows deposits on the internal surface of the pipe.

83
Figure 437.30: EDS analysis of the deposits as shown in Figure 7.29.
Table 147.7: Qualitative EDS analysis for deposit Area.
Element Wt% At%
N 21.23 29.15
O 41.91 50.39
Al 00.72 00.51
Si 00.61 00.42
S 28.51 17.11
Fe 07.02 02.42
Matrix Correction ZAF
The conducted metallurgical analysis tests showed that the failure was caused by
Microbiologically Influenced Corrosion (MIC) based on the pit morphology, the
preferential attack mechanism in the weld and the presence of bacteria/bacteria product.
Yet, it could be argued that localized attack in this form of pitting could also result from

84
chloride induced pitting corrosion. Such argument can be contested by analyzing the
samples to look for any chloride concentration present in the as-received samples. The
EDS analysis illustrated in Figures 41 and 42 did not show any indication of chloride
presences. However, these were spot elemental analyses at high magnification at around
2000x. So, in order to clearly refute this argument, multiple EDS area analyses were
conducted for the location illustrated in Figure 7.20, which is at a lower magnification i.e.
around 250x. As shown in Figures 7.31 & 7.32 and Tables 7.8 & 7.9, no chloride was
detected in the elemental analysis by EDS. Therefore, this finding suggests that chloride
did not play a role in the failure at hand. In comparison, for failures caused by chloride
ions, as reported by Subai (2014), they detected chloride using EDS at the bottom surface
of the pipe at lower magnification in different locations at 4.16 %wt., 2.19 %wt. and 0.14
%wt. (Subai, 2014). Also, they cross-sectioned the pit and conducted EDS analysis in as-
polished condition and found 4.76%wt. of chloride at the bottom surface of the pit (Subai,
2014). Based on Subai study, if the failure at hand was due to chloride induced pitting
corrosion, then the conducted EDS analysis should detect it.

85
Figure 447.31: EDS analysis (Above) for the pinhole in as-received condition (Below).

86
Table 157.8: Qualitative EDS analysis for the area specified in Figure 7.31.
Element Wt% At%
C 05.92 18.12
O 11.11 25.54
Si 01.00 01.31
Mo 03.77 01.45
S 01.65 01.90
Cr 27.94 19.76
Fe 45.62 30.05
Ni 02.99 01.87
Matrix Correction ZAF
Table 167.9: Qualitative EDS analysis for the area specified in the following Figure 7.32.
Element Wt% At%
C 11.94 32.97
O 09.09 18.84
Si 01.51 01.78
Mo 03.14 01.09
S 00.53 00.55
Cr 23.47 14.97
Fe 47.30 28.09
Ni 03.03 01.71
Matrix Correction ZAF

87
Figure 457.32: EDS analysis (Above) for the pinhole in another location in as-received condition (Below).

88
7.5 Effect of Welding on MIC Initiation
As pointed out in the background chapter of this thesis, the conducted radiographic
testing (RT) showed rounded and elongated indications which were observed in the weld
joints for the full circumference. This non-destructive testing results suggest improper
welding performed for the pipes joints. These indications could be caused by inadequate
Welding Procedure Specification (WPS) or poor workmanship which is more likely. These
defects adversely affect the pipe joint integrity since the material will be susceptible to
MIC at the weldment.
As previously noted in the literature review, planktonic bacteria are presumably attracted
to the weld area, fusion line or the heat affected zone (HAZ). Therefore, improper welding
practices increase the chances of MIC initiation either by introducing heat oxide tent or
by root concavity or lack of weld filler penetration which result in welding defect and a
preferred zone for bacteria to attach to the surface and form the biofilm layer that later
causes the MIC.
As highlighted earlier, it is critical to shed some light on why microorganisms prefer to
attach themselves and colonize in the weldment area. One explanation for this issue is
that due to welding, the surface roughness and even the chemical composition are
different in a way that attracts the bacteria, or microorganisms in general, to colonize the
pipe internal surface that is in contact with water. Another explanation suggests that even
if the weld area and base metal have the same chemical composition and there is no

89
welding defect, bacteria tend to also attach in the weldment area because of residual
stresses introduced by the welding. (Cramer, 2003)
7.6 Effect of Hydrostatic testing procedure on MIC Initiation
As described earlier in the background chapter, there are improper practices occurred
during the construction which could adversely affect the integrity of the piping. This
section discussed the potential issues of the water quality that might be used during the
construction phase for the hydrotesting.
It is important to know which type of water was used and how it was treated. The current
investigation was limited in this regard. The plant inspectors claimed that the used water
was in compliance with their plant standards. Such standards stipulated the use of
demineralized water, boiler condensate water, or potable water that was treated
effectively to limit the chloride and oxygen concentrations and the total bacteria count.
However, they failed to provide any documentation supporting their claim. Therefore, with
the failure at hand coupled with the lack of proof, the used water for hydrotest was at best
untreated or poorly treated potable water. A possible explanation is that during the
construction phase, the project inspectors may delegate the responsibility of the
hydrotesting to the contractor with little or even no quality monitoring or supervision from
their side. Such practices are not unusual in large project construction with tight
deadlines.

90
Therefore, it is likely that the water had a high bacterial count due to poor water treatment.
With this in mind, and in order to reduce the possibility of MIC initiation, the water should
have a bacteria count of less than 1000 (Javeherdashti, 2013). This can be achieved by
using biocide treatment to effectively reduce the planktonic and therefore sessile bacteria
in the system.
7.7 Effect of the Idle period between construction and commissioning
on MIC propagation
This section discusses one of the main contributing factors in this failure, i.e. the extended
contact time of the hydrotest water inside the piping. It is basically the idle time between
conducting the hydrotesting as a final phase of the construction and the time of
commissioning the new plant.
As discussed in the background chapter, the idle time lasts for 3 years. This is alarming
because constructing the piping, hydrotesting it and then leaving it in closed condition
without proper lay-up makes the pipeline prone to different undesirable outcomes.
In the literature review chapter, many references were cited about the time limit upon
which the MIC start to initiate and/or propagate. The cited intervals are as follows: 3 to 5
days, 14 days and 1 months. If the idle time planned to be higher than such interval, then
dry or even wet lay-up should be conducted. Nevertheless, the failure at hand crossed all
these intervals and reached more than 1000 days. Yet, they have not protected their

91
assets by conducting preservation method like purging with an inert gas in order to
prevent the piping from corrosion.
Simply put, the more time the bacteria are living in their ideal environment, the more
bacteria growth is expected, assuming the availability of the nutrient in the environment.
In general, when the used water for hydrotesting is less clean, such as having high total
dissolved solids (TDS), the more nutrient is available in the water for bacteria to consume
and grow.
It is worth mentioning that during the investigation of the failure at hand, other piping in
the same system which was constructed a year earlier were also experiencing pinholes.
Although these new failures were not investigated thoroughly, it is safe to assume that
the longer the idle period where water is in contact with the steel surface, the more
pinholes and deeper pits will be developed. This is based on that the time from
commissioning the pipes to the observed leaking pinhole is different. For the pipes with
3-year idle period, the first leak was noticed after only 4 months in service. However, for
the 1-year idle period, the first leak was noticed after 8 months. The other failures with
the one-year idle period were not included in this investigation.

92
8 CONCLUSIONS AND RECOMMENDATIONS
8.1 Summary of the Findings from the Conducted Laboratory Tests
In this investigation, one of the main objectives was to identify the responsible damage
mechanism that consequently caused this failure and address, in details, all the
contributed factors that played significant roles in this failure. The investigation of the
pinhole defects in the 316L austenitic stainless steel pipes in ammonium sulfate solutions
suggested that the failure was caused by Microbiologically Influenced Corrosion (MIC).
The following highlights the main conclusions:
1. The Low Corrosivity of Chloridized Ammonium Sulfate Solution to 316L SS
The conducted electrochemical tests illustrated the low corrosivity of the chloridized
ammonium sulfate solution to 316L stainless steel. The corrosion rate based on the
anodic polarization test of 316L SS electrode in chloridized solution with 1 g/l NaCl would
not have exceeded 0.02 mm/year. This conclusion is supported by other studies
conducted on 316L stainless steel in chloridized ammonium sulfate at a higher
temperature reaching 100 oC. These studies and the published industrial corrosion tables
concluded the 316L SS is suitable for ammonium sulfate solution at any concentration
with a corrosion rate less than 0.1 mm/year.
2. Pitting Morphology
The most obvious finding to emerge from this investigation is the classical pits
morphology of MIC. It was numerously reported that a pit with a small opening “mouth”

93
and a large subsurface cavity with tunneling in stainless steels is likely to be a “signature”
of an attack by MIC. The visual and optical microscope examinations revealed the pitting
morphology that is similar to dozens of reported industrial cases with MIC identified as
the damage mechanism.
3. Pitting Location
Another important finding of this investigation is the location of the pinhole and the other
pits. It was evident that almost all the pits are located at or near the fusion line, i.e. the
heat affected zone (HAZ). This result was explained that the microorganisms prefer to
attach to the surface of the weldment. Such attachments could be due to different surface
roughness or different chemical composition between the weld area and the base metal.
Also, the attachment might be due to welding defects or residual stresses from the
welding.
4. Preferential Attack Mechanism
One of the most interesting findings is the preferential attack mechanism. The SEM
photomicrographs showed the preferential attack of ferrite stringers at the fusion line
which resulted in a dendritic surface at the pit. It was repeatedly highlighted in the
literature that the morphology of the MIC attacks in stainless steel weldments is a
preferential attack of a single phase.

94
5. The Presence of Bacteria
Surprisingly, one of the unanticipated findings during the SEM examination was that
bacteria may have been identified. There were two indications that suggest the existence
of bacteria inside the pit. The first indication was the shape. When compared with a Figure
by Dexter (2003), it illustrated the same shape of a bacterial cell in a colony. The second
indication was the elemental analysis. The EDS elemental spot analysis at the bacterial
cell showed a spike of carbon whereas in the adjacent area, the spot analysis did not
reveal the high carbon content.
Such finding strengthens the hypothesis that the MIC is the damage mechanism that led
to the piping multiple failures. As mentioned in the results and discussion chapter, the
analyzed sample was in as-received condition. Moreover, the pipe was sectioned through
the pit using dry cutting to reveal the subsurface cavity and tunnelling. Therefore, no
contamination was expected from the external environment.
6. The Absence of chloride
Generally, when pitting occur in austenitic stainless steel materials, it is widely believed
that chloride might be the main cause of the corrosion attack. Therefore, during the
investigation, the metallurgical examination of the failed sample in the as-received
condition did not show the presence of chloride. Thus, the absence of chloride means
that the failure was not due to chloride induced pitting corrosion which in turns strengthen
the conclusion that the failure occurred due to MIC considering the other vital findings.

95
8.2 Summary of Key Observations from the Investigation
If we take one step away from all the detailed findings which were revealed by the
electrochemical, metallurgical, chemical and mechanical tests, the bigger picture could
be visualized. As such, MIC attack could not occur without the below deficiencies that
paved the way to the failure.
1. Improper Hydrotesting Procedure
As highlighted in the background, the plant inspectors did not provide documentation that
proof the completion of all the required steps of the hydrotesting and the following draining
and drying. The residual water after the hydrotest was not properly drained and dried.
Therefore, a thorough draining and drying followed by effective inspection are critical to
ensure the dryness of the pipes immediately after the hydrotest which help to prevent
MIC in the first place.
2. The Welding Quality
The investigation revealed that the examined weld was performed improperly. Visual
examination showed welding defects in the form of root concavity and lack of penetration.
Such welding defects may favor the planktonic bacteria to attach to these areas and
colonize. Therefore, ensuring the proper workmanship and avoiding any welding defects
will safeguard the integrity of the pipe joint and reduce the likelihood for planktonic to be
sessile.

96
3. Idle Time “Contact Time”
A 3-year idle time between hydrotesting the piping during the construction phase and the
commissioning is very alarming. It was reported that a maximum of 30 days should be
between these two phases. If the period is expected to exceed this 30-day interval, the
line should be mothballed by purging inert gas to avoid active corrosion. However, the
plant professional reported that after hydrotesting, the line was closed and purging with
an inert gas was simply not performed.
8.3 Recommendations to Avoid the Reoccurrence of the Failure
Based on all the presented findings from the metallurgical examination and the
highlighted observations from the investigation in general, below highlights the main
recommendations:
1. It is recommended to replace the failed pipes with the in-kind material, i.e. 316L
Stainless Steel. The failure of the pipes was not attributed to improper material
selection.
2. It is strongly recommended to use treated water for the hydrostatic testing. Using
seawater, well water or even untreated potable water which have high bacteria
count will increase the possibility of damaging the pipes by Microbiologically
Influenced Corrosion (MIC).
3. It is recommended to completely drain and dry the pipes after the hydrotesting.
Failure to do so will result in water accumulation and stagnation which will increase
the likelihood of MIC attack on the pipes.

97
4. It is recommended to minimize the idle period between the construction of the
pipes and the commissioning of the unit to be preferably less than 14 days. If the
anticipated idle period will be longer than a month, then the pipes should be
preserved and protected by purging the pipes internally with nitrogen.
8.4 Suggested Future Work
This thesis presented and discussed in greater details the metallurgical investigation of
the failed 316L SS pipes, which includes determining the causes of failures and the
associated contributing factors that led to promptly end the useful life in a premature
manner. Nevertheless, such work could be expanded in future to include conducting the
following:
1. Electrochemical Testing:
Although the thesis discussed and studied several aspects of the failure at hand including
conducted OCO and Anodic Polarization tests, it deemed beneficial to expand the
conducting electrochemical tests to study the corrosivity of the ammonium sulfate solution
at simulated conditions to the industrial plant that experienced the failure. The simulated
tests should include the addition of Urea at concentrations of 0.2 wt.% with a pH value of
3.0. Also, the tests should include measuring the corrosion current density at different
solution states: stagnant and flowing conditions. Such study will highlight if in a stagnant
condition the 316L SS material would experience higher corrosion rate and by what
magnitude.

98
Moreover, besides ammonium sulfate solution, the electrochemical tests could also be
conducted for different types of water, i.e. seawater, well water and potable water. The
objective here is to identify the corrosion rate of each type of water in order to possibly
narrow-down the water type which was used in the hydrotest that resulted in such failure.
2. MIC Testing
This thesis investigated the failure based on the metallurgical analysis. However, such
investigation could be expanded to include conducting various microbial tests that are
usually used in MIC laboratory investigations. Such tests could include analyzing
different types of water and measure the bacteria count and the types of bacteria
present in the analyzed samples. The analysis could also include treating the water
samples with different types of biocides at different concentrations to measure what
would be the more effective method for MIC prevention.
Such MIC testing could also be coupled with chemical analysis of the water samples.
Analyzing the concentrations of TDS, TSS, chloride, oxygen, and pH, in relation to the
bacteria count and the performance of the biocides could be deemed valuable for
establishing significant and fundamental correlations.

99
BIBLIOGRAPHY
K. Alawadhi, M. Martinez, A. Aloraier, J. Alsarraf, Effect of inhibitors on preferential
weld corrosion under sweet conditions, Anti-Corrosion Methods and Materials. 61, 172-
181, 2014.
P. E. Arnvig and A. D. Bisgard, “Determining the potential independent critical pitting
temperature (CPT) by a potentionstatic method using the avesta cell”, NACE International
Conference, 1996.
American Petroleum Institute, Recommended Practice API RP 571, Damage
Mechanisms Affecting Fixed Equipment in the Refining Industry, 2nd edition, 2011.
ASM International Handbook Committee, ASM Handbook, Volume 01 - Properties and
Selection: Irons, Steels, and High-Performance Alloys, ASM International, 1990.
ASTM, Standard # A312, Standard Specification for Seamless, Welded, and Heavily Cold
Worked Austenitic Stainless Steel Pipes, 2017.
ASTM, Standard # E3, Standard Guide for Preparation of Metallographic Specimens,
2011.
ASTM, Standard # E384, Standard Test Method for Microindentation Hardness of
Materials, 2017.
R.E. Avery, S. Lamb, C.A. Powell, A.H. Tuthill, Stainless steel for potable water
treatment plants (PWTP)-Guidelines, Nickel Development Institute, 1-8, 1999.

100
Tiziano Bellezze, Giampaolo Giuliani, Gabriella Roventi, Study of stainless steels
corrosion in a strong acid mixture. Part 1: cyclic potentiodynamic polarization curves
examined by means of an analytical method, Corrosion Science, Volume 130, 113-125,
2018.
M.V. Biezma, Microstructural features and the microbiologically influenced corrosion of
stainless steels, European Federation of Corrosion Publications (UK), 29, 36-46, 2000.
P.E. Frederick Bloetscher, R.J. Bullock, G.M. Witt, Brackish Water Supply Corrosion
Control Issues using 3161 Stainless Steel, 2001.
S.W. Borenstein, P.B. Lindsay, Microbiologically influenced corrosion failure analysis of
304L stainless steel piping system left stagnant after hydrotesting with city water, NACE
Corrosion Conference, 2002.
J.E. Bringas, Handbook of Comparative World Steel Standard, ASTM International,
2007.
L. Carpén, T. Ohligschläger, A Case Study On Corrosion Of Stainless Steel In Firewater
Mains, 6th European Stainless Steel Conference, Finland, 2008.
C. Chandrasatheesh, J. Jayapriya, R.P. George, U.K. Mudali, Detection and analysis
of microbiologically influenced corrosion of 316 L stainless steel with electrochemical
noise technique, Eng. Failure Anal. 42, 133-142, 2014.
J. H. Cleland, What Does the Pitting Resistance Equivalent Really Tell Us?, Engineering
Failure Analysis, Vol. 3, No. 1, 65-69, 1996.

101
T.E. Cloete, Biofouling control in industrial water systems: what we know and what we
need to know, Materials and Corrosion. 54, 520-526, 2003.
S.D. Cramer, B.S. Covino Jr, ASM Handbook, Volume 13B - Corrosion: Materials, ASM
International, 2005.
S.D. Cramer, B.S. Covino Jr, ASM Handbook, Volume 13A - Corrosion: Fundamentals,
Testing and Protection, ASM International, 2003.
Y. Cui, C.D. Lundin, Austenite-preferential corrosion attack in 316 austenitic stainless
steel weld metals, Materials & design. 28, 324-328, 2007.
A. Darwin, K. Annadorai, K. Heidersbach, Prevention of Corrosion in Carbon Steel
Pipelines Containing Hydrotest Water-An Overview, NACE Corrosion Conference, 2010.
J.R. Davis, Corrosion of Austenitic Stainless Steel Weldments, in: Corrosion of
Weldments, ASM International, 43-57, 2006.
M.Y. Demeri, Advanced High-Strength Steels - Science, Technology, and Applications,
ASM International, 2013.
Stephen C. Dexter, Microbiologically Influenced Corrosion, ASM Handbook, Volume
13A, ASM International, 2003.
James Dillon, P. Desch, T. Lay, The Nalco Guide to Cooling Water Systems Failure
Analysis, McGraw-Hill Education, 2nd edition, 2015.
The Editor, Chloride and pH limits for stainless steel, Mater. Perform. 49, 59, 2010.

102
F. Elshawesh, K. Abusowa, H. Mahfud, A. Abderraheem, F. Eljweli, K. Zyada,
Microbial-Influenced Corrosion (MIC) on an 18 in. API 5L X52 Trunkline, Journal of Failure
Analysis and Prevention. 8, 60-68, 2008.
Dennis Enning, Julia Garrelfs, Corrosion of Iron by Sulfate-Reducing Bacteria: New
Views of an Old Problem, Applied and Environmental Microbiology, Volume 80, 1226-
1236, 2014.
D. Enning, H. Venzlaff, J. Garrelfs, H. Dinh, V. Meyer, K. Mayrhofer, A. Hassel, M.
Stratmann, F. Widdel. Marine Sulfate-Reducing Bacteria Cause Serious Corrosion of
Iron Under Electroconductive Biogenic Mineral Crust. Environ. Microbiol, 1772-1787,
2012.
G.S. Frankel, Microbiologically Induced Corrosion, ASM Handbook, Volume 13 A, 2003.
R.P. George, P. Muraleedharan, K.R. Sreekumari, H.S. Khatak, Influence of surface
characteristics and microstructure on adhesion of bacterial cells onto a type 304 stainless
steel, Biofouling 19, 1-8, 2003.
R.P. George, P. Muraleedharan, Microbiologically Influenced Corrosion, Corrosion of
Austenitic Stainless Steels, Mechanism, Mitigation and Monitoring, 218-240, 2002.
Alec Groysman, Corrosion for Everybody, 2010.
A Ghahremaninezhad, W Wang, E Asselin, J Budac, A Alfantazi, Electrochemical and
corrosion behaviour of stainless steels 316L and 317L in chloridised ammonium sulfate
solution, Canadian Metallurgical Quarterly, 51:4, 471-484, 2012.

103
John F. Grubb, Terry DeBold, James D. Fritz, Corrosion of Wrought Stainless Steels,
ASM Handbook, Volume 13B, Corrosion: Materials, ASM International, 54-75, 2005.
E. Hargrave, Behavior of 300-Series Stainless Steel Heat Exchangers in Cooling Water
Service, 2004.
W. Huang, D. Xu, G. Ruschau, J. Wen, J. Hornemann, T. Gu, Laboratory Investigation
of MIC Due to Hydrotest Using Seawater And Subsequent Exposure to Pipeline Fluids
With And Without SRB Spiking, NACE Corrosion Conference, 2012.
E. Huttunen-Saarivirta, M. Honkanen, T. Lepistö, V.-. Kuokkala, L. Koivisto, C. Berg,
Microbiologically influenced corrosion (MIC) in stainless steel heat exchanger, Applied
Surface Science. 258, 6512-6526, 2012.
M.A.M. Ibrahim, El Rehim, S S Abd, M.M. Hamza, Corrosion behavior of some
austenitic stainless steels in chloride environments, Mater. Chem. Phys. 115, 80-85,
2009.
D. Ifezue, F. Tobins, Failure Investigation of a Gate Valve Eye Bolt Fracture During
Hydrotesting, Journal of failure analysis and prevention. 13, 249-256, 2013.
ISO, Standard # 22309, Microbeam Analysis - Quantitative Analysis using Energy-
Dispersive Spectrometry (EDS) for Elements with an Atomic Number of 11 (Na) or Above,
2011.
Thomas R. Jack, Biological Corrosion Failures, ASM Handbook, Volume 11, 2002.
R. Javaherdashti, Examples of Some Materials Vulnerable to MIC, Microbiologically
Influenced Corrosion: An Engineering Insight, 123-131, 2008.

104
Reza Javaherdashti. Microbiologically Influenced Corrosion, Corrosion and Materials in
Oil and Gas Industries, 47-128, 2013.
M.A. Javed, S.L. McArthur, P.R. Stoddart, S.A. Wade, Techniques for studying initial
bacterial attachment and subsequent corrosion of metals, Corros. Preven. 2, 299-304,
2013.
S. Kaewkumsai, S. Auampan, K. Wongpinkaew, E. Viyanit, Root cause analysis for
316L stainless steel tube leakages, Eng. Failure Anal. 37, 53-63, 2014.
K.V. Kasiviswanathan, N.G. Muralidharan, N. Raghu, R.K. Dayal, H. Shaikh,
Corrosion Related Failures of Austenitic Stainless Steel Components, in: Corrosion of
Austenitic Stainless Steels, 314-339, 2011.
Y. Kikuchi, F. Matsuda, Microbiologically influenced corrosion of metal welds, Welding
international. 9, 677-681, 1995.
Y. Kikuchi, F. Matsuda, K. Tomoto, T. Okayama, T. Sakane, Role of micro-organism
on the microbiologically influenced corrosion (MIC) susceptibility of stainless steel weld,
Biodeterioration and Biodegradation. 133, 91-99. 1996.
E.W. Klechka, Use of corrosion inhibitors on the trans Alaska pipeline, Materials
performance. 3, 7-9, 2001.
G. Kobrin, Microbiologically Influenced Corrosion of Stainless Steels by Water used for
Cooling and Hydrostatic Testing, 58th Annual International Water Conference, Pittsburgh,
PA, 1997.

105
P.S. Korinko, S.H. Malene, Considerations for the weldability of types 304L and 316L
stainless steel, Practical Failure Analysis. 1, 61-68, 2001.
Curtis W. Kovach, James D. Redmond, High Performance Stainless Steels and
Microbiologically Influenced Corrosion, Avesta Sheffield Corrosion Management and
Application Engineering, 1997.
M. Krauss, R. Herzog, B. Scholtes, Influence of surface treatment on the pitting
corrosion behaviour of high alloyed stainless steels in a chloride solution, Zeitschrift Fur
Metallkunde. 92, 910-915, 2001.
O. Kvernvold, R. Johnson, T. Helgerson, Assessment of internal pipeline corrosion,
Proceedings of the International Conference on Offshore Mechanics and Arctic
Engineering, 409, 1992.
W. Lee, Z. Lewandowski, P. Nielsen, W. Hamilton, Role of Sulfate-Reducing Bacteria
in Corrosion of Mild Steel: A Review. Biofouling 8, 165-194, 1995.
A. N. Lebedev, V. A. Blinova, Y. N. Dulepov, The corrosion of stainless steels under
evaporator conditions during the concentration of ammonium sulfate solution, Chemical
and Petroleum Engineering 10, 797, 1974.
B.J. Little, J.S. Lee, Microbiologically influenced corrosion, Wiley, Hoboken, NJ, 2007.
B. Little, R. Ray, P. Wagner, E.D. Thomas, Microbiologically Influenced Corrosion of
Corrosion Resistant Materials, Tri-Service Committee on Corrosion Proceedings, 1994.
W. Liu, Rapid MIC attack on 2205 duplex stainless steel pipe in a yacht, Engineering
Failure Analysis. 42, 109-120, 2014.

106
L.L. Machuca, L. Murray, R. Gubner, S.I. Bailey, Evaluation of the effects of seawater
ingress into 316L lined pipes on corrosion performance, Materials and Corrosion, 65, 8-
17, 2014.
L.L. Machuca, S.I. Bailey, R. Gubner, E.L. Watkin, M.P. Ginige, A.H. Kaksonen, K.
Heidersbach, Effect of oxygen and biofilms on crevice corrosion of UNS S31803 and
UNS N08825 in natural seawater, Corrosion Science. 67, 242-255, 2013.
H. Mansoori, R. Mirzaee, A. Mohammadi, Pitting Corrosion Failures of Natural Gas
Transmission Pipelines, IPTC 2013: International Petroleum Technology Conference,
2013.
T. Mathiesen, J. Frantsen, Unusual Corrosion Failures of Stainless Steel in Low Chloride
Waters, NACE Corrosion Conference, 2008.
O. McWane, Integrity of rewelded thin wall 316L stainless steel tube, Master's Theses
782, San Jose State University, 1994.
A.S Modaihsh, Characteristics and Composition of the Falling Dust Sediments on Riyadh
City, Saudi Arabia, Journal of Arid Environments, Volume 36, Issue 2, 211-223, 1997.
D.A. Moreno, J.R. Ibars, J.L. Polo, J.M. Bastidas, EIS monitoring study of the early
microbiologically influenced corrosion of AISI 304L stainless steel condenser tubes in
freshwater, Journal of Solid State Electrochemistry. 18, 377-388, 2014.
D.A. Moreno, J.R. Ibars, C. Ranninger, De Mele, M F L, H.A. Videla, Evaluation of
Stainless Steel Susceptibility to Microbiologically Influenced Corrosion: An Updated

107
Review, Mycotoxins, Wood Decay, Plant Stress, Biocorrosion, and General
Biodeterioration, Springer, 527–552, 1994.
NACE International, Selection, Application and Evaluation of Biocides in the Oil and Gas
Industry, NACE 31205 Technical Report, 2006.
NACE/ASTM, G193, Standards Terminology and Acronyms Relating to Corrosion, 2012.
R.C. Newman, Understanding the Corrosion of Stainless Steel, Corrosion. 57, 1030–
1041, 2001.
PH. Nielsen, W. Lee, Z. Lewandowski, M. Morison, WG. Characklis, Corrosion of Mild
Steel in an Alternating Oxic and Anoxic Biofilm System. Biofouling 7, 267–284, 1993.
M. Ohanian, V. Diaz, M. Corengia, P. Russi, M.J. Pianzzola, R.J. Menes,
Microbiologically influenced corrosion evaluation on brass (UNS C68700, UNS C443) and
AISI 316 stainless steel, REVISTA DE METALURGIA. 50, 2014.
I. Olefjord, The passive state of stainless steels, Materials Science and Engineering. 42,
161-171, 1980.
C.A. Olsson, D. Landolt, Passive films on stainless steels—chemistry, structure and
growth, Electrochimica Acta. 48, 1093-1104, 2003.
R. Ovarfort, “Critical Pitting Temperature Measurements of Stainless Steels with an
Improved Electrochemical Method”, Corrosion Science, Vol. 29, 987-993, 1989.
J.E. Penkala, J. Fichter, S. Ramachandran, Protection against microbiologically
influenced corrosion by effective treatment and monitoring during hydrotest shut-in,
NACE Corrosion Conference, 2010.

108
S.L. Percival, J.S. Knapp, D.S. Wales, R. Edyvean, Physical factors influencing
bacterial fouling of type 304 and 316 stainless steels, British Corrosion Journal. 33, 121–
129, 1998.
Daniel E. Powell, Burkin Melancon, Robert H. Winters, Guidelines When Conducting
Hydrostatic Pressure Tests and Management of Extended Dwell Times Through Dry/Wet
Lay-Ups, NACE Corrosion Conference, 2011.
R. Prasad, Chemical treatment options for hydrotest water to control corrosion and
bacterial growth, NACE Corrosion Conference, 2003.
B.S.C. Rao, R. Madeswaran, R. Chandramohan, In-fabrication and pre-service care on
stainless steel pressure vessels, International journal of pressure vessels and piping. 73,
53–57, 1997.
R.I. Ray, B.J. Little, J.S. Lee, The Role of Marine Bacteria in Stainless Steel Pitting,
2002.
R.G. Rice, J.F. Wilkes, “Fundamental Aspects of Ozone Chemistry in Recirculating
Cooling Water Systems,” NACE Corrosion Conference, Paper 205, 1991.
M. H. W. Renner, "Corrosion Engineering Aspects Regarding MIC Related Failures on
Stainless Steels", NACE Corrosion Conference, paper 285, 1998.
J.J. Scutti, W.J. McBrine, ASM Handbook, Volume 11 - Introduction to Failure Analysis
and Prevention, 2002.
A. John Sedriks, Corrosion of Stainless Steels, 2nd edition, Wiley-Interscience, 1996.

109
H.M. Shalaby, A. Husain, Technical note: Localised corrosion of electric resistance
welds of austenitic stainless steel in sea water, British Corrosion Journal. 27, 45–49,
1992.
X. Shi, On the use of nanotechnology to manage steel corrosion, Recent Patents on
Engineering. 4, 44–50, 2010.
K. R. Sreekumari, K. Nandakumar, Y. Kikuchi, Bacterial attachment to stainless steel
welds: significance of substratum microstructure, Biofouling. 17, 303–316, 2001.
K.R. Sreekumari, Y. Sato, Y. Kikuchi, Antibacterial metals-A viable solution for bacterial
attachment and microbiologically influenced corrosion, Materials transactions. 46, 1636–
1645, 2005.
D. Starosvetsky, O. Khaselev, J. Starosvetsky, R. Armon, J. Yahalom, The role of
sulfides in iron activation in chloride-containing solutions, Electrochemical and Solid State
Letters. 2, 265-266, 1999.
J. Starosvetsky, D. Starosvetsky, B. Pokroy, T. Hilel, R. Armon, Electrochemical
behaviour of stainless steels in media containing iron-oxidizing bacteria (IOB) by
corrosion process modeling, Corrosion Science. 50, 540-547, 2008.
J. Stewart, D.E. Williams, The Initiation of Pitting Corrosion on Austenitic Stainless-Steel
- on the Role and Importance of Sulfide Inclusions, Corros. Sci. 33, 1992.
J.G. Stoecker, Penetration of stainless steel following hydrostatic test, A practical manual
on microbiologically influenced corrosion. Kobrin G (ed), NACE, Houston, Texas, 1993.

110
M.A. Streicher, Pitting Corrosion of 18cr-8ni Stainless Steel, J. Electrochem. Soc. 103,
375-390, 1956.
M.A. Streicher, Theory and Application of Evaluation Tests for Detecting Susceptibility
to Intergranular Attack in Stainless Steels and Related Alloys—Problems and
Opportunities, Intergranulur Corrosion of Stainless Alloys, STP 656, American Society for
Testing and Materials, 70, 1978.
L.L.M. Suarez, Microbiologically Influenced Corrosion of Common Alloys Used for
Subsea Applications, Citeseer, 2012.
Saud Al Subai, Keshab Barai, Esteban Morales Murillo, Failure analysis of firewater
pipeline, Case Studies in Engineering Failure Analysis, Volume 2, Issue 2, 144-149, 2014.
M.E. Suess, Bacteria-induced corrosion of a stainless steel chemical trailer barrel, ASM
International, Handbook of Case Histories in Failure Analysis. 1, 70–73, 1992.
Kazuo Sugibayashi, Researches on the Corrosion of 18-8 Steel by the Aqueous Solution
of Ammonium Sulphate, and its Prevention, the Society of Chemical Engineers, Japan,
Volume 18, Issue 1, 16-21 1954.
K. Sugimoto, Y. Sawada, Role of Alloyed Molybdenum in Austenitic Stainless-Steels in
Inhibition of Pitting in Neutral Halide Solutions, Corrosion. 32, 347-352, 1976.
T. Suter, H. Bohni, A new microelectrochemical method to study pit initiation on stainless
steels, Electrochim. Acta. 42, 3275-3280, 1997.
A.K. Tiller, Is stainless steel susceptible to microbial corrosion?, Microbial Corrosion,
104–107, 1983.

111
A.K. Tiller, Some case histories of corrosion failures induced by bacteria, International
Biodeterioration. 24, 231–237, 1988.
A.H. Tuthill, R.E. Avery, Survey of stainless steel performance in low chloride waters,
Public Works. 125, 1994.
R.N. Tuttle, Corrosion in oil and gas production, Journal of petroleum technology. 39,
756–762, 1987.
J. E. Truman, Proceedings of UC Corrosion, Brighton, 111-129, 1987.
B.R. Tzaneva, L.B. Fachikov, R.G. Raicheff, Effect of halide anions and temperature
on initiation of pitting in Cr-Mn-N and Cr-Ni steels, Corrosion Engineering Science and
Technology. 41, 62-66, 2006.
T. Ujiro, K. Yoshioka, R.W. Staehle, Differences in Corrosion Behavior of Ferritic and
Austenitic Stainless-Steels, Corrosion. 50, 953-962, 1994.
M. Urgen, A.F. Cakir, The Effect of Molybdate Ions on the Temperature-Dependent
Pitting Potential of Austenitic Stainless-Steels in Neutral Chloride Solutions, Corros. Sci.
32, 841-852, 1991.
H.A. Videla, M.R. Viera, P.S. Guiamet, M.F.L. deMelle, J.C. Staibano Alais, Biocidal
Activity of Dissolved Ozone on Sessile and Planktonic Bacteria: Effects of Corrosion
Behavior of Cooling Water Systems Structural Materials, Proc. 1995 Intl. Conf. on MIC,
P. Angel et al., Ed., NACE International, 62, 1995.
D. Walsh, D. Pope, M. Danford, T. Huff, The effect of microstructure on microbiologically
influenced corrosion, JOM. 45, 22–30, 1993.

112
T. Watanabe, K. Ei, H. Nakamura, Pitting Corrosion and Microscopically Measuring of
the Local Corrosion Potential in Welds of Austenitic Stainless-Steels, Transactions of
National Research Institute for Metals. 29, 87-97, 1987.
Z. Wei, P. Duby, P. Somasundaran, Inhibition of pitting corrosion by surfactants as a
function of temperature, Corrosion. 61, 341-347, 2005.
D.E. Williams, J. Stewart, P.H. Balkwill, The Nucleation, Growth and Stability of
Micropits in Stainless-Steel, Corros. Sci. 36, 1213-1235, 1994.
S. Xin, J. Xu, F. Lang, M. Li, Effect of temperature and grain size on the corrosion
behavior of 316L stainless steel in seawater, Materials and Manufacturing, Pts 1 and 2.
299-300, 175-178, 2011.
C. Xu, Y. Zhang, G. Cheng, W. Zhu, Localized corrosion behavior of 316L stainless steel
in the presence of sulfate-reducing and iron-oxidizing bacteria, Materials Science and
Engineering: A. 443, 235-241, 2007.
C. Xu, Y. Zhang, G. Cheng, W. Zhu, Pitting corrosion behavior of 316L stainless steel in
the media of sulphate-reducing and iron-oxidizing bacteria, Materials Characterization.
59, 245-255, 2008.
D. Xu, W. Huang, G. Ruschau, J. Hornemann, J. Wen, T. Gu, Laboratory investigation
of MIC threat due to hydrotest using untreated seawater and subsequent exposure to
pipeline fluids with and without SRB spiking, Engineering Failure Analysis. 28, 149–159,
2013.

113
Ling Yun, Z. G. Chen, P. Guempl, M. Kaesser M, Influence of Water Pollution on MIC
of Stainless Steel 304L, 钢铁研究学报:英文版. 9, 45-48, 2002.
E.M. Zahrani, A. Saatchi, A. Alfantazi, Pitting of 316L stainless steel in flare piping of a
petrochemical plant, Engineering Failure Analysis. 17, 810–817, 2010.
K. Zhao, Investigation of microbiologically influenced corrosion (MIC) and biocide
treatment in anaerobic salt water and development of a mechanistic MIC model, 2008.
Zhao, Kaili. Investigation of Microbiologically Influenced Corrosion (MIC) and Biocide
Treatment in Anaerobic Salt Water and Development of A Mechanistic MIC Model, PhD
Dissertation. Ohio University, 2008.
K. Zhao, T. Gu, I. Cruz, A. Kopliku, Laboratory investigation of MIC in hydrotesting using
seawater, NACE Corrosion Conference, 2010.
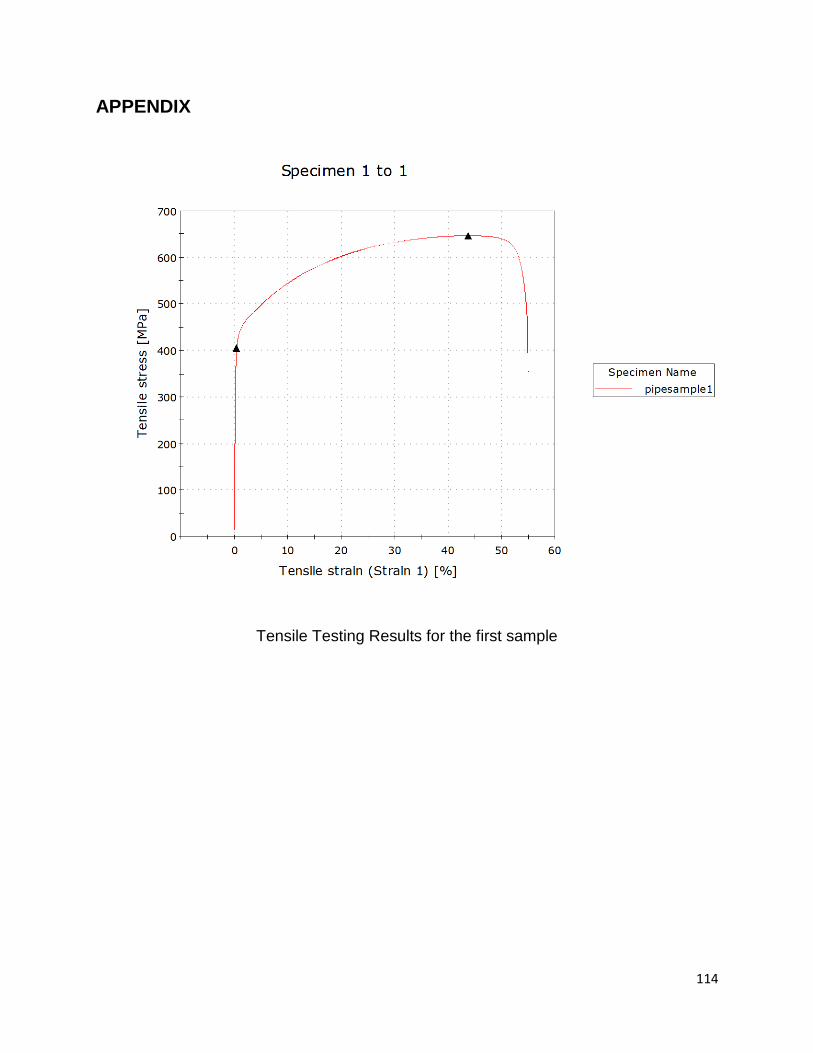
114
APPENDIX
Tensile Testing Results for the first sample

115
Tensile testing result for the second sample

116
More samples from the piping network experienced the same failure morphology.

117
Another sample from the failed piping network experienced the same failure morphology