Metal oxide semiconductor gas sensor self-test using ... · CC Attribution 3.0 License. Metal oxide...
9
J. Sens. Sens. Syst., 3, 213–221, 2014 www.j-sens-sens-syst.net/3/213/2014/ doi:10.5194/jsss-3-213-2014 © Author(s) 2014. CC Attribution 3.0 License. Metal oxide semiconductor gas sensor self-test using Fourier-based impedance spectroscopy M. Schüler, T. Sauerwald, and A. Schütze Laboratory for Measurement Technology, Department of Mechatronics, Saarland University, Saarbrücken, Germany Correspondence to: M. Schüler ([email protected]) Received: 31 July 2014 – Revised: 4 September 2014 – Accepted: 6 September 2014 – Published: 25 September 2014 Abstract. For the self-test of semiconductor gas sensors, we combine two multi-signal processes: temperature- cycled operation (TCO) and electrical impedance spectroscopy (EIS). This combination allows one to discrim- inate between irreversible changes of the sensor, i.e., changes caused by poisoning, as well as changes in the gas atmosphere. To integrate EIS and TCO, impedance spectra should be acquired in a very short time period, in which the sensor can be considered time invariant, i.e., milliseconds or less. For this purpose we developed a Fourier-based high-speed, low-cost impedance spectroscope. It provides a binary excitation signal through an FPGA (field programable gate array), which also acquires the data. To determine impedance spectra, it uses the ETFE (empirical transfer function estimate) method, which calculates the impedance by evaluating the Fourier transformations of current and voltage. With this approach an impedance spectrum over the range from 61 kHz to 100 MHz is acquired in ca. 16 μs. We carried out TCO–EIS measurements with this spectroscope and a commercial impedance analyzer (Agilent 4294A), with a temperature cycle consisting of six equidistant temperature steps between 200 and 450 ◦ C, with lengths of 30 s (200 ◦ C) and 18 s (all others). Discrimination of carbon monoxide (CO) and methane (CH 4 ) is possible by LDA (linear discriminant analysis) using either TCO or EIS data, thus enabling a validation of results by comparison of both methods. 1 Introduction Metal oxide semiconductor (MOS) gas sensors are highly sensitive to a broad range of reducing and oxidizing gases, and they are available at relatively low cost. Their opera- tion is based on resistance measurements of a sensitive layer, which in most cases consists of a granular metal oxide. The resistance of this layer is strongly determined by the adsorp- tion of oxygen, which creates a depletion region at the metal oxide surface leading to an energy barrier between grains (Tricoli et al., 2010; Morrison, 1982; Kohl, 1989). The interaction of adsorbed oxygen and reducing or oxi- dizing gases on the grain surfaces depends strongly on tem- perature and shows different behavior, depending on the gases and temperatures (Clifford and Tuma, 1982, 1983; Morrison, 1987). Temperature is usually controlled by an in- tegrated heater, e.g., a microstructured platinum resistor on the substrate. By variation of temperature, it is possible to obtain a vir- tual multi-sensor or virtual sensor array, i.e., to evaluate the sensor resistance at different temperatures and thereby gain selectivity, in a manner similar to the use of multi-sensory arrays (Stetter and Penrose, 2002; Schütze et al., 2004). This method, which we denote as temperature-cycled operation (TCO), can be used to increase the selectivity and sensitivity of metal oxide gas sensors considerably (Heilig et al., 1997; Lee and Reedy, 1999). Another way to increase the selectivity is the measurement of the complex sensor impedance by electrical impedance spectroscopy (EIS). One of the underlying effects is the change in capacity at the grain boundaries, which is caused by gas, primarily oxygen. The dielectric properties of the chemical species present in the sensing layer also influ- ence the capacitance properties of the sensor layer – their measurement by EIS can thus increase selectivity (Weimar and Göpel, 1998; Bârsan and Weimar, 2003). Published by Copernicus Publications on behalf of the AMA Association for Sensor Technology.
Transcript of Metal oxide semiconductor gas sensor self-test using ... · CC Attribution 3.0 License. Metal oxide...
J. Sens. Sens. Syst., 3, 213–221, 2014www.j-sens-sens-syst.net/3/213/2014/doi:10.5194/jsss-3-213-2014© Author(s) 2014. CC Attribution 3.0 License.
Metal oxide semiconductor gas sensor self-test usingFourier-based impedance spectroscopy
M. Schüler, T. Sauerwald, and A. Schütze
Laboratory for Measurement Technology, Department of Mechatronics, Saarland University,Saarbrücken, Germany
Correspondence to:M. Schüler ([email protected])
Received: 31 July 2014 – Revised: 4 September 2014 – Accepted: 6 September 2014 – Published: 25 September 2014
Abstract. For the self-test of semiconductor gas sensors, we combine two multi-signal processes: temperature-cycled operation (TCO) and electrical impedance spectroscopy (EIS). This combination allows one to discrim-inate between irreversible changes of the sensor, i.e., changes caused by poisoning, as well as changes in thegas atmosphere. To integrate EIS and TCO, impedance spectra should be acquired in a very short time period,in which the sensor can be considered time invariant, i.e., milliseconds or less. For this purpose we developeda Fourier-based high-speed, low-cost impedance spectroscope. It provides a binary excitation signal through anFPGA (field programable gate array), which also acquires the data. To determine impedance spectra, it uses theETFE (empirical transfer function estimate) method, which calculates the impedance by evaluating the Fouriertransformations of current and voltage. With this approach an impedance spectrum over the range from 61 kHzto 100 MHz is acquired in ca. 16 µs.
We carried out TCO–EIS measurements with this spectroscope and a commercial impedance analyzer (Agilent4294A), with a temperature cycle consisting of six equidistant temperature steps between 200 and 450◦C, withlengths of 30 s (200◦C) and 18 s (all others). Discrimination of carbon monoxide (CO) and methane (CH4) ispossible by LDA (linear discriminant analysis) using either TCO or EIS data, thus enabling a validation of resultsby comparison of both methods.
1 Introduction
Metal oxide semiconductor (MOS) gas sensors are highlysensitive to a broad range of reducing and oxidizing gases,and they are available at relatively low cost. Their opera-tion is based on resistance measurements of a sensitive layer,which in most cases consists of a granular metal oxide. Theresistance of this layer is strongly determined by the adsorp-tion of oxygen, which creates a depletion region at the metaloxide surface leading to an energy barrier between grains(Tricoli et al., 2010; Morrison, 1982; Kohl, 1989).
The interaction of adsorbed oxygen and reducing or oxi-dizing gases on the grain surfaces depends strongly on tem-perature and shows different behavior, depending on thegases and temperatures (Clifford and Tuma, 1982, 1983;Morrison, 1987). Temperature is usually controlled by an in-tegrated heater, e.g., a microstructured platinum resistor onthe substrate.
By variation of temperature, it is possible to obtain a vir-tual multi-sensor or virtual sensor array, i.e., to evaluate thesensor resistance at different temperatures and thereby gainselectivity, in a manner similar to the use of multi-sensoryarrays (Stetter and Penrose, 2002; Schütze et al., 2004). Thismethod, which we denote as temperature-cycled operation(TCO), can be used to increase the selectivity and sensitivityof metal oxide gas sensors considerably (Heilig et al., 1997;Lee and Reedy, 1999).
Another way to increase the selectivity is the measurementof the complex sensor impedance by electrical impedancespectroscopy (EIS). One of the underlying effects is thechange in capacity at the grain boundaries, which is causedby gas, primarily oxygen. The dielectric properties of thechemical species present in the sensing layer also influ-ence the capacitance properties of the sensor layer – theirmeasurement by EIS can thus increase selectivity (Weimarand Göpel, 1998; Bârsan and Weimar, 2003).
Published by Copernicus Publications on behalf of the AMA Association for Sensor Technology.
214 M. Schüler et al.: MOS gas sensor self-test using FoBIS
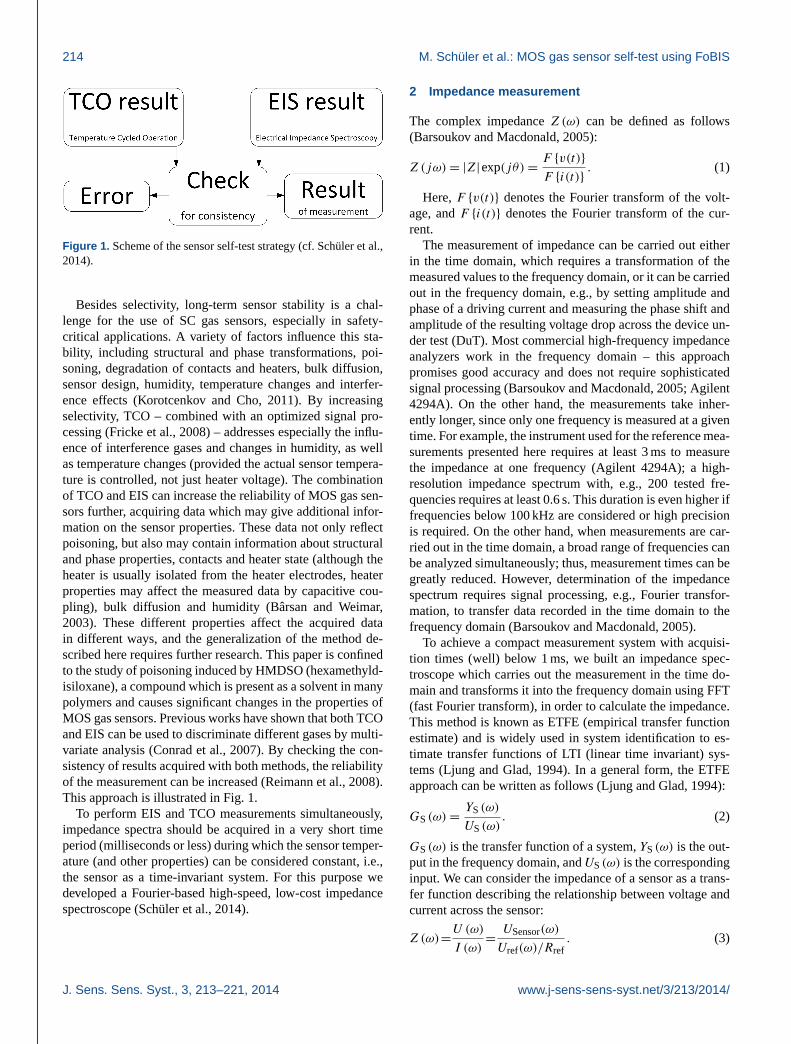
Figure 1. Scheme of the sensor self-test strategy (cf. Schüler et al.,2014).
Besides selectivity, long-term sensor stability is a chal-lenge for the use of SC gas sensors, especially in safety-critical applications. A variety of factors influence this sta-bility, including structural and phase transformations, poi-soning, degradation of contacts and heaters, bulk diffusion,sensor design, humidity, temperature changes and interfer-ence effects (Korotcenkov and Cho, 2011). By increasingselectivity, TCO – combined with an optimized signal pro-cessing (Fricke et al., 2008) – addresses especially the influ-ence of interference gases and changes in humidity, as wellas temperature changes (provided the actual sensor tempera-ture is controlled, not just heater voltage). The combinationof TCO and EIS can increase the reliability of MOS gas sen-sors further, acquiring data which may give additional infor-mation on the sensor properties. These data not only reflectpoisoning, but also may contain information about structuraland phase properties, contacts and heater state (although theheater is usually isolated from the heater electrodes, heaterproperties may affect the measured data by capacitive cou-pling), bulk diffusion and humidity (Bârsan and Weimar,2003). These different properties affect the acquired datain different ways, and the generalization of the method de-scribed here requires further research. This paper is confinedto the study of poisoning induced by HMDSO (hexamethyld-isiloxane), a compound which is present as a solvent in manypolymers and causes significant changes in the properties ofMOS gas sensors. Previous works have shown that both TCOand EIS can be used to discriminate different gases by multi-variate analysis (Conrad et al., 2007). By checking the con-sistency of results acquired with both methods, the reliabilityof the measurement can be increased (Reimann et al., 2008).This approach is illustrated in Fig. 1.
To perform EIS and TCO measurements simultaneously,impedance spectra should be acquired in a very short timeperiod (milliseconds or less) during which the sensor temper-ature (and other properties) can be considered constant, i.e.,the sensor as a time-invariant system. For this purpose wedeveloped a Fourier-based high-speed, low-cost impedancespectroscope (Schüler et al., 2014).
2 Impedance measurement
The complex impedanceZ(ω) can be defined as follows(Barsoukov and Macdonald, 2005):
Z(jω) = |Z|exp(jθ) =F {v(t)}
F {i(t)}. (1)
Here,F {v(t)} denotes the Fourier transform of the volt-age, andF {i(t)} denotes the Fourier transform of the cur-rent.
The measurement of impedance can be carried out eitherin the time domain, which requires a transformation of themeasured values to the frequency domain, or it can be carriedout in the frequency domain, e.g., by setting amplitude andphase of a driving current and measuring the phase shift andamplitude of the resulting voltage drop across the device un-der test (DuT). Most commercial high-frequency impedanceanalyzers work in the frequency domain – this approachpromises good accuracy and does not require sophisticatedsignal processing (Barsoukov and Macdonald, 2005; Agilent4294A). On the other hand, the measurements take inher-ently longer, since only one frequency is measured at a giventime. For example, the instrument used for the reference mea-surements presented here requires at least 3 ms to measurethe impedance at one frequency (Agilent 4294A); a high-resolution impedance spectrum with, e.g., 200 tested fre-quencies requires at least 0.6 s. This duration is even higher iffrequencies below 100 kHz are considered or high precisionis required. On the other hand, when measurements are car-ried out in the time domain, a broad range of frequencies canbe analyzed simultaneously; thus, measurement times can begreatly reduced. However, determination of the impedancespectrum requires signal processing, e.g., Fourier transfor-mation, to transfer data recorded in the time domain to thefrequency domain (Barsoukov and Macdonald, 2005).
To achieve a compact measurement system with acquisi-tion times (well) below 1 ms, we built an impedance spec-troscope which carries out the measurement in the time do-main and transforms it into the frequency domain using FFT(fast Fourier transform), in order to calculate the impedance.This method is known as ETFE (empirical transfer functionestimate) and is widely used in system identification to es-timate transfer functions of LTI (linear time invariant) sys-tems (Ljung and Glad, 1994). In a general form, the ETFEapproach can be written as follows (Ljung and Glad, 1994):
GS(ω) =YS(ω)
US(ω). (2)
GS(ω) is the transfer function of a system,YS(ω) is the out-put in the frequency domain, andUS(ω) is the correspondinginput. We can consider the impedance of a sensor as a trans-fer function describing the relationship between voltage andcurrent across the sensor:
Z(ω)=U (ω)
I (ω)=
USensor(ω)
Uref(ω)/Rref. (3)
J. Sens. Sens. Syst., 3, 213–221, 2014 www.j-sens-sens-syst.net/3/213/2014/
M. Schüler et al.: MOS gas sensor self-test using FoBIS 215
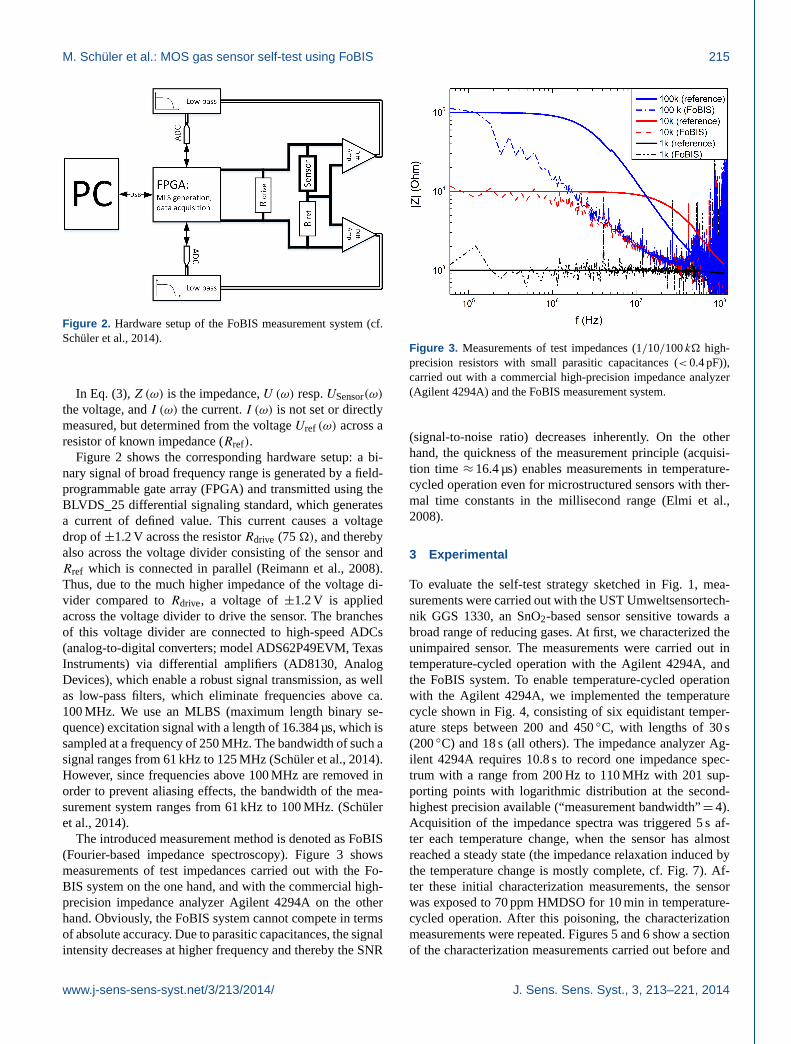
Figure 2. Hardware setup of the FoBIS measurement system (cf.Schüler et al., 2014).
In Eq. (3),Z(ω) is the impedance,U (ω) resp.USensor(ω)
the voltage, andI (ω) the current.I (ω) is not set or directlymeasured, but determined from the voltageUref (ω) across aresistor of known impedance (Rref).
Figure 2 shows the corresponding hardware setup: a bi-nary signal of broad frequency range is generated by a field-programmable gate array (FPGA) and transmitted using theBLVDS_25 differential signaling standard, which generatesa current of defined value. This current causes a voltagedrop of±1.2 V across the resistorRdrive (75�), and therebyalso across the voltage divider consisting of the sensor andRref which is connected in parallel (Reimann et al., 2008).Thus, due to the much higher impedance of the voltage di-vider compared toRdrive, a voltage of±1.2 V is appliedacross the voltage divider to drive the sensor. The branchesof this voltage divider are connected to high-speed ADCs(analog-to-digital converters; model ADS62P49EVM, TexasInstruments) via differential amplifiers (AD8130, AnalogDevices), which enable a robust signal transmission, as wellas low-pass filters, which eliminate frequencies above ca.100 MHz. We use an MLBS (maximum length binary se-quence) excitation signal with a length of 16.384 µs, which issampled at a frequency of 250 MHz. The bandwidth of such asignal ranges from 61 kHz to 125 MHz (Schüler et al., 2014).However, since frequencies above 100 MHz are removed inorder to prevent aliasing effects, the bandwidth of the mea-surement system ranges from 61 kHz to 100 MHz. (Schüleret al., 2014).
The introduced measurement method is denoted as FoBIS(Fourier-based impedance spectroscopy). Figure 3 showsmeasurements of test impedances carried out with the Fo-BIS system on the one hand, and with the commercial high-precision impedance analyzer Agilent 4294A on the otherhand. Obviously, the FoBIS system cannot compete in termsof absolute accuracy. Due to parasitic capacitances, the signalintensity decreases at higher frequency and thereby the SNR
Figure 3. Measurements of test impedances (1/10/100k� high-precision resistors with small parasitic capacitances (< 0.4 pF)),carried out with a commercial high-precision impedance analyzer(Agilent 4294A) and the FoBIS measurement system.
(signal-to-noise ratio) decreases inherently. On the otherhand, the quickness of the measurement principle (acquisi-tion time ≈ 16.4 µs) enables measurements in temperature-cycled operation even for microstructured sensors with ther-mal time constants in the millisecond range (Elmi et al.,2008).
3 Experimental
To evaluate the self-test strategy sketched in Fig. 1, mea-surements were carried out with the UST Umweltsensortech-nik GGS 1330, an SnO2-based sensor sensitive towards abroad range of reducing gases. At first, we characterized theunimpaired sensor. The measurements were carried out intemperature-cycled operation with the Agilent 4294A, andthe FoBIS system. To enable temperature-cycled operationwith the Agilent 4294A, we implemented the temperaturecycle shown in Fig. 4, consisting of six equidistant temper-ature steps between 200 and 450◦C, with lengths of 30 s(200◦C) and 18 s (all others). The impedance analyzer Ag-ilent 4294A requires 10.8 s to record one impedance spec-trum with a range from 200 Hz to 110 MHz with 201 sup-porting points with logarithmic distribution at the second-highest precision available (“measurement bandwidth”= 4).Acquisition of the impedance spectra was triggered 5 s af-ter each temperature change, when the sensor has almostreached a steady state (the impedance relaxation induced bythe temperature change is mostly complete, cf. Fig. 7). Af-ter these initial characterization measurements, the sensorwas exposed to 70 ppm HMDSO for 10 min in temperature-cycled operation. After this poisoning, the characterizationmeasurements were repeated. Figures 5 and 6 show a sectionof the characterization measurements carried out before and
www.j-sens-sens-syst.net/3/213/2014/ J. Sens. Sens. Syst., 3, 213–221, 2014
216 M. Schüler et al.: MOS gas sensor self-test using FoBIS
Figure 4. Temperature set points and timing of impedance mea-surements during temperature cycle.
after poisoning. The presented values are quasi-static sen-sor responses, i.e., sensor response values which were ac-quired at defined time/temperature points within the temper-ature profile. The sensor response is defined as follows:
S =|Zair|
|Zgas|− 1, (4)
where|Zair| is the magnitude of the impedance in air, ac-quired for each temperature in the first temperature cycle,and|Zgas| is the impedance value at a given time during themeasurement.
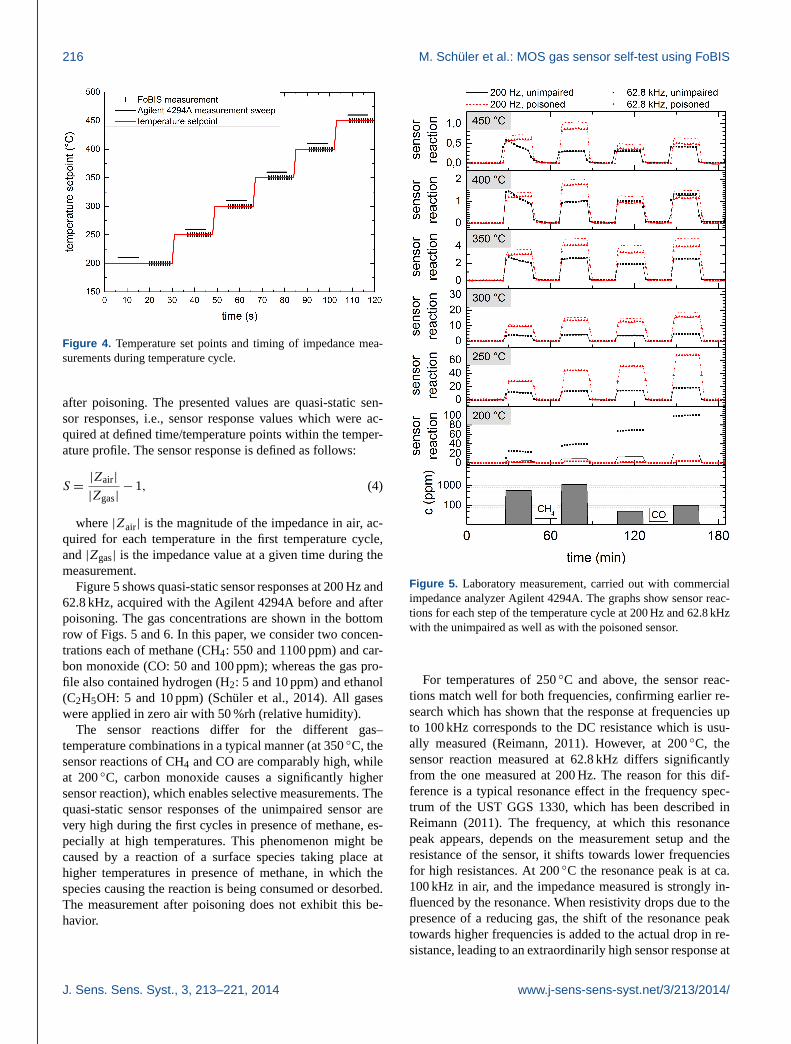
Figure 5 shows quasi-static sensor responses at 200 Hz and62.8 kHz, acquired with the Agilent 4294A before and afterpoisoning. The gas concentrations are shown in the bottomrow of Figs. 5 and 6. In this paper, we consider two concen-trations each of methane (CH4: 550 and 1100 ppm) and car-bon monoxide (CO: 50 and 100 ppm); whereas the gas pro-file also contained hydrogen (H2: 5 and 10 ppm) and ethanol(C2H5OH: 5 and 10 ppm) (Schüler et al., 2014). All gaseswere applied in zero air with 50 %rh (relative humidity).
The sensor reactions differ for the different gas–temperature combinations in a typical manner (at 350◦C, thesensor reactions of CH4 and CO are comparably high, whileat 200◦C, carbon monoxide causes a significantly highersensor reaction), which enables selective measurements. Thequasi-static sensor responses of the unimpaired sensor arevery high during the first cycles in presence of methane, es-pecially at high temperatures. This phenomenon might becaused by a reaction of a surface species taking place athigher temperatures in presence of methane, in which thespecies causing the reaction is being consumed or desorbed.The measurement after poisoning does not exhibit this be-havior.
Figure 5. Laboratory measurement, carried out with commercialimpedance analyzer Agilent 4294A. The graphs show sensor reac-tions for each step of the temperature cycle at 200 Hz and 62.8 kHzwith the unimpaired as well as with the poisoned sensor.
For temperatures of 250◦C and above, the sensor reac-tions match well for both frequencies, confirming earlier re-search which has shown that the response at frequencies upto 100 kHz corresponds to the DC resistance which is usu-ally measured (Reimann, 2011). However, at 200◦C, thesensor reaction measured at 62.8 kHz differs significantlyfrom the one measured at 200 Hz. The reason for this dif-ference is a typical resonance effect in the frequency spec-trum of the UST GGS 1330, which has been described inReimann (2011). The frequency, at which this resonancepeak appears, depends on the measurement setup and theresistance of the sensor, it shifts towards lower frequenciesfor high resistances. At 200◦C the resonance peak is at ca.100 kHz in air, and the impedance measured is strongly in-fluenced by the resonance. When resistivity drops due to thepresence of a reducing gas, the shift of the resonance peaktowards higher frequencies is added to the actual drop in re-sistance, leading to an extraordinarily high sensor response at
J. Sens. Sens. Syst., 3, 213–221, 2014 www.j-sens-sens-syst.net/3/213/2014/
M. Schüler et al.: MOS gas sensor self-test using FoBIS 217
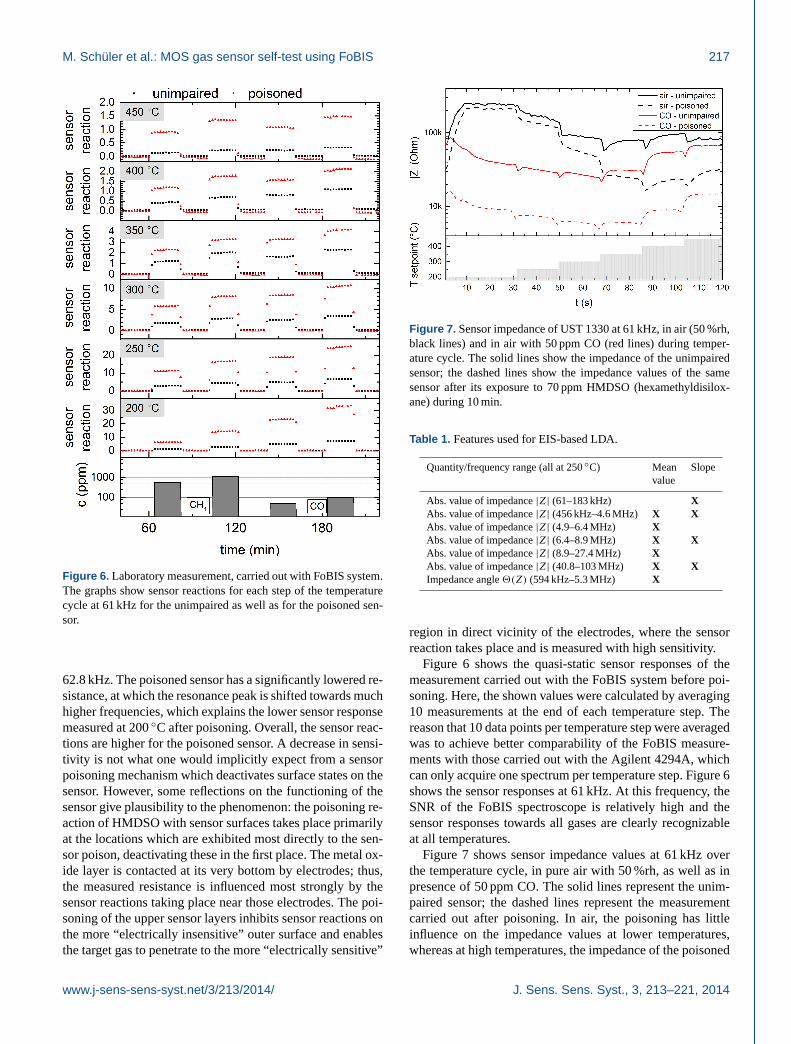
Figure 6. Laboratory measurement, carried out with FoBIS system.The graphs show sensor reactions for each step of the temperaturecycle at 61 kHz for the unimpaired as well as for the poisoned sen-sor.
62.8 kHz. The poisoned sensor has a significantly lowered re-sistance, at which the resonance peak is shifted towards muchhigher frequencies, which explains the lower sensor responsemeasured at 200◦C after poisoning. Overall, the sensor reac-tions are higher for the poisoned sensor. A decrease in sensi-tivity is not what one would implicitly expect from a sensorpoisoning mechanism which deactivates surface states on thesensor. However, some reflections on the functioning of thesensor give plausibility to the phenomenon: the poisoning re-action of HMDSO with sensor surfaces takes place primarilyat the locations which are exhibited most directly to the sen-sor poison, deactivating these in the first place. The metal ox-ide layer is contacted at its very bottom by electrodes; thus,the measured resistance is influenced most strongly by thesensor reactions taking place near those electrodes. The poi-soning of the upper sensor layers inhibits sensor reactions onthe more “electrically insensitive” outer surface and enablesthe target gas to penetrate to the more “electrically sensitive”
Figure 7. Sensor impedance of UST 1330 at 61 kHz, in air (50 %rh,black lines) and in air with 50 ppm CO (red lines) during temper-ature cycle. The solid lines show the impedance of the unimpairedsensor; the dashed lines show the impedance values of the samesensor after its exposure to 70 ppm HMDSO (hexamethyldisilox-ane) during 10 min.
Table 1. Features used for EIS-based LDA.
Quantity/frequency range (all at 250◦C) Mean Slopevalue
Abs. value of impedance|Z| (61–183 kHz) XAbs. value of impedance|Z| (456 kHz–4.6 MHz) X XAbs. value of impedance|Z| (4.9–6.4 MHz) XAbs. value of impedance|Z| (6.4–8.9 MHz) X XAbs. value of impedance|Z| (8.9–27.4 MHz) XAbs. value of impedance|Z| (40.8–103 MHz) X XImpedance angle2(Z) (594 kHz–5.3 MHz) X
region in direct vicinity of the electrodes, where the sensorreaction takes place and is measured with high sensitivity.
Figure 6 shows the quasi-static sensor responses of themeasurement carried out with the FoBIS system before poi-soning. Here, the shown values were calculated by averaging10 measurements at the end of each temperature step. Thereason that 10 data points per temperature step were averagedwas to achieve better comparability of the FoBIS measure-ments with those carried out with the Agilent 4294A, whichcan only acquire one spectrum per temperature step. Figure 6shows the sensor responses at 61 kHz. At this frequency, theSNR of the FoBIS spectroscope is relatively high and thesensor responses towards all gases are clearly recognizableat all temperatures.
Figure 7 shows sensor impedance values at 61 kHz overthe temperature cycle, in pure air with 50 %rh, as well as inpresence of 50 ppm CO. The solid lines represent the unim-paired sensor; the dashed lines represent the measurementcarried out after poisoning. In air, the poisoning has littleinfluence on the impedance values at lower temperatures,whereas at high temperatures, the impedance of the poisoned
www.j-sens-sens-syst.net/3/213/2014/ J. Sens. Sens. Syst., 3, 213–221, 2014
218 M. Schüler et al.: MOS gas sensor self-test using FoBIS
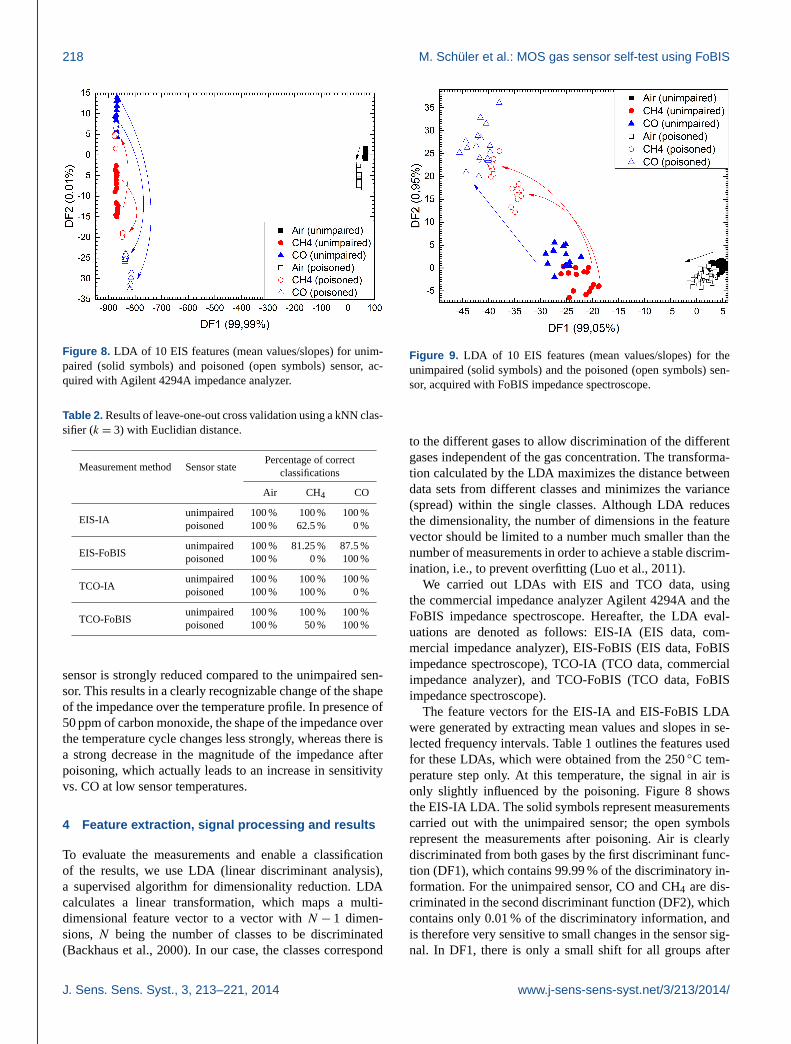
Figure 8. LDA of 10 EIS features (mean values/slopes) for unim-paired (solid symbols) and poisoned (open symbols) sensor, ac-quired with Agilent 4294A impedance analyzer.
Table 2. Results of leave-one-out cross validation using a kNN clas-sifier (k = 3) with Euclidian distance.
Measurement method Sensor statePercentage of correct
classifications
Air CH4 CO
EIS-IAunimpaired 100 % 100 % 100 %poisoned 100 % 62.5 % 0 %
EIS-FoBISunimpaired 100 % 81.25 % 87.5 %poisoned 100 % 0 % 100 %
TCO-IAunimpaired 100 % 100 % 100 %poisoned 100 % 100 % 0 %
TCO-FoBISunimpaired 100 % 100 % 100 %poisoned 100 % 50 % 100 %
sensor is strongly reduced compared to the unimpaired sen-sor. This results in a clearly recognizable change of the shapeof the impedance over the temperature profile. In presence of50 ppm of carbon monoxide, the shape of the impedance overthe temperature cycle changes less strongly, whereas there isa strong decrease in the magnitude of the impedance afterpoisoning, which actually leads to an increase in sensitivityvs. CO at low sensor temperatures.
4 Feature extraction, signal processing and results
To evaluate the measurements and enable a classificationof the results, we use LDA (linear discriminant analysis),a supervised algorithm for dimensionality reduction. LDAcalculates a linear transformation, which maps a multi-dimensional feature vector to a vector withN − 1 dimen-sions,N being the number of classes to be discriminated(Backhaus et al., 2000). In our case, the classes correspond
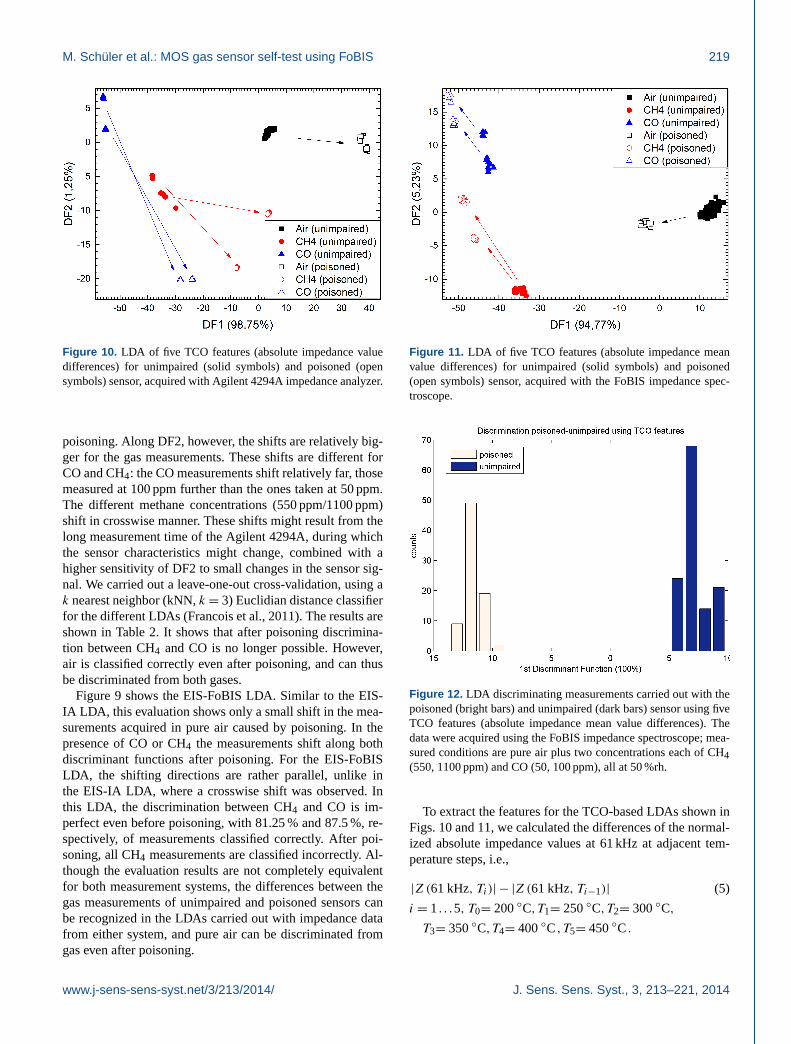
Figure 9. LDA of 10 EIS features (mean values/slopes) for theunimpaired (solid symbols) and the poisoned (open symbols) sen-sor, acquired with FoBIS impedance spectroscope.
to the different gases to allow discrimination of the differentgases independent of the gas concentration. The transforma-tion calculated by the LDA maximizes the distance betweendata sets from different classes and minimizes the variance(spread) within the single classes. Although LDA reducesthe dimensionality, the number of dimensions in the featurevector should be limited to a number much smaller than thenumber of measurements in order to achieve a stable discrim-ination, i.e., to prevent overfitting (Luo et al., 2011).
We carried out LDAs with EIS and TCO data, usingthe commercial impedance analyzer Agilent 4294A and theFoBIS impedance spectroscope. Hereafter, the LDA eval-uations are denoted as follows: EIS-IA (EIS data, com-mercial impedance analyzer), EIS-FoBIS (EIS data, FoBISimpedance spectroscope), TCO-IA (TCO data, commercialimpedance analyzer), and TCO-FoBIS (TCO data, FoBISimpedance spectroscope).
The feature vectors for the EIS-IA and EIS-FoBIS LDAwere generated by extracting mean values and slopes in se-lected frequency intervals. Table 1 outlines the features usedfor these LDAs, which were obtained from the 250◦C tem-perature step only. At this temperature, the signal in air isonly slightly influenced by the poisoning. Figure 8 showsthe EIS-IA LDA. The solid symbols represent measurementscarried out with the unimpaired sensor; the open symbolsrepresent the measurements after poisoning. Air is clearlydiscriminated from both gases by the first discriminant func-tion (DF1), which contains 99.99 % of the discriminatory in-formation. For the unimpaired sensor, CO and CH4 are dis-criminated in the second discriminant function (DF2), whichcontains only 0.01 % of the discriminatory information, andis therefore very sensitive to small changes in the sensor sig-nal. In DF1, there is only a small shift for all groups after
J. Sens. Sens. Syst., 3, 213–221, 2014 www.j-sens-sens-syst.net/3/213/2014/
M. Schüler et al.: MOS gas sensor self-test using FoBIS 219
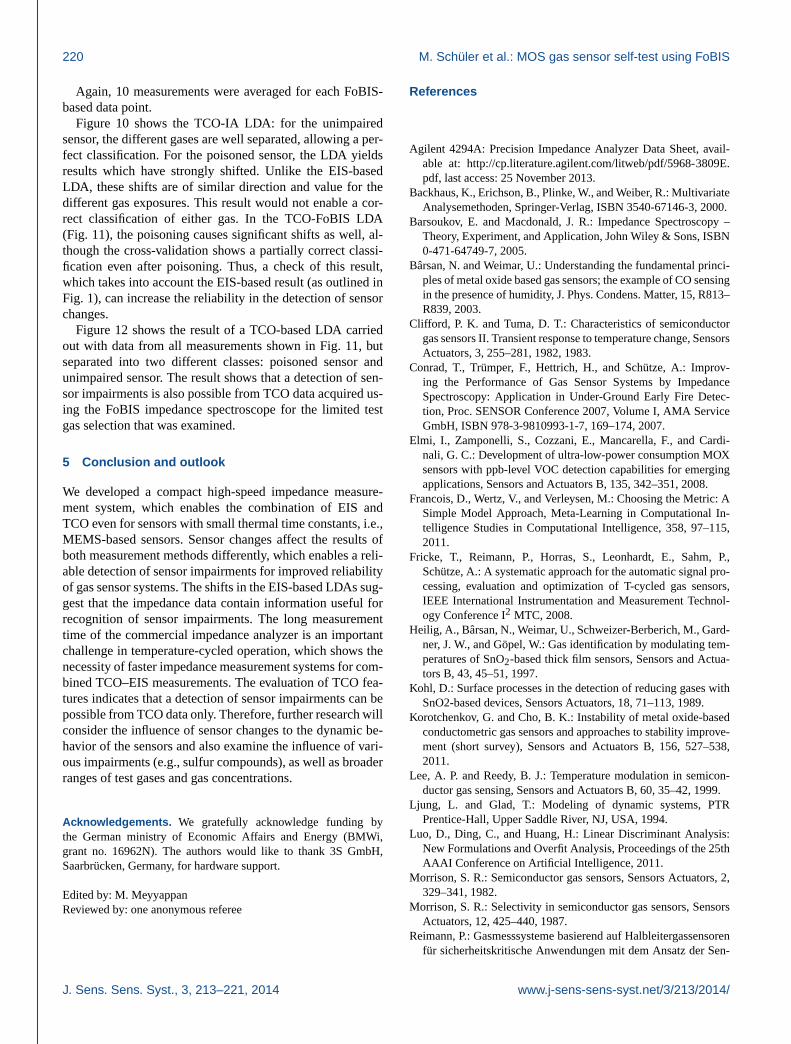
Figure 10. LDA of five TCO features (absolute impedance valuedifferences) for unimpaired (solid symbols) and poisoned (opensymbols) sensor, acquired with Agilent 4294A impedance analyzer.
poisoning. Along DF2, however, the shifts are relatively big-ger for the gas measurements. These shifts are different forCO and CH4: the CO measurements shift relatively far, thosemeasured at 100 ppm further than the ones taken at 50 ppm.The different methane concentrations (550 ppm/1100 ppm)shift in crosswise manner. These shifts might result from thelong measurement time of the Agilent 4294A, during whichthe sensor characteristics might change, combined with ahigher sensitivity of DF2 to small changes in the sensor sig-nal. We carried out a leave-one-out cross-validation, using ak nearest neighbor (kNN,k = 3) Euclidian distance classifierfor the different LDAs (Francois et al., 2011). The results areshown in Table 2. It shows that after poisoning discrimina-tion between CH4 and CO is no longer possible. However,air is classified correctly even after poisoning, and can thusbe discriminated from both gases.
Figure 9 shows the EIS-FoBIS LDA. Similar to the EIS-IA LDA, this evaluation shows only a small shift in the mea-surements acquired in pure air caused by poisoning. In thepresence of CO or CH4 the measurements shift along bothdiscriminant functions after poisoning. For the EIS-FoBISLDA, the shifting directions are rather parallel, unlike inthe EIS-IA LDA, where a crosswise shift was observed. Inthis LDA, the discrimination between CH4 and CO is im-perfect even before poisoning, with 81.25 % and 87.5 %, re-spectively, of measurements classified correctly. After poi-soning, all CH4 measurements are classified incorrectly. Al-though the evaluation results are not completely equivalentfor both measurement systems, the differences between thegas measurements of unimpaired and poisoned sensors canbe recognized in the LDAs carried out with impedance datafrom either system, and pure air can be discriminated fromgas even after poisoning.
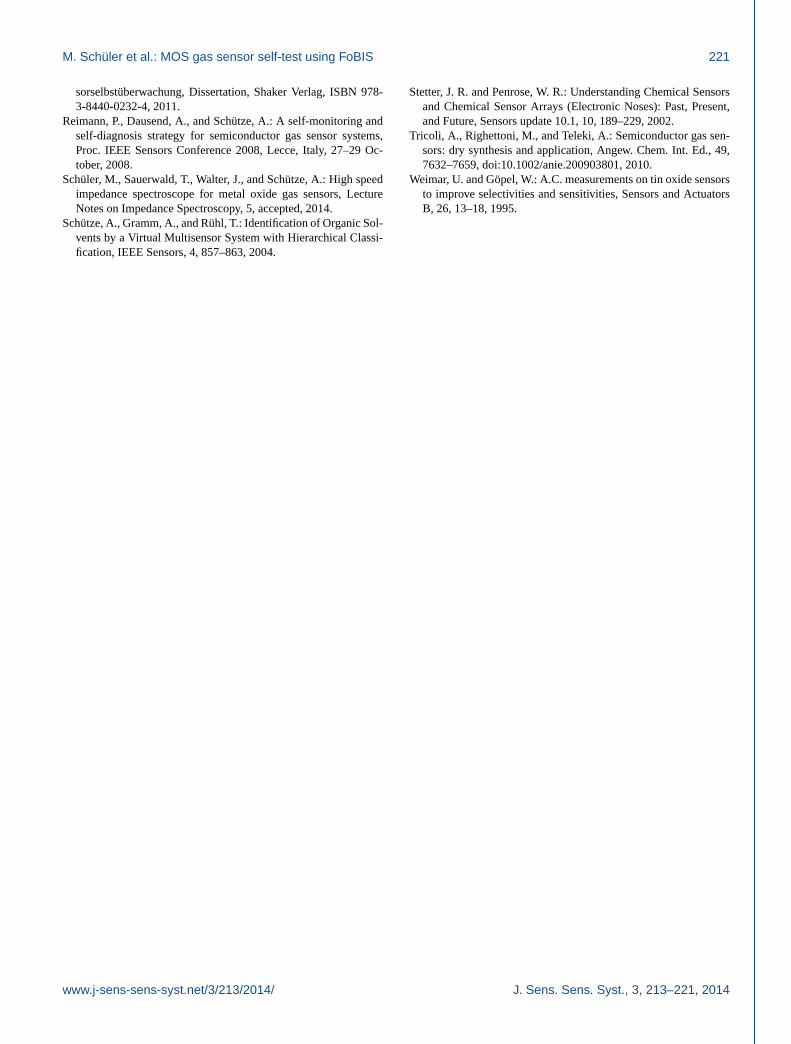
Figure 11. LDA of five TCO features (absolute impedance meanvalue differences) for unimpaired (solid symbols) and poisoned(open symbols) sensor, acquired with the FoBIS impedance spec-troscope.
Figure 12. LDA discriminating measurements carried out with thepoisoned (bright bars) and unimpaired (dark bars) sensor using fiveTCO features (absolute impedance mean value differences). Thedata were acquired using the FoBIS impedance spectroscope; mea-sured conditions are pure air plus two concentrations each of CH4(550, 1100 ppm) and CO (50, 100 ppm), all at 50 %rh.
To extract the features for the TCO-based LDAs shown inFigs. 10 and 11, we calculated the differences of the normal-ized absolute impedance values at 61 kHz at adjacent tem-perature steps, i.e.,
|Z(61 kHz, Ti)| − |Z(61 kHz, Ti−1)| (5)
i = 1. . .5, T0= 200◦C,T1= 250◦C,T2= 300◦C,
T3= 350◦C,T4= 400◦C,T5= 450◦C.
www.j-sens-sens-syst.net/3/213/2014/ J. Sens. Sens. Syst., 3, 213–221, 2014
220 M. Schüler et al.: MOS gas sensor self-test using FoBIS
Again, 10 measurements were averaged for each FoBIS-based data point.
Figure 10 shows the TCO-IA LDA: for the unimpairedsensor, the different gases are well separated, allowing a per-fect classification. For the poisoned sensor, the LDA yieldsresults which have strongly shifted. Unlike the EIS-basedLDA, these shifts are of similar direction and value for thedifferent gas exposures. This result would not enable a cor-rect classification of either gas. In the TCO-FoBIS LDA(Fig. 11), the poisoning causes significant shifts as well, al-though the cross-validation shows a partially correct classi-fication even after poisoning. Thus, a check of this result,which takes into account the EIS-based result (as outlined inFig. 1), can increase the reliability in the detection of sensorchanges.
Figure 12 shows the result of a TCO-based LDA carriedout with data from all measurements shown in Fig. 11, butseparated into two different classes: poisoned sensor andunimpaired sensor. The result shows that a detection of sen-sor impairments is also possible from TCO data acquired us-ing the FoBIS impedance spectroscope for the limited testgas selection that was examined.
5 Conclusion and outlook
We developed a compact high-speed impedance measure-ment system, which enables the combination of EIS andTCO even for sensors with small thermal time constants, i.e.,MEMS-based sensors. Sensor changes affect the results ofboth measurement methods differently, which enables a reli-able detection of sensor impairments for improved reliabilityof gas sensor systems. The shifts in the EIS-based LDAs sug-gest that the impedance data contain information useful forrecognition of sensor impairments. The long measurementtime of the commercial impedance analyzer is an importantchallenge in temperature-cycled operation, which shows thenecessity of faster impedance measurement systems for com-bined TCO–EIS measurements. The evaluation of TCO fea-tures indicates that a detection of sensor impairments can bepossible from TCO data only. Therefore, further research willconsider the influence of sensor changes to the dynamic be-havior of the sensors and also examine the influence of vari-ous impairments (e.g., sulfur compounds), as well as broaderranges of test gases and gas concentrations.
Acknowledgements. We gratefully acknowledge funding bythe German ministry of Economic Affairs and Energy (BMWi,grant no. 16962N). The authors would like to thank 3S GmbH,Saarbrücken, Germany, for hardware support.
Edited by: M. MeyyappanReviewed by: one anonymous referee
References
Agilent 4294A: Precision Impedance Analyzer Data Sheet, avail-able at: http://cp.literature.agilent.com/litweb/pdf/5968-3809E.pdf, last access: 25 November 2013.
Backhaus, K., Erichson, B., Plinke, W., and Weiber, R.: MultivariateAnalysemethoden, Springer-Verlag, ISBN 3540-67146-3, 2000.
Barsoukov, E. and Macdonald, J. R.: Impedance Spectroscopy –Theory, Experiment, and Application, John Wiley & Sons, ISBN0-471-64749-7, 2005.
Bârsan, N. and Weimar, U.: Understanding the fundamental princi-ples of metal oxide based gas sensors; the example of CO sensingin the presence of humidity, J. Phys. Condens. Matter, 15, R813–R839, 2003.
Clifford, P. K. and Tuma, D. T.: Characteristics of semiconductorgas sensors II. Transient response to temperature change, SensorsActuators, 3, 255–281, 1982, 1983.
Conrad, T., Trümper, F., Hettrich, H., and Schütze, A.: Improv-ing the Performance of Gas Sensor Systems by ImpedanceSpectroscopy: Application in Under-Ground Early Fire Detec-tion, Proc. SENSOR Conference 2007, Volume I, AMA ServiceGmbH, ISBN 978-3-9810993-1-7, 169–174, 2007.
Elmi, I., Zamponelli, S., Cozzani, E., Mancarella, F., and Cardi-nali, G. C.: Development of ultra-low-power consumption MOXsensors with ppb-level VOC detection capabilities for emergingapplications, Sensors and Actuators B, 135, 342–351, 2008.
Francois, D., Wertz, V., and Verleysen, M.: Choosing the Metric: ASimple Model Approach, Meta-Learning in Computational In-telligence Studies in Computational Intelligence, 358, 97–115,2011.
Fricke, T., Reimann, P., Horras, S., Leonhardt, E., Sahm, P.,Schütze, A.: A systematic approach for the automatic signal pro-cessing, evaluation and optimization of T-cycled gas sensors,IEEE International Instrumentation and Measurement Technol-ogy Conference I2 MTC, 2008.
Heilig, A., Bârsan, N., Weimar, U., Schweizer-Berberich, M., Gard-ner, J. W., and Göpel, W.: Gas identification by modulating tem-peratures of SnO2-based thick film sensors, Sensors and Actua-tors B, 43, 45–51, 1997.
Kohl, D.: Surface processes in the detection of reducing gases withSnO2-based devices, Sensors Actuators, 18, 71–113, 1989.
Korotchenkov, G. and Cho, B. K.: Instability of metal oxide-basedconductometric gas sensors and approaches to stability improve-ment (short survey), Sensors and Actuators B, 156, 527–538,2011.
Lee, A. P. and Reedy, B. J.: Temperature modulation in semicon-ductor gas sensing, Sensors and Actuators B, 60, 35–42, 1999.
Ljung, L. and Glad, T.: Modeling of dynamic systems, PTRPrentice-Hall, Upper Saddle River, NJ, USA, 1994.
Luo, D., Ding, C., and Huang, H.: Linear Discriminant Analysis:New Formulations and Overfit Analysis, Proceedings of the 25thAAAI Conference on Artificial Intelligence, 2011.
Morrison, S. R.: Semiconductor gas sensors, Sensors Actuators, 2,329–341, 1982.
Morrison, S. R.: Selectivity in semiconductor gas sensors, SensorsActuators, 12, 425–440, 1987.
Reimann, P.: Gasmesssysteme basierend auf Halbleitergassensorenfür sicherheitskritische Anwendungen mit dem Ansatz der Sen-
J. Sens. Sens. Syst., 3, 213–221, 2014 www.j-sens-sens-syst.net/3/213/2014/
M. Schüler et al.: MOS gas sensor self-test using FoBIS 221
sorselbstüberwachung, Dissertation, Shaker Verlag, ISBN 978-3-8440-0232-4, 2011.
Reimann, P., Dausend, A., and Schütze, A.: A self-monitoring andself-diagnosis strategy for semiconductor gas sensor systems,Proc. IEEE Sensors Conference 2008, Lecce, Italy, 27–29 Oc-tober, 2008.
Schüler, M., Sauerwald, T., Walter, J., and Schütze, A.: High speedimpedance spectroscope for metal oxide gas sensors, LectureNotes on Impedance Spectroscopy, 5, accepted, 2014.
Schütze, A., Gramm, A., and Rühl, T.: Identification of Organic Sol-vents by a Virtual Multisensor System with Hierarchical Classi-fication, IEEE Sensors, 4, 857–863, 2004.
Stetter, J. R. and Penrose, W. R.: Understanding Chemical Sensorsand Chemical Sensor Arrays (Electronic Noses): Past, Present,and Future, Sensors update 10.1, 10, 189–229, 2002.
Tricoli, A., Righettoni, M., and Teleki, A.: Semiconductor gas sen-sors: dry synthesis and application, Angew. Chem. Int. Ed., 49,7632–7659, doi:10.1002/anie.200903801, 2010.
Weimar, U. and Göpel, W.: A.C. measurements on tin oxide sensorsto improve selectivities and sensitivities, Sensors and ActuatorsB, 26, 13–18, 1995.
www.j-sens-sens-syst.net/3/213/2014/ J. Sens. Sens. Syst., 3, 213–221, 2014