Metal Oxide Materials and Collector Efficiency in...
84
Defence R&D Canada – Atlantic DEFENCE DÉFENSE & Metal Oxide Materials and Collector Efficiency in Electrochemical Supercapacitors: First Annual Report Gwenaël Chamouland and Daniel Bélanger Université du Québec à Montréal Université du Québec à Montréal Département de chimie CP 8888, Succ. Centre-Ville Montréal (Québec) H3C 3P8 Project Manager: Colin G. Cameron, 902-427-1367 Contract Number: W7707-063348/001/HAL Contract Scientific Authority: Colin G. Cameron, 902-427-1367 The scientific or technical validity of this Contract Report is entirely the responsibility of the contractor and the contents do not necessarily have the approval or endorsement of Defence R&D Canada. Contract Report DRDC Atlantic CR 2007-233 October 2007 Copy No. _____ Defence Research and Development Canada Recherche et développement pour la défense Canada
Transcript of Metal Oxide Materials and Collector Efficiency in...

Defence R&D Canada – Atlantic
DEFENCE DÉFENSE&
Metal Oxide Materials and Collector
Efficiency in Electrochemical
Supercapacitors: First Annual Report
Gwenaël Chamouland and Daniel BélangerUniversité du Québec à Montréal
Université du Québec à MontréalDépartement de chimieCP 8888, Succ. Centre-Ville Montréal (Québec) H3C 3P8
Project Manager: Colin G. Cameron, 902-427-1367
Contract Number: W7707-063348/001/HAL
Contract Scientific Authority: Colin G. Cameron, 902-427-1367
The scientific or technical validity of this Contract Report is entirely the responsibility of the contractor andthe contents do not necessarily have the approval or endorsement of Defence R&D Canada.
Contract Report
DRDC Atlantic CR 2007-233
October 2007
Copy No. _____
Defence Research andDevelopment Canada
Recherche et développementpour la défense Canada

This page intentionally left blank.

Metal Oxide Materials and Collector Efficiency in Electrochemical Supercapacitors: First Annual Report
Gwenaël Chamoulaud and Daniel Bélanger Université de Québec à Montréal Université de Québec à Montréal Département de chimie, CP 8888, Succ. Centre-ville Montréal, Québec H3C 3P8 Project Manager: Colin G. Cameron, 902-427-1367 Contract Number: W7707-063348 Contract Scientific Authority: Colin G. Cameron, 902-427-1367
The scientific or technical validity of this Contract Report is entirely the responsibility of the contractor and the contents do not necessarily have the approval or endorsement of Defence R&D Canada.
Defence R&D Canada – Atlantic
Contract Report
DRDC Atlantic CR 2007-233
October 2007

Approved by
Colin G. Cameron
Scientific Authority
Approved for release by
James L. Kennedy A/Chair, Document Review Panel
© Her Majesty the Queen in Right of Canada, as represented by the Minister of National Defence, 2008
© Sa Majesté la Reine (en droit du Canada), telle que représentée par le ministre de la Défense nationale, 2008
Original signed by Colin G. Cameron
Original signed by James L. Kennedy

DRDC Atlantic CR 2007-233 i
Abstract
This report deals with the development of electrochemical supercapacitors based on MnO2/RuO2 binary oxides and using titanium as the current collector. Nanostructured titanium electrodes with sufficient conductivity were obtained using several methods. We found that MnO2/RuO2 binary oxides cannot be electrodeposited on titanium without dramatically increasing the resistance of the electrode. An alternative for the preparation of MnO2/RuO2 binary oxides by the co-precipitation method was also investigated and is described in this report
Résumé
Ce rapport traite du développement de supercapacités électrochimiques basées sur des oxydes binaires de type MnO2/RuO2 et utilisant un collecteur de courant en titane. Des électrodes en titane nanostructurées, avec une conductivité satisfaisante ont été obtenues par différentes méthodes. Cependant, les oxydes binaires de type MnO2/RuO2 ne peuvent pas être électrodéposés simultanément sur le titane sans augmenter dramatiquement la résistance globale de l’électrode. Une alternative à la préparation des oxydes binaires de type MnO2/RuO2 par la méthode de co-précipitation a été également étudiée et est décrite dans ce rapport.

ii DRDC Atlantic CR 2007-233
This page intentionally left blank.

DRDC Atlantic CR 2007-233 iii
Executive summary
Metal Oxide Materials and Collector Efficiency in Electrochemical Supercapacitors: First Annual Report
Chamoulaud, G.; Bélanger D.; DRDC Atlantic CR 2007-233; Defence R&D Canada – Atlantic, October 2007
Introduction: The objective of this project is to develop supercapacitor electrode materials based on high surface area metal oxide materials and to optimize the interface between electrode materials and the current collector in order to improve equivalent series resistance. Nanostructured titanium substrates were used as the current collector due to their good stability in acidic media. Binary oxides such as MnO2/RuO2 were prepared in this work. RuO2 is characterized by excellent capacitive and charge storage properties and its use in conjunction with a low cost oxide such as MnO2 could lead to the development of materials with a better performance/cost ratio. The simultaneous electrodeposition of these oxides was investigated since a good electrical contact between the active material and the current collector could be achieved with this deposition technique.
Results: Nanostructured titania and titanium electrodes can be prepared by using several chemical and electrochemical treatments. The electrodeposition of RuO2 can be achieved on Ti but a dramatic increase of the electrode resistance is observed following the electrodeposition of MnO2. Accordingly, the simultaneous electrodeposition of MnO2 and RuO2 is not possible with the procedures that we have used so far. Therefore, binary MnO2/RuO2 were prepared by co-precipitation from corresponding metal salts.
Significance: Improvement of the electrical resistance of the current collector is an important aspect of maximizing supercapacitor performance. The use of inexpensive metal oxides offers the promise of more cost-effective devices.
Future plans: Future work will focus on the electrochemical characterization of the binary oxides synthesized by chemical precipitation. The current collector developed during the first year will be used.

iv DRDC Atlantic CR 2007-233
Sommaire
Metal Oxide Materials and Collector Efficiency in Electrochemical Supercapacitors:
Chamoulaud, G.; Bélanger D.; DRDC Atlantic CR 2007-233 ; R & D pour la défense Canada – Atlantique, October 2007
Introduction: L’objectif de ce projet était le développement de nouvelles supercapacités électrochimiques basées sur de nouveaux matériaux tout en améliorant la qualité de l’interface entre le matériau d’électrode et le collecteur de courant. Le titane, connu pour sa bonne stabilité en milieu aqueux acide a été envisagé pour le développement de collecteurs de courant nanostructurés (grande surface de contact). Les oxydes binaires de type MnO2/RuO2 ont été envisagés comme matériaux actifs. Le RuO2 est déjà connu pour posséder de très bonnes propriétés capacitives et l’utilisation simultanée de cet oxyde et d’un oxyde peu coûteux tel le MnO2 pourrait conduire à des matériaux présentant un meilleur rapport performance/coût. L’électrodéposition simultanée de ces deux oxydes, qui permet d’avoir un bon contact électrique entre le collecteur de courant et le matériau actif, a été envisagée
Résultats: Des électrodes nanostructurées en titane, avec des conductivités satisfaisantes, ont été obtenues à l’aide de différentes méthodes de texturation (dissolution et croissance de nanotubes d’oxydes de titane). L’électrodéposition sur le titane de RuO2 est possible. Cependant, pour MnO2, celle-ci conduit à une augmentation dramatique de la résistance du collecteur de courant. L’électrodéposition simultanée de RuO2 et MnO2 sur le titane n’étant pas envisageable, une alternative, la préparation des oxydes binaires de type MnO2/RuO2 par co-précipitation a été étudiée.
Importance: L’amélioration de la résistance électrique du collecteur de courant est très important pour maximiser le performance des supercondensateurs. En plus, les oxydes moins chers offrent la possibilité des dispositifs peu coûteux.
Perspectives: Les prochains travaux seront axés sur la caractérisation des oxydes binaires MnO2/RuO2 formés par co-précipitation ainsi que l’étude de leurs propriétés électrochimiques en utilisant les collecteurs de courant développés lors de la première année.

DRDC Atlantic CR 2007-233 v
Table of contents
Abstract ............................................................................................................................................ i
Résumé ............................................................................................................................................. i
Executive summary ........................................................................................................................ iii
Sommaire........................................................................................................................................ iv
Table of contents ............................................................................................................................. v
List of figures ................................................................................................................................ vii
List of tables .................................................................................................................................... x
1 Introduction............................................................................................................................... 1
2 Titanium current collector ........................................................................................................ 2
2.1 Effect of polishing ......................................................................................................... 2
2.2 Effect of electrochemical reduction............................................................................... 5
2.3 Electrochemical reduction in acetonitrile ...................................................................... 8
3 Nanostructured titania and titanium........................................................................................ 10
3.1 Titanium electrode modification protocols.................................................................. 11
3.1.1 Titanium electrode polishing......................................................................... 11
3.1.2 Electrode modification .................................................................................. 11
3.1.3 Electrochemical Impedance Spectroscopy (EIS) .......................................... 12
3.1.4 Electrochemical reduction in acetonitrile...................................................... 13
3.1.5 Scanning electron microscopy (SEM) and energy dispersive X-ray (EDX) analyses ............................................................................................. 13
3.1.6 Results and discussion................................................................................... 14
3.1.6.1 Unmodified titanium (polished electrode).................................. 14
3.1.6.2 Titanium H2O2 etching ............................................................... 15
3.1.6.3 Titanium oxidation in NaOH...................................................... 16
3.1.6.4 Anodic dissolution of titanium ................................................... 18
3.1.6.5 Cathodic deposition from a TiClO4/acetonitrile solution ........... 20
3.1.6.6 Electrodeposition from a TiF4 / acetonitrile solution.................. 22
3.1.6.7 TiO2 nanotubes formation........................................................... 23
3.1.6.8 Conclusions ................................................................................ 25
3.2 Electrodeposition of titanium nanorods....................................................................... 26
3.2.1 Electrodeposition in acetonitrile media......................................................... 26
3.2.2 Cyclic voltammetry study ............................................................................. 29
3.3 Conclusions ................................................................................................................. 31
4 Syntheses of RuO2/MnO2 material ......................................................................................... 32
4.1 Electrodeposition of RuO2 and MnO2 on titanium ...................................................... 32
4.1.1 RuOy.nH2O electrodeposition ....................................................................... 32
4.1.2 MnO2 electrodeposition ................................................................................ 34

vi DRDC Atlantic CR 2007-233
4.1.3 Conclusion and Perspectives......................................................................... 36
4.2 Co-precipitation of RuO2 and MnO2 ........................................................................... 36
4.2.1 Preliminary studies........................................................................................ 37
4.2.1.1 Single salt solutions .................................................................... 37
4.2.1.2 Salt mixture solution................................................................... 38
4.2.1.3 Co-precipitation in acidic and alkaline solutions........................ 40
4.2.2 MnO2, RuOy.n(H2O) and binary oxides powder syntheses ........................... 41
4.2.3 Mn/Ru oxides characterization ..................................................................... 42
4.2.3.1 X-ray diffraction analyses (XRD) .............................................. 42
4.2.3.2 Scanning electron microscopy (SEM) and energy dispersive X-ray (EDX) analyses. ............................................................... 44
4.2.3.3 Thermogravimetric and Differential thermal analyses (TGA / DTA)........................................................................................... 48
4.2.4 Conclusions and perspectives ....................................................................... 51
References ..................................................................................................................................... 52
Annex A Nyquist diagrams ........................................................................................................... 55
A.1 Polished titanium electrode.............................................................................................. 55
A.2 Titanium electrode modified by H2O2 / (NH4)2HPO4. ..................................................... 56
A.3 Titanium electrode modified by NaOH aqueous solution................................................ 57
A.4 Titanium electrode modified by electrodissolution of Ti................................................. 58
A.5 Titanium electrode modified by electrodeposition from a TiClO4/acetonitrile solution. ....................................................................................................................... 59
A.6 Titanium electrode modified by electrodeposition from a TiF4/acetonitrile solution. ..... 60
A.7 Titanium electrode modified by NH4HF2 / NH4H2PO4. ................................................... 61
List of symbols/abbreviations/acronyms/initialisms ..................................................................... 62
Distribution List ............................................................................................................................ 63

DRDC Atlantic CR 2007-233 vii
List of figures
Figure 1 : Nyquist diagrams of TiO2 raw, polished and polished and sonicated electrodes in 1M HCl / 0.5M NaCl aqueous media............................................................................ 3
Figure 2: Equivalent circuit of TiO2 passive layer on polished titanium electrode. ........................ 3
Figure 3 : Change with time of the Nyquist diagrams of polished and sonicated TiO2 electrodes in 1M HCl / 0.5M NaCl aqueous media. ..................................................... 4
Figure 4 : Nyquist diagrams of polished TiO2 electrodes with and without electrochemical pre-treatment at -0.5 V vs. Ag/AgCl for 5 minutes and by cyclic voltammetry between 0.25 and -1.0V vs Ag/AgCl recorded at 200mV.s-1 in 1M HCl / 0.5M NaCl aqueous media. .................................................................................................... 6
Figure 5 : Change with time of the Nyquist diagrams of a successively polished, sonicated and electrochemically reduced TiO2 electrodes in 1M HCl / 0.5M NaCl aqueous media. ............................................................................................................................ 7
Figure 6: Effects of applied potential upon the Nyquist diagrams of polished titanium electrodes in 0.1 M TEATFB / acetonitrile solution. .................................................... 8
Figure 7 : Polished titanium electrode resistance estimated by electrochemical impedance spectroscopy as function of the applied potential vs. Ag/AgCl. ................................... 9
Figure 8 : Electrochemical impedance fitting model for titanium electrodes with one oxide layer possessing a significant roughness. .................................................................... 13
Figure 9 : SEM of a polished titanium electrode at A) x5K and B) x20k magnification. ............. 14
Figure 10 : Titanium electrodes modified by chemical reaction in 1.5 M H2O2 / 2.5 M (NH4)2HPO4 aqueous solution at 70°C for 1 h for A) x1k and B) x20 magnification and for C) x50k magnification with an angle of 45°. Photomicrograph D) represents the same electrode after electrochemical reduction in LiClO4 / acetonitrile media for 25k magnification. ................................................. 15
Figure 11 : Titanium electrodes modified by chemical reaction in 10 M NaOH aqueous solution at 110°C for 20 h for A) x3k (region 1), B) x5K (region 2) and C) x50k magnification (region 2) and after electrochemical reduction in LiClO4 / acetonitrile media for D) x3K magnification. ............................................... 17
Figure 12 : Titanium electrodes modified by electrodissolution of Ti at +2.5 V vs Ag/AgCl for 1 h in 0.1M LiClO4 / acetonitrile solution A) x200 magnification and after electrochemical reduction treatment in LiClO4 / acetonitrile B) x200 magnification, C) x40 magnification and D) x20k magnification (non corroded area)............................................................................................................................. 19
Figure 13 : Titanium electrodes modified by electrodeposition of Ti from a TiClO4 / 0.1M LiClO4 acetonitrile solution at -2.5 V vs Ag/AgCl for 1 h, A) x20k magnification (taken with an angle of 45°) and after electrochemical reduction treatment in LiClO4 / acetonitrile media B) x30k magnification..................................................... 21

viii DRDC Atlantic CR 2007-233
Figure 14 : Titanium electrodes modified by electrodeposition of Ti from a 25 mM TiF4 / acetonitrile solution at -2.5 V vs Ag/AgCl for 1 h A) 50k magnification with an angle of 45° and after electrochemical reduction treatment in LiClO4 / acetonitrile media B) x50k magnification and C) x6k magnification. .......... 22
Figure 15 : Titanium electrodes modified by potentiostatic polarisation at +20 V for 6 h in NH4HF2/NH4H2PO4 aqueous solution A) x50k magnification and after electrochemical reduction treatment in LiClO4 / acetonitrile B) x50k magnification, C) x10k magnification and D) x60k magnification taken with an angle of 45°. ................................................................................................................ 24
Figure 16 : Electrochemical cell used for the electrodeposition of titanium nanorods. ................ 26
Figure 17: Potential steps used for the electrodeposition of titanium nanorods from TiCl4 / ACN solution................................................................................................... 27
Figure 18 : SEM of A) polished titanium electrode at x40K magnification, B) AAO membrane (side in contact with the titanium electrode) at x20k magnification, and titanium electrodes after C) 1h and D) 4h of electrodeposition from TiCl4 / ACN solutions at x40K magnification. ................................................................................ 28
Figure 19 : Cyclic voltammograms of polished titanium electrode recorded at 50 mV/s in 0.1 M LiClO4 a) acetonitrile, b) DMF and c) DMSO media with (____) and without (. . . .) 5 mM TiF4 salt. ................................................................................................... 30
Figure 20 : Cyclic voltammograms of polished titanium electrode recorded at 50 mV/s in 5mM RuCl3 / 10mM HCl / 0.1M KCl aqueous media (pH = 2) at 85ºC. ................... 32
Figure 21 : Cyclic voltammograms of (. . . .) freshly polished and (____) RuOy.nH2O modified titanium electrodes recorded at 20 mV/s in 0.5M H2SO4 aqueous solution at 25ºC (5th cycle)..................................................................................................................... 33
Figure 22 : Typical cyclic voltammograms of (. . . .) freshly polished and (____) MnO2 modified titanium electrodes recorded at 20 mV/s in 0.5M H2SO4 aqueous solution at 25ºC (5th first cycles)........................................................................................................... 35
Figure 23 : Typical cyclic voltammograms of (. . . .) freshly polished and (____) MnO2 modified titanium electrodes recorded at 5 mV/s in 0.65M K2SO4 aqueous solution at 25ºC. .. 36
Figure 24 : Change with time of UV-visible spectra of 1M NaOH aqueous solutions containing a) 0.5mM KMnO4 and b) 0.5mM RuCl3. ................................................. 39
Figure 25 : UV-visible spectra of 0.5mM KMnO4/RuCl3 + 1M NaOH aqueous solutions a) containing different proportions of RuCl3 0 minutes and b) with an Mn/Ru atomic ratio of 3/2 for 0, 5, 10 and 10 minutes. ...................................................................... 40
Figure 26 : MnO2, RuOynH2O and Mn/Ru oxides prepared by precipitation and co-precipitation of 10mM KMnO4 and RuCl3 salts. X-ray diffraction spectra of a) MnO2, b) RuOynH2O, c) sample 1, d) sample 2 and e) sample 3................................ 43
Figure 27 : Mn/Ru oxides prepared by co-precipitation of 10mM KMnO4 and RuCl3 salts in 1M NaOH (rapid mixing) with subsequent addition of 1M HCl (sample 1). Photomicrographs of Mn/Ru oxides for A) x1.2k, B) x90k, C) x100k and D) x150k magnification.................................................................................................... 44

DRDC Atlantic CR 2007-233 ix
Figure 28 : Mn/Ru oxides prepared by co-precipitation of 10mM KMnO4 and RuCl3 salts in 1M NaOH (dropwise mixing) with subsequent addition of 1M HCl (sample 2). Photomicrographs obtained for A) x700, B) x45k, C) x100k and D) x150k magnification............................................................................................................... 46
Figure 29 : Mn/Ru oxides prepared by co-precipitation of 10mM KMnO4 and RuCl3 salts in 1M HCl (dropwise mixing) with subsequent addition of 1M NaOH (sample 3). Photomicrographs obtained for A) x2.0k, B) x25k, C) x35k and D) x50k magnification............................................................................................................... 47
Figure 30 : a) Thermogravimetric and b) differential thermogravimetric curves of MnO2, RuO2 and MnO2/RuO2 powders: sample 1 (rapid mixing in NaOH), sample 2 (dropwise mixing in NaOH) and sample 3 (dropwise mixing in HCl) powders......... 49
Figure 31 : a) Differential thermal analysis and b) derivative differential thermal analysis curves of MnO2, RuO2 and MnO2/RuO2 powders: sample 1 (rapid mixing in NaOH), sample 2 (dropwise mixing in NaOH) and sample 3 (dropwise mixing in HCl) powders. ............................................................................................................. 50

x DRDC Atlantic CR 2007-233
List of tables
Table 1: Effect of polishing and sonication on TiO2 resistance and thickness................................ 4
Table 2: Effect of electroreduction on TiO2 resistance and thickness. ............................................ 6
Table 3 : Change with time of TiO2 electrodes open circuit potential, resistance, and layer thickness, after electroreduction.................................................................................... 7
Table 4 : Open-circuit potential, resistance and O/Ti ratio for polished titanium electrode, before and after the electrochemical reduction treatment in 0.1M LiClO4 / acetonitrile solution....................................................................................... 14
Table 5 : Open-circuit potential, resistance, and O/Ti atomic ratio for polished titanium electrodes modified by chemical reaction in 1.5 M H2O2 / 2.5 M (NH4)2HPO4 aqueous solution at 70°C for 1h, before and after the electrochemical reduction treatment in LiClO4 / acetonitrile media...................................................................... 16
Table 6 : Open-circuit potential, resistance, and O/Ti atomic ratio for polished titanium electrode modified by chemical reaction in 10 M NaOH aqueous solution at 110°C for 20 h, before and after the electrochemical reduction treatment in LiClO4/acetonitrile media. .......................................................................................... 18
Table 7 : Open-circuit potential, resistance, and O/Ti atomic ratio for titanium electrode modified by electrodissolution of Ti in TiClO4 at +2.5 V vs Ag/AgCl for 1 h in 0.1M LiClO4 / acetonitrile solution, before and after the electrochemical reduction treatment in LiClO4 / acetonitrile. ............................................................... 20
Table 8 : Open-circuit potential, resistance, and O/Ti atomic ratio for titanium electrodes modified by electrodeposition of Ti from a TiClO4 / 0.1M LiClO4 acetonitrile solution at -2.5 V vs Ag/AgCl for 1 h, before and after the electrochemical reduction treatment in LiClO4 / acetonitrile. ..................................... 21
Table 9 : Open-circuit potential, resistance, O/Ti and C/Ti atomic ratios for titanium electrodes modified by electrodeposition of Ti from a 25 mM TiF4 / acetonitrile solution at -2.5 V vs Ag/AgCl for 1 h, before and after the electrochemical reduction treatment in LiClO4 / acetonitrile. ............................................................... 23
Table 10 : Open-circuit potential, resistance and O/Ti atomic ratio for titanium electrode modified by potentiostatic polarization at +20 V for 6 h in NH4HF2 / NH4H2PO4 aqueous solution, before and after the electrochemical reduction treatment in LiClO4 / acetonitrile media...................................................... 25
Table 11 : Open-circuit potential, resistance, O/Ti and C/Ti atomic ratios for titanium electrodes modified by potentiostatic electrodeposition of Ti at -2.5V from a 25mM TiF4 / acetonitrile solution and modified by pulsed electrodeposition of Ti from a saturated TiF4 / acetonitrile solution for 1 h and 4 h........................................ 29
Table 12: Mn and Ru species formed from KMnO4, RuCl3 and mixture of KMnO4 + RuCl3 solution in HCl, NaCl and NaOH aqueous solutions and HCl and NaOH aqueous solutions with the addition of NaOH and HCl respectively. ....................................... 41

DRDC Atlantic CR 2007-233 xi
Table 13: Atomic composition of Mn/Ru oxides prepared by co-precipitation of 10mM KMnO4 and RuCl3 salts in 1M NaOH (rapid mixing) with subsequent addition of 1M HCl (sample 1)...................................................................................................... 45
Table 14: Atomic composition of Mn/Ru oxides prepared by co-precipitation of 10mM KMnO4 and RuCl3 salts in 1M NaOH (dropwise mixing) with subsequent addition of 1M HCl (sample 2). ................................................................................................ 46
Table 15: Atomic composition of Mn/Ru oxides prepared by co-precipitation of 10mM KMnO4 and RuCl3 salts in 1M HCl (dropwise mixing) with subsequent addition of 1M NaOH (sample 3).............................................................................................. 48

xii DRDC Atlantic CR 2007-233
This page intentionally left blank.

DRDC Atlantic CR 2007-233 1
1 Introduction
The objective of the contract is to develop supercapacitor electrode materials based on high surface area metal oxide materials and to optimize the interface between electrode materials and the current collector in order to improve equivalent series resistance.
An important parameter in the development of electrochemical supercapacitor is the equivalent series resistance (esr) which can severely limit the power density that can be delivered by the energy storage system if its value is too high. Thus, it is of the utmost importance to maintain a low esr. A major contribution to the esr originates form the electrical contact between the active electrode material and the current collector. Furthermore, an increase of the esr is often observed during prolonged charge/discharge cycling.
During the first year, various approaches to decrease the resistance associated with the current collector and the current collector/active electrode material interface were developed. More specifically, our research effort focused on developing surface treatments on a titanium current collector. The modified current collectors were characterized by scanning electron microscopy and electrochemical techniques to determine the effect of the treatment on the morphology of the substrate.
Ruthenium dioxide was the first metal oxide that was investigated for charge storage material in an electrochemical supercapacitor. Subsequently, other metal oxides, mostly low cost materials, have been investigated. These include manganese dioxide, nickel oxide and iron oxide, among others. Mixed oxides have been not widely investigated in the past and therefore there is an opportunity to find novel materials with useful charge storage properties. Mixed metal oxides have been prepared by methods such as electrodeposition and thermal treatment of appropriate metal precursors.
In this project, mixed ruthenium/manganese oxides were prepared by electrodeposition and chemical precipitation from metal precursors. The mixed oxides were electrochemically deposited on a titanium current collector. The mixed metal oxides were characterized by scanning electron microscopy, XRD and electrochemistry.

2 DRDC Atlantic CR 2007-233
2 Titanium current collector
Titanium has excellent corrosion resistance. This is the result of its ability to form a stable, protective, continuous, and adherent oxide film (TiO2) in the presence of air or water. However, this oxide layer could eventually contribute to the total resistance of the electrode. So, prior to the metal oxide electrodeposition, it will be necessary to pre-treat the titanium collector in order to minimize the total resistance of the electrode. It is now well established that surface treatment of titanium such as polishing, electrochemical reduction or chemical etching could reduce the thickness of the TiO2 film and also affect the structure of this surface oxide [1]. Chemical etching (using HF or H2O2) had also the advantage of increasing the surface roughness and the active surface area [2].
This section of the report focuses on the study of two reductive treatments on the titanium collector and their effect on the thickness and conductivity of the TiO2 film that is covering the titanium substrate.
2.1 Effect of polishing
TiO2 electrodes were polished with Buehler 1 and 0.05 μm alumina slurry (Tech-Met Canada).
After polishing, the electrodes were washed with Nanopure water (18.2 MΩ.cm), and sonicated in acetonitrile for 10 min.
Electrochemical impedance measurements were conducted in a three electrode cell in 1 M HCl + 0.5 M NaCl solution at room temperature. The counter electrode was platinum gauze. The reference electrode was an Ag/AgCl electrode filled with a saturated KCl solution (potential relative to a normal hydrogen electrode is equal to 0.201 V). The surface area of the titanium working electrode was 0.28 cm2.
Resistance and thickness of the oxide films were estimated from electrochemical impedance spectroscopy data. All measurements were carried out with the 1470 multi-potentiostat system (Solartron Analytical) using an SI 1287 electrochemical interface and coupled with an FRA 1255B frequency response analyzer and the CorrWare/ZPlot software (Scribner Associates). When performing electrochemical impedance measurements, a sine signal with amplitude of 10 mV was used for the exciting signal. The range of measured frequencies was extended from 0.1 Hz to 1MHz, with a logarithmic sweep of 10 points per decade.

DRDC Atlantic CR 2007-233 3
0 1000 2000 3000 4000 5000 6000
0
-1000
-2000
-3000
-4000
-5000
-6000 raw electrode
polished electrode
polished electrode + US
Z"
(Ω)
Z' (Ω)
Figure 1 : Nyquist diagrams of TiO2 raw, polished and polished and sonicated electrodes in
1M HCl / 0.5M NaCl aqueous media.
The following equivalent circuit was used as model for the fitting of the electrochemical impedance data.
Rs
R1
CPE1
R2
CPE2
Figure 2: Equivalent circuit of TiO2 passive layer on polished titanium electrode.
The circuit consists of an electrolyte resistance Rs, in parallel with one or two R-CPE circuits that correspond to one or two different passive films of TiO2 formed at the titanium surface, where Rx is the resistance and CPEx the constant phase element of the TiO2 layer X. The total resistance of the TiO2 film is the sum of the Rx resistances. The total thickness of the TiO2 films was calculated from the impedance data using the following equation; [1]
( )1 0 02d A f Z Zε ε π= −
(1)

4 DRDC Atlantic CR 2007-233
where d if the thickness of the film, ε1 is the dielectric constant of TiO2 (equal to 48 for an anatase
phase), ε0 = 8.854 x 10⁻¹² F.m-1 (dielectric constant of free space), A is the surface area
(0.2827 cm-2), f is the frequency (Hz), Z is impedance (Ω) at frequency f, and Z0 is impedance at high frequency (solution resistance). Values of TiO2 resistances and film thickness are reported in Table 1.
Table 1: Effect of polishing and sonication on TiO2 resistance and thickness.
Electrode As Received Polished Polished + sonication
TiO2 Resistance / Ω.cm2 2333 276 701
TiO2 Thickness / nm 91.9 10.4 14.1
The results clearly show, as expected, that the resistance and thickness of the TiO2 film could be reduced by polishing. This method allows reducing the resistance by a factor of 8.4 and the thickness of the layer by a factor of 8.8. Sonication, even if it used to remove adsorbed alumina, had a negative effect on the conductivity of the electrode. In fact, during sonication, TiO2 formation in presence of dissolved O2 and/or H2O may slowly occur.
0 500 1000 1500 2000 2500
0
-500
-1000
-1500
-2000
-2500
t = 0 min
t = 5 min
t = 10 min
Z"
(Ω)
Z' (Ω)
Figure 3 : Change with time of the Nyquist diagrams of polished and sonicated TiO2
electrodes in 1M HCl / 0.5M NaCl aqueous media.
Figure 3 shows the stability of freshly polished and sonicated TiO2 electrodes in 1M HCl / 0.5M NaCl aqueous solution. There is no increase of the resistance of the TiO2 layer over 10 min. In
those conditions, the TiO2 electrode is stable, with a resistance around 700 Ω.cm2 and a TiO2

DRDC Atlantic CR 2007-233 5
layer thickness of around 14 nm. This equilibrium is reached during sonication and could explain the differences observed between sonicated and not sonicated electrodes.
The major drawback of a polishing method for removing TiO2 film is that it can only be applied on planar surface and cannot be used on rough electrodes with high texture and porosity.
2.2 Effect of electrochemical reduction
Electrochemical reduction is another method to transform native TiO2 layers formed on titanium surface which, in contrast to a polishing method, could keep the roughness and porosity of the substrate.
The experiments were performed on polished electrodes in order to start with a consistent surface on the substrate and to allow an easier comparison of results. Polishing was done as described previously, and despite the negative effects of sonication, each electrode was sonicated after polishing to remove alumina debris.
Two kinds of electrochemical reductive treatments were used:
• Potentiostatic electroreduction of TiO2 at -0.5 V vs. Ag/AgCl in 1M HCl / 0.5 NaCl aqueous media for 5 minutes.
• Cyclic voltammetry reduction of TiO2 between -0.25 V and -1.50 V vs. Ag/AgCl in 1M HCl / 0.5 NaCl aqueous media at 200 mV.s-1.
The effects of these treatments are shown in the Nyquist plots in Figure 4 and Table 2. The results show that electrochemical pre-treatment, in addition of polishing, leads to a decrease of the TiO2 resistance and film thickness. The electrochemical potentiostatic reduction at - 0.5 V seems to be
the more efficient method. A resistance of 302 Ω.cm2 is obtained, which is similar to the polished
electrode without sonication (276 Ω.cm2). In comparison to a polished electrode, a decrease of the resistance by a factor of 2.3 and a reduction of the TiO2 thickness by a factor of 2.5 are observed. This electrochemical treatment seems to remove the TiO2 layer formed during sonication and also allows obtaining a thicker layer than for electrodes only polished.

6 DRDC Atlantic CR 2007-233
0 500 1000 1500 2000 2500
0
-500
-1000
-1500
-2000
-2500
polished
polished + E = -0.5 V
polished + VC
Z"
(Ω)
Z' (Ω)
Figure 4 : Nyquist diagrams of polished TiO2 electrodes with and without electrochemical
pre-treatment at -0.5 V vs. Ag/AgCl for 5 minutes and by cyclic voltammetry
between 0.25 and -1.0V vs Ag/AgCl recorded at 200mV.s-1
in 1M HCl / 0.5M NaCl
aqueous media.
Table 2: Effect of electroreduction on TiO2 resistance and thickness.
Electrode Polished Reduced at -0.5 V Reduced by CV
TiO2 Resistance / Ω.cm2 701 302 343
TiO2 Thickness / nm 14.1 5.5 5.7
The electrochemical reduction, using cyclic voltammetry, allows a decrease of the TiO2 resistance by a factor of 2.0 and the TiO2 thickness by a factor of 2.4. The difference of efficiency between potentiostatic and CV reduction methods could be due to the formation of titanium oxides for the more anodic potentials, near 0.25 V vs. Ag/AgCl, during CV reduction.
Other electrochemical reductions at lower potentials (from -0.6 V to -1.5 V vs. Ag/AgCl) were performed, but with no substantial lowering of resistance and TiO2 film thickness. This method is also limited by the solvent stability (water), since electroreduction at potentials lower than -1.5 V cannot be performed due to the onset of the hydrogen evolution reaction. Electrochemical experiments with ACN/0.1M TEATFB (non aqueous media), and more cathodic applied potentials (E < -1.5 V) were also performed and led to higher resistance for the TiO2 layers.

DRDC Atlantic CR 2007-233 7
0 500 1000 1500
0
-500
-1000
-1500
t = 0 min
t = 5 min
t = 10 min
t = 30 min
t = 50 min
Z"
(Ω)
Z' (Ω)
Figure 5 : Change with time of the Nyquist diagrams of a successively polished, sonicated and
electrochemically reduced TiO2 electrodes in 1M HCl / 0.5M NaCl aqueous media.
Table 3 : Change with time of TiO2 electrodes open circuit potential, resistance, and layer
thickness, after electroreduction.
Time / min 0 5 10 30 50
Open-circuit potential / mV vs Ag/AgCl - 470 - 740 - 810 - 890 - 900
TiO2 Resistance / Ω.cm2 252 298 367 455 496
TiO2 Thickness / nm 5.5 6.4 7.2 8.4 9.1
Figure 5 shows that, after the potentiostatic electrochemical reduction of TiO2 electrode at -0.5V vs. Ag/AgCl for 5 minutes, a change in the TiO2 resistance is observed. After the electrochemical reduction, the electrode/solution system is out of equilibrium. The return to the equilibrium is characterized by the change of the open circuit potential from anodic potentials (TiO2 formation) to cathodic potentials (equilibrium of TiO2 in HCl/NaCl in aqueous media). TiO2 formation during this potential shift is clearly highlighted by the increase of the TiO2 resistance (from 252 to
496 Ω.cm2) and the increase of the TiO2 layer thickness (from 5.5 to 9.1 nm) (Table 3).
Those results shows that it is possible to obtain by electrochemical methods titanium electrodes
with a relatively thin TiO2 layer (5.5 nm) and low resistance (252 Ω.cm2) in aqueous media but these electrodes are not stable and an increase of the resistance occurs when Ti electrode is soaked in a HCl/NaCl solution.

8 DRDC Atlantic CR 2007-233
The Nyquist diagrams of Figure 5 clearly highlight a transformation which is indicated by an increase of the semi-circle. An increase of the first semi-circle (at high frequencies), is observed. At the same time, a decrease of the second semi-circle (at low frequencies) occurs. This change suggests the transformation of the titanium oxide from one phase to another. Birch and Burleigh have shown that an amorphous titanium oxide phase (TiO2(H2O)x) exists at the surface of a Ti substrate after polishing and etching. [1] They also demonstrated that a slow anodization of this substrate can lead to the formation of a second kind of amorphous titanium oxide TiO2(H2O)y. Those two amorphous oxides may have different properties (chemical composition, crystallographic structure, bandgap energy). In our case, the changes in the Nyquist plots (Figure 5) could indicate the formation of the TiO2(H2O)y structure prior to the TiO2(H2O)x structure upon exposure of the Ti electrode to the HCl/NaCl solution.
2.3 Electrochemical reduction in acetonitrile
As previously shown, it was possible to decrease the resistance of a titanium electrode by potentiostatic electroreduction of TiO2 at -0.5 V vs. Ag/AgCl in aqueous 1 M HCl / 0.5 M NaCl solution for 5 minutes. However, electroreduction in aqueous media is limited by the stability of water. Lisowska et al. have shown that, in acetonitrile, for potentials around -2.5 V vs. Ag/AgCl, further reduction of titanium to Ti(0) was possible [3].
Figure 6 represents the change with applied potential of the Nyquist diagrams of polished titanium electrodes in 0.1 M TEATFB / acetonitrile solution. A constant decrease of the diameter of the semi-circle was observed when the potential is changed from -0.5 to -2.0 V. Then Nyquist diagrams were found to be similar at -2.5 and -3.0 V.
Figure 6: Effects of applied potential upon the Nyquist diagrams of polished titanium

DRDC Atlantic CR 2007-233 9
electrodes in 0.1 M TEATFB / acetonitrile solution.
The equivalent circuit (Figure 2) was used as a model for fitting the electrochemical impedance data to estimate the titanium oxide layer resistance In our case, only one R-CPE circuit was necessary to fit the electrochemical impedance data due to the presence of only one type of titanium oxide layer at the electrode surface. Figure 7 shows the resistance as function of the applied potential for a polished titanium electrode in 0.1M TEATFB / acetonitrile.
-3.0 -2.5 -2.0 -1.5 -1.0 -0.5
0
500
1000
1500
2000
2500
3000
Re
sis
tance
/ Ω
.cm
2
Applied potential / V vs. Ag/AgCl
Figure 7 : Polished titanium electrode resistance estimated by electrochemical impedance
spectroscopy as function of the applied potential vs. Ag/AgCl.
Figure 7 reveals that for potentials more negative than -1.0 V, an important charge transfer resistance decrease is observed until -2.5 V where the titanium is expected to be in the Ti(0) form [3]. For more cathodic potentials, the resistance becomes negligible. This shows that an electrochemical treatment in LiClO4 / acetonitrile solution could be performed to reduce the resistance of titanium electrode and maybe also reduce titanium oxides to metallic titanium. This electrochemical reductive method will be used in this study.

10 DRDC Atlantic CR 2007-233
3 Nanostructured titania and titanium
Highly nanostructured titania layers can be obtained using oxidative treatments. For example, amorphous TiOx nanofibers can be fabricated by impregnating a mesoporous silica film with TiCl4 which is then hydrolysed in air [4]. Titania nanorods [5] and titania nanoflowers [6] have been synthesised through direct oxidation of titanium with hydrogen peroxide at low-temperature. Titanium oxide nanotubes were also obtained by successive NaOH and HCl chemical treatments [7][8], anodic oxidation in HF [9] or in NH4HF2/NH4H2PO4
[10] aqueous solutions, and also by sonochemical synthesis [11]. However, even if thick titanium films and/or nanostructured layers were obtained using those methods, they are composed of non-conducting titanium oxides and not pure metallic titanium, rendering these layers useless for current collector applications.
Zhitomirsky et al. have shown that the electrodeposition of ceramic films like TiO2 can be performed using peroxoprecursors [12][13][14]. Nogami et al. have established a technique for fabricating nanocrystalline TiO2 thin films from the cathodic electrodeposition of titanium oxyhydroxide gel films and their subsequent heat-treatment [15]. Zecchin et al. have shown that the anodic dissolution of Ti can occur in Bu4NClO4/acetonitrile or LiClO4/acetonitrile media. This dissolution led to the formation Ti(IV) perchlorate complexes which could be subsequently electrochemicaly reduced to TiO2 films [16]. The deposition of nanostructured titania has also been investigated. For example, single-crystalline titanium oxide nanowires have been obtained by Tang et al. by electrochemically induced sol-gel preparation [17]. Cao et al. have demonstrated the applicability of sol electrophoretic deposition for the formation of TiO2 nanorods of various sizes [18]. Here again, even if thick titania films and/or nanostructured layers were obtained using all those reductive methods, they still mostly composed of titanium oxides and not pure titanium metal.
Lisowska et al. have shown that for low negative potentials, the electrochemical reduction of titanium tetrachloride in acetonitrile [3] and dimethylsulfoxide [19] can yield metallic titanium. However, at those potentials, they also observed the decomposition of both acetonitrile and DMSO solvents and the titanium layers were not pure. Titanium can also be electrodeposited in various molten salts [20][21][22]. The major difficulty of this method is the high temperature required to work with molten salts. More recently it has been reported that very thin layers of titanium could be electrodeposited in room temperature ionic liquid like [BMIm][BTA] [23][24]. But, in this case only very thin titanium layers, about only 0.8 nm thick, were obtained. Another limitation of this method is the price of ionic liquids (around $500 for 5 g of [BMIm][BTA], for example).
This review of the literature suggests that deposition of thick pure titanium metal layers is not easy to achieve. On the other hand, nanostructured titania electrodes with high surface roughness could be obtained by chemical or electrochemical method with reductive or oxidative treatments. Unfortunately, those electrodes were mostly composed of passivated titanium oxides instead of conductive titanium metal. However, we have shown that it is possible to electrochemically reduce TiO2 layers thickness to increase the conductivity (section 2.3).

DRDC Atlantic CR 2007-233 11
3.1 Titanium electrode modification protocols
The increase of the titanium electrode surface roughness was attempted by using several treatments:
• etching of titanium in H2O2 aqueous solution [2],
• formation of TiO2 nanowires in 10 M NaOH solution [7][8],
• anodic dissolution of titanium in LiClO4 acetonitrile media [11],
• cathodic deposition of titanium from TiClO4 complexes [11],
• electrodeposition of titanium from TiF4/acetonitrile solution [14],
• electrochemical formation of TiO2 nanotubes [10].
Following those treatments, the electrodes were electrochemically reduced with the aim to increase their conductivity. Subsequently, the modified electrodes were characterized by electrochemical impedance spectroscopy (EIS), scanning electronic microscopy (SEM) and energy dispersive X-ray (EDX) analyses before and after electrochemical reduction. For each modified titanium electrodes, the same protocol was used:
• Polishing of the as-received titanium electrode,
• Chemical or electrochemical modification of electrode,
• EIS measurements in aqueous media,
• Electrochemical reduction in acetonitrile,
• EIS measurements in aqueous media,
• SEM/EDX analyses of the electrode.
The description of each step of the protocol follows.
3.1.1 Titanium electrode polishing
Titanium electrodes were polished, before each treatment, to allow comparison with the subsequently modified electrode. Before polishing, titanium electrodes were cleaned with sandpaper to remove titanium oxides layer at the electrode surface. Then they were polished with
Buehler 1 and 0.05 μm alumina slurries (Tech-Met Canada). After each polishing step, the
titanium electrodes were rinsed with Nanopure water (18 MΩ.cm) and washed for 10 min in acetone by sonication and stored in acetone.
3.1.2 Electrode modification
Prior to the modification, the titanium electrodes were rinsed in a water or acetonitrile ultrasonic bath for 10 min, depending on the media used for the modification (water or acetonitrile media).
• For chemical etching modification, titanium electrodes were immersed in a stirred 1.5 M H2O2 / 2.5 M (NH4)2HPO4 aqueous solution and heated at 70°C for 1 h [2].

12 DRDC Atlantic CR 2007-233
• For chemical oxidation in NaOH, titanium electrodes were immersed in a stirred 10 M NaOH aqueous solution and heated at 110°C for 20 h [7][8].
• For anodic dissolution, titanium electrodes were immersed in a 0.1 M LiClO4 / acetonitrile solution. The solution was stirred and an anodic potential of 2.5V was applied for 1 h [16].
• The electrodeposition of titanium was carried out form a TiClO4 / 0.1 M LiClO4 / acetonitrile solution. The TiClO4 species were generated by anodic dissolution of titanium as previously described [15]. The solution was stirred and a potential of -2.5V was applied for 1 h.
• For electrodeposition from TiF4, titanium electrodes were immersed in 25 mM TiF4 / acetonitrile solution. The solution was stirred and a cathodic potential of -2.5V was applied for 1 h [3].
• Finally, TiO2 nanotubes were generated on a titanium electrode from an aqueous 0.5% wt. NH4HF2 / 1 M NH4H2PO4 solution. The solution was gently stirred and an anodic potential of +20 V was applied for 6 h [10].
After each treatment, modified titanium electrodes were rinsed with Nanopure water and then cleaned in a Nanopure water ultrasonic bath for 10 min.
3.1.3 Electrochemical Impedance Spectroscopy (EIS)
Before electrochemical impedance spectroscopy measurements, the titanium electrode was rinsed with Nanopure water. EIS measurements were conducted in a three electrode cell in 1 M HCl / 0.5 M NaCl aqueous solution at room temperature. The counter electrode was a platinum gauze. The reference electrode was an Ag/AgCl electrode filled with a saturated KCl solution (potential relative to a normal hydrogen electrode is 0.201 V).
EIS measurements were performed only after the system reached a stable open-circuit potential. The open-circuit potential value was taken as an estimate of the oxidation state of the titanium electrodes.
All measurements were carried out with the 263A potentiostat/galvanostat system (EG&G Princeton Applied Researches) coupled with an FRA 1250 frequency response analyzer and the CorrWare/ZPlot software (Scribner Associates). Electrochemical impedance measurements were performed between 0.1 Hz to 1 MHz, with a logarithmic sweep of 10 points per decade and using a sine signal with an amplitude of 10 mV for the exciting signal.
Due to the expected formation of textured surfaces with significant surface roughness, another equivalent circuit (Figure 8) was chosen as model for the fitting of the electrochemical impedance data.

DRDC Atlantic CR 2007-233 13
Rs R1
CPE1
R2
CPE2
Figure 8 : Electrochemical impedance fitting model for titanium electrodes with one oxide
layer possessing a significant roughness.
The circuit consists of an electrolyte resistance Rs, in series with two parallel R-CPE circuits. The R1-CPE1 circuit corresponds to a passive titanium oxide film (without any porosity) and R2-CPE2 circuit corresponds to the roughness/porosity of the electrode surface. Rx is the resistance and CPEx the constant phase element X [25]. The total resistance of the titanium oxide film corresponds to:
1 2
1 2
R R
R R+
(2)
For all cases, R2 values were significantly larger than the R1 values. In this case, since R1 << R2, the total resistance of the TiO2 film becomes equal to R1. It should be noted that all reported
resistance values (in Ω.cm2) will be calculated by considering the geometrical surface of the electrode.
3.1.4 Electrochemical reduction in acetonitrile
Prior to the electrochemical reduction, the modified titanium electrodes were rinsed in an acetonitrile ultrasonic bath for 10 min. After that, only 2 cm2 of the previously modified region of the titanium electrode was immersed in 0.1 M LiClO4 / acetonitrile. Then, a potential of -2.5V was applied for 10 min. At this potential, the reduction of titanium oxide to metallic titanium is expected. After this reduction, each modified electrode is composed of 2 regions: one which has been only modified and a second one which has been modified and electrochemically reduced.
3.1.5 Scanning electron microscopy (SEM) and energy dispersive X-ray (EDX) analyses
Before SEM and EDX analyses, titanium electrodes were rinsed with Nanopure water and acetone and then dried and stored under vacuum. SEM and EDX analyses were performed on the 2 different regions of the electrode (modified and modified+electroreduced) using a Hitachi S-4300SE/N (VP-SEM) microscope coupled with an EDX analyzer. SEM analyses were used to

14 DRDC Atlantic CR 2007-233
estimate the effect of the treatment on the electrode surface roughness. EDX analyses were used to characterize the titanium oxide species by calculating the O/Ti atomic ratio.
3.1.6 Results and discussion
3.1.6.1 Unmodified titanium (polished electrode)
SEM photomicrographs of Figure 9 clearly show the efficiency of the polishing method. Even for a high magnification of x20k (Figure 9B) no electrode texture was observed.
Figure 9 : SEM of a polished titanium electrode at A) x5K and B) x20k magnification.
Open-circuit potential values, resistance values and O/Ti ratios for polished titanium electrodes before and after electrochemical reduction in 0.1 M LiClO4 / acetonitrile media are shown on the Table 4.
Table 4 : Open-circuit potential, resistance and O/Ti ratio for polished titanium electrode, before
and after the electrochemical reduction treatment in 0.1M LiClO4 / acetonitrile
solution.
OC potential / V vs.
Ag/AgCl Resistance / Ω.cm2 O/Ti atomic ratio
Polished -0.230 2103 0.33
After reduction -0.238 2038 0.29
Resistance values were determined from EIS Nyquist diagrams fitting (Annex A.1 ).
The electrochemical reduction does not appear to have a significant effect on the open-circuit potential, resistance and O/Ti ratio. Indeed, previous studies have shown that polishing was the most effective method to remove the TiO2 layer and obtain the most conductive titanium surface.
A B

DRDC Atlantic CR 2007-233 15
However, the values in Table 4 will be used as reference and compared with those obtained for modified titanium electrodes. EDX analyses indicate O/Ti ratios around 0.3 before and after the electrochemical reduction in LiClO4 / acetonitrile media. No known titanium oxide corresponds to this ratio. For a polished titanium electrode the presence at the surface of Ti and Ti2O species is assumed [1].
3.1.6.2 Titanium H2O2 etching
Figure 10 and Table 5 represent SEM photomicrographs and surface characterization (OC potential, resistance and O/Ti ratio), respectively before and after the electrochemical treatment in acetonitrile.
Figure 10 : Titanium electrodes modified by chemical reaction in 1.5 M H2O2 / 2.5 M
(NH4)2HPO4 aqueous solution at 70°C for 1 h for A) x1k and B) x20 magnification
and for C) x50k magnification with an angle of 45°. Photomicrograph D) represents
the same electrode after electrochemical reduction in LiClO4 / acetonitrile media for
25k magnification.
A B
C D

16 DRDC Atlantic CR 2007-233
SEM photomicrographs of Figure 10 show that the texture of the titanium electrode was transformed by the chemical treatment in the H2O2 / (NH4)2HPO4 aqueous solution. For low magnification (Figure 10A) small corrosion regions are visible at the surface of the electrode. Areas of the electrode which appeared relatively smooth at higher magnification (Figure 10B) show a very fine and homogeneous texture for slightly higher magnification and a view angle of 45° (Figure 10C). After electrochemical reduction of the electrode in LiClO4 / acetonitrile media, the textured surface is still observed (Figure 10D).
Table 5 : Open-circuit potential, resistance, and O/Ti atomic ratio for polished titanium
electrodes modified by chemical reaction in 1.5 M H2O2 / 2.5 M (NH4)2HPO4 aqueous
solution at 70°C for 1h, before and after the electrochemical reduction treatment in
LiClO4 / acetonitrile media.
Electrode OC potential / V vs.
Ag/AgCl Resistance / Ω.cm2 O/Ti atomic ratio
Polished -0.230 2103 0.33
After treatment +0.235 14599 0.48
After reduction -0.219 991 0.44
Resistance values were determined from EIS Nyquist diagrams fitting (Annex A.2 ).
After the chemical treatment by H2O2/(NH4)2HPO4, the open-circuit potential and the resistance values are higher than for a polished titanium electrode. The oxidative chemical treatment, based on H2O2 can explain the formation of titanium oxides with a higher oxidation state and the variation of the electrode potential and of the resistance. The O/Ti ratio around 0.5 suggests that Ti2O oxides were mostly formed. After electrochemical reduction in acetonitrile, the open-circuit potential value was similar to those obtained for a polished titanium electrode. The invariance of the oxygen/titanium ratio suggests that Ti2O oxides are still present in large quantity. However the obtained resistance value was lower than those obtained for a polished titanium electrode. This lower resistance value is linked to an increase of the conductivity but also to an increase of electrode area. This demonstrates that the electrochemical reduction treatment led to the reduction of titanium oxides and the recovery the metal surface.
These results show that titanium etching using H2O2 / (NH4)2HPO4 allows an increase of the electrode surface by creating a very fine texture. After an electrochemical reduction treatment, it was possible to recover the conductivity of the polished electrode.
3.1.6.3 Titanium oxidation in NaOH
Figure 11 and Table 6 represent SEM photomicrographs and surface characterization (OC potential, resistance and O/Ti ratio), respectively before and after the electrochemical treatment in LiClO4 / acetonitrile solution.

DRDC Atlantic CR 2007-233 17
Figure 11 : Titanium electrodes modified by chemical reaction in 10 M NaOH aqueous
solution at 110°C for 20 h for A) x3k (region 1), B) x5K (region 2) and C) x50k
magnification (region 2) and after electrochemical reduction in LiClO4 / acetonitrile
media for D) x3K magnification.
SEM photomicrographs show that the chemical treatment is not uniform as two different textures were obtained. Figure 11A is characterized by relatively flat areas with some large pits. The second texture (Figure 11B) is more uniform overall and consists of globules and fibers (more clearly seen at higher magnification on Figure 11C). The formation of TiO2 nanotubes by the same chemical treatment of TiO2 powders has been recently reported [7][8]. Thus, it seems that this transformation in nanotubes is much less efficient at an electrode surface. Subsequently, after the electrochemical reduction the surface is very different (Figure 11D) and a smooth textured surface is observed.
A B
C D

18 DRDC Atlantic CR 2007-233
Table 6 : Open-circuit potential, resistance, and O/Ti atomic ratio for polished titanium
electrode modified by chemical reaction in 10 M NaOH aqueous solution at 110°C for
20 h, before and after the electrochemical reduction treatment in LiClO4/acetonitrile
media.
Electrode OC potential / V vs.
Ag/AgCl Resistance / Ω.cm2 O/Ti atomic ratio
Polished -0.230 2103 0.33
After treatment -0.203 31752 1.01
After reduction -0.048 122147 0.30
Resistance values were determined from EIS Nyquist diagrams fitting (Annex A.3 ).
After the chemical treatment with NaOH, the open-circuit potential is similar to that of a polished electrode. However a 15 fold increase of the resistance is found and the atomic ratio O/Ti is equal to 1. This is in accordance with the formation of Ti-O-Na or Ti-OH bonds during the chemical reaction that was suggested by Raman spectroscopy [8]. However our EDX analyses have not shown presence of Na, so the formation of Ti-OH or TiO oxides species were assumed. After electrochemical reduction in a LiClO4/acetonitrile solution, both of the OC potential and resistance increased. The electrochemical reduction has allowed reducing Ti-OH groups to Ti leading to an O/Ti ratio of 0.3 (mixture of Ti and Ti2O species). On the other hand, this reduction has also strongly decreased the electrode porosity (Figure 11D) leading to an increase of the resistance (Table 6).
Even if treatment with NaOH, as reported in the literature [7][8], allows an increase of the titanium electrode porosity by creating titanium nanofibers, a significant increase of the resistance is observed at the same time. Moreover, the electrode conductivity cannot be recovered without totally losing the newly formed porosity. In conclusion, the chemical treatment in NaOH will be not useful in a current collector application.
3.1.6.4 Anodic dissolution of titanium
Figure 12 and Table 7 show SEM photomicrographs and surface characterization (OC potential, resistance and O/Ti ratio), respectively before and after the anodic treatment in acetonitrile.

DRDC Atlantic CR 2007-233 19
Figure 12 : Titanium electrodes modified by electrodissolution of Ti at +2.5 V vs Ag/AgCl for
1 h in 0.1M LiClO4 / acetonitrile solution A) x200 magnification and after
electrochemical reduction treatment in LiClO4 / acetonitrile B) x200 magnification,
C) x40 magnification and D) x20k magnification (non corroded area).
The dissolution of titanium induces the formation of large corroded areas (Figure 12A). SEM photomicrographs show no significant difference on titanium electrodes before and after electrochemical reduction (Figure 12A and B). For low magnification (Figure 12C), corrosion/dissolution processes seem to be more important than previously observed for the treatment in H2O2 / (NH4)2HPO4 solution (Figure 12A). However, when non-corroded regions are examined at higher magnification (Figure 12D) no fine texture was observed like for the treatment in H2O2 / (NH4)2HPO4 solution (Figure 12D).
A B
C D

20 DRDC Atlantic CR 2007-233
Table 7 : Open-circuit potential, resistance, and O/Ti atomic ratio for titanium
electrode modified by electrodissolution of Ti in TiClO4 at +2.5 V vs Ag/AgCl for 1 h in
0.1M LiClO4 / acetonitrile solution, before and after the electrochemical reduction
treatment in LiClO4 / acetonitrile.
Electrode OC potential / V vs.
Ag/AgCl Resistance / Ω.cm2 O/Ti atomic ratio
Polished -0.230 2103 0.33
After treatment +0.191 11437 1.17
After reduction +0.110 5426 0.50
Resistance values were determined from EIS Nyquist diagrams fitting (Annex A.4
The open-circuit potential values remain anodic at around +0.15 V before and after electrochemical reduction in acetonitrile (Table 7). The electrochemical dissolution in LiClO4 seems to have generated titanium oxides that cannot be reduced afterwards. This is confirmed by the value of the resistance which is still 2 times higher than that of a polished titanium electrode after the electrochemical reduction. Before reduction, the oxygen titanium ratio is close to 1. Zotti et al. explained the dissolution of titanium by the reaction with perchlorate and by the formation of soluble TiO2+ anions [16]. This formation of TiO2+ could explain the obtained O/Ti ratio (equal to 1.17). After the electrochemical reduction, it appears that the electrode is mostly under Ti2O form (O/Ti ratio of 0.5).
The anodic dissolution of titanium to TiO2+ creates large corrosion regions, increasing the electrode surface roughness but, in contrast to the treatment in H2O2, not the entire surface was textured. The creation of porosity was limited to some areas and the initial conductivity cannot be recovered.
3.1.6.5 Cathodic deposition from a TiClO4/acetonitrile solution
Figure 13 and Table 8 present SEM photomicrographs and surface characterization (OC potential, resistance and O/Ti ratio), respectively before and after an electrochemical treatment in LiClO4 / acetonitrile solution. During the electrolysis, a significant white/gray deposit was observed on the titanium electrode. After electrolysis and rinsing with acetonitrile, the deposited layer was totally removed and the electrode had recovered its polished appearance.

DRDC Atlantic CR 2007-233 21
Figure 13 : Titanium electrodes modified by electrodeposition of Ti from a TiClO4 / 0.1M
LiClO4 acetonitrile solution at -2.5 V vs Ag/AgCl for 1 h, A) x20k magnification
(taken with an angle of 45°) and after electrochemical reduction treatment in
LiClO4 / acetonitrile media B) x30k magnification.
SEM photomicrographs show that no significant modification of the surface occurred due to the cathodic electrodeposition from a solution containing TiO2+ / ClO4
2- [16]. For some regions of the electrode, a very fine deposit was visible (Figure 13A), but most of surface was not modified. For unmodified regions of the electrode, some dark regions were visible (Figure 13B). Those dots could be due to the adsorption of unknown titanium species during electrolysis. Thereafter, those adsorbed species were removed during cleaning in the ultrasonic bath, leaving a darker area where they were adsorbed. Biallozor and Lisowska have also observed the adsorption of an insoluble layer at a Pt electrode during the electroreduction of TiCl4 in acetonitrile solutions [3]. This layer was attributed to the formation of TiCl2 salt (slightly soluble in acetonitrile) and its adsorption at the electrode surface.
Table 8 : Open-circuit potential, resistance, and O/Ti atomic ratio for titanium
electrodes modified by electrodeposition of Ti from a TiClO4 / 0.1M LiClO4 acetonitrile
solution at -2.5 V vs Ag/AgCl for 1 h, before and after the electrochemical reduction
treatment in LiClO4 / acetonitrile.
Electrode OC potential / V vs.
Ag/AgCl Resistance / Ω.cm2 O/Ti atomic ratio
Polished -0.230 2103 0.33
After treatment -0.047 8367 0.31
After reduction -0.205 2490 0.30
Resistance values were determined from EIS Nyquist diagrams fitting (Annex A.5
A B

22 DRDC Atlantic CR 2007-233
After electrochemical reduction in a LiClO4 / acetonitrile solution, the open-circuit potential, resistance and O/Ti ratio are similar to those obtained for a freshly polished titanium electrode which confirms SEM analyses that cathodic electrodeposition of titanium from a TiClO4 / acetonitrile solution did not occur.
3.1.6.6 Electrodeposition from a TiF4 / acetonitrile solution
Figure 14 and Table 9 represent SEM photomicrographs and surface characterization (OC potential, resistance and O/Ti ratio), respectively before and after the electrochemical treatment in acetonitrile.
Figure 14 : Titanium electrodes modified by electrodeposition of Ti from a 25 mM
TiF4 / acetonitrile solution at -2.5 V vs Ag/AgCl for 1 h A) 50k magnification with
an angle of 45° and after electrochemical reduction treatment in
LiClO4 / acetonitrile media B) x50k magnification and C) x6k magnification.
After electrodeposition, a relatively non-uniform deposit is observed (Figure 14A). After the reduction in LiClO4 / acetonitrile solution, this deposit still exists (Figure 14B and C). Biallozor et
al. have studied the electrodeposition from TiCl4 / acetonitrile solutions. Their deposit contained
A B
C

DRDC Atlantic CR 2007-233 23
titanium and about 60 % carbon. This presence of carbon was attributed to the decomposition of acetonitrile during electrolyses [3].
Table 9 : Open-circuit potential, resistance, O/Ti and C/Ti atomic ratios for titanium
electrodes modified by electrodeposition of Ti from a 25 mM TiF4 / acetonitrile solution
at -2.5 V vs Ag/AgCl for 1 h, before and after the electrochemical reduction treatment
in LiClO4 / acetonitrile.
Electrode OC potential / V vs.
Ag/AgCl
Resistance /
Ω.cm2
O/Ti atomic
ratio
C/Ti atomic
ratio
Polished -0.230 2103 0.33 -
After treatment
-0.400 42 0.36 0.11
After reduction
-0.047 1218 0.32 -
Resistance values were determined from EIS Nyquist diagrams fitting (Annex A.6
After electrodeposition, the C/Ti ratio estimated by EDX analyses was only 0.1 (Table 9). Interestingly, after electrochemical reduction in LiClO4 / acetonitrile media, the carbon is lost. The presence of carbon before the reduction treatment can be attributed to adsorbed or entrapped acetonitrile molecules, which were removed after electrochemical reduction or after further ultrasonic cleaning. Carbon was not present at the surface but, at this time, it is not yet possible to confirm the origin of the carbon present. After electrodeposition, the open-circuit potential and resistance value were lower than those obtained on a freshly polished titanium electrode. This tends to confirm that the electrode surface was mostly composed of freshly deposited titanium metal. However, the O/Ti atomic ratio (around 0.33) suggests that both Ti and Ti2O species were present at the electrode surface. The electrochemical reduction in LiClO4 / acetonitrile solution, even if not necessary here, has been effected to apply the same treatment as other electrodes. The open-circuit potential, resistance value and O/Ti ratio are close to those obtained for a freshly polished titanium electrode
These results prove that electrodeposition of titanium metal can occur in acetonitrile without any surface contamination by the decomposition of the solvent.
3.1.6.7 TiO2 nanotubes formation
Figure 15 and Table 10 present SEM photomicrographs and surface characterization (OC potential, resistance and O/Ti ratio) respectively before and after the electrochemical treatment in LiClO4 / acetonitrile solution.

24 DRDC Atlantic CR 2007-233
Figure 15 : Titanium electrodes modified by potentiostatic polarisation at +20 V for 6 h in
NH4HF2/NH4H2PO4 aqueous solution A) x50k magnification and after
electrochemical reduction treatment in LiClO4 / acetonitrile B) x50k magnification,
C) x10k magnification and D) x60k magnification taken with an angle of 45°.
After potentiostatic polarization at +20 V, a tube-like structure formed at the titanium electrode surface (Figure 15A). The nanotubes have an internal diameter of around 100 nm and their length was estimated between 300 to 400 nm (Figure 15D). For Gong et al. who have studied the formation of titanium nanotubes, one possible process contributing to the formation of nanotube structures during anodization is the migration of titanium ions from the interpore areas of the oxide film to the oxide/solution interface [9]. For high anodization voltages, the electric field was strong enough to move these ions and their migration leaves voids in the interpore areas, eventually separating the pores and forming discrete tube-like structures. After the electrochemical reduction in LiClO4 / acetonitrile, the structure of the nanotubes seems better defined (Figure 15B). This fact is attributed to a higher conductivity of the electrode which enhances the EDX analysis resolution. It must be also noticed that during the electroreduction in LiClO4 / acetonitrile media an important modification of the electrode colour from grey/golden metallic to opaque black was observed. Finally, for lower magnification (Figure 15C), the structure of the titanium oxide nanotubes appears clearly homogeneous.
A B
C D

DRDC Atlantic CR 2007-233 25
Table 10 : Open-circuit potential, resistance and O/Ti atomic ratio for titanium
electrode modified by potentiostatic polarization at +20 V for 6 h in
NH4HF2 / NH4H2PO4 aqueous solution, before and after the electrochemical reduction
treatment in LiClO4 / acetonitrile media.
Electrode OC potential / V vs.
Ag/AgCl Resistance / Ω.cm2 O/Ti atomic ratio
Polished -0.230 2103 0.33
After treatment +0.405 4419 1.13
After reduction -0.113 803 1.49
Resistance values were determined from EIS Nyquist diagrams fitting (Annex A.7
After treatment, as expected, open-circuit potential and resistance values were higher than those obtained on a freshly polished titanium electrode (Table 10). After electroreduction in LiClO4 / acetonitrile, the resistance is lower than that obtained for a polished titanium electrode. As previously observed with a H2O2 treatment, the lower resistances comparable to that of the polished electrode can be due to the increase of the electrode specific surface area. Before electroreduction, O/Ti ratio was about 1 and the modified electrode surface was mostly composed of TiO species. After electrochemical reduction, this ratio has increased to 1.5. This higher ratio could be explained by the formation of Ti2O3 species (highly conductive). The oxidation of a part of the TiO oxides to TiO2 (highly resistive) is unlikely. Moreover, the observed opaque black colour for the electrode after reduction in LiClO4 / acetonitrile media confirms the formation of Ti2O3 species (which has a dark blue colour). However the mechanism of the Ti2O3 formation is still unclear.
3.1.6.8 Conclusions
The modification of titanium electrode by several chemical and electrochemical treatments, with the aim to increase electrode specific area and at the same time keeping a good conductivity was performed. The following modification procedures have not succeeded:
• Chemical treatment in heated NaOH solutions yields a fiber texture with potentially high surface, but also increases the electrode resistance. Subsequent electrochemical reduction lowers this resistance, but also totally wipes out the formed texture.
• Anodic dissolution of titanium increases electrode surface area. But this modification was not homogeneous and was localized to some regions. However this treatment permanently increases the overall electrode resistance.
• Finally the cathodic deposition from TiClO4 / acetonitrile solution does not give a stable deposit or increasing the electrode surface.

26 DRDC Atlantic CR 2007-233
However, other treatments have permitted an increase of the electrode specific surface area without increasing dramatically the resistance:
• Chemical etching in heated H2O2 solutions led to the dissolution of titanium and the formation of a uniform and fine texture on the entire surface of the electrode. The electrode surface was increased without increasing its total resistance.
• The formation of titanium nanotubes by anodization in NH4HF2 / NH4H2PO4 aqueous solution has also led to an increase in the titanium electrode surface, and the subsequent electrochemical reduction in acetonitrile solution has increased the conductivity of the electrode without losing the nanotube-like structure.
Finally, a titanium layer was obtained by electrochemical deposition from a TiF4 / acetonitrile solution without any solvent decomposition (e.g. formation of carbon on the Ti layer). This method does not directly increase the electrode surface, but by using nanostructured templates (like AAO membranes) during deposition it may be possible to create nanostructured titanium current collectors [26].
3.2 Electrodeposition of titanium nanorods
Fabrication of nanostructures by electrodeposition, using anodic aluminum oxides (AAO) membranes as template, has been already reported [27]. This method has been used for the production of both metal [28] and metal oxide nanowires [29][30][31]. Taberna et al. electrodeposited copper nanorods using an AAO membrane as template [26]. The growth of TiO2 nanorods through AAO membranes was also performed using anodic oxidative hydrolysis of TiCl3
[32][33] or sol-electrophoresis [33] methods.
3.2.1 Electrodeposition in acetonitrile media
For the electrodeposition of titanium from TiCl4/ACN solution, an adaptation of the electrochemical cell used by Taberna et al. was used (Figure 16).
A B C D
A EF G
Figure 16 : Electrochemical cell used for the electrodeposition of titanium nanorods.

DRDC Atlantic CR 2007-233 27
The cell consisted of two Teflon® plates (A), a platinum plate as counter electrode (B), two filter papers (C), an AAO membrane (D), a polished titanium plate as working electrode (E) and a titanium plate as current collector (F), protected by a Teflon® template (G).
The working electrode was a freshly polished titanium plate (area 4 cm2). Before polishing, titanium electrodes were cleaned with sandpaper to remove the surface oxide layer present at the
electrode surface. Then, polishing was performed with 1 and 0.05 μm alumina slurries (Buehler, Tech-Met Canada). After each polishing step, the titanium electrodes were rinsed with Nanopure
water (18 MΩ.cm) and washed for 10 min in acetonitrile by sonication. The current collector for the working electrode was a larger titanium plate (not polished). The AAO membrane was a
Whatman Anodisc 47 (diameter 47 mm, thickness 60 μm, pore size 0,2 μm). The counter electrode was a platinum plate. All the parts of the cell were assembled as in the Figure 16 (the AAO membrane and the filter paper were previously immersed in the TiCl4 / ACN solution) and the two external Teflon® plates were maintained under pressure by two strong steel stainless grips.
Before electrolysis, the cell was immersed in a beaker containing a saturated solution of TiCl4 in ACN. The reference electrode was an Ag/AgCl electrode and was placed near the filter papers of electrochemical cell. The TiCl4 / ACN solution was continuously stirred.
-1.0 V
-2.5 V
0.25 s
0.05 s
Figure 17: Potential steps used for the electrodeposition of titanium nanorods from
TiCl4 / ACN solution.
For the electrolysis, pulsed potentials steps were applied (Figure 17). The first potential step, corresponding to the reduction potential to metallic titanium (-2.5 V vs. Ag/AgCl) was applied for 50 ms. The second step, corresponding to a relaxation step, was applied at -1.0 V vs. Ag/AgCl for 250 ms to allow the diffusion of the titanium species from the solution in the AAO membrane pores (through the filter papers). This sequence of pulses was applied for 1 or 4 hours.
After electrolysis, the modified titanium electrodes were rinsed with Nanopure water and acetone. The AAO membrane, which may stay at the titanium surface, was dissolved by immersing it in a 1M NaOH aqueous solution, and heated at about 80ºC for 2 minutes. Finally, the electrodes were rinsed again with Nanopure water and acetone, dried, and stored under vacuum.
The modified titanium electrodes were characterized by SEM and EDX analyses on a Hitachi S-4300SE/N (VP-SEM) microscope coupled with an EDX analyzer. SEM analyses were used to estimate the effect of the treatment on the electrode surface roughness. EDX analyses were used to characterize the titanium oxide species by calculating the O/Ti atomic ratio. SEM
C

28 DRDC Atlantic CR 2007-233
photomicrographs of the AAO membrane, and polished and modified titanium electrodes are presented in Figure 18.
Figure 18 : SEM of A) polished titanium electrode at x40K magnification, B) AAO membrane
(side in contact with the titanium electrode) at x20k magnification, and titanium
electrodes after C) 1h and D) 4h of electrodeposition from TiCl4 / ACN solutions at
x40K magnification.
SEM photomicrographs show that, after electrolyses of 1 and 4 hours, the titanium surfaces were clearly modified (Figure 18C and Figure 18D). The formation of titanium nanorods with diameter around 200 nm, corresponding to the size of the pores of the AAO membrane (Figure 18B) was expected. Instead of the titanium nanorods, the formation of fine small needles (with length under 100 nm) is observed. Those needles are similar to the texture previously obtained during the formation of TiO2 nanoneedles (section 3.1.6.3). The treatment conditions for removing the AAO membrane and for the TiO2 nanoneedles formation are also very close. The formation of those needles could be mostly related to the formation of titanium oxide rather than to the pulsed electrodeposition of titanium.
C D
A B

DRDC Atlantic CR 2007-233 29
Table 11 : Open-circuit potential, resistance, O/Ti and C/Ti atomic ratios for titanium
electrodes modified by potentiostatic electrodeposition of Ti at -2.5V from a 25mM
TiF4 / acetonitrile solution and modified by pulsed electrodeposition of Ti from a
saturated TiF4 / acetonitrile solution for 1 h and 4 h.
EDX analyses show that after potentiostatic electrodeposition of Ti followed by oxidative treatment for removing the AAO membrane, the O/Ti ratios are about 2 and 3 times higher than for a titanium electrode electrodeposited from a TiCl4 / ACN solution (Table 11). Those high values of O/Ti ratios confirm the formation of titanium oxides during the oxidative treatment for removing AAO membranes. Table 11 also shows that the C/Ti ratio increases with the electrolysis time and after a 4 hour-electrolysis, this ratio is equal to 0.74. The presence of carbon is linked to the degradation of acetonitrile, and this degradation increases with time.
3.2.2 Cyclic voltammetry study
Cyclic voltammetry (Figure 19) was performed in several organic solvents (acetonitrile, DMF and DMSO) to study the effect of the solvent and its degradation on the electrodeposition of metallic titanium from TiCl4 salts.
Electrode OC potential / V
vs. Ag/AgCl
Resistance /
Ω.cm2
O/Ti atomic
ratio
C/Ti atomic
ratio
Polished -0.230 2103 0.33 -
Potentiostatic electrodeposition
-0.400 42 0.36 0.11
1h pulsed electrodeposition
- - 0.68 0.19
4h pulsed electrodeposition
- - 0.93 0.74

30 DRDC Atlantic CR 2007-233
-3.0 -2.5 -2.0 -1.5 -1.0 -0.5
-1.00
-0.75
-0.50
-0.25
0.00
0.25
0.50
0.1M LiClO4 / ACN
5mM TiF4 / 0.1M LiClO
4 / ACN
i / A
.cm
-2
E / V vs. Ag/AgCl
-3.0 -2.5 -2.0 -1.5 -1.0 -0.5
-0.20
-0.15
-0.10
-0.05
0.00
0.05
0.1M LiClO4 / DMF
5mM TiF4 / 0.1M LiClO
4 / DMF
i / A
.cm
-2
E / V vs. Ag/AgCl
-3.0 -2.5 -2.0 -1.5 -1.0 -0.5
-0.10
-0.08
-0.06
-0.04
-0.02
0.00
0.02
0.1M LiClO4 / DMSO
5mM TiF4 / 0.1M LiClO
4 / DMSO
i / A
.cm
-2
E / V vs. Ag/AgCl
Figure 19 : Cyclic voltammograms of polished titanium electrode recorded at 50 mV/s in
0.1 M LiClO4 a) acetonitrile, b) DMF and c) DMSO media with (____
) and without
(. . . .
) 5 mM TiF4 salt.
In acetonitrile (Figure 19a), during the first cathodic scan, a cathodic peak corresponding to the reduction of TiCl4 to Ti(0) is observed at -2.5 V vs. Ag/AgCl. During the following scans, a shift of this peak to more negative potentials is observed together with a decrease of the current intensity of this peak. This shows that electrodeposition of Ti(0) becomes less efficient with time due to a slow passivation of the electrode surface. This passivation could be linked to the decomposition of the organic solvent and a strong irreversible adsorption of passivating carbonaceous species. This passivation by adsorbed carbonaceous species could explain the slight deposition of metallic titanium (sections 3.1.6.5 and 3.1.6.6) and why no formation of titanium nanorods was observed.
In DMF and DMSO (Figure 19b and c) this adsorption/passivating effect seems more significant. In DMF, a large wave starting at -2.5V vs. Ag/AgCl, which could be attributed to the reduction of TiCl4 to Ti(0) is observed during the first cathodic scan. This wave was not observed during the second cathodic scan (Figure 19b). In DMSO, this wave is shifted to more negative potential (around -2.7 V vs. Ag/AgCl), the wave was also not observed during the second cathodic scan (Figure 19c).
a) b)
c)
D

DRDC Atlantic CR 2007-233 31
The cyclic voltammetry study of the electrodeposition of Ti(0) from TiCl4 in ACN, DMF and DMSO media clearly shows that the passivation of the titanium surface, by the adsorption of solvent degradation species, prevents the growth of the metallic titanium deposits. This fact explains why only small deposits can be obtained and why the formation of titanium nanorods cannot be achieved.
3.3 Conclusions
The electrodeposition of titanium from TiCl4 in ACN, DMF and DMSO media is hampered by the passivation of the electrode surface and by the adsorption of solvent degradation species. This passivation blocks further growth of the metallic titanium deposit and explains why the formation of titanium nanorods was not observed. In this case, pure nanostructured metallic titanium current collector, with high surface area, cannot be obtained using classical chemical or electrochemical methods. Only titanium current collectors with an oxidized layer at the surface can be obtained.

32 DRDC Atlantic CR 2007-233
4 Syntheses of RuO2/MnO2 material
4.1 Electrodeposition of RuO2 and MnO2 on titanium
In order to obtain mixed RuOy.nH2O and MnO2, it would be useful to find a suitable medium for the simultaneous electrodeposition of these two oxides. It is well known that RuOy.nH2O electrodeposition can be performed only in acidic media [35][36][37][38]. The electrodeposition of MnO2 has been performed in neutral or acidic aqueous media by galvanostatic [39] or potentiostatic methods [40][41][41]. Electrodeposition of MnO2 in neutral media yields electrode materials with high capacitance, but little information exists concerning the capacitance for electrodes electrodeposited from acidic media. Thus, the electrodeposition of RuOy.nH2O and MnO2 were first performed in acid media.
4.1.1 RuOy.nH2O electrodeposition
The electrodeposition of RuOy.nH2O was performed on a freshly polished titanium electrode by cyclic voltammetry from a 5mM RuCl3 / 10mM HCl / 0.1M KCl aqueous solution (pH = 2) at a scan rate of 50 mV/s (Figure 20).
-0.2 0.0 0.2 0.4 0.6 0.8 1.0
-2
-1
0
1
2
3
i / m
A.c
m-2
E / V vs. Ag/AgCl
Figure 20 : Cyclic voltammograms of polished titanium electrode recorded at 50 mV/s in 5mM
RuCl3 / 10mM HCl / 0.1M KCl aqueous media (pH = 2) at 85ºC.
A continuous growth of the redox waves was observed upon cycling (Figure 20). The anodic and cathodic peaks at 0.45 and 0.25 V respectively are attributed to a combination of (i)
adsorption/desorption of hydrated Ru complex (i.e. Ru(OH)δ Clα-δ .nH2O) in the plating bath; (ii)

DRDC Atlantic CR 2007-233 33
redox transitions of the already-deposited RuOy.nH2O; and/or (iii) conversion of newly adsorbed Ru species into RuOy.nH2O. The anodic and cathodic peaks at 0.95 and 0.8 V respectively are
attributed to complete conversion of these newly adsorbed Ru(OH)δ Clα-δ .nH2O) species into RuOy.nH2O
[35].
After the electrodeposition of RuOy.nH2O, the electrode was rinsed with Nanopure water and then tested by cyclic voltammetry in 0.5 M H2SO4 and 1 M NaOH aqueous solution at a scan rate of 20 mV/s. In 1M NaOH aqueous solution the dissolution of electrodeposited RuOy.nH2O occurs. However, in 0.5M H2SO4 aqueous solution, the RuOy.nH2O film is stable.
0.0 0.2 0.4 0.6 0.8 1.0
-0.6
-0.4
-0.2
0.0
0.2
0.4
0.6
0.8
Ti
RuO2 / Ti
i / m
A.c
m-2
E / V vs. Ag/AgCl
Figure 21 : Cyclic voltammograms of (. . . .
) freshly polished and (____
) RuOy.nH2O modified
titanium electrodes recorded at 20 mV/s in 0.5M H2SO4 aqueous solution at 25ºC
(5th cycle).
The pseudo-capacitive behaviour of the electrodeposited RuOy.nH2O film in 0.5 M H2SO4 aqueous solution is clearly shown in Figure 21. Before electrodeposition the capacitive response of the titanium electrode is obtained. After RuOy.nH2O electrodeposition a notable increase in current is observed. The pseudo-capacitance of RuOy.nH2O mainly comes from the redox transitions of oxides between different oxidation states.
+ -
x y x-į y+įRuO (OH) +įH +įe RuO (OH)⎯⎯→←⎯⎯ (3)
The voltammetric charge (q*) of a CV measured at 50 mV/s between 0 and 1.0 V was used to evaluate the capacitance of the electrode. The mean capacitance (Cq*) of these electrodes could be calculated on the basis of the following equation:

34 DRDC Atlantic CR 2007-233
* 1 2 *
qC q V= × Δ
(4)
where ΔV is equal to 1.0 V. This mean capacitance was equal to 19.8 mF.cm-2. The specific capacitance of the deposited material has not yet been determined.
4.1.2 MnO2 electrodeposition
Following literature reports, the electrodeposition of MnO2 was done on a freshly polished titanium electrode by potentiostatic (at +1.5V vs. Ag/AgCl) and galvanostatic (at +1.5 mA/cm2) methods at 85ºC for 10 min and 1h [43]. Several solutions were also used for the electrodeposition:
• 5mM MnSO4 / 10mM HCl / 0.1M KCl aqueous solution,
• 1M MnSO4 / 10mM HCl / 0.1M KCl aqueous solution,
• 1M MnSO4 / 0.5 M H2SO4 aqueous solution.
For all galvanostatic electrodepositions at +1.5 mA/cm2, a large variation of the potential from 0.7 to 3.0 V vs. Ag/AgCl was observed during electrolysis. Similarly, for all potentiostatic electrodeposition at +1.5 V vs. Ag/AgCl, a decrease of the measured current was observed. This suggests that passivation of the electrode occurs due to the formation of titanium oxides. However, at the end of the electrolysis, for all the electrodeposition methods used, the formation of a black film at the electrode surface was observed. This layer is attributed to the electrodeposition of MnO2.
After electrodeposition, the electrode was rinsed with Nanopure water and then tested by cyclic voltammetry in three media:
• 0.5M H2SO4 aqueous solution
• 0.65M K2SO4 aqueous solution
• 0.1M NaOH aqueous solution
Unfortunately, when the electrodeposition was performed for 1h, almost always the MnO2 deposit peeled off while rinsing with water. This could be due to the formation of a too large quantity of MnO2 which cannot stay attached on the polished titanium electrode. A typical cyclic voltammogram recorded at 20 mVs-1 is reported in Figure 22, for the electrodes where the deposit is still present.

DRDC Atlantic CR 2007-233 35
0.0 0.2 0.4 0.6 0.8 1.0
-4.0
-3.5
-3.0
-2.5
-2.0
-1.5
-1.0
-0.5
0.0
0.5
Ti
MnO2 / Ti
i / m
A.c
m-2
E / V vs. Ag/AgCl
Figure 22 : Typical cyclic voltammograms of (. . . .
) freshly polished and (____
) MnO2 modified
titanium electrodes recorded at 20 mV/s in 0.5M H2SO4 aqueous solution at 25ºC
(5th first cycles).
The cyclic voltammograms obtained for an electrodeposited MnO2 film in 0.5 M H2SO4 (Figure 22) differ from those obtained for RuOy.nH2O (Figure 21). A slow decrease of the current was observed during potential cycling. The cathodic wave is attributed to the reduction of the previously formed titanium oxides, but no capacitive response of deposited MnO2 is observed for these electrodes.

36 DRDC Atlantic CR 2007-233
-0.2 0.0 0.2 0.4 0.6 0.8 1.0 1.2 1.4
-0.4
-0.3
-0.2
-0.1
0.0
0.1
0.2
0.3
0.4
Ti
MnO2 / Ti
i / m
A.c
m-2
E / V vs. Ag/AgCl
Figure 23 : Typical cyclic voltammograms of (. . . .
) freshly polished and (____
) MnO2 modified
titanium electrodes recorded at 5 mV/s in 0.65M K2SO4 aqueous solution at 25ºC.
A capacitive response was only observed in 0.65 M K2SO4 aqueous solutions and only for an electrodeposition of 10 min (Figure 23). In those cases, the MnO2 deposit stays attached at the titanium electrode surface. An increase of the capacitance was observed after MnO2 electrodeposition. The shape of the cyclic voltammograms was not rectangular as expected but strongly sloped. This slope is due to the resistance of the titanium oxides formed during MnO2 electrodeposition [45]. The capacitance was estimated to 15.5 mF.cm-2. The specific capacitance of the deposited material has not yet been determined.
4.1.3 Conclusion and Perspectives
We have shown that the electrodeposition of RuOy.nH2O and MnO2 can be performed in acid media. Moreover, in the case of the electrodeposition of MnO2, due to the high anodic deposition potentials, passivation of the titanium support is observed. The co-electrodeposition of RuOy.nH2O and MnO2 could not be performed without dramatically increasing the resistance of the titanium support. The next section will focus to obtain a homogeneous binary material based on RuOy.nH2O and MnO2 using the co-precipitation method.
4.2 Co-precipitation of RuO2 and MnO2
Co-precipitation of RuOy.nH2O and MnO2 with other metal oxides has already been performed in aqueous media. For instance, binary oxides like Ni/RuO2
[46] and MnO2/ZrO2 [47] have been
obtained in aqueous media, by oxidation of the corresponding salts with NaOH and NH4 aqueous
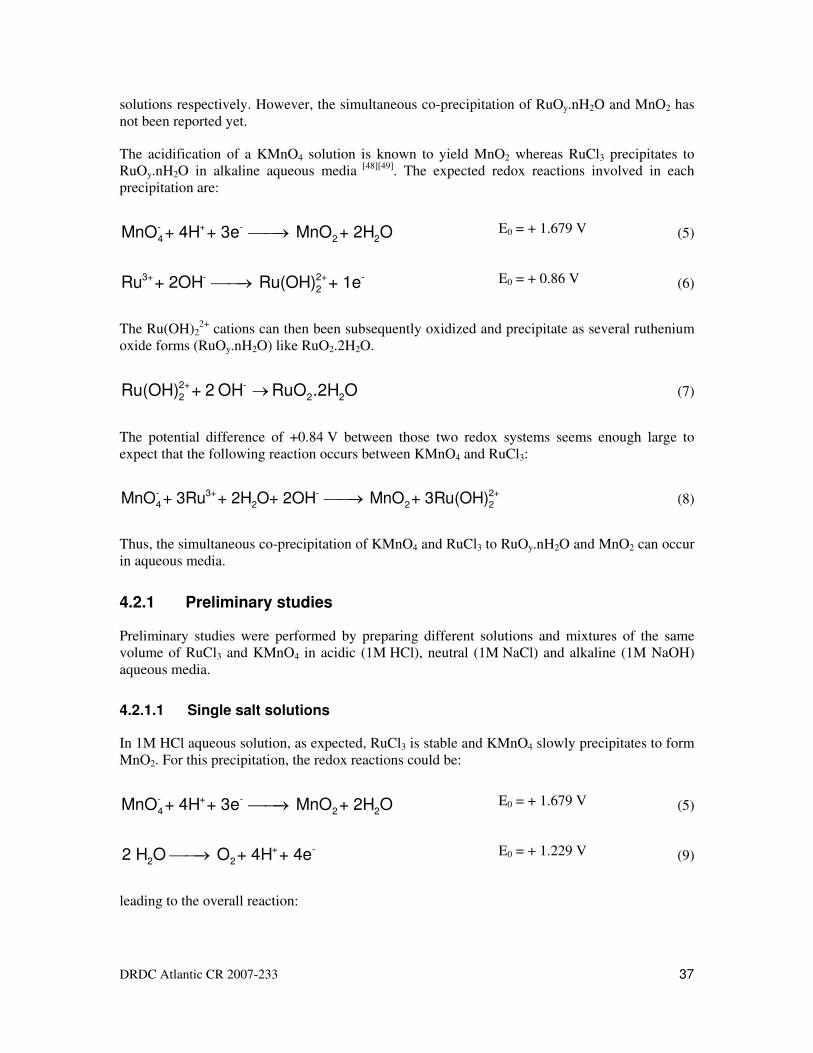
DRDC Atlantic CR 2007-233 37
solutions respectively. However, the simultaneous co-precipitation of RuOy.nH2O and MnO2 has not been reported yet.
The acidification of a KMnO4 solution is known to yield MnO2 whereas RuCl3 precipitates to RuOy.nH2O in alkaline aqueous media [48][49]. The expected redox reactions involved in each precipitation are:
- + -
4 2 2MnO + 4H + 3e MnO + 2H O⎯⎯→
E0 = + 1.679 V (5)
3+ - 2+ -
2Ru + 2OH Ru(OH) + 1e⎯⎯→
E0 = + 0.86 V (6)
The Ru(OH)22+ cations can then been subsequently oxidized and precipitate as several ruthenium
oxide forms (RuOy.nH2O) like RuO2.2H2O.
2+ -
2 2 2Ru(OH) + 2 OH RuO .2H O→
(7)
The potential difference of +0.84 V between those two redox systems seems enough large to expect that the following reaction occurs between KMnO4 and RuCl3:
- 3+ - 2+
4 2 2 2MnO + 3Ru + 2H O+ 2OH MnO + 3Ru(OH)⎯⎯→
(8)
Thus, the simultaneous co-precipitation of KMnO4 and RuCl3 to RuOy.nH2O and MnO2 can occur in aqueous media.
4.2.1 Preliminary studies
Preliminary studies were performed by preparing different solutions and mixtures of the same volume of RuCl3 and KMnO4 in acidic (1M HCl), neutral (1M NaCl) and alkaline (1M NaOH) aqueous media.
4.2.1.1 Single salt solutions
In 1M HCl aqueous solution, as expected, RuCl3 is stable and KMnO4 slowly precipitates to form MnO2. For this precipitation, the redox reactions could be:
- + -
4 2 2MnO + 4H + 3e MnO + 2H O⎯⎯→
E0 = + 1.679 V (5)
+ -
2 22 H O O + 4H + 4e⎯⎯→
E0 = + 1.229 V (9)
leading to the overall reaction:

38 DRDC Atlantic CR 2007-233
- + 324 2 2 22MnO + 2H 2MnO + H O+ O⎯⎯→
(10)
In 1M NaCl aqueous solution, RuCl3 and KMnO4 are stable. In 1M NaOH aqueous solution, KMnO4 is stable and RuCl3 precipitates to form RuOy.nH2O
[48][49].
4.2.1.2 Salt mixture solution
4.2.1.2.1 Acid aqueous solution
A red solution with a fine precipitate was obtained by adding 2.5 mM of KMnO4 and 2.5 mM of RuCl3 to a 1M HCl solution. The red color of the solution may be explained by the formation of Mn3+ ions (red),
- + - 3+
4 2MnO + 8H + 4e Mn + 4H O⎯⎯→
E0 = + 1.506 V (11)
and the precipitate could be due to the slow formation of MnO2.
- + -
4 2 2MnO + 4H + 3e MnO + 2H O⎯⎯→
E0 = + 1.679 V (12)
However, this formation of Mn3+ in acid media is only observed in presence of Ru3+ (section 4.2.1.1). A possible reaction could be:
- 3+ 3+ 2+
4 2 2MnO + 4Ru + 4H O Mn + 4Ru(OH)⎯⎯→
(13)
4.2.1.2.2 Neutral aqueous solution
A purple color solution without any precipitate was obtained by adding 2.5 mM of KMnO4 and 2.5 mM of RuCl3 into a 1M NaCl solution. The purple color is linked to the presence of MnO4
- ions. As expected, in this case no redox reaction occurs and the solution still contains the initial MnO4
- and Ru3+ ions.
4.2.1.2.3 Alkaline aqueous solution
A green solution without any precipitate was obtained by adding 2.5 mM of KMnO4 and 2.5 mM of RuCl3 to the 1M NaOH solution. This green solution could be linked to the presence of MnO4
2-
ions which are known to form in strongly alkaline solutions. The redox reaction could be:
- - 2-
4 4MnO + 1e MnO⎯⎯→
E0 = + 0.588 V (14)

DRDC Atlantic CR 2007-233 39
This formation of MnO42- in alkaline media is only observed in the presence of Ru3+ (section
4.2.1.1). More intriguingly, the precipitation of Ru3+ to RuOy.nH2O is not observed in those conditions. A redox reaction seems to occur between Ru3+ and MnO4
- ions. But here, the ruthenium redox couple involved in the reaction was not identified.
4.2.1.2.4 UV/visible kinetics in alkaline aqueous solution
UV-visible spectra of alkaline solutions (1M NaOH) containing different proportions of KMnO4
and RuCl3 were monitored as a function of time. The solutions were prepared by adding 100 μL of a metallic salt (10mM) to 2 mL of a 1M NaOH solution. All the solutions were analyzed with a Cary 1E UV-visible spectrometer (Varian) and the UV-visible spectra were measured for t = 0, 5, 10 and 15 min.
300 400 500 600 700 800 900
0.0
0.2
0.4
0.6
0.8
1.0
1.2
t=0 min
t=5 min
t=10 min
t=15 min
wavelenght / nm
Abs
pink / violet
300 400 500 600 700 800 900
0.0
0.2
0.4
0.6
0.8
1.0
1.2 t=0 min
t=5 min
t=10 min
t=15 min
wavelenght / nm
Abs
yellow
Figure 24 : Change with time of UV-visible spectra of 1M NaOH aqueous solutions
containing a) 0.5mM KMnO4 and b) 0.5mM RuCl3.
Figures 24a and 24b present the changes in the UV-visible spectra for alkaline solutions containing 100% of KMnO4 and 100% of RuCl3 for 15 minutes, respectively. For the KMnO4/NaOH solution a small decrease of the peaks attributed to MnO4
- at 505, 525, 545 and 565 nm (pink/violet color) was observed on Figure 24a. At the same time, two peaks around 430 and 620 nm appear. Those peaks can be attributed to the slow formation of MnO4
2- in alkaline media (equation 11) [50]. For the RuCl3/NaOH solution, a decrease of the peak at 390 nm (brown/yellow color) attributed to the slow precipitation of Ru3+ to RuOy.nH2O, is observed (Figure 24b).
a) b)
KMnO4 RuCl3

40 DRDC Atlantic CR 2007-233
300 400 500 600 700 800 900
0.0
0.2
0.4
0.6
0.8
1.0
1.2
RuCl3 / %
0
10
20
30
40
50
60
70
80
90
100
wavelenght / nm
Ab
s
300 400 500 600 700 800 900
0.0
0.2
0.4
0.6
0.8
1.0
1.2
Ab
s
t=0 min
t=5 min
t=10 min
t=15 min
wavelenght / nm
yellow
blue
Figure 25 : UV-visible spectra of 0.5mM KMnO4/RuCl3 + 1M NaOH aqueous solutions a)
containing different proportions of RuCl3 0 minutes and b) with an Mn/Ru atomic
ratio of 3/2 for 0, 5, 10 and 10 minutes.
Figure 25a shows that UV-visible spectra are totally different depending of proportion of KMnO4/RuCl3 in 1M NaOH. The total concentration of both species was always 0.5 mM. When the RuCl3 composition increases from 0 to 30 %, the intensities of the peaks corresponding to KMnO4 decrease. At the same time, the peak of RuCl3 is not observed and a progressive increase of two peaks at 440 and 610 nm (yellow and blue color) is observed. This clearly proves that some products are quickly formed by the reaction of KMnO4 with RuCl3.
When the fraction of RuCl3 is increased to 40 %, the peaks attributed to KMnO4 and RuCl3 are not observed. The observation suggests that most of the MnO4
- and Ru3+ ions have reacted. This
is confirmed by the intensities of the peaks at 440 and 610 nm. For RuCl3 fractions larger than 50%, the peaks at 440 and 610 nm progressively decrease when the RuCl3 concentration is increased. The peak attributed to RuCl3 is only observed for a RuCl3 fraction over 80%.
Figure 25b shows the changes in the UV-visible spectra for 1M NaOH aqueous media containing 60% KMnO4 and 40% RuCl3 for 15 minutes. The absorption peaks of MnO4
- are only observed for t = 0 min. After 5 min, UV-visible spectra are stable, showing the two defined peaks at 440 and 610 nm.
This UV-visible study shows that, in alkaline media, KMnO4 and RuCl3 quickly react to form stable products. This reaction is more efficient and fast for a KMnO4/RuCl3 molar ratio of 3/2.
4.2.1.3 Co-precipitation in acidic and alkaline solutions
The addition of an equal volume of a 1M NaOH solution to the previously prepared 2.5 mM KMnO4/RuCl3 + 1M HCl solution (section 4.2.1.2.1) leads to the fast formation of a black precipitate and the partial discoloration of the red solution. Similarly, the addition of 1M HCl to the previously prepared 2.5 mM KMnO4/RuCl3 + 1M NaOH solution (section 4.2.1.2.3) leads to the slow formation a black precipitate and the total discoloration of the green solution.
a) b)

DRDC Atlantic CR 2007-233 41
No precipitation was observed when 1M NaOH was added to 25 mM KMnO4 or 25 mM RuCl3 HCl solutions or when 1M HCl was added to 25 mM KMnO4 or 25 mM RuCl3 NaOH solutions. The summary of the formed manganese and ruthenium species in each studied media is presented in Table 12.
Table 12: Mn and Ru species formed from KMnO4, RuCl3 and mixture of KMnO4 + RuCl3 solution in HCl,
NaCl and NaOH aqueous solutions and HCl and NaOH aqueous solutions with the addition of
NaOH and HCl respectively.
In acid or alkaline media, KMnO4 and RuCl3 salts react to form intermediate species. After that, the variation of the pH of the solutions leads to the precipitation of the intermediate species. In those conditions, the co-precipitation of KMnO4 and RuCl3 to RuOy.nH2O and MnO2 seems to occur.
4.2.2 MnO2, RuOy.n(H2O) and binary oxides powder syntheses
To characterize the co-precipitated oxide, larger quantities were synthesized using 3 different methods.
• Sample 1 (rapid mixing): First, 0.49 g of KMnO4 was added to 200 mL of 1M NaOH. The solution was stirred for 10 minutes. Secondly, 0.51 g of RuCl3 was added and the mixture was stirred for 10 minutes. Finally, 200 mL of 1M HCl was added to the alkaline solution and the mixture was stirred for 12 hours.
• Sample 2 (dropwise mixing): First, 25 ml of 10mM KMnO4 aqueous solution was added dropwise to 100 mL of 1M NaOH. The solution was stirred for 10 minutes. Second, 25 ml of 10mM RuCl3 aqueous solution was added dropwise and the mixture was stirred for 10 minutes. Finally, 100 mL of 1M HCl was added to the alkaline solution and the mixture was stirred for 12 hours.
• Sample 3 (dropwise mixing): First, 25 ml of 10mM RuCl3 aqueous solution was added dropwise to 100mL of 1M HCl. The solution was stirred for 10 minutes. Second, 25 ml of 10mM KMnO4 aqueous solution was added dropwise and the mixture was stirred for 10 minutes. Finally, 100 mL of 1M NaOH have added to the alkaline solution and the mixture was stirred for 12 hours.
Media KMnO4 RuCl3 KMnO4 + RuCl3
HCl MnO2 Ru3+ Mn3+ + Ru(OH)22+
NaCl MnO4- Ru3+ MnO4
- + Ru3+
NaOH MnO4- RuOy.nH2O MnO4
2- + ??
HCl (+ NaOH) - Ru3+ MnO2 + RuOy.nH2O
NaOH (+ HCl) MnO4- - MnO2 + RuOy.nH2O

42 DRDC Atlantic CR 2007-233
• References: For comparison, MnO2 and RuOy.n(H2O) were prepared as follows. For MnO2, 0.49 g of KMnO4 was added to 200 mL of 1M HCl and the solution was stirred for 12 hours. For RuOy.n(H2O), 0.51 g of RuCl3 was added to 200 mL of 1M NaOH and the solution was stirred for 12 hours.
All the solutions yield a precipitate. The precipitate was filtered and washed respectively with 200 mL of water, 100 mL of methanol and 100 mL of acetone. Then, the resulting powders were dried and stored under vacuum at 40ºC prior to characterization.
During filtration of sample 2, the formation of a precipitate was also observed in the filtrate. This precipitate was also filtrated, washed, dried and identified as sample 2b.
4.2.3 Mn/Ru oxides characterization
4.2.3.1 X-ray diffraction analyses (XRD)
MnO2, RuOynH2O and mixed oxides samples were analyzed by X-ray diffraction and the spectra are presented in Figure 26.

DRDC Atlantic CR 2007-233 43
10 20 30 40 50 60 70 80
400
500
600
700
800
900
1000
1100
MnO2
Co
unts
2-theta
0 20 40 60 80 100
0
50
100
150
200
250
Co
un
ts
2 theta
RuOynH2O
0 20 40 60 80
20
40
60
80
100
120
140
160
180
200
Co
unts
2 theta
Sample 1
0 20 40 60 80
100
150
200
250
300
350
400
450
Co
un
ts
2 theta
Sample 2
20 40 60 80 100
100
200
300
400
500
600
700
Sample 3
Co
unts
2-theta
Figure 26 : MnO2, RuOynH2O and Mn/Ru oxides prepared by precipitation and co-
precipitation of 10mM KMnO4 and RuCl3 salts. X-ray diffraction spectra of a)
MnO2, b) RuOynH2O, c) sample 1, d) sample 2 and e) sample 3.
The spectra show that the oxide precipitation and co-precipitation methods lead to the formation
of amorphous powders. Some broad peaks are visible for MnO2 (2θ = 12° and 37°), RuOynH2O
(2θ = 22°, 35° and 78°) and sample 3 (2θ = 22°, 28°, 37° and 55°) but it was not possible, using
a) b)
c) d)
e)

44 DRDC Atlantic CR 2007-233
existing X-ray diffraction databases, to precisely link them to any manganese or ruthenium oxides ordered structures. All these samples would have to be annealed to generate crystalline phases.
4.2.3.2 Scanning electron microscopy (SEM) and energy dispersive X-ray (EDX) analyses.
4.2.3.2.1 Sample 1 : rapid mixing in NaOH
SEM photomicrograph and EDX data of Mn/Ru oxides prepared by co-precipitation of 10mM KMnO4 and RuCl3 in 1M NaOH (rapid mixing) followed by the addition of 1M HCl (sample 1) are represented on Figures 27a-27d and Table 13, respectively.
Figure 27 : Mn/Ru oxides prepared by co-precipitation of 10mM KMnO4 and RuCl3 salts in
1M NaOH (rapid mixing) with subsequent addition of 1M HCl (sample 1).
Photomicrographs of Mn/Ru oxides for A) x1.2k, B) x90k, C) x100k and D) x150k
magnification.
The Mn/Ru oxides consist of particles that form larger aggregates (Figure 27A). The size of the
largest aggregates varies from 10 to 35 μm. At higher magnification (Figures 27B, C and D), Mn/Ru oxides particles with diameter around 90 nm could be observed.
C D
A B

DRDC Atlantic CR 2007-233 45
Table 13: Atomic composition of Mn/Ru oxides prepared by co-precipitation of 10mM KMnO4 and RuCl3
salts in 1M NaOH (rapid mixing) with subsequent addition of 1M HCl (sample 1).
Mn Ru O
Atomic ratio / % 23.4 ± 6.5 8.0 ± 2.6 67.7 ± 7.5
EDX analyses realized on different aggregates (wide angle analyses) and particles (localized analyses) revealed that the chemical composition of Mn/Ru oxides is very homogenous, with only small variation of the atomic composition (Table 13). The Mn/Ru ratio is close to 3 and the metal/O ratio is close to 1/2. This Mn/Ru ratio is very different from the initial solution atomic
ratio (Mn/Ru ∼ 1) or from the optimal proportions observed by UV/visible for the formation of intermediate species (Mn/Ru ratio of 3/2). This suggests that only a part of the initial ruthenium has co-precipitated.
4.2.3.2.2 Sample 2 : dropwise mixing in NaOH
SEM photomicrographs and EDX data of Mn/Ru oxides prepared by co-precipitation of 10 mM KMnO4 and RuCl3 salts in 1M NaOH (dropwise mixing) followed by the addition of 1M HCl (sample 2) are presented in Figures 28a-28d and Table 14, respectively.

46 DRDC Atlantic CR 2007-233
Figure 28 : Mn/Ru oxides prepared by co-precipitation of 10mM KMnO4 and RuCl3 salts in
1M NaOH (dropwise mixing) with subsequent addition of 1M HCl (sample 2).
Photomicrographs obtained for A) x700, B) x45k, C) x100k and D) x150k
magnification.
The material obtained by co-precipitation with dropwise addition seems similar to that produced by co-precipitation using rapid mixing. Here again, the Mn/Ru oxides consist of particles that form larger aggregates (Figure 28A). The size of the largest aggregates is comparable to sample 1
and varies from 10 to 25 μm. At higher magnification (Figures 28B, 28C and 28D), Mn/Ru oxides particles could also be observed with diameter ranging between 60 and 100 nm.
Table 14: Atomic composition of Mn/Ru oxides prepared by co-precipitation of 10mM KMnO4
and RuCl3 salts in 1M NaOH (dropwise mixing) with subsequent addition of 1M HCl
(sample 2).
Mn Ru O
Atomic ratio / % 21.2 ± 6.8 8.4 ± 2.4 70.3 ± 9.2
C D
A B

DRDC Atlantic CR 2007-233 47
Like sample 1, the Mn/Ru oxides are very homogenous, with only small variation of the atomic composition (Table 14). The Mn/Ru ratio is close to 3 and the metal/O ratio is close to 1/2.
The method used for the mixing of KMnO4 and RuCl3 (rapid or dropwise mixing) seems to have no effect on the structure and the composition of the Mn/Ru oxide. The binary oxide is homogeneous and formed of aggregated small particles (60-150 nm). The Mn/Ru ratio is around 3 and the metal/O ratio is around 1/2. The composition for those two binary oxides (sample 1 and 2) is close to Mn3RuO8. This suggests that at most 1/3 of the initial ruthenium has co-precipitated.
4.2.3.2.3 Sample 3 : dropwise mixing in HCl
SEM photomicrographs and EDX data of Mn/Ru oxides prepared by co-precipitation of 10mM KMnO4 and RuCl3 salts in 1M HCl (dropwise mixing) followed by the addition of 1M NaOH (sample 3) are represented in Figures 29a-29d and Table 15, respectively.
Figure 29 : Mn/Ru oxides prepared by co-precipitation of 10mM KMnO4 and RuCl3 salts in
1M HCl (dropwise mixing) with subsequent addition of 1M NaOH (sample 3).
Photomicrographs obtained for A) x2.0k, B) x25k, C) x35k and D) x50k
magnification.
C D
A B

48 DRDC Atlantic CR 2007-233
The oxide structure looks different from the two previous samples. The structure seems more crystalline. The binary oxide consists of particle aggregates (Figure 29A), but the particles are larger (Figure 29C) than those shown in Figure 28. The mean diameter of those particles is
around 0.9 μm. Smaller particles are also occasionally observed (Figure 29B and 6D). Those particles with a diameter around 100 nm, seem heterogeneously deposited on the surface of the larger particles.
Table 15: Atomic composition of Mn/Ru oxides prepared by co-precipitation of 10mM KMnO4
and RuCl3 salts in 1M HCl (dropwise mixing) with subsequent addition of 1M NaOH
(sample 3).
Mn Ru O
Atomic ratio / % 38.9 ± 25.0 5.8 ± 2.7 49.4 ± 21.7
The oxide composition is also very different from the previous sample. The manganese composition is very heterogeneous (Table 15), varying from 15 to 80 %, according to the particle or the aggregate analyzed. In most cases, it was observed that the Mn/Ru ratio is lower in the regions containing a large number of the smallest particles. EDX analyses suggest that the large particles are mostly composed of manganese and the smallest particles are composed of ruthenium. The adsorption of trace amounts of ruthenium has already been observed during iron oxides formation [51]. The mean Mn/Ru ratio is equal to 6.7 and the metal/O ratio around 1. The sample is mostly composed a different oxides and binary oxides with varying composition.
The method used for the co-precipitation has an effect on the binary oxide composition. When KMnO4 and RuCl3 are first mixed in NaOH, a binary oxide with the Mn3RuO8 composition is formed with particle size around 100 nm. At the opposite when KMnO4 and RuCl3 are mixed in
HCl, a heterogeneous oxides mixture is formed, with particle size around 0.9 μm.
4.2.3.3 Thermogravimetric and Differential thermal analyses (TGA / DTA)
4.2.3.3.1 Thermogravimetric analyses (TGA)
Thermogravimetric analyses performed on MnO2, RuO2 powders and binary oxides (samples 1, 2 and 3) are reported in Figure 30.

DRDC Atlantic CR 2007-233 49
0 100 200 300 400 500 600 700
74
76
78
80
82
84
86
88
90
92
94
96
98
100
102
MnO2
RuO2
sample 1
sample 2
sample 3
TG
/ %
Temperature / OC
100 200 300 400 500 600
0.00
-0.02
-0.04
-0.06
-0.08
-0.10
-0.12
ΔTG
/ %
.min
-1
Temperature / OC
MnO2
RuO2
sample 1
sample 2
sample 3
water lost
Figure 30 : a) Thermogravimetric and b) differential thermogravimetric curves of MnO2,
RuO2 and MnO2/RuO2 powders: sample 1 (rapid mixing in NaOH), sample 2
(dropwise mixing in NaOH) and sample 3 (dropwise mixing in HCl) powders.
Figure 30a shows weight losses of 15 % for MnO2 and 23% for RuO2 following heating under N2
from room temperature to 600°C. For the binary manganese and ruthenium oxides, the weight loss is intermediate. For all the samples, the main weight loss is observed below 300ºC and results from the removal of physically adsorbed and chemically bound water. Other weight losses are observed above 300ºC and are highlighted by the differential thermogravimetric curves in Figure 30b.
For the MnO2 powder, two peaks are observed above 300°C (Figure 30b). The peak at 350ºC is attributed to the removal of chemically bound water and the peak at 540ºC may be attributed to the transformation of MnO2 to Mn2O3
[52]. Those two peaks are also observed for the MnO2/RuO2 powder prepared by rapid mixing in NaOH (sample 1). It is expected that this binary oxide contains a significant amount of MnO2.
For the RuO2 powder, two peaks are observed at 380 and 470ºC and are both attributed to the extraction of crystalline water molecules from the oxide structure. Those two peaks are not observed on any binary oxides (samples 1 to 3). This shows that the binary oxides contain ruthenium (section 4.2.3.2) but is not hydrated [53].
For samples 2 and 3, the peaks observed for individual MnO2 or RuO2 are not detected. For those binary oxides, either manganese and ruthenium oxides are not hydrated or they have a structure different from the MnO2 and RuOy.n(H2O) samples.
4.2.3.3.2 Differential thermal analyses (DTA)
Differential thermal analyses were also performed on the various sample and the results of these analyses are reported in Figure 31.
a) b)

50 DRDC Atlantic CR 2007-233
0 100 200 300 400 500 600 700
-200
-150
-100
-50
0
50
Temperature / OC
MnO2
RuO2
sample 1
sample 2
sample 3
ΔT
A / μ
V
100 200 300 400 500 600
-1.5
-1.0
-0.5
0.0
0.5
1.0
water lost
MnO2
RuO2
sample 1
sample 2
sample 3
Temperature / OC
ΔΔ
TA
/ μ
V.m
in-1
Figure 31 : a) Differential thermal analysis and b) derivative differential thermal analysis
curves of MnO2, RuO2 and MnO2/RuO2 powders: sample 1 (rapid mixing in NaOH),
sample 2 (dropwise mixing in NaOH) and sample 3 (dropwise mixing in HCl)
powders.
Figure 31a shows that some important thermal processes are occurring between 30 to 200ºC (Figure 31a). These endothermic and exothermic processes are due to the removal of physically adsorbed water, respectively, previously observed by thermogravimetry. Other endothermic and exothermic processes are observed around 350ºC and are highlighted by the derivative differential thermal analysis curves on the Figure 31b.
For MnO2, two peaks are observed (Figure 31b). The first endothermic peak at 340ºC is attributed to the extraction of crystalline water molecules from the oxide structure. This peak is followed by an exothermic peak at 380ºC and may be attributed to a reorganisation of the oxide structure. Those two peaks are also observed for the MnO2/RuO2 powder prepared by rapid mixing in NaOH (sample 1). As previously mentioned (section 4.2.3.3.1), this binary oxide may contain a significant amount of MnO2.
For the RuO2 powder, an endothermic peak is observed at 380ºC and is attributed to the extraction of crystalline water molecules from the oxide structure.
For temperatures above 400ºC, for all the samples, derivative differential thermal curves become very noisy and no significant thermal variation could be observed.
As previously observed by thermogravimetric analyses, the binary oxide prepared by rapid mixing in NaOH, may contain a significant amount of MnO2. On the other hand, for the samples prepared by dropwise addition in NaOH and HCl, the differential thermal analyses do not allow one to observe the endothermic and exothermic peaks recorded for the individual MnO2 or RuO2. Here again, we can assume that those binary oxides are under non-hydrated manganese and ruthenium oxides or have a structure different from the MnO2 and RuOy.n(H2O) samples.
a) b)

DRDC Atlantic CR 2007-233 51
4.2.4 Conclusions and perspectives
Co-precipitation of MnO2 and RuOy.nH2O was achieved by mixing KMnO4 and RuCl3 salts in NaOH or HCl aqueous media followed by the addition of an equivalent of HCl or NaOH, respectively.
In NaOH solution, the addition of KMnO4 and RuCl3 leads to the formation of soluble intermediate species and the formation of those species is more important and fast for a Mn/Ru ratio equal to 3/2. UV/visible analyses were performed in alkaline media to see if intermediate species were also formed.
Properties of the formed MnO2/ RuOy.n(H2O) oxides differ from their preparation method :
• Binary oxides formed by mixing in NaOH media look amorphous. Thermogravimetric analyses have also shown that those oxides are hydrated (around 20% in mass). X-ray diffraction analyses will be performed on dehydrated oxides (by heating them over 300ºC) with to goal to observe a structural response and identify formed structures.
• Binary oxides prepared by salts mixing in NaOH media seem to have a more homogenous composition (Mn/Ru = 3) than the binary oxide prepared in HCl. Those MnO2/ RuOy.n(H2O) oxides are also formed of smaller particles (60-150 nm) when prepared in NaOH. The composition of these binary oxides is Mn3RuO8.
• TGA and thermal analyses of the binary oxides have shown that the oxides prepared by dropwise mixing do not posess the same properties as individual MnO2 and RuOy.n(H2O) oxides and may not be a simple mixture of those two oxides.
Finally, in the future, all the prepared powders will be characterized by electrochemistry to estimate their capacitance for electrochemical supercapacitor applications.

52 DRDC Atlantic CR 2007-233
References
[1] J.R. Birch and T.D. Burleigh, Corrosion 56-12 (2000) 1233.
[2] J.E.A.M. van den Meerakker, J.P. Metsemakers, and J.B. Giespers, J. Electrochem. Soc. 149 (2002) C256E.
[3] S. Biallozor and A. Lisowska, Electrochim. Acta. 25 (1980) 1209.
[4] C. Xiong and K.J. Balkus, J. Chem. Mater. 17 (2005) 5136.
[5] J.M. Wu, J. Crystal Growth 269 (2004) 347.
[6] J.-M. Wu, B. Huang, M. Wang and A. Osaka, J. Am. Ceram. Soc. 89 (2006) 2660.
[7] T. Kasuga, M. Hiramatsu, A. Hoson, T. Sekino and K. Niihara, Langmuir 14 (1998) 3160.
[8] T. Kasuga, Thin Solid Films 496 (2006) 141.
[9] D. Gong, C.A. Grimes, O.K. Varghese, W. Hu, R.S. Singh, Z. Chen and E.C. Dickey, J. Mater. Res. 16 (2001) 3331.
[10] H. Li, X. Bai, Y. Ling, J. Li, D. Zhang and J. Wang, Electrochem. Solid-State Lett. 9 (2006) B28.
[11] Y. Zhu, H. Li, Y. Koltypin, Y.R. Hacohen and A. Gedanken, Chem. Commun. (2001) 2616.
[12] I. Zhitomirsky, L. Gal-Or, A. Kohn and H.W. Hennicke, J. Mat. Sci. 30 (1995) 5307.
[13] I. Zhitomirsky and L. Gal-Or, J. Eur. Ceram. Soc. 16 (1996) 819.
[14] I. Zhitomirsky, NanoStruct. Mat. 8 (1997) 521.
[15] C. Natarajan and G. Nogami, J. Electrochem. Soc. 143 (1996) 1547.
[16] G. Zotti, G. Schiavon and S. Zecchin, J. Electrochem. Soc. 146 (1999) 636.
[17] Z. Miao, D. Xu, J. Ouyang, G. Guo, X. Zhao and T. Tang, Nano Lett. 2 (2002) 717.
[18] S.J. Limmer, T.P. Chou and G.Z. Cao, J. Mat. Science 39 (2004) 895.
[19] A. Lisowska and S. Biallozor, Electrochim. Acta. 27 (1982) 105.
[20] E. Chassaing, F. Basile and G. Lorthioir, J. Appl. Electrochem. 11 (1981) 187.
[21] A. Robin and R.B. Ribeiro, J. Appl. Electrochem. 30 (2000) 239.
[22] T. Tsuda, C.L. Hussey, G.R. Stafford ans J.E. Bonevich, J. Electrochem. Soc. 150 (2003) C234.
[23] I. Mukhopadhyay and W. Freyland, Langmuir 19 (2003) 1951.
[24] I. Mukhopadhyay, C.L. Aravinda, D. Borissov, W. Freyland, Electrochim. Acta 50 (2005) 1275.
[25] S.V. Gnedenkov, S.L. Sinebryukhov and V.I. Sergienko, Russian J. Electrochem. 42 (2006) 197.

DRDC Atlantic CR 2007-233 53
[26] P.L. Taberna, S. Mitra, P. Poizot, P. Simon and J.-M. Tarascon, Nat. Mater. 5 (2006) 567.
[27] K.S. Shankar, A.K. Raychaudhuri, Mat. Sci. Eng. C, 25 (2005) 738.
[28] C. Schonenberger, B.M.I. van der Zande, L.G.J. Fokkink, M. Henny, C. Schmid, M. Kruger,A. Bachtold, R. Huber, H.Birk, U. Staufer, J. Phys. Chem. B. 101-28 (1997) 5497.
[29] M.J. Zheng, L.D. Zhang, G.H. Li, X.Y. Zhang, X.F. Wang, Appl. Phys. Lett. 79 (2001) 839.
[30] M. Zheng, G. Li, X. Zhang, S. Huang, Y. Lei, L. Zhang, Chem. Mater. 13-11 (2001). 3859.
[31] Y. Li, G.W. Meng, L.D. Zhang, F. Phillipp, Appl. Phys. Lett. 76 (2000) 2011.
[32] X.Y. Zhang, L.D. Zhang, W. Chen, G.W. Meng, M.J. Zheng, L.X. Zhao, F. Phillipp, Chem. Mater. 13-8 (2001) 2511.
[33] X. Zhang, B. Yao, L. Zhao, C. Liang, L. Zhang, Y. Mao, J. Electrochem. Soc. 148 (2001) G398.
[34] S.J. Limmer, T.P. Chou, G.Z. Cao, J. Mat. Science 39 (2004) 895.
[35] C.-C. Hu, Y.-H. Huang, J. Electrochem. Soc. 146-7 (1999) 2465.
[36] C.-C. Hu, Y.-H. Huang, Electrochimica Acta 46 (2001) 3431.
[37] I.-L. Kim, J.-H. Kim, Y.-H. Lee, K.-B. Kim, J. Electrochem. Soc. 152-11 (2005) A2170.
[38] Y.R. Ahn, M.Y. Song, S.M. Jo, C.R. Park, D.Y. Kim, Nanotechnology 17 (2006) 2865.
[39] J.N. Broughton, M.J. Brett, Electrochimica Acta 50 (2005) 4814.
[40] M.G. Pavlovic, A. Dekansk, J. Solid State Electrochem. 1 (1997) 208.
[41] C.-L. Xu, S.-J. Bao, L.-B. Kong, H. Li, H.-L. Li, J. Solid State Chem. 179 (2006) 1351.
[42] S. Chou, F. Cheng, J. Chen, J. Power Sources 162 (2006) 727.
[43] M.E. Armacanqui, R.J. Ekern, J. Appl. Electrochem. 22 (1992) 722.
[44] S. Rodrigues, N. Munichandraiah, A.K. Shukla, J. Appl. Electrochem. 28 (1998) 1235.
[45] E. Preisler, J. Appl. Electrochem. 19 (1989) 559.
[46] F. Pico, J. Ibanez, T.A. Centeno, C. Pecharroman, R.M. Rojas, J.M. Amarilla, J.M. Rojo, Electrochimica Acta 51 (2006) 4693.
[47] D.R. Burri, K.M. Choi, D.-S. Han, J.-B. Koo, S.-E. Park, Catalysis Today 115 (2006) 242.
[48] Y. Sato, K. Yomogida, T. Nanaumi, K. Kobayakawa, Y. Ohsawa, M. Kawai, Electrochem. Solid-State Lett. 3 (2000) 113.
[49] J.Zang, D. Jiang, B.Chen, J. Zhu, L. Jiang, H. Fang, J. Electrochem. Soc. 148-12 (2001) A1362.
[50] K.B. Wiberg, C.J. Deutsch, J. Rocek, J. Am. Chem. Soc. 95-9 (1973) 3034.
[51] S. Music, M. Ristic, J. RadioAnal. and Nucl. Chem. 109-2 (1987) 495.

54 DRDC Atlantic CR 2007-233
[52] R.N. Reddy, R.G. Reddy, J. Power Sources 132 (2004) 315.
[53] J.H. Jang, A. Kato, K. Machida, K. Naoi, J. Electrochem. Soc. 152-2 (2006) A321.

DRDC Atlantic CR 2007-233 55
Annex A Nyquist diagrams
A.1 Polished titanium electrode.
0 200 400 600 800
0
-200
-400
-600
-800
Z"
Z'
before
after
Nyquist diagrams of polished titanium electrode (…̈…
) before and (…»…
) after electrochemical
reduction treatment in LiClO4 / acetonitrile

56 DRDC Atlantic CR 2007-233
A.2 Titanium electrode modified by H2O2 / (NH4)2HPO4.
0 200 400 600 800
0
-200
-400
-600
-800
Z"
Z'
before
after
Nyquist diagrams of titanium electrodes modified by chemical reaction in 1.5 M H2O2 / 2.5 M
(NH4)2HPO4 aqueous solution at 70°C for 1 h (…̈…
) before and (…»…
) after
electrochemical reduction treatment in LiClO4 / acetonitrile.

DRDC Atlantic CR 2007-233 57
A.3 Titanium electrode modified by NaOH aqueous solution.
0 500 1000 1500 2000 2500
0
-500
-1000
-1500
-2000
-2500
Z"
Z'
before
after
Nyquist diagrams of titanium electrodes modified by chemical reaction in 10 M NaOH aqueous solution at 110°C for 20 h (…̈…) before and (…»…) after electrochemical
reduction treatment in LiClO4 / acetonitrile.

58 DRDC Atlantic CR 2007-233
A.4 Titanium electrode modified by electrodissolution of Ti.
0 500 1000 1500
0
-500
-1000
-1500
Z"
Z'
before
after
Nyquist diagrams of titanium electrodes modified by by electrodissolution of Ti at +2.5 V vs Ag/AgCl for 1 h in 0.1 M LiClO4 / acetonitrile solution (…̈…) before and (…»…)
after electrochemical reduction treatment in LiClO4 / acetonitrile.

DRDC Atlantic CR 2007-233 59
A.5 Titanium electrode modified by electrodeposition from a TiClO4/acetonitrile solution.
0 125 250 375 500
0
-125
-250
-375
-500
Z"
Z'
before
after
Nyquist diagrams of titanium electrodes modified by electrodeposition of Ti from a TiClO4 / 0.1 M LiClO4 acetonitrile solution at -2.5 V vs Ag/AgCl for 1 h (…̈…) before and
(…»…) after electrochemical reduction treatment in LiClO4 / acetonitrile.

60 DRDC Atlantic CR 2007-233
A.6 Titanium electrode modified by electrodeposition from a TiF4/acetonitrile solution.
0 125 250 375 500
0
-125
-250
-375
-500
Z"
Z'
before
after
Nyquist diagrams of titanium electrodes modified by electrodeposition Ti form a 25mM TiF4/acetonitrile solution at -2.5 V vs Ag/AgCl for 1 h (…̈…) before and (…»…) after
electrochemical reduction treatment in LiClO4 / acetonitrile.

DRDC Atlantic CR 2007-233 61
A.7 Titanium electrode modified by NH4HF2 / NH4H2PO4.
0 500 1000 1500
0
-500
-1000
-1500
before
after
Z"
Z'
Nyquist diagrams of titanium electrodes modified by potentiostatic polarisation at +20 V for 6 h in NH4HF2 / NH4H2PO4 aqueous solution (…̈…) before and (…»…) after
electrochemical reduction treatment in LiClO4 / acetonitrile.

62 DRDC Atlantic CR 2007-233
List of symbols/abbreviations/acronyms/initialisms
CPE Constant Phase Element
DND Department of National Defence
OPI Office of Primary Interest
R&D Research & Development

DRDC Atlantic CR 2007-233 63
Distribution List
Document No.: DRDC Atlantic CR 2007-233
LIST PART 1: CONTROLLED BY DRDC Atlantic LIBRARY 5 DRDC Atlantic library file copies 2 Colin Cameron (1 CD + 1 paper) 1 Jeff Szabo (GL Tailored Polymers) 1 Calvin Hyatt (Head, Emerging Materials) 1 Ed Andrukaitis 1 Trish Huber 11 TOTAL PART 1 LIST PART 2: DISTRIBUTED BY DRDKIM 1 NDHQ/DRDC/DRDKIM (PDF copy) 1 TOTAL PART 2 LIST PART 3: EXTERNAL DISTRIBUTION 1 Prof. Michael Freund (paper) Department of Chemistry University of Manitoba Winnipeg, MB R3T 2N2 1 Prof. Alex Adronov (paper) Department of Chemistry McMaster University 1280 Main St. W Hamilton, ON L8S 4M1 2 Prof. Daniel Belanger (1 paper + 1 CD) Dept. de chimie Universite de Quebec a Montreal CP 888 Succ. Centre Ville Montreal, QC H3C 3P8 1 Prof. P.G. Pickup (paper) Dept. of Chemistry Memorial University of Newfoundland St. John’s, NL A1B 3X7
5 TOTAL PART 3
17 TOTAL COPIES

64 DRDC Atlantic CR 2007-233
This page intentionally left blank.

DOCUMENT CONTROL DATA (Security classification of title, body of abstract and indexing annotation must be entered when the overall document is classified)
1. ORIGINATOR (The name and address of the organization preparing the document. Organizations for whom the document was prepared, e.g. Centre sponsoring a contractor's report, or tasking agency, are entered in section 8.)
Département de chimie, Université de Québec à Montréal
CP 8888, Succ. Centre-ville Montréal Québec H3C 3P8
2. SECURITY CLASSIFICATION (Overall security classification of the document
including special warning terms if applicable.)
Unclassified
3. TITLE (The complete document title as indicated on the title page. Its classification should be indicated by the appropriate abbreviation (S, C, R or U) in parentheses after the title.)
Metal Oxide Materials and Collector Efficiency in Electrochemical Supercapacitors: First Annual Report
4. AUTHORS (last name, followed by initials – ranks, titles, etc. not to be used)
Chamoulaud, G.; Bélanger D.
5. DATE OF PUBLICATION (Month and year of publication of document.)
Oct 2007
6a. NO. OF PAGES (Total containing information, including Annexes, Appendices, etc.)
80
6b. NO. OF REFS (Total cited in document.)
53
7. DESCRIPTIVE NOTES (The category of the document, e.g. technical report, technical note or memorandum. If appropriate, enter the type of report, e.g. interim, progress, summary, annual or final. Give the inclusive dates when a specific reporting period is covered.)
Contract Report
8. SPONSORING ACTIVITY (The name of the department project office or laboratory sponsoring the research and development – include address.)
9a. PROJECT OR GRANT NO. (If appropriate, the applicable research and development project or grant number under which the document was written. Please specify whether project or grant.)
12sz07
9b. CONTRACT NO. (If appropriate, the applicable number under which the document was written.)
W7707-063348
10a. ORIGINATOR'S DOCUMENT NUMBER (The official document number by which the document is identified by the originating activity. This number must be unique to this document.)
10b. OTHER DOCUMENT NO(s). (Any other numbers which may be assigned this document either by the originator or by the sponsor.)
DRDC Atlantic CR 2007-233
11. DOCUMENT AVAILABILITY (Any limitations on further dissemination of the document, other than those imposed by security classification.)
( X ) Unlimited distribution
( ) Defence departments and defence contractors; further distribution only as approved
( ) Defence departments and Canadian defence contractors; further distribution only as approved
( ) Government departments and agencies; further distribution only as approved
( ) Defence departments; further distribution only as approved
( ) Other (please specify):
12. DOCUMENT ANNOUNCEMENT (Any limitation to the bibliographic announcement of this document. This will normally correspond to the
Document Availability (11). However, where further distribution (beyond the audience specified in (11) is possible, a wider announcement audience may be selected.))

13. ABSTRACT (A brief and factual summary of the document. It may also appear elsewhere in the body of the document itself. It is highly desirable that the abstract of classified documents be unclassified. Each paragraph of the abstract shall begin with an indication of the security classification of the information in the paragraph (unless the document itself is unclassified) represented as (S), (C), (R), or (U). It is not necessary to include here abstracts in both official languages unless the text is bilingual.)
This report deals with the development of electrochemical supercapacitor based on MnO2/RuO2
binary oxides and using titanium as current collector. Nanostructured titanium electrodes, withsufficient conductivity were obtained using several methods. We found that MnO2/RuO2 binaryoxides cannot be electrodeposited on titanium without dramatically increasing the resistance ofthe electrode. An alternative for the preparation of MnO2/RuO2 binary oxides by the co-precipitation method was also investigated and is described in this report.
14. KEYWORDS, DESCRIPTORS or IDENTIFIERS (Technically meaningful terms or short phrases that characterize a document and could be helpful in cataloguing the document. They should be selected so that no security classification is required. Identifiers, such as equipment model designation, trade name, military project code name, geographic location may also be included. If possible keywords should be selected from a published thesaurus, e.g. Thesaurus of Engineering and Scientific Terms (TEST) and that thesaurus identified. If it is not possible to select indexing terms which are Unclassified, the classification of each should be indicated as with the title.)
Supercapacitor electrodes, metal oxides

This page intentionally left blank.