Metahara Sugar Factory in Oromia Regional State 200 km ...
38
Opportunity for Ethanol Fuel Production in Ethiopia Bioethanol as a Clean Cooking Fuel 8th Bioenergy Week, 16 – 18 March 2021 Metahara Sugar Factory in Oromia Regional State 200 km from Addis Ababa. 10,000 ha sugar under cultivation. Distillery capacity of 12.5 million liters/year
Transcript of Metahara Sugar Factory in Oromia Regional State 200 km ...

Opportunity for Ethanol Fuel Production in Ethiopia
Bioethanol as a Clean Cooking Fuel8th Bioenergy Week, 16 – 18 March 2021
Metahara Sugar Factory in Oromia Regional State 200 km from Addis Ababa. 10,000 ha sugar under cultivation. Distillery capacity of 12.5 million liters/year

What does ethanol offer as a cooking fuel? Technically simple – Ethanol cooking fuel is straight forward. While fuel blending with gasoline is complicated and must have upgraded fuel infrastructure, stove fuel sales and handling are straight forward. Lucrative market for producers – Ethanol for cooking can support prices equal to or better than blending. Scalable market – The cookstove fuel market is as big or bigger than the blending market. A 5% penetration of stoves in Addis Ababa would demand 50 million liters of ethanol per year. Dependable market – Once people cook with ethanol, they depend on it. Demand will not go away, only increase. Import substitution – Ethanol is a modern, clean, localfuel. It is an excellent replacement for both LPG and kerosene. Ethanol stoves can be made locally. Social dividends – The payback to society is high. The Ethiopian Sugar Corporation becomes even more important to the nation than it already is.

Cooking represents 70% to 90% of total energy demand in most developing countries. UN agencies and NGOs have been trying to address this need with “improved combustion” wood and charcoal-burning stoves. These have largely failed to deliver. The World Health Organization is calling for cleaner-burning stoves. Thus, a new approach is needed.
Why Cooking with Ethanol?
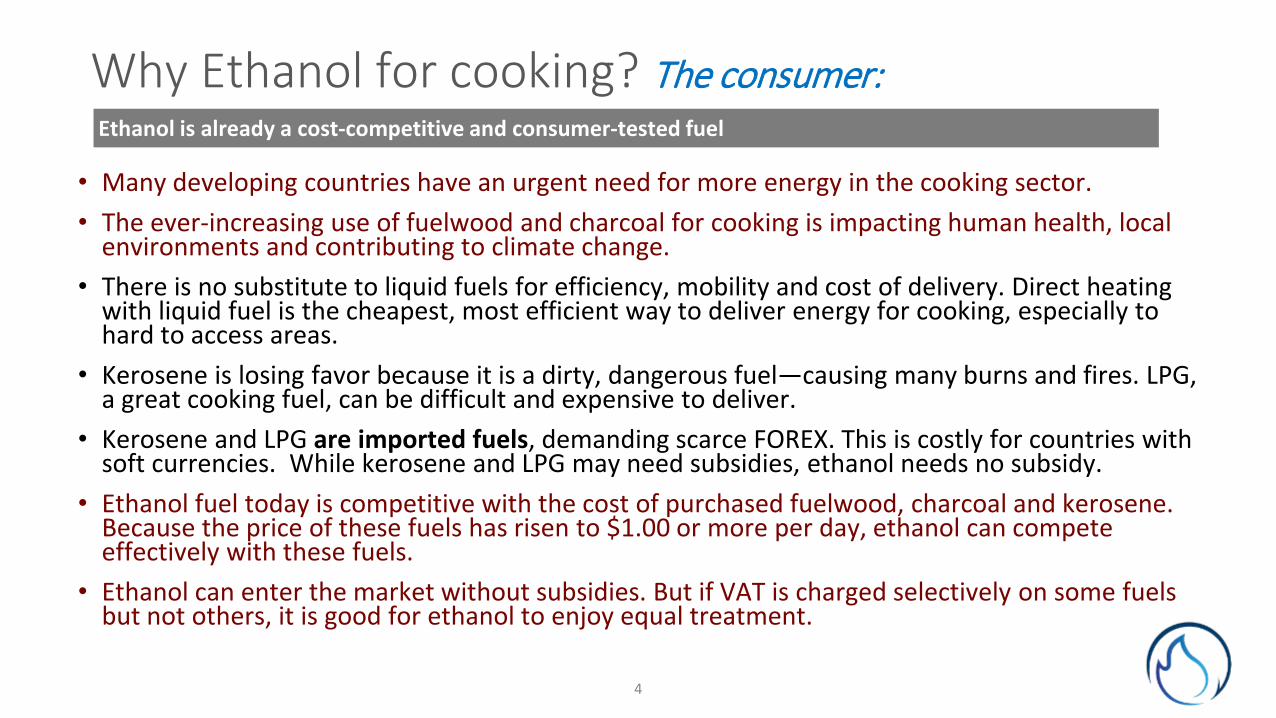
Why Ethanol for cooking? The consumer:
• Many developing countries have an urgent need for more energy in the cooking sector. • The ever-increasing use of fuelwood and charcoal for cooking is impacting human health, local
environments and contributing to climate change. • There is no substitute to liquid fuels for efficiency, mobility and cost of delivery. Direct heating
with liquid fuel is the cheapest, most efficient way to deliver energy for cooking, especially to hard to access areas.
• Kerosene is losing favor because it is a dirty, dangerous fuel—causing many burns and fires. LPG,a great cooking fuel, can be difficult and expensive to deliver.
• Kerosene and LPG are imported fuels, demanding scarce FOREX. This is costly for countries with soft currencies. While kerosene and LPG may need subsidies, ethanol needs no subsidy.
• Ethanol fuel today is competitive with the cost of purchased fuelwood, charcoal and kerosene. Because the price of these fuels has risen to $1.00 or more per day, ethanol can compete effectively with these fuels.
• Ethanol can enter the market without subsidies. But if VAT is charged selectively on some fuels but not others, it is good for ethanol to enjoy equal treatment.
4
Ethanol is already a cost-competitive and consumer-tested fuel
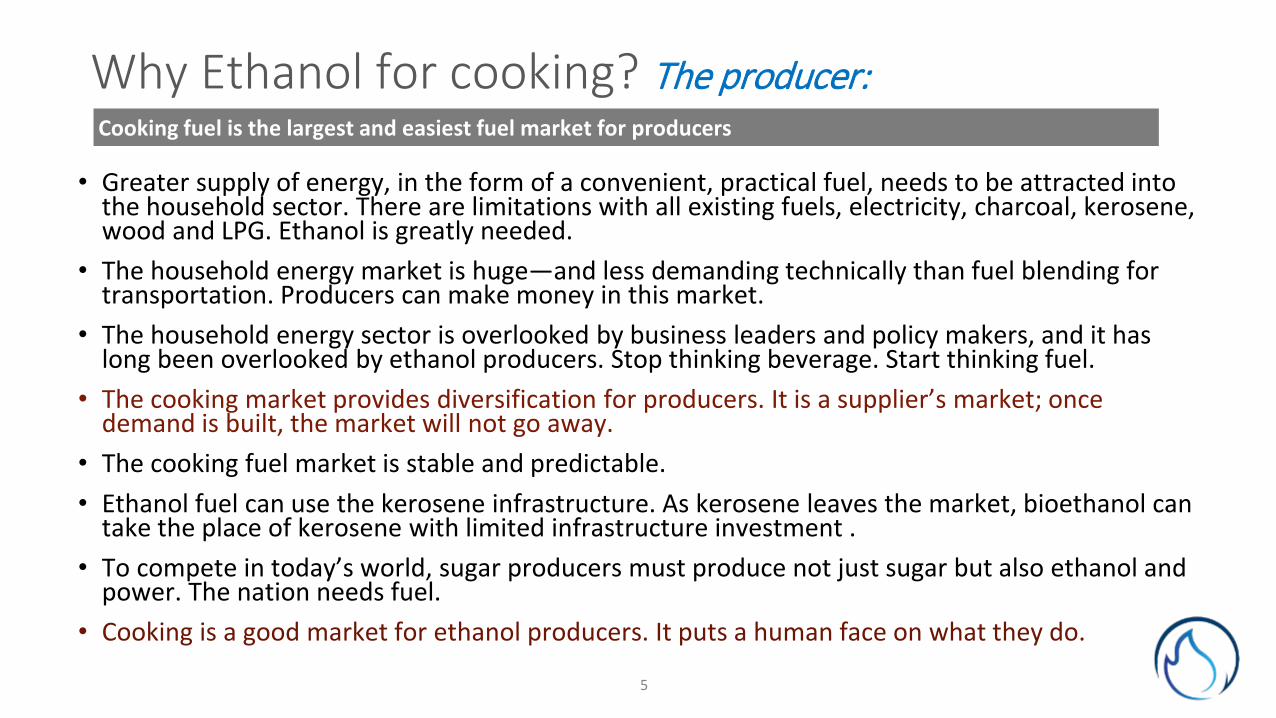
Why Ethanol for cooking? The producer:
• Greater supply of energy, in the form of a convenient, practical fuel, needs to be attracted into the household sector. There are limitations with all existing fuels, electricity, charcoal, kerosene, wood and LPG. Ethanol is greatly needed.
• The household energy market is huge—and less demanding technically than fuel blending for transportation. Producers can make money in this market.
• The household energy sector is overlooked by business leaders and policy makers, and it has long been overlooked by ethanol producers. Stop thinking beverage. Start thinking fuel.
• The cooking market provides diversification for producers. It is a supplier’s market; once demand is built, the market will not go away.
• The cooking fuel market is stable and predictable.• Ethanol fuel can use the kerosene infrastructure. As kerosene leaves the market, bioethanol can
take the place of kerosene with limited infrastructure investment .• To compete in today’s world, sugar producers must produce not just sugar but also ethanol and
power. The nation needs fuel. • Cooking is a good market for ethanol producers. It puts a human face on what they do.
Cooking fuel is the largest and easiest fuel market for producers
5

Losing ground: In Africa, of 29 million new peopleadded in 2012-14, only 4 million had some access to clean energy, while 25 million did not.
Hardly gaining: In Asia, of 94 million new people added during the same period, 54 million had access to clean energy while 40 million did not.
Of 3.04 billion people without access to clean energy, 807 million are in Sub-Saharan Africa and 2.1 billion in Asia.
We cannot not solve the problem of cooking and energy access only with LPG or more efficient use of wood and charcoal stoves. We need another clean fuel option in addition to LPG. And we need a fuel that is produced locally, within the Tanzanian economy that does not demand the use of FOREX.
6
Cooking fuel is the largest and easiest fuel market for producers
Lessons from the Global Tracking Framework:

methanol
ethanol
Why ethanol, why alcohols? A little chemistry
7

Kerosene is a mixture of hydrocarbons with number of carbon atoms ranging from 6 till 16. Its chemical formula might look like this: C16H32.
All of this carbon takes a lot of oxygen to burn up. It is the unburned carbon which causes smoke and soot.
LPG is a mixture of prominently two hydrocarbons propane (C3H8) and butane (C4H10). So, although a fossil fuel, LPG burns much cleaner.
Kerosene has too much carbon. LPG has less. And ethanol, even less. Plus, an oxygen!
8
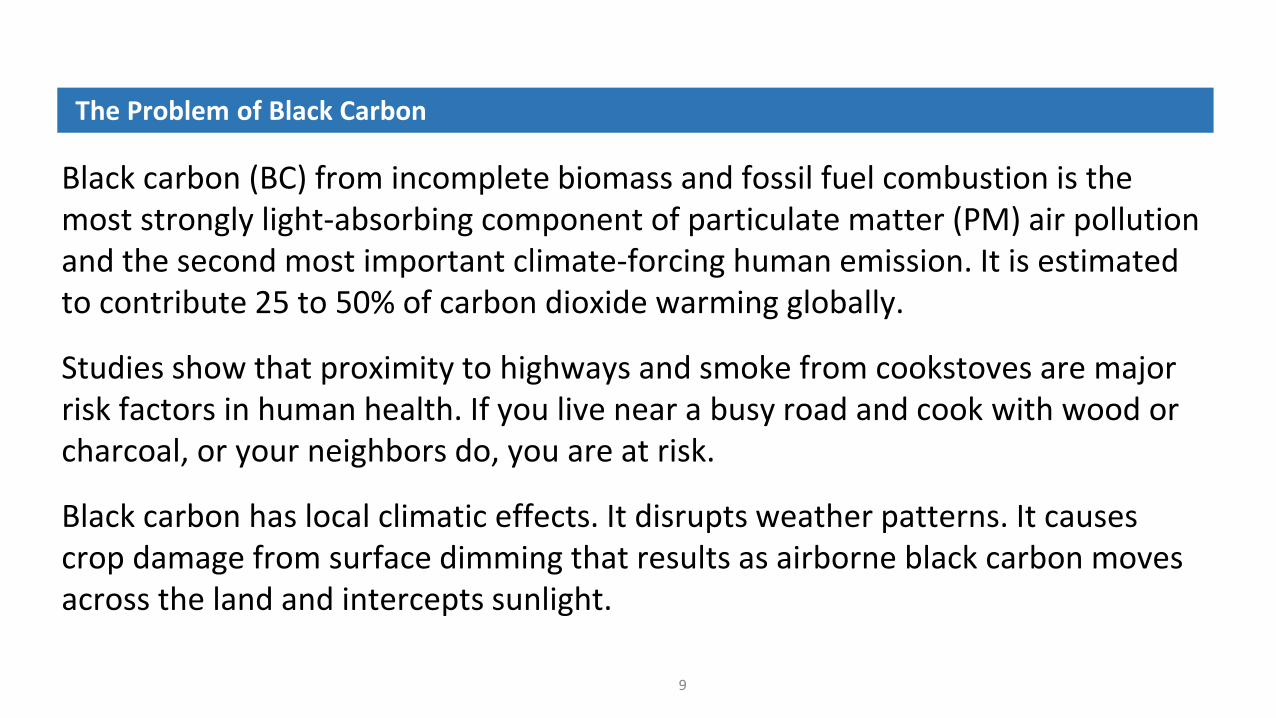
Black carbon (BC) from incomplete biomass and fossil fuel combustion is the most strongly light-absorbing component of particulate matter (PM) air pollution and the second most important climate-forcing human emission. It is estimated to contribute 25 to 50% of carbon dioxide warming globally.
Studies show that proximity to highways and smoke from cookstoves are major risk factors in human health. If you live near a busy road and cook with wood or charcoal, or your neighbors do, you are at risk.
Black carbon has local climatic effects. It disrupts weather patterns. It causes crop damage from surface dimming that results as airborne black carbon moves across the land and intercepts sunlight.
The Problem of Black Carbon
9

Rural cooking smoke is making Delhi air pollution worse (Oct. 26, 2017)Ambient air pollution in Delhi has worsened. Multiple sources contribute to this increase, including industry, transport, dust, waste burning, seasonal crop burning (outside Delhi), power plants, and diesel generator sets.
One often overlooked source is coming from the homes of people living beyond Delhi's city limits. That source is cooking and space heating using solid fuels.http://cleancookstoves.org/about/news/10-26-2017-rural-cooking-smoke-is-making-delhi-air-pollution-worse.html

11
Addis Ababa’s annual average concentration of fine particulate matter (PM2.5) is three times the World Health Organization (WHO) guidelines. This is raising serious health concerns among its residents.
A 2017 Global Burden of Disease Study showed that air pollution is the second highest risk factor for death and disability in Ethiopia. It is estimated to be responsible for 2,700 deaths annually in Addis Ababa alone. Without action to control air pollution, this figure is estimated to rise to 6,200 deaths annually by 2025.
Addis Ababa’s major air pollution sources are transport, industry, waste management facilities, and smoke from household cooking.
Source: https://breathelife2030.org/news/addis-ababa-ethiopia-celebrates-first-international-day-clean-air-blue-skies/

12
Every morning and evening, Addis Ababa fills with smoke from cooking fires. India’s urban pollution must serve as warning to African cities.

13
Thirteen sugar factories planned, under construction or operating, with a projected 3.6 million mt of sugar, 339 million liters ethanol, and 250 MW excess power to the grid.
Current production, about 400,000 mt sugar and 21 million liters ethanol. (Current sugar demand 720,000 tons.)
Ethiopia’s Ambitious Sugar and Ethanol Production Plans

14
Sugar Factory Sugar Ethanol Electricity StatusFinchaa Sugar Factory 270,000 mt 20 million liters, producing 31 MW, 10 MW to grid Operating, producing ethanol
Metahara Sugar Factory 136,000 mt 12 million liters, producing 9 MW Operating, producing ethanol
Wonji Shoa Sugar Factory 220,000 mt 12.8 million liters, projected 31 MW, 20 MW to grid Sugar factory modernization completed.
Omo-Kuraz Sugar Factories I, II, III and IV
1,250,000 mt total
140 million liters, projected total
225 MW, 145 MW to grid Two plants completed, two under construction
Kessem Sugar Factory 260,000 mt 30 million liters, projected 26 MW, 15 MW to grid Producing sugar and power
Tendaho 300,000 mt 31 million liters, projected 60 MW, 38 MW to grid Sugar production trials completed
Arjo Diddessa 230,000 mt 12 million liters, projected Operating
Wolkaiyt Sugar Factory 484,000 mt 41.6 million liters, projected Construction 95% completed
Tana Beles Sugar, 2 plants 484,000 mt 40 million liters, projected 45 MW, 25 MW to grid
Production in 2019 400,000 mt 21 million liters Imported 410,000 tons sugar in 2019
Eventual capacity 3,634,000 mt 339 million liters 250 MW to grid Current: ENA, REN and fuel uses.
Current demand 720,000 mt 6 – 10 million liters used in blending
Source: https://etsugar.com/projects/
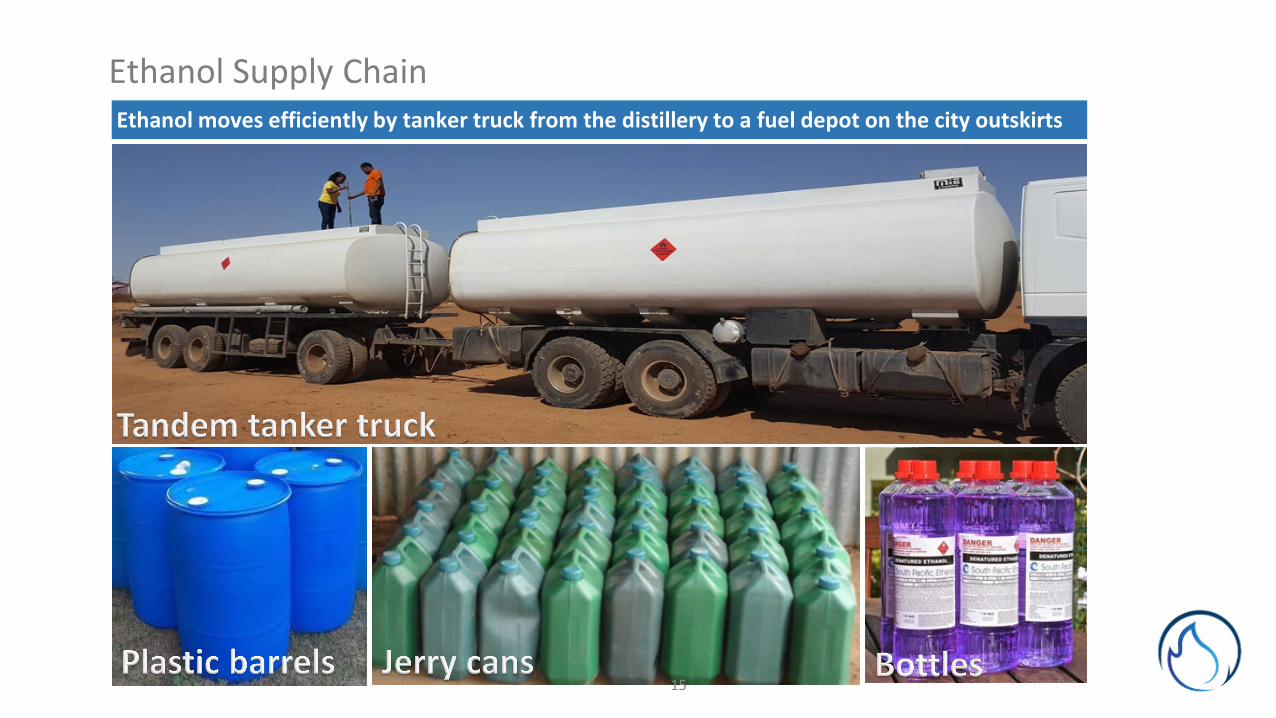
Ethanol Supply ChainEthanol moves efficiently by tanker truck from the distillery to a fuel depot on the city outskirts
15

16
A stove manufacturing company, A&H Development Solutions, is ready to manufacture the ethanol stove and distribute both stoves and fuel widely in Addis Ababa, as soon as government authorities agree to allocate ethanol for stove fuel. An ethanol stove carbon finance program is ready to subsidize stove purchases for consumers.

17
An ethanol stove using 1 liter of ethanol will displace 2½ to 4 kg of charcoal per day and 8 to 12 kg of fuelwood. It will displace 1.2 liters of kerosene and 0.5 kg (1 liter) of LPG.
Under the Project Gaia cookstove program of activities, a stove will earn 4 to 6 tons of CO2-e per year.
18
In 2015 Gaia Clean Energy and its collaborators published a comprehensive national strategy for Ethiopia on how to scale up ethanol fuel. This was funded by the Strageic Climate Institutions Program (SCIP). SCIP’s purpose is build Ethiopia's capacity to cope with climate change and respond to the challenges of transitioning to a climate resilient green economy. The Ethiopian Biofuels Directorate was an important collaborator in the study. Topics covered: Policy Brief on Ethanol Fuels Ethanol micro distilleries and ethanol stoves—Technology Brief Feedstock Resources for Bioethanol Production Market, Financial and Economic Analysis Household Energy Assessment Marketing Strategy Private Sector Development Brief
This was called a “holistic study” because it was designed to be comprehensive. It is a valuable resource at hand to serve government and the private sector.
One of the key strategies it laid out is the approach of “micro-distilleries,” 1,000 to 5,000 daily liters of production in size, designed to fit farm scale operations and exploit niche feedstocks.

19

Micro Distilleries: Producing from Dedicated Feedstock Supplies
20
2,500 liter/day micro distillery in Ilori, Nigeria
21
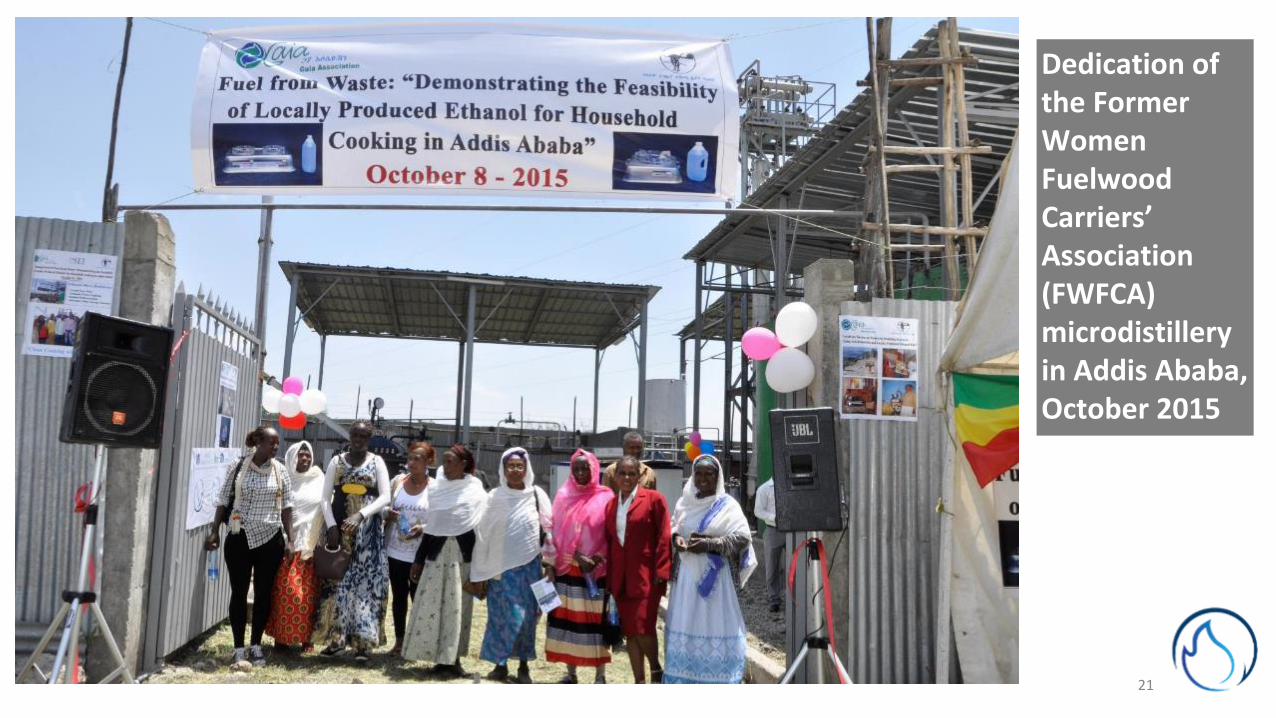
Dedication of the Former Women Fuelwood Carriers’ Association (FWFCA) microdistillery in Addis Ababa, October 2015

1,000 Liter / Day Molasses Based ethanol microdistillery (EMD) built by Gaia Clean Energy in partnership with the Former Women Fuelwood Carriers’ Association (FWFCA)

Stainless-steel Yeast activation/multiplication vessel
Yeast Propagation / Multiplication
23

Fermentation recirculation pump
Fermentation process
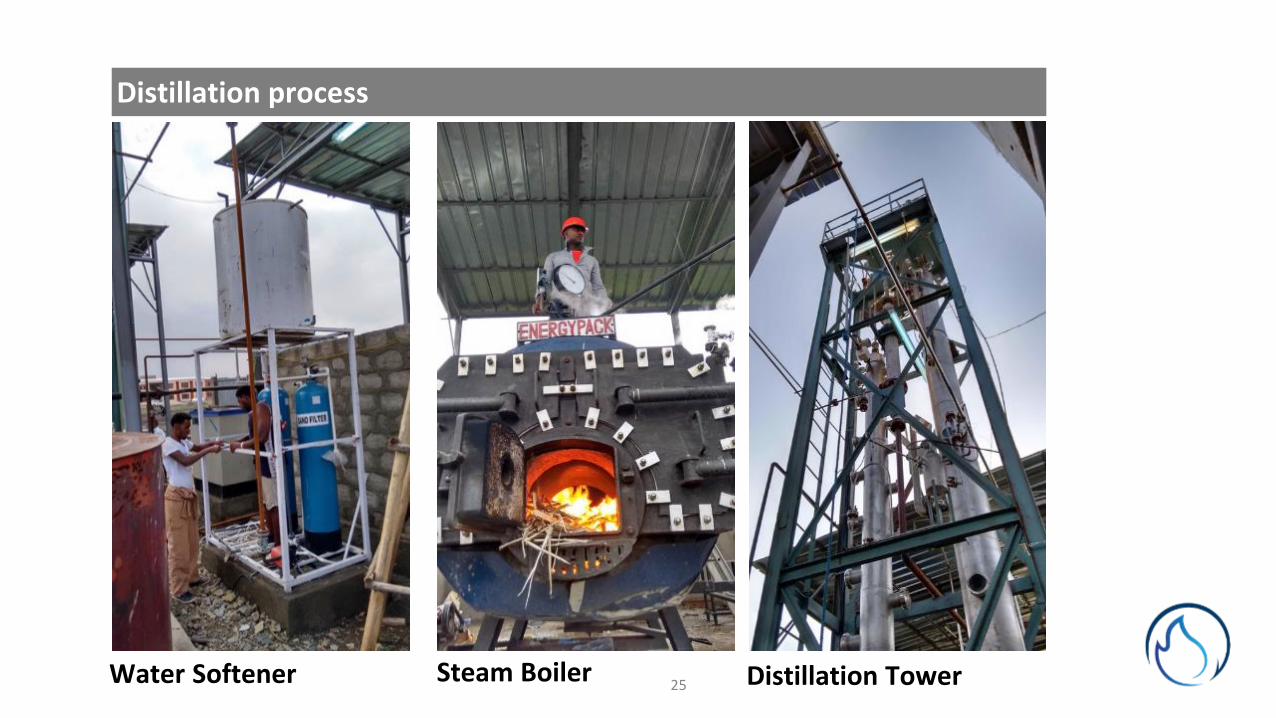
Water Softener Steam Boiler Distillation Tower
Distillation process
25

26
FWFCA women producing ethanol at the plant.

27
A new micro distillery opportunity: ACOS Ethiopia P.L.C., a leading bean exporting company, located in Adama
The Acos 5,000 liter/day distillery and protein extraction plant will produce protein for human consumption, ethanol for cooking fuel, and a high-quality animal feed for cattle.

28
Food and Fuel: Protein Extraction, Ethanol and Animal Food Processing from Rejected Beans
Rejected beans have little value and cannot be fed raw to animals. They are processed enzymatically, protein and starch are extracted (starch to ethanol), and the remaining enzyme-enriched material is a highly digestible animal feed.

29
Addis Ababa Head Office+251115541337+251911231706General Manager : Kassahun Bekele
AdamaPlant+251221115139 +251914303508Plant Manger: Girma ZewudeACOS ETHIOPIA P.L.C. Adama
Rajneesh Tyagi, Chief Executive OfficerSpectrum Technologies LtdManaging Director, Proveta Nutrition, Ltd.
Kassahun Bekele and Rajneesh Tyagi are soliciting partnership interest in the ACOS Bean Distillery and Protein Extraction Plant.
If interested, please contact ACOS, or you may contact us at Project Gaia / Gaia Clean Energy.

30
Financial Planning and Analysis
Project Gaia is assisting with this project and has developed a sophisticated EXCEL Model to assess opportunity.
Fuel Producer’s Business Opportunity
Project Gaia and Gaia Clean Energy will work with any client to develop his or her business plan, technical approach and
step by step implementation for producing ethanol fuel.

31
Financial Model Description
Assumptions
Input Worksheet
Output Worksheet
Calculations:Fixed Assets
Depreciation & Amortization ExpensesWorking capital requirements
Investment Cost and Financing SourcesLoan Repayment
Purchases, Inventory and SalesRevenue
Cost of SalesInventory
Staff-related costsMarketing and Promotion
Overhead CostsPro forma financial statements
Financial return(1) Input Worksheet. The Input worksheet comprise various assumptions (e.g. currency exchange rate, tax rate, RBF incentive amounts, fixed assets, depreciation methods, working capital requirements, loan amounts and terms, sales targets, selling prices, staffing costs, marketing activities and costs, and overhead costs), which are derived from the project documents or from other relevant sources.
The worksheet is designed to allow users to be able to change the numbers used in the model, but not the formulas.
(2) Calculation Worksheet. The worksheet contain various calculations such as: economic projections, sources and uses of funds, operations and maintenance, project revenue, loan repayment, and miscellaneous calculations.
(3) Output Worksheet. This worksheet includes pro forma financial statements: cash flow statement income statement, and balance sheet and key ratios, net present value (NPV), and interest rate of return (IRR).
Key financial ratios

32
Use of the Financial ModelProject stage Promoter (UNIDO) Service Provider Verification Agent
1. Pre-proposal stage
• Modify the assumptions in the model and estimate cost of procurement
• Evaluate the impact of taxes and negotiate tax rates with the Government Authority
• Facilitate the submission of standardized, comparable and complete financial proposals from bidders
• Modify the assumptions in the model in order to test the sensitivity of financial viability – which scenarios will generate enough cash flow and reasonable return on investment while being the lowest financial offer
2. Bidding and contract negotiation stage
• Evaluate whether assumptions in the financial model submitted by bidders are realistic; predict project performance and value for money
• Negotiate incentive amounts with the bidders
• Negotiate incentive payment amounts with the bidders
3. Operation stage • Monitor and track project performance • Assess the impact of changes in
assumptions overtime and negotiate new incentive amount
• Monitor and track project performance
• Assess the impact of changes in assumptions overtime and negotiate new incentive amount
• Monitor and track project performance

General Assumptions:Project life (in years ): 15 yearsExchange rate: local currency units per US$ 1: 31.88Plant capacity (in liters per day ): 1,500 liters/dayAverage ethanol production (in liters per day): 1,200 liters/dayNumber of working (in days per year): 300 days/yearSugarecane feedstock price (in US$ per tonnes): $16 per tonneEthanol yield (in liters per tonne of feedstock input): 58 liters/tonneEthanol factory gate price (in US$ per liter): $0.68 per literCorportat profit Tax (as percent of annual profit): 10.00%
InvestmentsInitial Investment (including taxes, if any):Land cost $10,000.00Civil works and buildings $30,000.00Plant machinery, equipment, commissioning
Sugarcane milling $50,000.00Distillation unit $185,000.00Generator, 45 KVA diesel generator $20,000.00Vinasses conversion to low-grade fertilizer $5,000.00Labaratory Equipment $3,000.00Transport of plant machinery, equipment to site $7,500.00Plant commissioning and staff training $20,000.00
Office Equipment and furnture $10,000.00Vehicles $20,000.00Pre-operative expenses $5,000.00
Financing:Loan(s) Amount $200,000.00Grace period (in years) 2 yearsLoan Repayment period (in years) 5 yearsLong-term Lan Borrowing interest rate (in percent per year) 10.00%
Depreciation/amortaization Rate:Land cost 10.00%Civil works and buildings (in percent): 5.00%Plant machinery, equipment and commissioning (in percent): 6.67%Office Equipment and furnture (in percent): 20.00%Vehicle and other fixed assets (in percent): 20.00%Pre-operating expeneses (in percent): 20.00%
Working capital requirementsSugarcane feedstock (in number of months): 90 daysDiesel fuel (in consumption in number of months): 90 daysChemicals 3 monthsSalaries and wages 3 months
O&M CostsDiesel consumption 25 liters/dayPurchase price of diesel fuel $0.68 per literChemical inputs $1,125 per monthWater bill $0 per monthOther costs $50 per monthRepair & Maintenance (as percent of cost of plant machinery) 1.50%
Key Assumptions

Key Assumptions Salaries and benefitsPosition Number SalaryGeneral Manager 1 number $300 per monthProcess Engineer 1 number $250 per monthBoiler Operators 3 number $150 per monthFermentation & Distilation 3 number $150 per monthFeedstock preparation 3 number $120 per monthAdministration & General Service 1 number $150 per monthAccountant 1 number $150 per monthCashier 1 number $150 per monthMarketing 1 number $150 per monthDriver 1 number $120 per monthCleaning 4 number $100 per monthGuards 4 number $100 per monthPosition name 0 number $0 per monthPosition name 0 number $0 per month
Provident Fund (as a percentage of salaries) 2.50%Salary Increases (as an annual percentage): 0.00%
Staff uniforms $500 yearTelecom & Posts $600 yearMarketing Expenses $1,200 yearOffice Supplies $600 yearLegal & Audit fees $1,000 yearFuel and Lubricants $2,400 yearMiscellaneous expeneses $0 year
Personnel Insurance (as a percentage of salaries) 2.00%Plant Insurance (as a percentage of investment cost) 1.50%
Chemical input and costs
Input requirement for 30 Days for 1000 liters/day plant capacity
Description Unit Quantity Price, US$Active -Dry Yeast (saccharomyces cerevisiae) kg 10 50 Urea kg 100 50 Znso4 and Mgso4 kg 50 250 Phosphoric Acid(H3PO4) liters 50 325 Sulphuric Acid (H2SO4) liters 50 100 Polybion Injection Of Vitamin B-complex(2ml) vials 15 75 Detergent For Fermentor Cleaning (1 Kg) kg 20 35 Cleaning material (brush) piece 4 15 Lime (powder) kg 150 35 Antibiotic(oxytetracycline) 300 15 Procanepenicilline or Benzil Penicilline (10 lac units) vials 75 50 DAP (Disodium Ammonium Phosphate) kg 15 5 Antifoam Agent liters 50 20 For Softener (NaCl) kg 50 10 For Cooling Tower (Anti Scavet, Anti Alagi, Anti Bacteria) liters 50 15 Saw dUSt/Agroforest kg 2,000 75
Total cost 1,125 Chemical cost, per liter of ethanol 0.03

Discounted Cash Flow
Discounted Cash Flow - Total Capital InvestedJan/19 Jan/20 Jan/21 Jan/22 Jan/23 Jan/24 Jan/25 Jan/26 Jan/27 Jan/28 Jan/29 Jan/30 Jan/31 Jan/32 Jan/33 Jan/34
Cash OutflowFixed investment
Land cost 10,000 - - - - - - - - - - - - - - - Civil works and buildings 30,000 - - - - - - - - - - - - - - - Plant machinery, equipment, commissioning 290,500 - - - - - - - - - - - - - - - Office Equipment and furnture 10,000 - - - - 10,000 - - - - 10,000 - - - - - Vehicles 20,000 - - - - 20,000 - - - - 20,000 - - - - - Pre-operative expenses 5,000 - - - - - - - - - - - - - - -
Interest payment on long-term loan - - - 31,079 27,804 24,200 20,236 15,876 - - - - - - - - Repayment of Long-term Loan - - - 32,759 36,035 39,639 43,603 47,963 - - - - - - - - Profit tax - - 2,014 1,814 1,594 1,991 2,427 3,006 3,534 4,114 4,114 4,114 4,214 4,214 4,214 4,214 Total Cash Outflow 365,500 - 2,014 65,653 65,433 95,830 66,266 66,845 3,534 4,114 34,114 4,114 4,214 4,214 4,214 4,214
Cash inflow - - Operating Income before depreciation - 69,009 69,009 69,009 69,009 69,009 69,009 69,009 69,009 69,009 69,009 69,009 69,009 69,009 69,009 69,009 Total Cash inflow - 69,009 69,009 69,009 69,009 69,009 69,009 69,009 69,009 69,009 69,009 69,009 69,009 69,009 69,009 69,009
Net cashflow (365,500) 69,009 66,995 3,356 3,576 (26,821) 2,743 2,164 65,475 64,895 34,895 64,895 64,795 64,795 64,795 64,795
Return on Investent (ROI)NPV at loang-term loan borrowing interest rate ($81,977.28)NPV at 5% discount rate $27,855.16NPV at 7.5% discount rate ($36,115.32)Internal Rate of Return (IRR) on Equity 6.0%
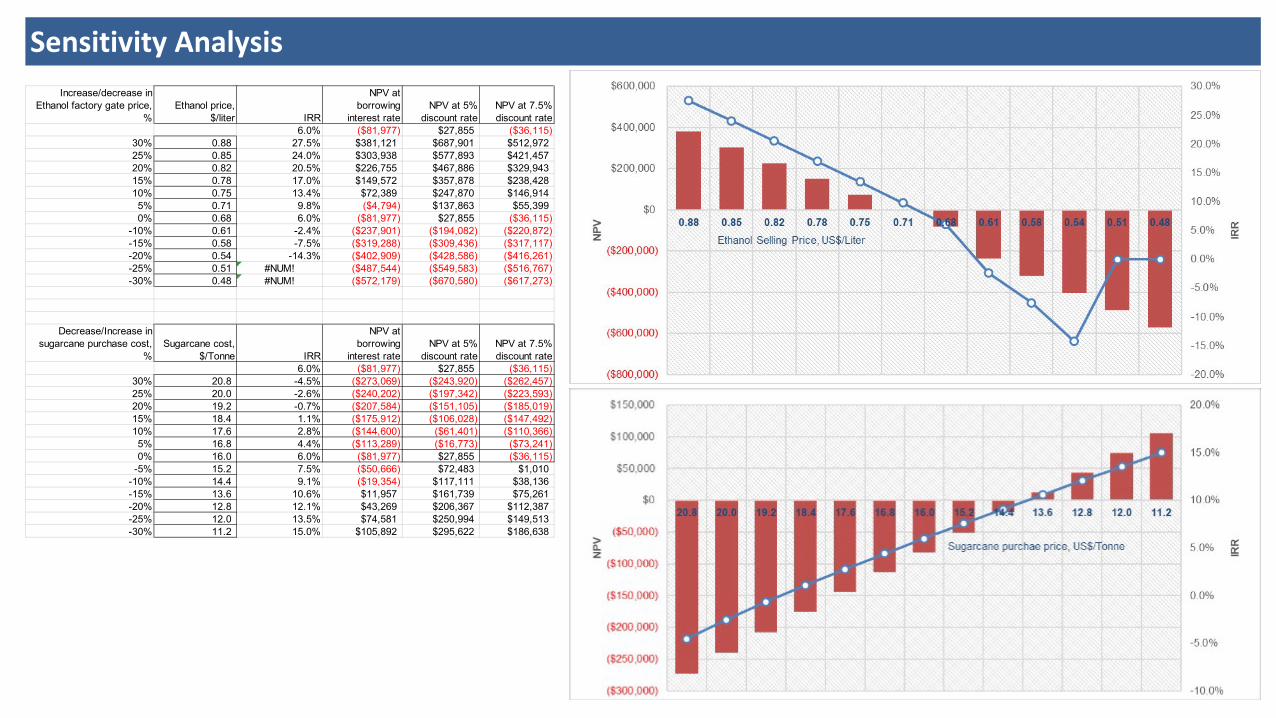
Sensitivity AnalysisIncrease/decrease in
Ethanol factory gate price, %
Ethanol price, $/liter IRR
NPV at borrowing
interest rateNPV at 5%
discount rateNPV at 7.5% discount rate
6.0% ($81,977) $27,855 ($36,115)30% 0.88 27.5% $381,121 $687,901 $512,97225% 0.85 24.0% $303,938 $577,893 $421,45720% 0.82 20.5% $226,755 $467,886 $329,94315% 0.78 17.0% $149,572 $357,878 $238,42810% 0.75 13.4% $72,389 $247,870 $146,9145% 0.71 9.8% ($4,794) $137,863 $55,3990% 0.68 6.0% ($81,977) $27,855 ($36,115)
-10% 0.61 -2.4% ($237,901) ($194,082) ($220,872)-15% 0.58 -7.5% ($319,288) ($309,436) ($317,117)-20% 0.54 -14.3% ($402,909) ($428,586) ($416,261)-25% 0.51 #NUM! ($487,544) ($549,583) ($516,767)-30% 0.48 #NUM! ($572,179) ($670,580) ($617,273)
Decrease/Increase in sugarcane purchase cost,
%Sugarcane cost,
$/Tonne IRR
NPV at borrowing
interest rateNPV at 5%
discount rateNPV at 7.5% discount rate
6.0% ($81,977) $27,855 ($36,115)30% 20.8 -4.5% ($273,069) ($243,920) ($262,457)25% 20.0 -2.6% ($240,202) ($197,342) ($223,593)20% 19.2 -0.7% ($207,584) ($151,105) ($185,019)15% 18.4 1.1% ($175,912) ($106,028) ($147,492)10% 17.6 2.8% ($144,600) ($61,401) ($110,366)5% 16.8 4.4% ($113,289) ($16,773) ($73,241)0% 16.0 6.0% ($81,977) $27,855 ($36,115)
-5% 15.2 7.5% ($50,666) $72,483 $1,010-10% 14.4 9.1% ($19,354) $117,111 $38,136-15% 13.6 10.6% $11,957 $161,739 $75,261-20% 12.8 12.1% $43,269 $206,367 $112,387-25% 12.0 13.5% $74,581 $250,994 $149,513-30% 11.2 15.0% $105,892 $295,622 $186,638


Our contacts at Project Gaia:
Desalegn Getaneh, Director of Gaia Clean Energy [email protected]
Wubshet Tadele, Project Gaia, Inc: [email protected]
Harry [email protected]
38