METADATA AND NUMERICAL DATA CAPTURE: Vapor-Liquid Equilibria: PTxy
32
This tutorial describes METADATA AND NUMERICAL DATA CAPTURE: for Vapor-Liquid Equilibria (2 components) PTxy with the Guided Data Capture (GDC) software. Guided Data Capture (GDC) METADATA AND NUMERICAL DATA CAPTURE: Vapor-Liquid Equilibria: PTxy (2 component mixture)
Transcript of METADATA AND NUMERICAL DATA CAPTURE: Vapor-Liquid Equilibria: PTxy
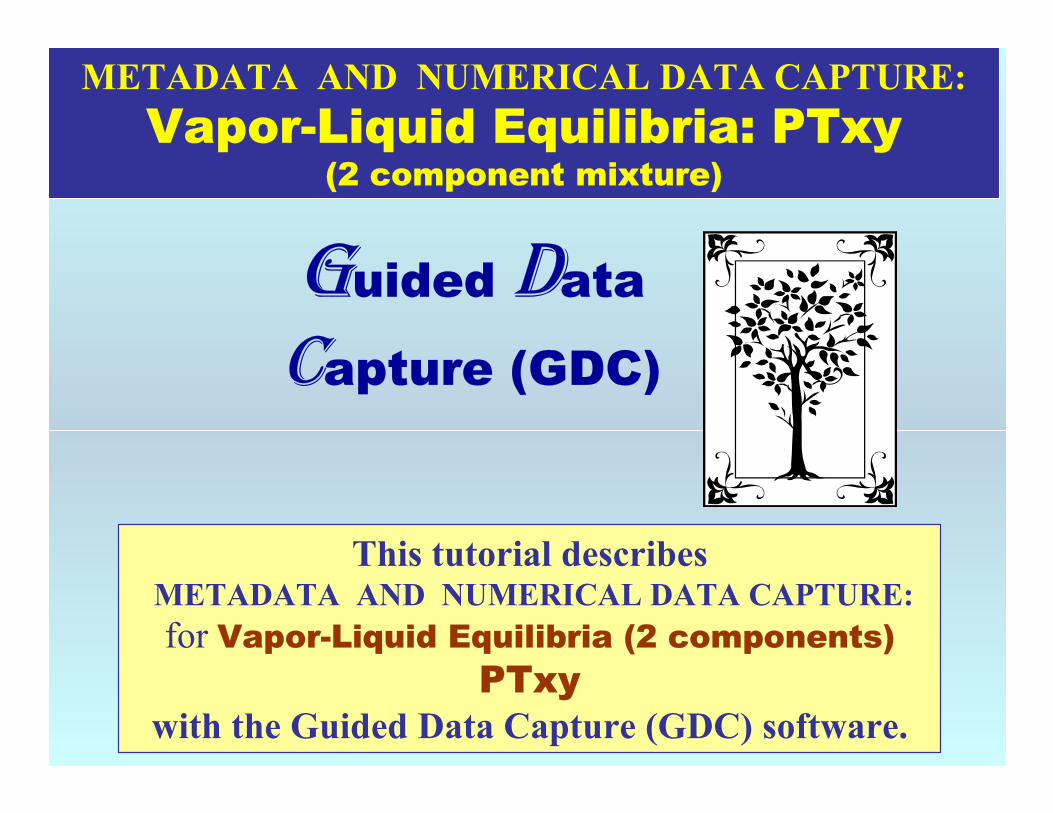
This tutorial describes METADATA AND NUMERICAL DATA CAPTURE:for Vapor-Liquid Equilibria (2 components)
PTxywith the Guided Data Capture (GDC) software.
Guided Data
Capture (GDC)
METADATA AND NUMERICAL DATA CAPTURE:Vapor-Liquid Equilibria: PTxy
(2 component mixture)
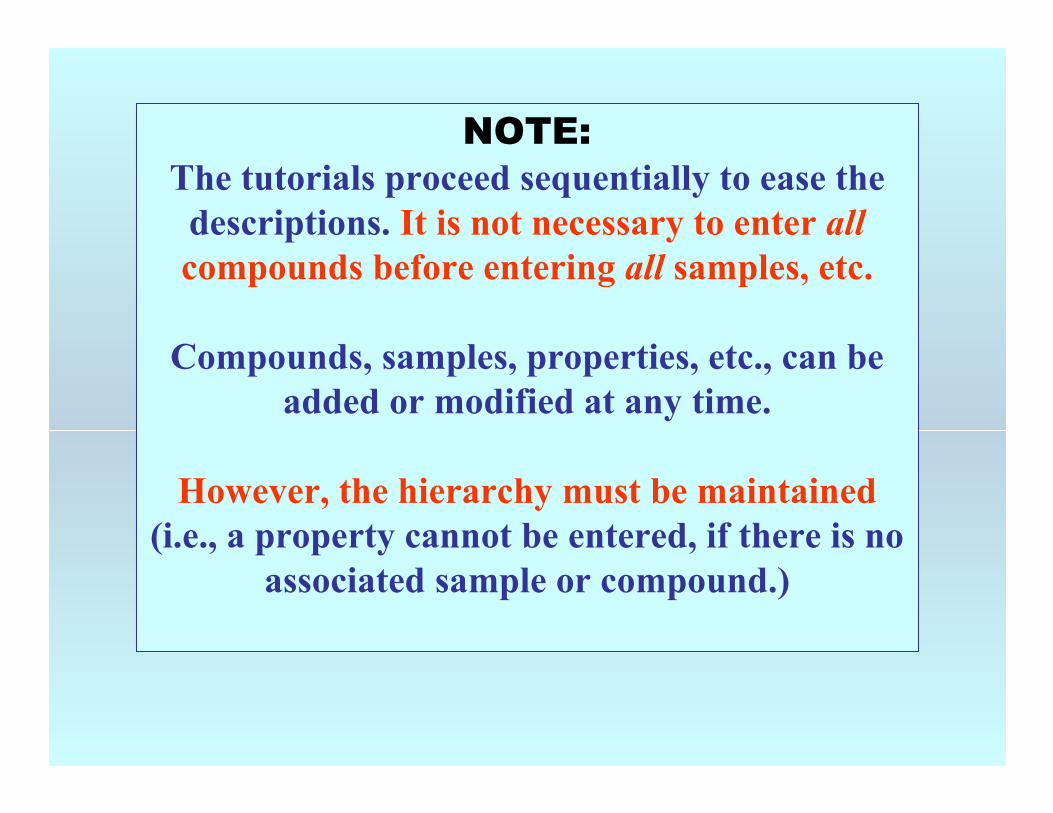
NOTE:The tutorials proceed sequentially to ease the
descriptions. It is not necessary to enter allcompounds before entering all samples, etc.
Compounds, samples, properties, etc., can be added or modified at any time.
However, the hierarchy must be maintained(i.e., a property cannot be entered, if there is no
associated sample or compound.)

The experimental data used in this example is from:
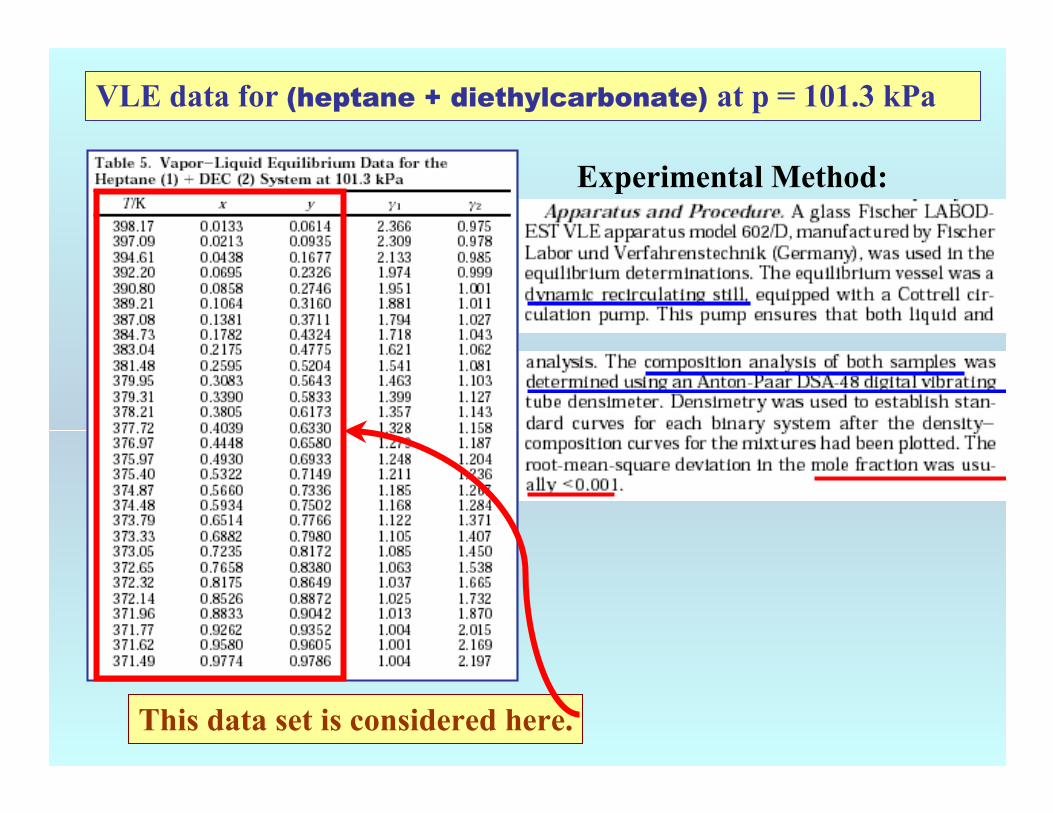
This data set is considered here.
VLE data for (heptane + diethylcarbonate) at p = 101.3 kPa
Experimental Method:

1. SELECT the mixture for which the data are to be captured.
2. CLICK Data Tables
NOTE: The bibliographic information, compound identities, sample descriptions, and mixture were entered previously. (There are separate tutorials related to capture of this information.)

This form appears:
CLICK OK
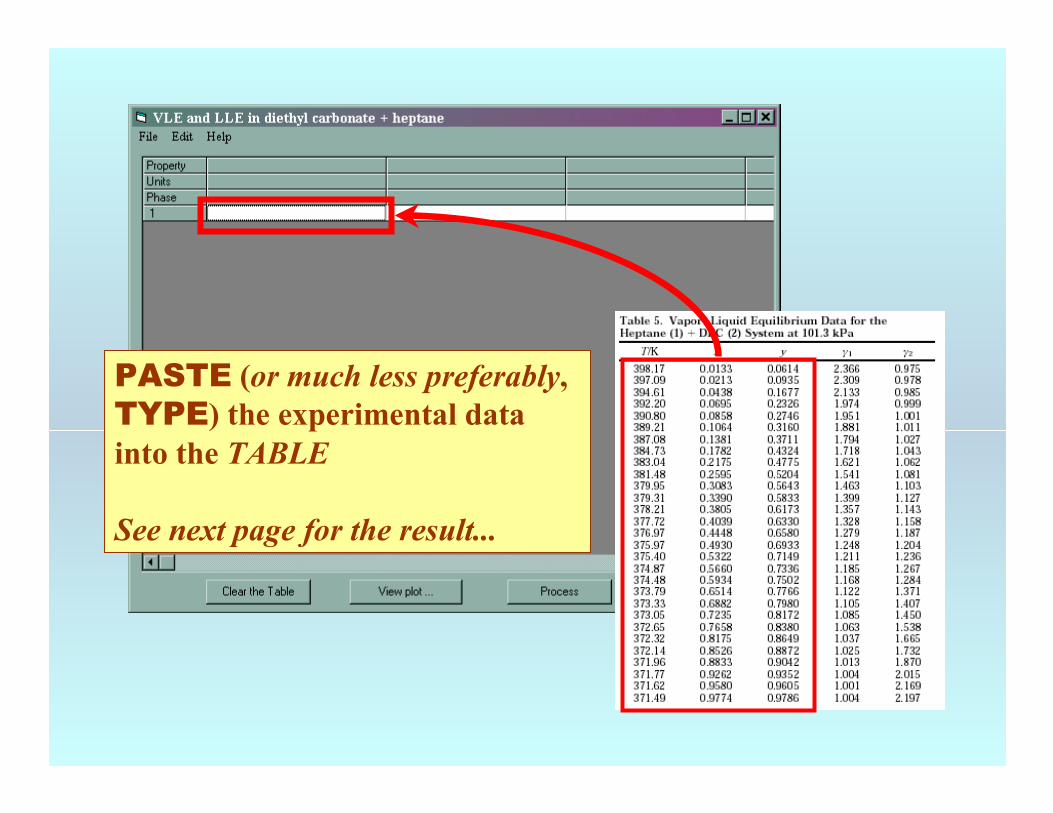
PASTE (or much less preferably, TYPE) the experimental data into the TABLE
See next page for the result...

NOTE: This is the result of the PASTE operation
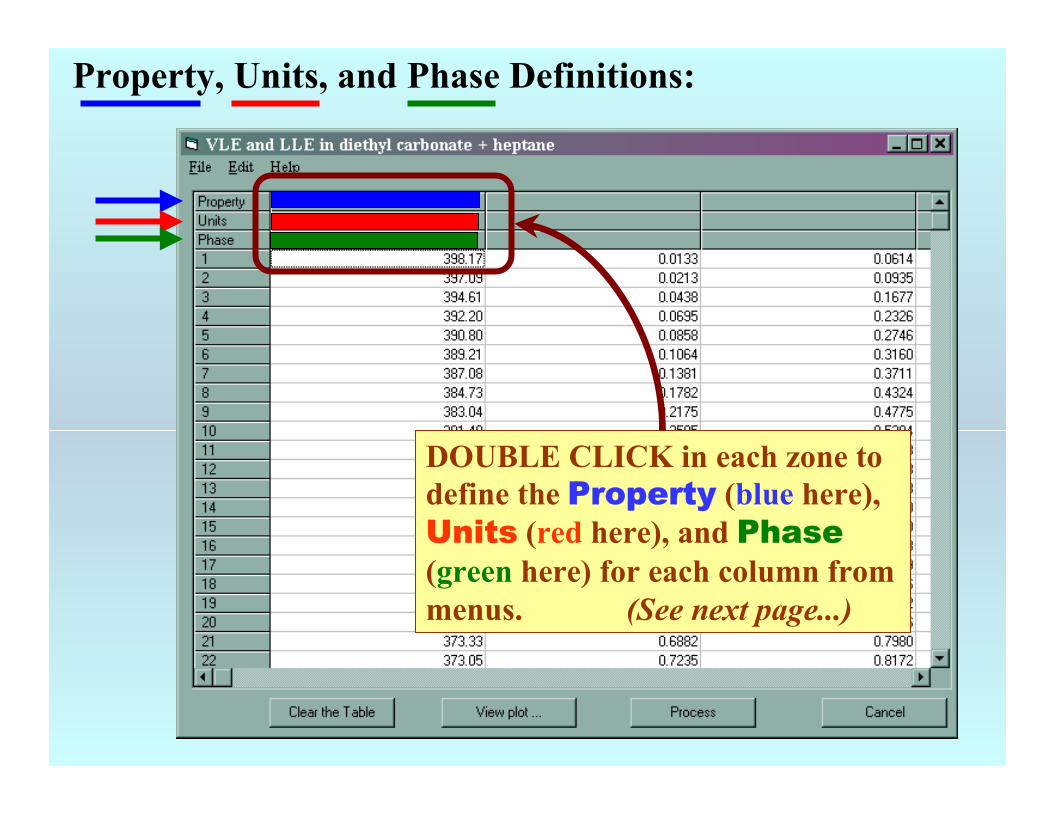
Property, Units, and Phase Definitions:
DOUBLE CLICK in each zone to define the Property (blue here), Units (red here), and Phase(green here) for each column from menus. (See next page...)

Define the Property:(here, it is Temperature)
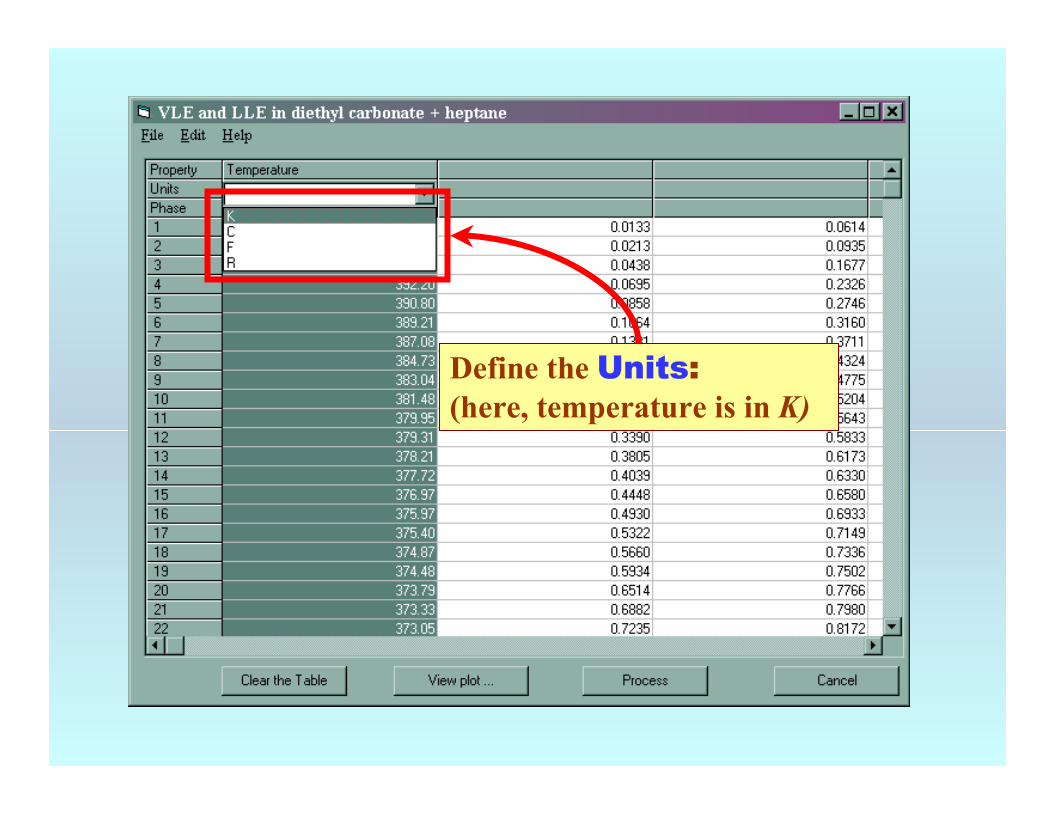
Define the Units:(here, temperature is in K)
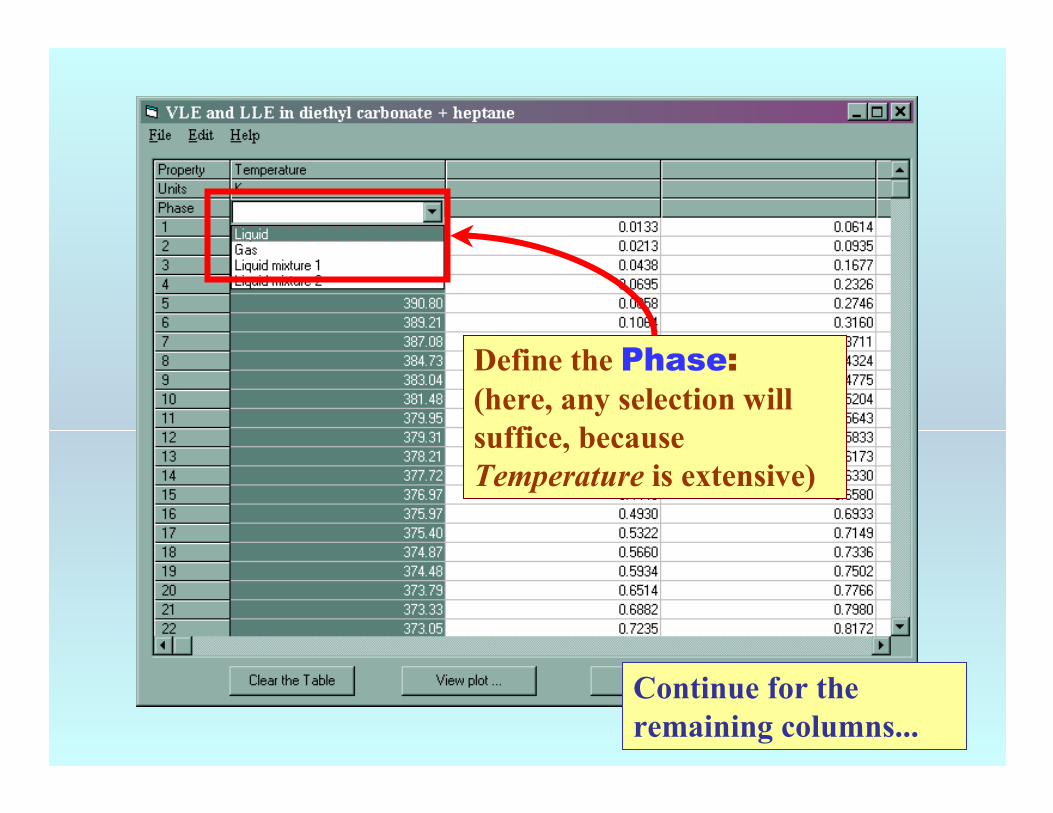
Define the Phase:(here, any selection will suffice, because Temperature is extensive)
Continue for the remaining columns...

Note: Various common composition specifications are accommodated, (i.e., mole fraction, mass fraction, molarity, etc.)
Please make selections with care...

1. The unit for mole fraction is filled automatically.
2. SELECT the phase associated with the composition; (here phase = liquid)
Note: Liquid mixture 1 and Liquid mixture 2 are used for LLE data, and are not applicable in this example.
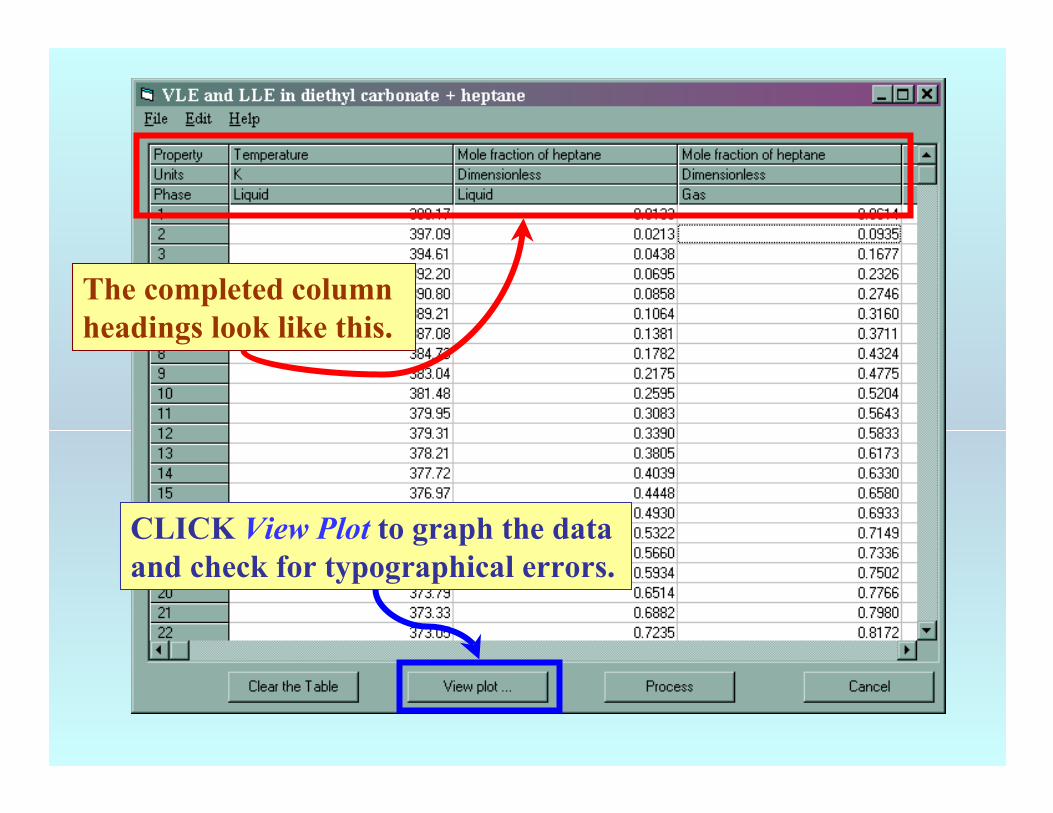
The completed column headings look like this.
CLICK View Plot to graph the data and check for typographical errors.
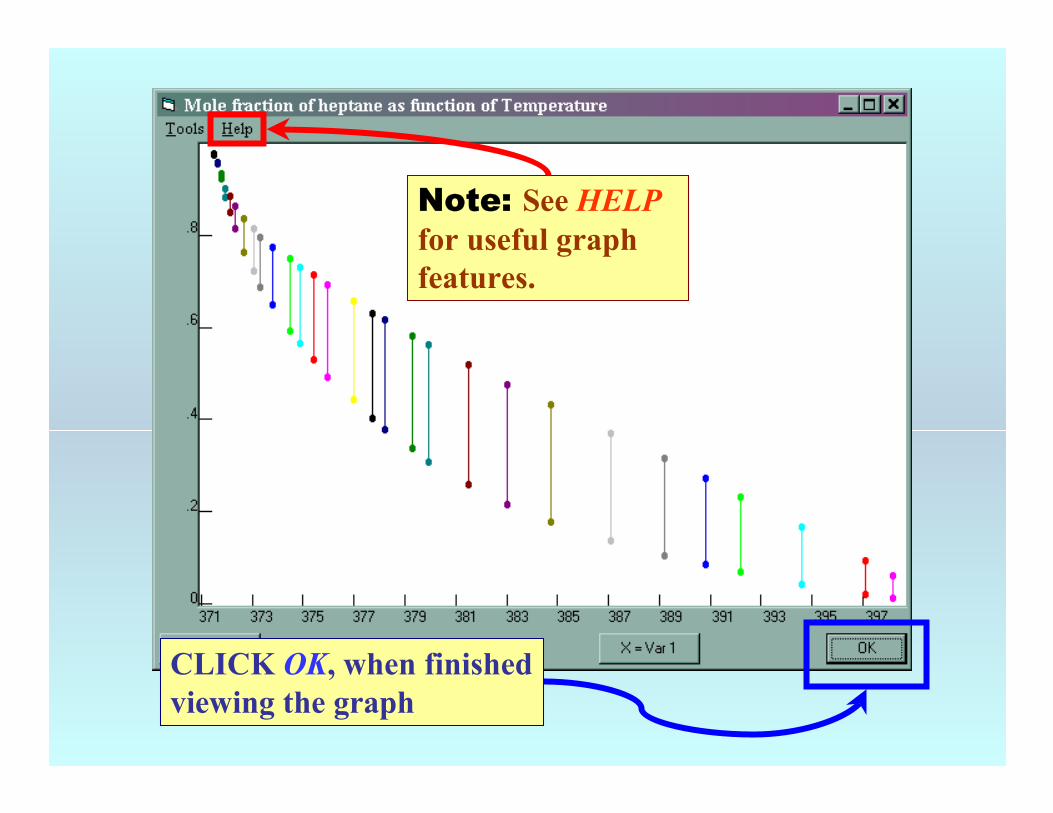
Note: See HELPfor useful graph features.
CLICK OK, when finished viewing the graph
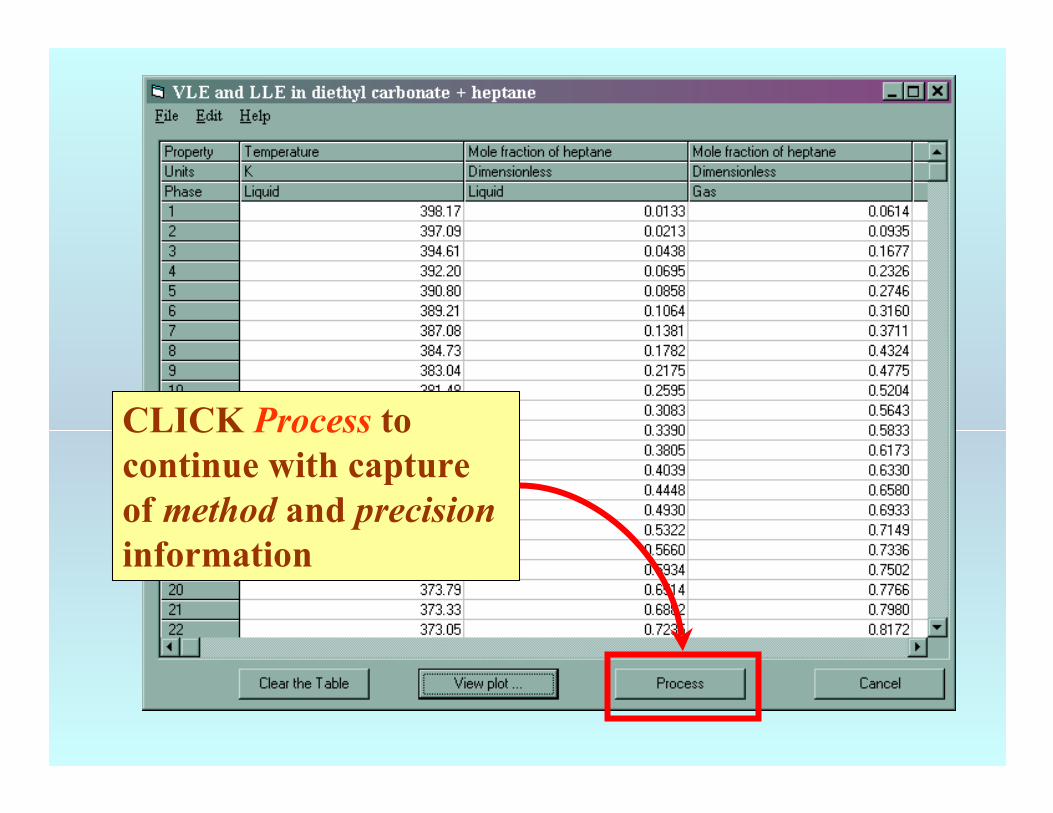
CLICK Process to continue with capture of method and precisioninformation
NOTE: The GDC software automatically divides the entered table of VLE data into an appropriate number of separate data sets (two in the present example) based on the Gibbs Phase rule.
The following screens capture information concerning the experimental methods and precisions for the data.

SELECT the Method of measurement and Experimental purpose from the menus provided. (CLICK in the fields to see the menus.)

Experimental Method:
CLICK OK
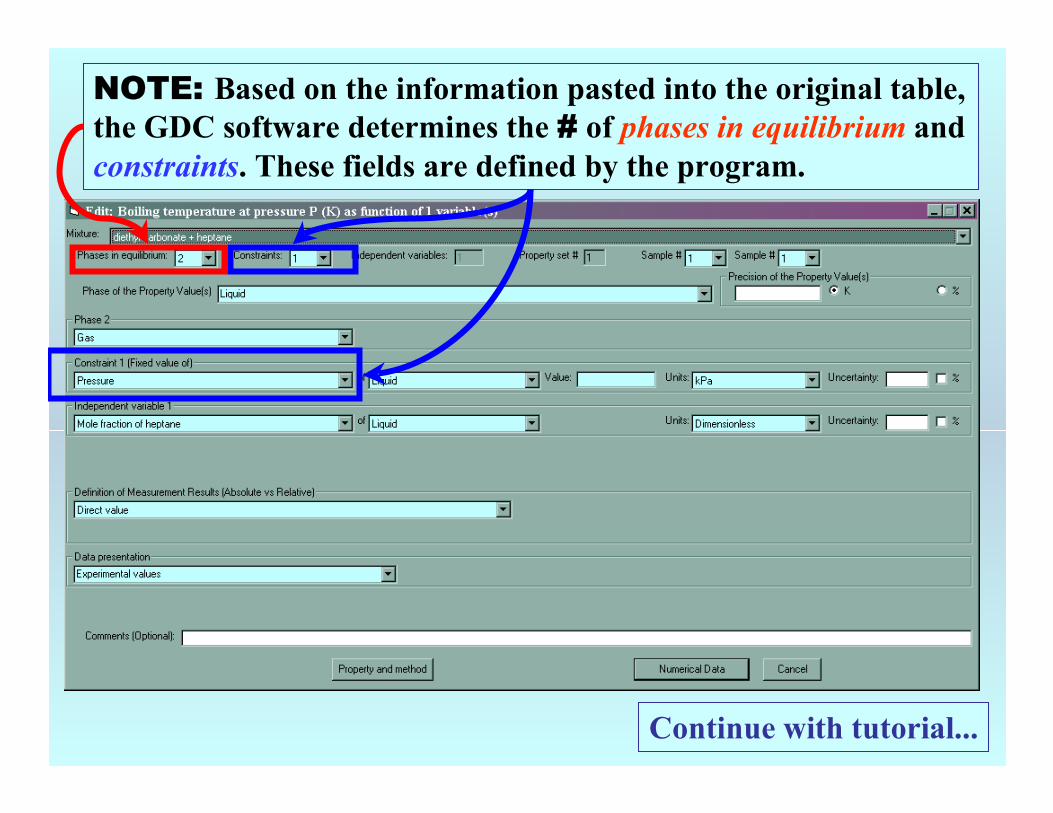
NOTE: Based on the information pasted into the original table, the GDC software determines the # of phases in equilibrium and constraints. These fields are defined by the program.
Continue with tutorial...

1.TYPE the value for the constraint(p = 101.3 kPa in the example).
NOTE: If the data table had included T, p, x1, and y1, this implies that there were no constraints, and pwould be listed as a variable, also.
2. SELECT the unitsfor the constraint value from the menu (kPa here)
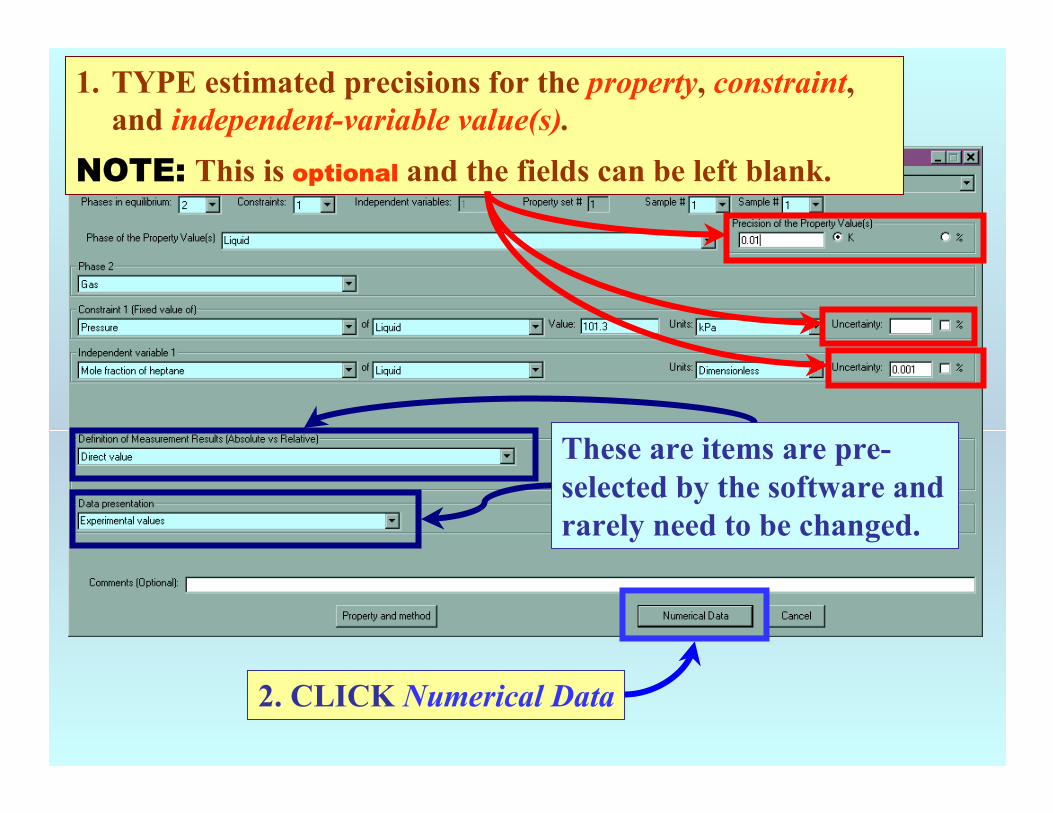
1. TYPE estimated precisions for the property, constraint, and independent-variable value(s).
NOTE: This is optional and the fields can be left blank.
These are items are pre-selected by the software and rarely need to be changed.
2. CLICK Numerical Data

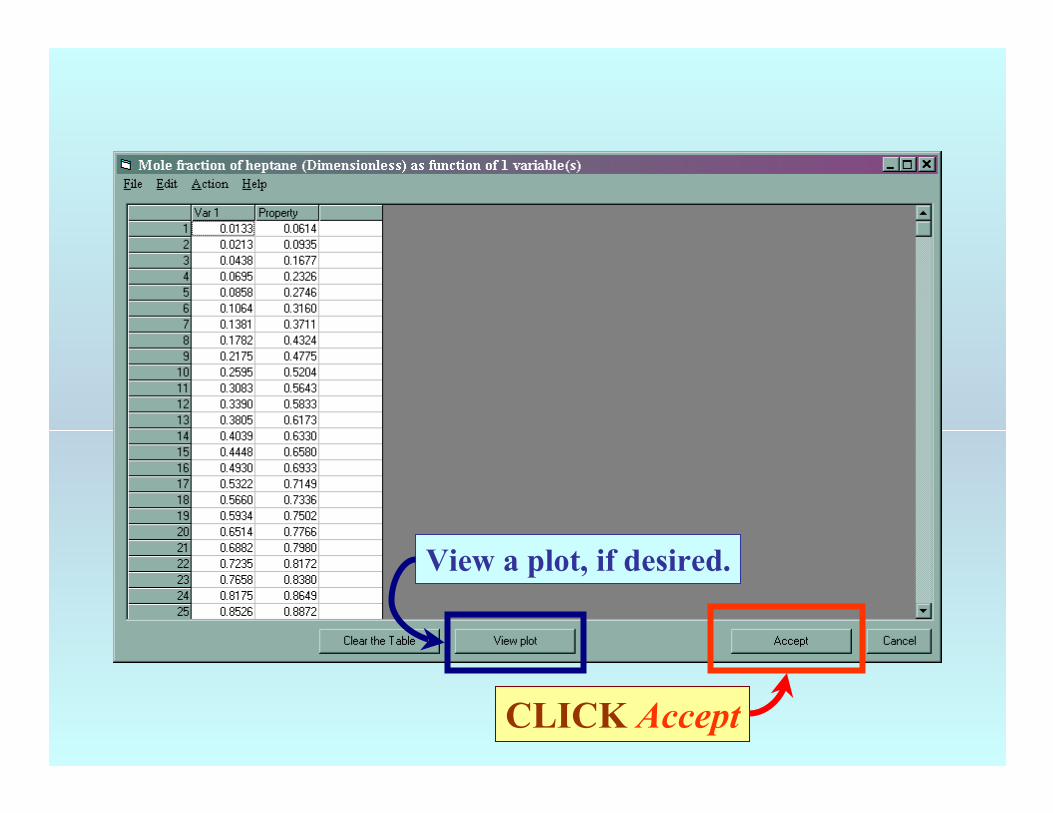
CLICK Accept
View a plot, if desired.
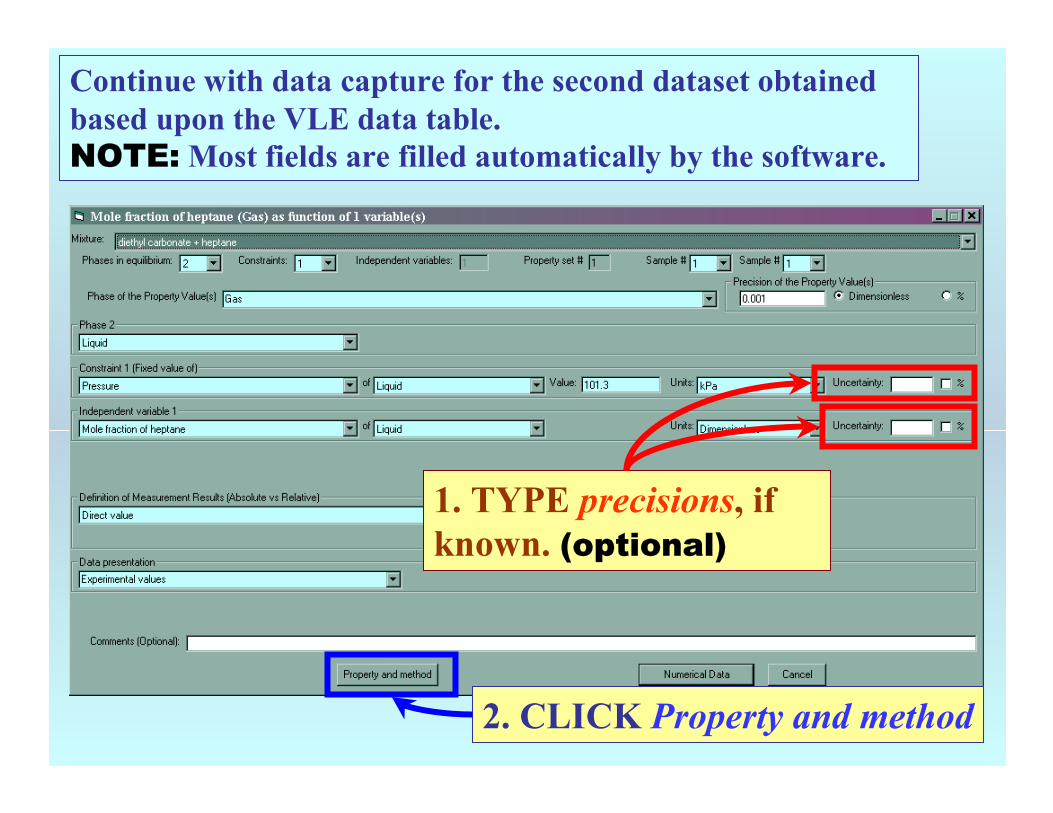
Continue with data capture for the second dataset obtained based upon the VLE data table. NOTE: Most fields are filled automatically by the software.
1. TYPE precisions, if known. (optional)
2. CLICK Property and method

SELECT the method of measurementused to determine the listed property.
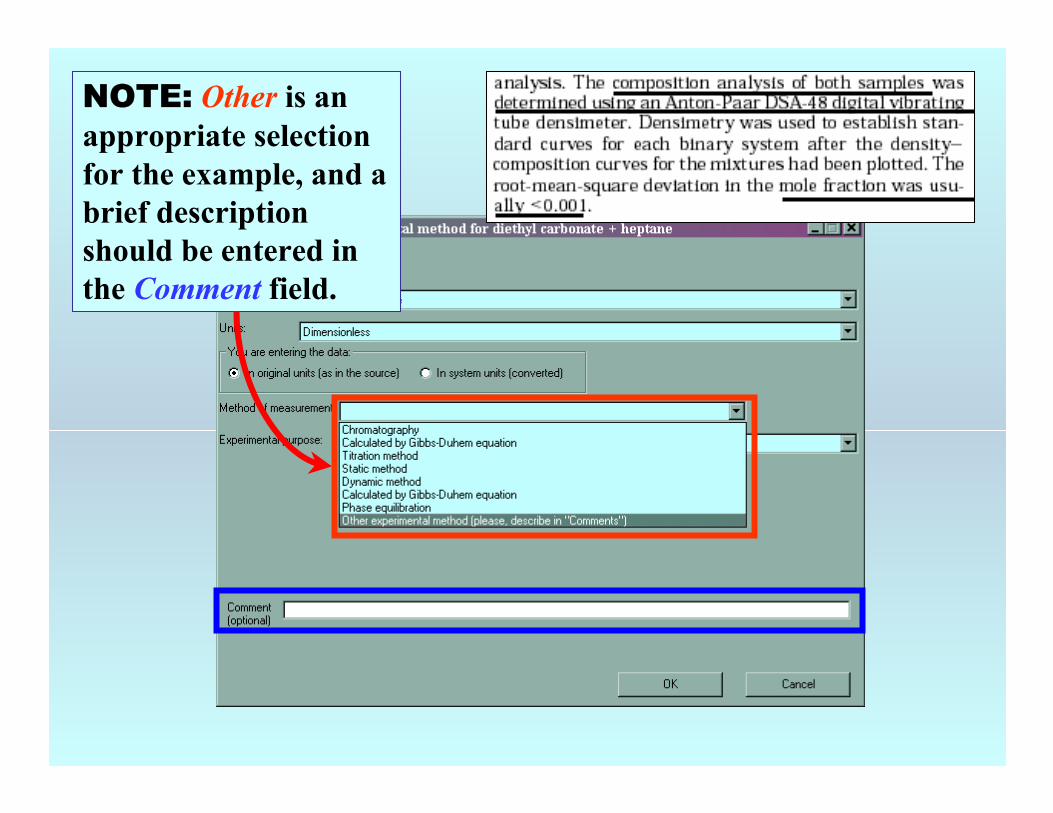
NOTE: Other is an appropriate selection for the example, and a brief description should be entered in the Comment field.
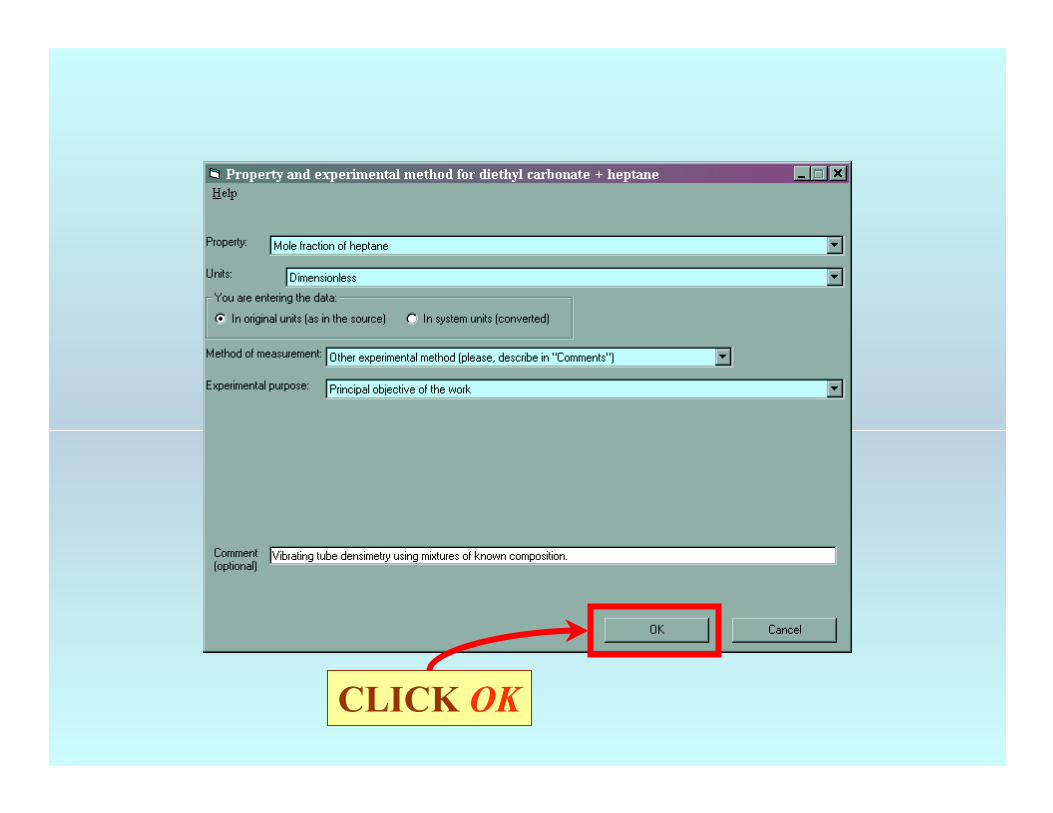
CLICK OK

You are returned to the previous screen.Check that entries are complete...
CLICK Numerical Data
CLICK Accept
View a plot, if desired.

NOTE: Two new datasets now are shown in the tree under the appropriate mixture.
NOTE: DOUBLE CLICKING on either dataset allows editing of all entered information.
END
Continue with other compounds, samples, properties, reactions, etc...
or save your file and exit the program.