Metabolomics, spring 06 Hans Bohnert ERML 196 [email protected] 265-5475 333-5574 class April...
28
Metabolomics, spring 06 Hans Bohnert ERML 196 [email protected] 265-5475 333-5574 http://www.life.uiuc.edu/bohnert/ class April 27 Metabolomics Essentiality Today’s discussion topic Schauer N, Zamir D, Fernie, AR (2005) Metabolic profiling of leaves and fruit of wild specie tomato: a survey of the Solanum lycopersicum complex. J Exp Bot. 56: 297-307. Schauer N, Semel Y Roessner Um Gur A, Balbo I, Carrari F, Pleban T, Perez-Melis A, Bruedigam C, Kopka J, Willmitzer L, Zamir D, Fernie AR (2006) Comprehensive metabolic profiling and phenotyping of interspecific introgression lines for tomato improvement. Nat Biotechnol. 24: 447-454.
-
Upload
wesley-fleming -
Category
Documents
-
view
214 -
download
0
Transcript of Metabolomics, spring 06 Hans Bohnert ERML 196 [email protected] 265-5475 333-5574 class April...

Metabolomics, spring 06
Hans BohnertERML 196
265-5475333-5574
http://www.life.uiuc.edu/bohnert/
class April 27
Metabolomics Essentiality
Today’s discussion topic
Schauer N, Zamir D, Fernie, AR (2005) Metabolic profiling of leaves and fruit of wild species tomato: a survey of the Solanum lycopersicum complex.J Exp Bot. 56: 297-307.
Schauer N, Semel Y Roessner Um Gur A, Balbo I, Carrari F, Pleban T, Perez-Melis A, Bruedigam C, Kopka J, Willmitzer L, Zamir D, Fernie AR (2006) Comprehensive metabolic profiling and phenotyping of interspecific introgression lines for tomato improvement. Nat Biotechnol. 24: 447-454.

From single genes to multi-gene traits
1. ‚Systems biology‘2.2. Use of natural diversityUse of natural diversity
Mark Stitt lectureMark Stitt lecture
From ‚biased‘ inhibition of candidate gene function to multisite ‚unbiased‘ analysis of change-of-function alleles:
Natural diversity is a central resource for the analysis of regulation and gene function
Alleles are the key to breeding, fitness‘ and evolution

Leaf (A) and fruit (B) phenotypes of the S. lycopersicum complex.
(I) S. chmielewskii, (II) S. habrochaites, (III) S. lycopersicum,
(IV) S. pimpinellifolium, (V) S. neorickii, and (VI) S. pennellii.

Protein and starch levels of fruits of the S. lycopersicum complex.
Six independent fruit samples were measured. Fruits were harvested 45 DAF 6 h into the light. Protein values (dark bars) are presented as mg protein/g FW. Starch values (grey bars) are presented as umol hexose/g FW.

Metabolite composition in leaves from species of the S. lycopersicum complex
Single leaf samples of six plants were measured. Leaves were harvested 6 h into the light period from fully-expanded mature leaves of 6-week-old plants.
Values are presented as the mean 6SE of six independent biological determinations. Those metabolites that are significantly different to S. lycopersicum are in bold type. Metabolites in italics represent relative differences with respect to S. lycopersicum, nd indicates metabolites were not detected.
A part of a very long table
Repeat at different ages of fruit development
Crosses MappingGrow under field conditionsRepeat in several seasons

Cross between the modern Cross between the modern tomato cultivar M82 and a tomato cultivar M82 and a
related wild species related wild species
ca. 100 Introgression Lines
Each contains a small part of the genome from the ‚donor‘ (here, the wild species) in the background of the otherwise unaltered genome from the
acceptor (elite cultivar)
Dani Zamir, HU JerusalemDani Zamir, HU Jerusalem
LycoLycopersicon pennellii x Lycopersicon esculentum
Wild relative Elite cultivar

Dani ZamirHU Jerusalem
9-1
0 1 2 3 4 59-1-2
0 1 2 3 4 5 9-1-3
0 1 2 3 4 5
Chromosome 9GP39
TG254
TG18
TG9
CT143
TG223A
CT32
CP44 CD32A,CT215A,CT284B
TG568
TG79 TG207,CT17,TG486,TG589,TG640,Tm2a
CT208.,CT235,TG79,TG415,CT17,CD3,TG591BTG390
TG551
TG404 TG186,CT236 TG429 TG348,TG347
TG248 GP94B CT74,CT177 GP129
CT198
CT218
TG421
TG424
GP101, CHS4
CT112A TG328,GP41,TG591A CT71
CT220
8.9
5.5
3.6
4.0
6.9
10.1
4.7
1.1
5.3
3.3
0.0
4.0
2.8
1.9 2.0 1.0 3.0
1.0 2.0 1.7 2.2
3.9
3.8
5.5
5.9
4.5
2.2 1.6 2.7
(CT225A)
(CT283A)
(TG225,TG10)
(TG3A,CD8,CT215B,CT215C)
(CT279,TG35,CT183,TG558,TG409)
(TG144)
(Est-2)
(GP123A)
(TG8, Nr)
(CT96)
(CT210)
PC6 CT208 TG101,TG291
GP125A
9-A
9-B
9-C
9-D
9-E
9-F
9-G
9-H
9-I
9-J
9-K
IL9-
1 IL9-
1-2
IL9-
1-3
IL9-
3
IL9-
3-2
IL9-
2IL
9-2-
5
+CD32A
+TG9-CT143
-GP39
-TG591B
+TG254
+TG186-TG348
-CT32
-GP129+CT198
+GP101-CT112A
IL9-
2-6-CT208
+TG390
-TG551+TG404
+GP263
-CT143+TG223A
+GP39
+CT220
IL9-
3-1
Metabolite profiles for each introgression lineMetabolite profiles for each introgression line
Field grown plantsField grown plants

Massively parallel identification of QTL’s for metabolite levels in tomato introgression lines
Metabolites, 1 .......n
Introgression
lines
GC-MS Metabolite-profiling
351 QTL‘s
Ally Fernie, MPI-MPAlly Fernie, MPI-MPDani Zamir HU JerusalemDani Zamir HU Jerusalem
Old Hypothesis:
Cell wall invertase hydrolyses sucrose and increases import
into growing organs
500 mMsucrose
INVINVGlc Glc FruFru
Example: high sugars. This is an important yield trait (BRIX)

Massively parallel identification of QTL’s for metabolite levels in tomato introgression lines
…. showed that a mutation leading to changed kinetic parameters of LIN5 - encoding Invertase
Fridman et al. , Science 2004
Metabolites, 1 .......n
Introgression
lines
GC-MS Metabolite-
profiling
0,1
0,2
0,3
-0,2 -0,1 0 0,1 0,2
1/mM sucrose
1/activityM82
9-2-5.…....
Lee_ _ _
Invertase kinetics
351 QTL‘s
GP39
TG254
TG18 TG9 CT143
TG223A
CT32 CP44
TG568 TG79
TG390 TG551 TG404 TG186,CT236 TG429 TG348,TG347 TG248 GP94B CT74,CT177 GP129 CT198 CT218 TG421
TG424
GP101, CHS4 CT112A CT71 CT220
8.9
5.5 3.6 4.0
6.9
10.1
4.7 1.1 5.3 3.3 0.0
4.0 2.8 1.9 2.0 1.0 3.0 1.0 2.0 1.7 2.2 3.9 3.8
5.5
5.9
4.5 2.2 1.6 2.7
(CT225A)
(CT283A)
(TG225,TG10)
(TG144) (Est-2)
(GP123A)
(TG8, Nr)
(CT96) (CT210)
PC6 CT208 TG101,TG291 GP125A
9-A
9-B
9-C9-D
9-E
9-F9-G9-H9-I
9-J
9-K
IL9-
1IL
9-1-
2IL
9-1-
3IL
9-3
IL9-
3-2
IL9-
2 IL9-
2-5
+CD32A
+TG9-CT143
-GP39
-TG591B
+TG254
+TG186-TG348
-CT32
-GP129+CT198
+GP101-CT112A
IL9-
2-6
-CT208+TG390-TG551+TG404
+GP263
-CT143+TG223A
+GP39
+CT220
IL9-
3-1
Fine mapping
LIN5
is the molecular basis of a sugar content ( BRIX ) QTL
Ally Fernie, MPI-MPAlly Fernie, MPI-MPDani Zamir HU JerusalemDani Zamir HU Jerusalem

Use of diversity in crop plant populations and wild populations for analysis of gene function:
A ‘strategic advantage’ for plant science
• Long experience of breeders in creating and phenotyping populations
• Large resources already available in the reference species Arabidopsis
• A wide range of resources are becoming available in several crops
• Their production will be aided by developments in genotyping
• Their production will be aided by information about genome sequences
• Analysis benefit from the analytics technologies developed in plant genomics will depend on and be driven by development of
bioinformatics capabilities
• A tight link from basic science into the application realm
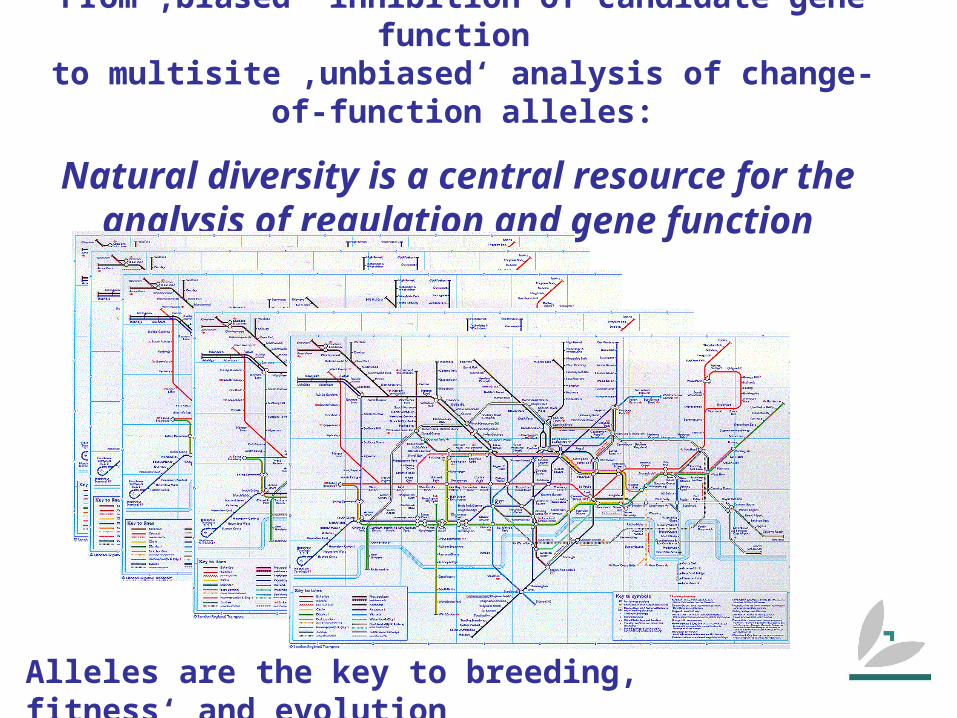
Overlay heat map of the metabolite profiles and other traits of the ILs in comparison to the parental control (S. lycopersicum).
Large sections of each map are white or pale in color, reflecting the fact that many of the chromosomal segment substitutions do not have a great effect on the amount of every metabolite. Regions of red or blue indicate that the metabolite content is increased or decreased, respectively, after the introgression of S. pennellii segments. Very dark coloring indicates that a large change in metabolite content was conserved across harvests; purple indicates that, relative to S. lycopersicum, the metabolite was increased in one harvest but decreased in the other. For each harvest, gas chromatography/mass spectrometry was used to quantify 74 metabolites, including amino acids, organic acids, fatty acids, sugars, sugar alcohols and vitamins.

metabolite analysis
What are we looking at?
Overlay heat map of the metabolite(total 74) profiles and other traits of the ILs
white – no effect
red (up) & blue (down)in presence of L. pen. segment
& purple (up in one, down in other harvest)
dark – two seasonslight – one season

Cartography of a network
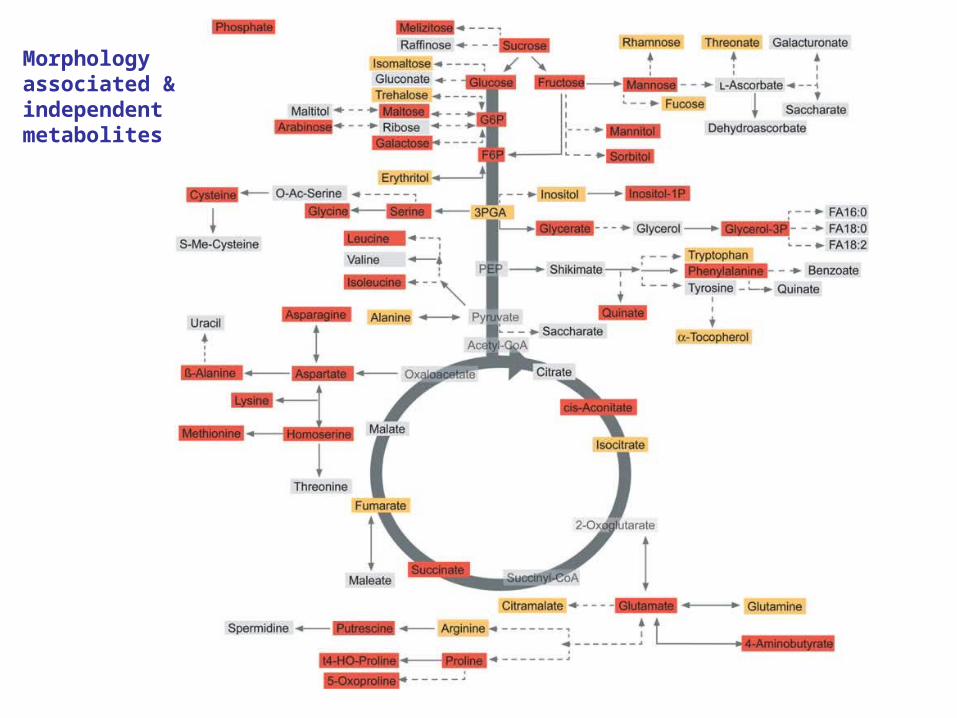
Morphology associated &independentmetabolites

Fine evaluation of genomic regions containing morphologically associated and independent metabolite QTLs.

Robustness of cartography algorithm
each pair of nodes(20 partitions in network)
how often in ILsclassified the same
always together – red
never together – dark blue


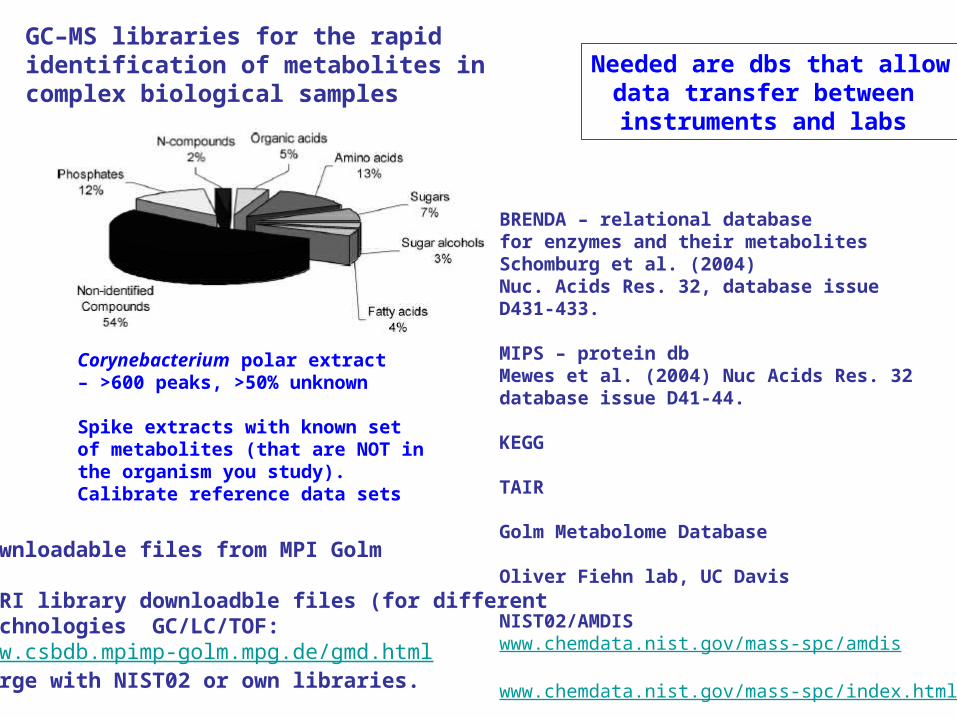
GC–MS libraries for the rapid identification of metabolites in complex biological samples
BRENDA – relational database for enzymes and their metabolitesSchomburg et al. (2004)Nuc. Acids Res. 32, database issueD431-433.
MIPS – protein dbMewes et al. (2004) Nuc Acids Res. 32database issue D41-44.
KEGG
TAIR
Golm Metabolome Database
Oliver Fiehn lab, UC Davis
NIST02/AMDIS www.chemdata.nist.gov/mass-spc/amdis
www.chemdata.nist.gov/mass-spc/index.html
Downloadable files from MPI Golm
MSRI library downloadble files (for differentTechnologies GC/LC/TOF:www.csbdb.mpimp-golm.mpg.de/gmd.htmlmerge with NIST02 or own libraries.
Corynebacterium polar extract – >600 peaks, >50% unknown
Spike extracts with known set of metabolites (that are NOT inthe organism you study). Calibrate reference data sets
Needed are dbs that allowdata transfer between instruments and labs

Test cases - Spike animal/bacterial samples with plant-specific metabolites
(kaempferol, phytosterol, a-tocopherol)
Golm libraries are (a) manually analyzed, assigned to ID libraries(b) automated deconvolution libraries, assigned NS libraries
Identify deconvolution errors: multiple mass spectra for single componentsaccidental deconvolutions based on random fluctuationsbackground noise (spill-over)chimeric mass spectra (mixed mass positions)
Provide data on experiment, samples, sources of reference, investigatorProvide both mass spectrum and retention time
Q_MSRI_ID library with 1166 annotated, identified MSTs for 574 non-redundant compoundsbut only 306 are unambiguously identified
Also a non-supervised collection of>30,000 MSTs from a range of plant species, models and crops,and different plant organs
Schauer et al. (2005) FEBS Lett 579, 1332-1337.


How accurate are unsupervised analyses?
Chlorogenic acid – typical 2nd metabolite in SolanaceaeCaffeic acid – precursor for chlorogenic acidQuinic acid – ubiquitous in plants

supplemental slides
documenting variability of field data.

Supplem. Figure 1 (next slide) Heat maps of the metabolite profiles of the introgression lines in comparison to that of theparental control (S. lycopersicum) from the individual data sets of A) 2001 and B) 2003.Large sections of each map are white or pale in coloor reflecting the fact that many of thechromosomal segment substitutions do not have a large affect on the level of every metabolite.Regions of red or blue indicate that the metabolite content is either increased or decreasedrespectively following the introgression of S. pennellii segments. A total of 74 metabolites were quantified by gas chromatography-mass spectrometry for each harvest, including amino acids, organic acids, fatty acids, sugars, sugar alcohols and vitamins.

(a) Data set 2001
Variability

(b) Data set 2003
Variability
![Metabolomics Basics[1]](https://static.fdocuments.in/doc/165x107/553de2815503466f378b4864/metabolomics-basics1.jpg)