Metabolomic analysis of obesity, metabolic syndrome, and ... ·...
23
Submitted 8 March 2018 Accepted 18 July 2018 Published 31 August 2018 Corresponding author Marvin R. Natowicz, [email protected] Academic editor Daniela Foti Additional Information and Declarations can be found on page 15 DOI 10.7717/peerj.5410 Copyright 2018 Libert et al. Distributed under Creative Commons CC-BY 4.0 OPEN ACCESS Metabolomic analysis of obesity, metabolic syndrome, and type 2 diabetes: amino acid and acylcarnitine levels change along a spectrum of metabolic wellness Diane M. Libert 1 , Amy S. Nowacki 1 ,2 and Marvin R. Natowicz 1 ,3 1 Cleveland Clinic Lerner College of Medicine of Case Western Reserve University, Case Western Reserve University School of Medicine, Cleveland, OH, United States of America 2 Department of Quantitative Health Sciences, Cleveland Clinic, Cleveland, OH, United States of America 3 Pathology and Laboratory Medicine, Genomic Medicine, Pediatrics and Neurological Institutes, Cleveland Clinic, Cleveland, OH, United States of America ABSTRACT Background. Metabolic syndrome (MS) is a construct used to separate ‘‘healthy’’ from ‘‘unhealthy’’ obese patients, and is a major risk factor for type 2 diabetes (T2D) and cardiovascular disease. There is controversy over whether obese ‘‘metabolically well’’ persons have a higher morbidity and mortality than lean counterparts, suggesting that MS criteria do not completely describe physiologic risk factors or consequences of obesity. We hypothesized that metabolomic analysis of plasma would distinguish obese individuals with and without MS and T2D along a spectrum of obesity-associated metabolic derangements, supporting metabolomic analysis as a tool for a more detailed assessment of metabolic wellness than currently used MS criteria. Methods. Fasting plasma samples from 90 adults were assigned to groups based on BMI and ATP III criteria for MS: (1) lean metabolically well (LMW; n = 24); (2) obese metabolically well (OBMW; n = 26); (3) obese metabolically unwell (OBMUW; n = 20); and (4) obese metabolically unwell with T2D (OBDM; n = 20). Forty-one amino acids/dipeptides, 33 acylcarnitines and 21 ratios were measured. Obesity and T2D effects were analyzed by Wilcoxon rank-sum tests comparing obese nondiabetics vs LMW, and OBDM vs nondiabetics, respectively. Metabolic unwellness was analyzed by Jonckheere-Terpstra trend tests, assuming worsening health from LMW → OBMW → OBMUW. To adjust for multiple comparisons, statistical significance was set at p < 0.005. K-means cluster analysis of aggregated amino acid and acylcarnitine data was also performed. Results. Analytes and ratios significantly increasing in obesity, T2D, and with worsening health include: branched-chain amino acids (BCAAs), cystine, alpha-aminoadipic acid, phenylalanine, leucine + lysine, and short-chain acylcarnitines/total carnitines. Tyro- sine, alanine and propionylcarnitine increase with obesity and metabolic unwellness. Asparagine and the tryptophan/large neutral amino acid ratio decrease with T2D and metabolic unwellness. Malonylcarnitine decreases in obesity and 3-OHbutyrylcarnitine increases in T2D; neither correlates with unwellness. Cluster analysis did not separate subjects into discreet groups based on metabolic wellness. How to cite this article Libert et al. (2018), Metabolomic analysis of obesity, metabolic syndrome, and type 2 diabetes: amino acid and acylcarnitine levels change along a spectrum of metabolic wellness. PeerJ 6:e5410; DOI 10.7717/peerj.5410
Transcript of Metabolomic analysis of obesity, metabolic syndrome, and ... ·...
Submitted 8 March 2018Accepted 18 July 2018Published 31 August 2018
Corresponding authorMarvin R. Natowicz,[email protected]
Academic editorDaniela Foti
Additional Information andDeclarations can be found onpage 15
DOI 10.7717/peerj.5410
Copyright2018 Libert et al.
Distributed underCreative Commons CC-BY 4.0
OPEN ACCESS
Metabolomic analysis of obesity,metabolic syndrome, and type 2 diabetes:amino acid and acylcarnitine levelschange along a spectrum of metabolicwellnessDiane M. Libert1, Amy S. Nowacki1,2 and Marvin R. Natowicz1,3
1Cleveland Clinic Lerner College of Medicine of Case Western Reserve University, Case Western ReserveUniversity School of Medicine, Cleveland, OH, United States of America
2Department of Quantitative Health Sciences, Cleveland Clinic, Cleveland, OH, United States of America3Pathology and Laboratory Medicine, Genomic Medicine, Pediatrics and Neurological Institutes, ClevelandClinic, Cleveland, OH, United States of America
ABSTRACTBackground. Metabolic syndrome (MS) is a construct used to separate ‘‘healthy’’ from‘‘unhealthy’’ obese patients, and is a major risk factor for type 2 diabetes (T2D) andcardiovascular disease. There is controversy over whether obese ‘‘metabolically well’’persons have a higher morbidity and mortality than lean counterparts, suggesting thatMS criteria do not completely describe physiologic risk factors or consequences ofobesity. We hypothesized that metabolomic analysis of plasma would distinguish obeseindividuals with and without MS and T2D along a spectrum of obesity-associatedmetabolic derangements, supporting metabolomic analysis as a tool for a more detailedassessment of metabolic wellness than currently used MS criteria.Methods. Fasting plasma samples from 90 adults were assigned to groups based onBMI and ATP III criteria for MS: (1) lean metabolically well (LMW; n= 24); (2)obese metabolically well (OBMW; n= 26); (3) obese metabolically unwell (OBMUW;n= 20); and (4) obese metabolically unwell with T2D (OBDM; n= 20). Forty-oneamino acids/dipeptides, 33 acylcarnitines and 21 ratios were measured. Obesity andT2D effects were analyzed by Wilcoxon rank-sum tests comparing obese nondiabeticsvs LMW, and OBDM vs nondiabetics, respectively. Metabolic unwellness was analyzedby Jonckheere-Terpstra trend tests, assuming worsening health from LMW→OBMW→ OBMUW. To adjust for multiple comparisons, statistical significance was set atp< 0.005. K-means cluster analysis of aggregated amino acid and acylcarnitine datawas also performed.Results. Analytes and ratios significantly increasing in obesity, T2D, andwithworseninghealth include: branched-chain amino acids (BCAAs), cystine, alpha-aminoadipic acid,phenylalanine, leucine + lysine, and short-chain acylcarnitines/total carnitines. Tyro-sine, alanine and propionylcarnitine increase with obesity and metabolic unwellness.Asparagine and the tryptophan/large neutral amino acid ratio decrease with T2D andmetabolic unwellness. Malonylcarnitine decreases in obesity and 3-OHbutyrylcarnitineincreases in T2D; neither correlates with unwellness. Cluster analysis did not separatesubjects into discreet groups based on metabolic wellness.
How to cite this article Libert et al. (2018), Metabolomic analysis of obesity, metabolic syndrome, and type 2 diabetes: amino acid andacylcarnitine levels change along a spectrum of metabolic wellness. PeerJ 6:e5410; DOI 10.7717/peerj.5410

Discussion. Levels of 15 species andmetabolite ratios trend significantlywithworseningmetabolic health; some are newly recognized. BCAAs, aromatic amino acids, lysine,and its metabolite, alpha-aminoadipate, increase with worsening health. The lysinepathway is distinct from BCAAmetabolism, indicating that biochemical derangementsassociated with MS involve pathways besides those affected by BCAAs. Even thoseconsidered ‘‘obese,metabolicallywell’’ hadmetabolite levels which significantly trendedtowards those found in obese diabetics. Overall, this analysis yields a more granularview of metabolic wellness than the sole use of cardiometabolic MS parameters. This,in turn, suggests the possible utility of plasma metabolomic analysis for research andpublic health applications.
Subjects Nutrition, Public Health, Medical Genetics, Metabolic SciencesKeywords Metabolomic, Metabolomics, Obesity, Metabolic syndrome, Metabolic wellness, Type2 diabetes, Amino acids, Acylcarnitines
INTRODUCTIONObesity, a major risk factor for cardiovascular disease, type 2 diabetes (T2D), and all-cause mortality, has dramatically increased in population prevalence over the past severaldecades (Ogden, Carroll & Flegal, 2003;The GBD 2015 Obesity Collaborators, 2017). Besidesobesity, a constellation of factors is associated with the development of cardiovasculardisease, T2D, and all-cause mortality. To group these factors into standardized criteria,four main definitions of metabolic syndrome (MS) have been formulated: the originalWorld Health Organization (WHO) definition of 1998; criteria of the European Groupfor the study of Insulin Resistance (EGIR); criteria of the National Cholesterol EducationProgram Adult Treatment Panel (NCEP ATP) III; and criteria of the International DiabetesFoundation (IDF) (Alberti & Zimmet, 1998; Balkau & Charles, 1999; Zimmet et al., 2005;Grundy et al., 2005). These criteria differ, but most include increased body mass index,hyperglycemia, hypertension, and dyslipidemia to describe an individual’s degree ofprogression toward cardiovascular disease and/or T2D. These criteria provide usefulclinical and pathophysiological insights. However, the use of these criteria has also ledto the recognition of a population of obese individuals who have been designated as‘‘metabolically well,’’ and studies differ over whether this group has a higher morbidityand earlier mortality than their lean counterparts (Fan et al., 2013; Kramer, Zinman &Retnakaran, 2013;Mørkedal et al., 2014; Lavie, De Schutter & Milani, 2015).
This controversy suggests that current definitions of MS do not completely describephysiologic risk factors or consequences of this process. To assess this, there is increasedinterest in discovering biomarkers that differentiate those who are obese and metabolicallywell from those who are obese and metabolically unwell (Zhong et al., 2017). Metabolicsignatures of obesity and diabetes have previously been studied to gain insight into thepathophysiology of these conditions and to develop and evaluate treatments; plasmaamino acids and acylcarnitines are frequently assessed for these purposes. A large body ofresearch characterizes metabolic differences in obese and diabetic states (Table S1). Similar
Libert et al. (2018), PeerJ, DOI 10.7717/peerj.5410 2/23
studies on MS exist, but the definitions of MS and populations studied vary (Table S2).Elevations in the branched-chain amino acids (BCAAs; leucine, isoleucine, valine)and aromatic amino acids (AAAs; phenylalanine, tyrosine) are often reported in thesepopulations (Felig, Marliss & Cahill, 1969; Jeevanandam, Ramias & Schiller, 1991; Newgardet al., 2009; Suhre et al., 2010; Xu et al., 2013). Studies of differences in acylcarnitine levelsbetween obese or diabetic individuals and normal controls have been less consistent, butgenerally report increased levels of the BCAA-associated species (i.e., propionylcarnitine,butyrylcarnitine, isovalerylcarnitine) (Adams et al., 2009; Mihalik et al., 2012; Rauschert etal., 2014; Schooneman et al., 2014). Less consistent results were obtained for other aminoacids or acylcarnitines. The differences between these studies may be attributable tovariations in study populations or analytic methods.
To our knowledge, there are no data regarding metabolite levels in different populationsalong a spectrum of metabolic wellness from lean, metabolically well individuals to thosewho are obese and metabolically unwell with T2D. Using this approach, we sought toevaluate differences in the levels of plasma amino acids and acylcarnitines between leanhealthy control adults, persons with obesity who are metabolically well by ATP III criteria,persons with obesity who meet criteria for metabolic syndrome, and obese individualswho are metabolically unwell and have T2D, thereby providing insights regarding thepathophysiological mechanisms associated with these states as well as their possible utilityin the clinic. We anticipated that differences in amino acid and acylcarnitine levels wouldprovide a more granular view of metabolic wellness than traditional MS criteria.
MATERIALS AND METHODSStudy populationsLeftover plasma samples were collected from patients aged 20–59 years presenting to ourhospital for outpatient fasting lipid panels and plasma metabolic panels. All patients hadfasted 10–12 h. Ninety samples were collected on a continuous basis between July andOctober 2016 and stored at 4 ◦C for one to seven days in lithium heparin tubes beforebeing decanted and frozen at −14 ◦C for short-term storage (<2 months) and −70 ◦Cfor long-term storage. Demographic data, medications, and laboratory test results werecollected from the electronic medical record before the samples were de-identified andstored. The Institutional Review Board of the Cleveland Clinic granted approval to carryout the study (IRB #16-499).
Determination of metabolic wellnessMetabolic wellness was determined according to the Adult Treatment Panel III (ATPIII) guidelines for the clinical identification of metabolic syndrome; determinants ofunwellness included blood pressure (≥130/≥85 mm Hg), fasting glucose (≥110 mg/dL),HDL (<40 mg/dL for men, <50 mg/dL for women), triglycerides (≥150 mg/dL), and waistcircumference (>40 in. for men, >35 in. for women) (Grundy et al., 2005). Metabolicallyunwell individuals meet three or more criteria. Since waist circumference data wereunavailable, we defined metabolically well individuals as those with at most one ATP III
Libert et al. (2018), PeerJ, DOI 10.7717/peerj.5410 3/23
criterion and metabolically unwell individuals as having three or more criteria. Our fourstudy groups were defined as follows:
• Lean metabolically well (LMW): BMI <25 kg/m2 with ≤1 ATP III criterion• Obese metabolically well (OBMW): BMI >30 kg/m2 with ≤1 ATP III criterion• Obese metabolically unwell (OBMUW): BMI >30 kg/m2 with ≥ 3 ATP III criteria• Obese metabolically unwell, diabetic (OBDM): BMI >30 kg/m2 with≥3 ATP III criteriaand a documented diagnosis of type 2 diabetes.
Exclusion criteriaTo exclude patients with common or severe metabolic derangements other than metabolicsyndrome or diabetes, we excluded persons having: (1) elevated creatinine (>1.00 mg/dL)or decreased eGFR (<60 mL/min/1.73 m2); (2) elevated liver enzymes (ALT >45 U/L,AST >40 U/L, alkaline phosphatase >150 U/L) or a diagnosis of liver disease besidesnonalcoholic steatohepatitis; (3) abnormal plasma calcium levels; (4) plasma electrolytedisturbances; and (5) abnormal free T4 (<0.9 or >1.7 ng/dL) or abnormal TSH (>5.5 or<0.4 uU/mL) levels. We also excluded individuals with uncontrolled bipolar, unipolar,and major depressive disorder, persons with cancer or known genetic metabolic disorders,persons with acute inflammatory processes, and hospital in-patients.
Metabolite quantificationHigh-performance liquid chromatography with ultraviolet detection (HPLC-UV) wasused to quantify 41 plasma amino acids and related compounds (Narayan et al., 2011).Liquid chromatography-tandemmass spectrometry (LC-MS/MS) was used tomeasure freecarnitine and 33 acylcarnitine species using a modification of the method of Scott, Heese &Garg (2016). Homocysteine was measured by a chemiluminescense immunoassay (Tewari,Zhang & Bluestein, 2004).Medians of the absolute values of thesemetabolites and calculatedratios for each group are reported in Tables S5A–S5C. Insulin levels were not measured.
Storage and sensitivity analysesTo evaluate the effect of storage at 4 ◦C on our metabolite measurements, we first assessedpossible changes of metabolite levels over time using blood from two healthy, fasting adults.Samples were obtained in lithium heparin tubes, centrifuged at 2500 rpm for 10 min in aSilencer 2310R centrifuge and analyzed immediately (baseline) and after storage at 4 ◦Cfor one, two, three, five, and seven days. The day at which levels deviated from baselineby 20% were recorded. It is recognized that length of storage could impact quality of thespecimen. Therefore, a sensitivity analysis was performed where only samples stored at4 ◦C for less than three days were analyzed. Results were consistent with those based on allsamples and are reported in the supplementary materials (Tables S3A–S3C).
Statistical analysesSummary measures are reported as median (Q1–Q3), mean (standard deviation) or count(%) as appropriate. Differences in metabolite levels among the four groups were initiallyanalyzed using Kruskal-Wallis tests. Acknowledging the large number of comparisons beingperformed, a significance level of p< 0.005 was utilized to reduce the type I error rate.
Libert et al. (2018), PeerJ, DOI 10.7717/peerj.5410 4/23
Metabolites signifying variations among the four groups were further explored to betterunderstand the differences. Specifically, three a priori contrasts of interest were investigatedcomparing: (1) obese non-diabetic (OBMW and OBMUW) to non-obese (LMW); (2) themetabolic wellness trend among non-diabetic patients (assuming worsening metabolicwellness from LMW→ OBMW→ OBMUW); and (3) diabetic (OBDM) to non-diabeticpatients (LMW, OBMW, and OBMUW). The obesity and diabetes effects were assessedusing nonparametric Wilcoxon rank-sum tests. The metabolic wellness trend was assessedusing nonparametric Jonckheere-Terpstra trend tests. A calculation was conducted for aWilcoxon rank-sum test to determine the power achieved for samples of size n= 20, 22and 26 using an alpha of 0.005, a tn−2 distribution, a location difference of 1.25, and twotails resulting in 75%, 82% and 90% power respectively.
An unsupervised cluster analysis was performed to assess whether metabolic groupswould form organically. A clustering task consists of dividing a dataset into groups(i.e., clusters) that share common properties according to given criteria and similaritymetrics (Bailey, 1994).We employed theK-means algorithm (Jain, 2010) which relies on thefrequent computation of similarity metrics between all of the elements to be clustered andthe proposed centroids of each of the k-clusters. All analyses were performed using eitherJMP Pro version 13.0 or SAS statistical software version 9.4 (SAS Institute, Cary, NC, USA).
RESULTS AND DISCUSSIONDemographic and clinical characteristics of the study populationsPlasma samples from 24 LMW, 26 OBMW, 20 OBMUW, and 20 OBDM subjects wereanalyzed. Obesity was regarded as BMI >30 kg/m2 and metabolic wellness was determinedby ATP III criteria as described in the Methods section, ‘Determination of metabolicwellness’. Subjects were between 20 and 59 years of age with mean ages 36.8 (LMW),37.5 (OBMW), 38.7 (OBMUW), and 40.0 (OBDM) (Table 1). Approximately half of thesubjects in each group were female; 63% of LMW, 54% of OBMW, 45% of OBMUW, and50% of OBDM. Additional demographic and clinical information are reported in Table 1.BMI, systolic and diastolic blood pressures, triglycerides, and fasting glucose level increasedwith the progression of metabolic unwellness from LMW to OBDM, while median HDLlevels decreased. Such trends are expected as these factors were used to categorize thesubjects.
BCAAs and related metabolites are elevated in obese, metabolicallyunwell, and diabetic statesOur data indicate an association of increased levels of the BCAAs with diabetes, obesityand metabolic unwellness. Valine, leucine and isoleucine—all essential amino acids—areassociated with all three states with strong statistical significance (p< 0.0001 overall foreach amino acid, see Table 2 and Fig. 1 for specifics). These findings have been noted inother studies (Tables S1, S2). Alloisoleucine, formed from the racemization of isoleucineand its subsequent retransamination, is increased in metabolic unwellness (p= 0.0001)and diabetes (p= 0.004) (Table 2, Fig. 1). This finding is previously unreported butconsistent with the elevated levels of isoleucine that are observed in these states (Table 2).
Libert et al. (2018), PeerJ, DOI 10.7717/peerj.5410 5/23
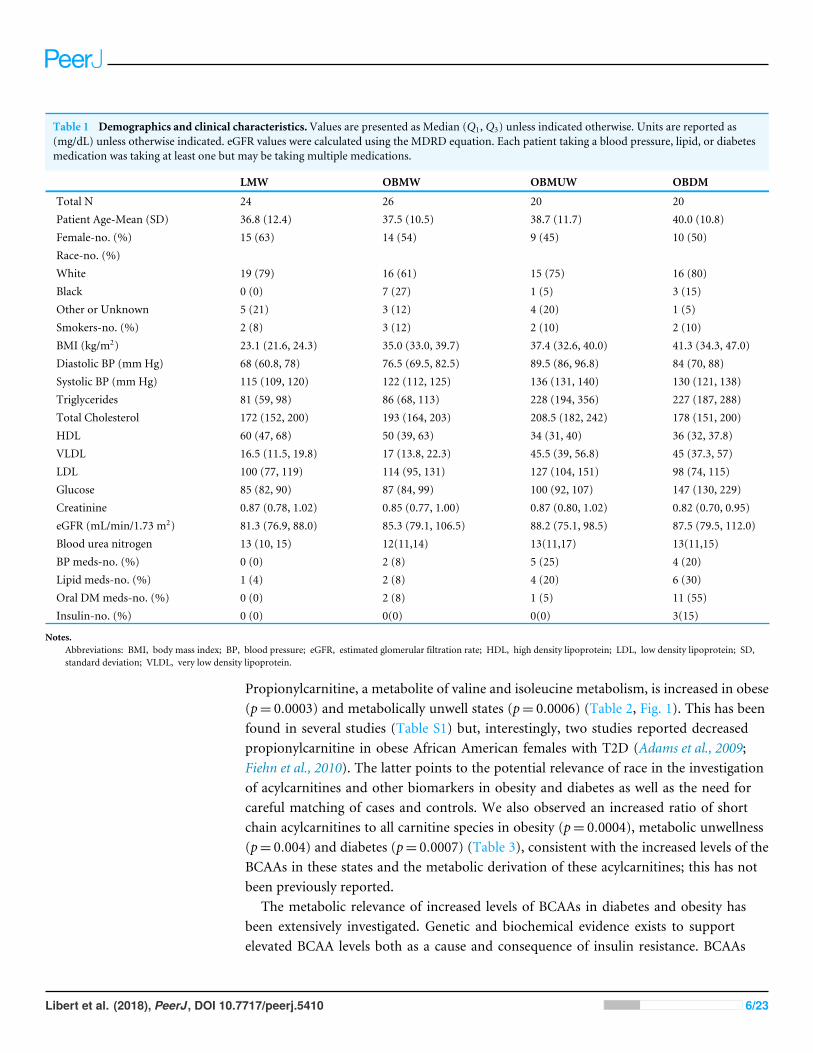
Table 1 Demographics and clinical characteristics.Values are presented as Median (Q1, Q3) unless indicated otherwise. Units are reported as(mg/dL) unless otherwise indicated. eGFR values were calculated using the MDRD equation. Each patient taking a blood pressure, lipid, or diabetesmedication was taking at least one but may be taking multiple medications.
LMW OBMW OBMUW OBDM
Total N 24 26 20 20Patient Age-Mean (SD) 36.8 (12.4) 37.5 (10.5) 38.7 (11.7) 40.0 (10.8)Female-no. (%) 15 (63) 14 (54) 9 (45) 10 (50)Race-no. (%)White 19 (79) 16 (61) 15 (75) 16 (80)Black 0 (0) 7 (27) 1 (5) 3 (15)Other or Unknown 5 (21) 3 (12) 4 (20) 1 (5)Smokers-no. (%) 2 (8) 3 (12) 2 (10) 2 (10)BMI (kg/m2) 23.1 (21.6, 24.3) 35.0 (33.0, 39.7) 37.4 (32.6, 40.0) 41.3 (34.3, 47.0)Diastolic BP (mm Hg) 68 (60.8, 78) 76.5 (69.5, 82.5) 89.5 (86, 96.8) 84 (70, 88)Systolic BP (mm Hg) 115 (109, 120) 122 (112, 125) 136 (131, 140) 130 (121, 138)Triglycerides 81 (59, 98) 86 (68, 113) 228 (194, 356) 227 (187, 288)Total Cholesterol 172 (152, 200) 193 (164, 203) 208.5 (182, 242) 178 (151, 200)HDL 60 (47, 68) 50 (39, 63) 34 (31, 40) 36 (32, 37.8)VLDL 16.5 (11.5, 19.8) 17 (13.8, 22.3) 45.5 (39, 56.8) 45 (37.3, 57)LDL 100 (77, 119) 114 (95, 131) 127 (104, 151) 98 (74, 115)Glucose 85 (82, 90) 87 (84, 99) 100 (92, 107) 147 (130, 229)Creatinine 0.87 (0.78, 1.02) 0.85 (0.77, 1.00) 0.87 (0.80, 1.02) 0.82 (0.70, 0.95)eGFR (mL/min/1.73 m2) 81.3 (76.9, 88.0) 85.3 (79.1, 106.5) 88.2 (75.1, 98.5) 87.5 (79.5, 112.0)Blood urea nitrogen 13 (10, 15) 12(11,14) 13(11,17) 13(11,15)BP meds-no. (%) 0 (0) 2 (8) 5 (25) 4 (20)Lipid meds-no. (%) 1 (4) 2 (8) 4 (20) 6 (30)Oral DMmeds-no. (%) 0 (0) 2 (8) 1 (5) 11 (55)Insulin-no. (%) 0 (0) 0(0) 0(0) 3(15)
Notes.Abbreviations: BMI, body mass index; BP, blood pressure; eGFR, estimated glomerular filtration rate; HDL, high density lipoprotein; LDL, low density lipoprotein; SD,standard deviation; VLDL, very low density lipoprotein.
Propionylcarnitine, a metabolite of valine and isoleucine metabolism, is increased in obese(p= 0.0003) and metabolically unwell states (p= 0.0006) (Table 2, Fig. 1). This has beenfound in several studies (Table S1) but, interestingly, two studies reported decreasedpropionylcarnitine in obese African American females with T2D (Adams et al., 2009;Fiehn et al., 2010). The latter points to the potential relevance of race in the investigationof acylcarnitines and other biomarkers in obesity and diabetes as well as the need forcareful matching of cases and controls. We also observed an increased ratio of shortchain acylcarnitines to all carnitine species in obesity (p= 0.0004), metabolic unwellness(p= 0.004) and diabetes (p= 0.0007) (Table 3), consistent with the increased levels of theBCAAs in these states and the metabolic derivation of these acylcarnitines; this has notbeen previously reported.
The metabolic relevance of increased levels of BCAAs in diabetes and obesity hasbeen extensively investigated. Genetic and biochemical evidence exists to supportelevated BCAA levels both as a cause and consequence of insulin resistance. BCAAs
Libert et al. (2018), PeerJ, DOI 10.7717/peerj.5410 6/23

Table 2 P-values reflecting overall group differences, the obesity effect, metabolic unwellness trend, and diabetic effect. P-values< 0.005 wereconsidered statistically significant and are bolded. Trend tests identified increasing (↑) or decreasing (↓) trends from LMW to OBMW to OBMUWgroups. Group comparisons identified increasing (↑) or decreasing (↓) if the second listed group had higher or lower values, respectively. For exam-ple, Obesity Effect for malonylcarnitine 0.0003 (↓) means that OBMW& OBMUW subjects have lower levels than LMW subjects.
Species Overall Obesity effect(LMW vs. OBMW,OBMUW)
MetabolicWellnessTrend (Nondiabetic)(LMW→OBMW→OBMUW)
Diabetic effect(LMW, OBMW,OBMUW vs. OBDM)
Alanine <0.0001 <0.0001 (↑) <0.0001 (↑) 0.008Alloisoleucine <0.0001 0.01 0.0001 (↑) 0.004(↑)Alpha-aminoadipic acid <0.0001 <0.0001 (↑) <0.0001 (↑) 0.004 (↑)Asparagine <0.0001 0.007 0.007 0.0001 (↓)3-OHbutyrylcarnitinea 0.001 0.3 0.59 0.0002 (↑)Cystine <0.0001 <0.0001 (↑) 0.001 (↑) <0.0001 (↑)Hexadecanoylcarnitine 0.005 0.02 0.02 0.01Isoleucine <0.0001 <0.0001 (↑) <0.0001 (↑) <0.0001 (↑)Leucine <0.0001 (↑) <0.0001 (↑) <0.0001 (↑) <0.0001 (↑)Lysine 0.0006 0.009 0.001 (↑) 0.008Malonylcarnitine 0.001 0.0003 (↓) 0.008 0.37Phenylalanine <0.0001 <0.0001 (↑) <0.0001 (↑) <0.0001 (↑)Propionylcarnitine 0.0005 0.0003 (↑) 0.0006 (↑) 0.03Tyrosine <0.0001 <0.0001 (↑) <0.0001 (↑) 0.03Valine <0.0001 0.001 (↑) <0.0001 (↑) <0.0001 (↑)
Notes.a3-OHbutyrylcarnitine was specifically quantified in 58 subjects (LMW= 14, OBMW= 20, OBMUW= 11, OBDM= 13).The species quantified in the other subjects could be either 3-OHisobutyrylcarnitine or 3-OHbutyrylcarnitine.
induce chronic phosphorylation of mTOR, JNK, and IRS-1, driving insulin resistance(Newgard et al., 2009). A recent genetic analysis revealed an association between a geneticvariant near the PPM1K gene, an activator of BCAA ketoacid dehydrogenase (BCKD), andT2D, implicating BCAAs with a causal role in the development of insulin resistance(Lotta et al., 2016). Other studies have linked impaired BCAA catabolism to insulinresistance or increased adiposity through reduced expression of BCKD and branched-chainaminotransferase, another complex that catabolizes BCAAs (She et al., 2007; Pietiläinen etal., 2008). Accelerated protein breakdown, a consequence of insulin resistance, may alsoexplain in part the increased levels of BCAAs in persons with diabetes or obesity (Lotta etal., 2016). Finally, insulin facilitates tissue uptake of BCAAs, especially in muscle, raisingthe possibility that insulin resistance may also be a contributing factor to the increasedlevels of plasma BCAAs in obese, metabolically unwell, and diabetic states (Fukagawa etal., 1986). Our data confirm involvement of the BCAAs in the pathogenesis of both obesityand diabetes, and as an important defining aspect of metabolic unwellness.
The increase in plasma BCAAs in metabolically unwell and diabetic persons has bothresearch and clinical implications. For example, levels of essential amino acids (BCAAs,histidine, lysine, methionine, phenylalanine, threonine, tryptophan) have been used toevaluate the pathobiology of diverse conditions such as heart failure (Cheng et al., 2015).In another study, Laferrère et al. (2011) compared obese diabetics who lost an equivalent
Libert et al. (2018), PeerJ, DOI 10.7717/peerj.5410 7/23
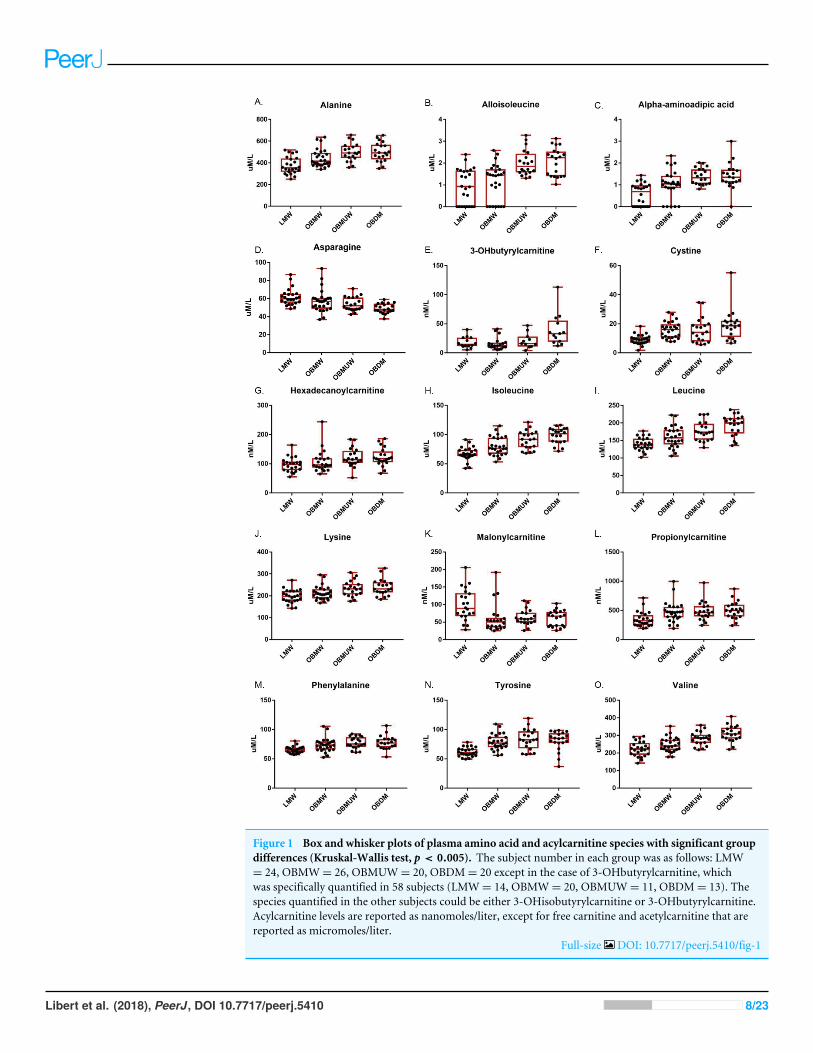
Figure 1 Box and whisker plots of plasma amino acid and acylcarnitine species with significant groupdifferences (Kruskal-Wallis test, p < 0.005). The subject number in each group was as follows: LMW= 24, OBMW= 26, OBMUW= 20, OBDM= 20 except in the case of 3-OHbutyrylcarnitine, whichwas specifically quantified in 58 subjects (LMW= 14, OBMW= 20, OBMUW= 11, OBDM= 13). Thespecies quantified in the other subjects could be either 3-OHisobutyrylcarnitine or 3-OHbutyrylcarnitine.Acylcarnitine levels are reported as nanomoles/liter, except for free carnitine and acetylcarnitine that arereported as micromoles/liter.
Full-size DOI: 10.7717/peerj.5410/fig-1
Libert et al. (2018), PeerJ, DOI 10.7717/peerj.5410 8/23
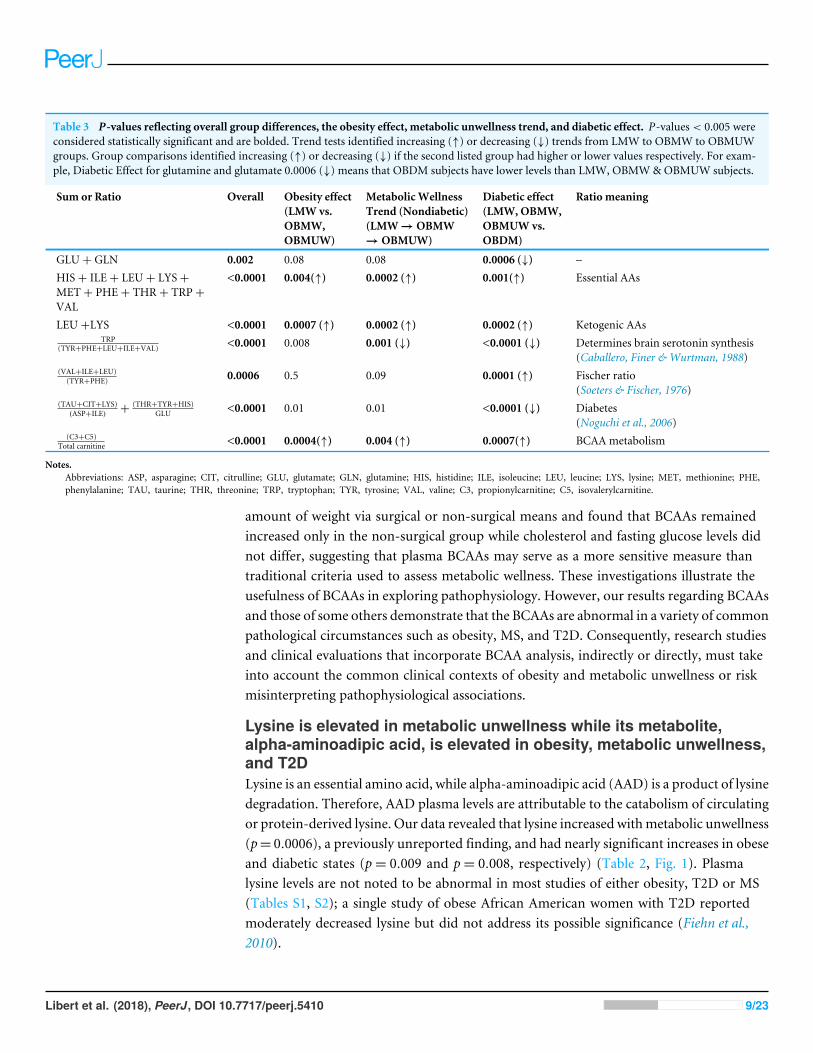
Table 3 P-values reflecting overall group differences, the obesity effect, metabolic unwellness trend, and diabetic effect. P-values< 0.005 wereconsidered statistically significant and are bolded. Trend tests identified increasing (↑) or decreasing (↓) trends from LMW to OBMW to OBMUWgroups. Group comparisons identified increasing (↑) or decreasing (↓) if the second listed group had higher or lower values respectively. For exam-ple, Diabetic Effect for glutamine and glutamate 0.0006 (↓) means that OBDM subjects have lower levels than LMW, OBMW& OBMUW subjects.
Sum or Ratio Overall Obesity effect(LMW vs.OBMW,OBMUW)
MetabolicWellnessTrend (Nondiabetic)(LMW→OBMW→OBMUW)
Diabetic effect(LMW, OBMW,OBMUW vs.OBDM)
Ratio meaning
GLU+ GLN 0.002 0.08 0.08 0.0006 (↓) –HIS+ ILE+ LEU+ LYS+MET+ PHE+ THR+ TRP+VAL
<0.0001 0.004(↑) 0.0002 (↑) 0.001(↑) Essential AAs
LEU+LYS <0.0001 0.0007 (↑) 0.0002 (↑) 0.0002 (↑) Ketogenic AAsTRP
(TYR+PHE+LEU+ILE+VAL) <0.0001 0.008 0.001 (↓) <0.0001 (↓) Determines brain serotonin synthesis(Caballero, Finer & Wurtman, 1988)
(VAL+ILE+LEU)(TYR+PHE) 0.0006 0.5 0.09 0.0001 (↑) Fischer ratio
(Soeters & Fischer, 1976)(TAU+CIT+LYS)
(ASP+ILE) +(THR+TYR+HIS)
GLU <0.0001 0.01 0.01 <0.0001 (↓) Diabetes(Noguchi et al., 2006)
(C3+C5)Total carnitine <0.0001 0.0004(↑) 0.004 (↑) 0.0007(↑) BCAA metabolism
Notes.Abbreviations: ASP, asparagine; CIT, citrulline; GLU, glutamate; GLN, glutamine; HIS, histidine; ILE, isoleucine; LEU, leucine; LYS, lysine; MET, methionine; PHE,phenylalanine; TAU, taurine; THR, threonine; TRP, tryptophan; TYR, tyrosine; VAL, valine; C3, propionylcarnitine; C5, isovalerylcarnitine.
amount of weight via surgical or non-surgical means and found that BCAAs remainedincreased only in the non-surgical group while cholesterol and fasting glucose levels didnot differ, suggesting that plasma BCAAs may serve as a more sensitive measure thantraditional criteria used to assess metabolic wellness. These investigations illustrate theusefulness of BCAAs in exploring pathophysiology. However, our results regarding BCAAsand those of some others demonstrate that the BCAAs are abnormal in a variety of commonpathological circumstances such as obesity, MS, and T2D. Consequently, research studiesand clinical evaluations that incorporate BCAA analysis, indirectly or directly, must takeinto account the common clinical contexts of obesity and metabolic unwellness or riskmisinterpreting pathophysiological associations.
Lysine is elevated in metabolic unwellness while its metabolite,alpha-aminoadipic acid, is elevated in obesity, metabolic unwellness,and T2DLysine is an essential amino acid, while alpha-aminoadipic acid (AAD) is a product of lysinedegradation. Therefore, AAD plasma levels are attributable to the catabolism of circulatingor protein-derived lysine. Our data revealed that lysine increased withmetabolic unwellness(p= 0.0006), a previously unreported finding, and had nearly significant increases in obeseand diabetic states (p= 0.009 and p= 0.008, respectively) (Table 2, Fig. 1). Plasmalysine levels are not noted to be abnormal in most studies of either obesity, T2D or MS(Tables S1, S2); a single study of obese African American women with T2D reportedmoderately decreased lysine but did not address its possible significance (Fiehn et al.,2010).
Libert et al. (2018), PeerJ, DOI 10.7717/peerj.5410 9/23
We noted that plasma AADwas significantly increased in all three states, with p< 0.0001for obesity and metabolic unwellness trend, and p= 0.004 for the T2D effect, respectively(Table 2). Only one other study has reported similar results. Wang et al. (2013) observedthat AAD predicted the development of diabetes in normoglycemic individuals andhypothesized that AAD levels increase in response to hyperglycemia, increasing insulinsecretion and contributing to a compensatory mechanism to maintain glucose homeostasisin early insulin resistance. One explanation for the elevation in plasma lysine is itsmobilization to provide AAD to promote insulin secretion in early insulin resistance,with perhaps less of a role in the setting of advanced insulin resistance in T2D. Thishypothesis is consistent with our observation of a more modest difference in AAD levelsbetween diabetic and non-diabetics compared to lean and obese subjects.
It is important to note that the pathways of BCAA and of lysine/AAD metabolism aredistinct. This, in turn, indicates that disparate biochemical pathways are dysregulated instates of obesity, metabolic unwellness, and diabetes.
Changes in phenylalanine and tyrosine levels with obesity, metabolicunwellness, and T2D reflect the pathophysiology of these processesand affect ratios implicated with hepatic function and serotoninsynthesisPhenylalanine, an essential amino acid, and tyrosine, a hydroxylation product ofphenylalanine metabolism, are largely metabolized in the liver, as is the other aromaticamino acid (AAA) tryptophan. We noted the plasma phenylalanine level to be increased inobese, metabolically unwell, and diabetic states (p< 0.0001), while tyrosine was increasedin obese and metabolically unwell states (p< 0.0001) but did not significantly differbetween diabetics and non-diabetics (p= 0.03) (Table 2, Fig. 1). Increased plasma levels ofphenylalanine and tyrosine have been observed in most analyses of amino acid biomarkersin obesity and T2D (Table S1).
The basis for the findings that we and others have noted is incompletely understood.Changes in these amino acids could be explained by several factors. One hypothesis isthat the increased circulating levels of the BCAAs compete with the aromatic amino acidsfor uptake into tissues through the shared large neutral amino acid transporter (LAT1)(Fernstrom, 2005; Newgard et al., 2009). Another possible explanation is that increasingliver dysfunction associated with metabolic unwellness results in decreased phenylalanineand tyrosine metabolism, leading to their elevated levels in plasma.
Still other factors may be operative and explain the increased levels of tyrosine and,possibly, phenylalanine. We noted, for example, that plasma cystine is significantlyassociated with obesity (p< 0.0001), metabolic unwellness (p= 0.001), and diabetes(p< 0.0001) (Table 2, Fig. 1). Cystine levels could be elevated as a result of increasedoxidative stress, or very early renal dysfunction (Buckley & Milligan, 1978; Hargrove &Wichman, 1987;Wijekoon, Brosnan & Brosnan, 2007; Pastore et al., 2015). Cysteine inhibitstyrosine aminotransferase activity, and can lead to an increased plasma tyrosine level(Buckley & Milligan, 1978; Hargrove & Wichman, 1987). No satisfying explanation for theelevation of tyrosine with obesity and metabolic unwellness but not diabetes is apparent.
Libert et al. (2018), PeerJ, DOI 10.7717/peerj.5410 10/23
This suggests that obese, metabolically unwell, and T2D subjects have metabolic signaturesthat evolve in a manner that is not entirely straightforward. Taken together, these findingsindicate that metabolic unwellness, through insulin resistance, the generation of reactiveoxygen species, or early end-organ dysfunction, leads to an elevation in phenylalanine andtyrosine.
Changes in the levels of the aromatic amino acids in the three states that we investigatedhave both research and clinical relevance. Plasma AAA levels are increased in persons withhepatic cirrhosis and, as such, the Fischer ratio (BCAAs/AAAs) is known to decrease withworsening liver dysfunction and is used to assess disease severity (Soeters & Fischer, 1976;Dejong et al., 2007). In this study, both AAAs and BCAAs increased in obesity, metabolicunwellness, and T2D, but the Fischer ratio only changed significantly in the diabetic state(p= 0.0001) (Table 3). A possible explanation for this finding is that only in a state ofextreme insulin resistance will the elevation of BCAAs so markedly surpass that of theAAAs. From a practical perspective, this finding advises caution in clinically using this ratioto evaluate hepatic dysfunction in diabetics.
In addition, serotonin synthesis in the brain depends on the tryptophan pool which,in turn, is determined by competition between tryptophan and other large neutral aminoacids (LNAAs; tryptophan, tyrosine, phenylalanine, and the BCAAs) at the blood–brain barrier (Pardridge & Oldendorf, 1975; Fernstrom &Wurtman, 1997). Therefore,the tryptophan/LNAA ratio has been utilized as a proxy to visualize changes in thebrain tryptophan pool (Ashley et al., 1985; Caballero, Finer & Wurtman, 1988; Breumet al., 2003). We found this ratio to be significantly decreased with metabolic unwellness(p= 0.001) and T2D (p< 0.0001), and nearly significant with obesity (p= 0.008) (Table 3).The tryptophan/LNAA ratio has not been evaluated in recent studies, but several olderstudies are consistent with our findings, though there are no data regarding the relevanceof this ratio to metabolic unwellness. This is a potentially actionable finding as tryptophansupplementation could possibly correct this ratio and provide clinical benefit. To ourknowledge, no study of the effect of tryptophan supplementation on weight loss oramelioration of metabolic syndrome has been published (Caballero, Finer & Wurtman,1988). Several monogenic metabolic disorders such as phenylketonuria are characterizedby markedly abnormal plasma amino acids levels that result in toxic brain levels. Whilethe mainstay of phenylketonuria treatment, for example, is the reduction of phenylalanineintake, recent investigations using animal models suggest that supplementation with largeneutral amino acids that compete with the excessive levels of phenylalanine at the sharedtransport systemmay be an effective alternative treatment (Van Vliet et al., 2016). Althoughthe magnitude of perturbation of brain amino acids would be expected to be less in personswith multifactorially determined obesity or metabolic syndrome than in classic monogenicmetabolic disorders, a similar principle could apply to treating these patients and furtherwork in this area appears warranted based on our findings.
In sum, these findings indicate that metabolic unwellness, through various possiblemechanisms, leads to an elevation in phenylalanine and tyrosine. In turn, the elevationof these species may alter the interpretation of the Fischer ratio, an indicator of hepatic
Libert et al. (2018), PeerJ, DOI 10.7717/peerj.5410 11/23
function, in diabetics. Moreover, the decreased tryptophan/LNAA ratio in metabolicallyunwell subjects indicates a possible decrease in serotonin synthesis, which may be clinicallyactionable.
Malonylcarnitine is decreased in obesity while 3-OHbutyrylcarnitineincreased in T2DMalonyl-CoA, the precursor of malonylcarnitine, is formed from acetyl-CoA by acetyl-CoA carboxylase and inhibits carnitine palmitoyltransferase I which, in turn, catalyzesthe rate-limiting step of mitochondrial fatty acid beta-oxidation (Saggerson, 2008). Wefound that malonylcarnitine is increased in lean vs. obese subjects (p= 0.0003); its levelssuggested but did not reach significance in terms of trending with metabolic wellness(p= 0.008) (Table 2, Fig. 1). 3-OHbutyrylcarnitine is increased in ketosis as it correlateswith 3-hydroxybutyrate levels (Hack et al., 2006). We found that 3-OHbutyrylcarnitinewas elevated in T2D (p= 0.0002) (Table 2, Fig. 1). Few studies have reported changes inthese metabolites. One study noted elevated levels of malonylcarnitine in incident T2D(Sun et al., 2016) and Mai et al. (2013) reported that the sum of malonylcarnitine and3-OHbutyrylcarnitine increased in T2D subjects compared to subjects with normal glucosetolerance, impaired fasting glucose, and impaired glucose tolerance.
The finding of increased 3-OHbutyrylcarnitine in T2D is not unexpected and isconsistent with increased ketones sometimes noted in this population (Mahendran etal., 2013). That malonylcarnitine is increased in lean normal vs. obese subjects is, to ourknowledge, previously unreported and unexpected. A possible explanation may be thatby inhibiting carnitine palmitoyltransferase I, it serves to shunt fatty acids away fromoxidative metabolism and promote an anabolic utilization of these compounds in the well,non-diabetic state.
Homocysteine levels did not significantly differ with obesity,metabolic wellness, or T2DIn this study, the median levels of plasma homocysteine did not significantly changewith obesity or T2D, and did not trend with metabolic unwellness (p= 0.26 overall,Table S5A). For decades, homocysteine has been of interest because an elevated serum levelis considered a risk factor for cardiovascular disease (Boushey et al., 1995; HomocysteineStudies Collaboration, 2002; Wald, Law & Morris, 2002). This has been related to its rolein causing endothelial damage (Félétou & Vanhoutte, 2006). Studies of the associationof serum homocysteine levels with insulin resistance have had conflicting results (Bar-On et al., 2000; Godsland et al., 2001; Meigs et al., 2001; Sanchez-Margalet et al., 2002).Mechanistically, elevated serum homocysteine could be a cause or consequence ofinsulin resistance. Studies in both rats and cultured human hepatocytes show thathyperinsulinemia affects the activity of 5,10-methlenetetrahydrofolate reductase (MTHFR)and cystathionine-beta-synthase (CBS), two key enzymes in homocysteine metabolism(Fonseca et al., 2000; Dicker-Brown et al., 2001). Additionally, one case-control studyshowed that the MTHFR C677T gene polymorphism, which results in increased serumhomocysteine levels, is associated with metabolic syndrome (Yang et al., 2014). Therehas been much interest in researching whether lowering serum homocysteine levels has
Libert et al. (2018), PeerJ, DOI 10.7717/peerj.5410 12/23
a beneficial effect on cardiovascular disease. One recent meta-analysis of randomized-controlled trials studying the effect of B12, B9, and/or B6 supplementation, which lowersblood homocysteine, found no evidence that supplementation prevents myocardialinfarction or lowers mortality rates in those living with cardiovascular disease, whileantihypertensives combined with a homocysteine-lowering regimen may reduce stroke(Martí-Carvajal et al., 2017).
Strengths and limitations of this workWe recognize several limitations to our study. First, although our subject groups includedboth ends of the spectrum of metabolic wellness, more granular analysis by inclusion ofseveral additional ‘‘intermediate’’ groups such as individuals who are lean andmetabolicallyunwell, individuals who are overweight (but not obese) and metabolically well, andindividuals who are overweight and unwell may have added to our study. Related to this,the fact that we lacked waist circumference data and had subjects of different races inour sample groups means that there is a possibility that our groups had slightly differentmetabolomes than their corresponding categories in the general population. Additionally,while we applied rigorous statistical methodology, it is possible that the size of our groupsdid not provide adequate statistical power to detect some very modest but still clinicallyrelevant metabolic changes or changes that occur in subpopulations.
Second, this study, like nearly all investigations in this area, analyzed fasting samples.Recent work indicates that physiological challenges such as glucose or lipid loads, exerciseor temperature stress can reveal increased inter-individual metabolic variation, evenin phenotypically similar subjects (Krug et al., 2012). This variation may be of clinicalrelevance but cannot be captured by exclusively analyzing fasting samples.
Third, while we analyzed a large number of metabolites, the targeted nature ofthe metabolomics analysis necessarily precludes discovery of analytes that may be ofsignificance that were not analyzed. One recent cohort study which applied an unbiasedsystems approach and analyzed 542 metabolites uncovered novel biomarkers includingspecies such as α-tocopherol, bradykinin and others, illustrating the usefulness of thisapproach (Peddinti et al., 2017). Fourth, the statistically significant metabolic associationsthat we noted do not establish causality of those associations. Although we see the changesin metabolite levels between populations differing in severity in terms of metabolicwellness and T2D (Table 2), this study does not enable one to make conclusions aboutthe contributory nature of metabolic changes in the progression of these conditions. Thislimitation is present in nearly all biomarker studies of similar design.
This study has several strengths. Unlike prior metabolomic analyses of obesity ormetabolic syndrome, this study incorporates an inclusion of well-defined populations ofindividuals along the pathophysiological spectrum that current definitions of metabolicwellness are designed to characterize: from lean, metabolically well individuals to those thathave developed T2D. Furthermore, we used one of the widely-used criteria of metabolicwellness to categorize our subjects, standardizing our results with other studies of thepathophysiology of metabolic syndrome. Additionally, we evaluated a larger number ofamino acid and acylcarnitine species than is measured in many similar biomarker studies
Libert et al. (2018), PeerJ, DOI 10.7717/peerj.5410 13/23
and, unlike most studies, also analyzed multiple clinically relevant ratios of these analytes.These measurements allowed us to uncover findings that have not been noted in previouswork. Lastly, use of a low a priori significance level, 0.005, reduced the likelihood of falsediscovery.
CONCLUSIONSBy group comparison and trend analysis of plasma amino acids and acylcarnitine levels inprespecified groups along a progression from LMW to OBDM, we have both supportedfindings in the literature and uncovered novel results. There is a ‘‘dose-dependentrelationship’’ between many metabolite levels and ratios with increasing metabolicunwellness, culminating in T2D, although an unsupervised cluster analysis did not separatethe subjects into the four prespecified groups (Table S4). In terms of specific analytes, wefound that the BCAAs, which have been described as both a cause and consequence ofinsulin resistance, are elevated in obesity, metabolic unwellness, and T2D. Our findingsregarding lysine and its metabolite alpha-aminoadipic acid support the hypothesis thatalpha-aminoadipic acid is involved in the pathophysiology of these conditions and mayact in early insulin resistance. Tyrosine was elevated in obesity and metabolic unwellness,earlier in MS progression than its precursor, phenylalanine, which was also elevatedin T2D. These findings could be attributed to early organ dysfunction or more complexchanges in biochemical pathways induced by insulin resistance.Malonylcarnitine decreasedwith obesity, a novel result warranting further investigation. Importantly, certain ratiosdescribing physiologic functions were altered as well. The Fischer ratio of liver dysfunctionwas altered in T2D, indicating that it should be used with caution in evaluating T2Dpatients. The tryptophan/LNAA ratio, an indicator of serotonin synthesis, was decreasedin obesity, MS, and T2D, and represents a potentially clinically actionable finding. Ourwork adds to that of others in the field in establishing the disparate biochemical pathways,not just those of BCAAs, are implicated in the pathophysiology of obesity, metabolicunwellness, and T2D.
Overall, we found: (1) even obese, metabolically healthy individuals by ATP III criteriahad metabolite levels that trended toward those of obese, diabetic individuals, challengingthe notion of the ‘‘obese, metabolically well’’; (2) there appears to be a ‘‘dose-dependentrelationship’’ between many metabolite levels and ratios with increasing metabolicunwellness, culminating in T2D; and (3) the progression from obesity to T2D is markedby complex biochemical changes that are not always explained by the straightforwardworsening of metabolic regulation in the face of increasing insulin resistance. This is shownby the elevation of tyrosine with obesity and metabolic unwellness and the decrease inmalonylcarnitine. This suggests the utility of measuring metabolite parameters over timein subjects when studying the metabolic effects of interventions for obesity, metabolicsyndrome, or T2D and may provide a more complete view of an individual’s metabolicwellness, especially if incorporated with other data such as HDL levels and measures ofinsulin resistance.
Libert et al. (2018), PeerJ, DOI 10.7717/peerj.5410 14/23
ACKNOWLEDGEMENTSWe thank Ms. Kathleen Pap and Ms. Regina Spatholt for assistance with obtaining andprocessing samples.
ADDITIONAL INFORMATION AND DECLARATIONS
FundingThis work was supported by the Cleveland Clinic Lerner College of Medicine and thePathology and Laboratory Medicine Institute of the Cleveland Clinic. There was noadditional external funding received for this study. The funders had no role in studydesign, data collection and analysis, decision to publish, or preparation of the manuscript.
Grant DisclosuresThe following grant information was disclosed by the authors:Cleveland Clinic Lerner College of Medicine.Pathology and Laboratory Medicine Institute of the Cleveland Clinic.
Competing InterestsThe authors declare there are no competing interests.
Author Contributions• Diane M. Libert, Amy S. Nowacki and Marvin Natowicz conceived and designedthe experiments, performed the experiments, analyzed the data, contributedreagents/materials/analysis tools, prepared figures and/or tables, authored or revieweddrafts of the paper, approved the final draft.
Human EthicsThe following information was supplied relating to ethical approvals (i.e., approving bodyand any reference numbers):
The Institutional Review Board of the Cleveland Clinic granted approval to carry outthe study (IRB #16-499).
Data AvailabilityThe following information was supplied regarding data availability:
The raw data are provided in a Supplemental File.
Supplemental InformationSupplemental information for this article can be found online at http://dx.doi.org/10.7717/peerj.5410#supplemental-information.
REFERENCESAdams SH, Hoppel CL, Lok KH, Zhao L,Wong SW,Minkler PE, Hwang DH, Newman
JW, GarveyWT. 2009. Plasma acylcarnitine profiles suggest incomplete long-chain fatty acid beta-oxidation and altered tricarboxylic acid cycle activity in type
Libert et al. (2018), PeerJ, DOI 10.7717/peerj.5410 15/23

2 diabetic African-American women. The Journal of Nutrition 139:1073–1081DOI 10.3945/jn.108.103754.
Alberti KG, Zimmet PZ. 1998. Definition, diagnosis and classification of diabetesmellitus and its complications. Part 1: diagnosis and classification of diabetesmellitus provisional report of a WHO consultation. Diabetic Medicine 15:539–553DOI 10.1002/(SICI)1096-9136(199807)15:7<539::AID-DIA668>3.0.CO;2-S.
Ashley DV, Fleury MO, Golay A, Maeder E, Leathwood PD. 1985. Evidence fordiminished brain 5-hydroxytryptamine biosynthesis in obese diabetic and non-diabetic humans. The American Journal of Clinical Nutrition 42:1240–1245DOI 10.1093/ajcn/42.6.1240.
Bailey K. 1994. Numerical taxonomy ad cluster analysis. In: Typologies and tax-onomies: an introduction to classification. Thousand Oaks: Sage Publications, 34–65DOI 10.4135/9781412986397.n3.
Balkau B, Charles MA. 1999. Comment on the provisional report from the WHOconsultation. European Group for the Study of Insulin Resistance (EGIR). DiabeticMedicine 16:442–443 DOI 10.1046/j.1464-5491.1999.00059.x.
Bar-OnH, KidronM, Friedlander Y, Ben-Yehuda A, Selhub J, Rosenberg IH, FriedmanG. 2000. Plasma total homocysteine levels in subjects with hyperinsulinemia. Journalof Internal Medicine 247:287–294 DOI 10.1046/j.1365-2796.2000.00592.x.
Boushey CJ, Beresford SA, Omenn GS, Motulsky AG. 1995. A quantitative assessmentof plasma homocysteine as a risk factor for vascular disease. Probable benefitsof increasing folic acid intakes. Journal of the American Medical Association274:1049–1057 DOI 10.1001/jama.1995.03530130055028.
Breum L, RasmussenMH, Hilsted J, Fernstrom JD. 2003. Twenty-four-hour plasmatryptophan concentrations and ratios are below normal in obese subjects and arenot normalized by substantial weight reduction. The American Journal of ClinicalNutrition 77:1112–1118 DOI 10.1093/ajcn/77.5.1112.
BuckleyWT, Milligan LP. 1978. Participation of cysteine and cystine in inactivationof tyrosine aminotransferase in rat liver homogenates. The Biochemical Journal176:449–454 DOI 10.1042/bj1760449.
Caballero B, Finer N,Wurtman RJ. 1988. Plasma amino acids and insulin levels inobesity: response to carbohydrate intake and tryptophan supplements.Metabolism:Clinical and Experimental 37:672–676 DOI 10.1016/0026-0495(88)90089-3.
ChengM-L,Wang C-H, ShiaoM-S, LiuM-H, Huang Y-Y, Huang C-Y, Mao C-T, LinJ-F, Ho H-Y, Yang N-I. 2015.Metabolic disturbances identified in plasma areassociated with outcomes in patients with heart failure: diagnostic and prognosticvalue of metabolomics. Journal of the American College of Cardiology 65:1509–1520DOI 10.1016/j.jacc.2015.02.018.
Dejong CHC, Van de Poll MCG, Soeters PB, Jalan R, Olde Damink SWM. 2007.Aromatic amino acid metabolism during liver failure. The Journal of Nutrition137:1579S–1585S DOI 10.1093/jn/137.6.1579S.
Dicker-Brown A, Fonseca VA, Fink LM, Kern PA. 2001. The effect of glucose andinsulin on the activity of methylene tetrahydrofolate reductase and cystathionine-
Libert et al. (2018), PeerJ, DOI 10.7717/peerj.5410 16/23
β-synthase: studies in hepatocytes. Atherosclerosis 158:297–301DOI 10.1016/S0021-9150(01)00442-7.
Fan J, Song Y, Chen Y, Hui R, ZhangW. 2013. Combined effect of obesity and cardio-metabolic abnormality on the risk of cardiovascular disease: a meta-analysis ofprospective cohort studies. International Journal of Cardiology 168:4761–4768DOI 10.1016/j.ijcard.2013.07.230.
FélétouM, Vanhoutte PM. 2006. Endothelial dysfunction: a multifaceted disorder.American Journal of Physiology 291:H985–1002 DOI 10.1152/ajpheart.00292.2006.
Felig P, Marliss E, Cahill GFJ. 1969. Plasma amino acid levels and insulin secretion inobesity. New England Journal of Medicine 281:811–816DOI 10.1056/NEJM196910092811503.
Fernstrom JD. 2005. Branched-chain amino acids and brain function. The Journal ofNutrition 135:1539S–1546S DOI 10.1093/jn/135.6.1539S.
Fernstrom JD,Wurtman RJ. 1997. Brain serotonin content: physiological reg-ulation by plasma neutral amino acids. 1971. Obesity Research 5:377–380DOI 10.1002/j.1550-8528.1997.tb00567.x.
Fiehn O, GarveyWT, Newman JW, Lok KH, Hoppel CL, Adams SH. 2010. Plasmametabolomic profiles reflective of glucose homeostasis in non-diabetic and type 2diabetic obese African-American women. PLOS ONE 5:e15234DOI 10.1371/journal.pone.0015234.
Fonseca V, Dicker-Brown A, Ranganathan S, SongW, Barnard RJ, Fink L, KernPA. 2000. Effects of a high-fat-sucrose diet on enzymes in homocysteinemetabolism in the rat.Metabolism: Clinical and Experimental 49:736–741DOI 10.1053/meta.2000.6256.
Fukagawa NK, Minaker KL, Young VR, Rowe JW. 1986. Insulin dose-dependentreductions in plasma amino acids in man. The American Journal of Physiology250:E13–17.
The GBD 2015 Obesity Collaborators. 2017.Health effects of overweight and obesity in195 countries over 25 years. New England Journal of Medicine 377:13–27DOI 10.1056/NEJMoa1614362.
Godsland IF, Rosankiewicz JR, Proudler AJ, Johnston DG. 2001. Plasma total ho-mocysteine concentrations are unrelated to insulin sensitivity and components ofthe metabolic syndrome in healthy men. The Journal of Clinical Endocrinology &Metabolism 86:719–723 DOI 10.1210/jcem.86.2.7213.
Grundy SM, Cleeman JI, Daniels SR, Donato KA, Eckel RH, Franklin BA, Gor-don DJ, Krauss RM, Savage PJ, Smith SC, Spertus JA, Costa F. 2005. Diagno-sis and management of the metabolic syndrome. Circulation 112:2735–2752DOI 10.1161/CIRCULATIONAHA.105.169404.
Hack A, Busch V, Pascher B, Busch R, Bieger I, Gempel K, Baumeister FAM. 2006.Monitoring of ketogenic diet for carnitine metabolites by subcutaneous microdial-ysis. Pediatric Research 60:93–96 DOI 10.1203/01.pdr.0000219479.95410.79.
Libert et al. (2018), PeerJ, DOI 10.7717/peerj.5410 17/23
Hargrove JL, Wichman RD. 1987. A cystine-dependent inactivator of tyrosine amino-transferase co-purifies with gamma-cystathionase (cystine desulfurase). The Journalof Biological Chemistry 262:7351–7357.
Homocysteine Studies Collaboration. 2002.Homocysteine and risk of ischemic heartdisease and stroke: a meta-analysis. Journal of the American Medical Association288:2015–2022 DOI 10.1001/jama.288.16.2015.
Jain AK. 2010. Data clustering: 50 years beyond K-means. Pattern Recognition Letters31:651–666 DOI 10.1016/j.patrec.2009.09.011.
JeevanandamM, Ramias L, SchillerWR. 1991. Altered plasma free amino acid levelsin obese traumatized man.Metabolism: Clinical and Experimental 40:385–390DOI 10.1016/0026-0495(91)90149-Q.
Kramer CK, Zinman B, Retnakaran R. 2013. Are metabolically healthy overweight andobesity benign conditions?: a systematic review and meta-analysis. Annals of InternalMedicine 159:758–769 DOI 10.7326/0003-4819-159-11-201312030-00008.
Krug S, Kastenmüller G, Stückler F, Rist MJ, Skurk T, Sailer M, Raffler J, Römisch-MarglW, Adamski J, Prehn C, Frank T, Engel K-H, Hofmann T, Luy B, Zimmer-mann R, Moritz F, Schmitt-Kopplin P, Krumsiek J, KremerW, Huber F, Oeh U,Theis FJ, SzymczakW, Hauner H, Suhre K, Daniel H. 2012. The dynamic rangeof the human metabolome revealed by challenges. FASEB Journal 26:2607–2619DOI 10.1096/fj.11-198093.
Laferrère B, Reilly D, Arias S, Swerdlow N, Gorroochurn P, Bawa B, Bose M, TeixeiraJ, Stevens RD,Wenner BR, Bain JR, Muehlbauer MJ, Haqq A, Lien L, Shah SH,Svetkey LP, Newgard CB. 2011. Differential metabolic impact of gastric bypasssurgery versus dietary intervention in obese diabetic subjects despite identical weightloss. Science Translational Medicine 3:80re2 DOI 10.1126/scitranslmed.3002043.
Lavie CJ, De Schutter A, Milani RV. 2015.Healthy obese versus unhealthy lean: the obe-sity paradox. Nature Reviews Endocrinology 11:55–62 DOI 10.1038/nrendo.2014.165.
Lotta LA, Scott RA, Sharp SJ, Burgess S, Luan J ’an, Tillin T, Schmidt AF, Imamura F,Stewart ID, Perry JRB, Marney L, Koulman A, Karoly ED, Forouhi NG, SjögrenRJO, Näslund E, Zierath JR, Krook A, Savage DB, Griffin JL, Chaturvedi N,Hingorani AD, Khaw K-T, Barroso I, McCarthyMI, O’Rahilly S, WarehamNJ,Langenberg C. 2016. Genetic predisposition to an impaired metabolism of thebranched-chain amino acids and risk of type 2 diabetes: a mendelian randomisationanalysis. PLOS Medicine 13:e1002179 DOI 10.1371/journal.pmed.1002179.
Mahendran Y, Vangipurapu J, Cederberg H, Stancáková A, Pihlajamäki J, Soininen P,Kangas AJ, Paananen J, CivelekM, SaleemNK, Pajukanta P, Lusis AJ, BonnycastleLL, MorkenMA, Collins FS, Mohlke KL, BoehnkeM, Ala-Korpela M, Kuusisto J,LaaksoM. 2013. Association of ketone body levels with hyperglycemia and type 2diabetes in 9,398 Finnish men. Diabetes 62:3618–3626 DOI 10.2337/db12-1363.
MaiM, Tönjes A, Kovacs P, Stumvoll M, Fiedler GM, Leichtle AB. 2013. Serumlevels of acylcarnitines are altered in prediabetic conditions. PLOS ONE 8:e82459DOI 10.1371/journal.pone.0082459.
Libert et al. (2018), PeerJ, DOI 10.7717/peerj.5410 18/23

Martí-Carvajal AJ, Solà I, Lathyris D, Dayer M. 2017. Homocysteine-lowering inter-ventions for preventing cardiovascular events. In: Cochrane database of systematicreviews. Vol. 8. John Wiley & Sons, Ltd., CD006612DOI 10.1002/14651858.CD006612.pub5.
Meigs JB, Jacques PF, Selhub J, Singer DE, Nathan DM, Rifai N, D’Agostino RB,Wilson PW. 2001. Fasting plasma homocysteine levels in the insulin resistancesyndrome: the Framingham offspring study. Diabetes Care 24:1403–1410DOI 10.2337/diacare.24.8.1403.
Mihalik SJ, Michaliszyn SF, De las Heras J, Bacha F, Lee S, Chace DH, DeJesus VR,Vockley J, Arslanian SA. 2012.Metabolomic profiling of fatty acid and aminoacid metabolism in youth with obesity and type 2 diabetes: evidence for enhancedmitochondrial oxidation. Diabetes Care 35:605–611 DOI 10.2337/DC11-1577.
Mørkedal B, Vatten LJ, Romundstad PR, Laugsand LE, Janszky I. 2014. Risk of myocar-dial infarction and heart failure among metabolically healthy but obese individuals:HUNT (Nord-Trøndelag Health Study), Norway. Journal of the American College ofCardiology 63:1071–1078 DOI 10.1016/j.jacc.2013.11.035.
Narayan SB, Ditewig-Meyers G, GrahamKS, Scott R, Bennett MJ. 2011.Measurementof plasma amino acids by ultraperformance R© liquid chromatography. ClinicalChemistry and Laboratory Medicine 49:1177–1185 DOI 10.1515/CCLM.2011.200.
Newgard CB, An J, Bain JR, Muehlbauer MJ, Stevens RD, Lien LF, Haqq AM, Shah SH,Arlotto M, Slentz CA, Rochon J, Gallup D, Ilkayeva O,Wenner BR, YancyWS,Eisenson H, Musante G, Surwit RS, Millington DS, Butler MD, Svetkey LP. 2009.A branched-chain amino acid-related metabolic signature that differentiates obeseand lean humans and contributes to insulin resistance. Cell Metabolism 9:311–326DOI 10.1016/j.cmet.2009.02.002.
Noguchi Y, Zhang Q-W, Sugimoto T, Furuhata Y, Sakai R, Mori M, Takahashi M,Kimura T. 2006. Network analysis of plasma and tissue amino acids and thegeneration of an amino index for potential diagnostic use. The American Journal ofClinical Nutrition 83:513S–519S DOI 10.1093/ajcn/83.2.513S.
Ogden CL, Carroll MD, Flegal KM. 2003. Epidemiologic trends in overweight andobesity. Endocrinology and Metabolism Clinics of North America 32:741–760DOI 10.1016/S0889-8529(03)00074-4.
PardridgeWM, OldendorfWH. 1975. Kinetic analysis of blood–brain barrier transportof amino acids. Biochimica Et Biophysica Acta 401:128–136DOI 10.1016/0005-2736(75)90347-8.
Pastore A, Noce A, Di Giovamberardino G, De Stefano A, Callà C, Zenobi R, Dessì M,Di Daniele N. 2015.Homocysteine, cysteine, folate and vitamin B12 status in type2 diabetic patients with chronic kidney disease. Journal of Nephrology 28:571–576DOI 10.1007/s40620-014-0126-4.
Peddinti G, Cobb J, Yengo L, Froguel P, Kravić J, Balkau B, Tuomi T, Aittokallio T,Groop L. 2017. Early metabolic markers identify potential targets for the preventionof type 2 diabetes. Diabetologia 60:1740–1750 DOI 10.1007/s00125-017-4325-0.
Libert et al. (2018), PeerJ, DOI 10.7717/peerj.5410 19/23

Pietiläinen KH, Naukkarinen J, Rissanen A, Saharinen J, Ellonen P, KeränenH, Suomalainen A, Götz A, Suortti T, Yki-Järvinen H, Orešič M, Kaprio J,Peltonen L. 2008. Global transcript profiles of fat in monozygotic twins dis-cordant for BMI: pathways behind acquired obesity. PLOS Medicine 5:51DOI 10.1371/journal.pmed.0050051.
Rauschert S, Uhl O, Koletzko B, Hellmuth C. 2014.Metabolomic biomarkers forobesity in humans: a short review. Annals of Nutrition & Metabolism 64:314–324DOI 10.1159/000365040.
Saggerson D. 2008.Malonyl-CoA, a key signaling molecule in mammalian cells. AnnualReview of Nutrition 28:253–272 DOI 10.1146/annurev.nutr.28.061807.155434.
Sanchez-Margalet V, Valle M, Ruz FJ, Gascon F, Mateo J, Goberna R. 2002. Elevatedplasma total homocysteine levels in hyperinsulinemic obese subjects. The Journal ofNutritional Biochemistry 13:75–79 DOI 10.1016/S0955-2863(01)00197-8.
SchoonemanMG, Achterkamp N, Argmann CA, Soeters MR, Houten SM. 2014. Plasmaacylcarnitines inadequately reflect tissue acylcarnitine metabolism. Biochimica EtBiophysica Acta 1841:987–994 DOI 10.1016/j.bbalip.2014.04.001.
Scott D, Heese B, Garg U. 2016. Quantification of free carnitine and acylcarnitines inplasma or serum using HPLC/MS/MS.Methods in Molecular Biology 1378:11–19DOI 10.1007/978-1-4939-3182-8_2.
She P, Van Horn C, Reid T, Hutson SM, Cooney RN, Lynch CJ. 2007. Obesity-related elevations in plasma leucine are associated with alterations in enzymesinvolved in branched-chain amino acid metabolism. American Journal of Physiology293:E1552–E1563 DOI 10.1152/ajpendo.00134.2007.
Soeters PB, Fischer JE. 1976. Insulin, glucagon, aminoacid imbalance, and hepaticencephalopathy. Lancet 2:880–882.
Suhre K, Meisinger C, Döring A, Altmaier E, Belcredi P, Gieger C, Chang D, MilburnMV, Gall WE,Weinberger KM,Mewes H-W, Hrabé de Angelis M,WichmannH-E, Kronenberg F, Adamski J, Illig T. 2010.Metabolic footprint of diabetes:a multiplatform metabolomics study in an epidemiological setting. PLOS ONE5:e13953 DOI 10.1371/journal.pone.0013953.
Sun L, Liang L, Gao X, Zhang H, Yao P, Hu Y, Ma Y,Wang F, Jin Q, Li H, Li R, Liu Y,Hu FB, Zeng R, Lin X,Wu J. 2016. Early prediction of developing type 2 diabetesby plasma acylcarnitines: a population-based study. Diabetes Care 39:1563–1570DOI 10.2337/dc16-0232.
Tewari PC, Zhang B, Bluestein BI. 2004. Analytical and clinical evaluation of theBayer ADVIA Centaur homocysteine assay. Clinica Chimica Acta 342:171–178DOI 10.1016/j.cccn.2003.12.025.
Van Vliet D, Bruinenberg VM,Mazzola PN, Van FaassenMH, De Blaauw P, PascucciT, Puglisi-Allegra S, Kema IP, Heiner-FokkemaMR, Van der Zee EA, Van Spron-sen FJ. 2016. Therapeutic brain modulation with targeted large neutral amino acidsupplements in the Pah-enu2 phenylketonuria mouse model. The American Journalof Clinical Nutrition 104:1292–1300 DOI 10.3945/ajcn.116.135996.
Libert et al. (2018), PeerJ, DOI 10.7717/peerj.5410 20/23

Wald DS, LawM,Morris JK. 2002.Homocysteine and cardiovascular disease: evidenceon causality from a meta-analysis. BMJ 325:1202 DOI 10.1136/bmj.325.7374.1202.
Wang TJ, Ngo D, Psychogios N, Dejam A, LarsonMG, Vasan RS, Ghorbani A,O’Sullivan J, Cheng S, Rhee EP, Sinha S, McCabe E, Fox CS, O’Donnell CJ, Ho JE,Florez JC, MagnussonM, Pierce KA, Souza AL, Yu Y, Carter C, Light PE, MelanderO, Clish CB, Gerszten RE. 2013. 2-Aminoadipic acid is a biomarker for diabetes risk.The Journal of Clinical Investigation 123:4309–4317 DOI 10.1172/JCI64801.
Wijekoon EP, BrosnanME, Brosnan JT. 2007.Homocysteine metabolism in diabetes.Biochemical Society Transactions 35:1175–1179 DOI 10.1042/BST0351175.
Xu F, Tavintharan S, Sum CF,Woon K, Lim SC, Ong CN. 2013.Metabolic sig-nature shift in type 2 diabetes mellitus revealed by mass spectrometry-basedmetabolomics. The Journal of Clinical Endocrinology and Metabolism 98:E1060–1065DOI 10.1210/jc.2012-4132.
Yang B, Fan S, Zhi X,Wang D, Li Y,Wang Y,Wang Y,Wei J, Zheng Q, Sun G. 2014.Associations of MTHFR C677T and MTRR A66G gene polymorphisms withmetabolic syndrome: a case-control study in northern China. International Journalof Molecular Sciences 15:21687–21702 DOI 10.3390/ijms151221687.
Zhong F, XuM, Bruno RS, Ballard KD, Zhu J. 2017. Targeted high performance liquidchromatography tandem mass spectrometry-based metabolomics differentiatesmetabolic syndrome from obesity. Experimental Biology and Medicine 242:773–780DOI 10.1177/1535370217694098.
Zimmet P, Magliano D, Matsuzawa Y, Alberti G, Shaw J. 2005. The metabolic syn-drome: a global public health problem and a new definition. Journal of Atherosclerosisand Thrombosis 12:295–300 DOI 10.5551/jat.12.295.
FURTHER READINGAllam-Ndoul B, Guénard F, Garneau V, Cormier H, Barbier O, Pérusse L, Vohl M-
C. 2016. Association between metabolite profiles, metabolic syndrome and obesitystatus. Nutrients 8:E324 DOI 10.3390/nu8060324.
Batch BC, Shah SH, Newgard CB, Turer CB, Haynes C, Bain JR, Muehlbauer M, PatelMJ, Stevens RD, Appel LJ, Newby LK, Svetkey LP. 2013. Branched chain aminoacids are novel biomarkers for discrimination of metabolic wellness.Metabolism:Clinical and Experimental 62:961–969 DOI 10.1016/j.metabol.2013.01.007.
Chen H-H, Tseng YJ, Wang S-Y, Tsai Y-S, Chang C-S, Kuo T-C, YaoW-J, Shieh C-C,Wu C-H, Kuo P-H. 2015. The metabolome profiling and pathway analysisin metabolic healthy and abnormal obesity. International Journal of Obesity39:1241–1248 DOI 10.1038/ijo.2015.65.
Floegel A,Wientzek A, Bachlechner U, Jacobs S, Drogan D, Prehn C, Adamski J,Krumsiek J, Schulze MB, Pischon T, Boeing H. 2014. Linking diet, physical activity,cardiorespiratory fitness and obesity to serum metabolite networks: findings froma population-based study. International Journal of Obesity (2005) 38:1388–1396DOI 10.1038/ijo.2014.39.
Libert et al. (2018), PeerJ, DOI 10.7717/peerj.5410 21/23

Gao X, ZhangW,Wang Y, Pedram P, Cahill F, Zhai G, Randell E, GulliverW, Sun G.2016. Serum metabolic biomarkers distinguish metabolically healthy peripherallyobese from unhealthy centrally obese individuals. Nutrition & Metabolism 13:33DOI 10.1186/s12986-016-0095-9.
Gil-Garcia RJ, Badia-Contelles JM, Pons-Porrata A. 2006. A general framework foragglomerative hierarchical clustering algorithms. In: 18th international conferenceon pattern recognition. Hong Kong, 569–572 DOI 10.1109/ICPR.2006.69.
KamauraM, Nishijima K, Takahashi M, Ando T, Mizushima S, Tochikubo O. 2010.Lifestyle modification in metabolic syndrome and associated changes in plasmaamino acid profiles. Circulation Journal 74:2434–2440 DOI 10.1253/circj.CJ-10-0150.
Kim JY, Park JY, KimOY, Ham BM, KimH-J, Kwon DY, Jang Y, Lee JH. 2010.Metabolic profiling of plasma in overweight/obese and lean men using ultraperformance liquid chromatography and Q-TOF mass spectrometry (UPLC-Q-TOFMS). Journal of Proteome Research 9:4368–4375 DOI 10.1021/pr100101p.
Mangge H, Zelzer S, Prüller F, SchnedlWJ,Weghuber D, Enko D, Bergsten P,Haybaeck J, Meinitzer A. 2016. Branched-chain amino acids are associated withcardiometabolic risk profiles found already in lean, overweight and obese young. TheJournal of Nutritional Biochemistry 32:123–127 DOI 10.1016/j.jnutbio.2016.02.007.
Menni C, Fauman E, Erte I, Perry JRB, Kastenmüller G, Shin S-Y, Petersen A-K, HydeC, PsathaM,Ward KJ, YuanW,MilburnM, Palmer CNA, Frayling TM, TrimmerJ, Bell JT, Gieger C, Mohney RP, BrosnanMJ, Suhre K, Soranzo N, Spector TD.2013. Biomarkers for type 2 diabetes and impaired fasting glucose using a nontar-geted metabolomics approach. Diabetes 62:4270–4276 DOI 10.2337/db13-0570.
Mihalik SJ, Goodpaster BH, Kelley DE, Chace DH, Vockley J, Toledo FGS, DeLanyJP. 2010. Increased levels of plasma acylcarnitines in obesity and type 2 dia-betes and identification of a marker of glucolipotoxicity. Obesity 18:1695–1700DOI 10.1038/oby.2009.510.
Palmer ND, Stevens RD, Antinozzi PA, Anderson A, Bergman RN,Wagenknecht LE,Newgard CB, Bowden DW. 2015.Metabolomic profile associated with insulinresistance and conversion to diabetes in the Insulin Resistance AtherosclerosisStudy. The Journal of Clinical Endocrinology and Metabolism 100:E463–468DOI 10.1210/jc.2014-2357.
Qiu G, Zheng Y,Wang H, Sun J, Ma H, Xiao Y, Li Y, Yuan Y, Yang H, Li X, Min X,Zhang C, Xu C, Jiang Y, Zhang X, HeM, YangM, Hu Z, Tang H, Shen H, Hu FB,Pan A,Wu T. 2016. Plasma metabolomics identified novel metabolites associatedwith risk of type 2 diabetes in two prospective cohorts of Chinese adults. Interna-tional Journal of Epidemiology 45:1507–1516 DOI 10.1093/ije/dyw221.
Tillin T, Hughes AD,Wang Q,Würtz P, Ala-Korpela M, Sattar N, Forouhi NG, Gods-land IF, Eastwood SV, McKeigue PM, Chaturvedi N. 2015. Diabetes risk and aminoacid profiles: cross-sectional and prospective analyses of ethnicity, amino acids anddiabetes in a South Asian and European cohort from the SABRE (Southall And BrentREvisited) study. Diabetologia 58:968–979 DOI 10.1007/s00125-015-3517-8.
Libert et al. (2018), PeerJ, DOI 10.7717/peerj.5410 22/23
Villarreal-Pérez JZ, Villarreal-Martínez JZ, Lavalle-González FJ, Torres-SepúlvedaM del R, Ruiz-Herrera C, Cerda-Flores RM, Castillo-García ER, Rodríguez-Sánchez IP, Villarreal LEM de. 2014. Plasma and urine metabolic profilesare reflective of altered beta-oxidation in non-diabetic obese subjects and pa-tients with type 2 diabetes mellitus. Diabetology & Metabolic Syndrome 6:129DOI 10.1186/1758-5996-6-129.
Wang TJ, LarsonMG, Vasan RS, Cheng S, Rhee EP, McCabe E, Lewis GD, Fox CS,Jacques PF, Fernandez C, O’Donnell CJ, Carr SA, Mootha VK, Florez JC, SouzaA, Melander O, Clish CB, Gerszten RE. 2011.Metabolite profiles and the risk ofdeveloping diabetes. Nature Medicine 17:448–453 DOI 10.1038/nm.2307.
Wang-Sattler R, Yu Z, Herder C, Messias AC, Floegel A, He Y, Heim K, CampillosM, Holzapfel C, Thorand B, Grallert H, Xu T, Bader E, Huth C, Mittelstrass K,Döring A, Meisinger C, Gieger C, Prehn C, Roemisch-MarglW, CarstensenM,Xie L, Yamanaka-Okumura H, Xing G, Ceglarek U, Thiery J, Giani G, Lickert H,Lin X, Li Y, Boeing H, Joost H-G, De Angelis MH, RathmannW, Suhre K, ProkischH, Peters A, Meitinger T, RodenM,WichmannH-E, Pischon T, Adamski J, IlligT. 2012. Novel biomarkers for pre-diabetes identified by metabolomics.MolecularSystems Biology 8:615 DOI 10.1038/msb.2012.43.
Wiklund PK, Pekkala S, Autio R, Munukka E, Xu L, Saltevo J, Cheng S, Kujala UM,AlenM, Cheng S. 2014. Serum metabolic profiles in overweight and obese womenwith and without metabolic syndrome. Diabetology & Metabolic Syndrome 6:40DOI 10.1186/1758-5996-6-40.
YamakadoM, Nagao K, Imaizumi A, Tani M, Toda A, Tanaka T, Jinzu H, MiyanoH, Yamamoto H, Daimon T, Horimoto K, Ishizaka Y. 2015. Plasma free aminoacid profiles predict four-year risk of developing diabetes, metabolic syndrome,dyslipidemia, and hypertension in japanese population. Scientific Reports 5:11918DOI 10.1038/srep11918.
Yu D,Moore SC, Matthews CE, Xiang Y-B, Zhang X, Gao Y-T, ZhengW, Shu X-O.2016. Plasma metabolomic profiles in association with type 2 diabetes risk andprevalence in Chinese adults.Metabolomics 12:3 DOI 10.1007/s11306-015-0890-8.
Libert et al. (2018), PeerJ, DOI 10.7717/peerj.5410 23/23