Metabolome and transcriptome profiling provide insights ...
15
Ding et al. BMC Plant Biol (2021) 21:351 https://doi.org/10.1186/s12870-021-03121-3 RESEARCH Metabolome and transcriptome profiling provide insights into green apple peel reveals light- and UV-B-responsive pathway in anthocyanins accumulation Ruirui Ding † , Xingkai Che † , Zhen Shen and Yuanhu Zhang * Abstract Background: In nature, green apple are associated with the accumulation of chlorophyll, while red apple varieties are associated with anthocyanins accumulation. Notably, in this study, the green skin color apple variety ‘white winter pearmain’ treated with ultraviolet-B (UV-B) exhibited red skins and marked anthocyanin accumulation, while visible light could not. But there are few reports on the biosynthesis difference of anthocyanins in green apple by visible light and UV-B-treatment. Here, we explored the difference of metabolites and genes expression level in green apple by transcriptomic and metabolic. Results: The metabolic analysis revealed that there were 152 and 178 significantly changed metabolites in the vis- ible light and UV-B-treated green apple, respectively, compared to the control, and flavone, flavonol, and anthocya- nin were the most significantly increased; and transcriptomic analysis showed that 37,110 and 37,709 differentially expressed genes, including 382 and 475 transcription factors (TFs) were detected in light and UV-B-treatment fruit, respectively. Quantitative reverse transcription PCR (qRT-PCR) results confirmed changes in the expression levels of genes encoding metabolites involved in the flavonoid synthesis pathways. The flavonoid metabolic flux in the UV-B treatment increased the accumulation of cyanidin 3-glucoside and cyanidin 3, 5-diglucoside compared to under the light-treatment. Furthermore, we performed qRT-PCR analysis of anthocyanin biosynthesis genes and predicted the gene of MD00G1134400 (a UDP glucose-flavonoid 3–0-glucosyltransferase) may be a candidate gene for anthocyanins accumulation and highly expressed in UV-B-treatment fruit. Expression profiles of several transcription factors of the families MYB, bHLH, NAC were highly correlated with the content of the anthocyanin. Conclusions: The composition and contents of anthocyanins in green apple in UV-B-treatment very greatly. A series of metabolites and candidate genes were revealed through combined analysis of metabolome and transcriptome. These results provide an important data for dissecting candidate genes and molecular basis governing green apple color formation in response to visible light and UV-B light. Keywords: Apple, Flavonoids and anthocyanins accumulation, Visible light, UV-B, Metabolomic and transcriptome © The Author(s) 2021. Open Access This article is licensed under a Creative Commons Attribution 4.0 International License, which permits use, sharing, adaptation, distribution and reproduction in any medium or format, as long as you give appropriate credit to the original author(s) and the source, provide a link to the Creative Commons licence, and indicate if changes were made. The images or other third party material in this article are included in the article’s Creative Commons licence, unless indicated otherwise in a credit line to the material. If material is not included in the article’s Creative Commons licence and your intended use is not permitted by statutory regulation or exceeds the permitted use, you will need to obtain permission directly from the copyright holder. To view a copy of this licence, visit http://creativecommons.org/licenses/by/4.0/. The Creative Commons Public Domain Dedication waiver (http://creativeco mmons.org/publicdomain/zero/1.0/) applies to the data made available in this article, unless otherwise stated in a credit line to the data. Background In recent years, red apple have attracted the attention of consumers due to their attractive appearance and their reported nutritional value [1, 2]. Red apple vari- eties such as ‘Fuji’ [3] and ‘Fortune’ [4] can synthesize high numbers of anthocyanins and are preferred by Open Access *Correspondence: [email protected] † Ruirui Ding and Xingkai Che contributed equally to this work. State Key Laboratory of Crop Biology, College of Life Sciences, Shandong Agricultural University, Taian 271018, China
Transcript of Metabolome and transcriptome profiling provide insights ...
Ding et al. BMC Plant Biol (2021) 21:351 https://doi.org/10.1186/s12870-021-03121-3
RESEARCH
Metabolome and transcriptome profiling provide insights into green apple peel reveals light- and UV-B-responsive pathway in anthocyanins accumulationRuirui Ding†, Xingkai Che†, Zhen Shen and Yuanhu Zhang*
Abstract
Background: In nature, green apple are associated with the accumulation of chlorophyll, while red apple varieties are associated with anthocyanins accumulation. Notably, in this study, the green skin color apple variety ‘white winter pearmain’ treated with ultraviolet-B (UV-B) exhibited red skins and marked anthocyanin accumulation, while visible light could not. But there are few reports on the biosynthesis difference of anthocyanins in green apple by visible light and UV-B-treatment. Here, we explored the difference of metabolites and genes expression level in green apple by transcriptomic and metabolic.
Results: The metabolic analysis revealed that there were 152 and 178 significantly changed metabolites in the vis-ible light and UV-B-treated green apple, respectively, compared to the control, and flavone, flavonol, and anthocya-nin were the most significantly increased; and transcriptomic analysis showed that 37,110 and 37,709 differentially expressed genes, including 382 and 475 transcription factors (TFs) were detected in light and UV-B-treatment fruit, respectively. Quantitative reverse transcription PCR (qRT-PCR) results confirmed changes in the expression levels of genes encoding metabolites involved in the flavonoid synthesis pathways. The flavonoid metabolic flux in the UV-B treatment increased the accumulation of cyanidin 3-glucoside and cyanidin 3, 5-diglucoside compared to under the light-treatment. Furthermore, we performed qRT-PCR analysis of anthocyanin biosynthesis genes and predicted the gene of MD00G1134400 (a UDP glucose-flavonoid 3–0-glucosyltransferase) may be a candidate gene for anthocyanins accumulation and highly expressed in UV-B-treatment fruit. Expression profiles of several transcription factors of the families MYB, bHLH, NAC were highly correlated with the content of the anthocyanin.
Conclusions: The composition and contents of anthocyanins in green apple in UV-B-treatment very greatly. A series of metabolites and candidate genes were revealed through combined analysis of metabolome and transcriptome. These results provide an important data for dissecting candidate genes and molecular basis governing green apple color formation in response to visible light and UV-B light.
Keywords: Apple, Flavonoids and anthocyanins accumulation, Visible light, UV-B, Metabolomic and transcriptome
© The Author(s) 2021. Open Access This article is licensed under a Creative Commons Attribution 4.0 International License, which permits use, sharing, adaptation, distribution and reproduction in any medium or format, as long as you give appropriate credit to the original author(s) and the source, provide a link to the Creative Commons licence, and indicate if changes were made. The images or other third party material in this article are included in the article’s Creative Commons licence, unless indicated otherwise in a credit line to the material. If material is not included in the article’s Creative Commons licence and your intended use is not permitted by statutory regulation or exceeds the permitted use, you will need to obtain permission directly from the copyright holder. To view a copy of this licence, visit http:// creat iveco mmons. org/ licen ses/ by/4. 0/. The Creative Commons Public Domain Dedication waiver (http:// creat iveco mmons. org/ publi cdoma in/ zero/1. 0/) applies to the data made available in this article, unless otherwise stated in a credit line to the data.
BackgroundIn recent years, red apple have attracted the attention of consumers due to their attractive appearance and their reported nutritional value [1, 2]. Red apple vari-eties such as ‘Fuji’ [3] and ‘Fortune’ [4] can synthesize high numbers of anthocyanins and are preferred by
Open Access
*Correspondence: [email protected]† Ruirui Ding and Xingkai Che contributed equally to this work.State Key Laboratory of Crop Biology, College of Life Sciences, Shandong Agricultural University, Taian 271018, China
Page 2 of 15Ding et al. BMC Plant Biol (2021) 21:351
more consumers. Conversely, green apple cannot syn-thesize anthocyanins during natural growth, so that they mainly exhibit green or yellow colors, for example, the ‘white winter pearmain’ [5, 6] and ‘mutsu’ [4] apple varieties.
Annually, during apple growing seasons, particularly in the later stages of growth, sunlight plays important role in the development of fruit color [7–9]. In China, paper bagging is a tool applied in apple or pear fruit production [10–12], can not only control insect and bird pests, but can also enhance red pigmentation in the red fruit varie-ties in the late stages of fruit growth [7]. In addition, the degree of red pigmentation in one fruit variety could vary significantly in one location across several years based on varying sunlight intensity and temperature in an envi-ronment. Early studies suggested that light and ultravi-olet-B (UV-B) radiation regulate anthocyanin synthesis by regulating the activity of key enzymes and the gene transcription levels in anthocyanin biosynthesis pathway in red skin color fruit [13–15]. Furthermore, lowing the temperature is more beneficial to anthocyanin synthesis compared to high temperature in fruit peel [15]. Some researchers have attempted to elucidate the mechanisms of fruit coloration using high-throughput techniques [7, 9, 13]. However, to date, the effect of visible light and UV-B on coloration of red skin color and green skin color apple fruit, and their molecular foundation is rarely studied.
The red coloration in red apple varieties is due to the synthesis of anthocyanin in exocarp [4, 15]. Antho-cyanins are synthesized through flavonoid biosynthesis pathways, and the biosynthesis of anthocyanins involves several key enzymes and the genes expressions of coding these enzymes, it mainly contains phenylalanine ammo-nia-lyase (PAL), chalcone synthase (CHS), chalcone isomerase (CHI), flavanone-3-hydroxylase (F3H), dihy-droflavonol 4-reductase (DFR), anthocyanidin synthase (ANS), and UDP-glucose: flavonoid 3-glucosyltrans-ferase (UFGT) [16]. Regulating the genes encoding these enzymes are regulated by a protein complex formed by an R2R3-MYB, a basic-helix-loop-helix, and a WD40 [17]. The complex induces gene expression by binding to the promoters of structural gene [18]. In numerous species, MYB transcription factors (TFs) are considered essential for the activation of anthocyanin biosynthesis related genes. In apple, MdMYB1 and MdMYB10 act as positive TFs for anthocyanin biosynthesis in fruit skin [19, 20], while MdbHLH3 plays a regulatory role during anthocyanins biosynthesis [21]. Although the research on apple fruit coloring mainly focuses on red varieties, but few people have studied green varieties, particularly, the response of green apple varieties to visible light and UV-B exposure. Therefore, it is critical to investigate the
potential mechanisms by which visible light and UV-B induce anthocyanin synthesis in green apple varieties.
In the present study, we reported the anthocyanin accumulation by metabolome and transcriptome analy-ses in ‘white winter pearmain’ apple fruit peel samples treated with artificial visible light (63 h), artificial UV-B radiation (63 h), and a control (CK, bagged fruit stored in the dark for 63 h) after harvesting. Based on an inte-grated analysis of the differential metabolites and gene expression levels, we identified the metabolites involved in visible light and UV-B-responsive reactions, and analyzed the differential regulation of structural genes involved in anthocyanins biosynthesis. The result of the present study could elucidate further the mechanisms by which visible light and UV-B regulate anthocyanin biosynthesis in apple. In addition, the metabolomic and transcriptomic data obtained would offer basic data that would facilitate further investigations on the influence of visible light- and UV-B-induced fruit coloration in green apple varieties.
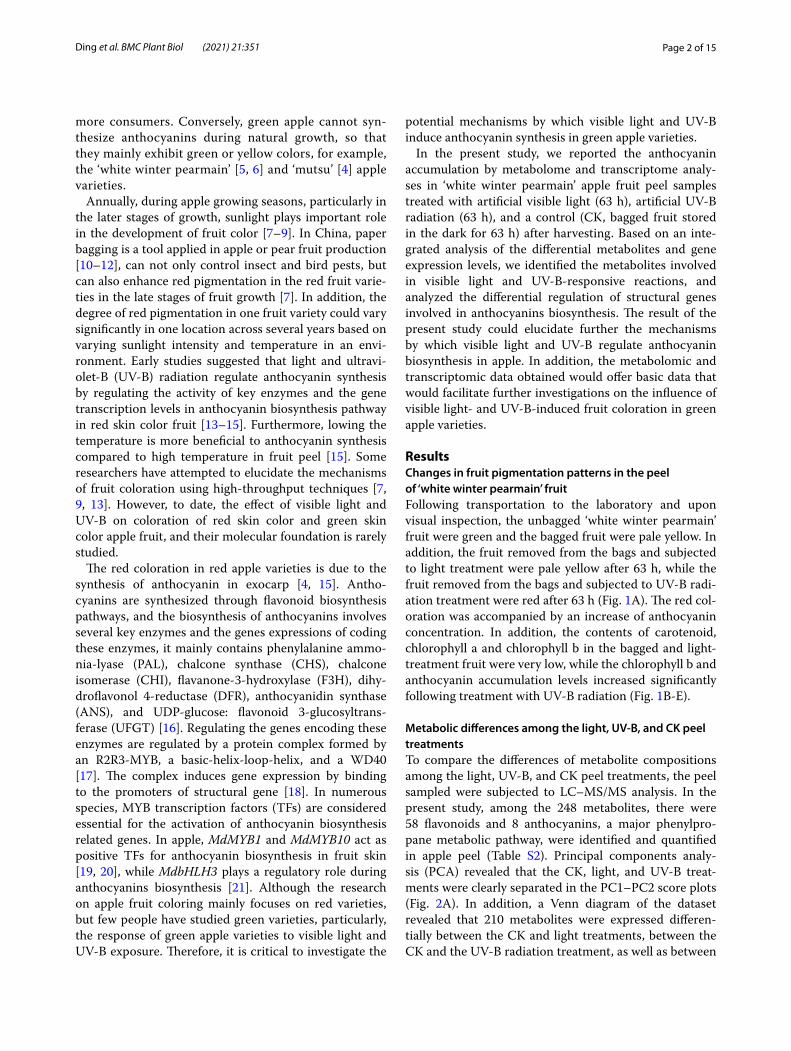
ResultsChanges in fruit pigmentation patterns in the peel of ‘white winter pearmain’ fruitFollowing transportation to the laboratory and upon visual inspection, the unbagged ‘white winter pearmain’ fruit were green and the bagged fruit were pale yellow. In addition, the fruit removed from the bags and subjected to light treatment were pale yellow after 63 h, while the fruit removed from the bags and subjected to UV-B radi-ation treatment were red after 63 h (Fig. 1A). The red col-oration was accompanied by an increase of anthocyanin concentration. In addition, the contents of carotenoid, chlorophyll a and chlorophyll b in the bagged and light-treatment fruit were very low, while the chlorophyll b and anthocyanin accumulation levels increased significantly following treatment with UV-B radiation (Fig. 1B-E).
Metabolic differences among the light, UV‑B, and CK peel treatmentsTo compare the differences of metabolite compositions among the light, UV-B, and CK peel treatments, the peel sampled were subjected to LC–MS/MS analysis. In the present study, among the 248 metabolites, there were 58 flavonoids and 8 anthocyanins, a major phenylpro-pane metabolic pathway, were identified and quantified in apple peel (Table S2). Principal components analy-sis (PCA) revealed that the CK, light, and UV-B treat-ments were clearly separated in the PC1–PC2 score plots (Fig. 2A). In addition, a Venn diagram of the dataset revealed that 210 metabolites were expressed differen-tially between the CK and light treatments, between the CK and the UV-B radiation treatment, as well as between
Page 3 of 15Ding et al. BMC Plant Biol (2021) 21:351
the light and the UV-B radiation treatment (Fig. 2B). Among the 248 metabolites identified in the apple peel, 152 and 178 (61.3 and 71.8%) changed substantially in the light and the UV-B treatments, respectively, compared to in the CK treatment. In addition, 127 and 133 metabo-lites were upregulated, and 25 and 45 metabolites were downregulated in the light and UV-B treatments, respec-tively, compared to the metabolites in the CK treatment (Fig. 2C-D). Moreover, 57 metabolites were upregulated and 94 metabolites were downregulated in the UV-B treatment compared with the light treatment (Fig. 2E).
Analysis of metabolic pathways and metabolites under the light‑ and UV‑B‑treatmentTo identify different metabolites in the peel of light, UV-B compared to those of CK, UV-B compared to
those of light, a metabolom comparison of the materi-als mentioned above was carried out. A KEGG path-way enrichment analysis revealed that the significantly changed metabolites were enriched mainly in ‘phe-nylpropanoid metabolic processes’ including flavo-noid biosynthesis, flavanone biosynthesis, flavone biosynthesis, flavonol biosynthesis, and anthocyanin biosynthesis (Fig. 3A-C). Fifty flavonoids and 8 antho-cyanins with significant changes in the metabolites of flavonoid and astaxanthin were screened out from the metabolome data for heat map analysis (Fig. 3D, Table S3). The results showed that the compounds of related to flavonoids and anthocyanins increased sig-nificantly under visible light and UV-B induction, such as cyanidin 3,5-O-diglucoside, cyanidin 3-O-galacto-side, delphinidin 3-O-rutinoside, quercetin and so on.
Fig. 1 Changes in pigmentation in fruit peel of ‘white winter pearmain’ in unbagged, bagged, bagged-light-, and bagged-UV-B-treated samples (63 h). A Color changes in ‘white winter pearmain’ during treatment. Changes in concentrations of chlorophyll a (B), chlorophyll b (C), carotenoids (D), and anthocyanins (E) during treatment. The graphs show average values from six independently sampled fruit as biological replicates. Error bars are the standard deviation. P < 0.05

Page 4 of 15Ding et al. BMC Plant Biol (2021) 21:351
Fig. 2 Significantly changed metabolites (SCMs) in visible light and UV-B radiation treated fruit compared to in the metabolites in CK. A Principal components analysis score-plot of metabolite profiles from the light, UV-B, and CK treatments. B Venn plot of metabolite profiles in the light, UV-B, and CK treatments. C-E Number of SCMs under the dark (CK), visible light and UV-B radiation treatments
Fig. 3 KEGG pathway enrichment of metabolites under the dark (CK), visible light and UV-B radiation treatments. A-C KEGG pathway enrichment of metabolites under the dark (CK), visible light and UV-B radiation treatments. D Heat map of 58 selected metabolites. The phenylpropanoid pathway metabolites were the most significantly changed metabolites. Black dot indicates flavonoid, flavone and flavonol, and anthocyanin biosynthesis metabolism
Page 5 of 15Ding et al. BMC Plant Biol (2021) 21:351
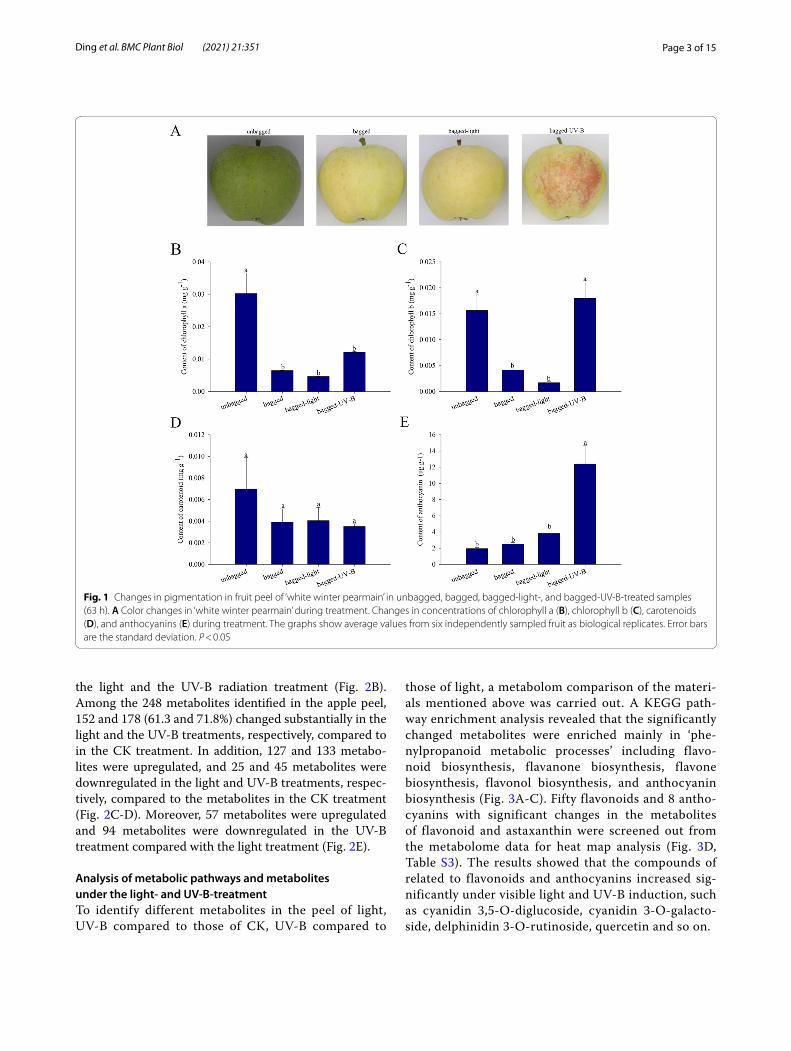
Differential expression of genes in the fruit peelTo identify the differentially expressed genes (DEGs) among the light, UV-B, and CK treatments, a transcrip-tomic comparison was performed. PCA score and Venn plots of gene expression among treatments revealed the effectiveness of data (Figure S1). Based on fold change ≥ 2 and FDR < 0.05 criteria, 37,110 and 37,709 DEGs were identified in the light and UV-B treatments compared with CK, respectively, and 3469 and 4212 genes, respec-tively, were significantly upregulated (Table S4a-b). In addition, 37,590 DEGs were identified in the UV-B compared with light, and 2762 genes were significantly upregulated (Table S4c). GO enrichment top 50 analysis of the 3355, 3428 and 2659 DEGs showed that the three major biological processes were biological process, cellu-lar component, and molecular function. In the molecu-lar function domain, the DEGs were enriched in catalytic activity and binding. In the cellular component domain, most of the DEGs were enriched in four categories, including apoplast, chloroplast, plastid, and thylakoid lumen (Fig. 4A-C). KEGG pathway enrichment analysis revealed that the DEGs were mainly enriched in various metabolic processes including flavonoid biosynthesis and secondary metabolism biosynthesis (Fig. 4D-F).
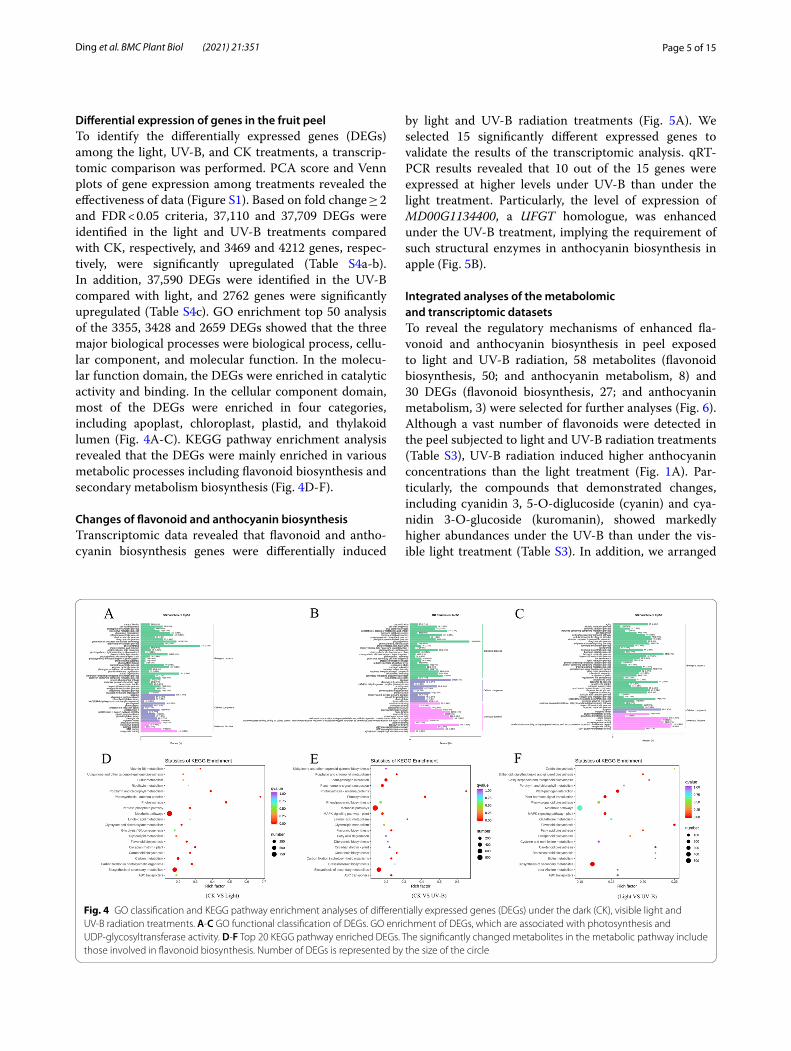
Changes of flavonoid and anthocyanin biosynthesisTranscriptomic data revealed that flavonoid and antho-cyanin biosynthesis genes were differentially induced
by light and UV-B radiation treatments (Fig. 5A). We selected 15 significantly different expressed genes to validate the results of the transcriptomic analysis. qRT-PCR results revealed that 10 out of the 15 genes were expressed at higher levels under UV-B than under the light treatment. Particularly, the level of expression of MD00G1134400, a UFGT homologue, was enhanced under the UV-B treatment, implying the requirement of such structural enzymes in anthocyanin biosynthesis in apple (Fig. 5B).
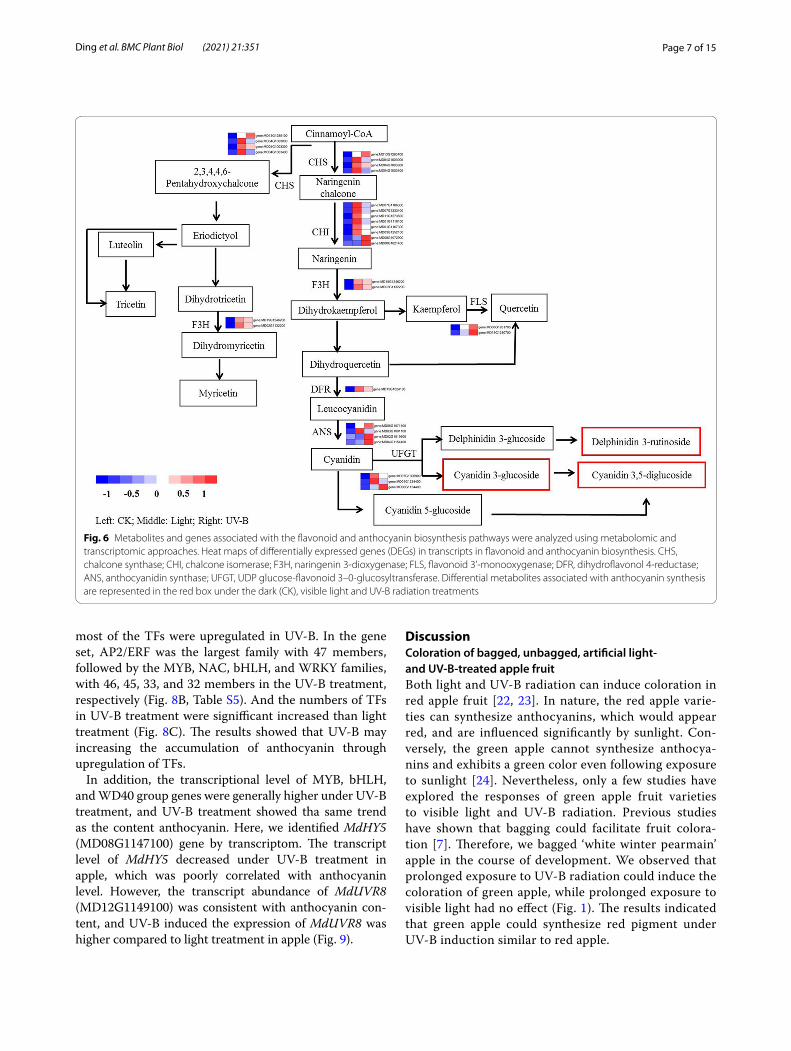
Integrated analyses of the metabolomic and transcriptomic datasetsTo reveal the regulatory mechanisms of enhanced fla-vonoid and anthocyanin biosynthesis in peel exposed to light and UV-B radiation, 58 metabolites (flavonoid biosynthesis, 50; and anthocyanin metabolism, 8) and 30 DEGs (flavonoid biosynthesis, 27; and anthocyanin metabolism, 3) were selected for further analyses (Fig. 6). Although a vast number of flavonoids were detected in the peel subjected to light and UV-B radiation treatments (Table S3), UV-B radiation induced higher anthocyanin concentrations than the light treatment (Fig. 1A). Par-ticularly, the compounds that demonstrated changes, including cyanidin 3, 5-O-diglucoside (cyanin) and cya-nidin 3-O-glucoside (kuromanin), showed markedly higher abundances under the UV-B than under the vis-ible light treatment (Table S3). In addition, we arranged
Fig. 4 GO classification and KEGG pathway enrichment analyses of differentially expressed genes (DEGs) under the dark (CK), visible light and UV-B radiation treatments. A-C GO functional classification of DEGs. GO enrichment of DEGs, which are associated with photosynthesis and UDP-glycosyltransferase activity. D-F Top 20 KEGG pathway enriched DEGs. The significantly changed metabolites in the metabolic pathway include those involved in flavonoid biosynthesis. Number of DEGs is represented by the size of the circle
Page 6 of 15Ding et al. BMC Plant Biol (2021) 21:351
30 DEGs based on their corresponding positions in the apple flavonoid biosynthesis pathway (Fig. 6). Among them, some MdCHS, MdCHI, MdF3H, MdFLS, MdDFR, MdANS, and MdUFGT homologues exhibited different expression levels.
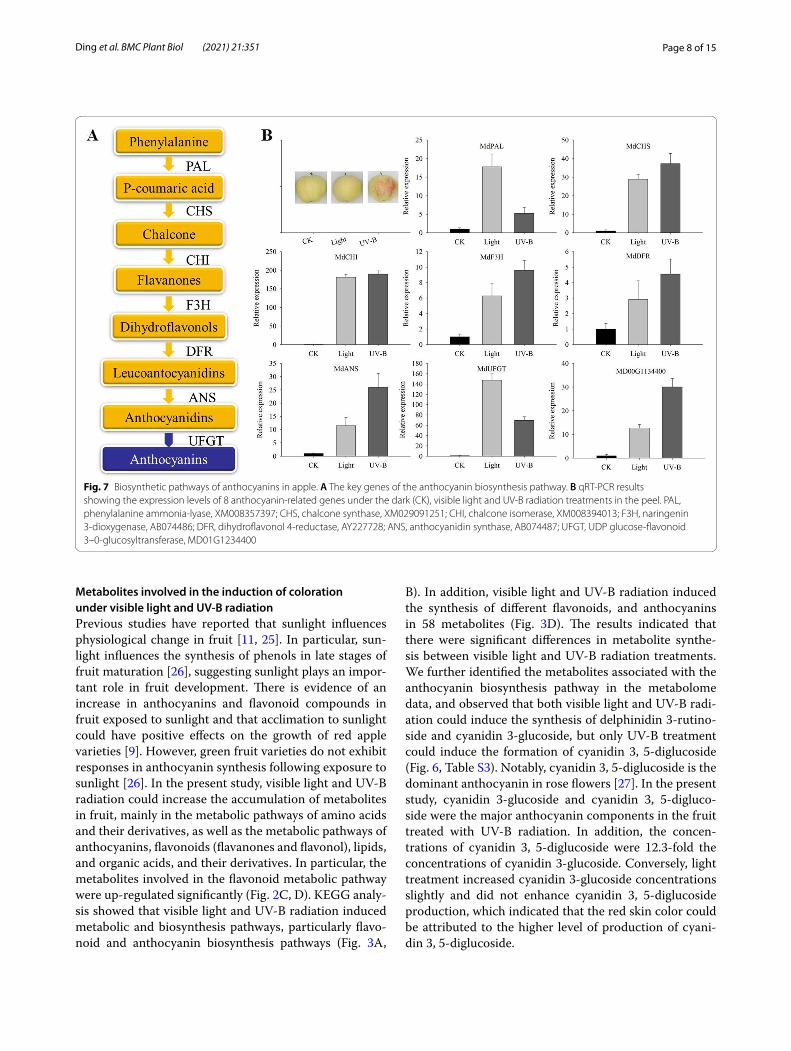
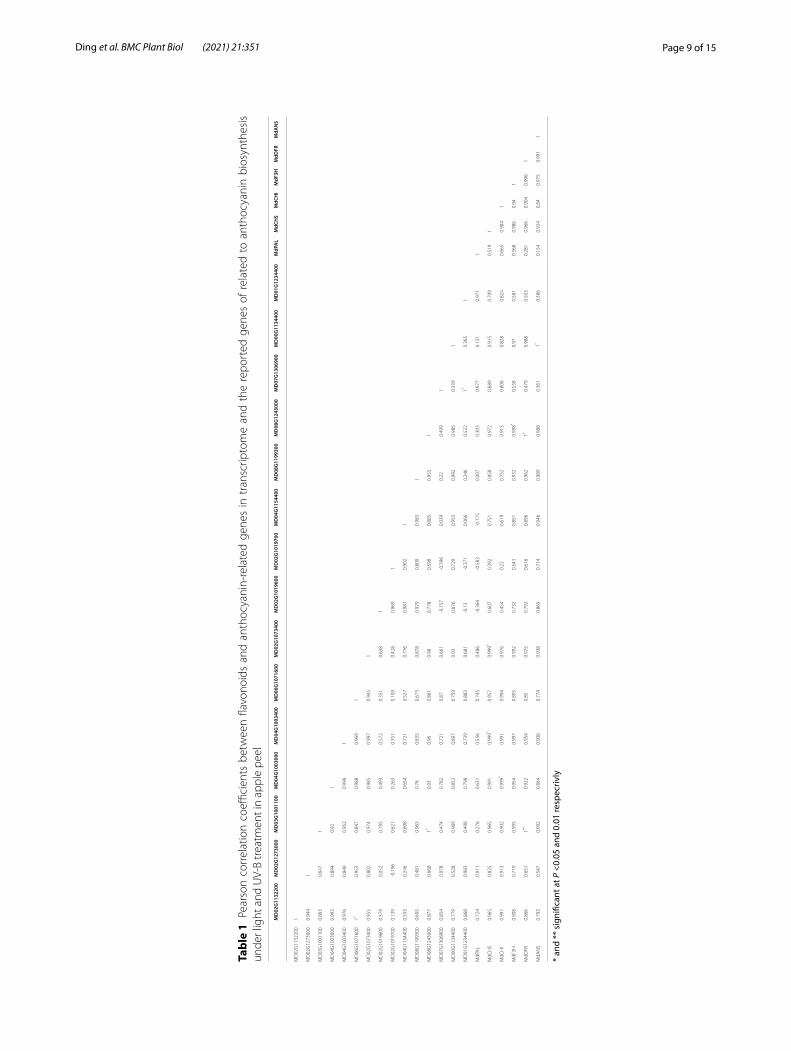
Differential expression of anthocyanin biosynthetic genes in fruit peelAnthocyanin in the skins investigated was biosynthesized via the flavonoid pathway (Fig. 7A). To determine the roles of anthocyanin biosynthetic genes under the light and UV-B conditions, the expression patterns of genes involved in their biosynthesis were analyzed. Significant expression changes were observed in both the light and UV-B responsive genes. Pearson’s correlation analysis showed that the genes expression levels in transcriptome verification experimrnt was significantly correlated with the reported transcription levels of anthocyanin biosyn-thesis related genes (P < 0.05, and P < 0.01) by light and UV-B treatment in apple peel (Table 1). We further per-formed qRT-PCR analysis on the reported related genes and candidate genes. The results showed that most of the
genes, such as MdCHS, MdF3H, MdDFR, MdANS, and Md00G1134400 were more responsive to UV-B induc-tion (Fig. 7B). The results suggested that the contribution of UV-B induced anthocyanin synthesis may be greater than that of visible light in green apple.
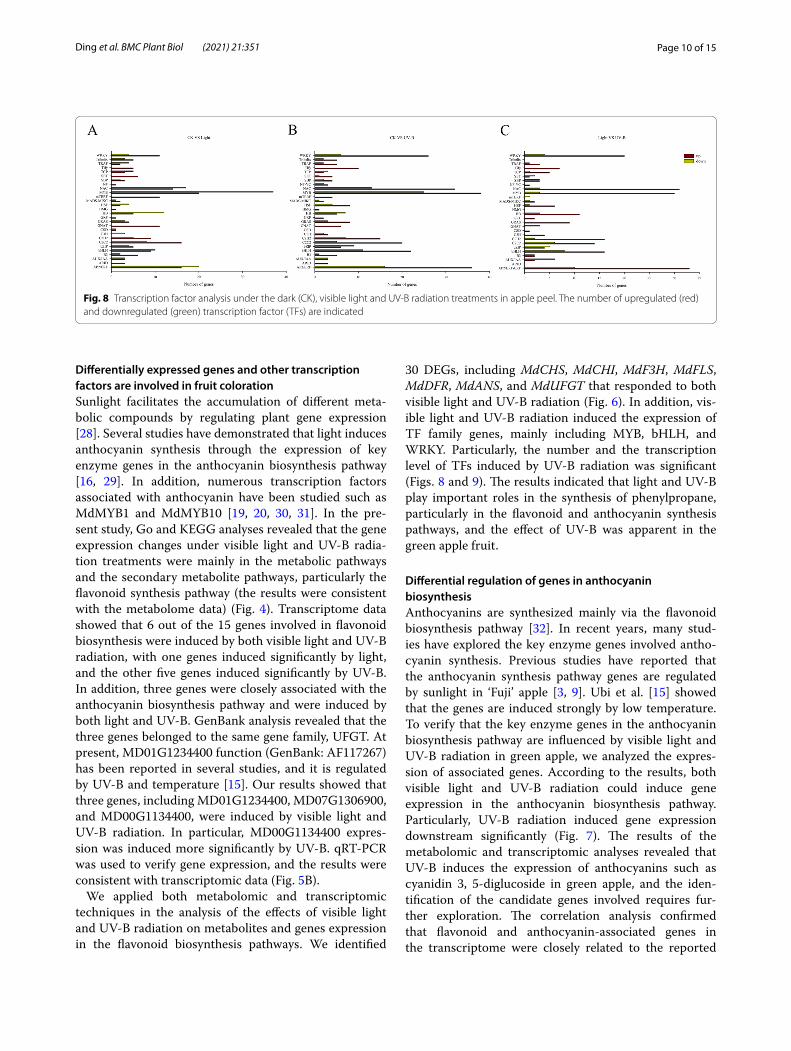
Transcription factors (TF) and light signal transduction related genes of light‑, UV‑B‑responsiveThree hundred eighty-two differentially expressed tran-scription factors belonging to 52 TF families, and 475 differentially expressed transcription factors belonging to 59 TF families were identified in the light-treatment and the UV-B treatment compared with CK, respectively, and 346 differentially expressed transcription factors belonging to 48 TF families were identified in the UV-B treatment compared with light-treatment (Table S5). In addition, we observed the up-regulation and down-regulation of 28 TF families that were both regulated by light and UV-B radiation treatments, including WRKY, NAC, MYB, bHLH, and AP2/ERF families (Fig. 8). Although rather similar numbers of TFs were observed between the light and the UV-B radiation treatments,
Fig. 5 Expression levels of differentially expressed genes (DEGs) in the flavonoid and anthocyanin pathways under the visible light and UV-B radiation treatments compared to the expression levels in the CK treatment. A Comparison of flavonoid and anthocyanin associated mRNA expression levels detected by RNA-seq. B qRT-PCR analysis results showing the expression levels of 15 flavonoid and anthocyanin-associated DEGs under the dark (CK), visible light and UV-B radiation treatments
Page 7 of 15Ding et al. BMC Plant Biol (2021) 21:351
most of the TFs were upregulated in UV-B. In the gene set, AP2/ERF was the largest family with 47 members, followed by the MYB, NAC, bHLH, and WRKY families, with 46, 45, 33, and 32 members in the UV-B treatment, respectively (Fig. 8B, Table S5). And the numbers of TFs in UV-B treatment were signifficant increased than light treatment (Fig. 8C). The results showed that UV-B may increasing the accumulation of anthocyanin through upregulation of TFs.
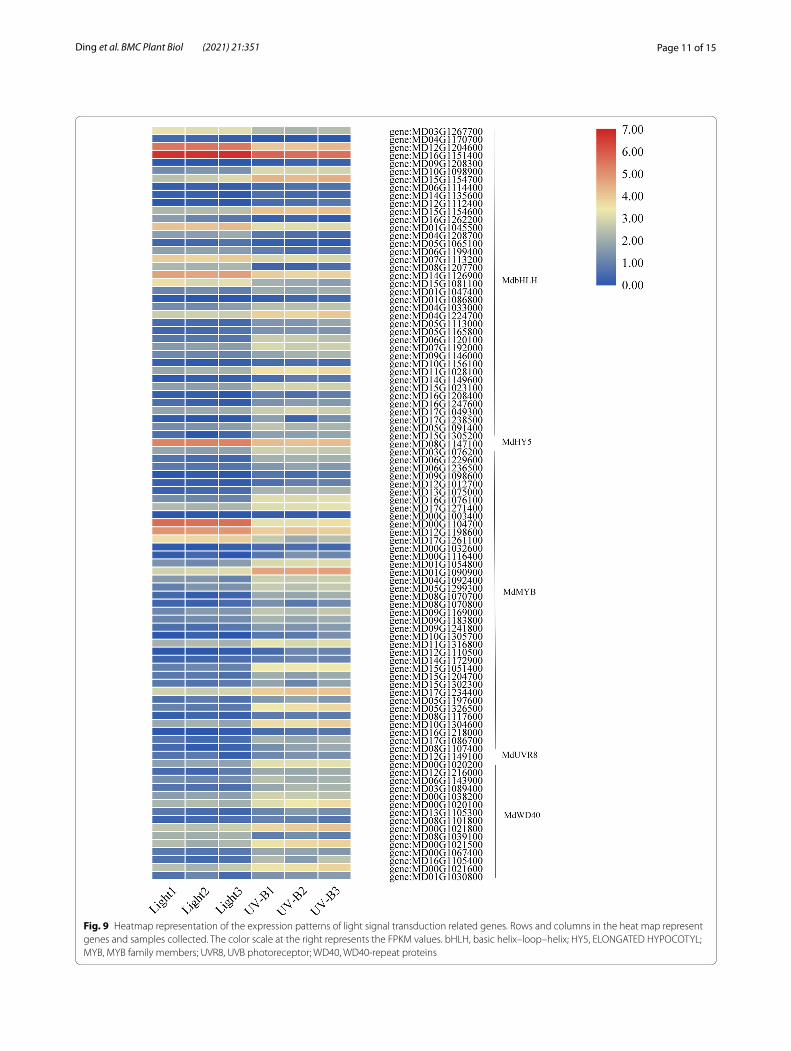
In addition, the transcriptional level of MYB, bHLH, and WD40 group genes were generally higher under UV-B treatment, and UV-B treatment showed tha same trend as the content anthocyanin. Here, we identified MdHY5 (MD08G1147100) gene by transcriptom. The transcript level of MdHY5 decreased under UV-B treatment in apple, which was poorly correlated with anthocyanin level. However, the transcript abundance of MdUVR8 (MD12G1149100) was consistent with anthocyanin con-tent, and UV-B induced the expression of MdUVR8 was higher compared to light treatment in apple (Fig. 9).
DiscussionColoration of bagged, unbagged, artificial light‑ and UV‑B‑treated apple fruitBoth light and UV-B radiation can induce coloration in red apple fruit [22, 23]. In nature, the red apple varie-ties can synthesize anthocyanins, which would appear red, and are influenced significantly by sunlight. Con-versely, the green apple cannot synthesize anthocya-nins and exhibits a green color even following exposure to sunlight [24]. Nevertheless, only a few studies have explored the responses of green apple fruit varieties to visible light and UV-B radiation. Previous studies have shown that bagging could facilitate fruit colora-tion [7]. Therefore, we bagged ‘white winter pearmain’ apple in the course of development. We observed that prolonged exposure to UV-B radiation could induce the coloration of green apple, while prolonged exposure to visible light had no effect (Fig. 1). The results indicated that green apple could synthesize red pigment under UV-B induction similar to red apple.
Fig. 6 Metabolites and genes associated with the flavonoid and anthocyanin biosynthesis pathways were analyzed using metabolomic and transcriptomic approaches. Heat maps of differentially expressed genes (DEGs) in transcripts in flavonoid and anthocyanin biosynthesis. CHS, chalcone synthase; CHI, chalcone isomerase; F3H, naringenin 3-dioxygenase; FLS, flavonoid 3’-monooxygenase; DFR, dihydroflavonol 4-reductase; ANS, anthocyanidin synthase; UFGT, UDP glucose-flavonoid 3–0-glucosyltransferase. Differential metabolites associated with anthocyanin synthesis are represented in the red box under the dark (CK), visible light and UV-B radiation treatments
Page 8 of 15Ding et al. BMC Plant Biol (2021) 21:351
Metabolites involved in the induction of coloration under visible light and UV‑B radiationPrevious studies have reported that sunlight influences physiological change in fruit [11, 25]. In particular, sun-light influences the synthesis of phenols in late stages of fruit maturation [26], suggesting sunlight plays an impor-tant role in fruit development. There is evidence of an increase in anthocyanins and flavonoid compounds in fruit exposed to sunlight and that acclimation to sunlight could have positive effects on the growth of red apple varieties [9]. However, green fruit varieties do not exhibit responses in anthocyanin synthesis following exposure to sunlight [26]. In the present study, visible light and UV-B radiation could increase the accumulation of metabolites in fruit, mainly in the metabolic pathways of amino acids and their derivatives, as well as the metabolic pathways of anthocyanins, flavonoids (flavanones and flavonol), lipids, and organic acids, and their derivatives. In particular, the metabolites involved in the flavonoid metabolic pathway were up-regulated significantly (Fig. 2C, D). KEGG analy-sis showed that visible light and UV-B radiation induced metabolic and biosynthesis pathways, particularly flavo-noid and anthocyanin biosynthesis pathways (Fig. 3A,
B). In addition, visible light and UV-B radiation induced the synthesis of different flavonoids, and anthocyanins in 58 metabolites (Fig. 3D). The results indicated that there were significant differences in metabolite synthe-sis between visible light and UV-B radiation treatments. We further identified the metabolites associated with the anthocyanin biosynthesis pathway in the metabolome data, and observed that both visible light and UV-B radi-ation could induce the synthesis of delphinidin 3-rutino-side and cyanidin 3-glucoside, but only UV-B treatment could induce the formation of cyanidin 3, 5-diglucoside (Fig. 6, Table S3). Notably, cyanidin 3, 5-diglucoside is the dominant anthocyanin in rose flowers [27]. In the present study, cyanidin 3-glucoside and cyanidin 3, 5-digluco-side were the major anthocyanin components in the fruit treated with UV-B radiation. In addition, the concen-trations of cyanidin 3, 5-diglucoside were 12.3-fold the concentrations of cyanidin 3-glucoside. Conversely, light treatment increased cyanidin 3-glucoside concentrations slightly and did not enhance cyanidin 3, 5-diglucoside production, which indicated that the red skin color could be attributed to the higher level of production of cyani-din 3, 5-diglucoside.
Fig. 7 Biosynthetic pathways of anthocyanins in apple. A The key genes of the anthocyanin biosynthesis pathway. B qRT-PCR results showing the expression levels of 8 anthocyanin-related genes under the dark (CK), visible light and UV-B radiation treatments in the peel. PAL, phenylalanine ammonia-lyase, XM008357397; CHS, chalcone synthase, XM029091251; CHI, chalcone isomerase, XM008394013; F3H, naringenin 3-dioxygenase, AB074486; DFR, dihydroflavonol 4-reductase, AY227728; ANS, anthocyanidin synthase, AB074487; UFGT, UDP glucose-flavonoid 3–0-glucosyltransferase, MD01G1234400
Page 9 of 15Ding et al. BMC Plant Biol (2021) 21:351
Tabl
e 1
Pear
son
corr
elat
ion
coeffi
cien
ts b
etw
een
flavo
noid
s an
d an
thoc
yani
n-re
late
d ge
nes
in t
rans
crip
tom
e an
d th
e re
port
ed g
enes
of
rela
ted
to a
ntho
cyan
in b
iosy
nthe
sis
unde
r lig
ht a
nd U
V-B
trea
tmen
t in
appl
e pe
el
* an
d **
sig
nific
ant a
t P <
0.05
and
0.0
1 re
spec
rivly
MD
02G
1132
200
MD
02G
1273
000
MD
03G
1001
100
MD
04G
1003
000
MD
04G
1003
400
MD
06G
1071
600
MD
02G
1073
400
MD
02G
1019
600
MD
02G
1019
700
MD
04G
1154
400
MD
08G
1199
300
MD
08G
1243
000
MD
07G
1306
900
MD
00G
1134
400
MD
01G
1234
400
MdP
AL
MdC
HS
MdC
HI
MdF
3HM
dDFR
MdA
NS
MD
02G
1132
200
1
MD
02G
1273
000
0.94
41
MD
03G
1001
100
0.86
30.
647
1
MD
04G
1003
000
0.99
20.
894
0.92
1
MD
04G
1003
400
0.97
60.
849
0.95
20.
996
1
MD
06G
1071
600
1*0.
953
0.84
70.
988
0.96
91
MD
02G
1073
400
0.95
50.
802
0.97
40.
985
0.99
70.
945
1
MD
02G
1019
600
0.37
90.
052
0.79
50.
493
0.57
20.
351
0.63
81
MD
02G
1019
700
0.13
9-0
.196
0.62
10.
263
0.35
10.
109
0.42
80.
969
1
MD
04G
1154
400
0.55
30.
246
0.89
80.
654
0.72
10.
527
0.77
60.
981
0.90
21
MD
08G
1199
300
0.69
50.
481
0.96
30.
780.
835
0.67
30.
878
0.92
90.
809
0.98
31
MD
08G
1243
000
0.87
70.
668
1*0.
930.
960.
861
0.98
0.77
80.
598
0.88
50.
955
1
MD
07G
1306
900
0.85
40.
978
0.47
40.
782
0.72
10.
870.
661
-0.1
57-0
.396
0.03
90.
220.
499
1
MD
00G
1134
400
0.77
90.
528
0.98
90.
852
0.89
70.
759
0.93
0.87
60.
729
0.95
30.
992
0.98
50.
339
1
MD
01G
1234
400
0.86
80.
983
0.49
80.
798
0.73
90.
883
0.68
1-0
.13
-0.3
710.
066
0.24
60.
522
1*0.
365
1
MdP
AL
0.72
40.
911
0.27
60.
631
0.55
60.
745
0.48
6-0
.364
-0.5
83-0
.175
0.00
70.
303
0.97
70.
131
0.97
11
MdC
HS
0.96
50.
825
0.96
50.
991
0.99
9*0.
957
0.99
9*0.
607
0.39
20.
751
0.85
80.
972
0.68
90.
915
0.70
90.
519
1
MdC
HI
0.99
70.
913
0.90
20.
999*
0.99
10.
994
0.97
60.
454
0.22
0.61
90.
752
0.91
30.
808
0.82
80.
824
0.66
50.
984
1
MdF
3H0.
908
0.71
90.
995
0.95
40.
997
0.89
50.
992
0.73
20.
541
0.85
10.
932
0.99
8*0.
558
0.97
0.58
10.
368
0.98
60.
941
MdD
FR0.
866
0.65
11**
0.92
20.
954
0.85
0.97
50.
792
0.61
60.
896
0.96
21*
0.47
90.
988
0.50
30.
281
0.96
60.
904
0.99
61
MdA
NS
0.79
30.
547
0.99
20.
864
0.90
60.
774
0.93
80.
865
0.71
40.
946
0.98
90.
988
0.36
11*
0.38
60.
154
0.92
40.
840.
975
0.99
11
Page 10 of 15Ding et al. BMC Plant Biol (2021) 21:351
Differentially expressed genes and other transcription factors are involved in fruit colorationSunlight facilitates the accumulation of different meta-bolic compounds by regulating plant gene expression [28]. Several studies have demonstrated that light induces anthocyanin synthesis through the expression of key enzyme genes in the anthocyanin biosynthesis pathway [16, 29]. In addition, numerous transcription factors associated with anthocyanin have been studied such as MdMYB1 and MdMYB10 [19, 20, 30, 31]. In the pre-sent study, Go and KEGG analyses revealed that the gene expression changes under visible light and UV-B radia-tion treatments were mainly in the metabolic pathways and the secondary metabolite pathways, particularly the flavonoid synthesis pathway (the results were consistent with the metabolome data) (Fig. 4). Transcriptome data showed that 6 out of the 15 genes involved in flavonoid biosynthesis were induced by both visible light and UV-B radiation, with one genes induced significantly by light, and the other five genes induced significantly by UV-B. In addition, three genes were closely associated with the anthocyanin biosynthesis pathway and were induced by both light and UV-B. GenBank analysis revealed that the three genes belonged to the same gene family, UFGT. At present, MD01G1234400 function (GenBank: AF117267) has been reported in several studies, and it is regulated by UV-B and temperature [15]. Our results showed that three genes, including MD01G1234400, MD07G1306900, and MD00G1134400, were induced by visible light and UV-B radiation. In particular, MD00G1134400 expres-sion was induced more significantly by UV-B. qRT-PCR was used to verify gene expression, and the results were consistent with transcriptomic data (Fig. 5B).
We applied both metabolomic and transcriptomic techniques in the analysis of the effects of visible light and UV-B radiation on metabolites and genes expression in the flavonoid biosynthesis pathways. We identified
30 DEGs, including MdCHS, MdCHI, MdF3H, MdFLS, MdDFR, MdANS, and MdUFGT that responded to both visible light and UV-B radiation (Fig. 6). In addition, vis-ible light and UV-B radiation induced the expression of TF family genes, mainly including MYB, bHLH, and WRKY. Particularly, the number and the transcription level of TFs induced by UV-B radiation was significant (Figs. 8 and 9). The results indicated that light and UV-B play important roles in the synthesis of phenylpropane, particularly in the flavonoid and anthocyanin synthesis pathways, and the effect of UV-B was apparent in the green apple fruit.
Differential regulation of genes in anthocyanin biosynthesisAnthocyanins are synthesized mainly via the flavonoid biosynthesis pathway [32]. In recent years, many stud-ies have explored the key enzyme genes involved antho-cyanin synthesis. Previous studies have reported that the anthocyanin synthesis pathway genes are regulated by sunlight in ‘Fuji’ apple [3, 9]. Ubi et al. [15] showed that the genes are induced strongly by low temperature. To verify that the key enzyme genes in the anthocyanin biosynthesis pathway are influenced by visible light and UV-B radiation in green apple, we analyzed the expres-sion of associated genes. According to the results, both visible light and UV-B radiation could induce gene expression in the anthocyanin biosynthesis pathway. Particularly, UV-B radiation induced gene expression downstream significantly (Fig. 7). The results of the metabolomic and transcriptomic analyses revealed that UV-B induces the expression of anthocyanins such as cyanidin 3, 5-diglucoside in green apple, and the iden-tification of the candidate genes involved requires fur-ther exploration. The correlation analysis confirmed that flavonoid and anthocyanin-associated genes in the transcriptome were closely related to the reported
Fig. 8 Transcription factor analysis under the dark (CK), visible light and UV-B radiation treatments in apple peel. The number of upregulated (red) and downregulated (green) transcription factor (TFs) are indicated
Page 11 of 15Ding et al. BMC Plant Biol (2021) 21:351
Fig. 9 Heatmap representation of the expression patterns of light signal transduction related genes. Rows and columns in the heat map represent genes and samples collected. The color scale at the right represents the FPKM values. bHLH, basic helix–loop–helix; HY5, ELONGATED HYPOCOTYL; MYB, MYB family members; UVR8, UVB photoreceptor; WD40, WD40-repeat proteins
Page 12 of 15Ding et al. BMC Plant Biol (2021) 21:351
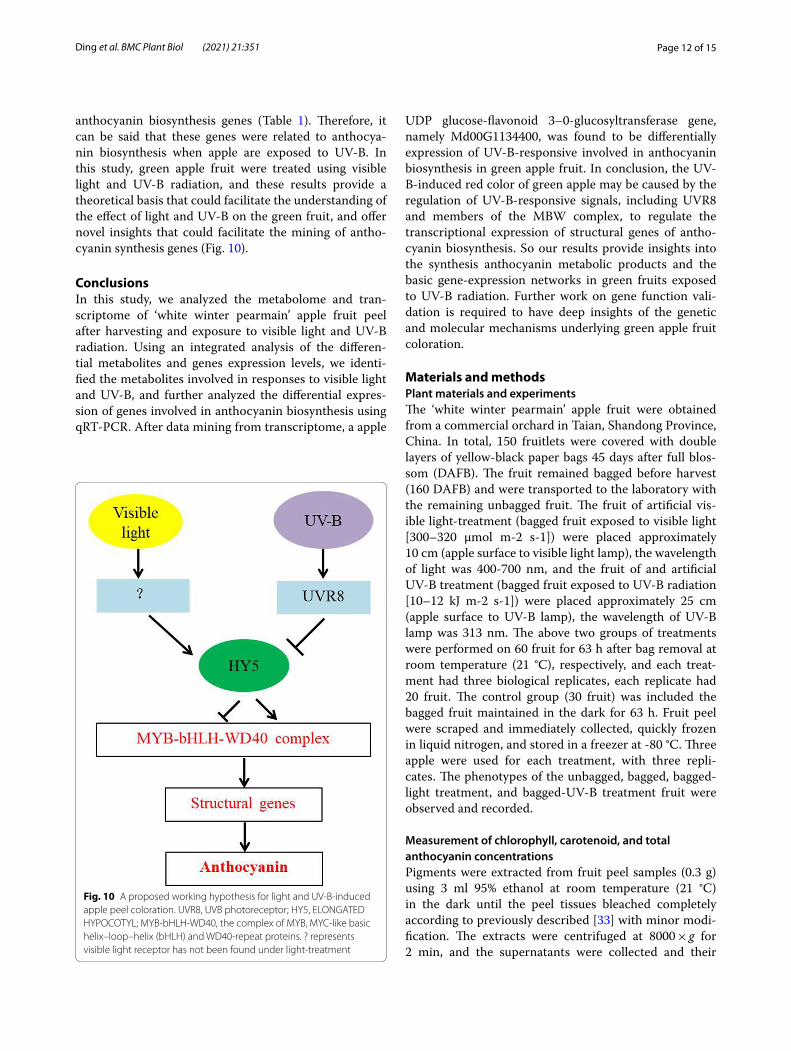
anthocyanin biosynthesis genes (Table 1). Therefore, it can be said that these genes were related to anthocya-nin biosynthesis when apple are exposed to UV-B. In this study, green apple fruit were treated using visible light and UV-B radiation, and these results provide a theoretical basis that could facilitate the understanding of the effect of light and UV-B on the green fruit, and offer novel insights that could facilitate the mining of antho-cyanin synthesis genes (Fig. 10).
ConclusionsIn this study, we analyzed the metabolome and tran-scriptome of ‘white winter pearmain’ apple fruit peel after harvesting and exposure to visible light and UV-B radiation. Using an integrated analysis of the differen-tial metabolites and genes expression levels, we identi-fied the metabolites involved in responses to visible light and UV-B, and further analyzed the differential expres-sion of genes involved in anthocyanin biosynthesis using qRT-PCR. After data mining from transcriptome, a apple
UDP glucose-flavonoid 3–0-glucosyltransferase gene, namely Md00G1134400, was found to be differentially expression of UV-B-responsive involved in anthocyanin biosynthesis in green apple fruit. In conclusion, the UV-B-induced red color of green apple may be caused by the regulation of UV-B-responsive signals, including UVR8 and members of the MBW complex, to regulate the transcriptional expression of structural genes of antho-cyanin biosynthesis. So our results provide insights into the synthesis anthocyanin metabolic products and the basic gene-expression networks in green fruits exposed to UV-B radiation. Further work on gene function vali-dation is required to have deep insights of the genetic and molecular mechanisms underlying green apple fruit coloration.
Materials and methodsPlant materials and experimentsThe ‘white winter pearmain’ apple fruit were obtained from a commercial orchard in Taian, Shandong Province, China. In total, 150 fruitlets were covered with double layers of yellow-black paper bags 45 days after full blos-som (DAFB). The fruit remained bagged before harvest (160 DAFB) and were transported to the laboratory with the remaining unbagged fruit. The fruit of artificial vis-ible light-treatment (bagged fruit exposed to visible light [300–320 μmol m-2 s-1]) were placed approximately 10 cm (apple surface to visible light lamp), the wavelength of light was 400-700 nm, and the fruit of and artificial UV-B treatment (bagged fruit exposed to UV-B radiation [10–12 kJ m-2 s-1]) were placed approximately 25 cm (apple surface to UV-B lamp), the wavelength of UV-B lamp was 313 nm. The above two groups of treatments were performed on 60 fruit for 63 h after bag removal at room temperature (21 °C), respectively, and each treat-ment had three biological replicates, each replicate had 20 fruit. The control group (30 fruit) was included the bagged fruit maintained in the dark for 63 h. Fruit peel were scraped and immediately collected, quickly frozen in liquid nitrogen, and stored in a freezer at -80 °C. Three apple were used for each treatment, with three repli-cates. The phenotypes of the unbagged, bagged, bagged-light treatment, and bagged-UV-B treatment fruit were observed and recorded.
Measurement of chlorophyll, carotenoid, and total anthocyanin concentrationsPigments were extracted from fruit peel samples (0.3 g) using 3 ml 95% ethanol at room temperature (21 °C) in the dark until the peel tissues bleached completely according to previously described [33] with minor modi-fication. The extracts were centrifuged at 8000 × g for 2 min, and the supernatants were collected and their
Fig. 10 A proposed working hypothesis for light and UV-B-induced apple peel coloration. UVR8, UVB photoreceptor; HY5, ELONGATED HYPOCOTYL; MYB-bHLH-WD40, the complex of MYB, MYC-like basic helix–loop–helix (bHLH) and WD40-repeat proteins. ? represents visible light receptor has not been found under light-treatment
Page 13 of 15Ding et al. BMC Plant Biol (2021) 21:351
absorbance was measured using a UV-1780 spectro-photometer (Shimadzu, Japan) at 665 nm, 649 nm, and 470 nm. The formulae for calculating chlorophyll concen-trations were as following: chlorophyll a = 13.95*A665 – 6.88*A649; and chlorophyll b = 24.96*A649 – 7.32*A665. The formulae for calculating carotenoid concentrations were as following: carotenoids = (1000*A470 – 2.05*Ca – 114.8*Cb)/245 and the results were expressed as mg g−1.
Anthocyanin was extracted using 0.3 g of the frozen peel tissues in 3 ml 95% methanol:1.5 M hydrochlo-ric acid (85:15) for 24 h at 4 °C in the dark according to previously described [34] with minor modifications. The extract was centrifuged at 12,000 × g for 5 min, and the supernatant was collected and analyzed using a UV-1780 spectrophotometer at 530, 620, and 650 nm. The antho-cyanin concentrations were calculated using the follow-ing formula: 46,200*[(A530 -A620)-0.1*(A650-A620)] and the results were expressed as ug g−1.
RNA‑Seq analysis, cDNA synthesis, and data analysisTotal RNA was extracted from fruit peel of the CK, and the Light and UV-B treatment samples, and cDNA syn-thesis was performed using the RNA library prep kit (Tiangen, Beijing, China). At least three biological repeats were collected and mixed. The RNA-seq and data analy-sis were performed by Metware Biotechnology Co., Ltd. (Wuhan, China) as previously described [35–43] based on available genetic databases, including NCBI non-redundant protein database, the SwissProt database, the TrEMBL database, the Pfam database, the KOG database, the KEGG database, and the GO database, based on log2 fold changes > 1, and a false discovery rates (FDR) < 0.05. The experiments were repeated three times.
Multiple reaction monitoring (MRM)Multiple reaction monitoring (MRM) was performed by Metware Biotechnology Co., Ltd. (Wuhan, China). The freeze-dried apple peel were crushed using an MM 400 mixer mill (Retsch, Haan, Germany) for 1.5 min at 30 Hz. The powder (100 mg) was weighed and extracted overnight at 4 °C. After centrifugation at 10,000 × g for 10 min, the extracts were absorbed and filtered. The sam-ple extracts were analyzed using a liquid chromatography coupled with tandem mass spectrometry (LC–MS/MS) system (HPLC, High Performance Liquid Chromatog-raphy, Shim-pack UFLC SHIMADZU CBM30A system, https:// www. shima dzu. com. cn/; MS/MS, Tandem mass spectrometry, Applied Biosystems 6500 QTRAP, http:// www. appli edbio syste ms. com. cn/). The analytical condi-tions were as follows: HPLC: column, Waters ACQUITY UPLC HSS T3 C18 (1.8 μm, 2.1 mm × 100 mm); solvent system, water (0.04% acetic acid): acetonitrile (0.04%
acetic acid); gradient program, 95:5 V/V at 0 min, 5:95 V/V at 11.0 min, 5:95 V/V at 12.0 min, 95:5 V/V at 12.1 min, 95:5 V/V at 15.0 min; flow rate, 0.4 mL/min; temperature, 40 °C; injection volume: 2 μl. The mass spectrum conditions mainly included an electrospray ionization (ESI) temperature of 500 °C, a mass spectrum voltage of 5500 V, and curtain gas pressure of 25 psi, with the collision-activated dissociation parameter set as high. In the triple quadrupole mass spectrometer, each ion pair was scanned according to the optimized declustering potential and collision energy [44]. A specific set of MRM transitions was monitored for each period according to the metabolites eluted within the period. The MRM was performed in triplicate for each treatment. The experi-ments were repeated three times.
RNA extraction, DNA sequencing, and real‑time quantitative reverse transcription (qRT‑PCR) analysisSamples stored in the freezer at -80 °C were used for total RNA extraction using a total RNA isolation system (Tiangen, Beijing, China). First-strand cDNAs were syn-thesized using a First-strand cDNA Synthesis Kit (Tian-gen, Beijing, China). The full-length coding sequences of genes were isolated from ‘white winter pearmain’ cDNA. Real-time quantitative reverse transcription (qRT-PCR) analysis was performed according to MIQE guidelines [45, 46]. qRT-PCR was performed on a Bio-Rad CFX96TM Real-time PCR System using SYBR Real Master Mix (Transgen, Beijing, China) under the follow-ing PCR thermal cycling conditions: predenaturation at 95 °C for 30 s; followed by 39 cycles of 95 °C for 5 s, 60 °C for 15 s, and 72 °C for 20 s. MdActin (GenBank Acces-sion Number: AB638619) was used as the housekeep-ing gene. The sequences of the primers used are listed in Supplementary Table S1. Three biological replicates were performed for each gene, and the standard curve method was applied in statistical analysis.
Statistical analysisLeast significant differences (p < 0.05) were calculated for mean separation using Data Processing System pro-cedures (Zhejiang University, Zhejiang, China). Standard errors were calculated and figures illustrated using Sigma Plot v12.0 (Systat Software Inc., San Jose, CA, USA). The data pearson correlation coefficients was analyzed using SPSS 16.0 software. For RNA-seq, differential expression analysis between two samples was performed using the DESeq2 package. After the differential expression analy-sis, the multiple hypothesis test correction of the P-value was performed using the Benjamini–Hochberg proce-dure based on a log2 fold change > 1 and an FDR < 0.05. The procedures were repeated three times.
Page 14 of 15Ding et al. BMC Plant Biol (2021) 21:351
AbbreviationsUV-B: Ultraviolet-B; TFs: Transcription factors; qRT-PCR: Quantitative reverse transcription PCR; PAL: Phenylalanine ammonia-lyase; CHS: Chalcone synthase; CHI: Chalcone isomerase; F3H: Naringenin 3-dioxygenase; DFR: Dihydrofla-vonol 4-reductase; ANS: Anthocyanidin synthase; UFGT: UDP glucose-flavo-noid 3–0-glucosyltransferase; DAFB: Days after full blossom; MRM: Multiple reaction monitoring; ESI: Electrospray ionization; PCA: Principal components analysis; DEGs: Differentially expressed genes; SCMs: Significantly changed metabolites; GO: Gene Ontology; KEGG: Kyoto Encyclopedia of Genes and Genomes.
Supplementary InformationThe online version contains supplementary material available at https:// doi. org/ 10. 1186/ s12870- 021- 03121-3.
Additional file 1: Table S1. Primers for qRT-PCR.
Additional file 2: Table S2. a. Significantly changed metabolites in Light compared with CK. b. Significantly changed metabolites in UV-B com-pared with CK. c. Significantly changed metabolites in Light compared with UV-B.
Additional file 3: Table S3. Abundance of flavonoids and anthocyanins quantified by LC-MS/MS.
Additional file 4: Table S4. a-1. All differentially changed genes in Light compared with CK. a-2. Significantly differentially expressed genes in Light compared with CK. b-1. All differentially changed genes in UV-B compared with CK. b-2. Significantly differentially expressed genes in UV-B compared with CK. c-1. All differentially changed genes in UV-B compared with Light. c-2. Significantly differentially expressed genes in UV-B compared with Light.
Additional file 5: Table S5. a. Differentially expression transcription fac-tors of Light compared with CK. b. Differentially expression transcription factors of UV-B compared with CK. c. Differentially expression transcription factors of Light compared with UV-B.
Additional file 6: Figure S1. Differentially expressed genes (DEGs) under the dark (CK), visible light and UV-B radiation treatments. (A) PCA score plot of genes profiles from the Light, UV-B, and CK. (B) Venn plot of genes profiles from the Light, UV-B, and CK.
AcknowledgementsNot applicable.
Authors’ contributionsRD and YZ conceived and designed the experiments; RD and ZS performed the experiments; RD and XC analyzed the data and drafted the manuscript; RD and XC formatted the figures, and revised the manuscript. All authors have read and approved the final manuscript.
FundingThis work was supported by the National Natural Science Foundation of China (31370359) and Natural Science Foundation of Shandong Provincial [grant number ZR2020MC028]. Funds were used for the experimental conduction and the open access payment. No funder has participated in data analysis and interpretation or writing of the manuscript.
Availability of data and materialsWe have uploaded the RNA sequencing data to NCBI and the link is https:// www. ncbi. nlm. nih. gov/ biopr oject/ PRJNA 623676. The data sets supporting the results of this article are include within the article and supplementary table.
Declarations
Ethics approval and consent to participateThis article did not contain any studies with human participants or animals performed by any of the authors.
Consent for publicationThis research is not applicable to consent for publication.
Competing interestsThe authors declare no competing financial interests.
Received: 10 May 2021 Accepted: 7 July 2021
References 1. Espley RV, Bovy A, Bava C, Jaeger SR, Tomes S, Norling C, Putterill J. Analy-
sis of genetically modified red-fleshed apples reveals effects on growth and consumer attributes. Plant Biotechnol J. 2013;11(4):408–19.
2. Sansavini S, Donati F, Costa F, Tartarini S. Advances in apple breeding for enhanced fruit quality and resistance to biotic stresses: new varieties for the European market. J Fruit Ornam Plant Res. 2004;12:13–52.
3. Jakopic J, Stampar F, Veberic R. The influence of exposure to light on the phenolic content of ‘Fuji’apple. Sci Hortic. 2009;123(2):234–9.
4. Feng F, Li M, Ma F, Cheng L. Phenylpropanoid metabolites and expres-sion of key genes involved in anthocyanin biosynthesis in the shaded peel of apple fruit in response to sun exposure. Plant Physiol Biochem. 2013;69:54–61.
5. Ding RR, Che XK, Liu HZ, Du BY, Dong KT, Zhang YH. Effects of 1-MCP and storage temperature on transcription of mevalonate (MVA) enzyme genes of α-farnesene in ‘White Winter Pearmain’apples fruit. Sci Hortic. 2020;259:108841.
6. Ding RR, Du BY, Zhang YH. Conjugated trienols and programmed cell death are more closely related to superficial scald than reactive oxygen species in apple fruit stored at low temperature. Sci Hortic. 2019;246:597–603.
7. Bai S, Sun Y, Qian M, Yang F, Ni J, Tao R, Teng Y. Transcriptome analysis of bagging-treated red Chinese sand pear peels reveals light-responsive pathway functions in anthocyanin accumulation. Sci Rep. 2017;7:63.
8. Rumainum IM, Worarad K, Yamaki Y, Yamane K. Effects of developmental stages, light, and an auxin polar transport inhibitor on the skin and flesh pigmentation of red-fleshed peach fruit. Hortic J. 2016;85(2).
9. Vimolmangkang S, Zheng D, Han Y, Khan MA, Soria-Guerra RE, Korban SS. Transcriptome analysis of the exocarp of apple fruit identi-fies light-induced genes involved in red color pigmentation. Gene. 2014;534(1):78–87.
10. Chen J, Gao W, Lv D, Cai M, Qin S, Ma H, Liu G. The effects of bagging on the fruit skin development process of Red Fuji apple. J Fruit Sci. 2009;26:217–21.
11. Huang C, Yu B, Teng Y, Su J, Shu Q, Cheng Z, Zeng L. Effects of fruit bag-ging on coloring and related physiology, and qualities of red Chinese sand pears during fruit maturation. Sci Hortic. 2009;121:149–58.
12. Xia J, Zhang Z, Qu S. Changes of peel pigments and flesh sugar contents in bagging Malus pumila during development stage. Acta Bot Boreal-Occid Sin. 2010;30:1675–80.
13. Czemmel S, Höll J, Loyola R, Arce-Johnson P, Alcalde JA, Matus JT, Bogs J. Transcriptome-wide identification of novel UV-B-and light modu-lated flavonol pathway genes controlled by VviMYBF1. Front Plant Sci. 2017;8:1084.
14. Honda C, Kotoda N, Wada M, Kondo S, Kobayashi S, Soejima J, Moriguchi T. Anthocyanin biosynthetic genes are coordinately expressed during red coloration in apple skin. Plant Physiol Biochem. 2002;40:955–62.
15. Ubi BE, Honda C, Bessho H, Kondo S, Wada M, Kobayashi S, Moriguchi T. Expression analysis of anthocyanin biosynthetic genes in apple skin: effect of UV-B and temperature. Plant Sci. 2006;170(3):571–8.
16. Xie R, Zheng L, He S, Zheng Y, Yi S, Deng L. Anthocyanin biosyn-thesis in fruit tree crops: genes and their regulation. Afr J Biotech. 2011;10(86):19890–7.
17. Xu W, Dubos C, Lepiniec L. Transcriptional control of flavonoid biosynthe-sis by MYB–bHLH–WDR complexes. Trends Plant Sci. 2015;20(3):176–85.
18. Dubos C, Stracke R, Grotewold E, Weisshaar B, Martin C, Lepiniec L. MYB transcription factors in Arabidopsis. Trends Plant Sci. 2010;5(10):573–81.
Page 15 of 15Ding et al. BMC Plant Biol (2021) 21:351
• fast, convenient online submission
•
thorough peer review by experienced researchers in your field
• rapid publication on acceptance
• support for research data, including large and complex data types
•
gold Open Access which fosters wider collaboration and increased citations
maximum visibility for your research: over 100M website views per year •
At BMC, research is always in progress.
Learn more biomedcentral.com/submissions
Ready to submit your researchReady to submit your research ? Choose BMC and benefit from: ? Choose BMC and benefit from:
19. Espley RV, Hellens RP, Putterill J, Stevenson DE, Kutty-Amma S, Allan AC. Red colouration in apple fruit is due to the activity of the MYB transcrip-tion factor, MdMYB10. Plant J. 2007;49:414–27.
20. Hu DG, Sun CH, Ma QJ, You CX, Cheng L, Hao YJ. MdMYB1 regulates anthocyanin and malate accumulation by directly facilitating their trans-port into vacuoles in apples. Plant Physiol. 2016;170:1315–30.
21. Xie XB, Li S, Zhang RF, Zhao J, Chen YC, Zhao Q, Hao YJ. The bHLH tran-scription factor MdbHLH3 promotes anthocyanin accumulation and fruit colouration in response to low temperature in apples. Plant Cell Environ. 2012;35:1884–97.
22. Jaakola L. New insights into the regulation of anthocyanin biosynthesis in fruit. Trends Plant Sci. 2013;18(9):477–83.
23. Takos AM, Jaffé FW, Jacob SR, Bogs J, Robinson SP, Walker AR. Light-induced expression of a MYB gene regulates anthocyanin biosynthesis in red apples. Plant Physiol. 2006;142:1216–32.
24. Bakhshi D, Arakawa O. Induction of phenolic compounds biosynthesis with light irradiation in the flesh of red and yellow apples. J Appl Hortic. 2005;8(2):101–4.
25. Opara LU, Studman CJ, Banks NH. Sunlight affects the incidence of inter-nal ring cracking and other physical attributes of ‘Gala’apples. J Tree Fruit Prod. 1997;2(1):45–52.
26. Sun S, Xin L, Gao H, Wang J, Li P. Response of phenolic compounds in ‘Golden Delicious’ and ‘Red Delicious’ apples peel to fruit bagging and subsequent sunlight re-exposure. Sci Hortic. 2014;168:161–7.
27. Mikanagi Y, Sait N, Yokoi M, Tatsuzawa F. Anthocyanins in flowers of genus rosa, sections cinnamomeae (=rosa), chinenses, gallicanae and some modern garden roses. Biochem Syst Ecol. 2000;28(9):887–902.
28. Stracke R, Ishihara H, Huep G, Barsch A, Mehrtens F, Niehaus K, Weisshaar B. Differential regulation of closely related R2R3-MYB transcription factors controls flavonol accumulation in different parts of the Arabidopsis thaliana seedling. Plant J. 2010;50:660–77.
29. Henry-Kirk RA, Plunkett B, Hall M, McGhie T, Allan AC, Wargent JJ, Espley RV. Solar UV light regulates flavonoid metabolism in apple (Malus x domestica). Plant Cell Environ. 2018;41:675–88.
30. Bai S, Tao R, Tang Y, Yin L, Teng Y. Bbx 16, a b-box protein, positively regulates light-nduced anthocyanin accumulation by activating myb 10 in red pear. Plant Biotechnol J. 2019;17(10):1985–97.
31. Ma C, Jing C, Chang B, Yan J, Liang B, Liu L, Zhao Z. The effect of promoter methylation on MdMYB1 expression determines the level of anthocyanin accumulation in skins of two non-red apple cultivars. BMC Plant Biol. 2018;18(1):108.
32. Kim SH, Lee JR, Hong ST, Yoo YK, An G, Kim SR. Molecular cloning and analysis of anthocyanin biosynthesis genes preferentially expressed in apple skin. Plant Sci. 2003;165(2):403–13.
33. Lichtenthaler HK. Chlorophylls and carotenoids: pigments of photosyn-thetic biomembranes. Method Enzymol. 1987;148C:350–82.
34. Zhao J, Xie X, Shen X, Wang Y. Effect of sunlight-exposure on antioxidants and antioxidant enzyme activities in ‘d’Anjou’pear in relation to superficial scald development. Food Chem. 2016;210:18–25.
35. Conesa A, Madrigal P, Tarazona S, Gomez-Cabrero D, Cervera A, McPher-son A, Mortazavi A. A survey of best practices for RNA-seq data analysis. Genome Biol. 2016;17(1):13.
36. Gel B, Serra E. karyoploteR: an R/Bioconductor package to plot customizable genomes displaying arbitrary data. Bioinformatics. 2017;33(19):3088–90.
37. Kanehisa M, Araki M, Goto S, Hattori M, Hirakawa M, Itoh M, Yamanishi Y. KEGG for linking genomes to life and the environment. Nucleic Acids Res. 2008;36(1):D480–4.
38. Liao Y, Smyth GK, Shi W. featureCounts: an efficient general purpose program for assigning sequence reads to genomic features. Bioinformat-ics. 2013;30:923–30.
39. Love MI, Huber W, Anders S. Moderated estimation of fold change and dispersion for RNA-seq data with DESeq2. Genome Biol. 2014;15(12):550.
40. Tatusov RL, Koonin EV, Lipman DJ. A genomic perspective on protein families. Science. 1997;278(5338):631–7.
41. Tatusov RL, Galperin MY, Natale DA, Koonin EV. The COG database: a tool for genome-scale analysis of protein functions and evolution. Nucleic Acids Res. 2000;28(1):33–6.
42. Varet H, Brillet-Guéguen L, Coppée JY, Dillies MA. SARTools: a DESeq2-and edgeR-based R pipeline for comprehensive differential analysis of RNA-Seq data. PLoS One. 2016;11:e0157022.
43. Wang Z, Gerstein M, Snyder M. RNA-Seq: a revolutionary tool for tran-scriptomics. Nat Rev Genet. 2009;10(1):57.
44. Chen W, Gong L, Guo Z, Wang W, Zhang H, Liu X, Luo J. A novel inte-grated method for large-scale detection, identification, and quantifica-tion of widely targeted metabolites: application in the study of rice metabolomics. Mol Plant. 2013;6(006):1769–80.
45. Bustin SA, Beaulieu JF, Huggett J, Jaggi R, Kibenge FS, Olsvik PA, Toegel S. MIQE precis: practical implementation of minimum standard guidelines for fluorescence-based quantitative real-time PCR experiments. BMC Mol Biol. 2010;11(1):74.
46. Bustin SA, Benes V, Garson JA, Hellemans J, Huggett J, Kubista M, Vandes-ompele J. The MIQE guidelines: minimum information for publication of quantitative real-time PCR experiments. Clin Chem. 2009;55(4):611–22.
Publisher’s NoteSpringer Nature remains neutral with regard to jurisdictional claims in pub-lished maps and institutional affiliations.


![Transcriptome and metabolome profiling provide insights into … · 2021. 3. 1. · elongation by restricting signals that control stem elong-ation [13]. The establishment of vascular](https://static.fdocuments.in/doc/165x107/61206886edb8ca0e3f524b6f/transcriptome-and-metabolome-profiling-provide-insights-into-2021-3-1-elongation.jpg)