Metabolism€¢ Page 197 High sensitivity analysis of metabolites in serum using simultaneous SIM...
25
Metabolism
Transcript of Metabolism€¢ Page 197 High sensitivity analysis of metabolites in serum using simultaneous SIM...
Metabolism

• Page 197High sensitivity analysis of metabolites in serum using simultaneous SIM and MRM modes in a triple quadrupole GC/MS/MS
• Page 202Analysis of D- and L-amino acids using auto- mated pre-column derivatization and liquid chromatography-electrospray ionization mass spectrometry
• Page 208Characterization of metabolites in microsomal metabolism of aconitine by high-performance liquid chromatography/quadrupole ion trap/time-of-flight mass spectrometry
• Page 213Simultaneous analysis of primary metabolites by triple quadrupole LC/MS/MS using penta- fluorophenylpropyl column
PO-CON1443E
High Sensitivity Analysis ofMetabolites in Serum UsingSimultaneous SIM and MRM Modesin a Triple Quadrupole GC/MS/MS
ASMS 2014 ThP 641
Shuichi Kawana1, Yukihiko Kudo2, Kenichi Obayashi2,
Laura Chambers3, Haruhiko Miyagawa2
1 Shimadzu, Osaka, Japan, 2 Shimadzu, Kyoto, Japan,
3 Shimadzu Scienti�c Instruments, Columbia, MD
2
High Sensitivity Analysis of Metabolites in Serum Using Simultaneous SIM and MRM Modes in a Triple Quadrupole GC/MS/MS
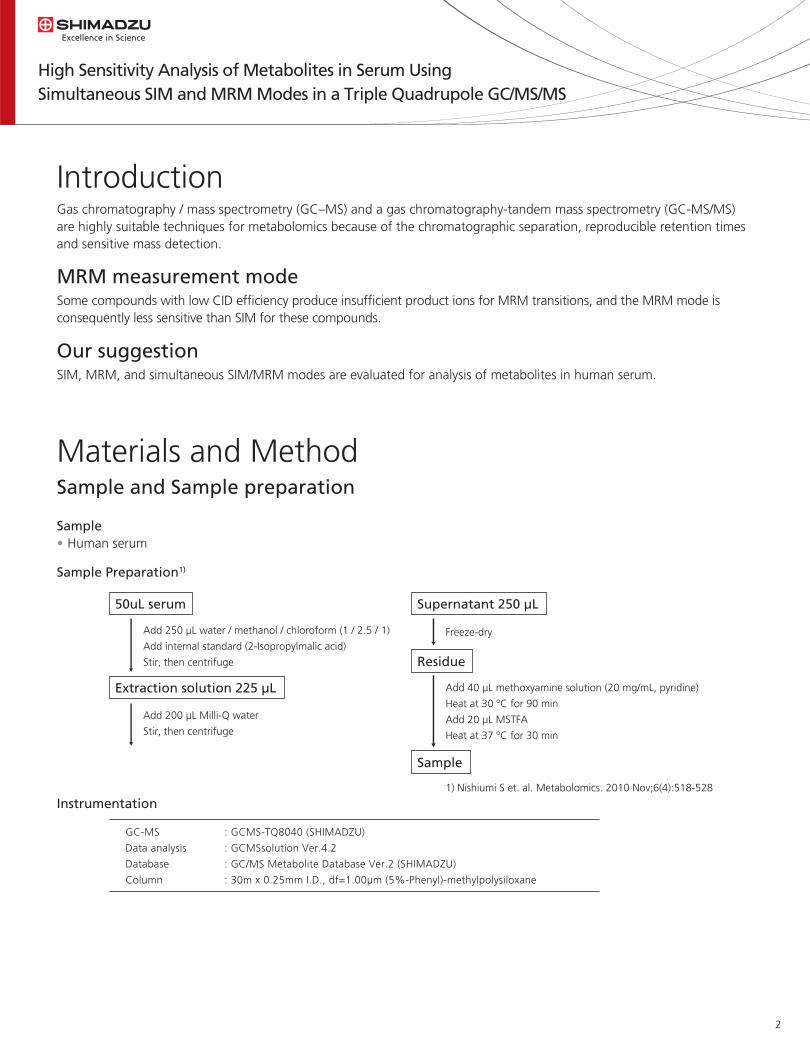
IntroductionGas chromatography / mass spectrometry (GC–MS) and a gas chromatography-tandem mass spectrometry (GC-MS/MS) are highly suitable techniques for metabolomics because of the chromatographic separation, reproducible retention times and sensitive mass detection.
Sample• Human serum
MRM measurement modeSome compounds with low CID ef�ciency produce insuf�cient product ions for MRM transitions, and the MRM mode is consequently less sensitive than SIM for these compounds.
Our suggestionSIM, MRM, and simultaneous SIM/MRM modes are evaluated for analysis of metabolites in human serum.
Materials and MethodSample and Sample preparation
Sample Preparation1)
Instrumentation
Freeze-dry
Residue
Sample
Add 40 µL methoxyamine solution (20 mg/mL, pyridine)
Heat at 30 ºC for 90 min
Add 20 µL MSTFA
Heat at 37 ºC for 30 min
1) Nishiumi S et. al. Metabolomics. 2010 Nov;6(4):518-528
Supernatant 250 µL
Add 250 µL water / methanol / chloroform (1 / 2.5 / 1)
Add internal standard (2-Isopropylmalic acid)
Stir, then centrifuge
Extraction solution 225 µL
Add 200 µL Milli-Q water
Stir, then centrifuge
50uL serum
GC-MS : GCMS-TQ8040 (SHIMADZU)
Data analysis : GCMSsolution Ver.4.2
Database : GC/MS Metabolite Database Ver.2 (SHIMADZU)
Column : 30m x 0.25mm I.D., df=1.00µm (5%-Phenyl)-methylpolysiloxane

3
High Sensitivity Analysis of Metabolites in Serum Using Simultaneous SIM and MRM Modes in a Triple Quadrupole GC/MS/MS
Simultaneous SIM and MRM modes in GC/MS/MSFigure 1 shows the theory of Simultaneous SIM and MRM modes. This analysis mode can measure SIM and MRM data in a single analysis.
Method Creation using Database and SmartMRMFigure 3 shows the GC/MS Metabolites Database Ver.2. This database involves conditions of SIM and MRM in 186 metabolites and a method creation function we call SmartMRM. SmartMRM creates MRM, SIM, SIM/MRM methods from Database automatically.
• Select the MRM, SIM and SIM/MRM conditions of 186 TMS derivatization metabolites from GC/MS Metabolites Database Ver.2.
• Select the two transitions (or ions) each metabolite.
Poor sensitivity of MRM in some compounds because of low CID ef�ciency
Figure 1 The concept of simultaneous SIM and MRM analysis mode.
Figure 3 GC/MS Metabolites Database Ver.2
Figure 2 Mass Spectrum of Precursor (or SIM) and Product ion
SIM
MRMSIM
MRM
Q1 Q3Collision Cell
SIMSIM CID
100 200 300 400 0
25
50
75
100 %
361
73
217 147 437 103 271
243 319 191
100 200 300 0
25
50
75
100
%
169
103 73
243 361
Precursor ion (or SIM) Product ion
CID

4
High Sensitivity Analysis of Metabolites in Serum Using Simultaneous SIM and MRM Modes in a Triple Quadrupole GC/MS/MS
A number of Identi�cation metabolites in serum Table 1 shows the identi�cation results of metabolites in human serum using SIM, MRM and simultaneous SIM/MRM analysis modes in GC/MS/MS. In SIM/MRM, the metabolites, which were insuf�cient sensitivity in MRM, were measured by SIM and the other metabolites were measured by MRM.
ResultsComparison of the chromatogram between SIM and MRM in human serum
Detected the peak in MRM because of high selectivity
Peak was not detected in MRM because of low CID ef�ciency.
SIM MRM
SIM MRM
0.5
1.0
1.5
2.0
2.5
3.0
3.5
2.5
5.0
7.5
0.25
0.50
0.75
1.00
1.25
1.50
1.75
(x100,000)333.10160.10
0.25
0.50
0.75
1.00
1.25
1.50
1.75
2.00
(x100,000)238.10218.10
(x10,000)218.10>73.00
(x100)238.10>91.00
238.10>91.00
(x10,000)333.10>143.10333.10>171.10
21.00 21.25 21.00 21.25
21.25 21.50 21.2521.00 21.50
21.2521.00 21.500.250.500.751.001.251.501.75
a) Glucuronic acid-meto-5TMS(2)
b) S-Benzyl-Cysteine-4TMS
Table 1 The number of identi�ed metabolites each analysis mode
note) A:Target and Con�rmation ions were detected.; B: Either Target or Con�rmation ion was detected. Another one was overlapped by contaminants.; C: Either Target or Con�rmation ion was detected.
Modes
SIM
MRM
SIM/MRM
A
57
131
133
B
51
14
22
C
8
1
1
Total
116
146
156

High Sensitivity Analysis of Metabolites in Serum Using Simultaneous SIM and MRM Modes in a Triple Quadrupole GC/MS/MS
For Research Use Only. Not for use in diagnostic procedures.The content of this publication shall not be reproduced, altered or sold for any commercial purpose without the written approval of Shimadzu. The information contained herein is provided to you "as is" without warranty of any kind including without limitation warranties as to its accuracy or completeness. Shimadzu does not assume any responsibility or liability for any damage, whether direct or indirect, relating to the use of this publication. This publication is based upon the information available to Shimadzu on or before the date of publication, and subject to change without notice.
© Shimadzu Corporation, 2014
First Edition: June, 2014
www.shimadzu.com/an/
Fig.4 shows a number of metabolites in each mode can be measured. In metabolites with low CID ef�ciency, SIM are superior to MRM if there are no interfering substances to the target metabolites.
Figure 4 Detected metabolites in human serum each analysis mode.
Conclusions• Analytical results from the SIM and MRM modes identi�ed 116 and 146 metabolites, respectively.• In metabolites with poor CID ef�ciency, the sensitivity of SIM is more than 10 times higher than MRM.• Simultaneous SIM and MRM modes in a single analysis (SIM/MRM) improves the sensitivity and reproducibility for
analysis of metabolites in human serum compared to MRM alone. • A novel SIM/MRM expands the utility of a triple quadrupole GC/MS/MS
The reproducibility(n=6) in MRM and SIM/MRMTable 2 Comparison of the reproducibility results from MRM and SIM/MRM analysis. A number of detected metabolites involves A, B and C in Table 1.
%RSD
- 4.99%
5 - 9.99%
10 - 14.99%
15 - 19.99%
> 20%
MRM
73
26
8
9
30
146
SIM/MRM
76
30
10
10
30
156
Improvement
+3
+4
+2
+1
0
+10
SIM MRM
10 40 106
Metabolites with low CIDef�ciency in MRM
Metabolites withinterference in SIM

PO-CON1451E
Analysis of D- and L-amino acids usingautomated pre-column derivatizationand liquid chromatography-electrosprayionization mass spectrometry
ASMS 2014 MP739
Kenichiro Tanaka1; Hidetoshi Terada2; Yoshiko Hirao2;
Kiyomi Arakawa2; Yoshihiro Hayakawa2
1. Shimadzu Scienti�c Instruments, Inc., Columbia, MD;
2. Shimadzu Corporation, Kyoto, Japan

2
Analysis of D- and L-amino acids using automated pre-column derivatization and liquid chromatography-electrospray ionization mass spectrometry
IntroductionRecently, several species of D- amino acids have been found in mammals including humans and their physiological functions have been elucidated. Quantitating each enantiomer of amino acids is indispensable for such studies. In order to diagnose diseases, it is desirable that D- and L-amino acid can be separately quantitated and applied to metabolic analysis. Pre-column derivatization with o-phthalaldehyde (OPA) and N-acetyl-L-cysteine(NAC) is widely utilized for the analysis of D- and L- amino acids since the method can be performed with a rapid reversed phase separation on a relatively simple hardware (U)HPLC con�guration with
good reliability. One of the drawbacks of pre-column derivatization is less reproducibility due to the tedious manual procedure and human errors. We have launched an autosampler for a UHPLC system equipped with an automated pretreatment function that allows overlapping injections in which the next derivatization proceeds during the current analysis for saving total analytical time. We have applied this autosampler and its function to fully automate pre-column derivatization for the determination of amino acids. In this study, we developed a methodology which enabled the automated procedure of pre-column chiral derivatization of D- and L- amino acids.
Experimental
The system used was a SHIMADZU UHPLC Nexera pre-column Amino Acids (AAs) system consisting of LC-30AD solvent delivery pump, DGU-20A5R degassing unit, SIL-30AC autosampler, CTO-30A column oven, and SHIMADZU triple quadrupole mass spectrometer LCMS-8040. The software is integrated in the LC/MS/MS
workstation (LabSolutions, Shimadzu Corporation, Japan) so that selected conditions can be seamlessly translated into method �les and registered to a batch queue, ready for instant analysis. A 1.9um YMC-Triart C8 column (2.0 mm x 150 mm L.) was used for the analysis.
Instruments
Derivatizing solutions: 0.1 mol/L boric acid buffer was prepared by dissolving 6.18 g of boric acid and 2.00 g of sodium hydroxide in 1 L of water. 10 mmol/L NAC solution was prepared by dissolving 16.3 mg of N-acetyl-L-cysteine in 10 mL of the 0.1 mol/L boric acid buffer. 10 mmol/L OPA solution was prepared by dissolving 6.7
mg of o-phthalaldehyde in 0.3 mL of ethanol, adding 0.7 mL of the 0.1 mol/L boric acid buffer and 4 mL of water.Fig.1 shows the schematic procedure for amino acids derivatization with the SIL-30AC.Samples, including the derivatized amino acids, were injected onto the UHPLC and separated under the conditions shown in Table 1.
Derivatization Method

3
Analysis of D- and L-amino acids using automated pre-column derivatization and liquid chromatography-electrospray ionization mass spectrometry
Fig.1 Schematic procedure of automated pre-column derivatization
Table 1 UHPLC and MS analytical conditions
Mobile Phase : A : 10 mmol/L Ammonium Bicarbonate solution
B : Acetonitrile/Methanol = 1/1(v/v)
Initial B Conc. : 0%
Flow Rate : 0.4 mL/min
Column Temperature : 40 ºC
Injection Volume : 1 μL
LC Time Program : 0 -> 5%(0.01min), 5%(0.01-1.00min), 5 ->20%(1.00 - 15.00min),
20 - 25%(15.00 - 24.00min), 25 – 90%(24.00 - 24.50min),
90%(24.50 - 27.50min), 90 - 0% (27.50 – 28.50min)
Ionization Mode : ESI
Nebulizing Gas Flow Rate : 3 L/min
Drying Gas Flow Rate : 15 L/min
DL Temperature : 300 ºC
Heating Block Temperature : 450 ºC
Result
A standard solution containing 27 amino acids was prepared at 1 mmol/L concentration each in 0.1 mol/L HCl solution. The MS conditions such as ESI positive and negative ionization modes were optimized in parallel with the column separation, and compound dependent parameters such as CID and pre-bias voltage were adjusted
using the function for automatic MRM optimization. The transition that provided the highest intensity was used for quanti�cation. Table 2 shows the MRM transition of each derivatized amino acid. The MRM chromatogram is illustrated in Fig.2.
Analysis of Standard Solution
(1)
Take 20 μL of 10 mmol/L NAC solution
Supply 1 μL ofsample solution to the vial for mixing
(3)
Take 20μL of 10 mmol/L OPA solution
Mix the sample solutionand derivatizing solutions
Inject 1μL of the mixed solution to the column
Supply 20 μL of NAC solution to thevial for mixing
Supply 20 μL of10 mmol/L OPA solution to the vial for mixing
(5)
Take 1 μL of sample solution
Wait for 3min untilthe derivatization ends
Take 1μL of the mixedsolution
(2) (4)
(6) (7) (8) (10)(9)

4
Analysis of D- and L-amino acids using automated pre-column derivatization and liquid chromatography-electrospray ionization mass spectrometry
Fig. 2 Chromatogram of a 27 amino acid standard solution
Compound
Aspartic acid
Glutamic acid
Serine
Glutamine
Glycine
Histidine
Threonine
Arginine
Tyrosine
Valine
Tryptophan
Isoleucine
Phenylalanine
Polarity
+
+
+
+
+
+
+
+
+
+
+
+
+
Precursor m/z
395.00
409.10
367.00
408.20
337.00
417.10
381.20
436.10
443.00
379.10
466.20
393.00
427.20
Product m/z
130.00
130.05
130.00
130.05
130.00
244.05
130.05
263.10
130.05
250.05
337.10
264.05
298.05
Table 2 Compounds, Ionization polarity and MRM transition
0.0 2.5 5.0 7.5 10.0 12.5 15.0 17.5 20.0 22.5 min
0
25000
50000
75000
100000
125000
150000
175000
200000
225000
250000
12
3 45
6
78
9
10
11
12 13
14
1516
17
18 1921
22
20
23
24
2526
27
■Peaks
1. D-Aspartic acid, 2. L-Aspartic acid, 3. L-Glutamic acid, 4. D-Glutamic acid, 5. D-Serine, 6. L-Serine, 7. L-Glutamine8. D-Glutamine, 9. Glycine, 10. L-Histidine, 11. D-Histidine ,12. D-Threonine, 13. L-Threonine, 14. L-Arginine15. D-Arginine, 16. D-Alanine, 17. L-Alanine, 18. D-tyrosine, 19. L-Tyrosine, 20. L-Valine, 21. D-Valine22. L-Tryptophan, 23. D-Tryptophan, 24. L-Isoleucine, 25. D-Phenylalanine, 26. L-Phenylalanine, 27.D-Isoleucine

5
Analysis of D- and L-amino acids using automated pre-column derivatization and liquid chromatography-electrospray ionization mass spectrometry
CompoundRepeatability (%RSD)
D-Aspartic acid
D-Glutamic acid
D-Serine
D-Glutamine
D-Histidine
D-Threonine
D-Arginine
D-Alanine
D-Tyrosine
D-Valine
D-Tryptophan
D-Isoleucine
D-Phenylalanine
5 μmol/L
3.5
3.7
4.8
4.1
4.3
3.8
3.4
4.0
3.2
3.3
3.9
3.1
3.5
25 μmol/L
2.5
3.1
3.0
3.4
1.8
2.6
1.7
2.3
2.9
2.2
3.2
2.9
1.8
Table 3 Reproducibility
Compound
D-Asparic acid
D-Glutamic acid
D-Serine
D-Glutamine
D-Histidine
D-Threonine
D-Arginine
D-Alanine
D-Tyrosine
D-Valine
D-Tryptophan
D-Isoleucine
D-Phenylalanine
Cali.F
Y = (44661.8)X + (1829.61)
Y = (12191.8)X + (10390.7)
Y = (22319.5)X + (-2869.30)
Y = (3458.60)X + (1521.83)
Y = (5778.33)X + (-341.182)
Y = (10800.6)X + (-1874.07)
Y = (10535.7)X + (-1298.12)
Y = (15349.1)X + (-4719.98)
Y = (17098.7)X + (-1812.69)
Y = (23707.7)X + (772.548)
Y = (18089.1)X + (-3620.41)
Y = (44017.1)X + (67903.1)
Y = (22426.0)X + (-736.090)
r2
0.998
0.999
0.999
0.999
0.998
0.999
0.998
0.999
0.999
0.999
0.998
0.999
0.999
Table 4 Linearity
Reproducibility and linearity in this analysis were evaluated with a plasma spiked standard solution. As a result, less than 5% relative standard deviation of peak areas were obtained. Table 3 shows the reproducibility of repeated analysis of spiked sample (n=6). Five different levels of
spiked sample concentration from 1 to 100 μmol/L standard solution were used for the linearity evaluation. The coef�cients of determination (r2) were approximately 0.999. Table 4 shows the summary for the linearity results.
Method Validation

For Research Use Only. Not for use in diagnostic procedures.The content of this publication shall not be reproduced, altered or sold for any commercial purpose without the written approval of Shimadzu. The information contained herein is provided to you "as is" without warranty of any kind including without limitation warranties as to its accuracy or completeness. Shimadzu does not assume any responsibility or liability for any damage, whether direct or indirect, relating to the use of this publication. This publication is based upon the information available to Shimadzu on or before the date of publication, and subject to change without notice.
© Shimadzu Corporation, 2014
First Edition: June, 2014
www.shimadzu.com/an/
Analysis of D- and L-amino acids using automated pre-column derivatization and liquid chromatography-electrospray ionization mass spectrometry
Considering the frequency of amino acids analysis in physiological samples, the recovery of spiked samples were con�rmed. In addition, the results indicated that the recovery ratio of most amino acids are around 100%.Table 5 shows the summarized results for the recovery of each amino acid.
Conclusions• The combination of Shimadzu triple quadrupole mass spectrometer and Nexera UHPLC provides reliable pre-column
derivatized AAs analysis with enhanced productivity.• An established method was successfully applied to the separation of D- and L- amino acids with excellent reliability.
CompoundRecovery (100%)
D-Asparic acid
D-Glutamic acid
D-Serine
D-Glutamine
D-Histidine
D-Threonine
D-Arginine
D-Alanine
D-Tyrosine
D-Valine
D-Tryptophan
D-Isoleucine
D-Phenylalanine
5 μmol/L
100.3
92.8
97.9
103.2
104.8
101.1
102.4
93.5
98.1
101.0
97.8
98.8
104.5
25 μmol/L
107.1
97.8
100.6
104.3
100.4
98.8
99.6
99.5
101.0
99.2
100.4
102.4
100.9
Table 5 Recovery
PO-CON1476E
Characterization of metabolites in microsomal metabolism of aconitineby high-performance liquid chromatography/quadrupole ion trap/time-of-�ight mass spectrometry
ASMS 2014 WP 739
Cuiping Yang1, Changkun Li2, Tianhong Zhang1,
Qian Sun2, Yueqi Li2, Guixiang Yang2, Taohong Huang2,
Shin-ichi Kawano2, Yuki Hashi2, Zhenqing Zhang1,* 1Beijing Institute of Pharmacology & Toxicology, 2Shimadzu Global COE, Shimadzu (China) Co., Ltd., China

2
Characterization of metabolites in microsomal metabolism of aconitine by high-performance liquid chromatography/quadrupole ion trap/time-of-�ight mass spectrometry
0.0 2.5 5.0 7.5 10.0 12.5 15.0 17.5 20.0 22.5 25.0 27.5 30.0 32.5
0.0
2.5
5.0
7.5(x1,000,000)
Introduction
Results
Aconitine (AC) is a bioactive alkaloid from plants of the genus Aconitum, some of which have been widely used as medicinal herbs for thousands of years. AC is also well known for its high toxicity that induces severe arrhythmias leading to death. Although numerous studies have raised on its pharmacology and toxicity, data on the identi�cation
metabolites of AC in liver microsomes are limited. The study of metabolic pathways is very important for ef�cacy of therapy and evaluation of toxicity for those with narrow therapy window. The aim of our work was to obtain the metabolic pathways of AC by the human liver microsomes.
Methods and Materials
The typical reaction mixture incubation contained 10 μmol/L aconitine and was preincubated at 37 ºC for 3 min. Reactions were initiated by adding 50 μL of NADPH (20 mmol/L), then incubated at 37 ºC in a waterbath shaker for
60 min. The reactions were terminated by adding 3-volume of ice-cold acetonitrile, then vortexed and centrifuged to remove precipitated protein.
Sample Preparation
Instrument : LCMS-IT-TOF (Shimadzu Corporation, Japan);
UFLCXR system (Shimadzu Corporation, Japan);
Column : Shim-pack XR-ODS II (2.0 mmI.D. x 75 mmL.,2.2 μm)
Mobile phase : A: water (0.1% formic acid+5 mmol ammonium formate),
B: acetonitrile
Gradient program : 30%B (0-4 min)-80%B (8 min)-80%B (8-11 min)-30%B (11.01-17 min)
Flow rate : 0.3 mL/min
M11M1
M0
M2M3
M4
M5
M6
M7
M8M9
M10
M12
M13 M14M16
M15
B
Fig.1 TIC chromatogram (A) and mass chromatograms of the metabolites of AC in the microsomal incubation mixture of human (B)
0.0 2.5 5.0 7.5 10.0 12.5 15.0 17.5 20.0 22.5 25.0 27.5 30.0 32.5 35.00.0
2.5
5.0
7.5(x1,000,000)
1:TIC (1.00)
A

3
Characterization of metabolites in microsomal metabolism of aconitine by high-performance liquid chromatography/quadrupole ion trap/time-of-�ight mass spectrometry
Fig. 3 Proposed metabolic pro�le of AC in the human liver microsomes
Fig. 2 Proposed fragmentation pathway of AC
OH+
OH
OO
O
O
N
O
OH
H
OH
O
O
C34H48NO11+
Exact Mass: 646.3227C32H44NO9
+
Exact Mass: 586.3016
C31H40NO8+
Exact Mass: 554.2754
C25H34NO8+
Exact Mass: 476.2284
C29H36NO8+
Exact Mass: 526.2441
C25H36NO9+
Exact Mass: 494.2390 C22H26NO4+
Exact Mass 368.1862 C21H25NO4+
Exact Mass 354.1705
O
OH
O
+
O
O
N
O
OH
H
OH
O
OH
O
+
O
O
N
O
OH
H
OH
O
OH
O
+
O
O
HN
O
OH
H
OH
O
OH
O
+
O
O
N
O
OH
H
OH
O
OH
O
+
O
O
N
O
OH
H
OH
OOH
O
O
HN
OH
OHH+
O
O
HN
HOH
OHH+
O
HO
HO
O
O
O
N
O
OH
H
OH
O
O
OH
HO
HO
O
O
O
N
O
OH
H
OH
O
O
OH
HO
O
O
O
OH
N
O
OH
H
OH
O
O
O
HO
O
O
O
O
N
HOH2C
O
OH
H
OH
O
O
O
OH
O
OH
O
O
N
O
OH
H
OH
O
O
OH
O
O
O
O
N
HOH2C
O
OH
H
OH
O
O
O
OH
O
O
O
O
N
O
OH
H
OH
O
O
O
OH
O
O
O
OH
N
O
OH
H
OH
O
O
OH
OH
O
O
O
O
N
O
OH
H
OH
O
O
O
OH
O
O
O
N
O
OH
H
OH
O O
O
O
O
N
O
OH
H
OH
O
O
O
OH
O
O
O
O
HN
O
OH
H
OH
O
OO
O
OH
O
O
N
O
OH
H
OH
O
O
OH
OH
O
O
O
O
N
O
OH
H
OH
O
O
M0
M13
M15
M11
M8M9M2
M10
M7
M16
M12
M3 M1
M5
O
HO
HO
O
O
O
N
O
OH
H
OH
O
O
M6O
HO
O
O
O
O
N
O
OH
H
OH
O
O
M4
O
HO
O
O
O
O
N
HOH2C
O
OH
H
OH
O
O
M14

4
Characterization of metabolites in microsomal metabolism of aconitine by high-performance liquid chromatography/quadrupole ion trap/time-of-�ight mass spectrometry
No.
M0
M1
M2
M3
M4
M5
M6
M7
M8
M9
M10
M11
M12
M13
M14
M15
M16
RT(min)
22.3
10.5
11.2
11.3
11.8
12.2
13.3
13.5
13.7
13.8
14.1
15.0
15.1
16.0
17.3
17.6
17.9
Meas.MW(m/z)
646.3230
618.2922
616.2754
604.3140
630.2930
586.3005
616.2769
632.3035
648.3016
618.2935
618.2890
662.3179
602.2948
632.3054
662.3209
632.3068
584.2826
Pred.MW(m/z)
646.3222
618.2909
616.2752
604.3116
630.2909
586.3011
616.2752
632.3065
648.3015
618.2909
618.2909
662.3171
602.2960
632.3065
662.3171
632.3065
584.2854
mDaerror
0.8
1.3
0.2
2.4
2.1
0.6
2.3
3.0
0.1
3.0
1.5
0.8
1.6
1.1
3.8
0.3
2.8
MS2 data
586.3000, 554.2752, 526.2785, 494.2536, 476.2431, 404.2432, 368.1847, 354.1687
558.2710, 498.2469, 480.2378, 436.2093, 354.1725
556.2510, 554.2335, 494.2106, 478.2321, 434.1908, 402.1682
554.2744, 522.2398, 434.1898
570.2686, 552.2576, 510.2457, 492.2381
568.2938, 554.2705, 522.2537, 466.2168, 434.1922
584.2477, 524.2316, 434.1941
572.2866, 512.2638, 494.2468, 480.2283, 462.2214, 290.2236, 354.1652, 340.1871
588.2702, 570.2654, 528.2566, 510.2434, 406.2161
558.2714, 494.2109, 476.2400, 340.1548
558.2722, 494.2127, 476.2009, 354.1635
602.2964, 570.2654, 542.2750, 510.2434, 420.2416
584.2533, 524.2249, 510.2179, 406.1582
572.2853, 512.2661, 480.2368, 476.2445, 436.2082, 368.1812
602.2947, 570.2654, 542.2766, 510.2434, 478.2187
586.2973, 526.2738, 508.2273, 494.2490
552.2669, 492.2111, 460.2063
Formula
C34H47NO11
C32H43NO11
C32H41NO11
C32H45NO10
C33H43NO11
C32H43NO9
C32H41NO11
C33H45NO11
C33H45NO12
C32H43NO11
C32H43NO11
C34H47NO12
C32H43NO10
C33H45NO11
C34H47NO12
C33H45NO11
C32H41NO9
Biotransformation
Parent
deethylation
bidemethylation+dehydrogenation
deacetylation
demethylation+dehydrogenation
deacetylation+dehydration
bidemethylation+dehydrogenation
demethylation
oxidation+demethylation
bidemethylation
bidemethylation
oxidation
deacetylation+dehydrogenation
demethylation
oxidation
demethylation
deacetylation+dehydration+dehydrogenation
ppmerror
1.26
2.10
0.26
3.94
3.35
0.96
3.68
4.81
0.23
4.88
2.43
1.21
2.66
1.80
5.74
0.42
4.82
Table1 Mass data for characterization of metabolites in of AC in the microsomalincubation mixture of human

For Research Use Only. Not for use in diagnostic procedures.The content of this publication shall not be reproduced, altered or sold for any commercial purpose without the written approval of Shimadzu. The information contained herein is provided to you "as is" without warranty of any kind including without limitation warranties as to its accuracy or completeness. Shimadzu does not assume any responsibility or liability for any damage, whether direct or indirect, relating to the use of this publication. This publication is based upon the information available to Shimadzu on or before the date of publication, and subject to change without notice.
© Shimadzu Corporation, 2014
First Edition: June, 2014
www.shimadzu.com/an/
Characterization of metabolites in microsomal metabolism of aconitine by high-performance liquid chromatography/quadrupole ion trap/time-of-�ight mass spectrometry
Conclusions In this study, totaling 16 metabolites were found and characterized in the humam liver microsomes incubation mixture, including O-demethylation, oxidation, bidemethylation, dehydrogenation, N-deethylation, deacetylation, dehydration and besides M1, M3, M4, M9, M13 and M15, all the left ten of them were �rst identi�ed and reported. Collectively, these data provide a foundation for the clinical use of AC and contributes to a wider understanding of xenobiotic metabolism and toxicity evaluation.

PO-CON1447E
Simultaneous analysis of primarymetabolites by triple quadrupole LC/MS/MSusing penta�uorophenylpropyl column
ASMS 2014 WP 613
Tsuyoshi Nakanishi1, Takako Hishiki2, Makoto Suematsu2,3
1 Shimadzu Corporation, Kyoto, Japan,
2 Department of Biochemistry, School of Medicine,
Keio University, Tokyo, Japan,
3 Japan Science and Technology Agency,
Exploratory Research for Advanced Technology,
Suematsu Gas Biology Project, Tokyo, Japan

2
Simultaneous analysis of primary metabolites by triple quadrupole LC/MS/MS using penta�uorophenylpropyl column
IntroductionVarious metabolic pathways are controlled to keep a biological function in the cell and to monitor the rapid and slight changes of these metabolism, a simple simultaneous analysis is required for quanti�cation of primary metabolites. A typical LC/MS system with an ODS column is not effective to measure primary metabolites because of low af�nity of ODS column to hydrophilic metabolites. Here we report the
simultaneous measurement of 97 metabolites by triple quadrupole LC/MS/MS using penta�uorophenylpropyl column. In this experiment, MRM transitions of these metabolites were optimized and this method was applied to biological samples. Furthermore, to evaluate the accuracy of developed method for quanti�cation, simultaneous analysis by PFPP column was compared to measurement of ion-paring chromatography.
Commercially available compounds were used as standards to optimize MRM transition and LC condition for separation. Mixed standard solutions were diluted to a range of 10 nM~10000 nM for a calibration curve and an aliquot of 3 µL was subjected to LC/MS/MS measurement.Mice were sacri�ced under anesthesia and the isolated heart/liver tissues were rapidly frozen in liquid nitrogen. Frozen liver or heart tissues (>50 mg) from mice were homogenized in 0.5 mL methanol including L-methionine sulfone and 2-morpholinoethanesulfonic
acid (MES) as internal standards. After a general chloroform/methanol extraction, upper aqueous layer �ltered through 5-kDa cutoff �lter. The �ltrate was dried up and dissolved in 0.1 mL puri�ed water. Further, the solution was diluted to 20-100 folds in puri�ed water. An aliquot of 3 µL was analyzed to measure primary metabolites by LC/MS instrument, Nexera UHPLC system and LCMS-8030/LCMS-8040 triple quadrupole mass spectrometer. The following is detailed conditions of LC/MS mesurement.
Methods and materials
3
Simultaneous analysis of primary metabolites by triple quadrupole LC/MS/MS using penta�uorophenylpropyl column
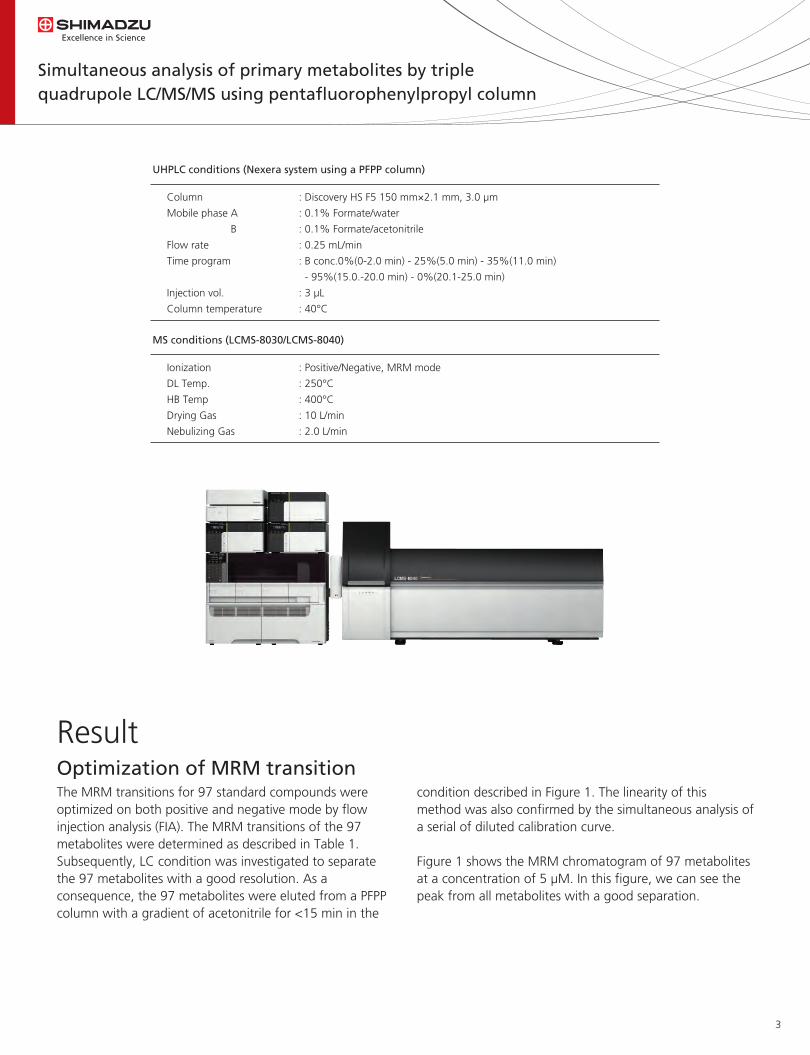
UHPLC conditions (Nexera system using a PFPP column)
Column : Discovery HS F5 150 mm×2.1 mm, 3.0 µm
Mobile phase A : 0.1% Formate/water
B : 0.1% Formate/acetonitrile
Flow rate : 0.25 mL/min
Time program : B conc.0%(0-2.0 min) - 25%(5.0 min) - 35%(11.0 min)
- 95%(15.0.-20.0 min) - 0%(20.1-25.0 min)
Injection vol. : 3 µL
Column temperature : 40°C
MS conditions (LCMS-8030/LCMS-8040)
Ionization : Positive/Negative, MRM mode
DL Temp. : 250°C
HB Temp : 400°C
Drying Gas : 10 L/min
Nebulizing Gas : 2.0 L/min
Result
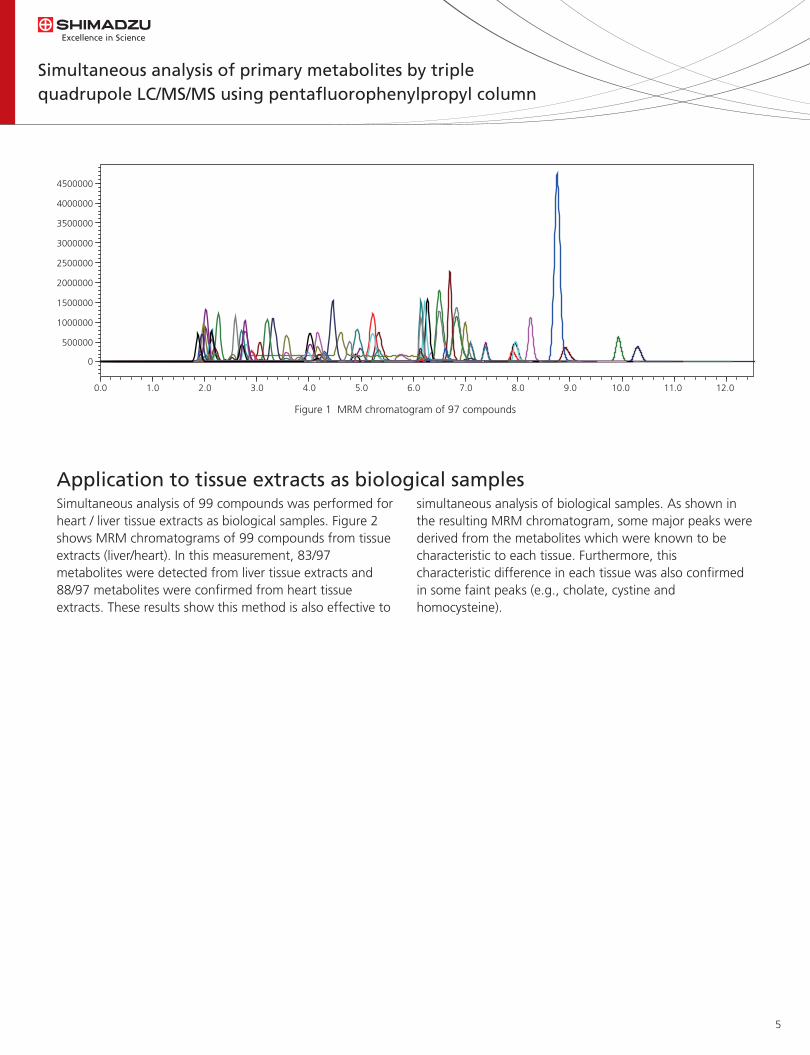
The MRM transitions for 97 standard compounds were optimized on both positive and negative mode by flow injection analysis (FIA). The MRM transitions of the 97 metabolites were determined as described in Table 1. Subsequently, LC condition was investigated to separate the 97 metabolites with a good resolution. As a consequence, the 97 metabolites were eluted from a PFPP column with a gradient of acetonitrile for <15 min in the
condition described in Figure 1. The linearity of this method was also confirmed by the simultaneous analysis of a serial of diluted calibration curve.
Figure 1 shows the MRM chromatogram of 97 metabolites at a concentration of 5 µM. In this figure, we can see the peak from all metabolites with a good separation.
Optimization of MRM transition

4
Simultaneous analysis of primary metabolites by triple quadrupole LC/MS/MS using penta�uorophenylpropyl column
Table 1 MRM transition of 97 metabolites
Name Product ion Precursor ion Linearity (R2)
2-Aminobutyrate
Acetylcarnitine
Acetylcholine
Adenine
Adenosine
Adenylsuccinate
ADMA
Ala
AMP
Arg
Argininosuccinate
Asn
Asp
cAMP
Carnitine
Carnosine
cCMP
cGMP
Choline
Citicoline
Citrulline
CMP
Creatine
Creatinine
Cys
Cystathionine
Cysteamine
Cystine
Cytidine
Cytosine
Dimethylglycine
DOPA
Dopamine
Epinephrine
FAD
GABA
gamma-Glu-Cys
Gln
Glu
Gly
GMP
GSH
Guanosine
His
Histamine
Homocysteine
Homocystine
Hydroxyproline
Hypoxanthine
Ile
No.
1
2
3
4
5
6
7
8
9
10
11
12
13
14
15
16
17
18
19
20
21
22
23
24
25
26
27
28
29
30
31
32
33
34
35
36
37
38
39
40
41
42
43
44
45
46
47
48
49
50
104.10
204.10
147.10
136.00
268.10
464.10
203.10
89.90
348.00
175.10
291.00
133.10
134.00
330.00
162.10
227.10
306.00
346.00
104.10
489.10
176.10
324.00
132.10
114.10
122.00
223.00
78.10
241.00
244.10
112.00
104.10
198.10
154.10
184.10
786.15
104.10
251.10
147.10
147.90
75.90
364.00
308.00
284.00
155.90
112.10
136.00
269.00
132.10
137.00
132.10
58.05
85.05
87.05
119.05
136.05
252.10
70.10
44.10
136.05
70.10
70.10
87.15
74.05
136.05
103.05
110.05
112.10
152.05
60.05
184.10
70.05
112.05
44.05
44.05
76.05
88.05
61.05
151.95
112.05
95.10
58.05
152.10
91.05
166.10
136.10
87.05
84.10
84.15
84.10
30.15
152.05
179.10
152.00
110.10
95.05
90.10
136.05
86.05
55.05
86.20
Polarity
+
+
+
+
+
+
+
+
+
+
+
+
+
+
+
+
+
+
+
+
+
+
+
+
+
+
+
+
+
+
+
+
+
+
+
+
+
+
+
+
+
+
+
+
+
+
+
+
+
+
0.99
0.99
0.99
0.98
0.99
0.99
0.99
0.99
0.99
0.99
0.99
0.99
0.99*
0.99
0.99
0.99*
0.99
0.99
0.99
0.99*
0.99
0.99
0.99
0.99
0.99*
0.99
0.98*
0.99
0.99
0.99
0.99
0.99*
0.99*
0.99
0.99*
0.99
0.99*
0.99
0.99*
0.99*
0.99
0.99*
0.99
0.99
0.99*
0.99*
0.99
0.99
0.98*
0.99
Name Product ion Precursor ion Linearity (R2)
Inosine
Kynurenine
Leu
L-Norepinephrine
Lys
Met
Methionine-sulfoxide
Nicotinamide
Nicotinic acid
Ophthalmic acid
Ornitine
Pantothenate
Phe
Pro
SAH
SAM
SDMA
Ser
Serotonin
Thr/Homoserine
Thymidine
Thymine
TMP
Trp
Tyr
Uracil
Uridine
Val
2-Oxoglutarate
Allantoin
Cholate
cis-Aconitate
Citrate
FMN
Fumarate
GSSG
Guanine
Isocitrate
Lactate
Malate
NAD
Orotic acid
Pyruvate
Succinate
Taurocholate
Uric acid
Xanthine
No.
51
52
53
54
55
56
57
58
59
60
61
62
63
64
65
66
67
68
69
70
71
72
73
74
75
76
77
78
79
80
81
82
83
84
85
86
87
88
89
90
91
92
93
94
95
96
97
269.10
209.10
132.10
170.10
147.10
149.90
166.00
123.10
124.05
290.10
133.10
220.10
166.10
115.90
385.10
399.10
203.10
105.90
177.10
120.10
243.10
127.10
322.90
205.10
182.10
113.00
245.00
118.10
144.90
157.00
407.20
172.90
191.20
455.00
115.10
611.10
150.00
191.20
89.30
133.10
663.10
155.00
86.90
117.30
514.20
167.10
151.00
137.05
192.05
86.05
152.15
84.10
56.10
74.10
80.05
80.05
58.10
70.10
90.15
120.10
70.10
134.00
250.05
70.15
60.10
160.10
74.15
127.10
54.05
81.10
188.15
136.10
70.00
113.05
72.15
101.10
97.10
343.15
85.05
111.10
97.00
71.00
306.00
133.00
111.10
89.05
114.95
541.05
111.10
87.05
73.00
107.10
123.95
108.00
Polarity
+
+
+
+
+
+
+
+
+
+
+
+
+
+
+
+
+
+
+
+
+
+
+
+
+
+
+
+
-
-
-
-
-
-
-
-
-
-
-
-
-
-
-
-
-
-
-
0.99
0.99
0.99
0.99
0.99
0.99
0.99
0.99
0.99
0.99
0.99
0.99
0.99
0.99
0.98
0.99*
0.99
0.99*
0.99
0.99
0.99
0.99*
0.99*
0.99
0.99
0.99*
0.99
0.99
0.98*
0.98*
0.99**
0.99
0.99*
0.99
0.99**
0.99*
0.99*
0.99*
0.97*
0.99*
0.99*
0.99
0.99*
0.99*
0.99*
0.99*
0.99*
Calibration curve was obtained at a range of concentration from 10 nM to 10000 nM.* Calibration curve was obtained at a range of concentration from 100 nM to 10000 nM.** Calibration curve was obtained at a range of concentration from 1000 nM to 10000 nM.
5
Simultaneous analysis of primary metabolites by triple quadrupole LC/MS/MS using penta�uorophenylpropyl column
Figure 1 MRM chromatogram of 97 compounds
Simultaneous analysis of 99 compounds was performed for heart / liver tissue extracts as biological samples. Figure 2 shows MRM chromatograms of 99 compounds from tissue extracts (liver/heart). In this measurement, 83/97 metabolites were detected from liver tissue extracts and 88/97 metabolites were confirmed from heart tissue extracts. These results show this method is also effective to
simultaneous analysis of biological samples. As shown in the resulting MRM chromatogram, some major peaks were derived from the metabolites which were known to be characteristic to each tissue. Furthermore, this characteristic difference in each tissue was also confirmed in some faint peaks (e.g., cholate, cystine and homocysteine).
Application to tissue extracts as biological samples
0.0 1.0 2.0 3.0 4.0 5.0 6.0 7.0 8.0 9.0 10.0 11.0 12.0
0
500000
1000000
1500000
2000000
2500000
3000000
3500000
4000000
4500000

Simultaneous analysis of primary metabolites by triple quadrupole LC/MS/MS using penta�uorophenylpropyl column
6
We have previously reported simultaneous analysis of 55 metabolites which were related to central carbon metabolic pathway by using ion pairing chromatography at ASMS conference 2013. To evaluate the accuracy of this simultaneous method using PFPP column, we compared the resulting peak area of 25 metabolites, which were covered as targets in both methods. The 25 metabolites are Lysine, Arginine, Histidine, Glycine, Serine, Asparagine, Alanine, Glutamine, Threonine, Methionine, Tyrosine, Glutamate, Aspartae, Phenylalanine, Tryptophan, Cysteine, CMP, NAD, GMP, TMP, AMP, cGMP, cAMP, MES and L-Methionine sulfone as internal standards. Heart tissue extracts were prepared from mice (n=9) according to the
method described above and the aliquots were measured by the simultaneous method using either ion pairing chromatography or PFPP separation system. As a result, we could see the similar trend of elevation/decrease of peak area in metabolites of 20/25 between nine samples. The peak areas between 9 samples of representative metabolites are shown in Figure 3. This result shows that a ratio of areas between 9 samples is kept in both methods. The four metabolites (TMP, cGMP, cAMP and Cysteine) could be hardly detected on simultaneous analysis by alternately ion-paring chromatography or PFPP column. Tryptophan had a faint peak in this experiment and led to the low similarity.
Correlation between PFPP and ion pairing Methods
Figure 2 MRM chromatogram of liver/heart tissue extracts
Liver Tissue
Heart Tissue
0.0 1.0 2.0 3.0 4.0 5.0 6.0 7.0 8.0 9.0 10.0 11.0 12.0
0
5000000
10000000
15000000
20000000
25000000
30000000
0.0 1.0 2.0 3.0 4.0 5.0 6.0 7.0 8.0 9.0 10.0 11.0 12.0
0
1000000
2000000
3000000
4000000
5000000
6000000
7000000
8000000
9000000
10000000
Acetylcarnitine
Creatine
Ophtalmic acid
GSSG
Guanosine
S-Adenosylhomocysteine
GSH
AMP

For Research Use Only. Not for use in diagnostic procedures.The content of this publication shall not be reproduced, altered or sold for any commercial purpose without the written approval of Shimadzu. The information contained herein is provided to you "as is" without warranty of any kind including without limitation warranties as to its accuracy or completeness. Shimadzu does not assume any responsibility or liability for any damage, whether direct or indirect, relating to the use of this publication. This publication is based upon the information available to Shimadzu on or before the date of publication, and subject to change without notice.
© Shimadzu Corporation, 2014
First Edition: June, 2014
www.shimadzu.com/an/
Simultaneous analysis of primary metabolites by triple quadrupole LC/MS/MS using penta�uorophenylpropyl column
Conclusions• The 97 metabolites were separated by PFPP column with high resolution and this method was applied to biological
samples.• The utility of this simultaneous analysis using PFPP column was con�rmed by comparing between PFPP and ion paring
chromatography.
0.0E+00
5.0E+05
1.0E+06
1.5E+06
1 2 3 4 5 6 7 8 9
MES
0.0E+00
5.0E+05
1.0E+06
1.5E+06
2.0E+06
1 2 3 4 5 6 7 8 9
Serine
0.0E+00
1.0E+05
2.0E+05
3.0E+05
4.0E+05
5.0E+05
1 2 3 4 5 6 7 8 9
Threonine
0.0E+00
1.0E+05
2.0E+05
3.0E+05
4.0E+05
5.0E+05
1 2 3 4 5 6 7 8 9
L-Methionine sulfone
PFPP
0.0E+00
2.0E+05
4.0E+05
6.0E+05
8.0E+05
1.0E+06
1 2 3 4 5 6 7 8 9
MES
0.0E+00
5.0E+03
1.0E+04
1.5E+04
2.0E+04
2.5E+04
1 2 3 4 5 6 7 8 9
Serine
0.0E+00
1.0E+04
2.0E+04
3.0E+04
4.0E+04
1 2 3 4 5 6 7 8 9
Threonine
0.0E+00
2.0E+05
4.0E+05
6.0E+05
8.0E+05
1.0E+06
1 2 3 4 5 6 7 8 9
L-Methionine sulfone
Ion pairing
0.0E+00
2.0E+06
4.0E+06
6.0E+06
8.0E+06
1 2 3 4 5 6 7 8 9
Aspartate
0.0E+005.0E+041.0E+051.5E+052.0E+052.5E+053.0E+05
1 2 3 4 5 6 7 8 9
GMP
0.0E+00
5.0E+06
1.0E+07
1.5E+07
1 2 3 4 5 6 7 8 9
AMP
0.0E+00
1.0E+06
2.0E+06
3.0E+06
4.0E+06
1 2 3 4 5 6 7 8 9
Phenylalanine
PFPP
0.0E+00
1.0E+05
2.0E+05
3.0E+05
4.0E+05
5.0E+05
1 2 3 4 5 6 7 8 9
Aspartate
0.0E+001.0E+042.0E+043.0E+044.0E+045.0E+046.0E+04
1 2 3 4 5 6 7 8 9
GMP
0.0E+001.0E+052.0E+053.0E+054.0E+055.0E+056.0E+05
1 2 3 4 5 6 7 8 9
AMP
0.0E+00
1.0E+04
2.0E+04
3.0E+04
4.0E+04
1 2 3 4 5 6 7 8 9
Phenylalanine
Ion pairing
Figure 3 Correlation of peak areas between PFPP and ion-pairing method