Metabolic fingerprinting for diagnosis of fibromyalgia and ... · 1 Metabolic fingerprinting for...
37
Metabolic fingerprinting for diagnosis of fibromyalgia and other rheumatologic disorders Kevin V. Hackshaw a , Didem P. Aykas b , Gregory T. Sigurdson b , Marcal Plans Pujolras b , Francesca Madiai a , Lianbo Yu c , Charles A. T. Buffington d , M. Mónica Giusti b , Luis Rodriguez-Saona b a Department of Internal Medicine, Division of Rheumatology and Immunology, The Ohio State University, Columbus, OH 43210, USA b Food Science and Technology, The Ohio State University, Columbus, OH 43210, USA c Center of Biostatistics and Bioinformatics, The Ohio State University, Columbus, OH 43210, USA d Department of Medicine and Epidemiology, School of Veterinary Medicine, University of California Davis, Davis, California, USA Running head: Bloodspot test for fibromyalgia Keywords: biomarker, Raman spectroscopy, fingerprinting, infrared spectroscopy (IR spectroscopy), fibromyalgia, high‐performance liquid chromatography (HPLC), mass spectrometry (MS), pain a Corresponding Author: Kevin V. Hackshaw, M.D. The Ohio State University 480 Medical Center Drive Room S2056 Columbus, Ohio 43210 +1-614-293-4837 [email protected] http://www.jbc.org/cgi/doi/10.1074/jbc.RA118.005816 The latest version is at JBC Papers in Press. Published on December 6, 2018 as Manuscript RA118.005816 by guest on May 27, 2019 http://www.jbc.org/ Downloaded from
Transcript of Metabolic fingerprinting for diagnosis of fibromyalgia and ... · 1 Metabolic fingerprinting for...

1
Metabolic fingerprinting for diagnosis of fibromyalgia and other rheumatologic disorders
Kevin V. Hackshawa, Didem P. Aykasb, Gregory T. Sigurdsonb, Marcal Plans Pujolrasb, Francesca Madiaia, Lianbo Yuc, Charles A. T. Buffingtond, M. Mónica Giustib, Luis Rodriguez-Saonab
aDepartment of Internal Medicine, Division of Rheumatology and Immunology, The Ohio State University, Columbus, OH 43210, USA bFood Science and Technology, The Ohio State University, Columbus, OH 43210, USA cCenter of Biostatistics and Bioinformatics, The Ohio State University, Columbus, OH 43210, USA dDepartment of Medicine and Epidemiology, School of Veterinary Medicine, University of California Davis, Davis, California, USA
Running head: Bloodspot test for fibromyalgia
Keywords: biomarker, Raman spectroscopy, fingerprinting, infrared spectroscopy (IR spectroscopy), fibromyalgia, high‐performance liquid chromatography (HPLC), mass spectrometry (MS), pain
aCorresponding Author:
Kevin V. Hackshaw, M.D.
The Ohio State University
480 Medical Center Drive
Room S2056
Columbus, Ohio 43210
+1-614-293-4837
http://www.jbc.org/cgi/doi/10.1074/jbc.RA118.005816The latest version is at JBC Papers in Press. Published on December 6, 2018 as Manuscript RA118.005816
by guest on May 27, 2019
http://ww
w.jbc.org/
Dow
nloaded from

1
ABSTRACT
Diagnosis and treatment of Fibromyalgia (FM) remains a challenge owing to the lack of reliable biomarkers. Our objective was to develop a rapid biomarker-based method for diagnosing FM by using vibrational spectroscopy to differentiate patients with FM from those with Rheumatoid Arthritis (RA), Osteoarthritis (OA) or Systemic Lupus Erythematosus (SLE), and to identify metabolites associated with these differences. Blood samples were collected from patients with a diagnosis of FM (n=50), RA (n=29), OA (n=19), or SLE (n=23). Bloodspot samples were prepared, and spectra collected with portable FT-IR and FT-Raman microspectroscopy and subjected to metabolomics analysis by ultra-HPLC (uHPLC), coupled to a photodiode array (PDA) and tandem MS/MS. Unique IR and Raman spectral signatures were identified by pattern recognition analysis and clustered all study participants into classes (FM, RA and SLE) with no misclassifications (p < 0.05, and interclass distances > 2.5). Furthermore, the spectra correlated (R= 0.95 and 0.83 for IR and Raman, respectively) with FM pain severity measured with fibromyalgia impact questionnaire revised version (FIQR) assessments. Protein backbones and pyridine-carboxylic acids dominated this discrimination and might serve as biomarkers for syndromes such as FM. uHPLC-PDA-MS/MS provided insights into metabolites significantly differing among the disease groups, not only in molecular m/z+ and m/z- values but also in UV-vis chromatograms. We conclude that vibrational spectroscopy may provide a reliable diagnostic test for differentiating FM from other disorders and for establishing serologic biomarkers of FM-associated pain.
This study was conducted under IRB approval 2015H0312.
INTRODUCTION
Fibromyalgia (FM) is a member of a class of disorders called “central sensitivity syndromes,”(1–4) or “overlapping chronic pain conditions”(5), all of which present significant diagnostic and therapeutic challenges to medicine. FM remains undiagnosed in as many as 3 out of 4 people with the condition, with an average of 5 years between the time of onset of symptoms to diagnosis, resulting in delayed and potentially suboptimal treatment (6). FM appears to result from variable combinations of sensitization of the central threat response system, dysregulation of neuroendocrine function, and abnormal nociceptive processing. The syndrome manifests clinically as widespread pain and tenderness in reproducible anatomic locations accompanied by associated sleep disturbances and a variety of comorbid conditions (2, 3, 7–10).
Fibromyalgia is the most common cause of chronic widespread pain in the United States (3, 7, 8), and females are 4 to 9 times more likely to be diagnosed with FM than are men (7, 8). Current evidence suggests that FM belongs to a much larger continuum of chronic pain syndromes, which includes chronic fatigue syndrome, irritable bowel syndrome and other functional GI syndromes, temporomandibular syndrome, migraine, interstitial cystitis/bladder pain syndrome, among others, all with considerable overlap (1, 3, 7, 8). Estimates suggest that at least 2% of the adult population in the United States may be affected by FM, with an overall annual impact considering work absenteeism, lost productivity, and health care rivaling the costs of rheumatoid arthritis (11–13).
The diagnosis of FM has evolved from relying primarily on evidence for multiple painful tender points as promulgated in the 1990 American College Rheumatology (ACR) criteria (14) to one that is more globally encompassing
by guest on May 27, 2019
http://ww
w.jbc.org/
Dow
nloaded from

Bloodspot test for fibromyalgia
and based on a combination of pain plus a multitude of other symptoms. The 2010 ACR criteria included symptom severity criteria coupled with pain and other somatic symptoms (10), and in 2016 the FM criteria was further refined to add additional distinctions to help avoid misclassifying patients with regional myofascial pain syndromes as having FM (9). Fibromyalgia is currently diagnosed on the basis of the following findings: 1. presence of generalized pain, defined as pain in at least 4 of 5 regions of the body; 2. symptoms present at a similar level for at least 3 months; 3. widespread pain index (WPI) ≥ 7 and symptom severity scale (SSS) score ≥ 5 or WPI of 4–6 and SSS score ≥ 9; and 4. the diagnosis of FM is valid irrespective of other diagnoses. Some studies have shown that a diagnosis alone improves FM patients’ health satisfaction, with fewer symptoms reported over the long term and reductions in the cost of medical resource utilization by patients (12, 13).
Unfortunately, no reliable diagnostic test for FM exists. Such a test would be a significant step towards earlier diagnosis of and intervention for this condition, helping to improve patient outcomes, contain health care and/or legal costs, and potentially provide clues to the etiopathogenesis of the syndrome. Our group has recently reported the first metabolomics approach in two central sensitivity syndromes, interstitial cystitis (15) and FM (16). We isolated a low-molecular weight fraction (LMF) of human blood using centrifugal ultrafiltration through a semi-permeable membrane (filtrate), leaving high molecular solutes in the retentate (16). The LMF was analyzed using infrared microspectroscopy, which provided a unique spectral pattern based on functional groups (e.g., methyl, carbonyl, indole etc.) in serum samples that vibrated in predictable ways after absorbing infrared light. Pattern recognition analysis of the spectra allowed us to discriminate FM patients from
those with RA or OA that appeared to be metabolically similar (16). The approach did not conclusively identify the metabolites responsible for the diagnostic spectral differentiation, although changes in tryptophan catabolism seemed to be involved (16). Another metabolomics approach has involved liquid chromatography/quadrupole–time-of-flight/mass spectrometry (LC/Q-TOF/MS) with multivariate statistical analysis aimed at discriminating FM (n=22) patients and controls (n=21) from blood plasma analysis (17). According to the investigators, lysophosphocholine dominated the metabolite profile, suggesting that there may be additional potential biomarkers for FM diagnosis (17). Recently, Malatji and others (18) used NMR metabolomics to identify a diagnostic biomarker profile for FM from urine, identifying metabolites associated with indicators of pain and fatigue symptoms (succinic acid, taurine and creatine) and perturbations in the gut microbiome (hippuric, 2-hydroxyisobutyric and lactic acids).
Vibrational spectroscopy technology currently is being developed for routine clinical use in many areas of medicine (19), including cancer (20–22), urology (23), and rheumatology (24, 25). Vibrational (mid-IR and Raman) spectroscopy fingerprinting capabilities offer rapid, high-throughput, and non-destructive analysis of a wide range of sample types producing a characteristic chemical ‘fingerprint’ with a unique signature profile. Raman spectroscopy offers an attractive fingerprinting technique because of the little or no sample preparation requirement, non-contact and non-destructive capabilities, weak Raman response of water allowing measurement in aqueous solutions and on substances enclosed in transparent containers, such as bags or vials, without opening them (26). However, a major hurdle in biological samples has been the interference of fluorescence. Traditional Raman handheld units are equipped with visible laser
2
by guest on May 27, 2019
http://ww
w.jbc.org/
Dow
nloaded from

Bloodspot test for fibromyalgia
excitation wavelengths, such as 532 and 785nm, to increase the Raman scattering signal. Unfortunately, these shorter excitation wavelengths increase fluorescence background, which obscure the Raman signal. To reduce the fluorescence limitation, Raman spectrometers can be equipped with a longer excitation wavelength (NIR, 830, 1064 nm), but this results in diminished Raman signal intensity. To address this signal limitation, a new generation of semiconductor detectors (InGaAs array) recently became available (27). In addition, surface-enhanced Raman spectroscopy (SERS) phenomena enhances the Raman signal (106–107) due to the large electromagnetic field induced by localized surface plasmon resonance by using metallic nanostructures (typically gold and silver) that are in proximity of the metal surface. Such refinements result in lower limits of detection of SERS in the ppb or single molecule level (28).
Advances in instrumentation and pattern recognition techniques are making this technology ideal for rapid screening and analysis of biological samples, permitting the separation of spectra into discrete clusters that permit classification of individuals based on subtle physiological differences. Pattern recognition solves the class-membership problem (29) by using unsupervised and supervised methods. In unsupervised techniques, there is no information available prior to analysis in regard to group structure of the samples (30). These techniques usually are applied to discover sample groupings within data, reveal any abnormal spectra in a data set, and to determine the natural variation among the samples. Principal component analysis (PCA) is used to reduce large datasets into a smaller number of orthogonal variables called principal components (PCs), which carry the major variance of the original variables. Thus, PCA reduces the dimensionality of data sets while simultaneously retaining the information present in the data (29). Supervised
classification uses a group of samples as a training set, in which the categories of each sample are known prior to analysis. Training set performance is then evaluated by comparing the predictions made by the model to the true categories of the samples used for validation (31). Supervised classification methods include K-Nearest Neighbors (k-NN), Soft Independent Modeling of Class Analogy (SIMCA), Linear Discriminant Analysis (LDA), Partial Least-Squares Discriminant Analysis (PLS-DA). Among the most common of the supervised techniques is SIMCA, which allows for the visualization of clustering patterns among samples (31). In SIMCA, a PCA is performed on each class in the data set, and a sufficient number of principal components are retained to account for most of the variation within each class (32). An important feature of SIMCA is that it only assigns an unknown sample to the class for which it has a high probability. If the residual variance of a sample exceeds the upper limit for every modeled class in the data set, the sample is not assigned to any of the classes represented in the data set.
The objectives of the current study were to develop simple, rapid, sensitive, and robust methods for the diagnosis of FM based on highly characteristic mid-infrared and Raman “fingerprint” from dried blood spots of peripheral blood samples obtained by finger-stick combined with supervised pattern recognition techniques. In addition, we evaluated the identification capabilities of LC-MS/MS to assist in a metabolomics approach for biomarker(s) elucidation, and to provide information to better understand the etiology and pathogenesis of FM.
RESULTS
Clinical Characteristics of Subjects:
The clinical characteristics of subjects with FM are shown in Table 1. Bloodspots were
3
by guest on May 27, 2019
http://ww
w.jbc.org/
Dow
nloaded from
Bloodspot test for fibromyalgia
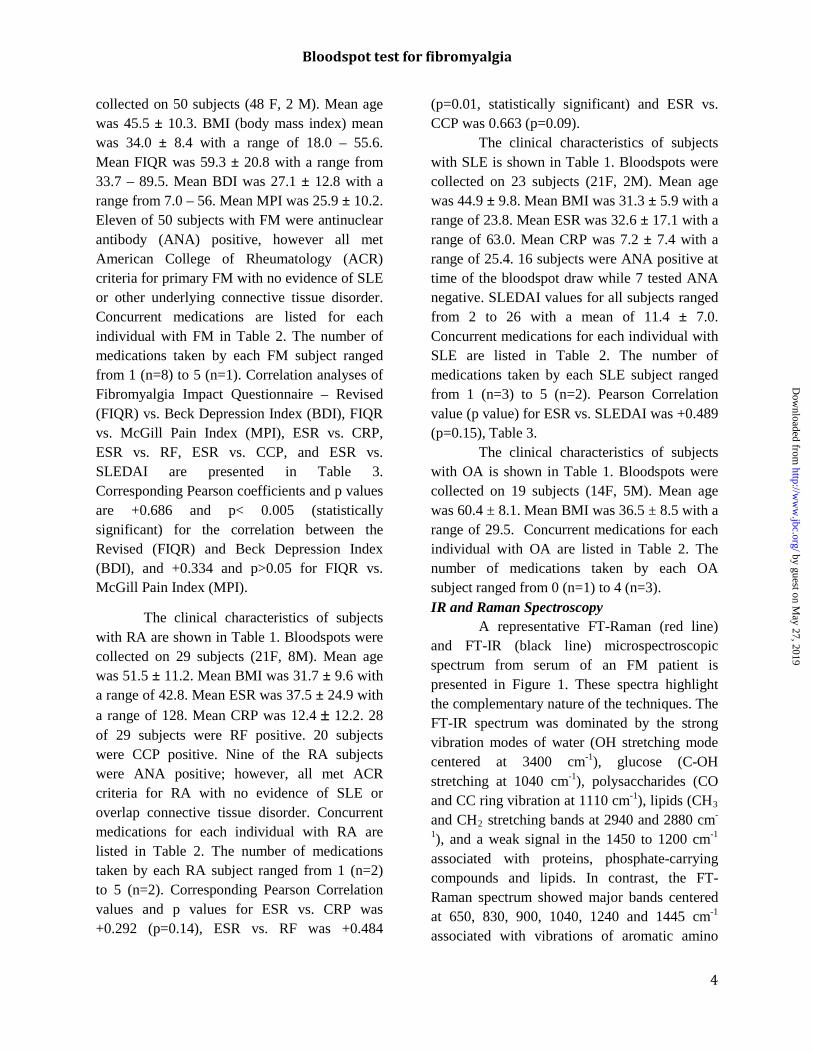
collected on 50 subjects (48 F, 2 M). Mean age was 45.5 ± 10.3. BMI (body mass index) mean was 34.0 ± 8.4 with a range of 18.0 – 55.6. Mean FIQR was 59.3 ± 20.8 with a range from 33.7 – 89.5. Mean BDI was 27.1 ± 12.8 with a range from 7.0 – 56. Mean MPI was 25.9 ± 10.2. Eleven of 50 subjects with FM were antinuclear antibody (ANA) positive, however all met American College of Rheumatology (ACR) criteria for primary FM with no evidence of SLE or other underlying connective tissue disorder. Concurrent medications are listed for each individual with FM in Table 2. The number of medications taken by each FM subject ranged from 1 (n=8) to 5 (n=1). Correlation analyses of Fibromyalgia Impact Questionnaire – Revised (FIQR) vs. Beck Depression Index (BDI), FIQR vs. McGill Pain Index (MPI), ESR vs. CRP, ESR vs. RF, ESR vs. CCP, and ESR vs. SLEDAI are presented in Table 3. Corresponding Pearson coefficients and p values are +0.686 and p< 0.005 (statistically significant) for the correlation between the Revised (FIQR) and Beck Depression Index (BDI), and +0.334 and p>0.05 for FIQR vs. McGill Pain Index (MPI).
The clinical characteristics of subjects with RA are shown in Table 1. Bloodspots were collected on 29 subjects (21F, 8M). Mean age was 51.5 ± 11.2. Mean BMI was 31.7 ± 9.6 with a range of 42.8. Mean ESR was 37.5 ± 24.9 with a range of 128. Mean CRP was 12.4 ± 12.2. 28 of 29 subjects were RF positive. 20 subjects were CCP positive. Nine of the RA subjects were ANA positive; however, all met ACR criteria for RA with no evidence of SLE or overlap connective tissue disorder. Concurrent medications for each individual with RA are listed in Table 2. The number of medications taken by each RA subject ranged from 1 (n=2) to 5 (n=2). Corresponding Pearson Correlation values and p values for ESR vs. CRP was +0.292 (p=0.14), ESR vs. RF was +0.484
(p=0.01, statistically significant) and ESR vs. CCP was 0.663 (p=0.09). The clinical characteristics of subjects with SLE is shown in Table 1. Bloodspots were collected on 23 subjects (21F, 2M). Mean age was 44.9 ± 9.8. Mean BMI was 31.3 ± 5.9 with a range of 23.8. Mean ESR was 32.6 ± 17.1 with a range of 63.0. Mean CRP was 7.2 ± 7.4 with a range of 25.4. 16 subjects were ANA positive at time of the bloodspot draw while 7 tested ANA negative. SLEDAI values for all subjects ranged from 2 to 26 with a mean of 11.4 ± 7.0. Concurrent medications for each individual with SLE are listed in Table 2. The number of medications taken by each SLE subject ranged from 1 (n=3) to 5 (n=2). Pearson Correlation value (p value) for ESR vs. SLEDAI was +0.489 (p=0.15), Table 3.
The clinical characteristics of subjects with OA is shown in Table 1. Bloodspots were collected on 19 subjects (14F, 5M). Mean age was 60.4 ± 8.1. Mean BMI was 36.5 ± 8.5 with a range of 29.5. Concurrent medications for each individual with OA are listed in Table 2. The number of medications taken by each OA subject ranged from 0 (n=1) to 4 (n=3). IR and Raman Spectroscopy A representative FT-Raman (red line) and FT-IR (black line) microspectroscopic spectrum from serum of an FM patient is presented in Figure 1. These spectra highlight the complementary nature of the techniques. The FT-IR spectrum was dominated by the strong vibration modes of water (OH stretching mode centered at 3400 cm-1), glucose (C-OH stretching at 1040 cm-1), polysaccharides (CO and CC ring vibration at 1110 cm-1), lipids (CH3 and CH2 stretching bands at 2940 and 2880 cm-
1), and a weak signal in the 1450 to 1200 cm-1 associated with proteins, phosphate-carrying compounds and lipids. In contrast, the FT-Raman spectrum showed major bands centered at 650, 830, 900, 1040, 1240 and 1445 cm-1 associated with vibrations of aromatic amino
4
by guest on May 27, 2019
http://ww
w.jbc.org/
Dow
nloaded from

Bloodspot test for fibromyalgia
acids groups, glycans, collagen, and mineral content of samples. Although FT-IR and Raman spectroscopies measure the vibrational energies of molecules, they are governed by different selection rules. FT-IR measures the absorption of the infrared light by the sample due to changes in the dipole moment of the molecule, whereas Raman is based on the inelastic scattering of light caused by the changes in polarizability of the molecule (33). Due to the differences in vibrational activity between Raman and FT-IR, some modes are active in both spectroscopies, but others are only active in Raman or FT-IR. In general, symmetric stretches and bends tend to be Raman active while vibrations involving strong dipole moments are more strongly observed by IR spectroscopy. Thus, carbonyl, hydroxyl or amine stretching vibrations are usually very strong in an FT-IR spectrum, whereas vibrations of carbon double or triple bonds and aromatic groups are very strong in a Raman spectrum (34).
SIMCA’s class projection (Figure 2 and Table 4) generated from FT-IR spectra resulted in distinct clustering of the specimen samples according to their disease class (FM (n=30), RA (n=20) or SLE (n=30)). The 3D plot was used to visualize clustering among samples (sample patterns, groupings or outliers), with each symbol in the cluster representing the spectrum of each sample. The class boundaries (ellipse surrounding each cluster) are defined using a 95% confidence interval projected on the first 3 principal components and showed well separated classes according to the clinical diagnosis of the subjects. Cross validation identified 3 (FM class), 4 (RA class), and 4 (SLE class) PCs that explained most of the variance in the data set, minimizing the risk of overfitting and thus generating a robust biomarker model in the training process. A statistic that provided information regarding the ability of SIMCA to discriminate among classes was the interclass
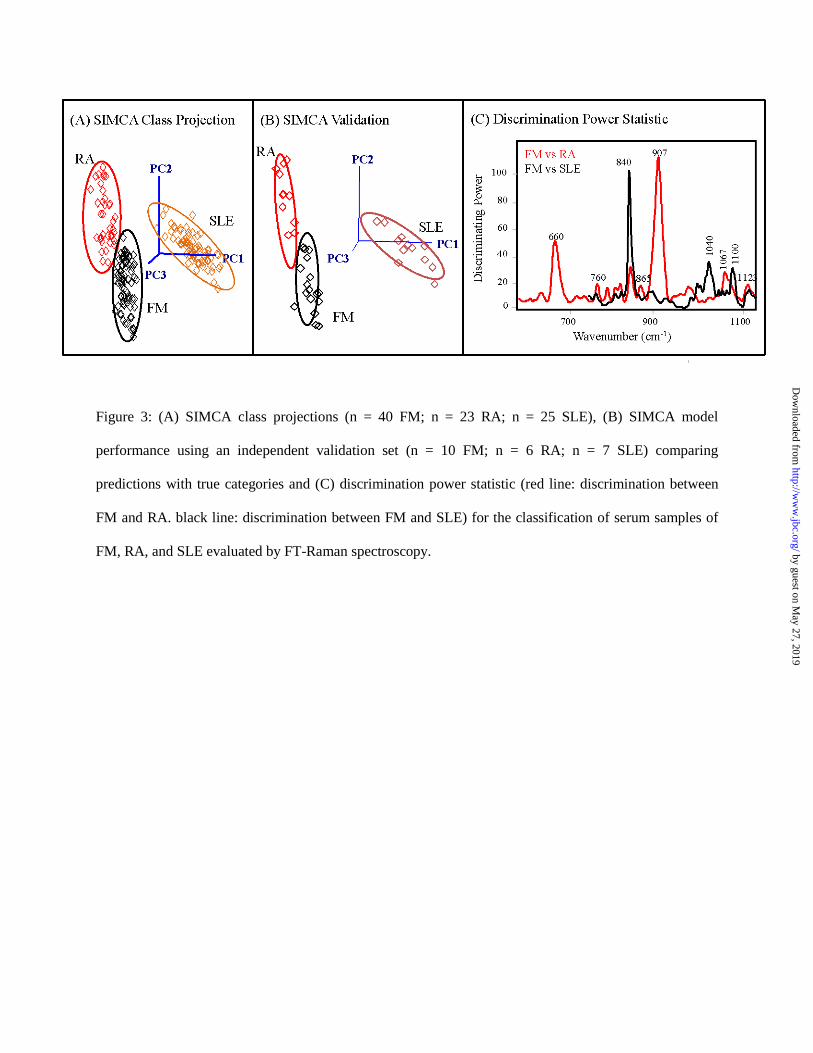
distance (ICD), a measurement (Mahalanobis distance between the centroids of the classes) statistically derived in the multivariate space that indicates the distance between clusters. A class distance greater than 3.0 is regarded as significant to differentiate 2 groups of samples as different classes (35, 36). Interclass distances (ICD) were largely independent of one another with ICD values of 4.5 (FM and RA), 4.0 (FM and SLE), and 3.5 (RA and SLE), and no class overlapping (Table 4). Furthermore, the misclassification statistic showed 100% success in classifying samples. SIMCA’s discrimination power (DP) statistic (Figure 2) identified the most discriminating variables (i.e., candidate biomarkers) between classes; the greater the discrimination power, the more a variable influences the classification (35). Major infrared bands responsible for the grouping of the 3 classes were in the region of 1700 and 1400 cm-1 corresponding to amide I (1640 cm-1) and amide II (1555 cm-1) vibrations, and contributions from both lipids and proteins (δasCH2 and CH3). SIMCA analysis of the discriminating power for FM and RA subjects (Figure 2) showed the unique contributions of aliphatic backbone conformations (1432 cm-1; δsCH2) of proteins and aromatic groups (1515 cm-1). Lechowicz and others (24) reported that the band at 1424 cm-1 was the most effective in distinguishing RA from non-RA individuals. The authors indicated that the band at 1430 cm-1 has been assigned to H-C-H and O-C-H in-plane bending vibration of proteins containing proline and tryptophan amino acids (24). The signal at 1515 cm-1 is consistent with the C=C stretch of aromatic compounds (36). SIMCA analysis of Raman spectra (Figure 3A) showed marked biochemical differences of SLE (5 PCs) subjects from FM (5 PCs) and RA (4 PCs) subjects, with interclass distances of 12 units indicating enormous differences among these classes. On the other hand, the model showed marginal discrimination
5
by guest on May 27, 2019
http://ww
w.jbc.org/
Dow
nloaded from

Bloodspot test for fibromyalgia
between FM and RA (ICD= 1.3), while the cross-validated model gave no miss-classifications. The 3D class projection (Figure 3A) showed some cluster overlapping between FM and RA samples, but this overlapping can be misleading since the graph does not account for the relevant variance left out by using more than 3 PCs and thus the 3D graph cannot realistically display the multidimensional nature of the model. The fact that the FM and RA clusters are closer in space reflects more similar Raman patterns compared to SLE; thus, a 2-class SIMCA analysis generated for FM vs RA subjects improved the cluster separation. It resulted in an interclass distance of 2.5 by using 5 PCs and resulted in models with zero miss-classification. Furthermore, the predictive accuracy of the model generated with Raman spectra was evaluated by using an external validation set (Figure 3B) providing correct class membership for all subjects and demonstrating the robustness and sensitivity of the model for diagnosis of FM and related rheumatic syndromes.
The 3-class SIMCA model showed that the discriminating region (620-1120 cm-1) was dominated by the bands centered at 660 and 907 cm-1, characteristic of pyridine ring vibrations and C–C skeletal (protein backbone) stretching modes of alanine (37), respectively (Figure 3C, red line). Interestingly, a 2-class SIMCA analysis of FM and RA subjects (Figure 3C, black line) revealed that most of the variable importance in the prior model was influenced by SLE sample characteristics. The discriminating power plot (Figure 3C, black line) for FM vs RA was dominated by a band centered at 840 cm-1 attributed to tyrosine residues in proteins (38). Multivariate analyses of the infrared and Raman spectra yielded robust models indicating that peptides in the filtered blood fluid are effective diagnostic markers. In addition, the pattern recognition analysis highlighted the importance of aromatic and carboxylic acids
molecules, which might support the association between phenolic and acidic amino acid groups as candidate molecules that include tryptophan and its metabolites. Vibrational Spectroscopy Explains Pain Intensity Outcomes Figure 4 shows the correlation between the FT-IR spectral data from bloodspot cards collected from 20 patients and their corresponding FM disease activity by using self-reported disease activity (FIQR) scores. The dependent variable (FIQR scores) was transformed by using the logarithmic function (Log FIQR) and partial least squares regression (PLSR), a multivariate linear regression technique, was used to develop a predictive model that gave excellent linear relationship (R= 0.94) and standard error of cross validation (SECV) of 1.1 (100.041) for FIQR scores (35-90 range) using the first 4 latent variables (Figure 4). The SECV evaluates the predictive accuracy of the PLS model combined with the sensitivity of the model to individual spectra in the training set, in other words it measures the model’s ability to predict new samples. Figure 4 shows the regression vector for the PLSR model, estimated weights that are applied to the variables while fitting the bilinear relationship between independent variables (spectra) and dependent variables (scores). The bands correlating to FIQR disease activity were centered at 1625, 1580 and 1522 cm-1. The band that was most important in explaining FIQR scores was associated with the stretching frequencies of the imidazolium ring with a typical strong peak centered at about 1580 cm-1 corresponding the functional group -C=N-. The band centered at 1522 cm-1 corresponds to the N-H bending in plane and C-N stretching of amino acids (amide II) while the signal at 1646 cm-1 is attributed to the contribution of the α-helix secondary structure of the amide I frequency (41).
6
by guest on May 27, 2019
http://ww
w.jbc.org/
Dow
nloaded from

Bloodspot test for fibromyalgia
Similarly, Raman spectral data from bloodspot cards collected from 30 patients were correlated to FM disease activity by using the Log transformation of the self-reported disease activity (FIQR) scores. PLSR predictive model gave adequate linear relationship (R= 0.88) and standard error of cross validation (SECV) of 1.1 (100.043) for FIQR scores (45-90 range) using the first 4 latent variables (Figure 5). The bands correlating to FIQR disease activity (Figure 5) were centered at 1450 cm-1 and in the region from 2000 and 2200 cm-1 which are associated with CH2 and CH3 deformation in proteins and the contribution of CN sp1 bonds, respectively (42). Overall, PLSR regression models for disease activity showed similar fit with ATR-IR than Raman after logarithmic transformation of the FIQR scores. The FT-Raman microscope technique limited sources of spectral variation associated with changes of source (laser) power at the sample, optical pathlength, matrix effects, and sample position. Our vibrational spectroscopy approach generated data showing potential to rapidly score physiological symptoms of patients from spectral data. Although we need to extend these studies to a larger sample size, the results strongly suggest that vibrational spectroscopy can identify state as well as trait markers of disease. Metabolomic Analysis by uHPLC-PDA-MS/MS From each disease group, 10 randomly selected samples were analyzed by uHPLC-PDA-MS/MS both with and without the use of a C18 column. Without the use of a column, m/z+ values ranged 74.75 – 365.40 under positive ion detection; 34 predominant ions were detected (Figure 6). Under negative ion detection, 19 major ions were detected ranging 79.55 – 343.40 (Figure 6). None of the detected m/z values were unique to a specific disease group under positive or negative ion detection, or their relative intensities. However after determining ratios of
m/z intensities to the mean, the proportions of some select ions were significantly different amongst the disease groups (Figure 6 and Table 5). Under positive ion mode detection, the ratios of m/z+ 74.75 and 184.85 differed significantly according to ANOVA (Table 5). For all groups, the m/z+ 184.85 was also in the greatest intensity and therefore, was selected for product ion scanning. The major fragments of this ion were, in order of decreasing relative intensity, 45.65 (100%), 57.50 (75%), 30.05 (45%), 32.05 (13%), 42.20 (8%), 27.90 (7%), and 93.00 7%). To attempt to identify this compound, the m/z+ of the intact compound and its fragments were searched in The Human Metabolome Database (39). However, no comparative mass spectra strongly matched the spectrum of this m/z+. Identification of this m/z+ and others will require subsequent evaluation and/or development of a MS/MS spectral library. Despite the lesser amount of detected ions under negative mode, the ratios of 3 specific m/z- differed significantly: 95.65, 217.90, and 290.15 (Table 5). Of these m/z-, 95.65 showed the greatest intensity. Using the direct injection approach minimizes the loss of any compound of potential interest. However, it also risks that some components from the sample or solvents may mask potential target analytes that could differentiate the different disease groups. To enhance resolution and detection of other metabolites, the sample extracts were analyzed by HPLC-PDA-MS/MS after separation on a C18 column. In terms of general chromatographic appearance, all samples showed a large abundance of very polar compounds, observed as large peaks in eluting from the column in the first 1.5 min (Figure 7). Under the uHPLC conditions used, the void volume of the column was ~0.35 min, corresponded to the observed peak 1. The spectrograms of peak 2 and 3 showed these to be
7
by guest on May 27, 2019
http://ww
w.jbc.org/
Dow
nloaded from

Bloodspot test for fibromyalgia
result of metabolites from each sample; there was co-elution observed between of these peaks further evidenced by similar absorbance spectra and λmax (Figure 7). Importantly, the use of a column enhanced analyte detection by MS/MS. The MS spectrum of peak 2 showed 42 m/z+, ranging 104.20 – 268.85; of these ions, the ratios of 5 significantly difference among the disease groups (Table 5). As observed from direct injection, the ratio of the intensities of m/z+ 184.85 was significantly different between the different disease groups. With the use of the C18, this compound was demonstrated to be very polar. Similarly for peak 3, 34 m/z+ were detected (104.20 – 348.10), with 5 of these significantly differing among the disease groups (Table 5).
Also observed in the chromatograms of (Figure 7), HPLC utilizing a C18 column also effectively separated some less polar metabolites (~12 – 18 min). To improve visualization of these peaks, the max-plot chromatograms (detection 260 – 450 nm) from 7 – 22 min was enlarged and presented as Figure 8. All 4 disease groups showed similar PDA chromatographic patterns, with the same number of major peaks. Peaks X, Y, and Z appeared to be unique to disease groups RA and SLE; however, these peaks were only observed in 1-2 samples from each of these groups, and therefore were considered outliers. Detection of absorbance from 260 – 450 nm was selected to encompass as many wavelengths absorbed by these compounds while reducing noise from far UV region. The absorbance spectrum of peak 12 showed the greatest λmax of 397 nm, entering the visible region of light; whereas most peaks showed λmax of 260 – 280 nm, typical of aromatic rings. Peak 13 also showed a comparatively larger λmax of 294 nm (Figure 8). Of particular note, peak 13 of the FM group visually appeared to be in a lower proportion to the other peaks as compared to the different disease groups. Multivariate analysis of these
chromatograms also showed significant different between the disease groups, interclass distances ≥ 2.2 (Table 6, Figure 9). Class projection resulted in the distinct clustering of the 4 disease groups. The discriminating region of these UV-Vis chromatograms ranged 14 – 17 min, correlating well with the visually observed differences, such as peak 13 (Figure 8). Peaks at 5 different retention times were identified as discriminating variables.
DISCUSSION
This study assessed the feasibility of vibrational spectroscopy to differentiate individuals with FM from those with several other rheumatic conditions including RA, SLE, and OA. In addition, we wanted to determine if various degrees of severity of FM were biochemically distinguishable from each other using a novel means of rapid detection. Advantages of such a methodology, if developed and honed to reproducibility, would be a capability for identifying specific treatment subsets for FM as well as identifying new targets as differentiated from each other metabolically by spectroscopy (UV-vis, MS, and vibrational). The results of the study found a unique Raman spectral signature that clustered all subjects into classes (FM, RA, and SLE) with no misclassifications. The discriminating power was dominated by vibrations of the backbone in proteins and nucleic acids, and also indicated mineral differences in blood as biomarker. In addition to Raman (differentiating FM from SLE and RA), HPLC-PDA-MS/MS also distinguished between disease groups with certain metabolites existing in significantly different proportions which resulted in discriminating UV-Vis chromatograms. Furthermore, preliminary studies showed the capability of Raman to differentiate between severe and mild FM based on FIQR disease assessments. Two recent studies have identified the value of subcategorizing patients with FM
8
by guest on May 27, 2019
http://ww
w.jbc.org/
Dow
nloaded from

Bloodspot test for fibromyalgia
based on similar symptoms with the rationale being that such groupings could provide a means towards more individualized clinical evaluation and intervention (40, 41). Therefore, FM appears to be characterized by distinctive subsets which further studies may distinguish as biochemically distinct.
Through the use of uHPLC-PDA-MS/MS, differences in the metabolic profiles of serum samples from patients with FM, RA, OA, and SLE were observed in terms of very polar and less polar compounds which may be correlated to the Raman and IR findings which differentiated diseases groups based on aromatic amino acids groups, glycans, collagen, and mineral content of samples. Differences in early eluting metabolites were observed from mass spectral data. Generally samples from FM and OA patients appeared to be share more metabolic similarities when compared to those from RA or SLE groups; this was observed in both the more polar mass spectral data (Table 5) and also in the later eluting components of the UV-Vis chromatograms (Figure 8). This was in partial contrast to previous findings in which RA and OA groups were metabolically similar and distinctive from the FM group (16). Some of the metabolites that most distinguished FM from the other disease groups included heme, cysteine–glutathione disulfide, and NAD+ (16). However, these larger metabolites were not found in significant proportions under the conditions of this study. Metabolites differentiating between disease groups were small compounds with m/z+ < 300
Less polar components, eluting later during the uHPLC runs, were also found to differentiate between the disease groups. UV-Visible absorbance of 280 nm was common to many of these separated peaks, which is typically of compounds composed of aromatic rings. Previous works have found some of the distinguishing metabolites of FM patients to be
related tryptophan metabolism and catabolism (16, 42). Due to its aromatic moiety, tryptophan is one of the few amino acids capable of absorbance of 280 nm and is actually responsible for ultraviolet light absorbance by many proteins. Perhaps the differences in the UV chromatograms amongst the disease groups may be partially result of these amino acids metabolites or derivatives. These findings suggest the combination of HPLC-PDA-MS/MS analytical methods may be useful in the diagnosis of FM from different classes of “central sensitivity syndromes”.
In our current study, we recorded the medications that patients were on at the time of their blood spot analysis for all disease conditions. There was no obvious medication signal/effect that could be discerned by spectroscopy or MS/MS amongst the current cohort, however, the effect of medications on these analyses was beyond the scope of this current study. It would require medication free control populations with similar demographic (age, BMI, sex, etc) and clinical features (FIQR, BDI, MPI) to be compared to a correspondingly matched population on a specific medication(s) in order to determine what medication effects might have on these results. It would be of interest to determine potential static and prospective changes over time elicited by various medication groups (tricyclics, serotonin and norepinephrine reuptake inhibitors, etc.).
There is a wide range of opinions on FM amongst physicians. Many physicians lack the necessary training to accurately diagnose this condition. As a result, patients with poorly explained symptoms are often lumped into the FM category although their clinical features might fit other diagnoses better. Examples might include generalized anxiety disorder, somatoform disorder, restless leg syndromes, amongst many others. Some physicians do try to adhere to the updated classification criteria for
9
by guest on May 27, 2019
http://ww
w.jbc.org/
Dow
nloaded from

Bloodspot test for fibromyalgia
diagnosis of FM (1, 9, 10, 14) while still another segment of the physician population displays a level of skepticism about the disease that dissuades many patients from even seeking a diagnosis due to concern that their symptoms are thought to be entirely “psychological”. Despite adoption of the newly revised criteria by many, it is increasingly recognized that use of these criteria for diagnosis is fraught with error due to a significant level of subjectivity in the survey elements (WPI and SSS) (9).
For physicians, a diagnosis of FM often provides an explanation for difficult to understand symptoms. For patients, a diagnosis of FM may offer them some confirmation that symptoms are real and not psychological. The development of new criteria for FM has helped somewhat with uniformity of clinical diagnosis in published reports. Unfortunately, for the majority of patients with FM, the updated diagnostic criteria still fail in regards to providing an objective measure confirmatory of disease, which is what many FM patients are seeking. Consequently, despite revised criteria, there remains no gold standard for defining or diagnosing FM. Results from the 2012 US National Health Interview Survey revealed that most patients who received a diagnosis of FM from a health professional did not satisfy published FM criteria (43). In addition, use of the updated diagnostic criteria has not translated into health care cost savings. We surmise that the reason for this is that true cost savings (such as avoiding unnecessary testing like MRI, CT Scan, repeated blood testing, etc.) will only occur once we have discovered a reproducible biomarker that is widely accepted amongst practitioners and patients. Hughes et al (44) showed that initial diagnosis of FM lead to modest decreases in health care costs for 1 – 2 years post diagnosis but those initial savings dissipated and health care costs and utilization escalated subsequently well beyond pre-diagnosis levels. The authors theorized that the
reason why costs rose is because patients remained in pain post diagnosis and there is no “truly effective treatment for FM (44). Alternatively, we surmise that many patients feel the “diagnosis” is still subjective and satisfaction may never be achieved for the great majority until we have a widely accepted gold standard or biomarker. Unfortunately, current FDA approved therapies for FM have not been able to show superior efficacy over mindfulness techniques or health coaching (45, 46).
Thus, our studies have great importance both from development of a reproducible biomarker as well as identifying potential new therapeutic targets for treatment. With advancements in the methodologies described in this manuscript and subsequent identification of differentiating metabolites, techniques for treatment of FM and related disorders may be advanced.
MATERIALS AND METHODS
Patients
All studies involving human subjects were approved by The Ohio State University Institutional Review Board and abide by the Declaration of Helsinki principles. Following IRB approval (2015H0312), blood samples were obtained from patients with FM (n = 50), RA (n = 29), SLE (n = 23), and OA (n = 19) at The Ohio State University Rheumatology clinics located at Care Point East. Criteria for diagnosis of FM included: age 18–80 with history of FM and meeting current revised ACR criteria (9, 10). We also required that no physical trauma or infection prior to the onset of FM could be identified as the primary initiating factor in their FM. The diagnosis of RA and SLE were based on ACR criteria for each disorder (47, 48). Patients with FM, RA, SLE, and OA were screened using current or past history of exclusionary medical and psychiatric diagnoses (e.g., cancer, or connective tissue disorder,
10
by guest on May 27, 2019
http://ww
w.jbc.org/
Dow
nloaded from
Bloodspot test for fibromyalgia
multiple sclerosis, congestive heart failure, diabetes, bipolar disorder, melancholic depression). In addition, samples were collected only from patients who had been under the care of the clinician investigator (KVH) for at least 6 months. This additional requirement was applied to provide a further safeguard for the accuracy of the diagnosis of patients to assure that we obtained samples from patients whose disorder has been correctly diagnosed.
Questionnaires:
Self-reported symptoms were obtained from all subjects. The Revised Fibromyalgia Impact Questionnaire (FIQR) is a 10 item self-rating instrument that measures physical functioning, work status, depression, anxiety, sleep, pain, stiffness, fatigue, and well-being. It is the most frequently used assessment tool for gauging overall impact of FM on quality of life (49).
The McGill Pain questionnaire (MPQ) is a reliable and valid instrument for indicating both descriptive aspects of pain as well as pain intensity. This tool is used to assess the level of generalized pain severity for subjects. This instrument uses sensory, affective and evaluative word descriptors to measure patient’s subjective pain experience. Scores are obtained for three classes of verbal descriptors as well as an overall measure of current pain, with higher scores indicating greater pain intensity. This tool has been shown to be effective in both acute and chronic pain populations (50).
Beck Depression Inventory is a 21-item self-administered questionnaire with established reliability and validity (51, 52). It is widely used to measure depression in patient populations. It can be used to quantify the psychological/behavioral dimension of FM impact. For each item on the inventory, subjects pick one of four statements to describe how they have been feeling in the past week; higher scores
indicate greater depression. The BDI generates a total score (range 0-63) and 2 subscores (cognitive/affective, range 0-42; somatic, range 0-21.
The most commonly used study of lupus activity is called the SLE Disease Activity Index (SLEDAI) (49). It is a list of 24 items including 16 clinical items and 8 items of laboratory results. These items are scored based on presence or absence within the 10 days prior to the blood draw obtained for diagnosis of SLE.
Other assessments of disease include the ESR (Erythrocyte sedimentation rate), CRP (C-reactive protein), RF (Rheumatoid Factor), CCP (Cyclic Citrullinated Protein), and ANA.
Sample preparation
Blood was collected from subjects and applied to blood spot cards, which were then dried and transported to the Rodriguez-Saona Spectroscopy laboratory for analysis. Variation in blood spot size was minimized by collecting samples on cards (Whatman 903 Protein Saver Snap Apart Card, GE Healthcare, Westborough, MA) with preprinted circles as guides to standardize the volume of blood applied; when applied to its border, each circle contains approximately 50 µL of blood. Upon arrival to the laboratory, 3 mm samples were punched from the card, extracted with 1 mL of ammonium acetate buffer (1% in water), mixed by sonication (Sonic Dismembrator Model 100, Fisher, Pittsburgh, PA), and the supernatant transferred to Amicon® Ultra centrifugal filter devices (30 K) and centrifuged (Model 5415, Eppendorf, Westbury, NY) at 14,000 g for 15 minutes at 4°C. Centrifugal membrane filter devices were used to remove large nominal molecular weight (NMW< 30KDa) blood components that interfered with resolving targeted biomarker compounds (15). Overall, the membrane filters removed proteins and isolated water-soluble molecules such as sugars, amino
11
by guest on May 27, 2019
http://ww
w.jbc.org/
Dow
nloaded from

Bloodspot test for fibromyalgia
acids, peptides and lipids. Two small volume (2 μl) drops of the blood filtrate fluid from all patients were deposited onto a SpectRIMTM Raman IR Slides (Tienta Sciences, Inc. Indianapolis, IN) and were allowed to dry at room temperature (~30 min) and Raman spectra were collected from each drop. Raman spectra were collected on the edge of the dried sample because it deposited more material providing reproducible signatures from samples. Esmonde-White (53) studying the molecular changes associated with osteoarthritis by Raman spectroscopy reported that proteins in specimens tend to accumulate on the edge of drops while smaller and more soluble components precipitate in the center during drop deposition. In the case of infrared spectroscopy, five microliter aliquots of the filtrate were diluted in methanol (50 µL), mixed and placed onto the ATR well for data collection.
Vibrational spectroscopy of samples
FT-IR spectra were collected using a 5500 portable system equipped with a heated 5-reflection ZnSe ATR crystal. The optical bench includes a Michelson interferometer with a mechanical bearing moving mirror, a potassium bromide beam splitter, and a deuterated triglycine sulfate (DTGS) detector operating at room temperature. To enhance the signal-to-noise ratio, 64 scans are co-added and signal averaged. The attenuated total reflectance (ATR) cell is warmed to 40 °C (±1 °C) so that all remaining solvent is evaporated before measurement.
Raman reflectance spectra were recorded using an NRS-4100 dispersive laser Raman microscope (Jasco Inc. Easton, MD), equipped with a with a motorized x-y stage, 5X, 20X, and 100X NIR objectives, and an Indium Gallium Arsenide (InGaAs) detector, which works at a temperature of -70°C. Spectra were collected from 2920 to 500 cm-1 using a
resolution of 1 cm-1. Laser wavelength was at 1064 nm, exposure was 60 seconds, and accumulation was 2. The grating, slit, and attenuator settings were 150 l/mm, 200 x 800 µm, and 25%, respectively. Measurements were performed using a 20X NIR objective. Background reflectance spectra were recorded between samples to minimize effects of the environment on the sample spectrum.
Multivariate analysis
Spectral differences (IR and Raman spectra and UV-Vis chromatograms from HPLC-PDA detection) between samples from subjects with FM and those with RA, SLE, or OA were evaluated using multivariate statistical techniques to resolve spectral information of interest, to cluster the samples according to the presence of the health condition (class), and to correlate symptom severity with spectral information. Soft Independent Modeling Class Analogy (SIMCA) and Partial Least Squares Regression (PLSR) were carried out using Pirouette pattern recognition software (Pirouette® version 4.5, Infometrix Inc., Woodville, WA, USA) as previously described (15). For all multivariate analysis, the only transformation applied to the data during the development were mean centering followed by a second derivative (35-point window). Second derivative transformation of the spectra allowed for further extraction of useful information and reduced spectral noise.
SIMCA, a supervised pattern recognition data-analysis method that uses the variance-covariance matrix, was used to reduce the dimensionality of the multivariate data sets by determining the principal components that best explained the systematic variation (29). A cross-validation algorithm was then used to determine the number of principal components that yielded the minimum prediction error. In SIMCA, the principal components contain
12
by guest on May 27, 2019
http://ww
w.jbc.org/
Dow
nloaded from

Bloodspot test for fibromyalgia
information about influential chemical and/or biological systems that define the classes; by determining the F-statistic, an upper limit for the residual variance (noise) can be calculated for all samples belonging to each class, resulting in a set of probabilities of class-membership for each sample. Thus, an unknown sample can only be assigned to the class for which it has a high probability. If the residual variance of a sample exceeds the upper limit for the modeled classes in the data set, it is not assigned to any of the classes; either it is an outlier, or it belongs to a class not represented in the data set (54). The classification model was developed on a training set (80% of the total number in a class) with known patient diagnosis, and the model performance was evaluated with an external validation set (remaining 20% of samples) of patients that were not used in the training and their predictions were compared with true categories (model sensitivity).
In order to distinguish FM activity (flares), signature biomarker band intensities in the spectrum were correlated to patient’s reported outcomes (FIQR) survey for the development of a quantitative algorithm, partial least squares regression (PLSR), to determine disease state. PLSR is a bi-linear regression based on the extraction of “latent variables” (56). These orthogonal factors (latent variables) explain most of the covariance of the X (spectra) and Y variables. PLSR reduces the dimensions contained in thousands of IR predictors into a few factors to explain variations in both the dependent variables and the spectral domain. The end-result is a linear model able to predict a desired characteristic (disease status) based on a selected set of predictors (IR spectra). PLSR has been particularly successful in developing multivariate calibration models for the spectroscopy field because it reduces the impact of irrelevant X-variations (noise) in the calibration model, resulting in more accurate and reproducible calibration models (57, 58). The
performance of the model was evaluated based on the number of latent variables, loading vectors, standard error of cross validation (SECV), coefficient of determination (R-value), and outlier diagnostics.
Metabolomic analysis by uHPLC-PDA-MS/MS
The untargeted metabolic profiling platform employed for this analysis consisted of ultrahigh performance liquid chromatography (uHPLC) coupled to a photodiode array (PDA) and tandem mass spectrometer (MS/MS) detectors for chemical species extracted from blood samples under alkaline conditions described above. To the dried bloodspot card samples previously extracted from punches, 1 mL of HPLC-MS grade H2O was added, and samples were vortexed for 15 s to homogenize. Aqueous samples were filtered through 0.2 µm nylon syringe filters (Phenomenex, Torrance, CA, U.S.A) into glass HPLC vials. Blood spot extract samples were evaluated by uHPLC-PDA-MS/MS using a uHPLC system (Shimadzu Nexera-i LC-2040C, Maryland, U.S.) coupled with tandem MS (Shimadzu LCMS-8040, Maryland, U.S.). Samples were evaluated by both direct injection into the system with no column and also with the use of a Pinnacle DB C18 column, 1.9 µm particle size, 50×2.1 mm length (Restek Corporation, Bellefonte, PA). When directly injected (25 µL of sample) into the system, flow consisted of 0.2 mL/min of 0.1% formic acid in water. When passed through the column (25 µL of sample), the column was heated to 40 °C and flow consisted of a binary gradient at 0.2 mL/min. Gradient consisted of solvents A: 0.1% formic acid in H2O and B: acetonitrile at 0% B for 0 – 5 min followed by increase of B from 0 – 40% during 5-20 min. Spectral data was collected from 200 – 800 nm
Conditions for MS/MS by electrospray ionization included the following: 1.5 L/min nebulizing gas flow, 230 °C desolvation line
13
by guest on May 27, 2019
http://ww
w.jbc.org/
Dow
nloaded from

Bloodspot test for fibromyalgia
temperature, 200 °C heat block temperature, and 15 L/min drying gas flow. M/z data were collected under both positive and negative modes from 25 – 1000 m/z with Q1 (1st quadrupole) total ion scan with event times of 100 ms. From analysis of preliminary data obtained, ions of interest were monitored under the same ionizing conditions using precursor and product ion scans with collision energy of −35.0 eV using argon gas for a secondary collision event. Data were collected using Lab Solutions software (Shimadzu, Maryland, U.S.). uHPLC-PDA-MS was performed on 10 samples (n = 10) from each disease group.
Data imputation and statistical analysis
To assist with data visualization, raw m/z intensity values for each metabolite were re-scaled by dividing all sample values by the mean value for each individual metabolite as similarly described by Hackshaw et al. (16). Each individual determination m/z was then expressed as a ratio relative to this mean value to determine fold-changes in metabolite concentrations. For statistical analyses and data display purposes, any missing values were assumed to be below the limit of detection, and these values were imputed with the compound minimum (minimum value imputation). Statistical analysis of metabolomics data was performed using was evaluated by 1-way
analysis of variance (ANOVA) (2-tailed, α = 0.05) and Tukey's HSD Post Hoc test (α = 0.05) using Minitab 16 (Minitab Inc., State College, PA). UHPLC-PDA chromatograms (detection from 260 – 450 nm) from samples analyzed with the use of a C18 column were also investigated by multivariate analysis as described above.
Conflict of Interest: The authors declare that they have no conflicts of interest with the contents of this article.
AUTHOR CONTRIBUTIONS
KVH: Project design, clinical assessment, manuscript co-authorship; DPA: vibrational spectroscopy analyses, data analysis; GTS: uHPLC-PDA-MS/MS design and analyses, data interpretation, manuscript co-authorship; MPP: vibrational spectroscopy analyses; FM: study design, sample collection, manuscript contributions; LY: consultant on statistical analyses; CATB: Project design, manuscript co-authorship; MMG: design of metabolomics approach, UV-Vis and MS data interpretation, manuscript co-authorship; LRS: Project design, manuscript co-authorship, Spectroscopy supervision and analyses.
REFERENCES
1. Yunus, M. B. (2015) Editorial Review: An Update on Central Sensitivity Syndromes and the Issues of Nosology and Psychobiology. Curr. Rheumatol. Rev. 11, 70–85
2. Arnold, L. M., Clauw, D. J., and McCarberg, B. H. (2011) Improving the recognition and diagnosis of fibromyalgia. Mayo Clin. Proc. 86, 457–464
3. Smith, H. S., Harris, R., and Clauw, D. (2011) Fibromyalgia: an afferent processing disorder leading to a complex pain generalized syndrome. Pain Physician. 14, E217–E245
4. Harte, S. E., Harris, R. E., and Clauw, D. J. (2018) The neurobiology of central sensitization. J. Appl. Biobehav. Res. 10.1111/jabr.12137
5. Maixner, W., Fillingim, R. B., Williams, D. A., Smith, S. B., and Slade, G. D. (2016) Overlapping
14
by guest on May 27, 2019
http://ww
w.jbc.org/
Dow
nloaded from

Bloodspot test for fibromyalgia
Chronic Pain Conditions: Implications for Diagnosis and Classification. J. Pain. 17, T93–T107
6. Yunus, M. B. (2008) Central Sensitivity Syndromes: A New Paradigm and Group Nosology for Fibromyalgia and Overlapping Conditions, and the Related Issue of Disease versus Illness. Semin. Arthritis Rheum. 37, 339–352
7. Dadabhoy, D., and Clauw, D. J. (2008) Musculoskeletal Signs and Symptoms. The Fibromyalgia Syndrome. in Primer on the Rheumatic Diseases, 13th Ed. (Klippel, J. H. ed), pp. 87 – 93, Springer, New York, NY
8. Clauw, D. J. (1995) The Pathogenesis of Chronic Pain and Fatigue Syndromes, with Special Reference to Fibromyalgia. Med. Hypotheses. 44, 369–378
9. Ablin, J. N., and Wolfe, F. (2017) A comparative evaluation of the 2011 and 2016 criteria for fibromyalgia. J. Rheumatol. 44, 1271–1276
10. Wolfe, F., Clauw, D. J., Fitzcharles, M. A., Goldenberg, D. L., Katz, R. S., Mease, P., Russell, A. S., Russell, I. J., Winfield, J. B., and Yunus, M. B. (2010) The American College of Rheumatology preliminary diagnostic criteria for fibromyalgia and measurement of symptom severity. Arthritis Care Res. 62, 600–610
11. Silverman, S., Dukes, E. M., Johnston, S. S., Brandenburg, N. A., Sadosky, A., and Huse, D. M. (2009) The economic burden of fibromyalgia: comparative analysis with rheumatoid arthritis. Curr. Med. Res. Opin. 25, 829–840
12. Annemans, L., Wessely, S., Spaepen, E., Caekelbergh, K., Caubère, J. P., Le Lay, K., and Taïeb, C. (2008) Health economic consequences related to the diagnosis of fibromyalgia syndrome. Arthritis Rheum. 58, 895–902
13. White, L. A., Birnbaum, H. G., Kaltenboeck, A., Tang, J., Mallett, D., and Robinson, R. L. (2008) Employees with fibromyalgia: Medical comorbidity, healthcare costs, and work loss. J. Occup. Environ. Med. 50, 13–24
14. Wolfe, F., Smythe, H. A., Yunus, M. B., Bennett, R. M., Bombardier, C., Goldenberg, D. L., Tugwell, P., Campbell, S. M., Abeles, M., Clark, P., and et al. (1990) The American College of Rheumatology 1990 Criteria for the Classification of Fibromyalgia. Report of the Multicenter Criteria Committee. Arthritis Rheum. 33, 160–172
15. Rubio-Diaz, D. E., Pozza, M. E., Dimitrakov, J., Gilleran, J. P., Giusti, M. M., Stella, J. L., Rodriguez-Saona, L. E., and Tony Buffington, C. A. (2009) A candidate serum biomarker for bladder pain syndrome/interstitial cystitis. Analyst. 134, 1133–1137
16. Hackshaw, K. V., Rodriguez-Saona, L., Plans, M., Bell, L. N., and Buffington, C. A. T. (2013) A bloodspot-based diagnostic test for fibromyalgia syndrome and related disorders. Analyst. 138, 4453–4462
17. Caboni, P., Liori, B., Kumar, A., Santoru, M. L., Asthana, S., Pieroni, E., Fais, A., Era, B., Cacace, E., Ruggiero, V., and Atzori, L. (2014) Metabolomics analysis and modeling suggest a lysophosphocholines-PAF receptor interaction in fibromyalgia. PLoS One. 9, 1–8
2
by guest on May 27, 2019
http://ww
w.jbc.org/
Dow
nloaded from

Bloodspot test for fibromyalgia
18. Malatji, B. G., Meyer, H., Mason, S., Engelke, U. F. H., Wevers, R. A., Reenen, M., and Reinecke, C. J. (2017) A diagnostic biomarker profile for fibromyalgia syndrome based on an NMR metabolomics study of selected patients and controls. BMC Neurol. 17, 1–15
19. Eikje, N. S., Aizawa, K., and Ozaki, Y. (2005) Vibrational spectroscopy for molecular characterisation and diagnosis of benign, premalignant and malignant skin tumours. Biotechnol. Annu. Rev. 11, 191–225
20. Diem, M., Griffiths, P. R., and Chalmers, J. M. (2008) Vibrational spectroscopy for medical diagnosis (Diem, M., Griffiths, P. R., and Chalmers, J. M. eds), Wiley, Chichester, West Sussex, U.K.
21. Kendall, C., Isabelle, M., Bazant-Hegemark, F., Hutchings, J., Orr, L., Babrah, J., Baker, R., and Stone, N. (2009) Vibrational spectroscopy: A clinical tool for cancer diagnostics. Analyst. 134, 1029–1045
22. Osterberg, E. C., Laudano, M. A., and Li, P. S. (2014) Clinical and investigative applications of Raman spectroscopy in Urology and Andrology. Transl. Androl. Urol. 3, 84–8
23. Carvalho, C. S., Martin, A. A., Santo, A. M. E., Andrade, L. E. C., Pinheiro, M. M., Cardoso, M. A. G., and Raniero, L. (2011) A Rheumatoid arthritis study using Raman spectroscopy. Theor. Chem. Acc. 130, 1211–1220
24. Lechowicz, L., Chrapek, M., Gaweda, J., Urbaniak, M., and Konieczna, I. (2016) Use of Fourier-transform infrared spectroscopy in the diagnosis of rheumatoid arthritis: a pilot study. Mol. Biol. Rep. 43, 1321–1326
25. Lavine, B. K. (2000) Clustering and classification of analutical data. Encycl. Anal. Chem. 10.1002/9780470027318.a5204.pub2
26. Santos, M., Gerbino, E., Tymczyszyn, E., and Gomez-Zavaglia, A. (2015) Applications of Infrared and Raman Spectroscopies to Probiotic Investigation. Foods. 4, 283–305
27. Bersani, D., and Lottici, P. P. (2016) Raman spectroscopy of minerals and mineral pigments in archaeometry. J. Raman Spectrosc. 47, 499–530
28. Roggo, Y., Chalus, P., Maurer, L., Lema-Martinez, C., Edmond, A., and Jent, N. (2007) A review of near infrared spectroscopy and chemometrics in pharmaceutical technologies. J. Pharm. Biomed. Anal. 44, 683–700
29. Sjöström, M., Wold, S., Lindberg, W., Persson, J. Å., and Martens, H. (1983) A multivariate calibration problem in analytical chemistry solved by partial least-squares models in latent variables. Anal. Chim. Acta. 150, 61–70
30. Aletaha, D., Neogi, T., Silman, A. J., Funovits, J., Felson, D. T., Bingham, C. O., Birnbaum, N. S., Burmester, G. R., Bykerk, V. P., Cohen, M. D., Combe, B., Costenbader, K. H., Dougados, M., Emery, P., Ferraccioli, G., Hazes, J. M. W., Hobbs, K., Huizinga, T. W. J., Kavanaugh, A., Kay, J., Kvien, T. K., Laing, T., Mease, P., Ménard, H. A., Moreland, L. W., Naden, R. L., Pincus, T., Smolen, J. S., Stanislawska-Biernat, E., Symmons, D., Tak, P. P., Upchurch, K. S., Vencovský, J., Wolfe, F., and Hawker, G. (2010) 2010 Rheumatoid arthritis classification criteria: An American
3
by guest on May 27, 2019
http://ww
w.jbc.org/
Dow
nloaded from

Bloodspot test for fibromyalgia
College of Rheumatology/European League Against Rheumatism collaborative initiative. Arthritis Rheum. 62, 2569–2581
31. Yu, C., Gershwin, M. E., and Chang, C. (2014) Diagnostic criteria for systemic lupus erythematosus: A critical review. J. Autoimmun. 48–49, 10–13
32. Bennett, R. M., Friend, R., Jones, K. D., Ward, R., Han, B. K., and Ross, R. L. (2009) The revised fibromyalgia impact questionnaire (FIQR): Validation and psychometric properties. Arthritis Res. Ther. 11, 1–14
33. Muhamadali, H., Chisanga, M., Subaihi, A., and Goodacre, R. (2015) Combining Raman and FT-IR spectroscopy with quantitative isotopic labeling for differentiation of E. Coli Cells at Community and Single Cell Levels. Anal. Chem. 87, 4578–4586
34. Cheng, Q., Debnath, S., Gregan, E., and Byrne, H. J. (2011) Vibrational mode assignments for bundled single-wall carbon nanotubes using Raman spectroscopy at different excitation energies. Appl. Phys. A. 102, 309–317
35. Marcello Manfredi, E. R. (2013) Biomarkers Discovery through Multivariate Statistical Methods: A Review of Recently Developed Methods and Applications in Proteomics. J. Proteomics Bioinform. 10.4172/jpb.S3-003
36. Coates, J. (2000) Interpretation of Infrared Spectra , A Practical Approach Interpretation of Infrared Spectra , A Practical Approach. in Encyclopedia of Analytical Chemistry (Meyers, R. A. ed), pp. 10815–10837, John Wiley and Sons Ltd, Chichester
37. Serban, D., Benevides, J. M., and Thomas, G. J. (2003) HU protein employs similar mechanisms of minor-groove recognition in binding to different B-DNA sites: Demonstration by Raman spectroscopy. Biochemistry. 42, 7390–7399
38. Ashton, L., Brewster, V. L., Correa, E., and Goodacre, R. (2017) Detection of glycosylation and iron-binding protein modifications using Raman spectroscopy. Analyst. 142, 808–814
39. Wishart, D. S., Feunang, Y. D., Marcu, A., Guo, A. C., Liang, K., Vázquez-Fresno, R., Sajed, T., Johnson, D., Li, C., Karu, N., Sayeeda, Z., Lo, E., Assempour, N., Berjanskii, M., Singhal, S., Arndt, D., Liang, Y., Badran, H., Grant, J., Serra-Cayuela, A., Liu, Y., Mandal, R., Neveu, V., Pon, A., Knox, C., Wilson, M., Manach, C., and Scalbert, A. (2018) HMDB 4.0: The human metabolome database for 2018. Nucleic Acids Res. 46, D608–D617
40. Vincent, A., Hoskin, T. L., Whipple, M. O., Clauw, D. J., Barton, D. L., Benzo, R. P., and Williams, D. A. (2014) OMERACT-based fibromyalgia symptom subgroups: An exploratory cluster analysis. Arthritis Res. Ther. 16, 1–11
41. Segura-Jiménez, V., Soriano-Maldonado, A., Álvarez-Gallardo, I. C., Estévez-López, F., Carbonell-Baeza, A., and Delgado-Fernández, M. (2015) Subgroups of fibromyalgia patients using the 1990 American College of Rheumatology criteria and the modified 2010 preliminary diagnostic criteria: the al-Ándalus project. Clin. Exp. Rheumatol. 34, S26-33
42. Schwarz, M. J., Offenbaecher, M., Neumeister, A., Ewert, T., Willeit, M., Praschak-Rieder, N., Zach, J., Zacherl, M., Lossau, K., Weisser, R., Stucki, G., and Ackenheil, M. (2002) Evidence for
4
by guest on May 27, 2019
http://ww
w.jbc.org/
Dow
nloaded from

Bloodspot test for fibromyalgia
an altered tryptophan metabolism in fibromyalgia. Neurobiol. Dis. 11, 434–442
43. Walitt, B., Nahin, R. L., Katz, R. S., Bergman, M. J., and Wolfe, F. (2015) The prevalence and characteristics of fibromyalgia in the 2012 national health interview survey. PLoS One. 10, 1–16
44. Hughes, G., Martinez, C., Myon, E., Taïeb, C., and Wessely, S. (2006) The impact of a diagnosis of fibromyalgia on health care resource use by primary care patients in the UK: An observational study based on clinical practice. Arthritis Rheum. 54, 177–183
45. Hackshaw, K. V., Plans-Pujolras, M., Rodriguez-Saona, L. E., Moore, M. A., Jackson, E. K., Sforzo, G. A., and Buffington, C. A. T. (2016) A pilot study of health and wellness coaching for fibromyalgia. BMC Musculoskelet. Disord. 17, 1–9
46. Robinson, R., Kroenke, K., Williams, D., Chen, Y., Peng, X., Faries, D., McCarberg, B., Wohlreich, M., and Mease, P. (2012) Longitudinal observation of treatment patterns and outcomes for patients with fibromyalgia. J. Pain. 13, S88
47. Melzack, R. (1975) The McGill Pain Questionnaire: Major properties and scoring methods. Pain. 1, 277–299
48. Stewart, A. L., Hays, R. D., and Ware Jr., J. E. (1988) The MOS Short-Form General Health Survey : Reliability and Validity in a Patient Population. Med. Care. 26, 724–735
49. Gladman, DD Ibanez, D Urowitz, M. (2002) Systemic lupus erythematosus disease activity index 2000. J Rheumatol. 29, 288–91
50. De Maesschalck, R., Candolfi, A., Massart, D. L., and Heuerding, S. (1999) Decision criteria for soft independent modelling of class analogy applied to near infrared data. Chemom. Intell. Lab. Syst. 47, 65–77
51. Beck, A. T., Brown, G., Epstein, N., and Steer, R. A. (1988) An Inventory for Measuring Clinical Anxiety: Psychometrical Properties. J. Consult. ans Clincal Psychol. 56, 893–897
52. Beck, A. T., Ward, C. H., Mendelson, M., Mock, J., and Erbaugh, J. (1961) Inventory for Measuring Depression. Arch. Gen. Psychiatry. 4, 561–571
53. Esmonde-White, K. A., Mandair, G. S., Raaii, F., Jacobson, J. A., Miller, B. S., Urquhart, A. G., Roessler, B. J., and Morris, M. D. (2009) Raman spectroscopy of synovial fluid as a tool for diagnosing osteoarthritis. J. Biomed. Opt. 14, 034013
54. Kvalheim, O. M., and Karstang, T. V. (1992) Classification by Means of Disjoint Cross Validates Principal Components Models. in Multivariate Pattern Recognition in Chemometrics: Illustrated by Case Studies (Brereton, R. G. ed), pp. 209–249, Elsevier, Amsterdam
ABBREVIATIONS
• ACR: American College of
Rheumatology
• ANA: Antinuclear Antibody
• ANOVA: Analysis of Variance
• ATR: Attenuated Total Reflectance
5
by guest on May 27, 2019
http://ww
w.jbc.org/
Dow
nloaded from

Bloodspot test for fibromyalgia
• BDI: Beck Depression Index
• BMI: Body Mass Index
• CCP: Cyclic Citrullinated Protein
• CRP: C-reactive protein
• CT: Computed Tomography
• DP: Discrimination Power
• DTGS: Deuterated Triglycine Sulfate
• ESR: Erythrocyte Sedimentation Rate
• FDA: US Food and Drug Administration
• FIQR: Fibromyalgia Impact
Questionnaire – Revised
• FM: Fibromyalgia
• FT-IR: Fourier-Transform Infrared
Spectroscopy
• GI: Gastrointestinal
• ICD: Interclass Distances
• IRB: Institutional Review Board
• LC/Q-TOF/MS: Liquid
Chromatography/Quadrupole–Time-of-
Flight/Mass Spectrometry
• LDA: Linear Discriminant Analysis
• LMF: Low-Molecular Weight Fraction
• MPI: McGill Pain Index
• MPQ: McGill Pain Questionnaire
• MRI: Magnetic Resonance Imaging
• MS/MS: Tandem Mass Spectrometry
• NIR: Near Infrared
• NMR: Nuclear Magnetic Resonance
Spectroscopy
• OA: Osteoarthritis
• PC: Principal Component
• PCA: Principal Component Analysis
• PDA: Photodiode Array Detection
• PLS-DA: Partial Least-Squares
Discriminant Analysis
• PLSR: Partial Least Squares Regression
• RA: Rheumatoid arthritis
• RF: Rheumatoid Factor
• SECV: Standard Error of Cross
Validation
• SERS: Surface-Enhanced Raman
Spectroscopy
2
by guest on May 27, 2019
http://ww
w.jbc.org/
Dow
nloaded from

Bloodspot test for fibromyalgia
• SIMCA: Soft Independent Modeling of
Class Analogy
• SLE: Systemic Lupus Erythematosus
• SLEDAI: Systemic Lupus Erythematosus
Disease Activity Index
• SSS: Symptom Severity Scale
• uHPLC: Ultra High Performance Liquid
Chromatography
• UV-Vis: Ultraviolet-Visible Light
• WPI: Widespread Pain Index
3
by guest on May 27, 2019
http://ww
w.jbc.org/
Dow
nloaded from
2
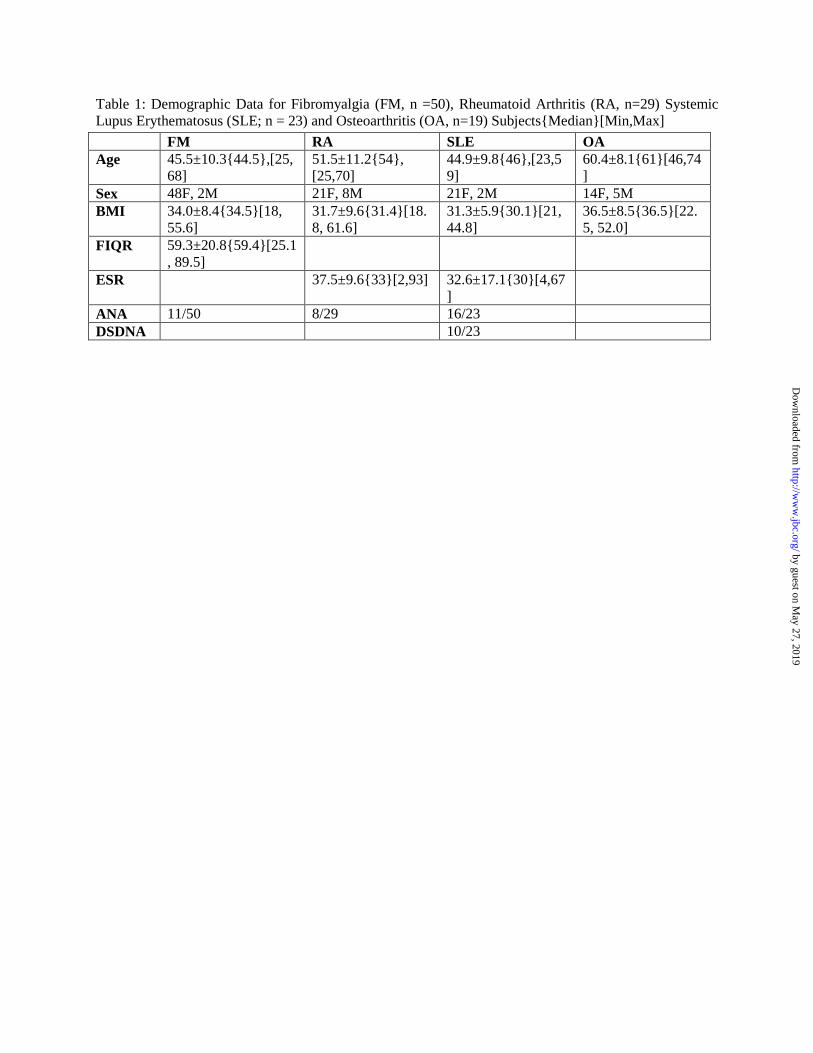
Table 1: Demographic Data for Fibromyalgia (FM, n =50), Rheumatoid Arthritis (RA, n=29) Systemic Lupus Erythematosus (SLE; n = 23) and Osteoarthritis (OA, n=19) Subjects{Median}[Min,Max]
FM RA SLE OA Age 45.5±10.3{44.5},[25,
68] 51.5±11.2{54}, [25,70]
44.9±9.8{46},[23,59]
60.4±8.1{61}[46,74]
Sex 48F, 2M 21F, 8M 21F, 2M 14F, 5M BMI 34.0±8.4{34.5}[18,
55.6] 31.7±9.6{31.4}[18.8, 61.6]
31.3±5.9{30.1}[21, 44.8]
36.5±8.5{36.5}[22.5, 52.0]
FIQR 59.3±20.8{59.4}[25.1, 89.5]
ESR 37.5±9.6{33}[2,93] 32.6±17.1{30}[4,67]
ANA 11/50 8/29 16/23 DSDNA 10/23
by guest on May 27, 2019
http://ww
w.jbc.org/
Dow
nloaded from

3
Table 2: Medications taken by Fibromyalgia (FM, n =50), Rheumatoid Arthritis (RA, n=29) Systemic Lupus Erythematosus (SLE; n = 23) and Osteoarthritis (OA, n=19) Subjects
Subj Med1
Subj Meds1
Subj Meds1
FM RA SLE OA FM RA SLE OA FM
1 1,3,5 9,15 20 1,9 18 1,2 15 2,18,20,27 2,9 35 1,2
2 2,4 22,27 18,20 4,9 19 30 15,18,23 18,21 2,9,27 36 1,2,7,9,26
3 5,26,27 2,18,26 18 9 20 1,4 9,12,24,26,27 1,18,19 37 3,27
4 27 15 2,4,18 9,27 21 2,7.26 2,15,27,28 1,2,3,18,20 38 1,2,5
5 2,4,27 1,2,15,18 16,18 2,6,27 22 1,2,8 9,23 2,6,8,16,18 39 3,4
6 2,5 4,15,33 17,19 6,27 23 1,2,7,9,26 20,27,29 30 40 3,7,26
7 8,9 2,15,32 16,18,20 2,26 24 3,27 17,20,22 41 3
8 1,7 18,35 17,18,20 3,4 25 1,2,5 42 30
9 1,2,6,9 9,15 15,18 26 3,4 15,20,28 43 2,6,26 10 3,8 15,31 3,15 1,2,6,27 27 3,7,26 2,15,18,20 44 2,4 11 1,6 1,12,22 2,18,20 2,6,9,27 28 3 15,31 45 1,3,6 12 2,6,12 18,26 2,9,26 29 30 46 2,6,12
13 1,2,6,26 28 18,26 2,9,11,26 30 2,6,26 47 2,5,8
14 2,4,12 2,4,18,20 9,18,27 9,27 31 2,4 48 1,2
15 30 12,15,22,23,31 1,2,18,26 9 32 1,3,6 49 2,10
16 5 9,27,34 15,18,20 4,26 33 2,6,12 50 1
17 1,6 20,23 18,27 3,27 34 2,5,8 1Legend of Medications listed (Tables 2,4, 6): Tricyclics [Amitriptyline, Doxepin, Nortriptyline, Imipramine, Trazodone] = 1; Gabapentin = 2; Pregabalin = 3; Duloxetine = 4; Venlafaxine = 5; Fluoxetine = 6; Milnacipran = 7; Topiramate = 8; Nonsteroidal anti-inflammatory drugs = 9; Cyclobenzaprine = 10; Metaxalone = 11; Tizanidine = 12; Carisprodol = 13; Baclofen = 14; Methotrexate = 15; Azathioprine = 16; Mycophenolate = 17; Hydroxychloroquine = 18; Belimumab = 19; Prednisone = 20; Cyclophosphamide = 21; Adalimumab = 22; Etanercept = 23; Infliximab = 24; Tofacitinib = 25; Tramadol = 26; Hydrocodone = 27; Rituximab = 28; Abatacept = 29; NONE = 30; Leflunomide = 31; Tocalizumab = 32; Sulfasalazine = 33; Golimumab = 34; Auranofin = 35; -=No value or not obtained
by guest on May 27, 2019
http://ww
w.jbc.org/
Dow
nloaded from

4
Table 3: Pearson correlation coefficients between self-reported symptoms questionnaire scores and other laboratory measures assessing disease states
FIQR ESR
BDI +0.686 p<0.005* n=27
CRP +0.292 p=0.14 n=28
MPI +0.334 p>0.05 n=26
RF +0.484 p=0.01* n=27
CCP +0.663 p=0.09 n=24
SLEDAI +0.489 p=0.15 n=23
by guest on May 27, 2019
http://ww
w.jbc.org/
Dow
nloaded from

5
Table 4: Interclass distances between disease groups based FT-IR and Raman analysis, (IR: n = 30 FM, 20 RA, 20 SLE. Raman: n = 40 FM; n = 23 RA; n = 25 SLE). (SIMCA, p-value < 0.05)
FT-IR Disease FM RA SLE FM 0.0 RA 4.5 0.0 SLE 4.0 3.8 0.0 Raman Disease FM RA SLE FM 0.0 RA 1.3 0.0 SLE 11.7 12.7 0.0
by guest on May 27, 2019
http://ww
w.jbc.org/
Dow
nloaded from

6
Table 5: Listing of m/z (positive and negative ion detection) of blood sample extracts from different disease groups from direct injection and passing through a C18 column having significant differences, according ratio to mean intensities (n = 10). (ANOVA, Post-Hoc t-test, p-value < 0.05) m/z p-value from ANOVA Grouping from Post-Hoc t-test Direct Injection, Negative Ion Detection 95.65 0.018 FMa ~ SLEab ~ OAb, RAb
217.90 0.031 OAa ~ FMab, RAab ~ SLEb
290.15 0.032 OAa ~ FMab, SLEab ~ RAb Direct Injection, Positive Ion Detection 74.75 0.021 SLEa ~ RAab, OAab ~ FMb
184.85 0.026 RAa, SLEa, OAa, FMa
C18 Column, Peak 2*, Positive Ion Detection 120.55 0.001 OAa, RAa > FMb, SLEb
133.80 0.000 SLEa, RAa > OAb, FMb
172.80 0.002 RAa > SLEb, OAb, FMb
184.75 0.000 SLEa, RAa > OAb, FMb
215.10 0.000 FMa, OAa > RAb, SLEb
C18 Column, Peak 3*, Positive Ion Detection 166.20 0.009 FMa, OAa ~ RAab ~ SLEb
189.20 0.000 FMa, OAa > RAb, SLEb
203.80 0.033 FMa ~ OAab, RAab ~ SLEb
255.95 0.038 RAa, SLEa, FMa, OAa
261.40 0.000 RAa, SLEa > OAb, FMa
* See Figure 2 for C18 Column Peaks 2 and 3 characterization
by guest on May 27, 2019
http://ww
w.jbc.org/
Dow
nloaded from

7
Table 6: Interclass distances between disease groups based on absorbance (260-450 nm) during uHPLC-PDA analysis, t = 14 – 17 min (n = 10). (SIMCA/PLSR, p-value < 0.05)
Interclass Distances Disease FM RA OA SLE FM 0.0 RA 5.5 0.0 OA 2.2 5.7 0.0 SLE 3.5 3.5 3.9 0.0
by guest on May 27, 2019
http://ww
w.jbc.org/
Dow
nloaded from

Bloodspot test for fibromyalgia
Figure 1: Representative spectra from serum of an FM patient collected by FT-Raman (red line) and FT-
IR (black line) microspectroscopy
1800 1400 Wavenumber (cm-1
)
Res
pons
e
830
900 650
1040
1240
1450
1414
1600
924
1110
1000
C-C
twis
ting
mod
e:
phen
ylal
anin
e
Out
of-
plan
e rin
g br
eath
ing
ν (C
-C):
tyro
sine
C1-H
def
orm
atio
n, β
-link
age,
skel
etal
C-O
-C
linka
ge st
retc
h: (G
lyco
sam
inog
lyca
ns)
δ C
-H (P
lane
ben
ding
) ar
omat
ic c
ompo
und:
Am
ide
III:
glyc
opro
tein
δ (C
-H) -
CH
3, CH
2 ben
ding
: co
llage
n, p
hosp
holip
ids,
trypt
opha
n
Infrared
Raman
8
by guest on May 27, 2019
http://ww
w.jbc.org/
Dow
nloaded from

9
Figure 2: SIMCA class projections and discrimination power statistic (red line: discrimination between
FM and RA. black line: discrimination between FM and SLE) for the classification of serum samples of
FM, RA, and SLE evaluated by ATR-IR spectroscopy (n = 30 FM, 20 RA, 20 SLE).
by guest on May 27, 2019
http://ww
w.jbc.org/
Dow
nloaded from
10
Figure 3: (A) SIMCA class projections (n = 40 FM; n = 23 RA; n = 25 SLE), (B) SIMCA model
performance using an independent validation set (n = 10 FM; n = 6 RA; n = 7 SLE) comparing
predictions with true categories and (C) discrimination power statistic (red line: discrimination between
FM and RA. black line: discrimination between FM and SLE) for the classification of serum samples of
FM, RA, and SLE evaluated by FT-Raman spectroscopy.
by guest on May 27, 2019
http://ww
w.jbc.org/
Dow
nloaded from

11
Figure 4: PLSR model correlating the IR spectral data and logarithmic transformed self-reported disease
activity (FIQR) scores for FM disease subjects (PLSR) and regression vector for the PLSR model (n = 20)
by guest on May 27, 2019
http://ww
w.jbc.org/
Dow
nloaded from

12
Figure 5: PLSR model correlating Raman spectral data and the logarithmic transformation of the self-
reported disease activity (FIQR) scores for FM disease subjects (PLSR) and regression vector for the
PLSR model (n = 30)
by guest on May 27, 2019
http://ww
w.jbc.org/
Dow
nloaded from

13
Figure 6: Ratio to mean intensities (and standard deviation) of m/z (positive and negative ion detection) of
blood sample extracts from different disease groups from direct injection (n = 10). * indicate m/z with
significant differences between diseases (ANOVA, p-value < 0.05)
by guest on May 27, 2019
http://ww
w.jbc.org/
Dow
nloaded from

14
Figure 7: Averaged uHPLC-PDA chromatograms (260-450 nm) of blood sample extracts from different
disease groups (intensities averaged within each group, n = 10)
by guest on May 27, 2019
http://ww
w.jbc.org/
Dow
nloaded from

15
Figure 8: Averaged uHPLC-PDA chromatograms (260-450 nm) of blood sample extracts from different
disease groups from 7-12 min (intensities averaged within each group, n = 10). The shaded area in grey
indicates the retention times that were found responsible for the discrimination among diseases (see figure
9).
by guest on May 27, 2019
http://ww
w.jbc.org/
Dow
nloaded from

16
Figure 9: SIMCA class projections for the classification of serum samples of FM, RA, OA and SLE
patients separated by chromatographic profiles during uHPLC-PDA analysis, detection 260-450 nm, and
discriminating peak retention times
by guest on May 27, 2019
http://ww
w.jbc.org/
Dow
nloaded from

Rodriguez-SaonaFrancesca Madiai, Lianbo Yu, Charles A. T. Buffington, M. Mónica Giusti and Luis Kevin V Hackshaw, Didem P. Aykas, Gregory T Sigurdson, Marcal Plans Pujolras,
disordersMetabolic fingerprinting for diagnosis of fibromyalgia and other rheumatologic
published online December 6, 2018J. Biol. Chem.
10.1074/jbc.RA118.005816Access the most updated version of this article at doi:
Alerts:
When a correction for this article is posted•
When this article is cited•
to choose from all of JBC's e-mail alertsClick here
by guest on May 27, 2019
http://ww
w.jbc.org/
Dow
nloaded from