Metabolic engineering strategies to improve yeast- … engineering strategies to improve yeast-based...
76
Metabolic engineering strategies to improve yeast- based production of itaconic acid guided by in silico metabolic modelling Ana Isabel de Vila-Santa Braga Campos Thesis to obtain the Master of Science Degree in Biotechnology Supervisors Prof. Doctor Nuno Gonçalo Pereira Mira Prof. Doctor Susana de Almeida Mendes Vinga Martins Examination committee Chaiperson: Prof. Doctor Isabel Maria de Sá-Correia Leite de Almeida Supervisor: Prof. Doctor Nuno Gonçalo Pereira Mira Members of the Commitee: Prof. Doctor César Simões da Fonseca Prof. Doctor Rafael Sousa Costa July 2015
Transcript of Metabolic engineering strategies to improve yeast- … engineering strategies to improve yeast-based...

Metabolic engineering strategies to improve yeast-
based production of itaconic acid guided by in
silico metabolic modelling
Ana Isabel de Vila-Santa Braga Campos
Thesis to obtain the Master of Science Degree in
Biotechnology
Supervisors
Prof. Doctor Nuno Gonçalo Pereira Mira
Prof. Doctor Susana de Almeida Mendes Vinga Martins
Examination committee
Chaiperson: Prof. Doctor Isabel Maria de Sá-Correia Leite de Almeida
Supervisor: Prof. Doctor Nuno Gonçalo Pereira Mira
Members of the Commitee: Prof. Doctor César Simões da Fonseca
Prof. Doctor Rafael Sousa Costa
July 2015

i
Acknowledgments
I would like to thank my supervisors, Professor Nuno Mira and Professor Susana Vinga, for the guidance
throughout the work and for the knowledge they’ve passed during this thesis, along with the scientific
enthusiasm. I also would like to thank Professor Isabel Sá-Correia, for providing the conditions to work in
Biological Sciences Research Group and the strains used in this work. I also want to acknowledge Prof
Antonius van Maris, who provided the TAM strain. I would also like to thank financial support of FCT
(UID/BIO/04565/2013). I’m also thankful for the help provided by the BSRG and CSI-IDMEC team members
with the difficulties that have arisen throughout the work. I also want to thank Nicole Rodrigues, who has
taught me the needed lab skills with such patience. I would also like to thank Cláudio Frazão for the
collaboration in the work. A thanks also to my colleagues Laura Luzia, Rui Santos, João Peça, João Silva,
Cátia Pacífico and Raquel Teixeira for making the laboratory experience much more joyfull. I also want to
thank Ana Sofia and Maria, for their friendship, who has meant so much during this thesis. I’m also grateful
to Pedro, for giving me strength and always helping me see the bright side.
Most of all, I’d like to thank my mother and my brother, for their incredible support and for being such
good examples of courage and persistence.

ii
Abstract In the context of microbial production of bulk compounds from renewable feedstocks to replace fuel-
derived chemicals, carboxylic acids are considered of particular interest since these molecules are
precursors of microbial metabolism and their chemical versatility allows their use as catalysts. The work
described in this thesis is focused on the production of itaconic acid, a C5 carboxylic acid, in
Saccharomyces cerevisiae. BY4741 cells transformed with a plasmid having the A. terreus AtCad1 gene
under the control of a galactose-inducible promoter were previously found to produce around 25.12 mg/L
of itaconic acid. In this work it was found that the production of itaconic acid is higher in fermentations
initiated with lower cellular densities. Strikingly, no production of itaconic acid was obtained when a
prototrophic strain was used as a host for the production of itaconic acid, indicating that amino acid
auxotrophies may be necessary to establish yeast-based production of itaconic acid. In the fermentations
undertaken by BY4741, proeminent concentrations of acetic acid were observed in the medium,
suggesting this an important byproduct of the fermentation processes performed. Using FBA-based in
silico metabolic modelling, a set of 21 gene deletions were identified as genetic backgrounds that could
be interesting to increase itaconic acid production in yeast. This beneficial effect was confirmed for at
least six of the mutants tested.
Key-words: itaconic acid, S. cerevisiae, AtCad1, FBA, metabolic modelling

iii
Resumo No contexto da produção microbiana de compostos de valor acrescentado a partir de biomassa com o
objectivo de substituir químicos de origem petrolífera, os ácidos carboxílicos têm um interesse relevante,
visto estas moléculas são precursoras no metabolismo microbiano e a sua versatilidade química permite
o seu uso como catalisadores. O trabalho descrito nesta tese é focado na produção de ácido itacónico,
um ácido carboxílico C5, em Saccharomyces cerevisiae. Foi previamente reportado que células BY4741
transformadas com um plasmídeo que tem o gene AtCad1 de A. terreus sob o controlo de um promotor
indutível por galactose produzem cerca de 25.12 mg/L de ácido itacónico. Neste trabalho foi observado
que a produção de ácido itacónico é aumentada quando as fermentações são iniciadas com uma menor
densidade celular. Surpreendentemente, quando uma estirpe prototrófica foi utilizada como hospedeiro
não se verificou a produção de ácido itacónico, indicando que auxotrofias de aminoácidos podem ser
necessárias para estabelecer uma produção de ácido itacónico baseada em leveduras. Nas fermentações
com a estirpe BY4741 foram observadas concentrações elevadas de ácido acético no meio, sugerindo que
este é um subproduto importante nas fermentações realizadas neste trabalho. Utilizando modelação
metabólica baseada em FBA, foram identificadas 21 delecções genéticas com o potencial de aumentar a
produção de ácido itacónico na levedura. O efeito benéfico foi confirmado para 6 destas estirpes.
Palavras-chave: ácido itacónico, S. cerevisiae, AtCad1, FBA, modelação metabólica

iv
List of Abbreviations
AtCAD1- CAD1 gene from A. terreus
CAD – Cis-aconitate Decarboxylase
CIAP – Calf Intestinal Alkaline Phosphatase
CSM – Complete Supplement Mixture
COBRA – Constraint-based Reconstruction Analysis
DMSO – Dimethyl sulfoxide
dNTP – Deoxynucleotide Triphosphates
EUROSCARF – European Saccharomyces cerevisiae Archive for Functional Analysis
FBA – Flux Balance Analysis
FVA – Flux Variability Analysis
GSMM – Genome-Scale Metabolic Models
MMB – Minimal Growth Medium
MMF – Minimal Fermentation Medium
OD600 – Optical density at a wavelength of 600 nm
pGAL1 – Promoter for the GAL1 gene (Galactokinase)
pTEF1 – Promoter for the TEF1 gene (Transcription Elongation Factor)
PCR – Polymerase Chain Reaction
PEG – Polyethylene glycol
rpm – rotations per minute
SBML – Systems Biology Markup Language
TCA – Tricarboxylic acid
UAS – Upstream Activating Sequences
YPD – Yeast Peptone Dextrose

v
List of Figures Figure 1: Itaconic acid and its compound derivatives. From Werpy, T. & Petersen, G.2004,[3] .. 3
Figure 2: Biosynthetic pathway of itaconic acid in Aspergillus terreus. Itaconic acid biosynthetic
pathway marked in red. From Steiger et al, 2013 [7]. .................................................................. 4
Figure 3: Itaconic acid and lovastatin gene clusters. Adapted from Li et al, 2012 [9]. ................. 4
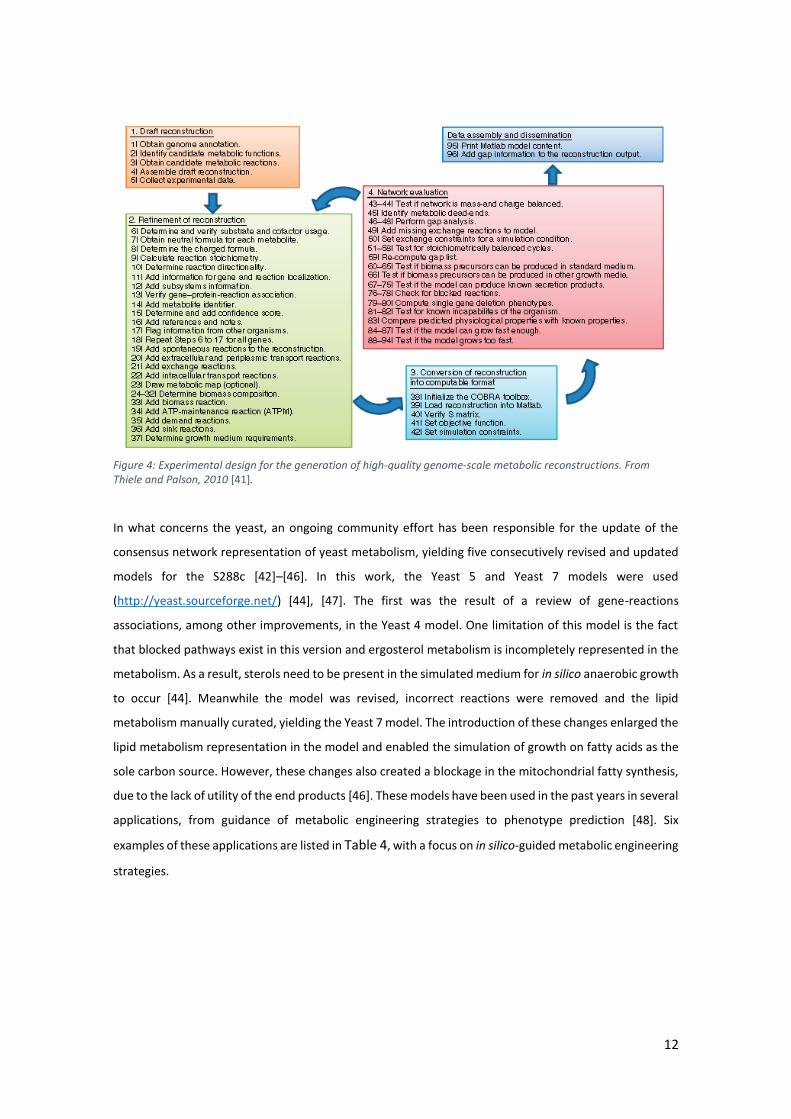
Figure 4: Experimental design for the generation of high-quality genome-scale metabolic
reconstructions. From Thiele and Palson, 2010 [41]. ................................................................. 12
Figure 5: Mathematical representation of a metabolic model: the glycolytic pathway in E. coli
(a), the stoichiometric matrix (b) and inequality constrains (c). From Becker et al, 2007 [54]. . 14
Figure 6: The solution space in flux-balance analysis. From Orth, Thiele and Palsson, 2010 [57]
..................................................................................................................................................... 16
Figure 7: The bilevel optimization structure of OptKnock. From Burgard, Pharkya and Maranas,
2003 [64]. .................................................................................................................................... 17
Figure 8: Convergence curve of the Optgene algorithm. From Patil et al, 2005 [68]. ................ 18
Figure 9: The central carbon metabolism of S. cerevisiae, and the model-guided metabolic
engineering strategy for succinate over-production. Legend: native reactions (blue solid line),
lumped native reactions (blue dashed line), interrupted reactions (red solid line), up-regulated
reactions (green solid line). From Otero et al, 2013 [53]. ........................................................... 19
Figure 10: Summarized description of the work presented in this thesis. ................................. 21
Figure 11: Genetic engineering strategy used to exchange the Gal1 promoter present in the
engineered pAtCad1 plasmid. As an example it is shown the replacement of GAL1 for TEF1
promoter. .................................................................................................................................... 32
Figure 12: Colony PCR of 24 TEF1-AtCad1 yeast candidates. Lane 0: 1 kb DNA plus ladder; Lane
1: positive control; Lanes 3-27: TEF1-AtCad1 candidates ........................................................... 33
Figure 13: (Left) Concentration of itaconic acid (o, ) and galactose (, ) in supernatant of
cultures of BY4741 cells harboring the pGAL1-AtCad1 plasmid along 7 days of cultivation in
MMF fermentation medium. Two sizes of initial inoculum were tested corresponding to an
initial OD600nm of 0.1 (o,) or 2 (,); (Right) Growth curve of BY4741 cells harboring the
pGAL1-AtCad1 plasmid in MMF fermentation medium along the 7 days of fermentation with
initial OD600 of 0.1() or 2(). .................................................................................................. 34
Figure 14: (Left) Concentration of itaconic acid (o, ) and galactose (, ) in supernatant of
cultures of TAM cells harboring the pGAL1-AtCad1 plasmid along 7 days of cultivation in MMF
fermentation medium. Two sizes of initial inoculum were tested corresponding to an initial
OD600nm of 0.1 (o,) or 2 (,); (Right) Growth curve of TAM cells harboring the pGAL1-
AtCad1 plasmid in MMF fermentation medium along the 7 days of fermentation with initial
OD600 of 0.1() or 2(). ................................................................Error! Bookmark not defined.
Figure 15: Reactions and metabolites added to the Yeast 5 and Yeast 7 models. The
metabolites in red are already present in the models. The reactions associated with the LEU2,
MET15 and HIS3 genes were constrained to zero. ..................................................................... 35
Figure 16: Scenarios used to in silico simulate S. cerevisiae metabolism during production of
itaconic acid. ................................................................................................................................ 36
Figure 17: Fluxes through some aminoacid biosynthesis reactions when the objective function
is the maximization of growth (A) or itaconic acid production (B). Results presented for the
Yeast 7 model. The reactions associated with the genes HIS3, LEU2 and MET15 are highlighted.
.........................................................................................................Error! Bookmark not defined.
Figure 18: (A) Concentration of itaconic acid present in the supernatant of 7-day fermentations
undertaken by BY4741 cells or by the derived deletion mutants transformed with the pGal-
vi
AtCad1 plasmid in MMF medium; (B) Comparison between the growth rate rates of the
BY4741 strain and of the derived deletion mutants in the MMF medium. In both graphs the
dashed lines corresponds to the values obtained for the wild-type strain. ............................... 44
Figure 19: Robustness analysis on the Yeast 7 model. Left) In the standard scenario in the
prototrophic background. Rigth) In the simulated scenario () and in the simulated scenario
without constraints on ammonium availability (o) on the BY4741 background.. ...................... 47
Figure 20: Effect of ammonium concentration in MMF growth medium in the ability of yeast
cells to produce itaconic acid. The concentration of itaconic acid present in the supernatant of
3-day fermentations undertaken by BY4741 cells was measured by HPLC (A). The initial and
final DO600 were measured and the ratio final/initial was calculated (B). The results shown
represent two independent assays that were performed. ......................................................... 48
Figure 21: (Left) Concentration of pyruvic acid in supernatant of cultures of BY4741 (,) and
TAM (o,) cells harboring the pGAL1-AtCad1 plasmid along 7 days of cultivation in MMF
fermentation medium. Two sizes of initial inoculum were tested corresponding to an initial
OD600nm of 0.1 (o,) or 2 (,); (Right) Concentration of pyruvic acid in supernatant of
cultures of BY4741 (,) and TAM (o,) cells harboring the pGAL1-AtCad1 plasmid along 7
days of cultivation in MMF fermentation medium. Two sizes of initial inoculum were tested
corresponding to an initial OD600nm of 0.1 (o,) or 2 (,) .................................................. 61
Figure 22: Concentration of itaconic acid (A) and galactose (B) in the supernatant of
fermentations undertaken by BY4741 or by the derived deletion mutants transformed with the
pGal1-AtCad1 plasmid. ................................................................................................................ 66
vii
List of Tables Table 1: Top added value building blocks from identified by the DOE and BREW reports [3], [4]2
Table 2: Overview of the host used for the production of itaconic acid, other than Aspergillus
species, and the genetic modifications used. ............................................................................... 6
Table 3: Advantages and disadvantages associated with the production of organic acids in
bacteria, filamentous fungi and yeast. .......................................................................................... 7
Table 4: Some applications of the Yeastnet models. Six studies focused on metabolic
engineering are listed, out of 106 reported papers using genome-scale models of
Saccharomyces cerevisiae metabolism (http://sbrg.ucsd.edu/cobra-predictions-app/). .......... 13
Table 5: S. cerevisiae strains used in this study. ......................................................................... 22
Table 6: Final fermentation medium composition in aminoacids, vitamins and trace elements.
..................................................................................................................................................... 23
Table 7: Plasmids used in this study. ........................................................................................... 23
Table 8: Primers used for the amplification of the promoter fragments. .................................. 25
Table 9: Reaction mixture used for the amplification ................................................................. 25
Table 10: Conditions of the PCR cycle for amplification of the promoters ................................. 25
Table 11: Solutions prepared for the microplate fermentations. ............................................... 27
Table 12: Sets of constraints imposed on the lower bounds of the sink reactions corresponding
to the nutrients present in the fermentation medium. .............................................................. 29
Table 13: Reactions where the lower and upper bounds where forced to zero to simulate the
BY4741 genetic background, in the Yeast 5 and Yeast 7 model. ................................................ 30
Table 14: Overview of production titers and yield of itaconic acid produced in 7 day
fermentations undertaken by BY4741 and TAM cells in MMF medium. .................................... 34
Table 15: FBA results for the optimization of cell growth and itaconic acid production when
cells are grown in 10 mmol glucose/gDCW/h (standard conditions).CAD corresponds to cis-
aconitate decarboxylase. * marks the scenarios where no FBA solution was found. ................ 37
Table 16: FBA results for optimization of cell growth and itaconic acid production when cells
have maximal uptake rates based on the fermentation medium. CAD corresponds to cis-
aconitate decarboxylase. ............................................................................................................ 37
Table 17: FBA results for the maximization of biomass/flux. Results presented for both the
Yeast 5 and Yeast 7 models. CAD corresponds to cis-aconitate decarboxylase. * marks the
scenarios where no FBA solution was found .............................................................................. 38
Table 18: FBA results for the maximization of biomass/flux. For each scenario two genetic
backgrounds were tested: prototrophic and the auxotrophic BY4741. Results presented for
both the Yeast 5 and Yeast 7 models. CAD corresponds to cis-aconitate decarboxylase. ......... 39
Table 19: FVA results (allowing a 5% decrease in the growth rate) for both Yeast 5 and Yeast 7
model, using 2 sets of constraints. CAD corresponds to the cis-aconitate decarboxylase
enzyme. ....................................................................................................................................... 40
Table 20: Single deletion mutants identified by OptKnock and OptGene selected to be
experimentally validated. ............................................................................................................ 43
Table 21: Overview of final itaconic acid titers, yield, productivity, galactose consumption rate
and growth rate of the cultures with the BY4741 and mutant strains harboring the pGal1-
AtCad1 plasmid. .......................................................................................................................... 45
Table 22: Deletion strategies predicted by the OptKnock tool for the coupling of itaconic acid
to celular growth. ........................................................................................................................ 46

viii
Contents Acknowledgments .......................................................................................................................... i
Abstract ......................................................................................................................................... ii
Resumo ......................................................................................................................................... iii
List of Abbreviations ......................................................................................................................iv
List of Figures ................................................................................................................................ v
List of Tables ................................................................................................................................. vii
1. Introduction .......................................................................................................................... 1
1.1. Organic acids as added-value building block chemicals: the case of itaconic acid ....... 1
1.1.1. Microbial production of itaconic acid based on Aspergillus terreus ..................... 3
1.1.2. Other microbial hosts used for itaconic acid production ...................................... 5
1.1.3. Advantadges and disadvantadges of using S. cerevisiae as a host system for the
production of carboxylic acids .............................................................................................. 7
1.2. Metabolic engineering strategies used to improve the efficiency of yeast-based
production of carboxylic acids .................................................................................................. 8
1.3. Metabolic modelling methods .................................................................................... 10
1.3.1. Generation of genome-scale metabolic reconstructions .................................... 11
1.3.2. Constraint-based modelling methods ................................................................. 13
1.3.3. Tools used in metabolic modelling based on FBA ............................................... 16
1.3.4. The role of metabolic modelling tools in improving production of carboxylic
acids in S. cerevisiae ............................................................................................................ 18
1.4. Introduction to the theme of the thesis...................................................................... 20
2. Materials and methods ....................................................................................................... 22
2.1. Strains and growth media. ........................................................................................... 22
2.2. Exchange of the GAL1 promoter for other promoters in the pGAL1-AtCad1 plasmid .... 24
2.2.1. In vitro DNA Manipulations ....................................................................................... 24
2.2.2. Yeast transformation ................................................................................................. 25
2.3. Batch fermentations for the production of itaconic acid in yeast cells using strains
derived from BY4741 or 23344c ............................................................................................. 26
2.3. Batch fermentations for the production of itaconic acid in yeast cells using the TAM
strain ...........................................................................................Error! Bookmark not defined.
2.4. Batch fermentations for yeast-based production of itaconic acid using microplates ..... 27
2.5. Simulation of yeast metabolism in itaconic acid-producing cells .................................... 28
3. Results ................................................................................................................................. 32
3.1. Effect of the promoter region used to drive expression of AtCad1 in the ability of
yeast cells to produce itaconic acid ........................................................................................ 32

ix
3.2. Assessment of the size of the inoculum and genetic strain background in yeast ability to
produce itaconic acid from pGal1-Atcad1 .............................................................................. 33
3.3. Effect of the elimination of PDC genes in the ability of yeast cells to produce itaconic
acid ..............................................................................................Error! Bookmark not defined.
3.3. Simulation of yeast metabolism in itaconic acid-producing cells .................................... 35
3.1.3 Flux variability analysis ............................................................................................... 40
3.4. Identification of gene deletions increasing the production of itaconic acid by yeast cells
................................................................................................................................................. 41
3.4.1 In silico identification: OptKnock and OptGene ......................................................... 41
3.4.2. Preliminary results for the proposed mutants in shake-flask fermentations ........... 44
3.5. Role of ammonium availability in itaconic acid production ............................................. 47
3.5.1. In silico robustness analysis ....................................................................................... 47
3.5.2. Microplate fermentations to test different concentrations of ammonium in the
fermentation medium ......................................................................................................... 48
4. Discussion ............................................................................................................................ 49
5. References ........................................................................................................................... 54
2. Annex................................................................................................................................... 61
Annex I) Extracellular concentrations of pyruvic and acetic acid in the BY4741 and TAM
cultures .................................................................................................................................... 61
Annex II) Lists of single mutants proposed by OptGene and OptKnock ................................. 62
Annex III) Extracellular concentrations of itaconic acid and galactose in the batch cultures of
the mutants proposed by OptKnock and OptGene ................................................................ 66

1
1. Introduction
With the decrease in oil reserves and the growing environmental concerns related to the greenhouse
effect caused by petrochemical activity, a worldwide recognition of the need to develop economically and
environmentally sustainable chemical processes is growing. Countries having high energy demands and
limited resources, such as the United States, are now putting a great effort in research focusing this
thematic, being envisaged a replacement of 25% of the fossils fuels used by renewable sources in the next
30 years [1]. To accomplish this ambitious goal, efforts are being put on the development of strategies
aiming to explore microbes as cell factories for the production of biofuels and of industrial chemicals that
are nowadays obtained based on petrochemical industry. The development and implementation of
biorefineries is another strategy that is being used in this context, these being dedicated facilities in which
sugars, oils and proteins obtained from renewable biomass are expected to be converted into biofuels
and, eventually into other added-value industrial chemicals [2]. Although production of biofuels from
biomass has attracted a great deal of interest among the public, the production of renewable chemicals
also represents an important opportunity in the industrial biotechnology field, having lower capital costs
and potentially higher returns. Indeed, the diversification of substrates that can be produced in biomass-
based centrals is considered one of the key steps to assure the economic sustainability of biorefineries
[2].
1.1. Organic acids as added-value building block chemicals: the case of itaconic
acid
In 2004 the U.S. Department of Energy (DOE) has performed an initial screening of the renewable
chemicals that could be co-produced as side streams of biofuels and bioenergy. The analysis resulted in a
list of 30 monomers that can be obtained by fermentation of sugars and that can be used as building block
molecules [3].
Alternatively, these can be novel products that are not yet used in the chemical industry or can serve as
direct replacements of fuel-derived compounds that are already supplied to the chemical industry, such
as maleic anhydride. These building block chemicals can then be chemically converted to intermediate
products that are used in the industry. A compilation of the top value added bulk compounds identified
by the U.S. DOE and the BREW project, as part of the European Comission GROWTH programme is listed
in Table 1 [3], [4]. Since the release of this report, the progress in this biotechnological field has produced
substantial changes in the economics of production of bulk chemicals, such as a decrease in costs.
Consequently, the production of this bulk compounds is an attractive opportunity not only to be used a
co-production strategy in the context of biofuels but also to be produced alone from feedstocks. With the
implementation of increasingly efficient processes and the fluctuations in fuel prices, the potential

2
markets for these building block molecules are expanding and the profit opportunities increasing.
Currently, some of these building blocks, obtained through microbial fermentation, are already available
the market, including 1,4-butanediol, isoprene, isobutanol, lactic, succinic, citric and acetic acids [2].
Table 1: Top added value building blocks from identified by the DOE and BREW reports [3], [4]
Number
of
carbons
Compounds
Commercial
production by
microorganism?
Number
of
carbons
Compound
Commercial
production by
microorganism?
2 Ethanol Y 4 1,4-butanediol y
Acetic acid Y 5 Glutamic acid Y
3 Glycerol N Itaconic acid Y
3-Hydroxy propionic acid N Levulinic acid N
Lactic acid Y Xylitol/arabinitol N
1,3-Propanediol Y Furfural N
Acrylic acid N 6 2,5-Furan dicarboxylic
acid
N
4 1,4- Diacids (succinic,
fumaric and malic)
Y Glucaric acid N
Aspartic acid N Sorbitol N
3-Hydroxybutyrolactone N 5-Hydroxymethylfurfural N
1-butanol y Adipic acid N
Thirteen of the identified add-value molecules are carboxylic acids, as it can be seen in Table 1. The
different functional groups present in carboxylic acids give these molecules the necessary versatility to be
used in different synthetic routes, where they can be subjected to enzymatic and/or chemical catalysis.
Furthermore, most of the carboxylic acids identified as interesting building-block molecules are produced
by most microbes during the course of their normal metabolic activity. Although the market for organic
acids is still limited, the optimization of the production processes in terms of productivity and yield, is
expected to significantly reduce the associated production costs thereby greatly increasing the profits
generated.
Itaconic acid, the carboxylic acid that is focused in this thesis, is a di-carboxylic acid that has one of the
carboxyl groups conjugated to a methylene group (Figure 1). The economic value of itaconic acid is
estimated in 1.5–2.5 US$/kg (1.36-2.2 €/kg) and the total global market is predicted to increase to 398.3
million US$ (352 million €) in 2017. The interest in this compound derives from its application in resins
and as a building block for plastics, acrylate latexes, super-absorbents and anti-scaling agents, among

3
others [5]. Currently itaconic acid occupies a niche market where it is used as a co-monomer in the
production of styrene-butadiene rubber and acrylate latexes with applications in the paper and
architectural coating industry [6]. In 2011 there were four major companies bio-producing itaconic acid,
the global leader being Qingdao Kehai Biochemistry. The market of itaconic acid is currently stagnated
mainly due to the narrow range of applications and the fact that the annual production is currently at half
its maximal capacity. The production capacity for itaconic acid in 2011 was estimated to approximately
80,000 MT per year, nevertheless, the annual production reported was only of 41,400 MT[6].
1.1.1. Microbial production of itaconic acid based on Aspergillus terreus
Itaconic acid is naturally produced by many microorganisms such as Ustilago zeae, Ustilago maydis,
Candida sp and Rhodotorula sp. However, the most relevant natural producer is Aspergillus terreus, where
the titers of itaconic acid produced in fermentation can reach up to 85 g/L [7]. The biochemical pathway
leading to itaconic acid synthesis from sugar in A. terreus has already been characterized: glucose enters
the glycolytic pathway and one of the two pyruvate molecules produced is converted to acetyl-coA by the
cytosolic pyruvate dehydrogenase complex, while the other pyruvate molecule is carboxylated to
oxaloacetate. Both of these products enter the TCA cycle, where they are condensed to citrate. The
isomerization of citrate to isocitrate includes an intermediate dehydration step that leads to the formation
of cis-aconitate, the precursor of itaconic acid (Figure 2). Conversion of cis-aconitic acid into itaconic acid
is mediated by the enzyme cis-aconitate decarboxylase (CadA), encoded by the cad1 gene. Quantification
of enzymatic activity obtained from different cellular fractions together with 14C-labelling experiments
suggests that CadA is a cytosolic enzyme, although the steps leading to the synthesis of cis-aconitic acid
Figure 1: Itaconic acid and its compound derivatives. From Werpy, T. & Petersen, G.2004,[3]

4
occur in the mitochondria. Consequently, the need of having a step involving transport of cis-aconitate
from the mitochondria to the cytosol is required, although no such transporter has yet been identified.
The cad1 gene is included in a genomic region of A. terreus that also includes the ATEG_09960,
ATEG_09970 and ATEG_09972 genes (Figure 3). These genes encode, respectively, a putative regulator
protein which contains a zinc finger, a predicted mitochondrial carrier of tricarboxylic acids and a plasma
membrane transporter of the Major Facilitator Superfamily.
Currently itaconic acid is produced by fermentation using Aspergillus terreus and A. niger, the final titers
obtained ranging 85 g/L and 7 g/L, respectively [7], [8]. However, this is still well below from the titers
1: putative regulator: contains zinc finger domain and fungal specific transcription factor domain
2: (MTT) putative mitochondrial tricarboxylate transporter
3: (cadA) cis-aconitate decarboxylase
4: (MFS) putative Major Facilitator Superfamility transporter (small solutes)
Figure 3: Itaconic acid and lovastatin gene clusters. Adapted from Li et al, 2012 [9].
Figure 2: Biosynthetic pathway of itaconic acid in Aspergillus terreus. Itaconic acid biosynthetic pathway marked in red. From Steiger et al, 2013 [7].

5
obtained in the industrial production of citric acid from Aspergillus niger and the theoretical achievable
yields of 240 g/L [9]. Consequently, efforts have been made to identify the limiting parameters in the
production of this acid and to implement optimization strategies. Tevz et al, 2010 have proposed that the
flux through glycolysis could be limiting the production of itaconic acid in A. terreus, as a result of an
allosteric negative effect imposed by citric acid over the activity of glycolytic enzymes, as observed to
occur in A. niger [10]. In that sense the pfkA gene, encoding phosfrutokinase, has been engineered to
bypass the inhibitory effect exerted by citric acid. Expression of this engineered pfkA gene in A. terreus
increased production of itaconic acid by 2-fold, comparing to the values that were produced by a strain
expressing the wild-type pfkA gene[10]. In a recent study aiming to improve production of itaconic acid in
A. terreus, the effect of over-expressing a set of genes found to be up-regulated in A. terreus in high
itaconic-acid producing conditions was examined [9]. These genes included cadA, mttA , mfsA and
ATEG_09960, the four genes of the itaconic acid-cluster; and also gdpA and acoA, encoding, respectively,
glyceraldehyde 3-phosphate dehydrogenase and aconitase. Additionally, the effect of overexpressing
citA, the gene encoding citrate synthase, was also examined. The overexpression of these genes was
found to impact the production of itaconic acid but also of other organic acids such as citrate. The
individual over-expression of cadA and of mfsA were the most beneficial strategies, highlighting the
importance of a high cis-aconitate decarboxylase activity and of the export of the itaconic acid [11].
Besides genetic manipulation, the improvement of itaconic acid production has also been achieved
through modulation of the composition of the growth medium. More specifically, the amount of
potassium and copper in the growth medium was found to improve the production of itaconic acid. The
concentration of copper was positively correlated with fungal growth, while the amount of copper was
negatively correlated. Thus, the increase in biomass is thought to be the basis of the higher acid
production obtained, with decreasing yields on the carbon source, as the glucose consumption increased.
The beneficial effect obtained upon supplementation of the growth medium with potassium was also
observed in a batch bioreactor setting [12].
1.1.2. Other microbial hosts used for itaconic acid production
The genetic background and the physiology of the Aspergillus terreus species is considered to be an
important factor contributing for the limited yields of itaconic acid that can be produced by this yeast
species. Its poor genetic tractability is another important disadvantage. In that sense, different host
systems have been explored as alternative producers of itaconic acid. One of these hosts is A. niger, a
species that already has a long-track record of utilization in the biotechnological industry, where it is used
for industrial production of citric acid. To enable production of itaconic acid in A. niger, strains expressing
the AtcadA enzyme have been engineered [7]. Although the knowledge previously gathered on
optimization of citric acid production in A. niger may be beneficial for itaconic acid production, the use of
this species is limited by the extensive amounts of oxalic acid that are produced as a by-product.
Therefore, the design of a good strategy to produce itaconic acid in A. niger has been found to include the

6
choice of a strain demonstrated to accumulate citric acid, the use of environmental conditions similar to
those used for citric acid production and the exploration of other genetic modifications considered of
interest. The expression of mfsA and mttA genes from A. terreus, together with CadA, has been found to
increase production of itaconic acid in A. niger, although over-expression of mfsA has also been found to
lead to increased accumulation of oxalic acid in the broth [13]. To circumvent this, a strain devoid of
oxaloacetate hydrolase, the enzyme that leads to synthesis of oxalic acid, has been engineered, this strain
producing around 2-fold more itaconic acid than the non-manipulated strain [13]. Environmental
conditions found to favor itaconic acid production in A. niger include the use of low oxygen dissolved
concentrations (about 20%) [13]. In a recent effort, itaconic acid titer in fermenter cultures with A. niger
were increased up to 7 g/L by heterologous expression of the codon-optimized itaconic acid cluster from
A. terreus, encompassing the cadA, mttA and mfsA genes. The expression of these genes was applied in a
genetic background lacking the oahA and goxC, encoding oxaloacetate hydrolase and glucose oxidase,
with the goal of preventing the production of two major byproducts: oxaloacetate and gluconic acid. It
was observed that the expression of MFS transporter was only relevant when the original strain already
produced high levels of itaconic acid, i.e., when the mttA and cadA had already been introduced in the
strain. Additionally, the transporter encoded by mfsA was proposed to also export citric and oxalic acids
[8].
Table 2: Overview of the host used for the production of itaconic acid, other than Aspergillus species, and the genetic modifications used.
Host Genetic modification Titers
obtained Reference
E. coli Expression of CadA from A. terreus < 10 mg/L [14]
E. coli Expression of CadA from A. terreus
+ expression of altA and acnA from C. glutamicum (citrate
synthase and aconitase)
+ deletion of pta and ldhA (phosphate acetyltransferase and
lactate dehydrogenase)
680 mg/L [14]
E. coli Expression of CadA from A. terreus
+ deletion of icd (isocitrate dehydrogenase)
0.35 g/L [15]
E. coli Expression of CadA from A. terreus
+ deletion of icd (isocitrate dehydrogenase)
+ Oe-acnB (aconitase)
4.34 g/L [15]
Synechocystic sp Expression of CadA from A. terreus 0.9 mg/L [16]
S. cerevisiae Expression of CadA from A. terreus 59 mg/L [17]
S. cerevisiae Expression of CadA from A. terreus
+ deletion of ade3, M5 and tes1
160 mg/L [17]

7
(a cytoplasmic C1-tetrahydrofolate synthase, a tryptophan
2,3-dioxigenase and a peroxisomal acyl-coA thiosterase)
Production of itaconic acid has also been attempted in various hosts other than Aspergilli including E. coli,
Synechocystic sp and S. cerevisiae, although the titers obtained in these systems are well below those
obtained in A. terreus. An overview of the host systems and the required genetic modifications is
presented in Table 2.
1.1.3. Advantadges and disadvantadges of using S. cerevisiae as a host system for the
production of carboxylic acids
S. cerevisiae has emerged as an interesting host for production of carboxylic acids due to its low
nutritional requirements, simple morphology and remarkable tolerance to low pH conditions, which
allows the direct recovery of the acids produced in their undissociated form, bypassing the need of having
to decrease the fermentation broth pH after the fermentation. Other advantages of the use of S.
cerevisiae includes its long history of safe use in biotechnological industry and the central role played by
this species as a model species and an experimental system. A huge panoply of genetic resources are
today available to be used in yeast which significantly boosts all the research performed in this species
including strain optimization [18]–[20]. The availability of several improved and refined genome-scale
models for the yeast metabolism is another advantage for the exploitation of this microbe as a platform
in metabolic engineering [21]. The advantages and disadvantages of S. cerevisiae, compared to other host
systems used for production of carboxylic acids, are summarized in Table 3.
Table 3: Advantages and disadvantages associated with the production of organic acids in bacteria, filamentous fungi and yeast.
Bacteria Filamentous fungi Yeast
Advantages High growth rates Natural producers Low nutritional requirements
Simple morphology
Resistant to low pHs
Easier approval for human
consumption
Highly developed molecular
biology toolbox
Genome-scale metabolic models
available
Disadvantages Complex
nutritional
requirements
Complex
morphology causing
increased aeration
Not a natural producer in some
cases

8
costs and high
variability
Production of toxins
1.2. Metabolic engineering strategies used to improve the efficiency of yeast-
based production of carboxylic acids
An important step for the establishment of microbe-based production of organic acids is the increase in
efficiency, enabling the prices to become more competitive. Strain optimization in yeast, as in any other
host, aims this goal. Classical tools used for strain optimization in yeast include the use of random
mutagenesis and directed evolution; however, in the recent years the design of more rational metabolic
engineering strategies have emerged as powerful tools in strain engineering and optimization allowing a
much more targeted rewiring of the cell’s metabolism and/or physiology. In this sense, the design of yeast
strains optimized for the production of carboxylic acids aims at four major goals:
1. Elimination of alcoholic fermentation;
2. Linking of the glycolytic pathway with the production of the metabolite of interest;
3. Engineering the export of the product;
4. Improving strain robustness, by increasing its tolerance to the products, substrates or culture
environment [19].
Ethanol is the main product of yeast alcoholic fermentation and thus production of this metabolite
represents the most important drain of carbon and co-factors. Several attempts have been made to
eliminate alcoholic fermentation in yeast in order to increase production of carboxylic acids synthesized
along the TCA cycle. The first strategies attempted focused on the elimination of the four genes encoding
alcohol dehydrogenase enzymes (ADH1-4); however, this approach resulted in the toxic accumulation of
acetaldehyde and in the increase in glycerol production, suggesting co-factor imbalance [22]. Subsequent
approaches aimed at the elimination of the PDC1, PDC5 and PDC6 genes, encoding the three isoenzymes
that compose the pyruvate decarboxylase complex [23]. This strain, named Pdc-, was found to be unable
to grow in defined or complex media unless a source of C2 (such as acetate or ethanol) was provided to
the growth medium. The molecular reasons for such phenotype were unclear, although it had been
suggested that it could be attributable to the key role played by pyruvate decarboxylase reaction in
maintaining the pool of cytosolic acetyl-coA, necessary for lipid and lysine synthesis [24]. Consistently, the
C2 requirement was partially circumvented through the overexpression of the GLY1 gene, encoding
threonine aldose, which catalyzes the cleavage of threonine into glycine and acetaldehyde, allowing the
formation of cytosolic acetyl-coA. Upon this genetic modification Δpdc strains were found to be able to
grow only on glucose-limited chemostat cultures; while in batch cultures the cells were found to excrete

9
high amounts of pyruvate but are unable to grow. The molecular basis for this glucose sensitivity remained
unexplained [25]. These two phenotypic traits of the Δpdc strains represent a serious barriers to the use
of these mutants in production of carboxylic acids. To circumvent this, a C2-independent glucose-tolerant
Δpdc strain was obtained by evolutionary engineering, this being designated as TAM [26]. To bypass the
C2 requirement, Δpdc cells were grown in chemostat with decreasing concentrations of acetate. Then,
prolonged shake-flask cultures of the C2 independent strains were cultivated in a media containing 2%
glucose, with 27 serial transfers and increasingly culture growth rates. At the end, the evolved TAM strain
exhibited a maximal growth rate of 0.2 h-1 and, expectedly, produced higher titers of pyruvic acid.
Transcriptomics analysis revealed that the TAM strain has a partial alleviation of the Mig1p-mediated
glucose repression, which results in the up-regulation of genes required for growth in alternative carbon
sources and in down-regulation of the HXT genes, encoding hexose transporters [26]. Further genetic
analysis of the TAM strain revealed an internal deletion on the MTH1 gene, leading to increased stability
of the protein. Mth1 is a transcriptional regulator involved in glucose sensing and its reduced degradation
has been linked to the down-regulation of the expression of the HXT genes, thus accounting for the
decreased glucose uptake rate of the TAM strain. Although these findings don’t fully explain the basis for
the glucose sensitivity of the Δpdc mutants, two hypothesis were proposed:
The Δpdc mutants overproduce pyruvate and this acid does not exit the cell by passive diffusion.
A decrease in glucose uptake results in lower amounts of intracellular pyruvate, preventing
toxicity.
The blockage of the pyruvate decarboxylase reaction prevents the cell from rapidly oxidizing the
cytosolic NADH in the alcohol dehydrogenase enzymatic step. Since the NAD+ regeneration
through the respiratory chain might not occur at a sufficiently fast rate to counter-balance the
surplus of NAD+ utilization in glycolysis, redox imbalance might occur. By reducing intracellular
glucose cells reduce the glycolytic flux, which could then alleviate redox imbalance.
No mechanistic reason was found for the C2 independence of the TAM strain [27]. The obtained TAM
strain has been used with success to setup production of lactic and malic acids in yeast [28], [29].
Despite the general improvement that was obtained in production of carboxylic acids by yeast cells upon
elimination of ethanol formation, other problems have been found, these being very much dependent on
the acid that is being produced. For example, production of malic and succinic acids was found to be
limited by the fact that synthesis of these molecules is not coupled to ATP synthesis. This means that, for
those metabolites to be produced, part of the carbon source has to be directed towards respiration to
obtain energy for growth and maintenance processes. Furthermore, succinate is in a more reduced state
than malate, which means that its production in the glyoxylate cycle implies a net input of two electrons.
This is another source of decrease in the yield, since the carbon source also has to be oxidized through
the TCA cycle. For these reasons, metabolic engineering of succinate production has been found to be
considerably more difficult as all redox reactions found in yeast metabolism have to be taken into account.

10
To solve this, the use of metabolic modelling methods is essential to predict genetic changes that rewire
the metabolism towards the production of the compound of interest.
1.3. Metabolic modelling methods
Rational metabolic engineering approaches have been successfully used to improve strain
performance, however such attempts are limited to the manipulation of only a handful of genes encoding
enzymes and regulatory proteins that were selected based on their anticipated involvement in the
pathway under study, based on available information and research experience [30]. Distant pathways can
play important roles in the synthesis of the compound of interest and genetic alterations can have
unpredicted effects on apparently unrelated parts of the metabolism; therefore, the outcome of these in
the overall metabolism is very difficult to foresee. Such limitation led to the development of the new field
of systems metabolic engineering aiming to develop optimized strain within a systems biology framework,
in which whole cellular networks are optimized [31]. As a result of the work developed in this field,
Genome-Scale Metabolic Models (GSMM) are being built, describing the metabolism of a given organism
through a wide range of mathematical equations and that can be used to guide the engineering of
biological systems. In addition to direct improvements in production capacity of the strains, GSMMs can
also be used to predict relevant phenotypic traits such as growth rate or consumption of a nutrient [32].
A main limitation of these metabolic models is the fact that they ignore all regulatory events that are
underneath the control of microbial metabolism, because much of this knowledge is unknown and also
because some of these regulatory events could not be easily translated through mathematical formalisms.
Thus, the establishment of mechanistic models that describe cellular behavior are usually based on
simplifications [33]. These mathematical models can be divided in two main categories: stoichiometric
and kinetic.
The term stoichiometric modelling applies to all methodologies that represent the cell
metabolism using a metabolic network based on reaction stoichiometry and that assume a pseudo-steady
state for internal metabolites. The stoichiometric framework is only the starting point, since other inputs,
such as constraints, are needed [34]. Constraint-based modelling uses physiochemical constraints (such
as mass balances, energy balances, and flux limitations) to describe the potential behavior of an organism
[35]. In principle, if all constraints operating under a given set of circumstances are known, the actual
state of a metabolic network could be elucidated. Although this scenario does not seem likely to occur in
the near future, the imposition of constraints determines which fluxes can and cannot occur in the cell
[34]. After this selection, a physiologically meaningful steady state is identified by carrying out an
optimization to find the maximum value of a specified objective function with respect to the constraints
imposed in the model. Flux Balance Analysis (FBA) is a constraint-based modelling approach in which the
stoichiometry of the underlying biochemical network constrains the solution [35]. In FBA the solution

11
space is realistically narrowed down by selecting only the flux distribution that can optimize a biologically
relevant objective, such as biomass or ATP production [36]. The main limitation of stoichiometric models
is the lack of regulatory and kinetic input in the models, which limits the accuracy of the predictions.
Another important drawback of constraint-based modelling is the fact that it does not predict metabolite
concentrations, but only fluxes [37]. The model used, which is highly dependent on the database curation,
and on the identification of realistic constraints, based on experimental data, are other limiting factors
that influence greatly the process and that can lead to inaccurate predictions. Every stoichiometric model
available has errors, since correct manual revision of every reaction and metabolite is very hard and time-
consuming. The use of inaccurate constraints is also a reason for incorrect simulation results, where the
obtained flux distributions are significantly different from experimental data.
When detailed information is available about the kinetics of specific cellular processes (e.g.
enzyme-catalyzed reactions, protein–protein interactions, or protein–DNA binding) it is possible to
describe the dynamics of these processes by combining kinetics with the known stoichiometry of
metabolic pathways [33]. This approach has been applied, for example, in modelling of glycolysis and the
pentose phosphate pathway undertaken by S. cerevisiae [38], [39]. However, currently it is difficult to
build accurate dynamic models of cellular metabolism due to a strong dependence on having precise
knowledge of the functional form of all involved enzymatic rate equations and their associated parameter
values. Even when in vivo experimental data is available, the estimation of the parameters is a difficult
task. Additionally, in vitro experimental measures are less reliable in this context [40], which hampers the
correct identification of the complete kinetics of the system.
1.3.1. Generation of genome-scale metabolic reconstructions
The development of Genomics has boosted the development of genome-scale metabolic
reconstruction models for many organisms. These in silico models are created in a bottom-up fashion,
representing a biochemical, genetic and genomic (BiGG) knowledge base. They are then converted into
mathematical models to be used to determine physiological properties and states [41]. This
reconstruction process is usually iterative: the first model is made publicly available and then refined
through a continuous input that is provided by the scientific community. Thus, consecutive releases of
improved versions of the original model are common. The minimum information necessary is the
annotated genome and physiological information [41]. The experimental protocol for the generation of
metabolic reconstruction is schematized in Figure 4.
12
In what concerns the yeast, an ongoing community effort has been responsible for the update of the
consensus network representation of yeast metabolism, yielding five consecutively revised and updated
models for the S288c [42]–[46]. In this work, the Yeast 5 and Yeast 7 models were used
(http://yeast.sourceforge.net/) [44], [47]. The first was the result of a review of gene-reactions
associations, among other improvements, in the Yeast 4 model. One limitation of this model is the fact
that blocked pathways exist in this version and ergosterol metabolism is incompletely represented in the
metabolism. As a result, sterols need to be present in the simulated medium for in silico anaerobic growth
to occur [44]. Meanwhile the model was revised, incorrect reactions were removed and the lipid
metabolism manually curated, yielding the Yeast 7 model. The introduction of these changes enlarged the
lipid metabolism representation in the model and enabled the simulation of growth on fatty acids as the
sole carbon source. However, these changes also created a blockage in the mitochondrial fatty synthesis,
due to the lack of utility of the end products [46]. These models have been used in the past years in several
applications, from guidance of metabolic engineering strategies to phenotype prediction [48]. Six
examples of these applications are listed in Table 4, with a focus on in silico-guided metabolic engineering
strategies.
Figure 4: Experimental design for the generation of high-quality genome-scale metabolic reconstructions. From Thiele and Palson, 2010 [41].

13
Table 4: Some applications of the Yeastnet models. Six studies focused on metabolic engineering are listed, out of 106 reported papers using genome-scale models of Saccharomyces cerevisiae metabolism (http://sbrg.ucsd.edu/cobra-predictions-app/).
Methodology Application Reference
OptKnock Identification of deletion strategies for the
overproduction of 2,3-butanediol [49]
OptGene Identification of deletion strategies for the
overproduction of vanillin [50]
OptGene with MOMA objective function
Identification of deletion strategies for the overproduction of sisquiterpene
[51]
FBA Identification of the necessary steps to rewire the
metabolism towards the production of muconic acid [52]
FBA and robustness analysis
Identification of control steps in fumarate production [32]
OptGene Identification of deletion strategies for the
overproduction of succinic acid [53]
1.3.2. Constraint-based modelling methods
The dissemination of constrain-based modelling methods has created a demand for a computational tool
encompassing many of the FBA related methods for analyzing metabolic networks. In 2007 the COBRA
(COnstraint-Based Reconstruction and Analysis) toolbox for MATLAB and Python was created with this
purpose, allowing predictive computations of steady-state and dynamic optimal growth behavior; assess
the effects in metabolic network of gene deletions; perform comprehensive robustness analyses and
sampling the range of possible cellular metabolic states [54]. This software has been updated to the 2.0
version to include methods that have been developed since its original release: network gap filling, 13C
analysis, metabolic engineering, omics-guided analysis and visualization [55]. These two versions of the
COBRA toolbox have now 346 and 243 citations (by July 2nd) , respectively, according to the information
available at ISI Web of Science, which clearly demonstrates the value that constraint-based methods have
nowadays in the field of metabolic engineering. In the following sections some of these constrain-based
methods are introduced, with an emphasis on Flux Balance Analysis, a commonly used approach in
metabolic engineering.

14
1.3.2.1. Flux balance analysis (FBA): Formulation of the mathematical model, constraints and
optimization
FBA is an approach based on Linear Programming, where the constraint maximization of an objective
function enables the calculation of metabolite fluxes through a given metabolic network. The first step is
the representation of the metabolic reactions in a mathematical form through the stoichiometric matrix
S. It has n rows and m columns, where n is the number of metabolites and m is the number of reactions
included in the model. Each position of the matrix is filled with the stoichiometric coefficient of each
metabolite for each reaction. Since there are many reactions in the model in which only a few metabolites
participate in, the matrix is sparse, for it is mainly composed of zeros [56]. Constraints are applied in the
form of mass balances and inequalities. The mass balances are determined as follows: the change in
metabolite concentration is equal to the product of the reaction fluxes and the stoichiometric coefficients.
This creates a set of ordinary differential equations that can be represented using the S matrix and v
vector, which represent all the fluxes through the reactions. Due to the steady state assumption
(Equation 1), the derivative of the metabolite concentrations is zero and the mathematical problem is
converted into a linear system (Figure 5) [56].
Figure 5: Mathematical representation of a metabolic model: the glycolytic pathway in E. coli (a), the stoichiometric matrix (b) and inequality constrains (c). From Becker et al, 2007 [54].

15
𝑆. 𝑣 = 𝑑𝑋
𝑑𝑡 𝑠𝑡𝑒𝑎𝑑𝑦−𝑠𝑡𝑎𝑡𝑒⇒ 𝑆. 𝑣 = 0
Equation 1: The assumption of steady state: X is metabolite concentration and dX/dt is the derivative of metabolite
concentration over time.
Inequalities can be attributed to each reaction to assign upper and lower bounds of its fluxes. These two
kinds of constraints define the solution space: the set of flux distributions that are allowed given these
conditions [35]. The problem is solved by optimizing the system towards a given biological objective, for
example, the maximization of biomass production. In that case, the goal is to maximize the conversion of
metabolites such as nucleic acids, proteins and lipids in biomass, a process that is represented in the
model as an additional biomass formation reaction/flux. The coefficients for this reaction are based on
experimental measures, meaning that the reaction is scaled, so that the flux through it corresponds to the
exponential growth rate of organism [57].
Although biomass maximization is the most widely used objective function, the appropriate objective
function is dependent on the growth conditions that are being simulated. In fact, there are reports of the
maximization of biomass being the best objective function to describe the growth on limited nutrients in
continuous cultures, while maximization of biomass or ATP yield per flux unit seems to best fit the
behavior of batch cultures [58], [59].
Thus, the matrix and the constraints define a linear system of equations, which is solved by linear
programming. The application of mass balances and reactions bounds constrains the solution space.
However, there are still many possible solutions, that is, many v vectors that satisfy the system Sv=0 (v is
said to be in the null space of S). This is due to the fact that there are more reactions than metabolites
and, consequently, more variables than equations. Within the allowable solution space, FBA is used to
find the optimal solution, the flux distribution that maximizes a given reaction flux. This is performed
through the maximization of an objective function Z=cTv, where v is the flux vector and cT is a vector
containing the weights assigned to each reaction. When cT(x)=1 for some x and zero elsewhere, the
cellular objective is the maximization of reaction x [57].
1.3.2.2. The solution space in FBA The flux solution space of a given in silico genome-scale model gives an idea of the metabolic
capacity of that organism. Since it represents all possible physiological states, the larger it is, the more
interesting the organism is for the production of those compounds. The imposition of realistic constraints
reshapes the solution space and makes it smaller. Removal of useless reactions within the model has the
same effect. By adding heterologous reactions, the solution space increases, as the metabolic capacity of
the organism diversifies [60].

16
Figure 6: The solution space in flux-balance analysis. From Orth, Thiele and Palsson, 2010 [57]
The main limitations of FBA analysis are its inability to calculate metabolite concentrations due
to the lack of kinetic parameters, its assumption of steady state and the fact that it does not account for
regulatory events. In some cases there might be more than one flux distribution that maximize the cellular
objective, i.e., two different pathways might contribute equally to metabolite production. These different
solutions can be identified by Flux Variability Analysis (FVA) [61]
1.3.3. Tools used in metabolic modelling based on FBA
1.3.3.1. Robustness
Robustness analysis is devoted to the exploration of the sensitivity of the cellular objective to changes in
flux levels of essential gene products. It implements an application of FBA to the study of the metabolic
capacities of a given organism. This approach first calculates the wild-type in silico flux, the flux vector
obtained from a regular FBA with only external constraints. Then, the flux through the reaction to be
studied is gradually increased and decreased and the objective function is re-calculated [62].
1.3.3.2. Flux variability analysis
For a given solution space there may more than one flux distribution corresponding to a maximal objective
function value and FBA only identifies one of those distributions. This can happen due to the network’s
topology and the presence of redundancies within the metabolism. The impact of the existence of non-
unique solutions (alternative optima) in the conclusions drawn from the FBA results can be negligible or
highly significant [61].
Flux Variability Analysis (FVA) is focused on the determination of the maximum and minimum flux values
that allow the objective value to still be optimal. It does not identify all possible solutions, only the upper
and lower bounds on every solution. This algorithm first performs a regular FBA to determine the optimal
objective value in standard conditions. Then, both the upper and lower bound of the reaction
corresponding to the objective function are set to said value and, for each reaction in the model, the
maximal and minimal possible fluxes are found through maximization and minimization FBA. This way,

17
the variation that can occur in each single reaction in the model, while the objective function remains
unchanged (i.e., in its maximal value) is identified.
1.3.3.3. Metabolic engineering tools: OptKnock and OptGene
A number of algorithms have been developed (e.g. for the software package COBRA) to identify groups of
gene knockouts that are predicted to change the fermentation profile of a cell when growing at a
maximum growth rate, allowing for simultaneous overproduction of a metabolite of interest, a
characteristic known as growth-coupling [63]. In this section the OptKnock and OptGene tool will be
described in more detail as these are the more commonly used tools in metabolic engineering.
OptKnock
This algorithm suggests gene deletion strategies that may lead to an overproduction of a specific
metabolite. It focuses on network connectivity and finds the metabolic reactions that uncouple the
desired metabolite production from cellular growth. This is a bi-level optimization problem with a nested
framework (Figure 7), since it has two competing objectives: the inner cellular objective, which is growth,
and the bioengineering objective, which is the production of the metabolite [64].
OptGene
OptGene is an evolutionary programming-based method that can be used to identify deletion mutants
with improved substrate-specific productivity. Evolutionary algorithms are well-suited for the solution of
multiobjective optimization problems, a complex task [65]. The objective function is defined as the
product of the growth rate by the productivity, to take this into account. This objective function is non-
linear and its value is termed as the Biomass-Product Coupled Yield.
The scheme of the algorithm can be described in five steps:
1. Initialization of population: The algorithm creates a set of individuals, termed chromosomes, each
one having a set of genes. These genes are randomly assigned as present or absent.
Figure 7: The bilevel optimization structure of OptKnock. From Burgard, Pharkya and Maranas, 2003 [64].

18
2. Scoring fitness of individuals: Using FBA, MOMA or ROOM (Minimization of Metabolic Adjustment
and Regulatory On/Off Minimization, two methodologies used to predict mutant phenotype flux
distribution [66], [67]) to calculate the objective function value, a fitness value is assigned to each
individual, reflecting its ability to produce the compounds of interest.
3. Crossover of chromosomes: The individuals with the best score are selected and crossed, producing
new offspring.
4. Mutation: The offspring is subjected to mutation: in this case, gene deletion.
5. New population and termination: The new population suffers another round of evaluation, crossover
and mutation (steps 2, 3 and 4). When an individual is found with a satisfactory fitness score,
convergence is achieved and the process stops.
Contrasting with most evolutionary algorithms, the convergence curve for OptGene shows step changes,
indicating that the problem is discrete and that a good candidate is found suddenly and its performance
increases rapidly (Figure 8). This convergence can usually be achieved after 500 generations, making this
a quick strategy with low computational cost.
1.3.4. The role of metabolic modelling tools in improving production of carboxylic acids
in S. cerevisiae
There are at least three where constraint-based modelling has aided the design of metabolic engineering
strategies to improve organic acid production in S. cerevisiae [32], [52], [53]. The more paradigmatic case
is the production of succinic acid, this also being one of the first cases where metabolic modelling has
been used to improve yeast-based production of organic acids. Exploring OptGene, Patil et al., 2006 have
identified a set of deletion mutants proposed to have an increased ability to produce succinate [68]. Using
FBA, the maximum predicted theoretical yield of succinic acid production was 0.506 g/g glucose but this
implied the absence of growth. Differently, when biomass production was optimized, no succinic acid
could be produced. OptGene was used to propose a set of multiple knockouts that could have increased
Figure 8: Convergence curve of the Optgene algorithm. From Patil et al, 2005 [68].

19
succinic acid production and a metabolic engineering strategy was based on this, encompassing the
deletion of SDH3, SER3 and SER33. The deletion of one of the cytochrome b subunits of succinate
dehydrogenase (SDH3) minimizes succinate conversion to fumarate, allowing its accumulation in the TCA
cycle. The deletion of 2 isoenzymes of glycerate-3-phosphate dehydrogenase (SER3 and SER33) blocks
serine synthesis from 3-phosphate glycerate, forcing serine and glycine synthesis to occur through
isocitrate lyase, yielding succinate surplus. As glycine and serine are two aminoacids necessary for biomass
production, growth becomes coupled with succinate production (Figure 9). The mutant only grew with
glycine supplementation but a 13-fold increase in succinate production was observed, with only 33%
decrease in growth rate. Although the need for glycine supplementation was not predicted in silico, the
observed decrease in the growth rate is very similar to the predicted by OptGene.
In addition to succinic acid, itaconic acid production in S. cerevisiae has already been improved by in silico
guided metabolic engineering strategies, by iterating between in silico predictions of appropriate mutants
and in vivo cultivation of the mutants to assess itaconic acid production. In the study of Blazeck et al, 2014,
[17] the Yeast 1 model was used and single-deletion scans were performed with FBA to identify knockouts
that could improve itaconic acid production. A total of 11 knockouts were identified and tested in vivo;
while the experimental data presented some discrepancies with the in silico data, four overproducing
mutants were identified, these being Δynk1, Δfat1, Δshm2 and Δade3. The Δade3 was the most promising
candidate, as itaconic acid titers in this strains increased to 90 mg/L, compared to 59 mg/L in the wild-
Figure 9: The central carbon metabolism of S. cerevisiae, and the model-guided metabolic engineering strategy for succinate over-production. Legend: native reactions (blue solid line), lumped native reactions (blue dashed line), interrupted reactions (red solid line), up-regulated reactions (green solid line). From Otero et al, 2013 [53].

20
type. Following deletion of the Ade3p reaction from the model and a 2nd round of single-deletion scans,
six new strategies were proposed and tested in vivo. Of these, only the bna2 deletion in a Δade3
background resulted in increased itaconic titers in shake flask fermentations, of 122 mg/L. For this reason,
this double mutant was selected to continue the work. In the 3rd iteration, the Bna2p and Ade3p reactions
were removed from the model and a new search for relevant gene deletions yielded 17 targets. Upon
experimental validation, the Δade3 Δbna2 Δtes1 background was selected as the optimal one for
expression of the CAD gene, with itaconic acid titers of 126 mg/L [17]. The involvement of the 3 knockouts
on itaconic acid synthesis is non-intuitive: ADE3 encodes for a cytoplasmic trifunctional C1-
tetrahydrofolate synthase, involved in purine synthesis, the bna2p is a putative tryptophan 2,3-
dioxygenase acting on the NAD biosynthetic pathway, while Tes1p is a peroxisomal acyl-coA thioesterase
involved in fatty acid synthesis. Yet, the implementation of this strategy resulted in a significant increase
in itaconic acid production, highlighting the utility of genome-scale models to identify genetic changes in
distant pathways that can affect the production of a given compound of interest.
1.4. Introduction to the theme of the thesis
Heterologous expression of A. terreus AtCad1 enzyme has been successfully performed in previous works
undertaken at the iBB laboratory [69], [70]. For this a plasmid driving the expression of the Cad1 gene
from A. terreus C-terminally fused to a 6-histidine tail and put under the control of the galactose-inducible
promoter Gal1 was engineered. Transformation of yeast cells with this plasmid, named pGal1-AtCad1,
enabled production of itaconic acid in this species in titers achieving 25.12 mg/L [70]. In the first part of
the work that is described in this Master thesis it was examined the effect of several important variables
in the ability of S. cerevisiae to produce itaconic acid, including the initial cellular density of the culture,
the genetic background of the strain used and the promoter used to drive the expression of the AtCad1
gene. In the second part of the work the metabolic modelling strategies that were used in order to identify
gene deletions favoring production of itaconic acid in yeast cells will be described. Besides this general
goal, other aspects relevant for the metabolic modelling were also taken into account, including the
assessment of the cellular objective functions that best describe the production of itaconic acid by yeast
cells in batch cultures; the influence of the genetic background of the host strain in the production of
itaconic acid; how suboptimal states may affect the balance between maximization of the growth rate
and the drain of TCA precursors toward the cis-aconitate decarboxylase reaction; and the role played by
ammonium availability on the production of itaconic acid through the study of the robustness of the
metabolic network. The workflow is presented in Figure 10.

21
1) Initial characterization of the batch production of itaconic acid in S. cerevisiae and assessment of important variables
•The effect of initial cellular culture
•Involvement of strain’s genetic background and auxotrophies
3) Metabolic modelling of yeast metabolism in a model containing the cadA reaction
•Assessment of the best cellular objective function to describe the batch culture of cadA expressing yeast
•Investigation of the influence of aminoacid auxotrophies in itaconic acid production
•Exploration of suboptimal states in a cadA expressing yeast
•Investigation of the role of ammonium availability in itaconic acid production in yeast
4) In silico identification of interesting deletion mutants for the improvement of itaconic acid production in yeast
•Preliminary shake-flask results
Figure 10: Summarized description of the work presented in this thesis.

22
2. Materials and methods
2.1. Strains and growth media.
The strains used in this thesis are listed in Table 5, the mutant strains being derived from the BY4741
background and acquired from the Euroscarf collection [71].
Table 5: S. cerevisiae strains used in this study.
Strain Genotype
BY4741 MATa, his3Δ1, leu2Δ0, met15Δ0, ura3Δ0
23344c MATα ura3Δ0
ΔM2 MATa, his3Δ1, leu2Δ0, met15Δ0, ura3Δ0, M2::KanMx [72]
ΔM17 MATa, his3Δ1, leu2Δ0, met15Δ0, ura3Δ0, M17::KanMx [72]
ΔM18 MATa, his3Δ1, leu2Δ0, met15Δ0, ura3Δ0, M18::KanMx [72]
ΔM11 MATa, his3Δ1, leu2Δ0, met15Δ0, ura3Δ0, M11::KanMx [72]
ΔM3 MATa, his3Δ1, leu2Δ0, met15Δ0, ura3Δ0, M3:: KanMx [72]
ΔM15 MATa, his3Δ1, leu2Δ0, met15Δ0, ura3Δ0, M15:: KanMx [72]
ΔM9 MATa, his3Δ1, leu2Δ0, met15Δ0, ura3Δ0, M9:: KanMx [72]
ΔM10 MATa, his3Δ1, leu2Δ0, met15Δ0, ura3Δ0, M10:: KanMx [72]
ΔM7 MATa, his3Δ1, leu2Δ0, met15Δ0, ura3Δ0, M7:: KanMx [72]
Strains were maintained in YPD growth medium which contains 20 g/L glucose (Merck), 20 g/L yeast
extract (Difco) and 10 g/L bactopeptone (Difco). The synthetic MMB medium contains, per liter, 20 g
glucose (Merck), 1.7 g Yeast Nitrogen Base without amino acids and ammonium sulphate (Difco) and 2.65
g ammonium sulphate (Merck) . When needed MMB medium was supplemented with 20 mg/L histidine,
60 mg/L leucine and 20 mg/L methionine to complement the auxotrophies of the BY4741 background or
with 20 mg/L to complement the auxotrophy of the 23344c strain. Solid YPD or MMB was obtained
supplementing the liquid growth medium with 2% agar (Iberagar). Fermentation assays for production of
itaconic acid were performed in MMF which has the following composition: 20 g/L galactose or glucose,
depending on the assay; 2.65g/L ammonium sulfate; 1.7 g/L Yeast Nitrogen Base; 2 g/L of potassium
phosphate and a designated concentration of various amino acids, vitamins and trace elements which is
described in Table 6.
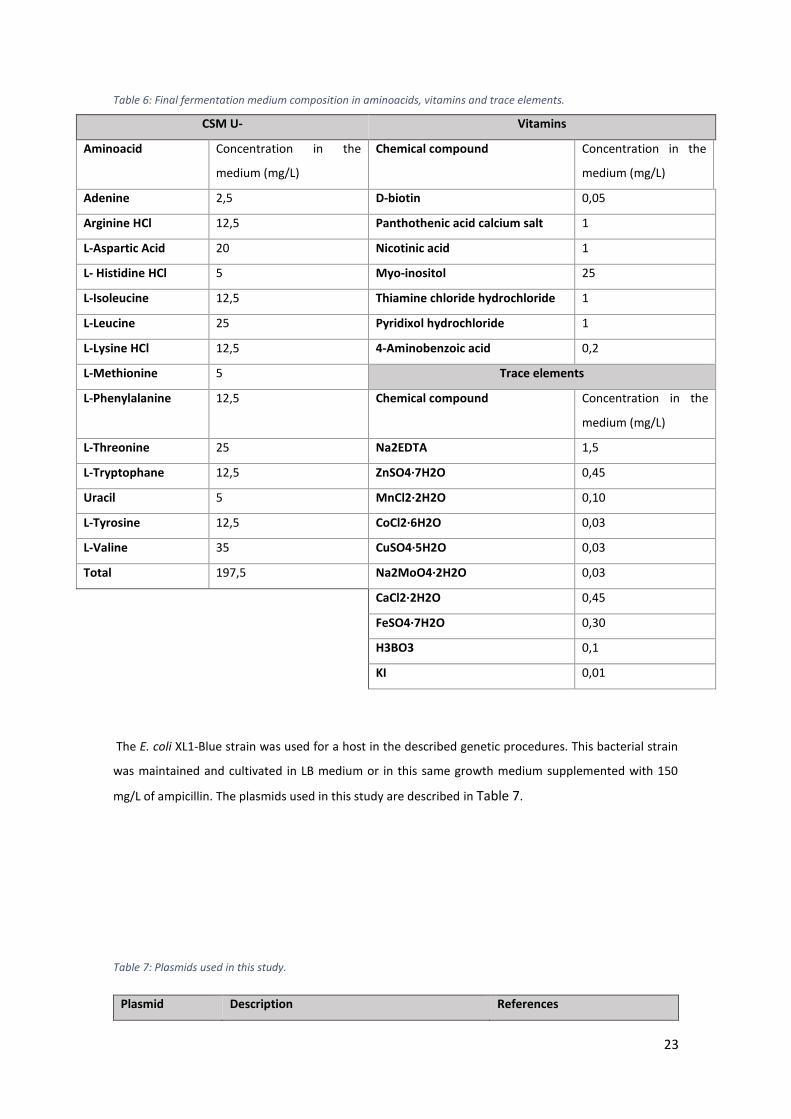
23
Table 6: Final fermentation medium composition in aminoacids, vitamins and trace elements.
CSM U- Vitamins
Aminoacid Concentration in the
medium (mg/L)
Chemical compound Concentration in the
medium (mg/L)
Adenine 2,5 D-biotin 0,05
Arginine HCl 12,5 Panthothenic acid calcium salt 1
L-Aspartic Acid 20 Nicotinic acid 1
L- Histidine HCl 5 Myo-inositol 25
L-Isoleucine 12,5 Thiamine chloride hydrochloride 1
L-Leucine 25 Pyridixol hydrochloride 1
L-Lysine HCl 12,5 4-Aminobenzoic acid 0,2
L-Methionine 5 Trace elements
L-Phenylalanine 12,5 Chemical compound Concentration in the
medium (mg/L)
L-Threonine 25 Na2EDTA 1,5
L-Tryptophane 12,5 ZnSO4·7H2O 0,45
Uracil 5 MnCl2·2H2O 0,10
L-Tyrosine 12,5 CoCl2·6H2O 0,03
L-Valine 35 CuSO4·5H2O 0,03
Total 197,5 Na2MoO4·2H2O 0,03
CaCl2·2H2O 0,45
FeSO4·7H2O 0,30
H3BO3 0,1
KI 0,01
The E. coli XL1-Blue strain was used for a host in the described genetic procedures. This bacterial strain
was maintained and cultivated in LB medium or in this same growth medium supplemented with 150
mg/L of ampicillin. The plasmids used in this study are described in Table 7.
Table 7: Plasmids used in this study.
Plasmid Description References

24
pGreg586 Empty plasmid (URA3 selection marker) [73]
pGal1-AtCad1 With codon-optimized AtCad1 gene from A.
terreus under the control of the GAL1
promoter, with 6-HIS tail (URA3 selection
marker)
[74]
pTEF1-AtCad1 With codon-optimized AtCad1 gene from A.
terreus under the control of the TEF1
promoter, with a 6-HIS tail (URA3 selection
marker)
In this work
2.2. Exchange of the GAL1 promoter for other promoters in the pGAL1-AtCad1
plasmid
A general strategy, based on homologous recombination, was designed to allow the exchange of the GAL1
promoter present in the pGal1-AtCAD1-His6 by the TEF1, ADH1, PMA1 and ICL1 promoters. This strategy
is schematically represented in Figure 11 shown in the Results section.
2.2.1. In vitro DNA Manipulations
The pGal1-AtCAD1-His6 plasmid was digested with 20 U of NotI (ThermoScientific) at 37ºC during 2 hours
after which the mixture was concentrated using the DNA Clean and Concentration Kit TM (Zymo
Research). The digested product was then incubated in the presence of 20 U of AscI (New England Biolabs)
at 37ºC overnight and finally with 15 U of Calf Intestinal Alkaline Phosphatase (CIAP) (Invitrogen) at 37ºC
for 45 minutes to prevent re-circularization. Appropriate restriction of the plasmid was confirmed by
running one sample of the digested DNA in a 0.8% agarose gel and confirming the release of a 500 bp
fragment which corresponded to the expected size of the GAL1 promoter.
The promoter region of TEF1, ADH1, ICL1 and PMA1 genes to be inserted in the digested pAtCad1 plasmid
were obtained by PCR using genomic DNA of S. cerevisiae BY4741 as a template. The promoter region was
considered to be the 1000 nucleotides located upstream of the genes start codon. The PCR reactions were
performed using Phusion® high-fidelity polymerase (Thermo Scientific) and a set of primers that were
designed to specifically hybridize in the selected promoter regions. Besides the region that allow PCR
amplification the primers selected also containing the necessary regions of homology to the plasmid,
essential for the homologous recombination process. The nucleotide sequences of the primers used are
indicated in Table 8, while in Table 9 and Table 10 it is described the reaction mixture used and the
experimental conditions used in the PCR amplification. Amplification of the fragments was confirmed by
running the PCR products in a 0.8% agarose gel. The bands obtained, having a size of approximately 1000
bp, were excised and purified using the JETQUICK Gel Extraction Spin kit (Genomed). The purified DNA
was then concentrated in a speed vaccum and finally resuspended in 10 µl of water.

25
Table 8: Primers used for the amplification of the promoter fragments.
Table 9: Reaction mixture used for the amplification
of the promoters
Table 10: Conditions of the PCR cycle for
amplification of the promoters
2.2.2. Yeast transformation
The amplified promoter regions and the digested pAtCad1 plasmid were used to transform S. cerevisiae
BY4741 cells using the Alkali-Cation TM Yeast Transformation kit (MP Biomedicals). For this, the cells were
cultivated until mid-exponential fase (OD600 nm=0.4) in 50 mL of YPD and then centrifuged for 5 minutes at
6000 rpm and 4ºC. The pellet obtained was resuspended in 4.5 mL TE (pH 7.5) and then centrifuged again
using the same conditions described above. The pellet was resuspended in 2.5 mL of Lithium/Cesium
Acetate Solution and the obtained suspension was then incubated for 30 minutes at 30ºC with 100 rpm
agitation. The cells were centrifuged as described above and finally resuspended in 500 µL of TE (pH 7.5)
to obtain competent cells. Each transformation mixture used 100 µL of competent cells, 10 µL of purified
promoter fragment, 1 µL of digested pGal1-Atcad1-6HIS plasmid, 5 µL of carrier DNA and 5 µL of histamine
ADH1_fw: AAC AAA AGC TGG AGC TCG TTT AAA CGG CGC GCC AAG GTG AGA CGC GCA TAA CC
ADH1_rev: CCC GTG ATG GTG ATG GTG ATG CGA TCC TCT CAT GAG ATA GTT GAT TGT ATG CTT GG
PMA1_fw: AAC AAA AGC TGG AGC TCG TTT AAA CGG CGC GCC CTC AGC TTT GCT AAA GTG CA
PMA1_rev: ATG GTG ATG CGA TCC TCT CAT ACT AGT GCG GCC CTT TCT TAT CTT CTT ATT C
TEF1_fw: AAC AAA AGC TGG AGC TCG TTT AAA CGG CGC GCC CTT CAT CGG TAT CTT CGC TA
TEF1_rev: ATG GTG ATG CGA TCC TCT CAT ACT AGT GCG GCC GAT TAG ATT GCT ATG CTT TC
ICL1_fw: AAC AAA AGC TGG AGC TCG TTT AAA CGG CGC GCC GTA AAGGATAATG AGTGAGC
ICL1_rev: ATG GTG ATG CGA TCC TCT CAT ACT AGT GCG GCC GCT AAG AGT TTT CTC TC
Component Volume or mass per
reaction
HF buffer 10 µl
dNTPs 1 µl
Primer forward 1 µl
Primer reverse 1 µl
Template DNA ~200 ng
MgCl2 2 µl
DMSO 1.5 µl
Phusion 0.4 µl
Water Remaining volume
Total 50 µl
5 min 94ºC
30 sec 94ºC x30
20 sec 54ºC
1 min 72ºC
7 min 72ºC
∞ 10ºC

26
solution. The mixtures were incubated at room temperature for 15 minutes. After this, 0.2 ml of TE/Cation
Mix and 0.8 mL of PEG were added to each reaction and these were incubated for another 10 minutes at
30ºC. Cells were then heat shocked for 10 minutes at 42ºC and subsequently cooled to 30ºC. The reactions
mixtures were centrifuged at 8000 rpms for 3 minutes and cells were resuspended in 100 µL of YPD and
plated on MMB plates lacking uracil.
Confirmation of the integration of the different promoters in the pAtCAd1 plasmid was initially performed
by colony PCR. For this, a loop of cells obtained from colonies obtained in the transformation step was
resuspended in 10 µL of 20mM NaOH, incubated at 100ºC for 10 minutes and then centrifuges for 1
minute in a table-top centrifuge at 13000 rpm. 5 µL of the supernatant were used for the subsequent PCR
reaction which was performed using the same conditions described above in Tables 4 and 5. Those
colonies in which amplification of a 1000 bp product was observed were considered to be positive
candidates. Positive candidates were only found for the TEF1 promoter. Total DNA was extracted from
these positive candidates by resuspending a loop of biomass in 200 L of lysis buffer (50 mM Tris, 50 mM
EDTA, 250 mM NaCl and 0.3% SDS). 100 µL of glass beads were added and then the tube was vortexed for
2 minutes at maximum speed. After this, the mixture was incubation at 65ºC and then put on ice.
Afterwards, the suspension was centrifuged for 15 minutes at 13000 rpms at 4ºC and the supernatant
was recovered. 20 µL of 1/10 NaAc 3M (pH(4.8) and 440 µL of ethanol 100% were added to induce plasmid
DNA precipitation. The sample was incubated for 30 minutes at -20ºC and then centrifuged for 20 minutes
at 13000 rpms at 4ºC. The pelleted DNA was washed with 70% ethanol and finally resuspended in 100 µL
of water.
The plasmid DNA obtained from the positive candidates was inserted in E. coli XL1-Blue cells by adding 10
µL of the purified plasmid DNA to 100 uL of competent cells in an electroporation cuvette. The conditions
used for the electroporation were 2.5 kV, 25 µFaraday and 400 Ω. After the electric shock, 1 mL of liquid
LB was added to the cell suspension and this was then incubated for 1 hour at 37ºC at 250 rpm to allow
recovery of the cells. The culture was then centrifuged at maximum speed in a table-top centrifuge and
the pellet obtained was resuspended in LB and finally plated in selective LBA medium. Plasmid DNA was
recovered from the E. coli transformants using the QIAprep Spin Miniprep Kit (Quiagen). Integration was
confirmed by performing the restriction map of the recovered plasmids with NotI and SacI and then by
Sanger sequencing.
2.3. Batch fermentations for the production of itaconic acid in yeast cells using
strains derived from BY4741 or 23344c
S. cerevisiae cells derived from the BY4741 or from the 23344c background harboring the plasmids
pGal1-AtCad1, pTEF1-AtCad1 or pGREG586 were batch-cultured at 30ºC and 250 rpm over-night in MMF
growth medium having 2% glucose as the carbon source. In the next day an appropriate volume of this
pre-culture was used to inoculate shake-flasks containing fresh MMF medium (having 2% galactose or
glucose as the carbon source) at an initial OD600 nm of 0.1 or 2, depending on the experiment. A ratio of
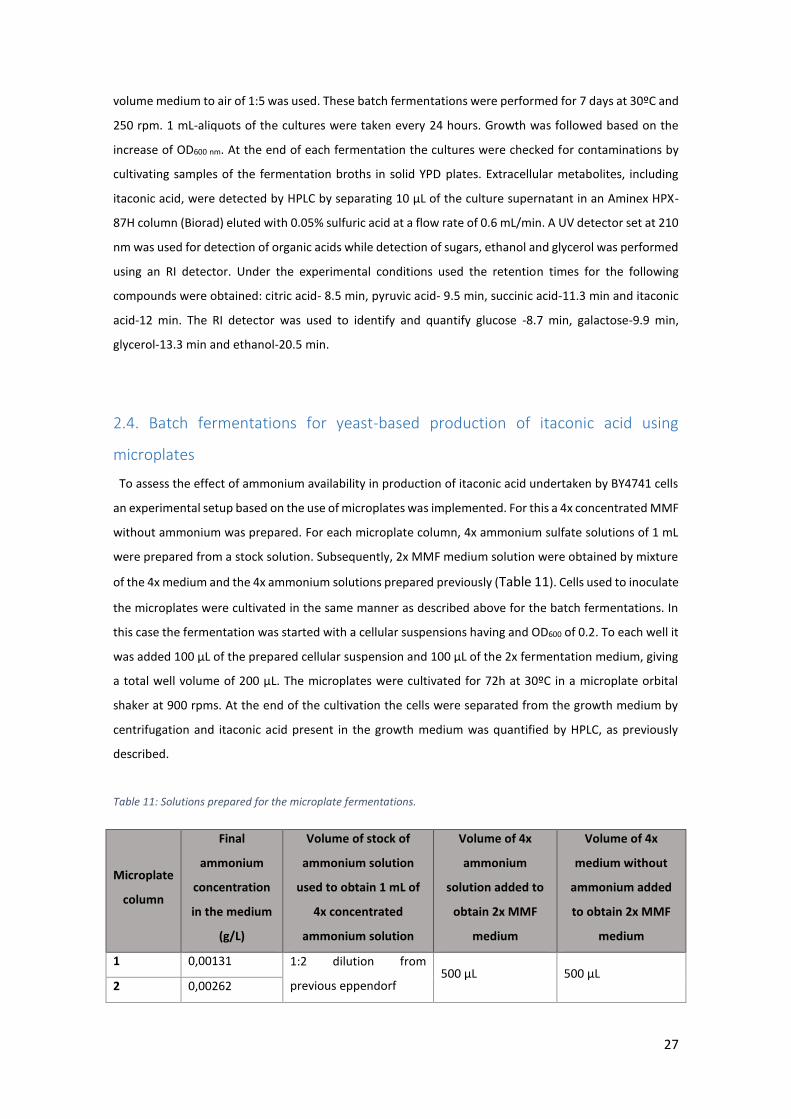
27
volume medium to air of 1:5 was used. These batch fermentations were performed for 7 days at 30ºC and
250 rpm. 1 mL-aliquots of the cultures were taken every 24 hours. Growth was followed based on the
increase of OD600 nm. At the end of each fermentation the cultures were checked for contaminations by
cultivating samples of the fermentation broths in solid YPD plates. Extracellular metabolites, including
itaconic acid, were detected by HPLC by separating 10 µL of the culture supernatant in an Aminex HPX-
87H column (Biorad) eluted with 0.05% sulfuric acid at a flow rate of 0.6 mL/min. A UV detector set at 210
nm was used for detection of organic acids while detection of sugars, ethanol and glycerol was performed
using an RI detector. Under the experimental conditions used the retention times for the following
compounds were obtained: citric acid- 8.5 min, pyruvic acid- 9.5 min, succinic acid-11.3 min and itaconic
acid-12 min. The RI detector was used to identify and quantify glucose -8.7 min, galactose-9.9 min,
glycerol-13.3 min and ethanol-20.5 min.
2.4. Batch fermentations for yeast-based production of itaconic acid using
microplates
To assess the effect of ammonium availability in production of itaconic acid undertaken by BY4741 cells
an experimental setup based on the use of microplates was implemented. For this a 4x concentrated MMF
without ammonium was prepared. For each microplate column, 4x ammonium sulfate solutions of 1 mL
were prepared from a stock solution. Subsequently, 2x MMF medium solution were obtained by mixture
of the 4x medium and the 4x ammonium solutions prepared previously (Table 11). Cells used to inoculate
the microplates were cultivated in the same manner as described above for the batch fermentations. In
this case the fermentation was started with a cellular suspensions having and OD600 of 0.2. To each well it
was added 100 µL of the prepared cellular suspension and 100 µL of the 2x fermentation medium, giving
a total well volume of 200 µL. The microplates were cultivated for 72h at 30ºC in a microplate orbital
shaker at 900 rpms. At the end of the cultivation the cells were separated from the growth medium by
centrifugation and itaconic acid present in the growth medium was quantified by HPLC, as previously
described.
Table 11: Solutions prepared for the microplate fermentations.
Microplate
column
Final
ammonium
concentration
in the medium
(g/L)
Volume of stock of
ammonium solution
used to obtain 1 mL of
4x concentrated
ammonium solution
Volume of 4x
ammonium
solution added to
obtain 2x MMF
medium
Volume of 4x
medium without
ammonium added
to obtain 2x MMF
medium
1 0,00131 1:2 dilution from
previous eppendorf 500 µL 500 µL
2 0,00262

28
3 0,00524
4 0,01048
5 0,02096
6 0,04192
7 0,08384
8 0,16768
9 0,33536
10 0,67072
11 1,34144 268,28 µL
12 1,64 328 µL
2.5. Simulation of yeast metabolism in itaconic acid-producing cells
All simulation experiments were performed using the COBRA 2.0 toolbox for MATLAB [55] or the OptFlux
workbench [75]. The SBML files for the Yeast 5.1 and Yeast 7.0 models were downloaded from
http://yeast.sourceforge.net/. These are XML files in which the model is defined in the Systems Biology
Markup Language, a standardized and machine-readable language [76]. The reaction of cis-aconitate
transport from the mitochondria to the cytosol was added to both yeast 5.1 and 7.0 models, along with
the cytoplasmic cis-aconitate decarboxylase enzyme and the itaconic acid export reaction. A sink reaction
was also added, to allow the maintenance of a mass balance in the model.
Simulation was performed using two types of conditions: a standard condition in which nutrients do not
have a defined concentration and in a “simulated medium” in which the fluxes were calculated based on
the nutrient concentration profile of the MMF growth medium, which was used for the fermentations. In
the standard scenario cells receive a maximum of 10 mmol/glucose/gDCW/h and the uptake of the
remaining nutrients is unchanged, using the only constraints that are inherent to the model (e.g. no
aminoacid uptake). In the simulated medium scenario cells are exposed to conditions similar to the ones
used in the in vivo fermentations, with constraints on the uptake of galactose, ammonium and amino
acids. The calculations of the lower bounds of the sink reactions for the nutrients were based on two sets
of assumptions:
I. All the nutrients are consumed after 3 days so the maximum fluxes are calculated by
dividing the concentration in the medium by 3 days.
or
II. Only galactose is consumed after 3 days. The remaining nutrients can be consumed in 1
day.
From these assumptions the fluxes were calculated and normalized to the average dry cell weight in the
first 3 days of culture, obtaining the fluxes that were applied to the corresponding sink reactions (Table

29
12). The average dry cell weight was calculated from the OD600 measurements of the culture of BY4741
pGal1-Atcad1 and a using correlation factor between OD600 and dry cell weight of 2.45 OD600/(g/L) [77].
Table 12: Sets of constraints imposed on the lower bounds of the sink reactions corresponding to the nutrients present
in the fermentation medium.
1st set of constraints 2nd set of constraints
Sink reaction name Flux (mmol/d/gDCW) Flux (mmol/d/gDCW)
D-galactose exchange -42,5635 -42,5635
D-glucose exchange 0 0
ammonium exchange -7,7472 -23,2415
adenine exchange -0,0284 -0,0851
L-arginine exchange -0,0910 -0,2730
L-aspartate exchange -0,2305 -0,6914
L-histidine exchange -0,0494 -0,1483
L-leucine exchange -0,2923 -0,8769
L-lysine exchange -0,1311 -0,3934
L-methionine exchange -0,0514 -0,1542
L-phenylalanine exchange -0,1161 -0,3482
L-threonine exchange -0,3219 -0,9656
L-tryptophan exchange -0,0939 -0,2816
L-tyrosine exchange -0,1058 -0,3174
L-valine exchange -0,4582 -1,3746
biotin exchange -8,2E-05 -0,0002
(R)-pantothenate exchange -0,00223 -0,0068
folic acid exchange -1,7E-06 -5,2E-06
1st set of constraints 2nd set of constraints
Sink reaction name Flux (mmol/d/gDCW) Flux (mmol/d/gDCW)
myo-inositol exchange -0,0575 -0,1724
nicotinate exchange -0,0044 -0,0131
4-aminobenzoate exchange -0,0011 -0,0034
pyridoxine exchange -0,0026 -0,0078
riboflavin exchange -0,0002 -0,0006
Thiamine exchange -0,0016 -0,0048
sulphate exchange -1,6014 -4,8042
potassium exchange -8,4622 -25,3867
sodium exchange -0,6619 -1,9856

30
phosphate exchange -8,4612 -25,386
iron (II) exchange -0,0004 -0,0012
The optimization using the objective function of Max (biomass/flux unit) was used in the COBRA toolbox
with the methods described in Costa, Nguyen, Hartmann & Vinga, 2014 [58] and the corresponding scripts
available at https://github.com/rs-costa/ObjComparison. The procedure can be described as follows:
1. Determination of the range of maximal and minimal growth rate; define a vector with
1000 points in this range.
2. For each of these points:
- minimize the L1 Manhattan norm of the fluxes
- the ratio between biomass flux and the L2 norm is calculated
3. Chose the point for which the ratio is the highest. This growth value corresponds to
biomass yield per flux unit
The BY4741 genetic background was simulated in silico by taking into account the histidine, leucine and
methionine auxotrophies and forcing the lower and upper bounds to zero on the reactions corresponding
to the HIS3, LEU2 and MET15 genes (Table 13). The ΔURA3 auxotrophy wasn’t introduced, as it is rescued
by the selection marker of the pGREG586 or of the pAtCad1 plasmid.
Table 13: Reactions where the lower and upper bounds where forced to zero to simulate the BY4741 genetic
background, in the Yeast 5 and Yeast 7 model.
Simulation of the BY4741 genetic background
Gene Reaction name Reaction in Yeast 5 Reaction in Yeast7
HIS3 Imidazoleglycerol-phosphate dehydratase r_0564 r_0564
LEU2 3-isopropylmalate dehydrogenase r_0061 r_0061
MET15
Cysteine synthase r_0312 r_0312
O-acetylhomoserine (thiol)-lyase r_0812 r_0812
O-acetylhomoserine (thiol)-lyase r_0813 r_0813
Whenever needed, the flux distributions were visualized in Cytoscape 2.8. (http://cytoscape.org/) [78], by
importing the corresponding models and flux distributions in .xml format.
The OptKnock algorithm implemented in the COBRA toolbox was applied to the Yeast 5 and Yeast 7
models, using standard constraints and the 2nd set of constraints in the simulated medium scenario. All
reactions were allowed to be deleted in the constrop option, excepting the CAD and the biomass
formation reactions.

31
The OptGene algorithm was implemented in the OptFlux software. The program was downloaded from
http://darwin.di.uminho.pt/optflux/ [75] and the standard constraint of 10 mmol/gDCW/h.

32
3. Results
3.1. Effect of the promoter region used to drive expression of AtCad1 in the
ability of yeast cells to produce itaconic acid
The plasmid already available in the laboratory that enabled production of itaconic acid in yeast cells
had the AtCad1 gene under the control of the strong galactose-inducible promoter GAL1 [69], [74]. In the
first part of this work the effect of other promoters having different “strengths” was tested. In particular,
it was aimed to replace the GAL1 promoter for the promoter region of TEF1, encoding a translation factor;
of ADH1, encoding alcohol dehydrogenase 1; and PMA1, encoding the yeast plasma membrane proton
pump. According to the information available in the literature these promoters have the following rank in
terms of strength: GAL1>TEF1>ADH1, during exponential growth [79]. PMA1 is also considered a strong
promoter, however, its activity has not been yet compared with the other promoters mentioned above.
The use of ADH1, TEF1 and PMA1 gene promoters also have the advantage of being constitutive which
means that their activity would be independent of the carbon source used in the growth medium. The
strategy used to replace the GAL1 promote present in pAtCad1 is schematically represented in Figure 11.
Promoter amplificatio
n by PCR
NotI AscI
Sequencing
Cloning the promoter by homologous
recombination in
S. cerevisiae
DNA extraction from S.
cerevisiae and E. coli
electroporation
Extraction of plasmid DNA
from E. Coli and restriction with NotI and AscI
pTEF1
Figure 11: Genetic engineering strategy used to exchange the Gal1 promoter present in the engineered pAtCad1 plasmid. As an example it is shown the replacement of GAL1 for TEF1 promoter.

33
Briefly, the promoters of interest were amplified from S. cerevisiae genomic DNA, recovered from the
agarose gel, concentrated, purified and then transformed into yeast cells together with a NotI-SacI
digested pAtcad1 plasmid. After two days of incubation at 30ºC only the plates obtained from the
transformations performed with the TEF1, ADH1 and PMA1 promoters had colonies. A subsequent
analysis of these colonies by colony PCR only allowed the identification offour candidates having the TEF1
promoter fused with the AtCad1 sequence, as evidenced by the agarose gel shown in Figure 12. Correct
insertion of the TEF1 promoter upstream of the AtCad1 gene in the plasmid was confirmed by Sanger
sequencing. This plasmid was designated pTEF1-AtCad1. BY4741 cells harboring the pTEF1-AtCad1
plasmid were cultivated, for 7 days, in MMF fermentation medium containing 2% glucose. However,
despite various attempts no itaconic acid was found to be present in the culture supernatants (results not
shown). Because of this the remaining parts of the work were performed with the pGAL1-AtCad1 plasmid.
3.2. Assessment of the size of the inoculum and genetic strain background in yeast
ability to produce itaconic acid from pGal1-Atcad1
Previous work performed at the iBB laboratory has demonstrated that transformation of BY4741 cells
with pGAL1-AtCad1 plasmid enabled production of itaconic acid in titers of around 25.12 mg/L [74]. The
effect of the size of the inoculum used in the fermentation in this work was examined by starting the
fermentations with an initial OD600 of 0.1 or 2. In both cases the cultures exhibited growth, evidenced by
the increase in the OD600 of the culture; however, in the case of the more concentrated culture the period
of exponential growth was considerably shorter (Figure 13). Surprisingly, the increase in the size of the
inoculum reduced itaconic acid production by around 2-fold (Figure 13). As expected, cultures harboring
the cloning vector pGreg586 produced no itaconic acid (results not shown). Cultivation of BY4741 cells
harboring the pGal1-AtCad1 plasmid in MMF fermentation medium having 2% glucose as the sole carbon
source also did not led to a detectable production of itaconic acid, this being consistent with the low
activity of the Gal1 promoter under these conditions [80]. In both cultures the production of itaconic acid
was found to occur at higher rate when cells were in stationary phase (Figure 13).
Figure 12: Colony PCR of 24 TEF1-AtCad1 yeast candidates. Lane 0: 1 kb DNA plus ladder; Lane 1: positive control; Lanes 3-27: TEF1-AtCad1 candidates

34
A significant amount of acetic acid (108 and 147 mM) was found in the supernatant of the BY4741
cultures. This differences in the production of acetic acid could not be attributed to the expression of the
AtCad1 gene since the supernatants of BY4741 cells transformed with the pGREG plasmid also had higher
titers of acetic acid (146 and 91 mM for the cultures with initial DO600 of 2 and 0.1, respectively).
Table 14: Overview of production titers and yield of itaconic acid produced in 7 day fermentations undertaken by
BY4741 and TAM cells in MMF medium.
Strain Initial
OD600
Final
itaconic acid
titer (mg/L)
Residual
galactose
(g/L)
Yield itaconic
acid (mg /g)
Final
ethanol
titer (%)
Final
pyruvate
titer
(mM)
Final
acetic
acid
titer
(mM)
By4741 0,1 9,39 0,00 0,47 0,41 0,22 108
2,0 4,46 1,90 0,25 0,38 2,98 145
The genetic background of the yeast strain used is another aspect that might have an important impact
in the ability of yeast cells to produce itaconic acid, as it has been shown that different strains with or
without auxotrophies exhibit remarkable differences in their fermentative capacity [81]. In that sense, the
prototrophic strain 23344c was transformed with the pGAL1-AtCad1 plasmid and the ability of the
transformed cells to produce itaconic acid was assessed and compared with the one exhibited by BY4741
cells. Strikingly, although 23344c cells consumed galactose and were able to grow, only trace amounts of
itaconic acid were detected in the culture supernatants of 23344c fermentations (results not shown). This
0
5
10
15
20
25
0
0,02
0,04
0,06
0,08
0 2 4 6
Gal
acto
se (
g/L)
Itac
on
ic a
cid
(m
M)
Fermentation time (d)
0,01
0,1
1
10
0 2 4 6
OD
60
0
Fermentation time (d)
Figure 13: (Left) Concentration of itaconic acid (o, ) and galactose (, ) in supernatant of cultures of BY4741 cells harboring
the pGAL1-AtCad1 plasmid along 7 days of cultivation in MMF fermentation medium. Two sizes of initial inoculum were tested
corresponding to an initial OD600nm of 0.1 (o,) or 2 (,); (Right) Growth curve of BY4741 cells harboring the pGAL1-AtCad1
plasmid in MMF fermentation medium along the 7 days of fermentation with initial OD600 of 0.1() or 2().

35
results clearly demonstrate the importance of taking into account the strain background and the influence
of amino acid biosynthetic processes in the production of itaconic acid.
3.3. Simulation of yeast metabolism in itaconic acid-producing cells
To simulate the production of itaconic acid in yeast cells transformed with the pGAl1-AtCad1 plasmid
the in silico Yeast 5 and Yeast 7 models [44], [47] were altered by adding the transport reaction of cis-
aconitate from the mitochondrion to the cytoplasm, the conversion of cis-aconitate into itaconic acid and
the itaconic export reaction (Figure 14). Additionally, the flux of the three reactions (catalyzed by His3,
Leu2 and Met15) that are known to be absent in the BY4741 strain was constrained to zero, to simulate
the auxotrophies.
Two environmental scenarios were simulated, one considering the use of “standard” conditions and
another in which the nutrient concentrations were matched to the concentrations that are found present
in the MMF growth medium (Figure 15). In the “standard” scenario the only constraint imposed is that
cells uptake the carbons source (in this case glucose) from the growth medium at maximum rate of 10
mmol/gDCW/h. The remaining nutrients were considered to have an unlimited availability, using only the
constraints that are inherent to the model (e.g. no aminoacid uptake). In the simulated medium scenario,
limitations were imposed to the uptake of galactose, ammonium, amino acids and other elements, taking
Itaconate export
Cis-aconitate transport Cis-aconitate
(mitochondrion) Cis-aconitate
(cytosol)
Cis-aconitate decarboxylase Itaconate
(cytosol) CO2
(cytosol)
Itaconate (extracellular)
Itaconate sink
MET15
HIS3
LEU2 Leucine biosynthesis Methionine biosynthesis Histidine biosynthesis
Figure 14: Reactions and metabolites added to the Yeast 5 and Yeast 7 models. The metabolites in red are already present in the models. The reactions associated with the LEU2, MET15 and HIS3 genes were constrained to zero.
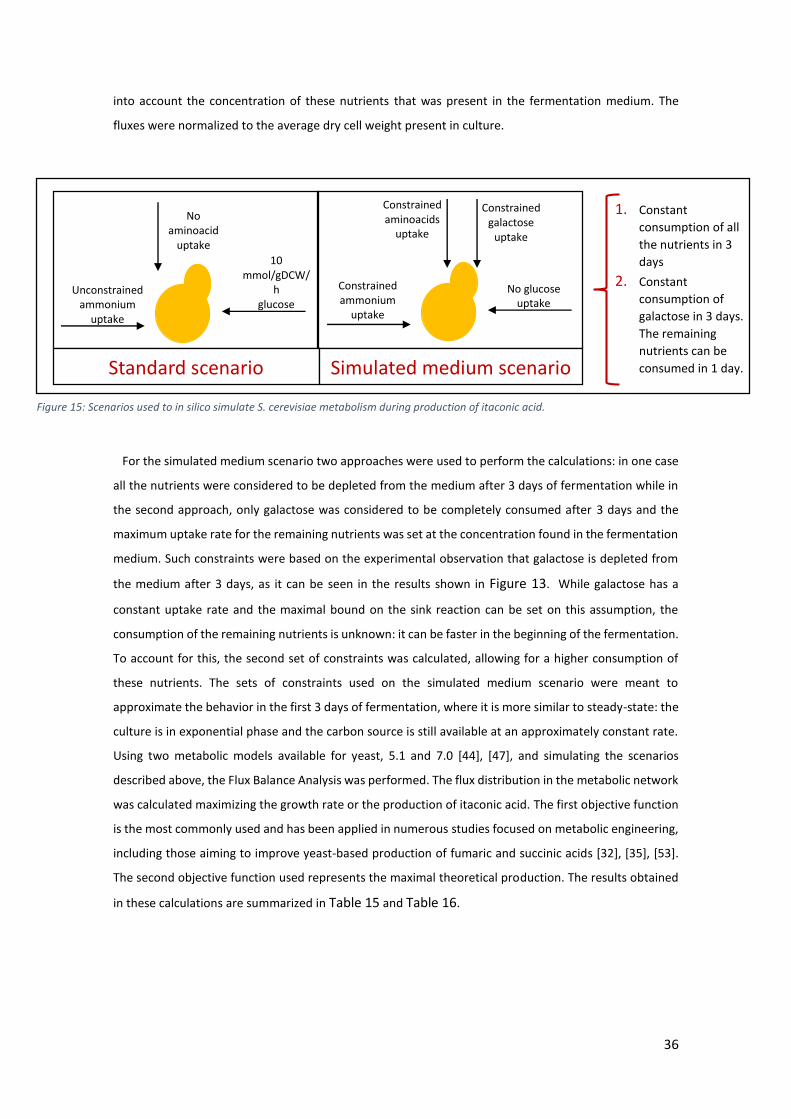
36
into account the concentration of these nutrients that was present in the fermentation medium. The
fluxes were normalized to the average dry cell weight present in culture.
For the simulated medium scenario two approaches were used to perform the calculations: in one case
all the nutrients were considered to be depleted from the medium after 3 days of fermentation while in
the second approach, only galactose was considered to be completely consumed after 3 days and the
maximum uptake rate for the remaining nutrients was set at the concentration found in the fermentation
medium. Such constraints were based on the experimental observation that galactose is depleted from
the medium after 3 days, as it can be seen in the results shown in Figure 13. While galactose has a
constant uptake rate and the maximal bound on the sink reaction can be set on this assumption, the
consumption of the remaining nutrients is unknown: it can be faster in the beginning of the fermentation.
To account for this, the second set of constraints was calculated, allowing for a higher consumption of
these nutrients. The sets of constraints used on the simulated medium scenario were meant to
approximate the behavior in the first 3 days of fermentation, where it is more similar to steady-state: the
culture is in exponential phase and the carbon source is still available at an approximately constant rate.
Using two metabolic models available for yeast, 5.1 and 7.0 [44], [47], and simulating the scenarios
described above, the Flux Balance Analysis was performed. The flux distribution in the metabolic network
was calculated maximizing the growth rate or the production of itaconic acid. The first objective function
is the most commonly used and has been applied in numerous studies focused on metabolic engineering,
including those aiming to improve yeast-based production of fumaric and succinic acids [32], [35], [53].
The second objective function used represents the maximal theoretical production. The results obtained
in these calculations are summarized in Table 15 and Table 16.
No glucose uptake
Constrained ammonium
uptake
Constrained aminoacids
uptake
Constrained galactose
uptake
10 mmol/gDCW/
h glucose
Unconstrained ammonium
uptake
No aminoacid
uptake
Standard scenario Simulated medium scenario
1. Constant
consumption of all
the nutrients in 3
days
2. Constant
consumption of
galactose in 3 days.
The remaining
nutrients can be
consumed in 1 day.
Figure 15: Scenarios used to in silico simulate S. cerevisiae metabolism during production of itaconic acid.
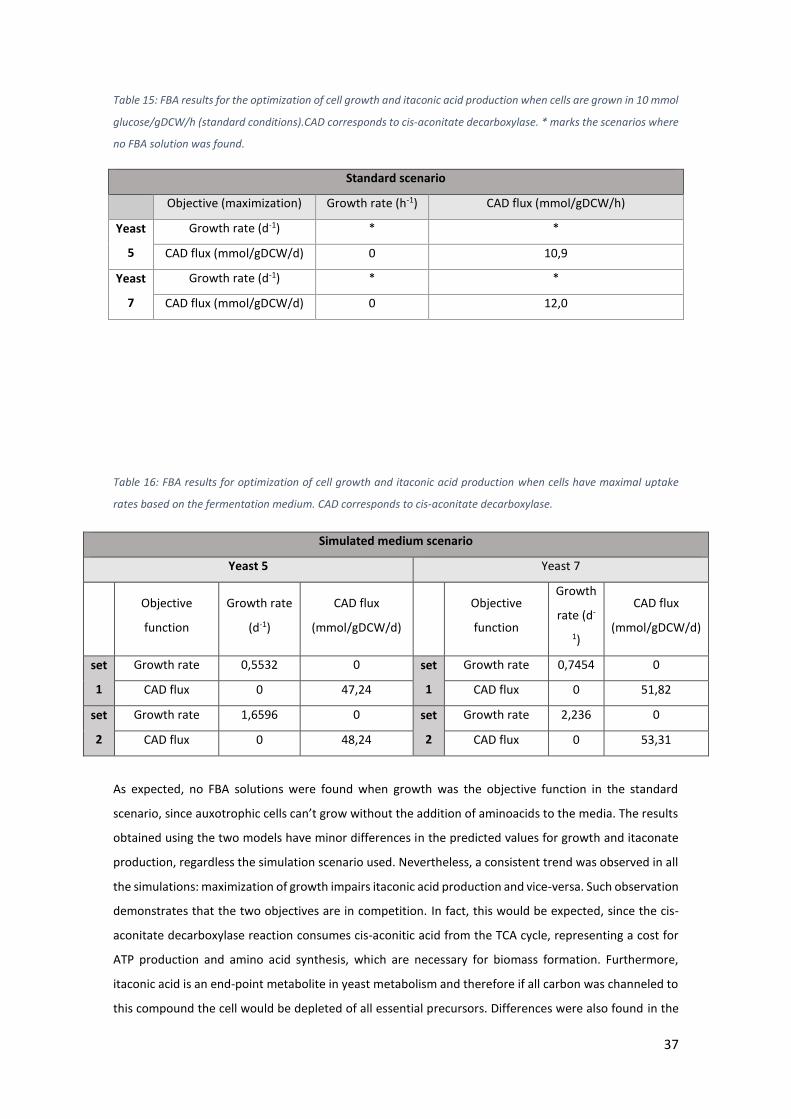
37
Table 15: FBA results for the optimization of cell growth and itaconic acid production when cells are grown in 10 mmol
glucose/gDCW/h (standard conditions).CAD corresponds to cis-aconitate decarboxylase. * marks the scenarios where
no FBA solution was found.
Standard scenario
Objective (maximization) Growth rate (h-1) CAD flux (mmol/gDCW/h)
Yeast
5
Growth rate (d-1) * *
CAD flux (mmol/gDCW/d) 0 10,9
Yeast
7
Growth rate (d-1) * *
CAD flux (mmol/gDCW/d) 0 12,0
Table 16: FBA results for optimization of cell growth and itaconic acid production when cells have maximal uptake
rates based on the fermentation medium. CAD corresponds to cis-aconitate decarboxylase.
Simulated medium scenario
Yeast 5 Yeast 7
Objective
function
Growth rate
(d-1)
CAD flux
(mmol/gDCW/d)
Objective
function
Growth
rate (d-
1)
CAD flux
(mmol/gDCW/d)
set
1
Growth rate 0,5532 0 set
1
Growth rate 0,7454 0
CAD flux 0 47,24 CAD flux 0 51,82
set
2
Growth rate 1,6596 0 set
2
Growth rate 2,236 0
CAD flux 0 48,24 CAD flux 0 53,31
As expected, no FBA solutions were found when growth was the objective function in the standard
scenario, since auxotrophic cells can’t grow without the addition of aminoacids to the media. The results
obtained using the two models have minor differences in the predicted values for growth and itaconate
production, regardless the simulation scenario used. Nevertheless, a consistent trend was observed in all
the simulations: maximization of growth impairs itaconic acid production and vice-versa. Such observation
demonstrates that the two objectives are in competition. In fact, this would be expected, since the cis-
aconitate decarboxylase reaction consumes cis-aconitic acid from the TCA cycle, representing a cost for
ATP production and amino acid synthesis, which are necessary for biomass formation. Furthermore,
itaconic acid is an end-point metabolite in yeast metabolism and therefore if all carbon was channeled to
this compound the cell would be depleted of all essential precursors. Differences were also found in the

38
values obtained for the two sets of constrains used in the simulated medium scenario within each yeast
model used, suggesting that not only constraints on the carbon source are determinant and that taking
into account the other nutrients in the medium affect the values predicted by FBA.
The in silico simulation performed with the objective function of growth maximization could not predict
the ability of yeast cells to produce itaconic acid while growing, which is actually what occurs in vivo as it
can be observed by the results shown in Figure 13. Given this, a different objective function was
implemented for the FBA analysis. In specific, it was used the maximization of biomass yield while
minimizing the total metabolic flux (maximization of biomass per flux unit), as this was found to be more
accurate for the prediction of fluxes in batch cultures [58], [59].
Table 17: FBA results for the maximization of biomass/flux. Results presented for both the Yeast 5 and Yeast 7 models.
CAD corresponds to cis-aconitate decarboxylase. * marks the scenarios where no FBA solution was found
The use of this new objective function in the FBA resulted in flux vectors with non-null fluxes for both
growth and itaconic acid production in the simulated medium scenarios (Table 17). Again, no solutions
were found in the standard scenarios. However, the differences between the values obtained for the Yeast
5 and Yeast 7 models were very prominent. The modifications made to the yeast models along time, such
as the removal of blocked and dead-end reactions in the Yeast 6 model and the revision of the lipid
metabolism, may account for the observed differences [45], [47].
To test if the model could predict the different abilities of the BY4741 and 23344c strains to produce
itaconic acid, a new FBA analysis was performed using a complete model that included the reactions
Maximization of biomass and minimization of total metabolic flux
Scenario Growth rate (d-1) CAD flux (mmol/gDCW/d)
Yeast 5
Standard * *
Simulated
medium: set 1 0,0055 3,52e-06
Simulated
medium: set 2 0,0166 1,49e-07
Yeast 7
Standard * *
Simulated
medium: set 1 0,0075 1,53e-05
Simulated
medium: set 2 0,0538 1,07e-06

39
catalyzed by His3, Leu2 and Met15. The FBA problem was solved using as an objective function the
maximization of biomass per flux unit, as described above.
Table 18: FBA results for the maximization of biomass/flux. For each scenario two genetic backgrounds were tested:
prototrophic and the auxotrophic BY4741. Results presented for both the Yeast 5 and Yeast 7 models. CAD corresponds
to cis-aconitate decarboxylase.
Influence of the genetic background
Yeast 5 Yeast 7
Scenario Genetic
background
Growth rate
(d-1)
CAD flux
(mmol/gDCW/d)
Growth
rate (d-1)
CAD flux
(mmol/gDC
W/d)
Standard Prototrophic 0,2194 8,17e-05 8,0928 2,62e-04
BY4741-like - - - -
Simulated
medium:
set 1
Prototrophic 0,0182 3,62e-06 0,0538 1,07e-06
BY4741-like 0,0055 3,52e-06 0,0075 1,52e-05
Simulated
medium:
set 2
Prototrophic 0,0448 2,41e-07 0,0186 7,13e-07
BY4741-like 0,0166 1,49e-07 0,0538 1,07e-06
Now simulating a prototrophic background it was possible to find solutions in the standard scenario of
growth without aminoacids in the medium. The simulated medium solutions were obtained, although
prominent differences were observed in the values results reported by the Yeast 7 and Yeast 5 models. In
the Yeast 5 model, the flux through the CAD reaction is lower in the auxotrophic strain than in the
prototrophic strain, this being observed for the two simulated medium scenarios. Differently, the Yeast 7
model predicted an increase in CAD flux in a genetic background similar to the one of the BY4741 strain,
particularly when the 1st set of constraints was used, where the increase was of about 14-fold. On the
overall, these results of the in silico simulation show that the genetic background of the strain and, in
particular, the auxotrophies of the BY4741 strain have an impact in yeast metabolism and, in particular,
in production of itaconic acid. It is important to notice that the difference in production of itaconic acid
between BY4741 and a prototrophic strain could only be detected when the yeast model 7 was used

40
(Table 18). To further investigate the reasons underlying the increase in CAD flux upon elimination of
the HIS3, LEU2 and MET15 genes, the flux distributions of the Yeast 7 model corresponding to the
maximization of growth or itaconic acid production were imported into Cytoscape. The shortest
undirected path found between the nodes of the reactions associated to HIS3, LEU2 and MET15 genes
and the cis-aconitate decarboxylase node was the release of carbon dioxide, which occurs in all these
reactions (Error! Reference source not found.). This path is most probably not relevant for the observed
henotype, since carbon dioxide concentrations in the cytosol are not expected to be limiting production
of itaconic acid. Notably, when the simulation is performed maximizing production of itaconic acid, the
flux through His3, Leu2 and Met15 reactions is zero, while maximization of growth implies active reactions
catalyzed by Leu2 and His3. This observation is, in part, consistent with the beneficial effect that the
deletion of LEU2 and HIS3 seems to have in improving itaconic acid production, although it is unclear why,
since leucine and histidine biosynthesis are not directly linked with itaconic acid production.
3.1.3 Flux variability analysis
The observation that production of itaconic acid and growth are competing objectives led to the
examination of the extension of this effect. In specific, it was examined how a reduction in the growth
rate would affect the ability of yeast cells to produce itaconic acid. For that, FVA analysis was used,
imposing a 5% reduction in the growth rate. The results obtained are shown in Table 19.
Table 19: FVA results (allowing a 5% decrease in the growth rate) for both Yeast 5 and Yeast 7 model, using 2 sets of
constraints. CAD corresponds to the cis-aconitate decarboxylase enzyme.
Flux variability analysis
Model Scenario CAD flux (mmol/gDCW/d) Growth rate (d-1)
Figure 16: Fluxes through some aminoacid biosynthesis reactions when the objective function is the maximization of growth (A) or itaconic acid production (B). Results presented for the Yeast 7 model. The reactions associated with the genes HIS3, LEU2 and MET15 are highlighted.
Maximization of itaconic acid production B) Maximization of the growth rate
HIS3 HIS3
LEU2 LEU2
MET15 MET15
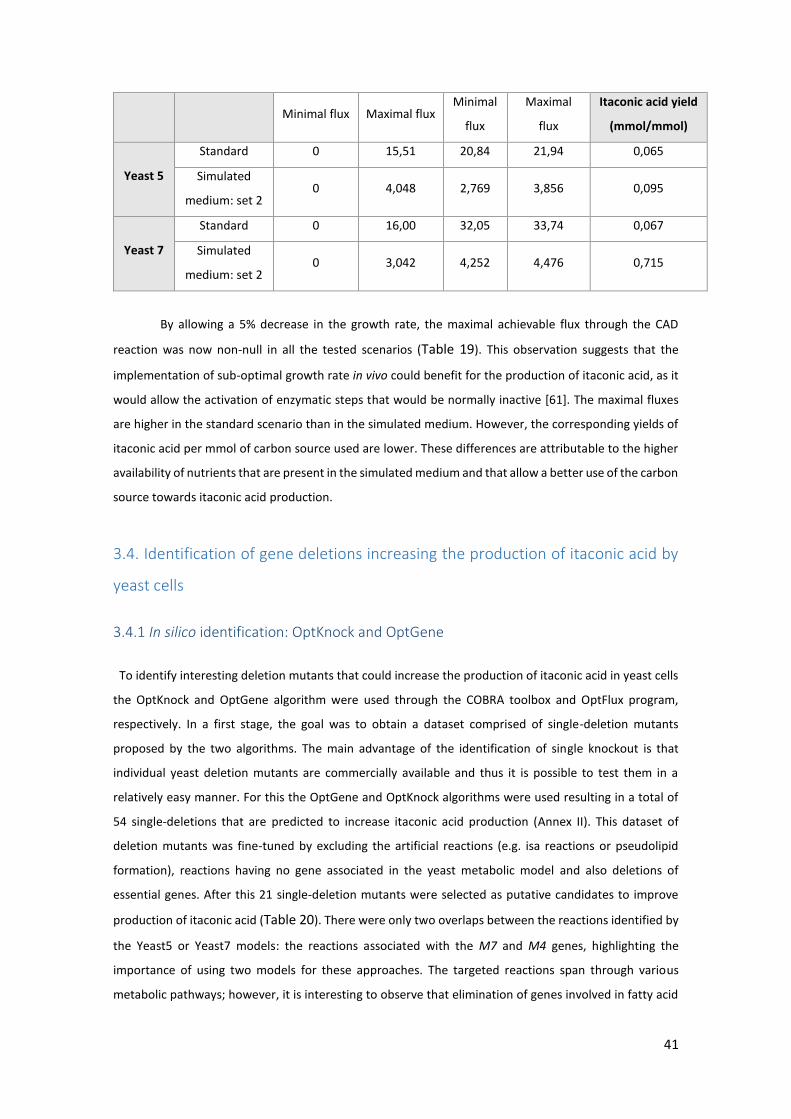
41
Minimal flux Maximal flux Minimal
flux
Maximal
flux
Itaconic acid yield
(mmol/mmol)
Yeast 5
Standard 0 15,51 20,84 21,94 0,065
Simulated
medium: set 2 0 4,048 2,769 3,856 0,095
Yeast 7
Standard 0 16,00 32,05 33,74 0,067
Simulated
medium: set 2 0 3,042 4,252 4,476 0,715
By allowing a 5% decrease in the growth rate, the maximal achievable flux through the CAD
reaction was now non-null in all the tested scenarios (Table 19). This observation suggests that the
implementation of sub-optimal growth rate in vivo could benefit for the production of itaconic acid, as it
would allow the activation of enzymatic steps that would be normally inactive [61]. The maximal fluxes
are higher in the standard scenario than in the simulated medium. However, the corresponding yields of
itaconic acid per mmol of carbon source used are lower. These differences are attributable to the higher
availability of nutrients that are present in the simulated medium and that allow a better use of the carbon
source towards itaconic acid production.
3.4. Identification of gene deletions increasing the production of itaconic acid by
yeast cells
3.4.1 In silico identification: OptKnock and OptGene
To identify interesting deletion mutants that could increase the production of itaconic acid in yeast cells
the OptKnock and OptGene algorithm were used through the COBRA toolbox and OptFlux program,
respectively. In a first stage, the goal was to obtain a dataset comprised of single-deletion mutants
proposed by the two algorithms. The main advantage of the identification of single knockout is that
individual yeast deletion mutants are commercially available and thus it is possible to test them in a
relatively easy manner. For this the OptGene and OptKnock algorithms were used resulting in a total of
54 single-deletions that are predicted to increase itaconic acid production (Annex II). This dataset of
deletion mutants was fine-tuned by excluding the artificial reactions (e.g. isa reactions or pseudolipid
formation), reactions having no gene associated in the yeast metabolic model and also deletions of
essential genes. After this 21 single-deletion mutants were selected as putative candidates to improve
production of itaconic acid (Table 20). There were only two overlaps between the reactions identified by
the Yeast5 or Yeast7 models: the reactions associated with the M7 and M4 genes, highlighting the
importance of using two models for these approaches. The targeted reactions span through various
metabolic pathways; however, it is interesting to observe that elimination of genes involved in fatty acid

42
beta-oxidation, in cardiolipin synthesis, in synthesis of sphingolipids and in fatty acids, in protein
glycolysation, in nicotinic acid and in utilization of non-fermentable carbon sources appear to be more
prominent in the dataset. The extent to which itaconic acid production could be increased in the multiple
knockouts couldn’t be predicted in silico, since the fluxes in the CAD reaction predicted by FBA of these
mutants was always zero, presumably because the objective function being used is the maximization of
growth.

43
Table 20: Single deletion mutants identified by OptKnock and OptGene selected to be experimentally validated.
Yeast 5 Yeast 7
Gene Enzyme Function Gene Enzyme Function
M1 Homoserine dehydrogenase
(NADH) Methione and threonine
biosynthesis M8 Ap4A hydrolase Purine metabolism
M2 acetyl-coA synthetase Acetate and ethanol
utilization M9
Various reactions of the type inositolphosphotransferase
Sphingolipids biosynthesis
M3 GTP/GDP translocase Mitochondrial transporter M10 acetyl-CoA C-acyltransferase (decanoyl-CoA) Fatty acid beta-oxidation
M4
3-hydroxyacyl-coA dehydrogenase (3-
oxooctadecanoyl-coA) Fatty acid beta-oxidation
M7 nucleoside diphosphatase Protein glycolysation
3-hydroxyacyl-coA dehydratase (3-hydroxydecanoyl-coA)
M11 fatty-acid--CoA ligase (tetradecanoate) Fatty acid beta-oxidation
M5 N-formyl-L-kynurenine
amidohydrolase Biosynthesis of nicotinic acid M12 DAG kinase (1-16:0, 2-18:1), ER membrane
Synthesis of membrane phospholipids and transduction
pathway
M6 aldehyde dehydrogenase
(acetaldehyde, NADP) Acetate biosynthesis, NADPH
regeneration M13
CL synthase (1-18:0, 2-16:1, 3-16:0, 4-16:1), mitochondrial membrane
Cardiolipin biosynthesis
M7 Nucleoside triphosphatase Protein glycolysation M14 'MLCL (1-16:1, 2-16:1, 4-18:1):PC (1-16:0, 2-
18:1) acyltransferase, mitochondrial membrane'
Cardiolipin biosynthesis (required for normal
phospholipid content of mitochondrial membranes)
M15 'B-ketoacyl-CoA reductase (3-hydroxyoctadecanoyl-CoA)'
Sphingolipids and long-chain fatty acid biosyntheis
M16 'glycerol-3-phosphate acyltransferase (18:1),
ER membrane' Lipid biosynthesis
M4 '2-enoyl-CoA hydratase (3-
hydroxytetradecanoyl-CoA)' Beta-oxidation
M17 and M18 'aldehyde dehydrogenase (2-phenylethanol,
NADP)' Alcohol synthesis
TGL3 and TGL4 Associated to 2 reactions of the type
triacylglycerol lipase Lipid metabolism

44
3.4.2. Preliminary results for the proposed mutants in shake-flask fermentations
The production of itaconic acid in nine of the deletion mutants (ΔM2, ΔM17, ΔM18, ΔM11, ΔM3, ΔM15,
ΔM9, ΔM10 and ΔM7) identified by the in silico modelling was tested. For this, the mutant strains were
transformed with the pGAL1-AtCad1 plasmid and fermentations were undertaken in MMF fermentation
medium in the same conditions as those described above for the BY4741 strain. The results obtained are
summarized in Figure 17 and Table 21.
The supernatants of 6 of the 9 mutants tested were found to have higher itaconic acid titers than those
registered for the parental strain BY4741 (Figure 17). The kinetics of production was similar in all strains,
the maximal itaconic acid concentration being achieved in all cases in the last day of fermentation (Annex
III). Galactose was fully consumed in all cultures, although at different rates (Annex III and Table 21). The
growth rate of the different strains was also found to differ from the one of the wild-type strain, with a
particular emphasis for the strains devoid of M10 gene, which exhibited a particularly low growth rate. As
the result of the lower growth rate and higher itaconic acid titers, the mutant strains exhibited significant
higher yields than the BY4741 strain (Table 21). It is interesting to observe that the mutants exhibiting
more robust increases in the production of itaconic acid had slower growth rates than the parental strain,
which is in agreement with the above described FVA analysis. The most promising mutant identified was
the strain devoid of M18 which had a ~ 2.5 fold higher yield than the one obtained for wild-type cells
(Table 21).
Figure 17: (A) Concentration of itaconic acid present in the supernatant of 7-day fermentations undertaken by BY4741 cells or by the derived deletion mutants transformed with the pGal-AtCad1 plasmid in MMF medium; (B) Comparison between the growth rate rates of the BY4741 strain and of the derived deletion mutants in the MMF medium. In both graphs the dashed lines corresponds to the values obtained for the wild-type strain.
0,0
5,0
10,0
15,0
20,0
25,0
Itac
on
ic a
cid
(m
g/L)
0,000
0,020
0,040
0,060
0,080
0,100
0,120
0,140
0,160
0,180
Gro
wth
rat
e (h
-1)
A B

45
Table 21: Overview of final itaconic acid titers, yield, productivity, galactose consumption rate and growth rate of the
cultures with the BY4741 and mutant strains harboring the pGal1-AtCad1 plasmid.
Strain Final Itaconic
titer (mg/L)
Yield (mg
itaconic /g
galactose)
Productivity
(mg/L/d)
Galactose
consumption rate
(g/L/d)
Growth rate
(h-1)
BY4741 9,4 0,469 1,34 4,0 0,161
ΔM2 11,0 0,550 1,57 3,3 0,090
ΔM17 11,1 0,556 1,59 10,4 0,117
ΔM18 23,1 1,155 3,30 5,5 0,118
ΔM11 8,8 0,441 1,26 5,7 0,082
ΔM3 5,0 0,249 0,71 5,0 0,137
ΔM15 16,2 0,812 2,32 5,5 0,086
ΔM9 6,0 0,298 0,85 4,5 0,105
ΔM10 14,1 0,703 2,01 4,6 0,012
ΔM7 18,4 0,920 2,63 4,7 0,116
Subsequently it was attempted to identify mutants with multiple deletions that could also be interesting
for the production of itaconic acid. For this, OptKnock was implemented in Yeast 7 and Yeast 5 model,
setting 5 as the maximal number of knockouts allowed. The results obtained are shown in Table 22. No
overlap between the genes identified by the model 7 or model 5 was obtained, which shows the relevance
of using both models to perform this analysis (Table 22). Notably, a triple mutant devoid of enzymes
involved in conversion of ceramides into phytosphingosine and of PDC genes was identified, this being a
particularly interesting result considering the increase in itaconic acid production that was already
observed upon elimination of alcoholic fermentation. It is also relevant to note that the deletion of the
pyruvate decarboxylase reaction was previously suggested as a single deletion strategy by OptKnock
(Annex II). Some of the strategies proposed include artifacts from the model, such as the lipid
pseudoreaction and exchange reactions, since the first doesn’t correspond to a process that happens in
vivo and the second ones are not associated to genes.

46
Table 22: Deletion strategies predicted by the OptKnock tool for the coupling of itaconic acid to celular growth.
Model
Number
of
knockouts
Enzymes to be deleted Simulated scenario
Yeast 7.0 3
Dihydroceramidase (substrate: ceramide C-24)
Simulated medium Dihydroceramidase (substrate: ceramide C-26)
Pyruvate decarboxylase
Yeast 5.1
2 Adenylate kinase
Simulated medium Sulfate uniport
3
Adenylate kinase
Standard Sulphate exchange
Lipid pseudoreaction
3
Adenylate kinase
Simulated medium L-lysine exchange
Lipid pseudoreaction
4
2-keto-4-methylthiobutyrate transamination
Standard Thioredoxin reductase (NADPH)
Sulfate uniport
Lipid pseudoreaction

47
3.5. Role of ammonium availability in itaconic acid production
3.5.1. In silico robustness analysis
As the MMF medium to produce itaconic acid is complex and includes a wide variety of nutrients a strategy
that could allow an in silico prediction of how the manipulation of the growth medium composition could
affect itaconic acid production was attempted. A first focus was put on the availability of ammonium since
this has been found to modulate, at some extent, production of itaconic acid in A. terreus, presumably by
modulating the activity of amino acid biosynthetic pathways [84]. In that sense, the impact exerted by
ammonium availability on the balance between growth and CAD flux was explored using FBA. The
robustness analysis of the network obtained with the standard scenario simulation reveals an inverse
relation between the growth rate and the CAD flux, which is line with the previously obtained results
(Figure 18).
However, when the 1st set of constraints of the simulated scenario of constraints is imposed, this relation
becomes discontinuous: only states corresponding to high CAD fluxes and low growth rates are allowed
(closed circles in Figure 18 B). This observation can be explained by the presence of a nutritional
constraint that is limiting for growth and not itaconic acid production. If the constraints on ammonium
availability are removed, the robustness line becomes similar to what is found in standard conditions. The
disconituity between growth and itaconic acid production suggests that the limitation of ammonium
availability could modulate itaconic acid production, as initially hypothesized based on results obtained in
A. terreus [84]. It is relevant to note that, when the 2nd set of constraints was imposed, the robustness
line became continuous again and the cells are now allowed to be in states where the CAD flux is close to
zero and the growth rate is nearly maximal. As the 1st implies a more prohibitive interpretation of nutrient
availability in the medium, it is possible that the effects of limiting ammonium are only observed if other
nutrients become limiting as well, in particular, amino acids. The described robustness analysis followed
the same patterns for both Yeast models.
0
2
4
6
8
10
12
0 0,5 1 1,5 2
CA
D f
lux
(mm
ol/
gDC
W/h
)
Growth rate (h-1)
0
10
20
30
40
50
60
0 1 2 3 4 5 6
CA
D f
lux
(mm
ol/
gDC
W/d
)
Growth rate (d-1)
Figure 18: Robustness analysis on the Yeast 7 model. Left) In the standard scenario in the prototrophic background. Rigth) In the
simulated scenario () and in the simulated scenario without constraints on ammonium availability (o) on the BY4741 background..

48
3.5.2. Microplate fermentations to test different concentrations of ammonium in the
fermentation medium
To test the hypothesis of ammonium limitation being a predisposing factor for itaconic acid production,
microplate fermentations with the BY4741 cells harboring the pGal1-Atcad1 plasmid were performed
using the MMF fermentation medium supplemented with a range of concentrations of ammonium
sulfate. The fermentations were carried out for 72 hours and the itaconic acid present in the supernatant
at the end of the fermentation was quantified. The results shown are relative to two independent replicas
that were performed. As observed, although some differences in the absolute values of the two assays
were obtained, the trend is similar in both of them. Under these conditions the amount of itaconic acid
achieved a minimum when the ammonium concentration was equal to ~0.04 g/L. Both the decrease and
the increase in the concentration of ammonium resulted in an increase in itaconic acid production
indicating that the relationship existing between ammonium availability and itaconic acid production is
complex. It is however important to stress that the reduction of ammonium concentration in the medium
didn’t affect the growth rate, which suggests that the cells may also be using the available amino acids in
the growth medium as nitrogen sources.
Figure 19: Effect of ammonium concentration in MMF growth medium in the ability of yeast cells to produce itaconic acid. The concentration of itaconic acid present in the supernatant of 3-day fermentations undertaken by BY4741 cells was measured by HPLC (A). The initial and final DO600 were measured and the ratio final/initial was calculated (B). The results shown represent two independent assays that were performed.
0
0,01
0,02
0,03
0,04
0,05
0,06
0,07
0,001 0,01 0,1 1 10
Itac
on
ic a
cid
(m
M)
Ammonium concentration in the medium (g/L)
0
5
10
15
20
0,001 0,01 0,1 1 10
Gro
wth
rat
io
Ammonium concentration in the medium (g/L)

49
4. Discussion
In the first part of this work the production itaconic acid in S. cerevisiae BY4741 cells in batch was further
characterized, being examined the effect played by the initial size of the inoculum and also the genetic
background of the strain used. The results obtained render clear that lower initial cell densities led to an
increase of around 2-fold of itaconic acid (for cultures starting with an initial OD600 of 0.1 and 2 the titer
of itaconic acid obtained was of 9.4 and 4.5 mg/L, respectively). Despite the improvement, the titers of
itaconic acid obtained were still below those previously described in the study of Blazeck et al., 2014,
which reported a titer between 23 mg/L and 59 mg/L, depending on the promoter used [17]. There are
several differences between the experimental setup used in this work and the one used in the study of
Blazeck et al.,2014, including the fact that in this study the size of the initial inoculum was of 6 while herein
we have worked with much lower initial ODs of the cultures (between 0.1 and 2). Furthermore, the
aeration ratio was also different in the two studies since we have used 50 mL cultures on 250 mL shake-
flask, while Blazeck et al, 2014 have used 15 mL cultures on 250 mL shake-flask bottles [17]. Aeration has
been shown to favor production of itaconic acid in A. terreus and therefore it may also be beneficial when
yeast is used as a host. Another important difference between this study and the study of Blazeck et al.
(2014) is the use of a different promoter to drive the expression of the AtCad1 gene: while in this study
the galactose-inducible plasmid GAL1, in the study of Blazeck et al, (2014) the expression of AtCad1 was
under the control of an artificial promoter that was specifically engineered for this effect. Although GAL1
promoter is known to be very potent upon supplementation of the growth medium with galactose, the
activity of this promoter decreases over time, accompanying the decrease in galactose titers [85]. Thus, it
can be argued that in the overall fermentation the expression of the AtCad1 enzyme could achieve higher
titers in the study of Blazeck et al., (2014) thereby leading to higher production of itaconic acid. When
galactose is the carbon source, the induction of the GAL promoter has been found to be higher during
exponential growth, followed by a decrease [86]. Taking this into account, the lower itaconic acid titers
obtained in fermentations that were started with an initial OD600 of 2 can result from a lower expression
of the AtCad1 gene under such conditions, since growth in this setup is considerably lower than the
obtained when the fermentations were started with an initial OD600nm of 0.1.The pGAL-AtCad1 plasmid
can be used for production of itaconic acid from galactose but also from other raw-materials that also
have high concentrations of this sugar such as those derived from red algae and spent sulfate pulping
liquor from the papermaking industry [87], [88]. Furthermore, it may also be possible to use this plasmid
to produce itaconic acid from substrates enriched in glucose using strains devoid of genes mediating the
glucose-repressive effect of the GAL1 promoter and that lack the ability of using galactose as a carbon
source, a strategy that has been used before with success [85].
Despite various attempts the use of the TEF1 promoter to control AtCad1 expression didn’t enabled
production of itaconic acid in yeast cells. The reasons behind these results are unclear, since the usage of
this promoter has been reported for metabolic engineering purposes [79]. Moreover, it has been

50
previously reported that itaconic acid can be produced in S. cerevisiae using a synthetic enhanced TEF1
promoter to control AtCad1 expression [17]. In our case we have used as the TEF1 promoter the 1000 bp
region upstream of ATG start codon, while the synthetic promoter pTEF1 is composed of three UAS from
the mitotic cyclin CLB2 gene (the enhancer element) and the -401 to -198 upstream region from the ATG
start codon of the TEF1 gene (the core promoter element) [89].
In the batch fermentations undertaken with the BY4741 strain two main C-based by-products were
identified, ethanol and acetic acid, which achieved a final titer of 3.2 g/L and ~7.5 g/L, respectively.
Production of acetic acid occurs in the alcohol fermentation pathway when a shortage of NADH occurs,
which results in accumulation of acetaldehyde which is subsequently converted into acetate by the
acetaldehyde dehydrogenase enzymes [90]. The concentration of acetic acid is considerably higher than
the one that would be expected to have if this product was being produced as a by-pass product of the
yeast alcoholic fermentation. This observation suggested that under the experimental conditions used
here, the yeast cells might be undergoing a ferment-respiratory metabolism. The accumulation of acetate
(and of other derived products such as acetoin or 2,3-butanediol) in the growth medium under conditions
favoring mixed fermentative-respiratory metabolism has been reported before [90]. The high ratio of
aeration used in the fermentations could contribute to increase oxygen availabily which can trigger
ferment-respiratory metabolism, especially in period of low growth-rate. It is also relevant to note that
MMF medium used in this work contains para-aminobenzoic acid, in a formulation defined by Verduyn et
al, 92 and that the presence of this acid has been linked to an increase in the respiratory capacity of S.
cerevisiae [91]. It is also important to stress that a higher titer of acetic acid was present in the supernatant
harvested from the cultures initiated with an OD600 of 2, which also have reduced growth. Furthermore,
this over-accumulation of acetic acid in the medium was also observed in the supernatants collected from
BY4741 cells transformed with the pGREG586 cloning vector. The absence of glycerol in the supernatants
of the different fermentations is also in line with the hypothesis of a fermento-respiratory metabolism,
suggesting that NADH is being mostly re-oxidized in respiration. These results indicate that strategies that
should be pursued to improve production of itaconic acid should involve, for example, channeling of this
exceeding acetate to acetyl-CoA which could then fuel the TCA cycle and boost itaconic acid production.
Production of itaconic acid was also attempted in the prototrophic strain 23344c (only auxotrophic to
ura3, the selection marker) transformed with the pGal-AtCad1 plasmid. However, in the fermentations
undertaken by these cells, only trace amounts of itaconic acid were detected in the fermentation broth,
which was surprising. Within an industrial setting the use of a prototrophic strain would be advisable and
in that sense the herein obtained result is of importance. In silico simulation confirmed, at least in one of
the tested cases, the better performance of the BY4741 strain in producing itaconic acid. According to the
obtained results the key deletions should be Leu2 and His3. It is not easy to understand how the deletion
of these two genes impact itaconic acid production, although it can be argued that the lack of leucine and
histidine biosynthesis that is expected to occur in the BY4741 could contribute to increase the availability
of TCA cycle-precursors which could then benefit itaconic acid production. It can’t also be disregarded the

51
possibility of this phenomenon registered in the 23344c strain resulting from a regulatory mechanism that
can’t be predicted by the metabolic models used. It will be essential to test if other prototrophic strains
are also unable to produce itaconic acid to understand if this could be a strain-dependent effect or if its
associated to prototrophy.
In the second part of this thesis a set of constraint-based methods were implemented to explore the
metabolic network of a yeast strain performing the conversion of cis-aconitate into itaconic acid.
Additionally OptGene and OptKnock were used to identify interesting deletion strategies for the
overproduction of itaconic acid. The optimization of biomass is generally used as a cellular objective
function in most studies performed in yeast-based metabolic engineering [57]. Nevertheless, using these
conditions it was not possible to simulate the occurrence of itaconic acid biosynthesis and growth
simultaneously, which is what is observed to occur in vivo. Modification of the objective function to
maximization of biomass yield per flux unit allowed a better representation of what was found to occur
in vivo, predicting the ability of yeast cells to produce itaconic acid and to grow at the same time. This
objective function is based on the assumption of parsimonious enzyme usage: under exponential growth,
there is a selection for the fastest growing strains that require lowest overall flux through the network
[95]. The application of this principle results in the selection of the flux distribution with minimal total
metabolic flux among the alternate optima that are usually provided by FBA. Upon maximization of
biomass yield per flux unit the CAD fluxes were non null for all the simulated scenarios, indicating that
this objective function is more well-suited for this application in particular. Production of itaconic acid and
growth are expected to be decoupled, since itaconic acid biosynthesis represents a cost for cellular
energetics by diverting cis-aconitic acid from the TCA cycle (which consequently leads to a decrease in the
flux going through the subsequent reactions that reduce NAD+ to NADH and that are necessary for ATP
production in the respiratory chain). Indeed, FVA-based analysis revealed that a decrease of only 5% in
the optimality of the growth rate was enough to trigger production of itaconic acid in yeast cells. Also
consistent with this idea, deletion mutants found to over-produce itaconic acid exhibited decreased
growth rates compared to the parental strain. A similar negative correlation with growth was also
observed when the metabolism of yeast cells producing succinic acid was simulated through FBA [68].
These results reinforce the need of implementing strategies that force the network to balance growth and
itaconic acid production.
Considering the results obtained by FVA and the established competition between growth and itaconic
acid production in the yeast metabolic network, it is possible that the induction of suboptimal states
improves itaconic acid production in yeast. One possible way to achieve this would be utilizing non-
fermentable carbon sources in the fermentation setting, as it has been observed that the utilization of
carbon sources for which the strains haven’t been adapted to can lead to changes in growth characteristics
that could signify parallel or opposing growth objectives, i.e., suboptimal states [96]. Further exploration
of the FVA results to identify the necessary flux changes that allow the achievement of the maximal fluxes
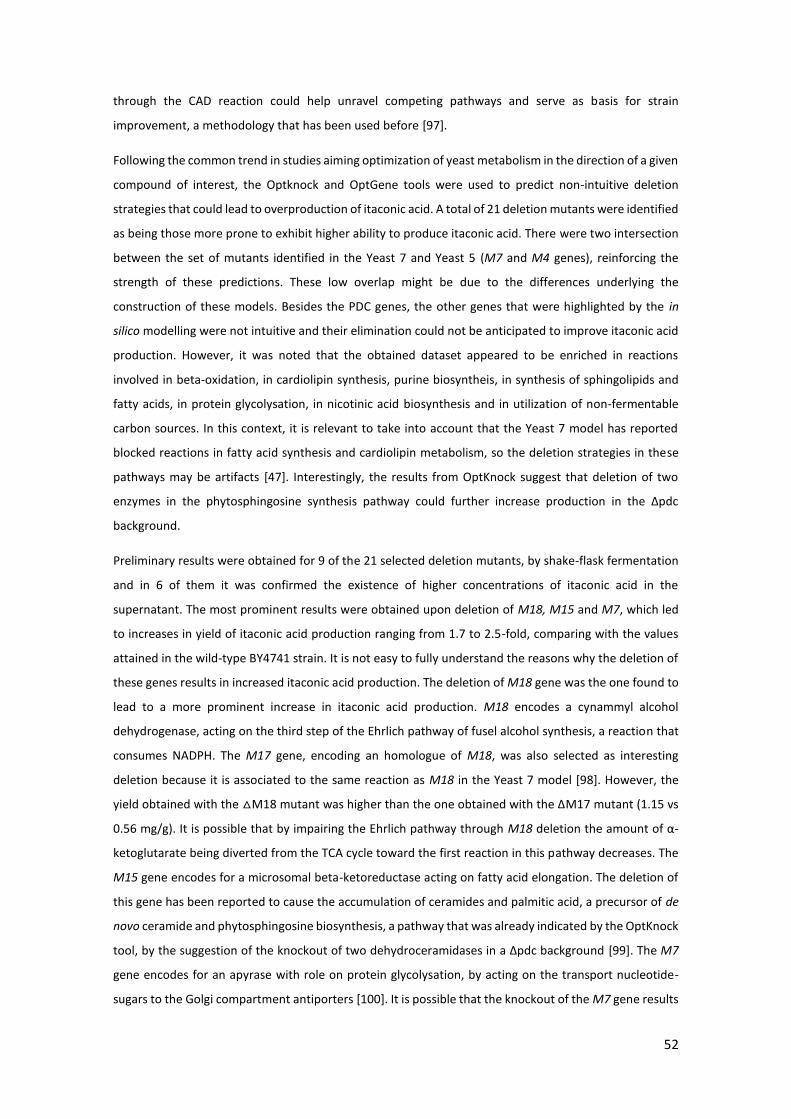
52
through the CAD reaction could help unravel competing pathways and serve as basis for strain
improvement, a methodology that has been used before [97].
Following the common trend in studies aiming optimization of yeast metabolism in the direction of a given
compound of interest, the Optknock and OptGene tools were used to predict non-intuitive deletion
strategies that could lead to overproduction of itaconic acid. A total of 21 deletion mutants were identified
as being those more prone to exhibit higher ability to produce itaconic acid. There were two intersection
between the set of mutants identified in the Yeast 7 and Yeast 5 (M7 and M4 genes), reinforcing the
strength of these predictions. These low overlap might be due to the differences underlying the
construction of these models. Besides the PDC genes, the other genes that were highlighted by the in
silico modelling were not intuitive and their elimination could not be anticipated to improve itaconic acid
production. However, it was noted that the obtained dataset appeared to be enriched in reactions
involved in beta-oxidation, in cardiolipin synthesis, purine biosyntheis, in synthesis of sphingolipids and
fatty acids, in protein glycolysation, in nicotinic acid biosynthesis and in utilization of non-fermentable
carbon sources. In this context, it is relevant to take into account that the Yeast 7 model has reported
blocked reactions in fatty acid synthesis and cardiolipin metabolism, so the deletion strategies in these
pathways may be artifacts [47]. Interestingly, the results from OptKnock suggest that deletion of two
enzymes in the phytosphingosine synthesis pathway could further increase production in the Δpdc
background.
Preliminary results were obtained for 9 of the 21 selected deletion mutants, by shake-flask fermentation
and in 6 of them it was confirmed the existence of higher concentrations of itaconic acid in the
supernatant. The most prominent results were obtained upon deletion of M18, M15 and M7, which led
to increases in yield of itaconic acid production ranging from 1.7 to 2.5-fold, comparing with the values
attained in the wild-type BY4741 strain. It is not easy to fully understand the reasons why the deletion of
these genes results in increased itaconic acid production. The deletion of M18 gene was the one found to
lead to a more prominent increase in itaconic acid production. M18 encodes a cynammyl alcohol
dehydrogenase, acting on the third step of the Ehrlich pathway of fusel alcohol synthesis, a reaction that
consumes NADPH. The M17 gene, encoding an homologue of M18, was also selected as interesting
deletion because it is associated to the same reaction as M18 in the Yeast 7 model [98]. However, the
yield obtained with the M18 mutant was higher than the one obtained with the ΔM17 mutant (1.15 vs
0.56 mg/g). It is possible that by impairing the Ehrlich pathway through M18 deletion the amount of α-
ketoglutarate being diverted from the TCA cycle toward the first reaction in this pathway decreases. The
M15 gene encodes for a microsomal beta-ketoreductase acting on fatty acid elongation. The deletion of
this gene has been reported to cause the accumulation of ceramides and palmitic acid, a precursor of de
novo ceramide and phytosphingosine biosynthesis, a pathway that was already indicated by the OptKnock
tool, by the suggestion of the knockout of two dehydroceramidases in a Δpdc background [99]. The M7
gene encodes for an apyrase with role on protein glycolysation, by acting on the transport nucleotide-
sugars to the Golgi compartment antiporters [100]. It is possible that the knockout of the M7 gene results

53
in a lower transport of these precursors, decreasing the drain of sugars from the first steps of glycolysis,
increasing the flux through the TCA cycle.
Notably, the herein identified set of deletions predicted to increase production of itaconic acid in S.
cerevisiae differs from the one described by Blazeck et al., (2014). Nevertheless, despite the individual
genes identified are different there is some convergence of the metabolic pathways involved. In the work
of Blazeck et al., 2014 the simultaneous knockout of ade3, bna2 and tes1 was found to be optimal for the
production of itaconic acid. Ade3 is a gene involved in purine synthesis, a category that was enriched in
the dataset obtained this work from OptKnock and OptGene. Additionally, tes1 encodes for an acyl-coA
thioesterase, with a role in the fatty acid oxidation. This pathway was also enriched in the dataset and the
deletion of M10, a peroxisoal ketoacyl-coA thiolase was also found to increase final itaconic acid titers in
vivo. Finally, bna2 encodes for a indoleamine 2,3-dioxygenase, an enzyme involded in the biosynthesis of
nicotinic acid from tryptophan via kynurenine. In this study one of the suggested knockouts is M5,
encoding a kynurenine aminotransferase involved in the same pathway. This reinforces the idea that a
decrease in the formation of nicotinic acid might allow a higher production of itaconic acid, either by a
decrease in the use of electron equivalents or by reducing cofactors availability and shifting its balance.
On the overall the results obtained in this work, combining experimental efforts with computational
simulation and optimization, have provided a set of of both rational and non-intuitive strategies that may
help to implement successful processes for the production of itaconic acid in yeast and, eventually, in
other fungal hosts currently used for production of itaconic acid, such as Aspergillii.

54
5. References
[1] T. Willke and K.-D. Vorlop, “Industrial bioconversion of renewable resources as an alternative to conventional chemistry.,” Appl. Microbiol. Biotechnol., vol. 66, no. 2, pp. 131–42, Dec. 2004.
[2] B. Erickson, Nelson, and P. Winters, “Perspective on opportunities in industrial biotechnology in renewable chemicals.,” Biotechnol. J., vol. 7, no. 2, pp. 176–85, Feb. 2012.
[3] T. Werpy and G. Petersen, “Top Value Added Chemicals from Biomass,” Program, p. 76, 2004.
[4] “BREW: Medium and Long-term Opportunities and Risks of the Biotechnological Production of Bulk Chemicals from Renewable Resources - The Potential of White Biotechnology The BREW Project,” 2006.
[5] T. Klement and J. Büchs, “Itaconic acid--a biotechnological process in change.,” Bioresour. Technol., vol. 135, pp. 422–31, May 2013.
[6] BioConSepT (European Union funded R&D Project), “Determination of Market Potential for Selected Platform Chemicals,” 2011.
[7] M. G. Steiger, M. L. Blumhoff, D. Mattanovich, and M. Sauer, “Biochemistry of microbial itaconic acid production.,” Front. Microbiol., vol. 4, no. February, p. 23, Jan. 2013.
[8] L. van der Straat, M. Vernooij, M. Lammers, W. van den Berg, T. Schonewille, J. Cordewener, I. van der Meer, A. Koops, and L. H. de Graaff, “Expression of the Aspergillus terreus itaconic acid biosynthesis cluster in Aspergillus niger.,” Microb. Cell Fact., vol. 13, p. 11, 2014.
[9] A. Li, N. van Luijk, M. ter Beek, M. Caspers, P. Punt, and M. van der Werf, “A clone-based transcriptomics approach for the identification of genes relevant for itaconic acid production in Aspergillus.,” Fungal Genet. Biol., vol. 48, no. 6, pp. 602–11, Jun. 2011.
[10] G. Tevz, M. Bencina, and M. Legisa, “Enhancing itaconic acid production by Aspergillus terreus.,” Appl. Microbiol. Biotechnol., vol. 87, no. 5, pp. 1657–64, Aug. 2010.
[11] X. Huang, X. Lu, Y. Li, X. Li, and J.-J. Li, “Improving itaconic acid production through genetic engineering of an industrial Aspergillus terreus strain.,” Microb. Cell Fact., vol. 13, no. 1, p. 119, Jan. 2014.
[12] A. Hevekerl, A. Kuenz, and K.-D. Vorlop, “Filamentous fungi in microtiter plates-an easy way to optimize itaconic acid production with Aspergillus terreus.,” Appl. Microbiol. Biotechnol., vol. 98, no. 16, pp. 6983–9, Aug. 2014.
[13] A. Li, N. Pfelzer, R. Zuijderwijk, A. Brickwedde, C. van Zeijl, and P. Punt, “Reduced by-product formation and modified oxygen availability improve itaconic acid production in Aspergillus niger.,” Appl. Microbiol. Biotechnol., vol. 97, no. 9, pp. 3901–11, May 2013.
[14] K. S. Vuoristo, A. E. Mars, J. V. Sangra, J. Springer, G. Eggink, J. P. M. Sanders, and R. a. Weusthuis, “Metabolic engineering of itaconate production in Escherichia coli,” Appl. Microbiol. Biotechnol., vol. 99, pp. 221–228, 2014.
[15] S. Okamoto, T. Chin, K. Hiratsuka, Y. Aso, Y. Tanaka, T. Takahashi, and H. Ohara, “Production of itaconic acid using metabolically engineered Escherichia coli,” J. Gen. Appl. Microbiol., vol. 60, pp. 191–197, 2014.

55
[16] T. Chin, M. Sano, T. Takahashi, H. Ohara, and Y. Aso, “Photosynthetic production of itaconic acid in Synechocystis sp. PCC6803,” J. Biotechnol., vol. 195, pp. 43–45, 2015.
[17] J. Blazeck, J. Miller, A. Pan, J. Gengler, C. Holden, M. Jamoussi, and H. S. Alper, “Metabolic engineering of Saccharomyces cerevisiae for itaconic acid production.,” Appl. Microbiol. Biotechnol., Jul. 2014.
[18] B. Scherens and A. Goffeau, “The uses of genome-wide yeast mutant collections.,” Genome Biol., vol. 5, no. 7, p. 229, Jan. 2004.
[19] D. a Abbott, R. M. Zelle, J. T. Pronk, and A. J. a van Maris, “Metabolic engineering of Saccharomyces cerevisiae for production of carboxylic acids: current status and challenges.,” FEMS Yeast Res., vol. 9, no. 8, pp. 1123–36, Dec. 2009.
[20] E. Nevoigt, “Progress in metabolic engineering of Saccharomyces cerevisiae.,” Microbiol. Mol. Biol. Rev., vol. 72, no. 3, pp. 379–412, Sep. 2008.
[21] M. C. for I. S. Biology, “The Yeastnet project.” [Online]. Available: http://yeast.sourceforge.net/. [Accessed: 29-Jan-2015].
[22] C. Drewke, J. Thielen, and M. Ciriacy, “Ethanol formation in adh0 mutants reveals the existence of a novel acetaldehyde-reducing activity in Saccharomyces cerevisiae.,” J. Bacteriol., vol. 172, no. 7, pp. 3909–17, Jul. 1990.
[23] P. J. Flikweert MT, Van Der Zanden L, Janssen WM, Steensma HY, Van Dijken JP, “Pyruvate decarboxylase: an indispensable enzyme for growth of Saccharomyces cerevisiae on glucose.,” Yeast, 1996. [Online]. Available: http://www.ncbi.nlm.nih.gov/pubmed/8904337. [Accessed: 08-Jul-2015].
[24] M. T. Flikweert, M. De Swaaf, J. P. Van Dijken, and J. T. Pronk, “Growth requirements of pyruvate-decarboxylase-negative Saccharomyces cerevisiae,” vol. 174, pp. 73–79, 1999.
[25] A. J. a Van Maris, M. a H. Luttik, A. a. Winkler, J. P. Van Dijken, and J. T. Pronk, “Overproduction of threonine aldolase circumvents the biosynthetic role of pyruvate decarboxylase in glucose-limited chemostat cultures of Saccharomyces cerevisiae,” Appl. Environ. Microbiol., vol. 69, no. 4, pp. 2094–2099, 2003.
[26] A. J. A. Van Maris, J. A. Geertman, A. Vermeulen, M. K. Groothuizen, A. Aaron, M. D. W. Piper, J. P. Van Dijken, J. T. Pronk, and A. A. Winkler, “Directed Evolution of Pyruvate Decarboxylase-Negative Saccharomyces cerevisiae, yielding a C2-Independent, Glucose-Tolerant, and Pyruvate-Hyperproducing Yeast,” 2004.
[27] B. Oud, C.-L. Flores, C. Gancedo, X. Zhang, J. Trueheart, J.-M. Daran, J. T. Pronk, and A. J. a van Maris, “An internal deletion in MTH1 enables growth on glucose of pyruvate-decarboxylase negative, non-fermentative Saccharomyces cerevisiae.,” Microb. Cell Fact., vol. 11, no. 1, p. 131, Jan. 2012.
[28] A. J. A. van Maris, A. A. Winkler, D. Porro, J. P. van Dijken, and J. T. Pronk, “Homofermentative Lactate Production Cannot Sustain Anaerobic Growth of Engineered Saccharomyces cerevisiae: Possible Consequence of Energy-Dependent Lactate Export,” Appl. Environ. Microbiol., vol. 70, no. 5, pp. 2898–2905, May 2004.
[29] R. M. Zelle, E. de Hulster, W. a van Winden, P. de Waard, C. Dijkema, A. a Winkler, J.-M. a Geertman, J. P. van Dijken, J. T. Pronk, and A. J. a van Maris, “Malic acid production by

56
Saccharomyces cerevisiae: engineering of pyruvate carboxylation, oxaloacetate reduction, and malate export.,” Appl. Environ. Microbiol., vol. 74, no. 9, pp. 2766–77, May 2008.
[30] S. Y. Lee, D.-Y. Lee, and T. Y. Kim, “Systems biotechnology for strain improvement.,” Trends Biotechnol., vol. 23, no. 7, pp. 349–58, Jul. 2005.
[31] J. H. Park, S. Y. Lee, T. Y. Kim, and H. U. Kim, “Application of systems biology for bioprocess development.,” Trends Biotechnol., vol. 26, no. 8, pp. 404–12, Aug. 2008.
[32] G. Xu, W. Zou, X. Chen, N. Xu, L. Liu, and J. Chen, “Fumaric acid production in Saccharomyces cerevisiae by in silico aided metabolic engineering.,” PLoS One, vol. 7, no. 12, p. e52086, Jan. 2012.
[33] A. K. Gombert and J. Nielsen, “Mathematical modelling of metabolism,” Curr. Opin. Biotechnol., vol. 11, no. 2, pp. 180–186, Apr. 2000.
[34] F. Llaneras and J. Picó, “Stoichiometric modelling of cell metabolism.,” J. Biosci. Bioeng., vol. 105, no. 1, pp. 1–11, Jan. 2008.
[35] K. J. Kauffman, P. Prakash, and J. S. Edwards, “Advances in flux balance analysis,” Curr. Opin. Biotechnol., vol. 14, no. 5, pp. 491–496, Oct. 2003.
[36] T. R. Maarleveld, R. A. Khandelwal, B. G. Olivier, B. Teusink, and F. J. Bruggeman, “Basic concepts and principles of stoichiometric modeling of metabolic networks.,” Biotechnol. J., vol. 8, no. 9, pp. 997–1008, Sep. 2013.
[37] A. Bordbar, J. M. Monk, Z. a King, and B. O. Palsson, “Constraint-based models predict metabolic and associated cellular functions.,” Nat. Rev. Genet., vol. 15, no. 2, pp. 107–20, Feb. 2014.
[38] S. Vaseghi, A. Baumeister, M. Rizzi, and M. Reuss, “In vivo dynamics of the pentose phosphate pathway in Saccharomyces cerevisiae.,” Metab. Eng., vol. 1, no. 2, pp. 128–40, Apr. 1999.
[39] M. Rizzi, M. Baltes, U. Theobald, and M. Reuss, “In vivo analysis of metabolic dynamics in Saccharomyces cerevisiae: II. Mathematical model.,” Biotechnol. Bioeng., vol. 55, no. 4, pp. 592–608, Aug. 1997.
[40] R. Steuer, T. Gross, J. Selbig, and B. Blasius, “Structural kinetic modeling of metabolic networks.,” Proc. Natl. Acad. Sci. U. S. A., vol. 103, no. 32, pp. 11868–73, Aug. 2006.
[41] I. Thiele and B. Ø. Palsson, “A protocol for generating a high-quality genome-scale metabolic reconstruction.,” Nat. Protoc., vol. 5, no. 1, pp. 93–121, Jan. 2010.
[42] M. J. Herrgård, N. Swainston, P. Dobson, W. B. Dunn, K. Y. Arga, M. Arvas, N. Blüthgen, S. Borger, R. Costenoble, M. Heinemann, M. Hucka, N. Le Novère, P. Li, W. Liebermeister, M. L. Mo, A. P. Oliveira, D. Petranovic, S. Pettifer, E. Simeonidis, K. Smallbone, I. Spasić, D. Weichart, R. Brent, D. S. Broomhead, H. V Westerhoff, B. Kirdar, M. Penttilä, E. Klipp, B. Ø. Palsson, U. Sauer, S. G. Oliver, P. Mendes, J. Nielsen, and D. B. Kell, “A consensus yeast metabolic network reconstruction obtained from a community approach to systems biology.,” Nat. Biotechnol., vol. 26, no. 10, pp. 1155–60, Oct. 2008.
[43] P. D. Dobson, K. Smallbone, D. Jameson, E. Simeonidis, K. Lanthaler, P. Pir, C. Lu, N. Swainston, W. B. Dunn, P. Fisher, D. Hull, M. Brown, O. Oshota, N. J. Stanford, D. B. Kell, R. D. King, S. G. Oliver, R. D. Stevens, and P. Mendes, “Further developments towards a genome-scale metabolic model of yeast.,” BMC Syst. Biol., vol. 4, p. 145, Jan. 2010.

57
[44] B. D. Heavner, K. Smallbone, B. Barker, P. Mendes, and L. P. Walker, “Yeast 5 - an expanded reconstruction of the Saccharomyces cerevisiae metabolic network.,” BMC Syst. Biol., vol. 6, no. 1, p. 55, Jan. 2012.
[45] B. D. Heavner, K. Smallbone, N. D. Price, and L. P. Walker, “Version 6 of the consensus yeast metabolic network refines biochemical coverage and improves model performance.,” Database (Oxford)., vol. 2013, p. bat059, Jan. 2013.
[46] H. W. Aung, S. a Henry, and L. P. Walker, “Revising the Representation of Fatty Acid, Glycerolipid, and Glycerophospholipid Metabolism in the Consensus Model of Yeast Metabolism.,” Ind. Biotechnol. (New Rochelle. N. Y)., vol. 9, no. 4, pp. 215–228, Aug. 2013.
[47] H. W. Aung, S. a Henry, and L. P. Walker, “Revising the Representation of Fatty Acid, Glycerolipid, and Glycerophospholipid Metabolism in the Consensus Model of Yeast Metabolism.,” Ind. Biotechnol. (New Rochelle. N. Y)., vol. 9, no. 4, pp. 215–228, Aug. 2013.
[48] I. Famili, J. Forster, J. Nielsen, and B. O. Palsson, “Saccharomyces cerevisiae phenotypes can be predicted by using constraint-based analysis of a genome-scale reconstructed metabolic network.,” Proc. Natl. Acad. Sci. U. S. A., vol. 100, no. 23, pp. 13134–9, Nov. 2003.
[49] C. Y. Ng, M.-Y. Jung, J. Lee, and M.-K. Oh, “Production of 2,3-butanediol in Saccharomyces cerevisiae by in silico aided metabolic engineering.,” Microb. Cell Fact., vol. 11, no. 1, p. 68, Jan. 2012.
[50] A. R. Brochado, C. Matos, B. L. Møller, J. Hansen, U. H. Mortensen, and K. R. Patil, “Improved vanillin production in baker’s yeast through in silico design.,” Microb. Cell Fact., vol. 9, no. 1, p. 84, Jan. 2010.
[51] M. a Asadollahi, J. Maury, K. R. Patil, M. Schalk, A. Clark, and J. Nielsen, “Enhancing sesquiterpene production in Saccharomyces cerevisiae through in silico driven metabolic engineering.,” Metab. Eng., vol. 11, no. 6, pp. 328–34, Nov. 2009.
[52] K. a Curran, J. M. Leavitt, A. S. Karim, and H. S. Alper, “Metabolic engineering of muconic acid production in Saccharomyces cerevisiae.,” Metab. Eng., vol. 15, pp. 55–66, Jan. 2013.
[53] J. M. Otero, D. Cimini, K. R. Patil, S. G. Poulsen, L. Olsson, and J. Nielsen, “Industrial systems biology of Saccharomyces cerevisiae enables novel succinic acid cell factory.,” PLoS One, vol. 8, no. 1, p. e54144, Jan. 2013.
[54] S. A. Becker, A. M. Feist, M. L. Mo, G. Hannum, B. Ø. Palsson, and M. J. Herrgard, “Quantitative prediction of cellular metabolism with constraint-based models: the COBRA Toolbox.,” Nat. Protoc., vol. 2, no. 3, pp. 727–38, Jan. 2007.
[55] J. Schellenberger, R. Que, R. M. T. Fleming, I. Thiele, J. D. Orth, A. M. Feist, D. C. Zielinski, A. Bordbar, N. E. Lewis, S. Rahmanian, J. Kang, D. R. Hyduke, and B. Ø. Palsson, “Quantitative prediction of cellular metabolism with constraint-based models: the COBRA Toolbox v2.0.,” Nat. Protoc., vol. 6, no. 9, pp. 1290–307, Sep. 2011.
[56] H.-S. Song, W. Cannon, A. Beliaev, and A. Konopka, “Mathematical Modeling of Microbial Community Dynamics: A Methodological Review,” Processes, vol. 2, no. 4, pp. 711–752, Oct. 2014.
[57] J. D. Orth, I. Thiele, and B. Ø. Palsson, “What is flux balance analysis?,” Nat. Biotechnol., vol. 28, no. 3, pp. 245–8, Mar. 2010.

58
[58] R. S. Costa, S. Nguyen, A. Hartmann, and S. Vinga, “Exploring the Cellular Objective in Flux Balance Constraint-Based Models,” pp. 211–224, 2014.
[59] R. Schuetz, L. Kuepfer, and U. Sauer, “Systematic evaluation of objective functions for predicting intracellular fluxes in Escherichia coli.,” Mol. Syst. Biol., vol. 3, no. 119, p. 119, 2007.
[60] J. M. Park, T. Y. Kim, and S. Y. Lee, “Constraints-based genome-scale metabolic simulation for systems metabolic engineering.,” Biotechnol. Adv., vol. 27, no. 6, pp. 979–88, 2009.
[61] R. Mahadevan and C. H. Schilling, “The effects of alternate optimal solutions in constraint-based genome-scale metabolic models,” Metab. Eng., vol. 5, no. 4, pp. 264–276, Oct. 2003.
[62] J. S. Edwards and B. O. Palsson, “Robustness Analysis of the Escherichia coli Metabolic Network,” pp. 927–939, 2000.
[63] Z. a King, C. J. Lloyd, A. M. Feist, and B. O. Palsson, “Next-generation genome-scale models for metabolic engineering,” Curr. Opin. Biotechnol., vol. 35, pp. 23–29, 2015.
[64] A. P. Burgard, P. Pharkya, and C. D. Maranas, “Optknock: a bilevel programming framework for identifying gene knockout strategies for microbial strain optimization.,” Biotechnol. Bioeng., vol. 84, no. 6, pp. 647–57, Dec. 2003.
[65] C. M. Fonseca and P. J. Fleming, “An Overview of Evolutionary Algorithms in Multiobjective Optimization,” Evol. Comput., vol. 3, no. 1, pp. 1–16, 1995.
[66] D. Segrè, D. Vitkup, and G. M. Church, “Analysis of optimality in natural and perturbed metabolic networks.,” Proc. Natl. Acad. Sci. U. S. A., vol. 99, no. 23, pp. 15112–7, Nov. 2002.
[67] T. Shlomi, O. Berkman, and E. Ruppin, “Regulatory on/off minimization of metabolic flux changes after genetic perturbations.,” Proc. Natl. Acad. Sci. U. S. A., vol. 102, no. 21, pp. 7695–700, May 2005.
[68] K. R. Patil, I. Rocha, J. Förster, and J. Nielsen, “Evolutionary programming as a platform for in silico metabolic engineering.,” BMC Bioinformatics, vol. 6, p. 308, Jan. 2005.
[69] M. R. Moita, “MSc Thesis: Towards the production of levulinic and itaconic acids in Saccharomyces cerevisiae: a contribution for understanding the molecular mechanisms of toxicity of these acids in producing cells,” Instituto Superior Técnico, 2013.
[70] N. M. Rodrigues, “MSc Thesis: Metabolic and genetic engineering strategies to explore Saccharomyces cerevisiae as a cell factory for the production of itaconic acid,” Instituto Superior Técnico, 2014.
[71] “European Saccharomyces cerevisiae arquive for functional analysis.” [Online]. Available: http://web.uni-frankfurt.de/fb15/mikro/euroscarf/descri.html. [Accessed: 01-Jan-2015].
[72] C. B. Brachmann, A. Davies, G. J. Cost, E. Caputo, J. Li, P. Hieter, and J. D. Boeke, “Designer deletion strains derived from Saccharomyces cerevisiae S288C: A useful set of strains and plasmids for PCR-mediated gene disruption and other applications,” Yeast, vol. 14, pp. 115–132, 1998.
[73] G. Jansen, C. Wu, B. Schade, D. Y. Thomas, and M. Whiteway, “Drag&Drop cloning in yeast.,” Gene, vol. 344, pp. 43–51, Jan. 2005.

59
[74] N. Rodrigues, “Exploring Saccharomyces cerevisiae to improve microbe-based production of itaconic acid (Master thesis in Biotechnology),” Instituto Superior Técnico, 2014.
[75] I. Rocha, P. Maia, P. Evangelista, P. Vilaça, S. Soares, J. P. Pinto, J. Nielsen, K. R. Patil, E. C. Ferreira, and M. Rocha, “OptFlux: an open-source software platform for in silico metabolic engineering.,” BMC Syst. Biol., vol. 4, p. 45, 2010.
[76] M. V. Schneider, “In Silico Systems Biology,” in In silico systems biology - Methods in Molecular Biology, vol. 1021, 2013, pp. 1–11.
[77] L. Paciello, E. de Alteriis, C. Mazzoni, V. Palermo, J. Zueco, and P. Parascandola, “Performance of the auxotrophic Saccharomyces cerevisiae BY4741 as host for the production of IL-1beta in aerated fed-batch reactor: role of ACA supplementation, strain viability, and maintenance energy.,” Microb. Cell Fact., vol. 8, no. 1, p. 70, Jan. 2009.
[78] M. E. Smoot, K. Ono, J. Ruscheinski, P.-L. Wang, and T. Ideker, “Cytoscape 2.8: new features for data integration and network visualization.,” Bioinformatics, vol. 27, no. 3, pp. 431–2, Feb. 2011.
[79] N. a Da Silva and S. Srikrishnan, “Introduction and expression of genes for metabolic engineering applications in Saccharomyces cerevisiae.,” FEMS Yeast Res., vol. 12, no. 2, pp. 197–214, Mar. 2012.
[80] M. Johnston, “A model fungal gene regulatory mechanism: the GAL genes of Saccharomyces cerevisiae.,” Microbiol. Rev., vol. 51, no. 4, pp. 458–476, 1987.
[81] L. Paciello, J. Zueco, and C. Landi, “On the fermentative behavior of auxotrophic strains of Saccharomyces cerevisiae,” Electron. J. Biotechnol., vol. 17, no. 5, pp. 246–249, Sep. 2014.
[82] R. M. Zelle, E. de Hulster, W. a van Winden, P. de Waard, C. Dijkema, A. a Winkler, J.-M. a Geertman, J. P. van Dijken, J. T. Pronk, and A. J. a van Maris, “Malic acid production by Saccharomyces cerevisiae: engineering of pyruvate carboxylation, oxaloacetate reduction, and malate export.,” Appl. Environ. Microbiol., vol. 74, no. 9, pp. 2766–77, May 2008.
[83] A. J. A. Van Maris, J. A. Geertman, A. Vermeulen, M. K. Groothuizen, A. A. Winkler, M. D. W. Piper, J. P. Van Dijken, J. T. Pronk, B. V Engineering, and N.-C. K. Rotterdam, “Directed Evolution of Pyruvate Decarboxylase-Negative Saccharomyces cerevisiae , Yielding a C 2 -Independent , Glucose-Tolerant , and Pyruvate-Hyperproducing Yeast,” vol. 70, no. 1, pp. 159–166, 2004.
[84] G. Tevz, M. Bencina, and M. Legisa, “Enhancing itaconic acid production by Aspergillus terreus.,” Appl. Microbiol. Biotechnol., vol. 87, no. 5, pp. 1657–64, Aug. 2010.
[85] K. Weinhandl, M. Winkler, A. Glieder, and A. Camattari, “Carbon source dependent promoters in yeasts.,” Microb. Cell Fact., vol. 13, p. 5, Jan. 2014.
[86] S. Partow, V. Siewers, S. Bjørn, J. Nielsen, and J. Maury, “Characterization of different promoters for designing a new expression vector in Saccharomyces cerevisiae.,” Yeast, vol. 27, no. 11, pp. 955–64, Nov. 2010.
[87] J. Gao, D. Anderson, and B. Levie, “Saccharification of recalcitrant biomass and integration options for lignocellulosic sugars from Catchlight Energy’s sugar process (CLE Sugar).,” Biotechnol. Biofuels, vol. 6, no. 1, p. 10, Jan. 2013.
[88] S. G. Wi, H. J. Kim, S. A. Mahadevan, D.-J. Yang, and H.-J. Bae, “The potential value of the seaweed Ceylon moss (Gelidium amansii) as an alternative bioenergy resource.,” Bioresour. Technol., vol. 100, no. 24, pp. 6658–60, Dec. 2009.

60
[89] J. Blazeck, R. Garg, B. Reed, and H. S. Alper, “Controlling promoter strength and regulation in Saccharomyces cerevisiae using synthetic hybrid promoters,” Biotechnol. Bioeng., vol. 109, no. 11, pp. 2884–2895, 2012.
[90] J. Hou, G. Scalcinati, M. Oldiges, and G. N. Vemuri, “Metabolic impact of increased NADH availability in saccharomyces cerevisiae,” Appl. Environ. Microbiol., vol. 76, no. 3, pp. 851–859, 2010.
[91] C. Verduyn, E. Postma, A. Scheffers, and J. P. V. A. N. Dijken, “Effect of Benzoic Acid on Metabolic Fluxes in Yeasts : A Continuous-Culture Study on the Regulation of Respiration and Alcoholic Fermentation,” vol. 8, no. 1 992, 1992.
[92] S. Ozcan and M. Johnston, “Function and Regulation of Yeast Hexose Transporters,” Microbiol. Mol. Biol. Rev., vol. 63, no. 3, pp. 554–569, Sep. 1999.
[93] D. J. Timson, “Galactose Metabolism in Saccharomyces cerevisiae,” Dyn. Biochem. Process Biotechnol. Mol. Biol., pp. 63–73, 2007.
[94] J. Lian, R. Chao, and H. Zhao, “Metabolic engineering of a Saccharomyces cerevisiae strain capable of simultaneously utilizing glucose and galactose to produce enantiopure (2R,3R)-butanediol,” Metab. Eng., vol. 23, pp. 92–99, 2014.
[95] N. E. Lewis, K. K. Hixson, T. M. Conrad, J. A. Lerman, P. Charusanti, A. D. Polpitiya, J. N. Adkins, G. Schramm, S. O. Purvine, D. Lopez-Ferrer, K. K. Weitz, R. Eils, R. König, R. D. Smith, and B. Ø. Palsson, “Omic data from evolved E. coli are consistent with computed optimal growth from genome-scale models.,” Mol. Syst. Biol., vol. 6, p. 390, Jul. 2010.
[96] S. S. Fong, J. Y. Marciniak, and B. Ø. Palsson, “Description and interpretation of adaptive evolution of Escherichia coli K-12 MG1655 by using a genome-scale in silico metabolic model.,” J. Bacteriol., vol. 185, no. 21, pp. 6400–8, Nov. 2003.
[97] J. Meng, Z. Xu, J. Guo, Y. Yue, and X. Sun, “Analysis of enhanced current-generating mechanism of Geobacter sulfurreducens strain via model-driven metabolism simulation.,” PLoS One, vol. 8, no. 9, p. e73907, Jan. 2013.
[98] C. Larroy, X. Parés, and J. a. Biosca, “Characterization of a Saccharomyces cerevisiae NADP(H)-dependent alcohol dehydrogenase (ADHVII), a member of the cinnamyl alcohol dehydrogenase family,” Eur. J. Biochem., vol. 269, no. October, pp. 5738–5745, 2002.
[99] G. Han, K. Gable, S. D. Kohlwein, F. Beaudoin, J. A. Napier, and T. M. Dunn, “The Saccharomyces cerevisiae YBR159w gene encodes the 3-ketoreductase of the microsomal fatty acid elongase.,” J. Biol. Chem., vol. 277, no. 38, pp. 35440–9, Sep. 2002.
[100] X.-D. Gao, V. Kaigorodov, and Y. Jigami, “M7, a Homologue of GDA1, Encodes Membrane-bound Apyrase Required for Golgi N- andO-Glycosylation in Saccharomyces cerevisiae,” J. Biol. Chem., vol. 274, no. 30, pp. 21450–21456, Jul. 1999.

61
2. Annex
Annex I) Extracellular concentrations of pyruvic and acetic acid in the BY4741 and
TAM cultures
Figure 20: (Right) Concentration of pyruvic acid in supernatant of cultures of BY4741 cells harboring the pGAL1-AtCad1 plasmid along 7 days of cultivation in MMF fermentation medium. Two sizes of initial
inoculum were tested corresponding to an initial OD600nm of 0.1 () or 2 ()
0
20
40
60
80
100
120
140
160
180
0 2 4 6 8
Ace
tic
acid
(m
M)
Time of fermentation (d)

62
Annex II) Lists of single mutants proposed by OptGene and OptKnock
Table 1: Single-mutants proposed by OptGene in the Yeast 7 model
Reaction index
Reaction name ORFs associated in the model
Gene
Reactions associated with only one gene in the model: selected to be experimentally validated
Gene associated with various reactions of the type inositolphosphotransferase M9
Acetyl-CoA C-acyltransferase (decanoyl-CoA) M10
Inositolphosphotransferase (PI (1-16:1, 2-18:1) MIPC-D (C24)) M9
Nucleoside diphosphatase M7
Fatty-acid--CoA ligase (tetradecanoate) M11
DAG kinase (1-16:0, 2-18:1), ER membrane M11
CL synthase (1-18:0, 2-16:1, 3-16:0, 4-16:1), mitochondrial membrane CRD!
MLCL (1-16:1, 2-16:1, 4-18:1):PC (1-16:0, 2-18:1) acyltransferase, mitochondrial membrane M14
B-ketoacyl-CoA reductase (3-hydroxyoctadecanoyl-CoA) M15
Glycerol-3-phosphate acyltransferase (18:1), ER membrane M16
2-enoyl-CoA hydratase (3-hydroxytetradecanoyl-CoA) M4
No genes associated in the model
3137 palmitate transport, mitochondrial membrane-cytoplasm
1179 5-nucleotidase (dGMP)
3426 isa 1-phosphatidyl-1D-myo-inositol for PI (1-16:0, 2-18:1)
1035 isa IPC
3061 ADP transport, cytoplasm-cell envelope
1212 alpha-ketoglutarate/malate transporter
3272 phosphatidyl-L-serine (1-16:0, 2-16:1) transport, ER membrane-Golgi membrane
3230 phosphatidyl-L-serine (1-18:0, 2-18:1) transport, ER membrane-mitochondrial membrane
3191 phosphatidylcholine (1-16:1, 2-16:1) transport, ER membrane-lipid particle
3090 1-phosphatidyl-1D-myo-inositol 4-phosphate (1-18:1, 2-18:1) transport, cell envelope-cytoplasm
1182 5-nucleotidase (GMP)

63
3263 phosphatidate (1-18:1, 2-18:1) transport, ER membrane-Golgi membrane
Mutants are non viable
2952
Associated with various reactions of the type inositol phosphorylceramide synthase (YDR367W AND YKL004W)
AUR1 and KEI1
2957
2930
2942
2985
1908 CDP-diacylglycerol synthase (1-18:1, 2-18:1), ER membrane YBR029C CDS1
2007 phosphatidylglycerolphosphate synthase (1-18:0, 2-16:1), mitochondrial membrane YCL004W PGS1
Reactions associated to multiple genes in the model (TGL3, TGL4, M17 and M18 were selected for experimental validation)
151 aldehyde dehydrogenase (2-phenylethanol, NADP) YCR105W OR YMR318C
M17 and M18
2741
Associated with reactions of the type triacylglycerol lipase
YMR313C OR YKR089C OR YOR081C OR YBR204C
TGL3, TGL4, TGL5 and LDH1 2729
846 V-ATPase, Golgi
YBR127C VMA2
YDL185W VMA1
YEL027W VMA3
YEL051W VMA8
YGR020C VMA7
YHR026W VMA13
YHR039C-A VMA10
YKL080W VMA5
YLR447C VMA6
YMR054W STV1
YOR332W VMA4
YPL234C VMA11
YPR036W VMA13
916 glycine transport (extracellular <--> cytoplasm)
YKR039W OR YPL265W OR YOR348C OR YOL020W OR YCL025C
GAP1
919 guanine transport (extracellular <--> cytoplasm) YER056C FCY2
YER060W FCY21

64
YER060W-A FCY22
YGL186C TPN1
957 L-methionine transport (extracellular <--> cytoplasm)
YKR039W GAP1
YDR508C GNP1
YHL036W MUP3
YBR068C BAP2
YDR046C RAD57
YG5055W MUP1
YCL025C AGP1
Table 2: Single-mutants proposed by Optknock in the Yeast 7 model
Reaction index
Reation name ORFs associated in the model
Gene
Selected for experimental validation
- Ap4A hydrolase - M8
Table 3: Single-mutants proposed by OptGene in the Yeast 5 model

65
Reaction Reaction name
ORFs associated in the model
Gene
Selected to be experimentally validated
Homoserine dehydrogenase (NADH) M1
homoserine dehydrogenase NADP
acetyl-coA synthetase M2
GTP/GDP translocase M3
3-hydroxyacyl-coA dehydrogenase (3-oxooctadecanoyl-coA) M4
3-hydroxyacyl-coA dehydratase (3-hydroxydecanoyl-coA)
N-formyl-L-kynurenine amidohydrolase M5
aldehyde dehydrogenase (acetaldehyde, NADP) M6
Nucleoside triphosphatase M7
No gene associated in the mode
r_1803 GDP-alpha-D-mannose transport - -
r_1811 Glycine transport - -
r_1957 NAD transport - -
Mutants are non viable
r_0772 NADH kinase mitochondrial YEL041W or YJR049C
YEF1
UTR1
Necessary to add fatty acids to the culture medium
r_0433 fatty-acyl-coA synthase (C14)
YGR037C and YKL182W and YNR016C and YPL231W
ACB1
FAS1
FAs2
ACC1
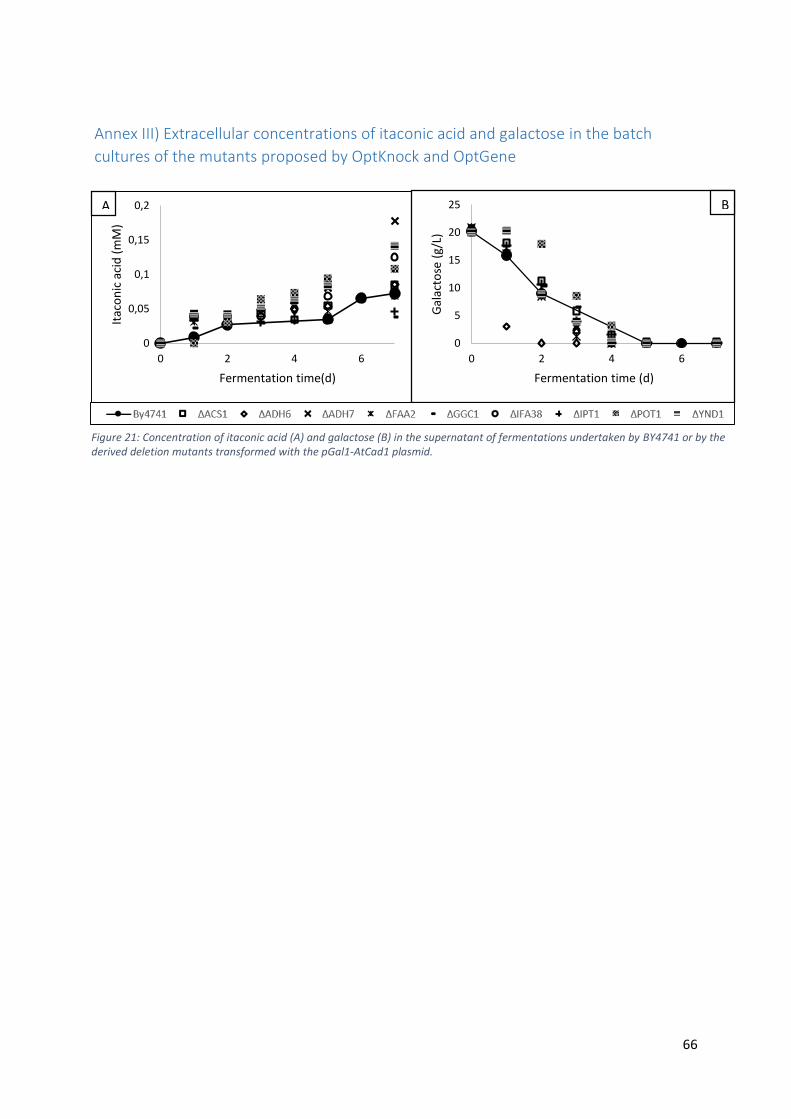
66
Annex III) Extracellular concentrations of itaconic acid and galactose in the batch
cultures of the mutants proposed by OptKnock and OptGene
0
0,05
0,1
0,15
0,2
0 2 4 6
Itac
on
ic a
cid
(m
M)
Fermentation time(d)
0
5
10
15
20
25
0 2 4 6
Gal
acto
se (
g/L)
Fermentation time (d)
Figure 21: Concentration of itaconic acid (A) and galactose (B) in the supernatant of fermentations undertaken by BY4741 or by the derived deletion mutants transformed with the pGal1-AtCad1 plasmid.
A B