METABOLIC ALTERATIONS OF FREE AND PROTEIN...
115
METABOLIC ALTERATIONS OF FREE AND PROTEIN-BOUND BIOTIN IN RATS DURING DIETARY BIOTIN MANIPULATION AND ENDOTOXIN EXPOSURE By BRANDON JAMES LEWIS A DISSERTATION PRESENTED TO THE GRADUATE SCHOOL OF THE UNIVERSITY OF FLORIDA IN PARTIAL FULFILLMENT OF THE REQUIREMENTS FOR THE DEGREE OF DOCTOR OF PHILOSOPHY UNIVERSITY OF FLORIDA 2003
Transcript of METABOLIC ALTERATIONS OF FREE AND PROTEIN...
METABOLIC ALTERATIONS OF FREE AND PROTEIN-BOUND BIOTIN IN RATS DURING DIETARY BIOTIN MANIPULATION AND ENDOTOXIN EXPOSURE
By
BRANDON JAMES LEWIS
A DISSERTATION PRESENTED TO THE GRADUATE SCHOOL OF THE UNIVERSITY OF FLORIDA IN PARTIAL FULFILLMENT
OF THE REQUIREMENTS FOR THE DEGREE OF DOCTOR OF PHILOSOPHY
UNIVERSITY OF FLORIDA
2003
ACKNOWLEDGMENTS
I would like to express my gratitude toward Drs. Bobbi Langkamp-Henken and
Robert McMahon for their continuous guidance, advice, and support throughout the
course of my Ph.D. work. My great appreciation also goes to my committee, Drs. Robert
Cousins, Jesse Gregory III, and Susan Frost, for constantly providing valuable comments
and suggestions during my Ph.D. experience. I would also like to express my gratitude
towards my wife, Darci, and my parents, Pete and Sharon Lewis, for their support and
undying faith that this would eventually be finished. Finally, I would like to thank Sara
Rathman for all her help and especially her reliability in the lab and Amy Mackey for her
support and enthusiasm in answering my many questions.
ii
TABLE OF CONTENTS
page
ACKNOWLEDGMENTS .................................................................................................. ii
ABSTRACT....................................................................................................................... vi
CHAPTER
1 LITERATURE REVIEW ................................................................................................1
Biotin............................................................................................................................... 1 Structure and Function ............................................................................................. 1 Sources ..................................................................................................................... 5 Absorption................................................................................................................ 5 Transport .................................................................................................................. 7 Deficiency ................................................................................................................ 7 Toxicity .................................................................................................................. 10 Biotin Status ........................................................................................................... 10 Role in Immune Function ...................................................................................... 11
Lipopolysaccharide ....................................................................................................... 12 Structure ................................................................................................................. 12 Binding................................................................................................................... 13 Elicited Response ................................................................................................... 15
Rationale and Hypotheses............................................................................................. 16 Dietary Modulation of Biotin Metabolism............................................................. 16 Modulation of Biotin Metabolism by Endotoxin ................................................... 17
2 GENERAL MATERIALS AND METHODS...............................................................21
Preparation of Radiolabeled and Nonradiolabeled Bisnorbiotin and Biotin Sulfoxide Standards........................................................................................................... 21
Bisnorbiotin............................................................................................................ 21 Biotin Sulfoxide ..................................................................................................... 22
Biotin, Bisnorbiotin, Biotin Sulfoxide, and Biocytin Separation by High Performance Liquid Chromatography.................................................................................... 22
Preparation of Biotinylated Bovine Serum Albumin.................................................... 23 Competitive Assay of Biotin......................................................................................... 24 Preparation of Avidin AlexaFluor 430 ......................................................................... 25 Markwell Assay for Protein Concentration .................................................................. 25 Carboxylase Separation by SDS-PAGE ....................................................................... 26
iii
Acetyl CoA Carboxylase ....................................................................................... 26 Pyruvate Carboxylase ............................................................................................ 26 Methylcrotonyl-CoA Carboxylase, and Propionyl-CoA Carboxylase................... 26
Detection of Carboxylases After SDS-PAGE............................................................... 26 Activity Assays of Pyruvate Carboxylase and Methylcrotonyl CoA Carboxylase ...... 27
Pyruvate Carboxylase ............................................................................................ 27 Methylcrotonyl CoA Carboxylase ......................................................................... 28
Isolation of P61 by Monomeric Avidin Column .......................................................... 28
3 DIETARY BIOTIN INTAKE MODULATES THE POOL OF FREE AND PROTEIN-BOUND BIOTIN IN RAT LIVER ...............................................................................30
Introduction................................................................................................................... 30 Methods.................................................................................................................. 32 Animals and Dietary Treatments ........................................................................... 32 Sample Preparation and Analysis........................................................................... 33 Measurement of Free Biotin................................................................................... 34 Measurement of Protein-Bound Biotin .................................................................. 34 Statistical Analysis ................................................................................................. 37
Results........................................................................................................................... 37 Effect of Dietary Biotin Intake on Rat Growth and Food Intake........................... 37 Effect of Dietary Biotin Intake on Biotin Status.................................................... 38 Effect of Dietary Biotin Intake on the Relative Abundance of Biotinylated
Carboxylases .............................................................................................. 40 Discussion..................................................................................................................... 41
4 LIPOPOLYSACCHARIDE INDUCED INFLAMMATORY RESPONSE ALTERS CIRCULATING BIOTIN AND THE RELATIVE ABUNDANCE OF THE BIOTIN-DEPENDENT CARBOXYLASES...............................................................................47
Introduction................................................................................................................... 47 Methods......................................................................................................................... 49
Materials................................................................................................................. 49 Animals and Dietary Treatments ........................................................................... 50
Dose-response experiments .............................................................................50 Time-dependent and dietary status experiments..............................................51
Sample Preparation ................................................................................................ 51 Dose-response experiments .............................................................................51 Time-dependent and dietary status experiments..............................................51
Competitive Binding Assay of Biotin .................................................................... 52 Detection and Quantification of Biotinylated Proteins .......................................... 52 Serum Zn and Serum Glucose................................................................................ 52 PC and MCC Activity ............................................................................................ 52 Statistical Analysis ................................................................................................. 53
Dose-response experiments .............................................................................53
iv
Time-dependent and dietary status experiments..............................................53 Results........................................................................................................................... 53
Dose Dependent Effects of an LPS Induced Inflammatory Response................... 53 Serum zinc and glucose ...................................................................................53 Urine, serum, and tissue free biotin .................................................................54 Relative abundance of hepatic biotinylated carboxylases ...............................55
Time and Diet Dependent Effects of an LPS Induced Inflammatory Response.... 58 Animal weight and diet consumption ..............................................................58 Serum zinc and glucose ...................................................................................58 Relative abundance of hepatic biotinylated carboxylases ...............................59 Relative abundance of biotinylated P61 ..........................................................63
PC and MCC Activity ............................................................................................ 64 Discussion..................................................................................................................... 65
5 ISOLATION AND CHARACTERIZATION OF P61..................................................74
Introduction................................................................................................................... 74 Materials and Methods.................................................................................................. 75
Localization of P61 by Differential Centrifugation ............................................... 75 Animal treatment .............................................................................................75 Differential centrifugation ...............................................................................75 Separation and detection of P61 ......................................................................76
Inhibition of Detection of P61 after Competition with Free Biotin ....................... 76 Solubilization of P61.............................................................................................. 76 Solubilization of Peripherally Bound Constituents of P61 .................................... 77 P61 Isolation .......................................................................................................... 77
Results........................................................................................................................... 79 Localization of P61 by Differential Centrifugation ............................................... 79 Competitive Inhibition of the Detection of P61..................................................... 79 Solubilization of P61.............................................................................................. 80 Solubilization of Peripherally Bound Constituents of P61 .................................... 80 Isolation of P61 ...................................................................................................... 81 Sequencing of P61 ................................................................................................. 82
Discussion..................................................................................................................... 82
6 SUMMARY...................................................................................................................87
APPENDIX LIST OF ABBREVIATIONS....................................................................93
LIST OF REFERENCES...................................................................................................95
BIOGRAPHICAL SKETCH ...........................................................................................108
v
Abstract of Dissertation Presented to the Graduate School of the University of Florida in Partial Fulfillment of the Requirements for the Degree of Doctor of Philosophy
METABLOLIC ALTERATIONS OF FREE AND PROTEIN-BOUND BIOTIN IN RATS DURING DIETARY BIOTIN MANIPULATION AND ENDOTOXIN
EXPOSURE
By
Brandon James Lewis
May 2003
Chair: Bobbi Langkamp-Henken Major Department: Food Science and Human Nutrition
The water-soluble B-vitamin biotin is an essential cofactor for the biotin-
dependent carboxylases involved in the metabolism of carbohydrate, protein, and fatty
acids. Although a frank biotin deficiency is thought to be rare, more recent evidence
suggests that a marginal biotin deficiency may be more prevalent than previously
appreciated. Despite substantial advances in molecular and analytical techniques, the
biotin requirement of healthy and physiologically stressed animals remains poorly
understood.
To address these gaps in the understanding of biotin nutriture, the effect of dietary
biotin intake on plasma, urine, and tissue levels of free and protein-bound biotin was
examined. Rats were fed an egg-white based AIN 76A diet containing 0, 0.06, 0.6, or
100 mg biotin/kg diet for three weeks. Indicators of biotin status (urinary biotin
excretion, liver free biotin, and liver protein-bound biotin) in rats fed a diet supplemented
to 0.06 mg biotin/kg diet were equal to that of rats fed a 0.6 mg biotin/kg diet, a level
vi
used in previous studies indicating adequate biotin status. This study also demonstrated
that distinct differences in these pools occurred as early as 3 weeks on a biotin-deficient
diet with no outward signs of biotin deficiency, thus potentially modeling a marginal
biotin deficiency in humans.
To determine the changes in biotin metabolism during an acute inflammatory
response, bacterial lipopolysaccharide (endotoxin) was administered to biotin-adequate
(0.06 mg biotin/kg diet) and biotin-deficient rats (0 mg biotin/kg diet). Endotoxin
administration modulated both free and protein-bound biotin pools in adequate rats. Free
biotin increased in the serum and liver. Protein bound biotin, represented by the relative
abundance of biotinylated carboxylases, also changed; however, increases or decreases
were specific for the individual carboxylases. Of note, a novel biotinylated protein with
an apparent molecular weight of 61 kDa appeared in endotoxin treated animals. These
changes provide plausible mechanisms to account for the observed changes in
carbohydrate, protein, and fatty acid metabolism associated with acute inflammation.
Biotin deficiency prior to endotoxin challenge delayed or lessened the changes in
carboxylase metabolism seen in adequate rats and may indicate a reduced ability to
respond to acute inflammation.
vii
CHAPTER 1 LITERATURE REVIEW
Biotin
Structure and Function
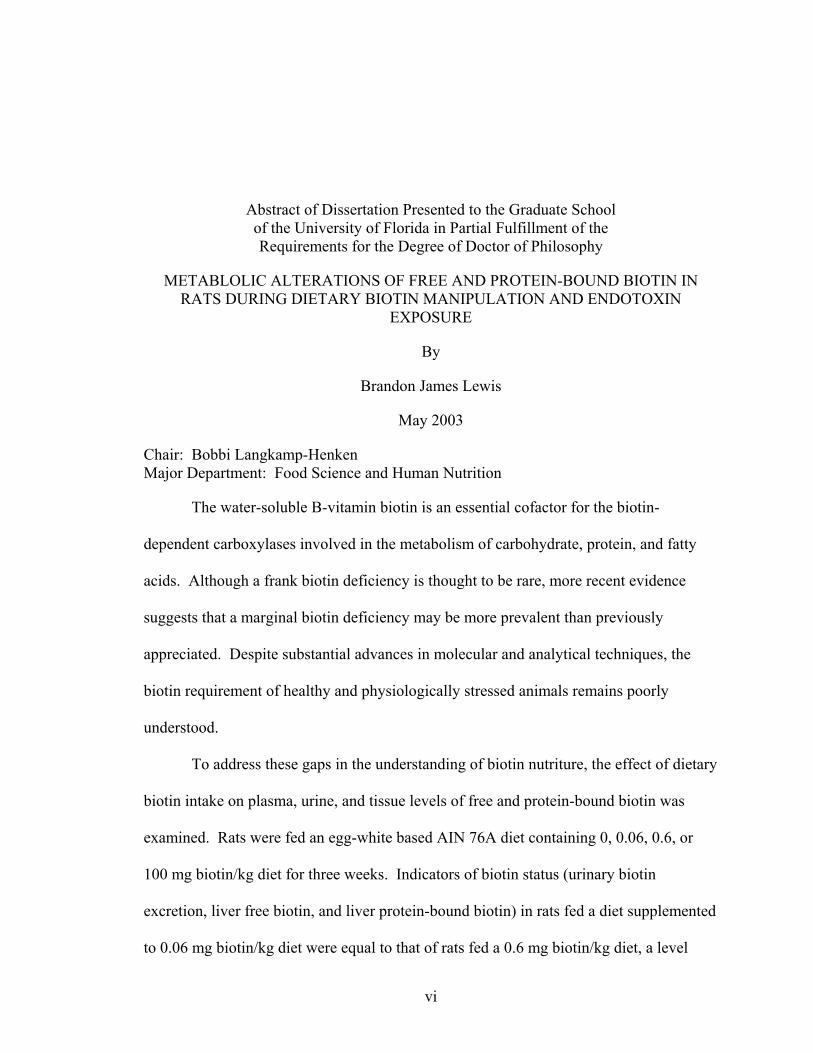
Biotin is a bicyclic compound consisting of a tetrahydrothiophene ring, ureido
group and a valeric acid side chain. d-(+)-Biotin is the only stereoisomer found in nature
and is the only one that is thought to be enzymatically active (1). In living organisms,
several states of biotin exist. Free biotin is found in the soluble fraction of cells as well
as the serum/plasma of animals. The free vitamin can also be conjugated to a carrier.
This carrier can be a simple amino acid as in biocytin (biotin conjugated to lysine) or
complex higher molecular weight compounds such as proteins or peptides (2). Finally,
catabolism of the vitamin yields the inactive biotin metabolites, of which bisnorbiotin
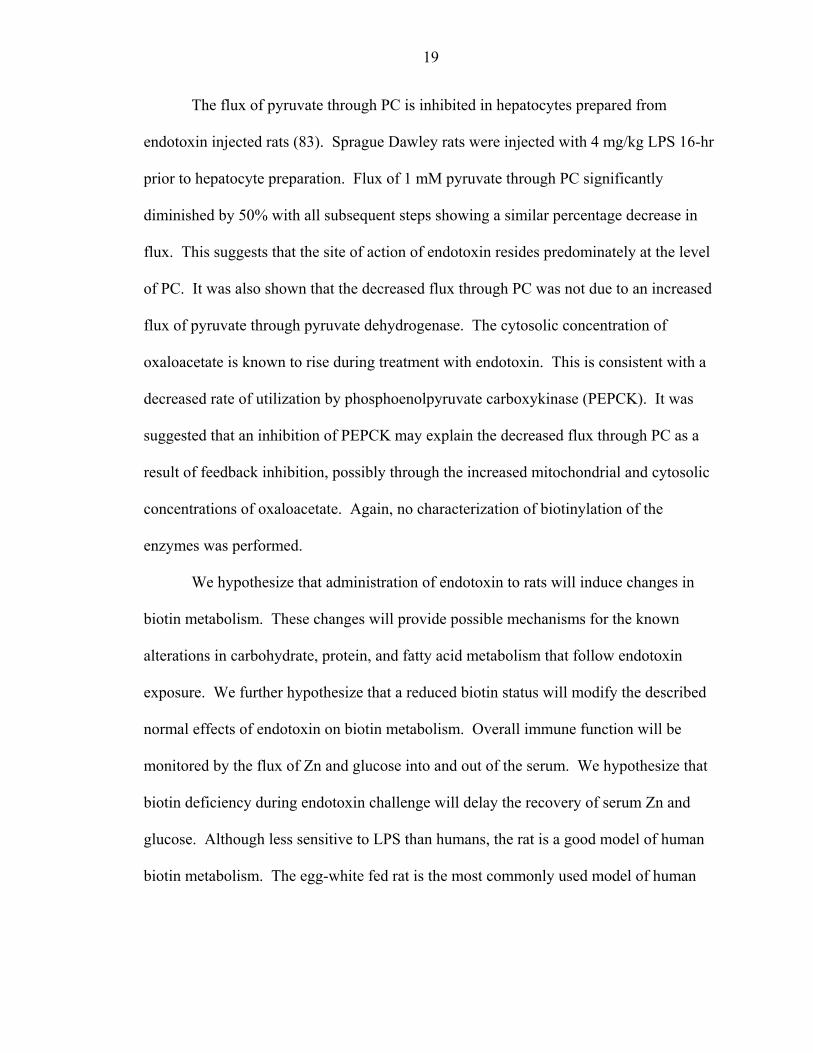
(BNB) and biotin sulfoxide (BSO) are the most abundant (Figure 1).
NH NH
S
O
OH
O
NH NH
S
O
NH
O
NH2
OH
O
NH NH
S
O
polypeptide
O
NH NH
S
O
AMP
O
NH NH
S
O
OH
O
O
NH NH
S
O
OH
O
Proteolysis
Biotinidase
HolocarboxylaseSynthase
HolocarboxylaseSynthase
SulfurOxidation
Side ChainOxidation
Bisnorbiotin
Biotin Sulfoxide
Biotin
Biocytin
Biotinyl-AMP
Holocarboxylase
Figure 1-1. Forms of biotin.
1
2
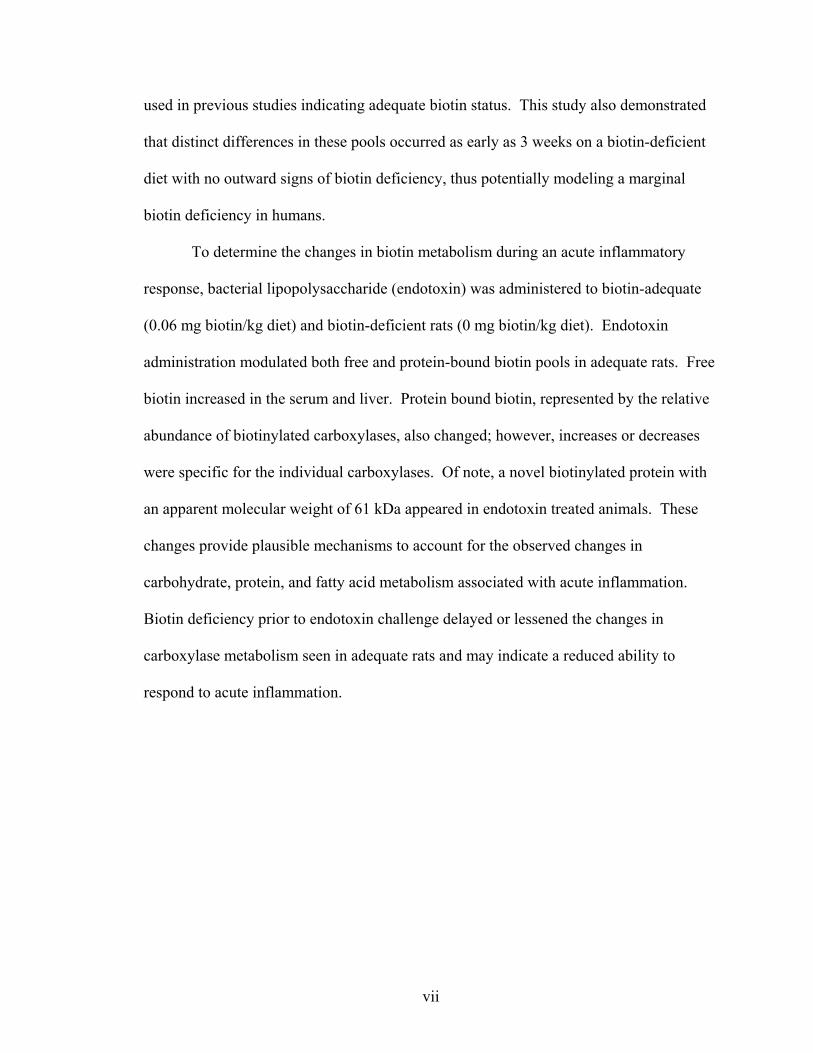
Biotin is the cofactor for five biotin-dependent carboxylases: the two isoforms of
acetyl-CoA carboxylase (ACC1, 265 kDa (3); ACC2, 280 kDa (4)), pyruvate carboxylase
(PC, 129 kDa (5)), methylcrotonyl-CoA carboxylase (MCC, α-chain-79.8 kDa
(genbank)), and propionyl-CoA carboxylase (PCC, α-chain-79.3 kDa (6)).
Holocarboxylase synthase, found in both the mitochondria and cytosol, catalyzes the
condensation reaction of biotin and the apocarboxylases to generate the
holocarboxylases. Holocarboxylase synthase recognizes the biotin carrier domain of the
apocarboxylase and in a two-step reaction covalently binds biotin to a specific lysine
within the polypeptide (Figure 1). Biotin is first converted to biotinyl-AMP and then,
through the removal of AMP, biotin is attached to the apocarboxylase to form the
holocarboxylase. The site at which biotin is attached is a highly conserved tetrapeptide
(AMKM) that resides 35 amino acids from the C-terminal end of the apocarboxylase (7).
glucose
glycolysis
pyruvate
oxaloacetate acetyl CoA malonyl CoA fatty acidsacetyl CoAcarboxylase
gluconeogenesis
pyruvatecarboxylase
3-methylglutaconyl CoA
3-methylcrotonyl CoAcarboxylase
3-methylcrotonyl CoA
leucine
succinyl CoA
methylmalonyl CoA
propionyl CoA
select amino acidsside chain of cholesterolodd chain fatty acids
propionyl CoAcarboxylase
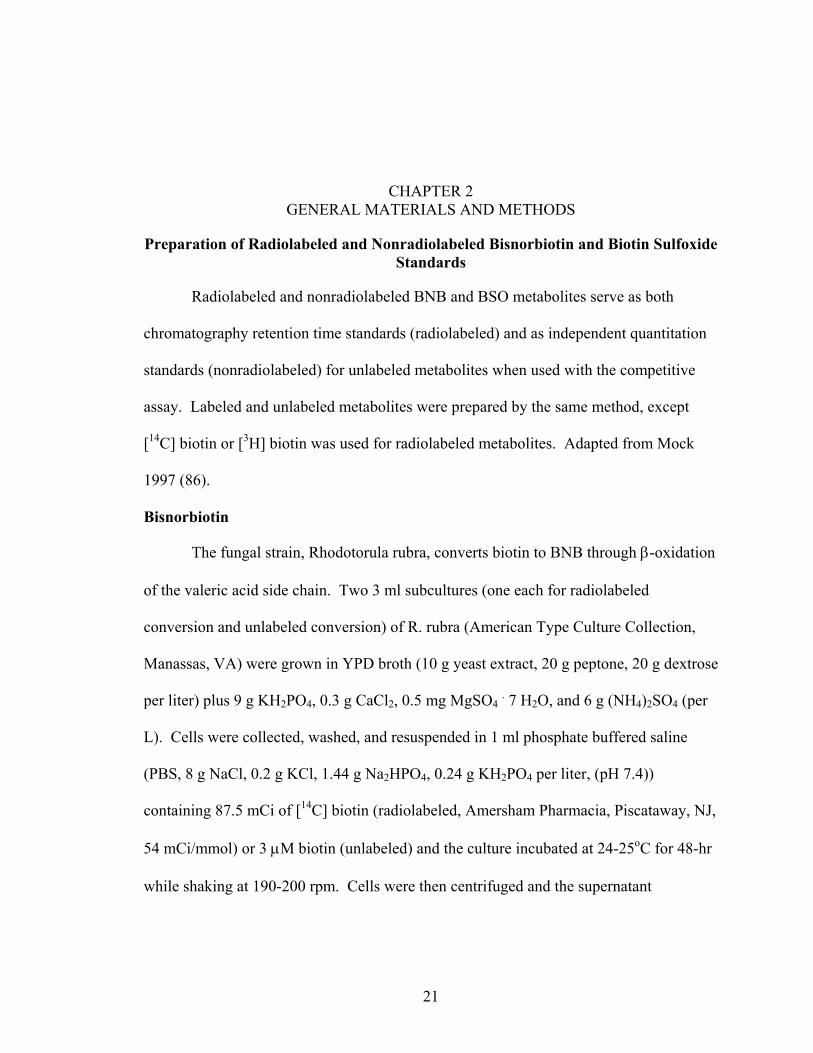
Figure 1-2. Role of biotin-dependent carboxylases in metabolism.

3
Once biotin is attached, each of these holocarboxylases can then catalyze the
incorporation of bicarbonate into a specific substrate (Figure 1-2) (8). This occurs
through the formation of a carboxybiotin intermediate at the expense of the hydrolysis of
one molecule of adenosine triphosphate (ATP). Carbon dioxide can then be transferred
to the substrate to form the carboxylated product.
There is now evidence that two isoforms of ACC exist: ACC1 and ACC2. ACC1
is found in the cytosol of the cell, while ACC2 is inserted into the mitochondrial
membrane (9). Both isoforms of ACC catalyze the addition of bicarbonate to acetyl-
CoA to form malonyl-CoA. When first discovered, the mitochondrial form of ACC
(ACC2) was thought to serve as a storage form of ACC that was transformed to active
ACC during times of biotin deficiency. However, it is now known that ACC1, the
original active form, is a cytosolic protein, whereas ACC2 is an integral membrane
protein associated with the mitochondria by an additional 136 amino acids. The first
twenty amino acids of ACC2 are hydrophobic and are thought to target the protein for
insertion into the mitochondrial membrane, while the remainder of the sequence is highly
homologous with ACC1 (9). In the case of ACC1, the malonyl-CoA produced serves as
the substrate for fatty acid synthase during fatty acid elongation. However, in the case of
ACC2, the malonyl-CoA produced is thought to regulate mitochondrial fatty acid β-
oxidation through its ability to inhibit carnitine palmitoyl-CoA transferase 1, the shuttle
responsible for fatty acid transport into the mitochondria (9).
Further evidence for the function of ACC2 in the regulation of fatty acid β-
oxidation includes its distribution in various tissues throughout the rat. Both isoforms of
ACC are expressed in liver, mammary gland, and brown adipose tissue where both fatty

4
acid synthesis and β-oxidation occur. In tissue such as white adipose tissue in which
fatty acid synthesis primarily occurs, only ACC1 is present. In tissues such as heart and
skeletal muscle where rates of fatty acid synthesis are low and rates of fatty acid β-
oxidation are high, only ACC2 is present (4).
PC, MCC, and PCC are localized to the mitochondria. PC catalyzes the formation
of oxaloacetate from pyruvate and bicarbonate. Oxaloacetate can then be used either as
an intermediate in the tricarboxylic acid cycle or in gluconeogenesis. MCC catalyzes the
formation of methylglutaconyl-CoA from methylcrotonyl-CoA and bicarbonate during
the degradation of the branched-chain amino acid leucine, and PCC catalyses the
formation of methylmalonyl-CoA from propionyl-CoA and bicarbonate. Methylmalonyl-
CoA is isomerized to succinyl-CoA and can then enter the tricarboxylic acid cycle.
During protein turnover and digestion, carboxylases are degraded to biotinyl-
lysine (biocytin). Cellular and secreted proteases cannot hydrolyze the amide bond
between biotin and lysine so cleavage by biotinidase is required for the release of biotin
(10). Once released from lysine by biotinidase, biotin is available to be absorbed in the
intestine or used to biotinylate proteins in the cell.
Functions other than biotin’s role as a cofactor for the carboxylases, such as
regulation of gene transcription, have been proposed. As early as 1968, biotin deficiency
in rats was shown to decrease glucokinase activity (11). Repletion of biotin restored
glucokinase activity to normal levels. With advances in molecular biology, it is now
known that the repletion of biotin increased the amount of mRNA coding for glucokinase
in rat liver (12). Biotin deficiency is also known to decrease mRNA levels of
holocarboxylase synthase (13). Posttranscriptionally, biotin deficiency has been shown

5
to reduce the expression of asialoglycoprotein receptor even though mRNA levels coding
for asialoglycoprotein receptor are comparable to biotin adequate controls (14). Biotin
may also have a role in DNA packaging, transcription, and replication as indicated by the
discovery of biotinylated histones in the nucleus (15). This may be linked to the impaired
interaction between histones and DNA observed during biotin deficiency (16); however,
it remains to be determined if deficiency reduces nuclear biotin concentration and histone
biotinylation. New evidence supporting a role of biotinylated histones in DNA
replication was recently published by Stanley et al. (17). The level of biotinylated
histones from peripheral blood mononuclear cells (PBMC) was determined to increase
four fold following stimulation of cell proliferation with the mitogen concanavalin A.
Sources
Biotin rich foods include egg yolk, liver, soybeans and yeast. Moderate sources
include human milk, fish, nuts, and oatmeal. Fruits and meats have generally lower
biotin contents. The majority of biotin in meats and grains is protein bound, conjugated
via a lysine residue to the protein (18). The bioavailability of protein-bound biotin varies
depending on the food source. Biotin from soy and corn is approximately 100%
bioavailable. In contrast, biotin from barley and oats is 20-30% bioavailable, and biotin
from wheat is virtually unavailable (19). The reason for this variability is unknown but
may reflect the susceptibility of these foods to digestive breakdown (20).
Absorption
The mechanism of intestinal hydrolysis of protein bound biotin has not been
clearly defined. Biotinidase is thought to play a critical role in releasing biotin from its
covalent bond to protein due to the inability of proteases to cleave this bond. It is
possible that biotinidase secreted by the pancreas is responsible for releasing the

6
covalently bound biotin from protein for absorption during the luminal phase of
proteolysis (18). Mucosal biotinidase is thought to release biotin from biotinyl
oligopeptides, the presumed products of intestinal proteolysis (10).
Absorption of free biotin occurs by both simple diffusion and by a biotin
transporter present in the intestinal brush-border membrane (21). This carrier-mediated
transport is structurally specific, temperature dependent, and electroneutral. Biotin
transport is sodium dependent, coupled 1:1 with Na+. Both simple diffusion and carrier
mediated transport of biotin are thought to occur; however, due to the small amount of
biotin in foods, carrier mediated transport is thought to predominate unless
pharmacologic doses are consumed.
In rats, the site at which biotin is maximally absorbed is the jejunum (22). While
most of the absorption is in the jejunum, significant absorption occurs in the proximal
colon. Blood concentrations of biotin increase after administration of biotin into the
colon (23). This implies that biotin synthesized by the normal flora in the gut may
contribute to biotin levels. It is also equally possible that biotin produced by the bacteria
is reintroduced for absorption in the small intestine through reflux or caprophagy (23).
The process of biotin exiting the rat intestine is by electroneutral, carrier-mediated
transport across the basolateral membrane. However, it is not Na+ dependent and does
not accumulate biotin against a concentration gradient (24). This carrier-mediated
transport out of intestinal cells has been duplicated in the human intestinal epithelial cell
line CaCo-2. However, in humans biotin transport out of the intestinal cell is sensitive to
manipulations of the transmembrane electrical potential (25).

7
Transport
Proteins in human plasma capable of binding biotin include α and β-globulin as
well as biotinidase. Biotinidase contains two biotin binding sites, one with high biotin
binding affinity (Kd = 3 nM) and one with low biotin binding affinity (Kd = 59 nM) (26).
The binding characteristics of these two sites predict that a high percentage of the total
free biotin pool should be bound. However, new data suggest that less than 10% of the
total free pool plus reversibly bound biotin is reversibly bound to plasma
macromolecules. Incubation of [3H]biotin with freshly collected human plasma followed
by ultrafiltration showed only 8% of the label in the retentate where protein bound biotin
is found (27). Recently, Wang et al. showed that the percentage of protein-bound biotin
in pig plasma was also <10% (6.9-7.6% depending on the method used) (28).
Uptake of free biotin by tissues has been assessed in 3T3-L1 and HepG2 cells, rat
hepatocytes, and basolateral membrane vesicles from human liver and found to be
mediated by both diffusion and by a specialized Na+ gradient, energy and temperature
dependent carrier system. Transport is electroneutral (1:1 Na+:biotin) and specific for a
free carboxyl group. However, isolated cultured hepatocytes did not exhibit this carrier
mediated transport system (29).
Deficiency
Biotin’s role as an essential nutrient in humans has been demonstrated in three
situations: prolonged consumption of raw egg-white (30), total parenteral nutrition (TPN)
without biotin supplementation (31), and multiple carboxylase deficiency (32). Avidin, a
glycoprotein in raw egg-whites, binds biotin (essentially irreversibly, Kd=10-15 M) and
can cause a severe form of biotin deficiency (frank biotin deficiency) characterized by
dermatitis, hair loss, and neuromuscular dysfunction (1). Symptoms of frank biotin
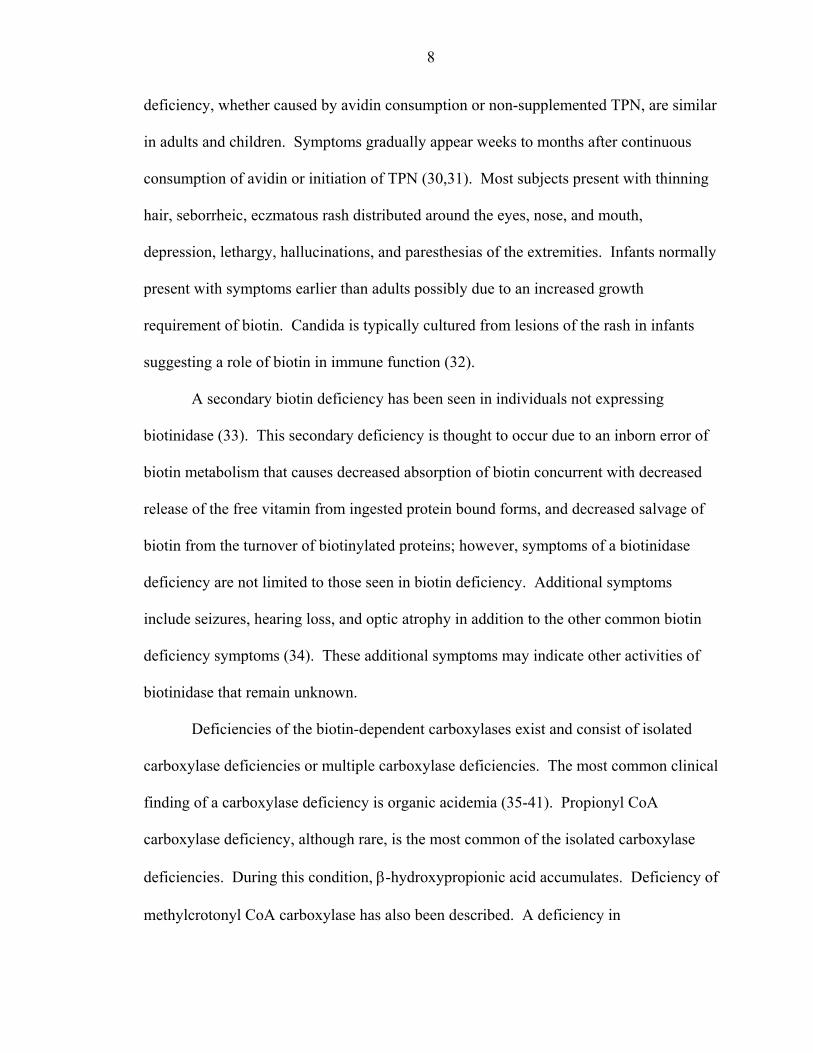
8
deficiency, whether caused by avidin consumption or non-supplemented TPN, are similar
in adults and children. Symptoms gradually appear weeks to months after continuous
consumption of avidin or initiation of TPN (30,31). Most subjects present with thinning
hair, seborrheic, eczmatous rash distributed around the eyes, nose, and mouth,
depression, lethargy, hallucinations, and paresthesias of the extremities. Infants normally
present with symptoms earlier than adults possibly due to an increased growth
requirement of biotin. Candida is typically cultured from lesions of the rash in infants
suggesting a role of biotin in immune function (32).
A secondary biotin deficiency has been seen in individuals not expressing
biotinidase (33). This secondary deficiency is thought to occur due to an inborn error of
biotin metabolism that causes decreased absorption of biotin concurrent with decreased
release of the free vitamin from ingested protein bound forms, and decreased salvage of
biotin from the turnover of biotinylated proteins; however, symptoms of a biotinidase
deficiency are not limited to those seen in biotin deficiency. Additional symptoms
include seizures, hearing loss, and optic atrophy in addition to the other common biotin
deficiency symptoms (34). These additional symptoms may indicate other activities of
biotinidase that remain unknown.
Deficiencies of the biotin-dependent carboxylases exist and consist of isolated
carboxylase deficiencies or multiple carboxylase deficiencies. The most common clinical
finding of a carboxylase deficiency is organic acidemia (35-41). Propionyl CoA
carboxylase deficiency, although rare, is the most common of the isolated carboxylase
deficiencies. During this condition, β-hydroxypropionic acid accumulates. Deficiency of
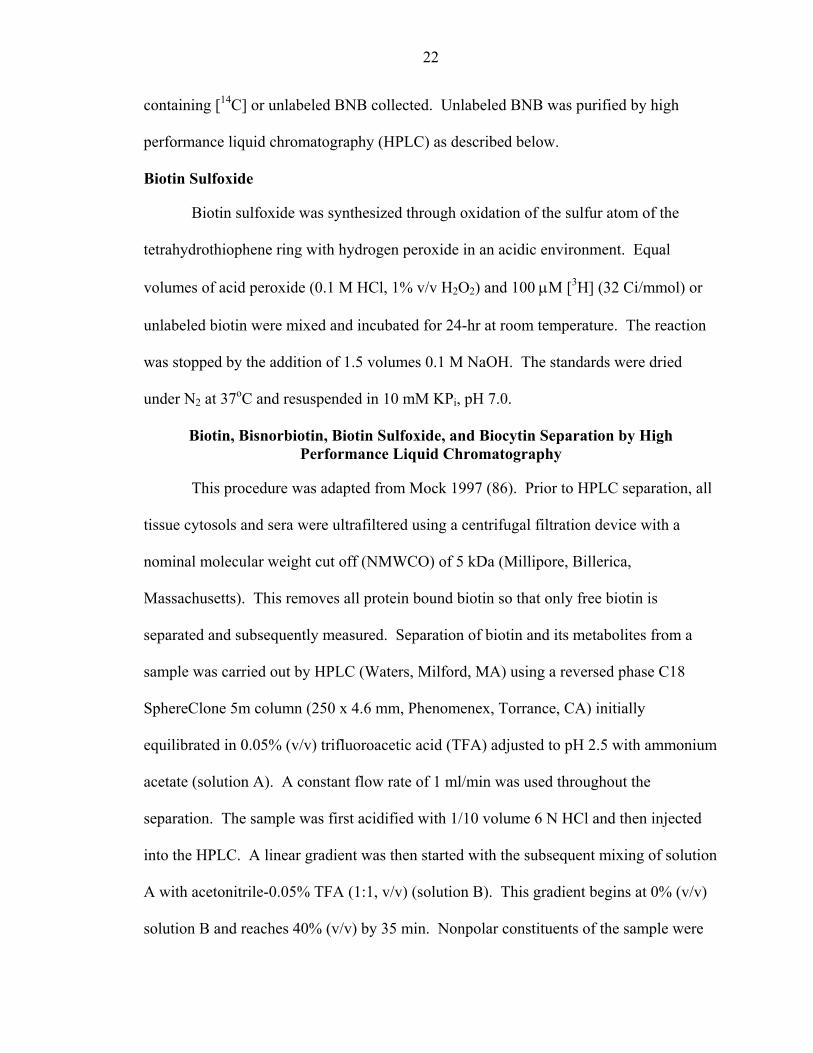
methylcrotonyl CoA carboxylase has also been described. A deficiency in

9
leucine
3-methylcrotonyl CoA
3-methylglutaconyl CoA
methylcrotonyl CoAcarboxylase
3-methylcrotonylglycine
3-hydroxyisovaleric acid
glycine
H2O
biotin or MCC deficiency
Figure 1-3. Accumulation of 3-Hydroxyisovaleric acid and 3-methylcrotonylglycine due to a biotin deficiency or methylcrotonyl CoA carboxylase (MCC) deficiency.
methylcrotonyl CoA carboxylase causes 3-methylcrotonylglycine (3-MCG), and 3-
hydroxyisovaleric acid (3-HIA) to accumulate due to a decrease in activity of
methylcrotonyl CoA carboxylase (Figure 1-3). This causes methylcrotonyl CoA to
accumulate and then be shunted into an alternate pathway where it is converted to 3-HIA
by cronotase and 3-MCG by glycine acylase.
Multiple carboxylase deficiency is described as a characteristically low activity of
all biotin-dependent carboxylases. Two forms of multiple carboxylase deficiency exist: a
neonatal or infantile form and a late-onset or juvenile form. The neonatal form manifests
within the first few days of life and results from a mutation in the gene coding for
holocarboxylase synthase (42). The late-onset form presents within 3-6 months of age
and is caused by abnormalities in the intestinal absorption of biotin (43). All inborn
errors of biotin metabolism are treated with pharmacologic doses of biotin.
There is a prevailing assumption that biotin deficiency is rare unless massive
amounts of raw egg-white are consumed, deficiencies in the carboxylases are present, or
long-term nonsupplemented TPN is the sole source of nutrition. More recent studies are

10
now providing evidence that decreased biotin status is seen in other groups of individuals
without outward signs of gross deficiency. This condition is being termed marginal
biotin deficiency. Accumulating data are providing evidence of marginal biotin
deficiency during pregnancy (44) and prolonged use of anticonvulsants (36-38). The
most notable finding is that 3-HIA excretion into the urine is increased in both of these
states along with a decrease in plasma biotin, accelerated catabolism of biotin, and a
decreased absorption of biotin in individuals taking anticonvulsants.
The possibility of marginal biotin deficiency during pregnancy is troublesome
considering biotin deficiency during pregnancy has teratogenic effects on the fetuses of
chicken, turkey, mouse (45), rat, and hamster (46). Even mild biotin deficiencies that do
not produce the typical cutaneous and central nervous system (CNS) symptoms in the
dam caused the fetus to have micrognathia, cleft palate, and micromelia. These defects
increase with severity of biotin deficiency.
Toxicity
Few studies have measured the toxicity of biotin. When given in excess, biotin
demonstrated sterilizing effects in both the Mexican fruit fly and the housefly (47).
Pregnant mice receiving 50 mg/kg biotin i.p. through gestation showed no signs of
disturbed reproductive function or abnormal embryonic development (48). No toxicity of
biotin has been reported with individuals receiving 200 mg orally or 20 mg intravenously
for treatment of inborn errors of biotin metabolism (49).
Biotin Status
The excretion of 3-HIA, biotin, and its metabolites into the urine are now
identified as early and sensitive markers of biotin status (50). Subjects consuming a
biotin-deficient egg-white based diet developed an increased excretion of 3-HIA by day 7

11
of consumption. By day 14, urinary excretion of biotin and its metabolites had decreased
below normal values. Serum biotin levels were still within the normal range 20 days
after initiation of the diet, demonstrating that it is not a reliable status indicator.
Role in Immune Function
Studies of immune responses in biotin deficient rodents, and of decreased
immunity in patients with multiple carboxylase deficiencies, indicate that biotin is
required for normal immune function. Rats fed an egg-white based biotin-deficient diet
for 20 weeks had several indicators of decreased immune function. A marked reduction
of thymic size and cellularity, depressed immune response to sheep red blood cells, and a
lack of allergic encephalomyelitis following immunization with guinea pig myelin basic
protein were all seen in the biotin-deficient group when compared to the adequate group
(egg-white diet + 2 mg biotin/kg diet) (51).
The role of biotin in human immune function can be demonstrated in patients
suffering from biotin-responsive multiple carboxylase deficiencies. In 1979, three
siblings presented with CNS dysfunction, candida dermatitis, keratoconjunctivits, absent
delayed-type hypersensitivity responses, absent in vitro lymphocyte responses to candida
antigen, IgA deficiency, lack of antibody response to pneumococcal polysaccharide
immunization, and a subnormal percentage of T lymphocytes. The first two siblings
began to show symptoms at 2½ and 3 months of age and died at 8 and 40 months of age,
respectively, with progressive CNS deterioration and overwhelming infection. The third
sibling began to show symptoms at 3 months of age. Assays of white cell preparations
for PC, PCC, and MCC activity were 7, 35, and 28% of controls respectively. After four
days of oral biotin (10 mg/d), the values increased to 281, 491, and 120% of controls
respectively. Although in vivo and in vitro responses to candida antigen were absent and
12
T lymphocyte numbers still mildly depressed after four months of treatment, there was no
reoccurrence of candida dermatitis or keratoconjunctivitis (52). These data are thought to
be consistent with a reduced affinity for biotin either in a transport protein or
holocarboxylase synthase (32).
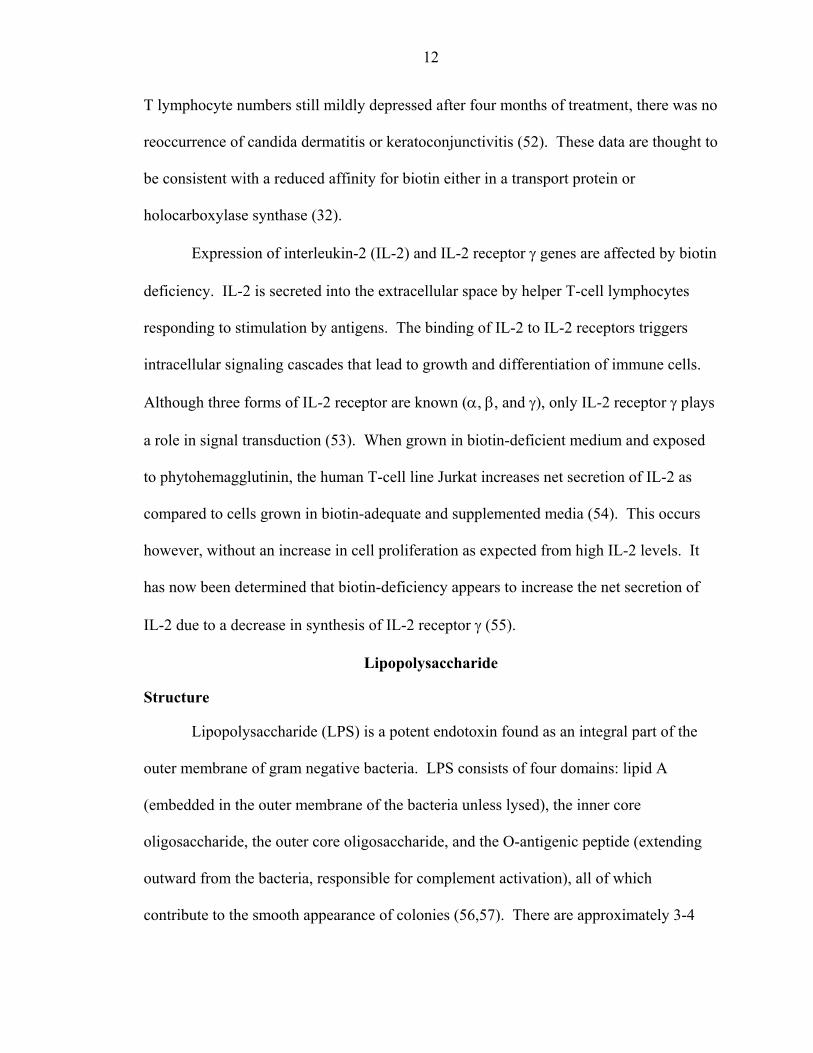
Expression of interleukin-2 (IL-2) and IL-2 receptor γ genes are affected by biotin
deficiency. IL-2 is secreted into the extracellular space by helper T-cell lymphocytes
responding to stimulation by antigens. The binding of IL-2 to IL-2 receptors triggers
intracellular signaling cascades that lead to growth and differentiation of immune cells.
Although three forms of IL-2 receptor are known (α, β, and γ), only IL-2 receptor γ plays
a role in signal transduction (53). When grown in biotin-deficient medium and exposed
to phytohemagglutinin, the human T-cell line Jurkat increases net secretion of IL-2 as
compared to cells grown in biotin-adequate and supplemented media (54). This occurs
however, without an increase in cell proliferation as expected from high IL-2 levels. It
has now been determined that biotin-deficiency appears to increase the net secretion of
IL-2 due to a decrease in synthesis of IL-2 receptor γ (55).
Lipopolysaccharide
Structure
Lipopolysaccharide (LPS) is a potent endotoxin found as an integral part of the
outer membrane of gram negative bacteria. LPS consists of four domains: lipid A
(embedded in the outer membrane of the bacteria unless lysed), the inner core
oligosaccharide, the outer core oligosaccharide, and the O-antigenic peptide (extending
outward from the bacteria, responsible for complement activation), all of which
contribute to the smooth appearance of colonies (56,57). There are approximately 3-4

13
million molecules of LPS per cell comprising about 3% of total cell dry weight in typical
laboratory strains of E. coli and greater than 10% of dry weight in clinical strains (56).
Lipid A is the component attributed with the major biological activities of LPS,
and it is the most conserved structure in LPS throughout bacterial species. The backbone
of lipid A is composed of a D-gluco-configured hexosamine disaccharide with two
phosphate residues attached. The polar head group and acyl chains of lipid A do not
share the same homology as the backbone. The polar head group can have a positive or
negative charge, or consist of zwitterionic groups. While the polar head group is not
known to contribute to the endotoxic properties of lipid A, it may be important in
determining the organization and permeability of the membrane as well as antibiotic
resistance of the bacteria. Generally, the primary fatty acids of lipid A are β-
hydroxylated with very few known exceptions (56).
The outer core of LPS is made of hexose residues and the inner core consists of
heptose and two deoxy-manno-octulosonic acid residues that link the lipid A to the core.
The O-antigenic peptide consists of repeating oligosaccharide units, and provides the
basis of the variability of LPS between bacterial strains (57).
Binding
CD14 and LPS binding protein (LBP) are the two most understood molecules
involved in the action of LPS. LBP is a plasma protein made in the liver that is thought
to enhance the binding of LPS to CD14 increasing cell sensitivity to LPS (58). LBP
accomplishes this by acting as a lipid transfer protein (58), bringing the hydrophobic LPS
molecule out of its aggregate to interact with the water-soluble CD14 (56). LBP also

14
transfers LPS to lipoproteins and may facilitate the transfer of LPS from CD14 into cell
membranes by lipid exchange (58).
CD14 exists as either a membrane bound (mCD14) or soluble form (sCD14).
Membrane CD14 is expressed mainly on monocytes and macrophages along with
polymorphonuclear neutrophils (58). It is a glycerophosphatidylinositol-anchored
glycoprotein that lacks a cytoplasmic portion, and so is thought to interact with another
signal transducing molecule at the cell membrane. It is now known that the protein
responsible for generating the transmembrane signal linked to LPS-induced cell
activation is Toll-like receptor 4 (TLR-4) (59). Binding of the LPS-CD14 complex to
TLR-4 promotes dimerization of the receptor. The cytoplasmic domain of TLR-4
interacts with the cytoplasmic adapter protein MyD88 which then activates IL-1 receptor
associated kinase (IRAK), mitogen-activated protein kinase, and TNF receptor-associated
factors (TRAF6), which results in the phosphorylation of IκB and its dissociation from
NF-κB (60). NF-κB is then able to migrate to the nucleus and initiate transcription and
production of IL-1, IL-6, TNF-α, acute phase proteins, and nitric oxide (61). Cells that
do not contain mCD14 are activated when sCD14 forms a bridge between the LPS-LBP
molecule and the cell membrane (62), suggesting other receptors on the membrane that
are capable of binding LPS or the LPS-CD14 complex (58). Soluble CD14 is produced
by macrophages proteolytically cleaving their phosphotidylinositol-linked surface
molecules and is thought to be made and secreted from the liver (58).
Activation of cells with LPS through the CD14 receptor is only required at low
concentrations of LPS. At higher concentrations, LPS can stimulate cells in a CD14-
independent manner. This suggests the involvement of a second molecule that
15
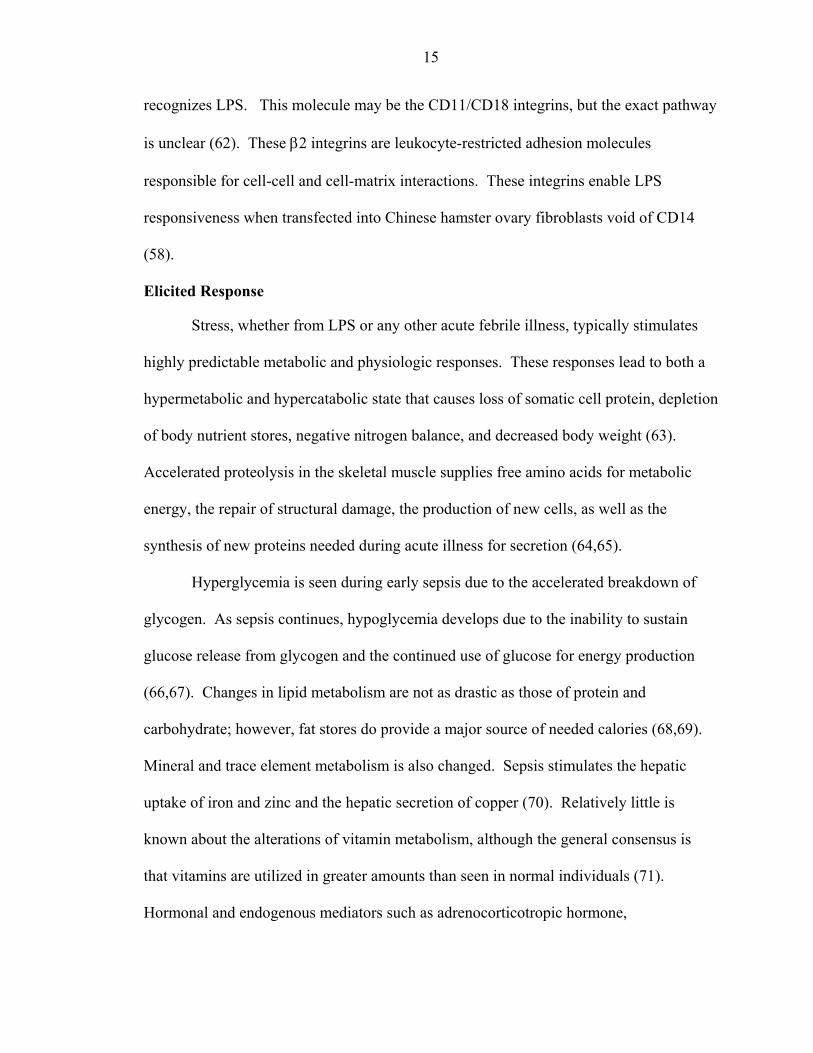
recognizes LPS. This molecule may be the CD11/CD18 integrins, but the exact pathway
is unclear (62). These β2 integrins are leukocyte-restricted adhesion molecules
responsible for cell-cell and cell-matrix interactions. These integrins enable LPS
responsiveness when transfected into Chinese hamster ovary fibroblasts void of CD14
(58).
Elicited Response
Stress, whether from LPS or any other acute febrile illness, typically stimulates
highly predictable metabolic and physiologic responses. These responses lead to both a
hypermetabolic and hypercatabolic state that causes loss of somatic cell protein, depletion
of body nutrient stores, negative nitrogen balance, and decreased body weight (63).
Accelerated proteolysis in the skeletal muscle supplies free amino acids for metabolic
energy, the repair of structural damage, the production of new cells, as well as the
synthesis of new proteins needed during acute illness for secretion (64,65).
Hyperglycemia is seen during early sepsis due to the accelerated breakdown of
glycogen. As sepsis continues, hypoglycemia develops due to the inability to sustain
glucose release from glycogen and the continued use of glucose for energy production
(66,67). Changes in lipid metabolism are not as drastic as those of protein and
carbohydrate; however, fat stores do provide a major source of needed calories (68,69).
Mineral and trace element metabolism is also changed. Sepsis stimulates the hepatic
uptake of iron and zinc and the hepatic secretion of copper (70). Relatively little is
known about the alterations of vitamin metabolism, although the general consensus is
that vitamins are utilized in greater amounts than seen in normal individuals (71).
Hormonal and endogenous mediators such as adrenocorticotropic hormone,
16
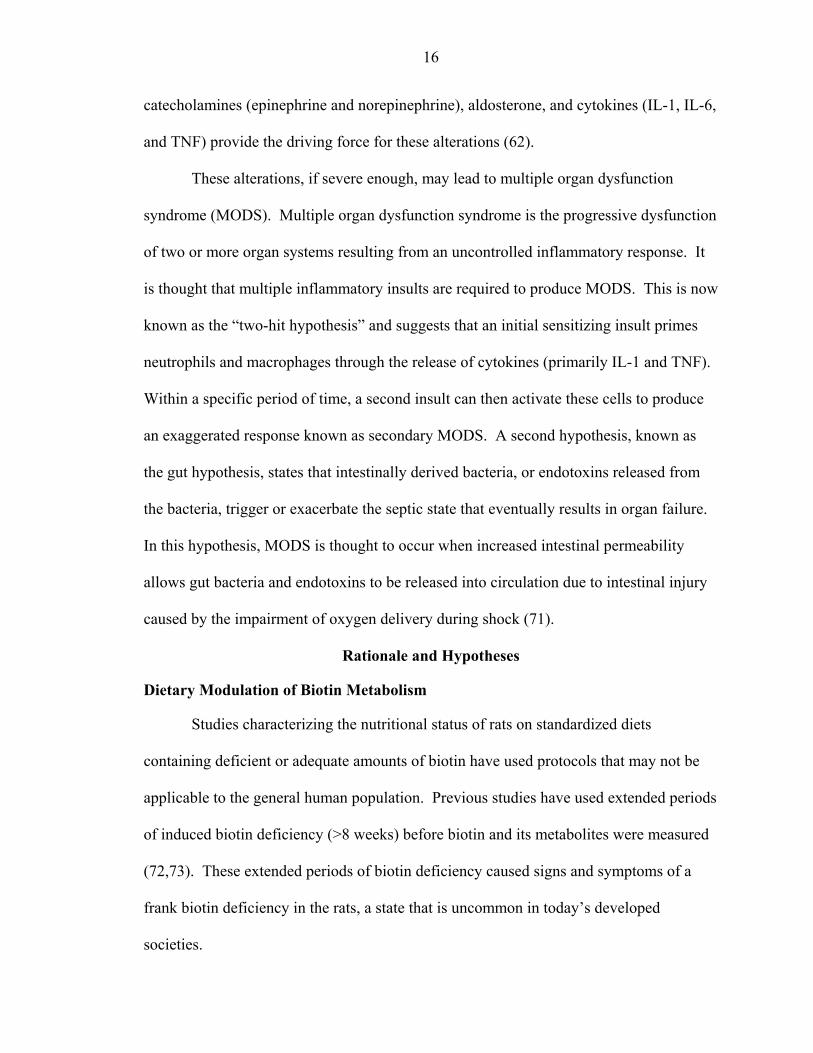
catecholamines (epinephrine and norepinephrine), aldosterone, and cytokines (IL-1, IL-6,
and TNF) provide the driving force for these alterations (62).
These alterations, if severe enough, may lead to multiple organ dysfunction
syndrome (MODS). Multiple organ dysfunction syndrome is the progressive dysfunction
of two or more organ systems resulting from an uncontrolled inflammatory response. It
is thought that multiple inflammatory insults are required to produce MODS. This is now
known as the “two-hit hypothesis” and suggests that an initial sensitizing insult primes
neutrophils and macrophages through the release of cytokines (primarily IL-1 and TNF).
Within a specific period of time, a second insult can then activate these cells to produce
an exaggerated response known as secondary MODS. A second hypothesis, known as
the gut hypothesis, states that intestinally derived bacteria, or endotoxins released from
the bacteria, trigger or exacerbate the septic state that eventually results in organ failure.
In this hypothesis, MODS is thought to occur when increased intestinal permeability
allows gut bacteria and endotoxins to be released into circulation due to intestinal injury
caused by the impairment of oxygen delivery during shock (71).
Rationale and Hypotheses
Dietary Modulation of Biotin Metabolism
Studies characterizing the nutritional status of rats on standardized diets
containing deficient or adequate amounts of biotin have used protocols that may not be
applicable to the general human population. Previous studies have used extended periods
of induced biotin deficiency (>8 weeks) before biotin and its metabolites were measured
(72,73). These extended periods of biotin deficiency caused signs and symptoms of a
frank biotin deficiency in the rats, a state that is uncommon in today’s developed
societies.

17
In studies including a biotin-adequate group, a level of 0.6 mg biotin/kg diet or
higher has generally been used (73-75). When adjusted to a per kg body weight basis,
this level of consumption is equivalent to a 70 kg human consuming in excess of ten
times the estimated safe and adequate daily dietary intake (ESADDI). In this study we
hypothesized that a level of biotin supplementation more relative to the human ESADDI
would be adequate to prevent biotin deficiency. We also hypothesized that a marginal
biotin deficiency, with no outward signs of frank deficiency, would decrease both free
and protein-bound metabolic pools of biotin. Finally, we hypothesized that a level of
supplementation of 100 mg biotin/kg diet, the highest level of consumption yet tested,
would not be toxic.
Modulation of Biotin Metabolism by Endotoxin
The possibility that nutritional support may prevent and treat the profound
metabolic alterations seen during stress, whether from wounds, falls, burns, or sepsis, has
gained increased attention. Nutrient requirements for energy, protein, fat, and some
minerals during stress have been well defined. However, no specific guidelines for the
requirements of vitamins, most minerals, or trace elements exist for the metabolically
stressed individual even though there is evidence that the requirements of stressed
individuals are increased over nonstressed individuals (71).
Vitamin and mineral metabolism and uptake are affected after endotoxin
exposure. Enhanced flux of iron and zinc from the plasma to storage compartments such
as the liver are thought to protect the host and combat infection by limiting nutrients
needed for bacterial growth (76). In contrast to plasma iron and zinc, serum copper
concentrations gradually increase, reflecting an increased synthesis and/or release of
ceruloplasmin (77). Endotoxin has been shown to significantly decrease ascorbic acid

18
transport in mouse fibroblasts (78) and rat adrenocortical cells (79) in a dose dependent
manner. Endotoxin also decreases the level of ascorbic acid in the heart (80) and aqueous
humor of the eye, which has one of the highest concentrations of ascorbic acid (81).
As discussed previously, decreases in immune function are seen in rats and mice
on biotin deficient diets as well as individuals with inborn errors of biotin metabolism.
Outside of deficiency, biotin and its role in immune function have never been tested.
Nothing is known as to the behavior of free and protein bound pools of biotin in healthy
animals during immune challenge. However, studies on the effects of endotoxin on
gluconeogenesis and de novo fatty acid biosynthesis provide clues that biotin metabolism
may change during endotoxin exposure. An endotoxin-induced mediator from cells
stimulated with endotoxin regulated key anabolic activities in adipose cells (82). To
examine the effect of the mediator substance on the activities of ACC and fatty acid
synthetase (FAS), 3T3 L1 cells were exposed to conditioned medium from mouse
peritoneal exudate cells cultured in the presence of endotoxin. ACC and FAS activities
were determined in digitonin released cytosolic fractions of the cells along with protein
synthesis using an [35S] methionine pulse following 3, 6, or 20-hr of incubation with the
mediator. The activities of both enzymes decreased over the 20-hr period to
approximately 25% of initial values. [35S] methionine incorporation into FAS and ACC
were down 80 and 95% respectively. These results are consistent with the concept that
the mediator depresses the activity of ACC and FAS by interfering with the synthesis of
the enzymes. However, these results do not show if degradation of the enzymes occurred
with the possible release of biotin from ACC into the free pool.
19
The flux of pyruvate through PC is inhibited in hepatocytes prepared from
endotoxin injected rats (83). Sprague Dawley rats were injected with 4 mg/kg LPS 16-hr
prior to hepatocyte preparation. Flux of 1 mM pyruvate through PC significantly
diminished by 50% with all subsequent steps showing a similar percentage decrease in
flux. This suggests that the site of action of endotoxin resides predominately at the level
of PC. It was also shown that the decreased flux through PC was not due to an increased
flux of pyruvate through pyruvate dehydrogenase. The cytosolic concentration of
oxaloacetate is known to rise during treatment with endotoxin. This is consistent with a
decreased rate of utilization by phosphoenolpyruvate carboxykinase (PEPCK). It was
suggested that an inhibition of PEPCK may explain the decreased flux through PC as a
result of feedback inhibition, possibly through the increased mitochondrial and cytosolic
concentrations of oxaloacetate. Again, no characterization of biotinylation of the
enzymes was performed.
We hypothesize that administration of endotoxin to rats will induce changes in
biotin metabolism. These changes will provide possible mechanisms for the known
alterations in carbohydrate, protein, and fatty acid metabolism that follow endotoxin
exposure. We further hypothesize that a reduced biotin status will modify the described
normal effects of endotoxin on biotin metabolism. Overall immune function will be
monitored by the flux of Zn and glucose into and out of the serum. We hypothesize that
biotin deficiency during endotoxin challenge will delay the recovery of serum Zn and
glucose. Although less sensitive to LPS than humans, the rat is a good model of human
biotin metabolism. The egg-white fed rat is the most commonly used model of human

20
biotin deficiency. This model has been shown to mimic the human profiles of excretion
of biotin and its metabolites into the urine (84), and lack of excretion into the bile (85).
CHAPTER 2 GENERAL MATERIALS AND METHODS
Preparation of Radiolabeled and Nonradiolabeled Bisnorbiotin and Biotin Sulfoxide Standards
Radiolabeled and nonradiolabeled BNB and BSO metabolites serve as both
chromatography retention time standards (radiolabeled) and as independent quantitation
standards (nonradiolabeled) for unlabeled metabolites when used with the competitive
assay. Labeled and unlabeled metabolites were prepared by the same method, except
[14C] biotin or [3H] biotin was used for radiolabeled metabolites. Adapted from Mock
1997 (86).
Bisnorbiotin
The fungal strain, Rhodotorula rubra, converts biotin to BNB through β-oxidation
of the valeric acid side chain. Two 3 ml subcultures (one each for radiolabeled
conversion and unlabeled conversion) of R. rubra (American Type Culture Collection,
Manassas, VA) were grown in YPD broth (10 g yeast extract, 20 g peptone, 20 g dextrose
per liter) plus 9 g KH2PO4, 0.3 g CaCl2, 0.5 mg MgSO4 . 7 H2O, and 6 g (NH4)2SO4 (per
L). Cells were collected, washed, and resuspended in 1 ml phosphate buffered saline
(PBS, 8 g NaCl, 0.2 g KCl, 1.44 g Na2HPO4, 0.24 g KH2PO4 per liter, (pH 7.4))
containing 87.5 mCi of [14C] biotin (radiolabeled, Amersham Pharmacia, Piscataway, NJ,
54 mCi/mmol) or 3 µM biotin (unlabeled) and the culture incubated at 24-25oC for 48-hr
while shaking at 190-200 rpm. Cells were then centrifuged and the supernatant
21
22
containing [14C] or unlabeled BNB collected. Unlabeled BNB was purified by high
performance liquid chromatography (HPLC) as described below.
Biotin Sulfoxide
Biotin sulfoxide was synthesized through oxidation of the sulfur atom of the
tetrahydrothiophene ring with hydrogen peroxide in an acidic environment. Equal
volumes of acid peroxide (0.1 M HCl, 1% v/v H2O2) and 100 µM [3H] (32 Ci/mmol) or
unlabeled biotin were mixed and incubated for 24-hr at room temperature. The reaction
was stopped by the addition of 1.5 volumes 0.1 M NaOH. The standards were dried
under N2 at 37oC and resuspended in 10 mM KPi, pH 7.0.
Biotin, Bisnorbiotin, Biotin Sulfoxide, and Biocytin Separation by High Performance Liquid Chromatography
This procedure was adapted from Mock 1997 (86). Prior to HPLC separation, all
tissue cytosols and sera were ultrafiltered using a centrifugal filtration device with a
nominal molecular weight cut off (NMWCO) of 5 kDa (Millipore, Billerica,
Massachusetts). This removes all protein bound biotin so that only free biotin is
separated and subsequently measured. Separation of biotin and its metabolites from a
sample was carried out by HPLC (Waters, Milford, MA) using a reversed phase C18
SphereClone 5m column (250 x 4.6 mm, Phenomenex, Torrance, CA) initially
equilibrated in 0.05% (v/v) trifluoroacetic acid (TFA) adjusted to pH 2.5 with ammonium
acetate (solution A). A constant flow rate of 1 ml/min was used throughout the
separation. The sample was first acidified with 1/10 volume 6 N HCl and then injected
into the HPLC. A linear gradient was then started with the subsequent mixing of solution
A with acetonitrile-0.05% TFA (1:1, v/v) (solution B). This gradient begins at 0% (v/v)
solution B and reaches 40% (v/v) by 35 min. Nonpolar constituents of the sample were
23
eluted from the column after the analytical gradient by increasing to 100% solution B
over 5 min and holding at 100% solution B for 5 min. The column was then re-
equilibrated to initial conditions by returning to 100% A for 10 min. The system was
then ready for injection of the next sample. Total run time was 60 min/sample.
The fractions in which biotin, BNB, and BSO were resolved were determined by
retention times of the radiolabled standards prepared above, injected prior to separation
of samples. There is no radiolabeled standard available for biocytin, so its retention time
was determined by measurement of each fraction by the competitive assay described
below. Since each metabolite has a discrete retention time, the fraction(s) corresponding
to that time were collected. If a radioactive sample was run, the fractions were collected
and counted in a liquid scintillation counter (Beckman). If the sample was not
radioactive, the fractions were dried under N2 to remove the chromatography solvents
and resuspended in HEPES buffer (0.1M 4-(2-hydroxyethyl)-1-piperazineethanesulfonic
acid (HEPES), pH 7.0, 1M NaCl) before measuring by competitive assay (see
Competitive Assay of Biotin).
Preparation of Biotinylated Bovine Serum Albumin
Biotinylated bovine serum albumin (BBSA) was used in the competitive assay for
biotin in which it competes against biotin in the sample for avidin binding as described in
Mock 1997 (86). Biotin N-hydroxysuccinimide ester (60 mg, NHS-biotin) was dissolved
in 5 ml of dimethyl sulfoxide (Sigma, St. Louis, MO) and added to 500 mg of fatty acid
free bovine serum albumin (fafBSA, Sigma) dissolved in 50 ml of ice cold 0.1 M
NaHCO3, pH 7.5. This was incubated overnight at 4oC while stirring and then placed in
dialysis tubing (30,000 NMWCO, Fisher Scientific, Pittsburgh, PA) and dialyzed against
24
PBS for 48-hr at 4oC with gentle stirring. The PBS was changed every 12-hr during the
48-hr incubation.
Competitive Assay of Biotin
The measurement of biotin and its metabolites BNB, BSO, and biocytin in all
samples was performed after HPLC separation (86). Each well of a 96-well microplate
was coated with 200 µl of a 1:50 dilution of BBSA to coating buffer (50 mM bicarbonate,
pH 9.0, 2.5 mg/ml BSA). The plate was covered and incubated at 4oC for 1-hr to 4 days.
After coating, the plate was washed twice with HEPES buffer (0.1 M HEPES, pH 7.0,
1 M NaCl). To a separate plate, 100 µl of biotin or metabolite standard (1500, 750, 375,
186.5, 93.25, 46.63, 23.32, 11.67 pM), unknown from HPLC separation, or HEPES
buffer (blank) was added. Avidin buffer (50 µl; NeutrAvidin-HRP (Pierce, Birmingham,
AL) diluted 1:25,000 in 0.1 M HEPES, pH 7.0, 1 M NaCl, 0.1% (w/v) BSA) was added
to each well and mixed thoroughly. The plate was incubated for one hr at room
temperature. The contents of these wells (100 µl) were transferred into the corresponding
wells of a BBSA coated plate that had been washed three times with 0.05% Tween 20
(Fisher Scientific Pittsburgh, PA) and incubated at room temperature for one hr. The
plate was washed three times with 0.05% Tween 20. Substrate solution (200 µl, 0.1 M
citric acid, 0.2 M sodium phosphate, final pH 5.0, 4.5 x 10⁻³ M ο-phenylenediamine
(Fisher Scientific), 0.012% (v/v) H2O2) was added and the plate incubated for 45 min. At
exactly the end of 45 min 100 µl of 2 M H2SO4 was added and the absorbance in the
wells measured at 490 nm – 650 nm in a spectrophotometer (Molecular Devices,
Sunnyvale, CA).

25
Preparation of Avidin AlexaFluor 430
NeutrAvidin (Pierce), an isoelectrically neutral and deglycosylated form of
avidin, was conjugated to the succinimidyl ester form of AlexaFluor 430 (Molecular
Probes, Eugene, OR). NeutrAvidin, 10 g/L in 50 mM sodium bicarbonate (pH 8.3), was
mixed 5:1 (v/v) with a solution of AlexaFluor 430 (10 g/L) in dimethyl sulfoxide
(DMSO) while vortexing. The solution was incubated while slowly vortexing for 1-hr at
room temperature. Unconjugated dye was removed by size exclusion chromatography
over a DG-10 column (Bio-Rad, Hercules, CA) equilibrated with PBS (20 mM sodium
phosphate, pH 7.2, 150 mM NaCl). Using PBS, the conjugate NeutrAvidin-AlexaFluor
430 was eluted from the column and the fractions with the highest absorbance at 280 nm
combined. Sodium azide (0.02% w/v) was added for preservation, and the conjugate
stored at 4oC protected from light.
Markwell Assay for Protein Concentration
Protein concentrations were measured using the modified Lowry procedure
known as the Markwell Assay (87). Tissue samples were first homogenized in 10
volumes of HEM (300 mM mannitol, 10 mM HEPES, 1 mM EDTA). Standards (0,
0.025, 0.05, 0.075, 0.1 mg BSA) or sample were added to test tubes in duplicate and
brought to a final volume of 100 µl with Milli Q water. Solution C (1 ml, 100:1 solution
A (2% Na2CO3, 0.4% NaOH, 0.16% Na+, K+ Tartrate, 1.0% Sodium Dodecyl Sulfate
(SDS) (w/v) to solution B (4% CuSO4)) was then added to each test tube and incubated
at room temperature for 10 min. Folin phenol (100 µl, 1 N) was then added and
incubated for 45 min. The absorbance at 650 nm was then measured in a
spectrophotometer (Molecular Devices).

26
Carboxylase Separation by SDS-PAGE
Acetyl CoA Carboxylase
Acetyl CoA carboxylase isoforms 1 and 2 were separated using a 3% stacking gel
(0.125 M Tris HCl, pH 6.8, 0.1% SDS, 3% acrylamide, 0.05% APS, 30 µl
tetramethylethylenediamine (TEMED, Fisher Scientific)) and a 5% separating gel (0.375
M Tris HCl, pH 8.8, 0.1% SDS, 5% acrylamide, 0.05% ammonium persulfate (APS), 30
µl TEMED). Sample homogenate (75 µg total protein) was diluted into 20 µl of sample
dilution buffer (0.375 M Tris HCl, pH 6.8, 0.23% SDS, 35% (v/v) glycerol, 0.035 mg/ml
bromophenol blue, 1.43 mM β-mercaptoethanol). The sample was incubated at 37oC for
5 min and then loaded onto the gel in an electrophoresis apparatus (Gibco BRL,
Gaithersburg, MD) filled with running buffer (0.025 M Tris base, 0.2 M glycine, 0.1%
SDS). The gel was electrophoressed at 37 volts overnight or until the dye front was
approximately 1 cm from the bottom.
Pyruvate Carboxylase
Pyruvate carboxylase was separated as ACC1 and 2 except that 10% acrylamide
was utilized in the separating gel.
Methylcrotonyl-CoA Carboxylase, and Propionyl-CoA Carboxylase
Methylcrotonyl-CoA carboxylase and PCC were separated as ACC1 and 2 except
that 8% acrylamide and a pH of 8.0 was utilized in the separating gel. This allows the
separation of MCC and PCC despite their close molecular weight.
Detection of Carboxylases After SDS-PAGE
Each gel was equilibrated in cold transfer buffer (0.03M Tris base, 0.2 M glycine,
60% (v/v) methanol) for 5-15 min. The gel was then transferred onto polyvinylidene
fluoride (PVDF, Millipore, Billerica, MA) using an electroblotter (Idea Scientific,

27
Corvallis, OR) at 12 volts for 2-hr. The PVDF was then stained with amido black stain
(50% (v/v) methanol, 10% (v/v) glacial acetic acid, 0.02% (w/v) naphthol blue black) and
then destained with amido destain (50% (v/v) methanol, 10% (v/v) glacial acetic acid).
The blot was rinsed in methanol and allowed to dry.
The blot was then blocked for 10 min in 0.5% nonfat dry milk (NFDM)- TBST
(0.5% NFDM, 20 mM Tris, 150 mM NaCl, 0.05% Tween 20, pH 7.4). NeutrAvidin –
alkaline phosphatase (Pierce, ACC1 and 2 and P61; 1:1000 dilution) or NeutrAvidin-
AlexaFluor 430 (PC, MCC, and PCC; 1:500 dilution) was then added and incubated for
45 min. The blot was washed 3 x 5 min in TBST no NFDM, and then developed using
ECF (Amersham Pharmacia, ACC1 and 2 and P61 only; PC, MCC, and PCC are scanned
directly with no substrate addition). The blot was then scanned on a fluorescent imager
(STORM 840, Molecular Devices).
Activity Assays of Pyruvate Carboxylase and Methylcrotonyl CoA Carboxylase
Adapted from Suormala et al, 1985 (88).
Pyruvate Carboxylase
Pyruvate carboxylase activity was determined through the measurement of [14C]
bicarbonate incorporated into the end product of the reaction catalyzed by pyruvate
carboxylase, oxaloacetate. Approximately 100 µg total protein (25 µl) from rat liver
homogenized in 50 volumes HEM, was mixed with 100 µl PC activity master mix
containing a final concentration of 100 mM Tris HCl (pH 8.0), 3.8 mM MgCl2, 0.5%
triton X-100 (v/v), 0.32 mM acetyl CoA, 3.14 mM ATP, 0.5 mM [14C] bicarbonate, 3.5
mM bicarbonate, and 15 mM pyruvate. Pyruvate was left out of the master mix for
blanks. The samples were incubated for 15 min at 37oC in a water bath. The reaction
28
was stopped through protein precipitation by the addition of 50 µl of 20% trichloroacetic
acid (TCA). The samples were centrifuged at 10,000 x g (Beckman) for 5 min to pellet
the precipitated protein. The supernatant was removed and placed into scintillation vials.
TCA (100 µl of a 10% solution) was added to the protein pellet to remove any remaining
radioactivity. The wash was combined with the supernatant and then evaporated at 65oC
under a constant stream of N2. The evaporated samples were resuspended in 500 µl of
water and 3 ml of scintillation cocktail was added. The amount of [14C] labeled
oxaloacetate was then determined in a liquid scintillation counter.
Methylcrotonyl CoA Carboxylase
Methylcrotonyl CoA carboxylase activity was determined through the
measurement of [14C] bicarbonate incorporated into the end product of the reaction
catalyzed by methylcrotonyl CoA carboxylase, methylglutaconyl CoA. The assay was
identical to the PC assay except for the master mix. The MCC master mix contained 100
mM Tris HCl (pH 8.0), 100 mM KCl, 0.75 mM dithiothreitol, 6 mM MgCl2, 0.1% triton
X-100 (v/v), 0.5 mM EDTA, 31.4 mM ATP, 0.5 mM [14C] sodium bicarbonate, 1.5 mM
sodium bicarbonate, and 2.8 mM methylcrotonyl CoA.
Isolation of P61 by Monomeric Avidin Column
Immobilized monomeric avidin (Pierce) was first poured into a plastic column (15
x 85 mm) and allowed to settle. The column was flushed with 10 ml PBS (0.1 M NaPi
(pH 7.2), 0.15 M NaCl). The column was washed 3 x 5 ml with biotin blocking and
elution buffer (PBS + 2 mM biotin) to block any irreversible biotin binding sites. The
column was then washed with 3 x 10 ml of regeneration buffer (0.1M glycine (pH 2.8))
to remove reversibly bound biotin. Finally, the column was equilibrated with 3 x 10 ml
29
of PBS. P61 containing supernatant (5 ml) was then placed onto the column and
incubated at room temperature for 1-hr. The column was then washed with 8 x 5 ml PBS
until all unbound protein was removed (no absorbance detected at 280 nm). Bound biotin
containing proteins and peptides were then eluted with 8 x 5 ml biotin blocking and
elution buffer until no absorbance was detected at 280 nm. The column was then
regenerated with 4 x 5 ml regeneration buffer. The biotin containing fractions (80 µl of
sample) were then separated on a 10% SDS-PAGE (pH 8.8), transferred to PVDF, and
stained with amido black (50% (v/v) methanol, 10% (v/v) glacial acetic acid, 0.02%
(w/v) naphthol blue black) and then destained with amido destain (50% (v/v) methanol,
10% (v/v) glacial acetic acid). Stained fractions containing P61 were concentrated 4 fold
and 240 µl of concentrate separated on a 10% SDS-PAGE (pH 8.8). The gel was stained
for 3-hr in coomassie stain (50% methanol, 6% glacial acetic acid, 0.05% coomassie blue
G250 (w/v)) and destained overnight (10% methanol, 15% glacial acetic acid).

CHAPTER 3 DIETARY BIOTIN INTAKE MODULATES THE POOL OF FREE AND PROTEIN-
BOUND BIOTIN IN RAT LIVER
As published in J. Nutr. (2001) 131:2310-2315, American Society for Nutritional Sciences.
Introduction
Biotin is present in organisms in two distinct forms, i.e. unassociated (free), and
protein bound. In the protein-bound form, biotin is covalently bound to the ε-amino
group of lysine residues occurring in a specific amino acid motif (89). In contrast, free
biotin exists as a distinct pool in several compartments, including urine, plasma, and
tissue. Free biotin undergoes substantial metabolism in lower as well as higher
organisms (90-94). In urine, biotin and its associated metabolites are all free due to
normal glomerular filtration of protein. The majority (~90%) of serum biotin is also free,
with the remainder either reversibly or covalently bound (27,95). Indirect evidence for
an intracellular pool of free biotin has been demonstrated in several ex vivo systems,
including cultured hepatocytes and peripheral blood mononuclear cells (29,96). The free
biotin pool in the tissues of intact animals has not been previously characterized.
Biotin deficiency markedly reduces urinary biotin excretion, with onset beginning
~2-3 weeks after consumption of a biotin-free diet (72). In a similar manner, biotin
deficiency effectively reduces serum and plasma biotin levels (72-74). The depleting
effect of biotin deficiency on tissue biotin levels, including brain, liver and pancreas, has
also been analyzed in several studies (97-99). As might be expected, consumption of a
biotin-supplemented diet or administration of biotin markedly elevates urinary biotin
30
31
excretion as well as serum or plasma levels in both humans and rodents (50,100). Biotin
supplementation also raises the concentration of the biotin metabolites, including biotin
sulfoxide and bisnorbiotin (101). To our knowledge, the effect of dietary biotin intake on
the free pool of biotin in tissues has not been investigated.
The relationship between dietary biotin intake and protein bound biotin has also
not been analyzed. Biotinylation is required for carboxylase function, and therefore
conditions that reduce protein biotinylation reduce enzymatic activity (72,97,98). It has
been proposed that during biotin deficiency, a pool of apocarboxylases is present because
the administration of biotin to biotin-deficient rats results in a rapid restoration of the
abundance of biotinylated polypeptide (75).
We sought to determine whether alterations in dietary biotin intake regulate tissue
biotin pools in a manner similar to plasma and urine. In this study, the free pool of biotin
in the liver and its relationship to protein biotinylation were analyzed separately in biotin-
deficient, biotin-adequate, biotin-supplemented, and pharmacologically supplemented
rats. The results have implications for understanding the relationship between dietary
biotin intake and the maintenance of biotin-dependent cellular function in higher
organisms.
Previous studies of biotin metabolism have used a purified diet with spray-dried
egg-white as the sole protein source and a biotin level of ~2 mg biotin/kg diet. Avidin
which is present in the egg-whites, binds ~ 1.44 mg of biotin/kg diet. This leaves ~0.6
mg biotin/kg diet available for absorption by the rat. This level equals a consumption of
900 ng biotin/day for a 0.15 kg rat, which is equivalent to a 70 kg human consuming 4.2
mg biotin/day. The biotin requirement for both the rat and human is unknown; however,
32
this equivalent level of consumption in humans is 45 times higher than the estimated safe
and adequate daily dietary intake (ESADDI) of 30-100 µg/day for humans. The purpose
of this study was to determine if a relative physiologic dose of biotin, more equivalent to
the human ESADDI, was adequate to prevent biotin deficiency in the rat.
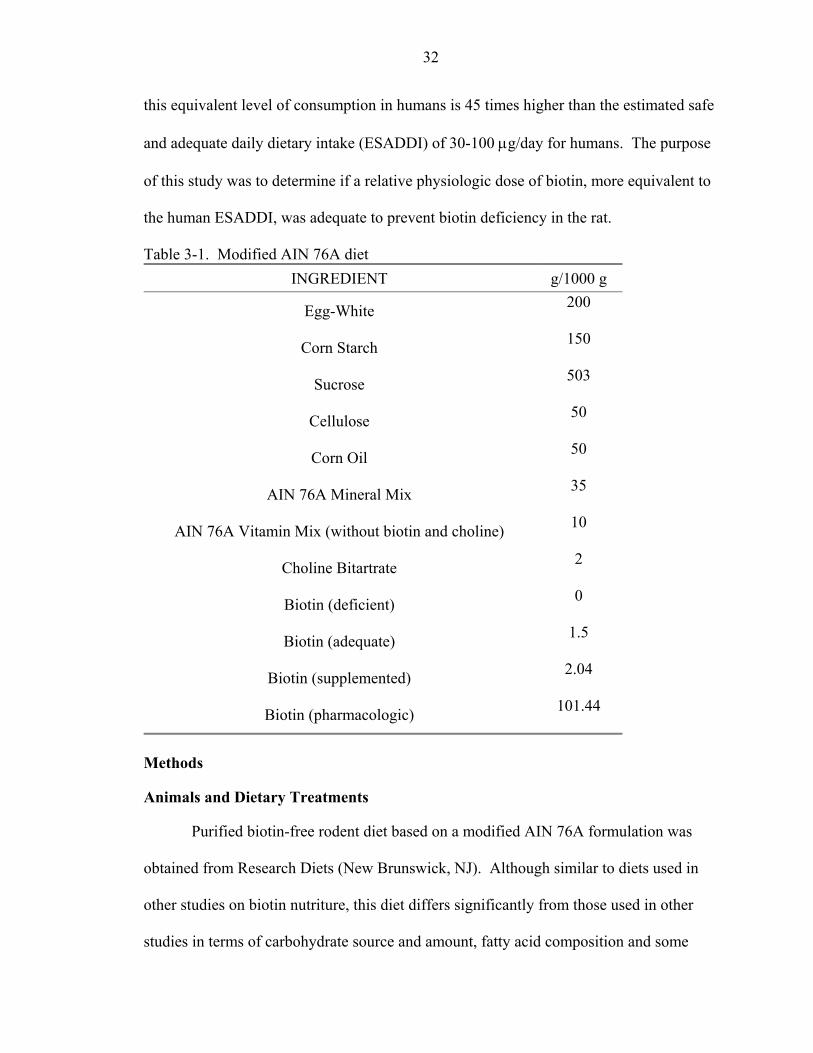
Table 3-1. Modified AIN 76A diet INGREDIENT g/1000 g
Egg-White 200
Corn Starch 150
Sucrose 503
Cellulose 50
Corn Oil 50
AIN 76A Mineral Mix 35
AIN 76A Vitamin Mix (without biotin and choline) 10
Choline Bitartrate 2
Biotin (deficient) 0
Biotin (adequate) 1.5
Biotin (supplemented) 2.04
Biotin (pharmacologic) 101.44
Methods
Animals and Dietary Treatments
Purified biotin-free rodent diet based on a modified AIN 76A formulation was
obtained from Research Diets (New Brunswick, NJ). Although similar to diets used in
other studies on biotin nutriture, this diet differs significantly from those used in other
studies in terms of carbohydrate source and amount, fatty acid composition and some

33
vitamins and minerals (72-75,102,103). This diet has been modified to include spray-
dried egg-white as its sole protein source (Table 3-1). The protein avidin found in egg-
whites binds ~1.44 mg biotin/kg diet, inhibiting absorption (104). The levels of dietary
biotin designated in this study represent the amount of biotin in the diet in excess of the
binding capacity of avidin in the diets. Male Sprague-Dawley rats (50-75 g initial
weight, n=20), obtained from Harlan (Indianapolis, IN), were housed individually in
hanging wire-bottom cages in an environmentally controlled room with constant
temperature (22oC) and a 12-hr light:dark cycle. After a four-day acclimation period
during which all rats consumed the 0.6 mg biotin/kg diet, rats were randomly assigned to
one of five groups (n=5/group) consuming an AIN 76A-based egg-white powdered diet
containing 0 mg biotin/kg diet (deficient), 0.06 mg biotin/kg diet (adequate), 0.6 mg
biotin/kg diet (supplemented), or 100 mg biotin/kg diet (pharmacologic). The diets were
consumed for three weeks. Body weight and food intake were measured three times
weekly. Twenty-four hr before the end of the study, the rats were placed into metabolic
chambers to allow the discrete collection of urine for biotin analysis. Rats were
anesthetized under halothane vapor and killed by exsanguination. The University of
Florida Institutional Animal Care and Use Committee approved all procedures.
Sample Preparation and Analysis
Blood was withdrawn using an EDTA-coated syringe to inhibit clotting and
centrifuged at 10,000 x g for 10 min to collect plasma. For plasma biotin, samples were
ultrafiltered using a 5000 dalton nominal molecular weight cut-off (NMWCO) filter
(Millipore, Bedford, MA) centrifuged at 12,000 x g for 1-hr at 4oC. This removes all
protein bound biotin allowing for a true free biotin measurement. Liver (~500 mg) was
removed and homogenized in 10 volumes ice-cold homogenization buffer (HEM, 300

34
mM mannitol, 10 mM HEPES (pH 7.2), 1 mM EDTA, and 1:100 (v/v) protease inhibitor
cocktail (Sigma, St. Louis, MO)) and centrifuged at 200,000 x g for 30 min at 4oC. The
supernatant was also ultrafiltered as above using a 5000 dalton NMWCO filter before the
competitive binding assay. The pellet was resuspended in homogenization buffer to a
concentration of ~40 g/L. All samples were immediately frozen in a mixture of dry ice
and isopropanol and stored at –80oC until analyzed.
Measurement of Free Biotin
The measurement of free biotin in urine, plasma, and liver was performed using
the coupled HPLC/competitive binding assay as described previously in Chapter 2.
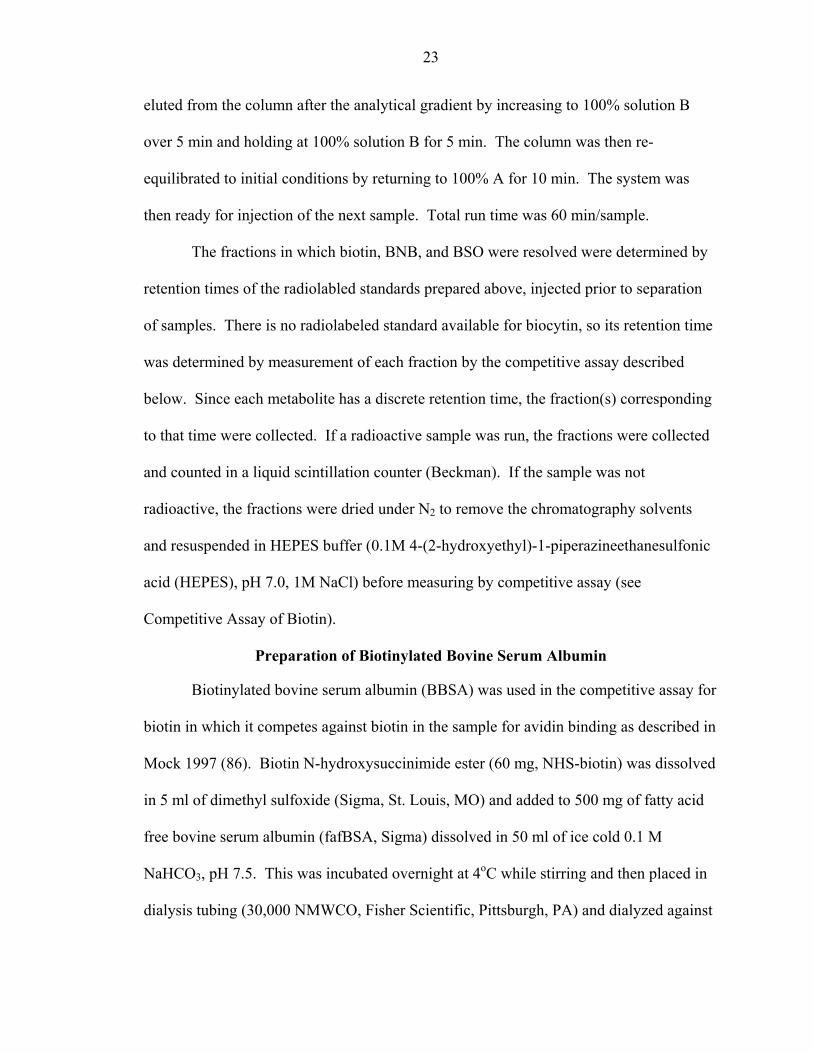
Measurement of Protein-Bound Biotin
Using the avidin blotting techniques described in Chapter 2, we specifically
detected five distinct proteins in the liver using a fluorescent imager, corresponding to the
five carboxylase enzymes ACC1, ACC2, PC, MCC, and PCC. We have validated the
limits of detection of the carboxylases using a fluorescent imager. To determine
sensitivity of our three detection methods (NeutrAvidin-AlexaFluor 430, NeutrAvidin-
HRP/ECL-Plus, NeutrAvidin-AP/ECF), we resolved varying amounts of BBSA (0.0001-
1 ng; produced in Chapter 2) by SDS-PAGE, transferred the gel to PVDF, and visualized
the BBSA using the appropriate reagent system. The NeutrAvidin-AlexaFluor 430
proved to be the least sensitive of the three methods, being able to detect to 0.245 ng
BBSA (Figure 3-1A). The NeutrAvidin-HRP/ECL-Plus system exhibited much higher
sensitivity, and was able to detect to 0.004 ng BBSA (Figure 3-1B). The NeutrAvidin-
AP/ECF system demonstrated the most sensitivity, as evidenced by the ability to detect
0.0009 ng BBSA.

35
0.1 1 10 100 1000
0.0x10 -00
1.0x10 05
0.0001 0.001 0.01 0.1 1 10
0.0x10 -00
2.5x10 05
5.0x10 05
7.5x10 05
B
0.0001 0.001 0.01 0.1 1 10
0.0x10 -00
1.0x10 07
2.0x10 07
3.0x10 07
ng BBSA
C
• Expected response o Measured response
Fluo
resc
ent I
nten
sity
, arb
itrar
y un
its
2.0x10 05
3.0x10 05
A
Figure 3-1. Detection and quantification of biotinylated bovine serum albumin by three fluorescent methods. A. Avidin-AlexaFluor 430, B. Avidin-HRP/ECL-Plus, C. Avidin-AP/ECF.
In order to assess the detection and quantification of biotinylated proteins in
complex protein mixtures, the linearity and sensitivity of the three detection systems was
analyzed in rat liver extracts. Rat liver endogenously expresses the biotinylated enzymes
ACC1 and 2, PC, MCC, and PCC. Although the exact abundance of these proteins is not
known in relation to the total amount of protein resolved by the gel, the molar ratio of
protein biotinylation is known to be 1:1, since only one biotinylation site exists in each of

36
these enzymes (89). Various amounts of rat liver homogenate extracts (100 - 0.78 µg by
serial dilution for NeutrAvidin – AlexaFluor 430 and the ECL-Plus system, 25-0.091 µg
by serial dilution for the ECF system) were resolved and transferred to PVDF prior to
being probed by one of the detection systems. Blots were then scanned and quantified
using a fluorescent imager.
The NeutrAvidin-AlexaFluor 430 conjugate was able to detect pyruvate
carboxylase, methylcrotonyl CoA carboxylase, and propionyl CoA carboxylase down to a
mass of 1.56 µg total protein, but failed to detect either isoform of ACC. For the
carboxylases that were detected, the observed response was linear for pyruvate
carboxylase and fit a second order polynomial curve for the methylcrotonyl CoA and
propionyl CoA carboxylase bands (Figure 3-2A). As expected, the ECL-Plus system
exhibited a much higher yield of fluorescence, but sensitivity was not markedly increased
for any of the carboxylases (1.56 µg total protein; Figure 3-2B). Again, ECF exhibited
the highest yield of fluorescence and sensitivity (0.19 µg total protein) compared to
NeutrAvidin-AlexaFluor 430 and the ECL-Plus system (Figure 3-2C). These results
suggested the use of NeutrAvidin-AlexaFluor 430 to detect carboxylases present in high
abundance, i.e. PC, MCC, and PCC. For the lower abundant isoforms of ACC, these
results suggest the use of NeutrAvidin-AP/ECF due to its ability to detect very low levels
of biotinylated proteins.
In this study, protein-bound biotin was measured as described in Chapter 2.
Pyruvate Carboxylase, MCC, and PCC were all measured using NeutrAvidin-AlexaFluor
430. Acetyl CoA carboxylase isoforms 1 and 2 were measured using NeutrAvidin-
AP/ECF.

37
0
25000
0 25 50 75 100 125
0
100000
200000
300000
liver homogenate, µg
B
0 5 10 15 20 25 30
0.0x10 -00
1.0x10 07
2.0x10 07
3.0x10 07
4.0x10 07
liver homogenate, µg
C
Fluo
resc
ent I
nten
sity
, arb
itrar
y un
its
o PC
• MCC/PCC
50000
75000A PCC/MCC
PC
Figure 3-2. Detection and Quantification of biotinylated polypeptides in rat liver homogenate. A. Avidin-AlexaFluor 430, B. Avidin-HRP/ECL-Plus, C. Avidin-AP/ECF .
Statistical Analysis
Results are expressed as means ± SEM. The significance of differences (P<0.05)
was tested by one-way ANOVA with Newman-Keuls post test.
Results
Effect of Dietary Biotin Intake on Rat Growth and Food Intake
At the observed rate of food intake, rats consumed 0 (deficient), 0.9 (adequate), 9
(supplemented), or 1502 (pharmacologic) µg biotin/day. The dietary biotin level in the
AIN 76A had no significant effect on either growth or food intake (Figure 3-3).
Additionally, no outward signs of biotin deficiency were found in rats consuming the
biotin-free diet. Toxicity was not evident in pharmacologically supplemented rats.

38
0mg/kg0.06 mg/kg0.6 mg/kg100 mg/kg
0
50
100
150
Bod
y w
-1 1 3 5 7 9 11 13 15 17 19 210
4
8
12
16
20
Day of Dietary Treatment
Food
inta
ke, g
/d
B
A
200
250
300
eigh
t, g
Figure 3-3. Effect of dietary biotin intake on rat growth (A) and food intake (B).
Effect of Dietary Biotin Intake on Biotin Status
Plasma biotin concentration increased with dietary biotin intake (Figure 3-4A).
Biotin deficient rats exhibited ~10% the biotin concentration found in biotin-adequate
rats (P<0.05, 2.0 ± 0.9 and 38.2 ± 11 nmol/L, respectively). Biotin-supplemented rats
exhibited a 3.6 fold increase in plasma biotin concentration over biotin-adequate rats
(P<0.05, 38.2 ± 11 and 176.7 ± 16.3, respectively). Rats consuming the pharmacologic
level of biotin exhibited a 137 fold elevation in plasma biotin (P<0.001, 5,239 ± 270
nmol/L) compared to biotin-adequate rats.
The concentration of hepatic free biotin, normalized to wet organ weight, was 32
± 7 pmol/g tissue in biotin-adequate rats (Figure 3-4B). Biotin-deficient rats exhibited a

39
Plasma Free Biotin Liver Free Biotin
0 0.06 0.6 1001
100
a
b
Diet, mg biotin/kg diet
Bio
tin, n
0 0.06 0.6 1001
10
100
a
bb
Diet, mg biotin/kg diet
Bio
tin, p
mo
Urinary Biotin Excretion
0 0.06 0.6 1001
100
10000
1000000
a
b b
c
Diet, mg biotin/kg diet
Bio
tin, p
mol
/hr
C
1000
10000
c
l/g ti
ssue
B10000m
ol/L
c
dA
Figure 3-4. Plasma (A), Liver (B), and Urinary (C) biotin levels following consumption of varying levels of dietary biotin for 3 weeks. Bars with different letters are significantly different (P<0.05).
78% reduction in free biotin (P<0.05, 6 ± 2 pmol/g tissue). Unlike plasma free biotin,
hepatic free biotin did not differ between biotin-adequate and biotin-supplemented rats
(32 ± 7 and 61 ± 14 pmol/g tissue). Pharmacologically supplemented rats had a 44 fold
elevation in free liver biotin concentration compared to biotin-adequate rats (P<0.01,
1414 ± 138 pmol/g tissue).
Rats consuming the biotin-free diet for 21 days excreted significantly less biotin
in the urine compared with biotin-adequate rats (P<0.05, 21 ± 10 and 168.4 ± 82 pmol/hr,
respectively) (Figure 3-4C). Rats consuming the diet containing a pharmacologic level of
biotin had a greatly increased urinary excretion rate (P<0.001, 35,090 ± 59 pmol/hr). As

40
with liver free biotin, there was no significant difference in the urinary biotin excretion
rate between biotin-adequate and biotin-supplemented rats (168.4 ± 82.6 and 206.2 ± 36
pmol/hr, respectively).
Effect of Dietary Biotin Intake on the Relative Abundance of Biotinylated Carboxylases
The effect of dietary biotin intake on the relative abundance of biotinylated
polypeptides was assessed using avidin blotting. Under these SDS-PAGE conditions,
MCC and PCC could not be separated and so results for these carboxylases are presented
as the combined fluorescence of MCC and PCC labeled MCC/PCC. Rats consuming
100 mg/kg 0.6 mg/kg 0.06 mg/kg 0 mg/kg
Fluo
resc
ent I
nten
sity
, ar
bitra
ry u
nits
Fl
uore
scen
t Int
ensi
ty,
arbi
trary
uni
ts
Fluo
resc
ent I
nten
sity
, ar
bitra
ry u
nits
Fl
uore
scen
t Int
ensi
ty,
arbi
trary
uni
ts
0
25000
50000
75000
a
b
b
b
0
25000
50000
75000
a
b
c
b
0 0.06 0.6 1000
10000
20000
30000
40000
50000
a
bb b
Dietary biotin level, mg/kg0 0.06 0.6 100
0
10000
20000
30000
40000
50000
a
b b
c
Dietary biotin level, mg/kg
ACC1 ACC2
PC MCC/PCC
ACC2 ACC1
PC
MCC/ PCC
Figure 3-5. Relative abundance of biotinylated ACC1, ACC2, PC, and MCC/PCC following consumption of varying levels of dietary biotin for 3 weeks. Bars with different letters are significantly different (P<0.05).

41
biotin-free diets had less of the biotinylated forms of all carboxylases after 21 days
(P<0.05). The magnitude of the reduction ranged from 50% for ACC isoforms 1 and 2,
to 60% for PC, and MCC/PCC (Figure 3-5). The abundance of ACC isoform 2 was
significantly elevated by 40% in biotin-supplemented rats compared to biotin-adequate
rats (P<0.05). There was no difference in the abundance of biotinylated PC, MCC/PCC,
and ACC1 between biotin-adequate and biotin supplemented rats. Pharmacologic biotin
supplementation significantly reduced the abundance of biotinylated ACC2, and
MCC/PCC (P<0.05) compared to biotin-supplemented rats.
Discussion
Despite the observation that frank signs of biotin deficiency are rare, there is
growing appreciation of genetic, physiologic, and pharmacologic conditions that impair
biotin status (36,38,44,105-108). This suggests that the lack of physiologic
manifestations of biotin deficiency may not be a reliable measure by which to gauge
biotin status in the general population. The effects of marginal biotin status, in the
absence of physiologic signs of deficiency, have not been analyzed as well as those of
more severe deficiency. In this study, the relationship between dietary intake and
intracellular pools of free and protein-bound biotin was analyzed in a rat model of biotin
nutriture. Our studies extend previous work in this area in three important ways: the use
of physiologically relevant intakes, the use of marginal biotin deficiency, and the
measurement of the free-biotin pool in the liver.
The experimental diets chosen in this study model several relevant states of biotin
nutriture. Dietary biotin intake had no effect on growth rate or food intake, suggesting
that severe deficiency was absent. This is in contrast to earlier studies in which loss of
growth was observed relatively early in the dietary manipulation, and may represent an

42
improvement in the use of the AIN 76A diet design (72,73,109). In these experiments,
rats fed the 0.06 mg biotin/kg diet exhibited an intake of ~0.9 µg biotin/d. This is
equivalent to an intake of ~400 µg biotin/d for a 70 kg human. Although still four to ten
times higher than the ESADDI, this is the lowest amount of biotin used in a biotin status
study. A biotin supplemented condition was obtained in rats consuming the 0.6 mg/kg
diet, or ~100 times the ESADDI. Previous to this study, this level of biotin was the
lowest level used and considered an adequate intake. This level represents a
supplemented dietary intake easily obtained in self-selected biotin supplements or in the
treatment of biotin-responsive disorders, such as biotinidase deficiency or multiple
carboxylase deficiency (110-112). To determine whether pharmacologic doses of biotin
might lead to adverse effects on physiology, some rats were given a diet containing 100
mg biotin/kg, a dietary level that is the highest intake yet tested, equivalent to an intake of
667 mg for a 70 kg person.
Despite the lack of outward signs of deficiency, biochemical measurements
clearly indicated a change in biotin status. We confirmed previous studies that
demonstrated a direct relationship between dietary biotin intake and urinary biotin
excretion (72,91). Urinary biotin excretion was significantly depressed in marginally
biotin-deficient rats, suggesting the induction of a homeostatic mechanism attempting to
conserve biotin pools. There was no difference in the urinary excretion of biotin in rats
consuming either the adequate or supplemented diets, suggesting that biotin pools were
not yet sufficiently large to spill over into the urine. Alternatively, biotin reabsorption
capacity in the kidney might not be saturated, preventing an increase in urinary excretion.
This was an unexpected finding because the adequate diet in our studies corresponded to

43
a relatively high human intake, and the supplemented diet represented a 10-fold increase
over that level. It is possible that, consistent with earlier studies in humans, excess biotin
was catabolized to BNB or BSO (100). Biotin catabolites were not measured in these
studies. We observed the expected large increases in urinary biotin excretion and plasma
biotin concentrations in rats consuming the pharmacologic doses of biotin, in agreement
with human studies that demonstrate a rapid and large excretion of biotin in excess of
required levels (100,101,113).
Plasma biotin pools were similarly influenced by dietary biotin intake. Marginal
biotin deficiency was remarkably effective in reducing plasma biotin levels, suggesting
that in this limited case, plasma biotin was a useful index of biotin status. In fact, plasma
biotin might be argued to be a better marker of biotin status in this study because a
significant elevation of plasma biotin was observed in the biotin-supplemented rats, in
contrast to urinary biotin excretion for which no such difference was found. Whether
such a conclusion can be extended to biotin-supplemented humans is unclear because,
during biotin deficiency, urinary biotin excretion appears to be a more reliable indicator
of biotin status (114). Plasma biotin was significantly elevated in pharmacologically
supplemented rats compared with all other dietary groups, demonstrating that a very high
circulating biotin concentration did not elicit any outward effects on physiology.
The soluble fraction of liver, which in our experiments reasonably represents the
cytosolic cellular fraction, also demonstrated a free biotin pool responsive to dietary
biotin intake. The intracellular biotin pool in biotin-deficient rats was 20% that in biotin-
adequate rats. Like plasma biotin, it was possible to greatly expand the hepatic free
biotin pool possibly available for protein biotinylation or other proposed functions of

44
biotin (115) using pharmacologic supplementation. Although high plasma biotin
concentrations may have contaminated the liver samples and falsely elevated the biotin
level, the ratio of liver to plasma free biotin (data not shown) was very small in all dietary
groups, suggesting that contamination was not contributing substantially to the liver
biotin measurement.
After establishing the biotin status of each dietary group, the effect of biotin
intake on the abundance of biotinylated polypeptides was analyzed. We believe that
changes in the abundance of biotinylated polypeptides are due to the deficiency per se,
rather than changes in the apoprotein form of the polypeptide. Although we cannot rule
out the latter possibility because Western blot analysis of each carboxylase was not
performed, our assumption is supported by the following findings: 1) biotin deficiency
does not alter the abundance of carboxylase mRNA, and 2) in biotin-deficient rats, large
pools of apocarboxylases are present that are immediately available for biotinylation
upon return of biotin to the system (20). Post-transcriptional regulation of MCC and
PCC has been proposed, but the relevant studies did not directly analyze the amount of
MCC or PCC polypeptide (75).
Biotin-deficient rats, even those not exhibiting outward signs of deficiency, have
a significantly reduced abundance of the biotinylated form of all carboxylases. This
demonstrates that loss of carboxylase activity is occurring before the overt signs of biotin
deficiency emerge. Biotin-adequate rats, consuming close to the suggested human
ESADDI, appear to demonstrate full biotinylation of PC, MCC, PCC, and ACC1 because
biotin-supplemented rats did not have significantly more biotinylated carboxylases.
Interestingly, we found a significant difference in the abundance of biotinylated ACC2

45
between biotin-adequate and biotin-supplemented rats, consistent with an earlier report of
higher sensitivity of ACC biotinylation to dietary biotin supply (103). We find this
observation to be of interest because it suggests that in rats consuming near the human
ESADDI for biotin, the function of ACC2 may not be maximal. The physiologic or
functional implications for incomplete biotinylation of ACC2 under presumably adequate
conditions cannot be inferred from this study. Several other studies have clearly
demonstrated alterations in fatty acid metabolism in biotin-deficient rats, but have usually
focused on fatty acid biosynthesis rather than β-oxidation (116-127).
Another unexpected finding of this study was the effect of a pharmacologic intake
of dietary biotin on protein biotinylation. We observed that in pharmacologically
supplemented rats, the abundance of some biotinylated carboxylases was significantly
reduced. Whether this represents a physiologically relevant detrimental effect of
pharmacologic biotin intake has yet to be determined.
Changes in biotin status have been demonstrated to affect a range of metabolic
processes, from changes in carboxylase activity to changes in the expression of
nonbiotin-dependent enzymes such as glucokinase, ornithine transcarbamylase, and
phosphoenolpyruvate carboxykinase (12,74,128-130). The sensitivity of this regulation
has not been addressed, but the possibility that marginal biotin status at the cellular level
regulates gene expression cannot be ruled out and is, in fact, supported by this work
because marginal biotin deficiency and supplementation resulted in altered tissue free
biotin pools. Finally, the use of rats as a model for biotin metabolism in humans has been
validated (85,131); thus, our data suggest that our current knowledge and

46
recommendations concerning biotin intake and the maintenance of biotin function may
not be in agreement and require further investigation.

CHAPTER 4 LIPOPOLYSACCHARIDE INDUCED INFLAMMATORY RESPONSE ALTERS
CIRCULATING BIOTIN AND THE RELATIVE ABUNDANCE OF THE BIOTIN-DEPENDENT CARBOXYLASES
Introduction
Several lines of investigation provide evidence that biotin is required for normal
function of the immune system, including antibody production, immunological reactivity,
T and B cell differentiation, and cytotoxic T-cell response (49). Biotin’s role in human
immune function can be demonstrated in patients suffering from biotin-responsive
multiple carboxylase deficiencies. Cowan et al., assessed the biotin responsiveness of
three siblings who presented in early childhood with central nervous system dysfunction,
candida dermatitis, intermittent ataxia, and alopecia (52). Analysis of urine samples from
these individuals demonstrated elevated levels of β-hydroxypropionate, β-
methylcrotonylglycine, and β-hydroxyisovalerate, strongly suggesting an insufficiency in
biotin-dependent enzyme function. Two of the siblings expired ultimately to
overwhelming infection, but the third improved after the administration of high doses of
biotin. Concomitant with the improvement in pathology, the urinary organic acids
drastically decreased.
A strong link between the importance of biotin in immune function has also been
obtained from the case study of a 12 month old boy who exhibited multiple carboxylase
deficiency likely due to biotinidase deficiency (132). This individual had decreased
levels of prostaglandin E2 (PGE2), which was associated with an absence of monocyte
suppressor activity. Prostaglandin synthesis is one facet of the downstream signal
47

48
transduction cascades in the inflammatory response. Oral biotin supplementation
restored biotin dependent enzyme activity as well as PGE2 levels, strongly suggesting an
important role for the biotin dependent enzyme acetyl CoA carboxylase in these cells.
Candidiasis is a common finding in biotinidase and multiple carboxylase deficiency
patients, suggesting a generalized lack of immune competence (32,133-137).
Further evidence of the importance of biotin in the immune system comes from a
recent study by Manthey and colleagues (54). This study evaluated the effects of biotin
supply on cell proliferation, cell death, and IL-2 secretion in the Jurkat human T-cell line.
While cell proliferation and death did not change between cells incubated in deficient,
adequate, or pharmacologic levels of biotin, the concentration of IL-2 was inversely
related to the concentration of biotin in the media. IL-2 produced by T-cells functions in
an autocrine manner to stimulate T-cell proliferation as well as to potentiate the apoptotic
cell death of antigen activated T-cells. IL-2 also stimulates the proliferation of natural
killer cells and B-cells (138). It has now been determined that the higher levels of IL-2
seen in cells grown in deficient medium was due to a decrease in IL-2 receptor γ (55).
This in part explains the lack of ability of high IL-2 levels to induce cell proliferation. In
vivo, the differing levels of IL-2 receptor γ caused by deficient, physiologic, or
pharmacologic amounts of biotin may have affected the proliferation rates of natural
killer cells, B-cells, or proliferation rates and apoptosis of activated T-cells.
In a study of the effect of biotin status on immune function in rodents,
experimentally induced biotin deficiency significantly reduced spleen size as well as the
absolute number of spleen cells (139). Additionally, the percentage of immune cells
presenting T and B-cell surface markers were altered. The percentage of cells expressing

49
surface immunoglobulin decreased significantly (B-cells), while the percentage of cells
expressing CD3, CD4, and CD8 were increased significantly (T-cells). This suggests that
biotin deficiency may affect B and T-cells differently. The decrease in cells expressing
surface immunoglobulin could correlate with the decreased antibody production seen in
biotin deficiency. Spleen cell proliferation stimulated by the mitogen concanavalin A
was also decreased in biotin-deficient rodents.
While immune dysfunction during biotin deficiency is well known, investigations
into the effect of an immune response on biotin metabolism are just now being
researched. Recently, the uptake and metabolism of biotin in human lymphocytes has
been investigated. Mitogen stimulation results in a substantial increase in biotin uptake
by proliferating lymphocytes through an increase in the number of biotin transporters per
cell; there is good evidence that the purpose of this increased intake is to support
biotinylation of an increased abundance of biotin-dependent enzymes (96,115,140).
While these in vitro data show biotin metabolism is changed during stimulation of
immune cells, no research into the effect of an in vivo immune response on whole body
biotin metabolism has been performed. The purpose of the present study was to
determine if the metabolism and function of biotin are altered during an inflammatory
response elicited by the administration of the bacterial endotoxin lipopolysaccharide, and
how a marginal biotin deficiency modulates this response.
Methods
Materials
Male Sprague-Dawley rats were obtained from Harlan (Indianapolis, IN).
Purified biotin-free rodent diet based on a modified AIN 76A formulation (described
previously in Chapter 3) was obtained from Research Diets (New Brunswick, NJ). d-

50
Biotin, protease inhibitor cocktail, LPS (catalogue # L3129 lot # 20K4047), and ο-
phenylenediamine dihydrochloride were purchased from Sigma (St. Louis, MO); avidin-
horseradish peroxidase (Avidin-HRP) and avidin-alkaline phosphatase (Avidin-AP) were
purchased from Pierce Chemical Company (Birmingham, AL); 96-well microtiter plates
(Nunc Maxisorb) and bovine serum albumin (BSA) were purchased from Fisher
Scientific (Pittsburgh, PA). Enhanced chemifluorescence (ECF) reagent was purchased
from Amersham-Pharmacia (Piscataway, NJ). Biotinylated BSA, and Avidin-AlexaFluor
430 conjugate were synthesized as previously described in Chapter 2.
Animals and Dietary Treatments
Male Sprague Dawley rats, 50-74 g initial weight, were housed individually in
hanging wire-bottom cages in an environmentally controlled room with constant
temperature (22oC) and a 12-h light:dark cycle. The University of Florida Institutional
Animal Care and Use Committee approved all procedures.
Dose-response experiments
Rats (n=20) were fed a modified AIN 76A diet containing 0.06 mg biotin/kg diet
for one week prior to the study to standardize their biotin status as previously described
(Chapter 3). This diet has been modified to include spray-dried egg-white as its sole
protein source. The protein avidin, contained within the egg-white, binds ~1.44 mg
biotin/kg purified diet. The amount of biotin expressed in the diet is the amount above
that bound by avidin as determined by the HPLC – avidin binding assay. Rats were
randomly assigned to receive i.p. 0, 0.1, 1, or 10 mg LPS/kg body weight dissolved in
endotoxin free 0.9% saline. Rats were immediately placed in metabolic cages for
discreet collection of urine for biotin and metabolite analysis. Rats were then
anesthetized under halothane vapor and killed by exsanguination 6-hr post LPS injection.
51
Time-dependent and dietary status experiments
Rats (n=36) were acclimated on a modified AIN 76A diet described in Chapter 3
containing 0.06 mg biotin/kg diet for five days and then randomly divided into two
groups: biotin deficient and biotin adequate. The biotin deficient diet was the modified
AIN 76A diet used above without biotin. The biotin adequate diet was the same diet used
during acclimation containing 0.06 mg biotin/kg diet. Rats consumed the diets for three
weeks before being further divided into rats receiving 5 mg/kg LPS dissolved in 0.9%
saline or 0.9% saline i.p. only. Three rats from each group (LPS deficient, saline
deficient, LPS adequate, saline adequate) were then anesthetized under halothane vapor
and killed by exsanguination 6, 12, or 24-hr after injection with LPS.
Sample Preparation
Dose-response experiments
Blood was withdrawn, allowed to coagulate for 30 min, and centrifuged at
10,000 x g for 5 min to collect serum. Liver (~500 mg) was removed and homogenized
in 10 volumes of ice-cold HEM (300 mmol/L mannitol, 10 mmol/L HEPES (pH 7.2), 1
mmol/L EDTA, and 1:100 (v/v) protease inhibitor cocktail). A portion of the
homogenate was set aside for protein biotinylation analysis and the remainder centrifuged
at 200,000 x g for 30 min at 4oC to collect the soluble fraction. All samples were
immediately frozen in a mixture of dry ice and isopropanol and stored at –80oC until
needed.
Time-dependent and dietary status experiments
Blood was withdrawn, allowed to coagulate for 30 min, and centrifuged at 10,000 x
g for 5 min to collect serum. The serum was immediately frozen and stored at –80oC
until needed. Liver was removed, divided into 6 equal pieces, immediately frozen on dry
52
ice, and stored at –80oC until needed. When needed, individual liver pieces were thawed
and homogenized in 10 volumes of ice-cold HEM.
Competitive Binding Assay of Biotin
The measurement of biotin and its metabolites in urine, serum, and liver was
performed with a coupled HPLC/competitive binding assay as previously described in
Chapter 2.
Detection and Quantification of Biotinylated Proteins
The five biotin-dependent carboxylases, acetyl CoA carboxylase isoforms 1 and 2
(ACC1, ACC2), pyruvate carboxylase (PC), propionyl CoA carboxylase (PCC), and
methylcrotonyl CoA carboxylase (MCC) were detected using the avidin blotting
technique described previously in Chapter 2 with slight modifications. Because of their
similar molecular weights, PCC and MCC are not separated under normal SDS-PAGE
conditions (10% separating gel pH 8.8). Using an 8% separating gel at pH 8.0, we have
separated these proteins from one another so that individual quantification of each band
could occur.
Serum Zn and Serum Glucose
Serum Zn was measured using an AAAnalyzer (Perkin-Elmer, Shelton, CT) after a
1:4 dilution with highly purified water. Serum glucose was measured using the Infinity
Glucose Reagent kit (Sigma).
PC and MCC Activity
The measurement of PC and MCC activity was performed using PC and MCC
activity assays described in Chapter 2.

53
Statistical Analysis
Dose-response experiments
Results are expressed as means ± SEM. The significance of differences (P<0.05)
was tested by one-way ANOVA with Newman-Keuls post test.
Time-dependent and dietary status experiments
Results are expressed as mean ± SEM. The significant differences (P<0.05) was
tested by three-way ANOVA or t-test (weight gain, diet consumption, and in vitro
biotinylation).
Results
Dose Dependent Effects of an LPS Induced Inflammatory Response
Serum zinc and glucose
In rats consuming a purified diet containing 0.06 mg free biotin/kg diet and
injected with saline, the serum Zn concentration was 1.71 ± 0.08 ppm. The
administration of lipopolysaccharide significantly reduced serum Zn concentration
approximately 75% at all doses tested (p<0.05) (Table 4-1). The serum Zn of one animal
in the 1 mg/kg LPS group did not decrease below control levels (1.56 ppm). This animal
Table 4-1. Changes in serum Zn and glucose during exposure to varying doses of endotoxin
LPS Dose, mg/kg 0 0.1 1 10 Zn, ppm 1.71 ± 0.08 0.44 ± 0.03a 0.42 ± 0.03a 0.36 ± 0.02a Glucose, mg/dl 198 ±19 175 ± 8 181 ± 4 170 ± 10
also showed no outward signs of illness and was therefore excluded from all subsequent
analyses. Serum glucose, while lower in LPS treated animals, was not significantly
reduced (Table 4-1).
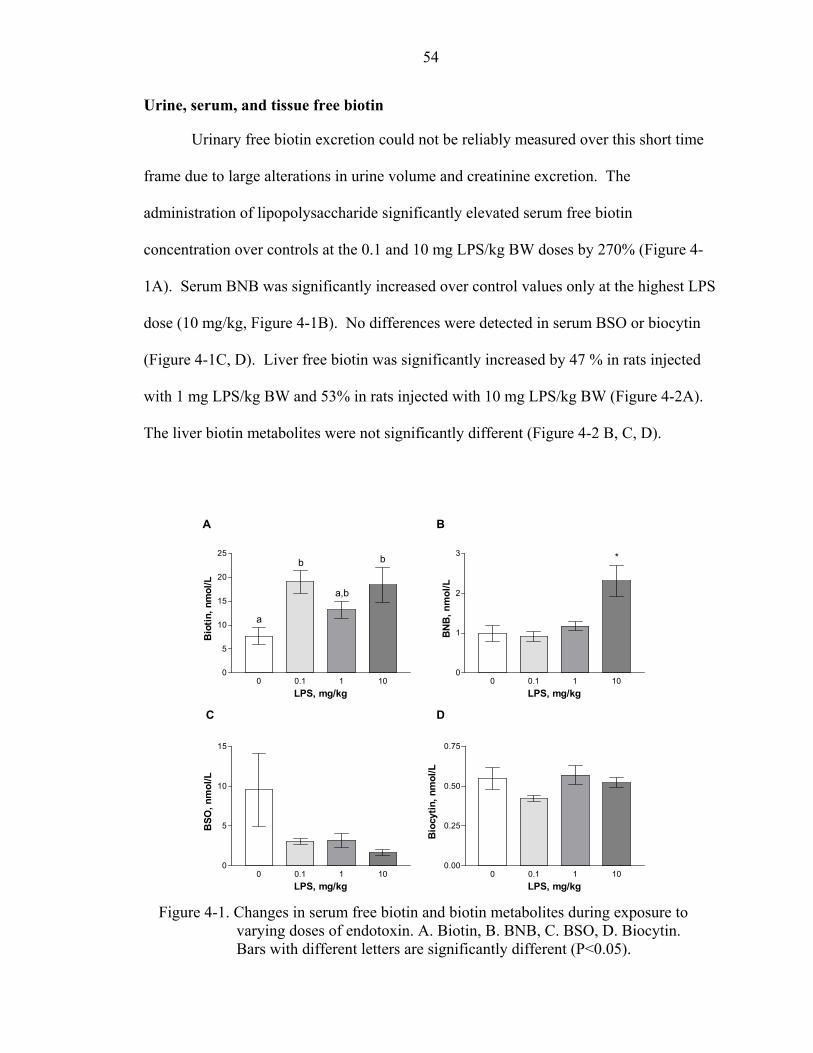
54
Urine, serum, and tissue free biotin
Urinary free biotin excretion could not be reliably measured over this short time
frame due to large alterations in urine volume and creatinine excretion. The
administration of lipopolysaccharide significantly elevated serum free biotin
concentration over controls at the 0.1 and 10 mg LPS/kg BW doses by 270% (Figure 4-
1A). Serum BNB was significantly increased over control values only at the highest LPS
dose (10 mg/kg, Figure 4-1B). No differences were detected in serum BSO or biocytin
(Figure 4-1C, D). Liver free biotin was significantly increased by 47 % in rats injected
with 1 mg LPS/kg BW and 53% in rats injected with 10 mg LPS/kg BW (Figure 4-2A).
The liver biotin metabolites were not significantly different (Figure 4-2 B, C, D).
0 0.1 1 100
5
10
15
20
25
a
b
a,b
b
LPS, mg/kg
Bio
tin, n
mol
/L
0 0.1 1 100
1
2
3 *
LPS, mg/kg
BN
B, n
mol
/L
0 0.1 1 100
5
10
15
LPS, mg/kg
BSO
, nm
ol/L
0 0.1 1 100.00
0.25
0.50
0.75
LPS, mg/kg
Bio
cytin
, nm
ol/L
A
C
B
D
Figure 4-1. Changes in serum free biotin and biotin metabolites during exposure to varying doses of endotoxin. A. Biotin, B. BNB, C. BSO, D. Biocytin. Bars with different letters are significantly different (P<0.05).

55
Relative abundance of hepatic biotinylated carboxylases
Administration of LPS significantly reduced the relative abundance of
biotinylated ACC isoform 1 at the 1 and 10 mg/kg body weight doses (Figure 4-3).
Biotinylated ACC isoform 2 was significantly reduced in abundance at all doses of LPS
analyzed (Figure 4-3). The abundance of hepatic biotinylated PC was significantly
decreased at all doses of LPS by ~50% following LPS administration (P<0.0001; Figure
4-4). In contrast, the abundance of hepatic biotinylated MCC was significantly increased
~100% after LPS administration (P=0.0001; Figure 4-5A). No significant difference was
detected in the abundance of hepatic biotinylated liver PCC (P>0.05; Figure 4-5B).
0 0.1 1 100
LPS, mg/kg
0 0.1 1 100.00
0.25
0.50
0.75
LPS, mg/kg
Bio
cytin
, ng/
g tis
sue
0 0.1 1 100
LPS, mg/kg
0 0.1 1 100
1
2
3
LPS, mg/kg
BSO
, ng/
g tis
sue
D C
1
2
3
a a
b b
Bio
tin, n
g/g
tissu
e
1
2
3
BN
B, n
g/g
tissu
e
A B
Figure 4-2. Changes in liver free biotin and biotin metabolites during exposure to varying doses of endotoxin. A. Biotin, B. BNB, C. BSO, D. Biocytin. Bars with different letters are significantly different (P<0.05).
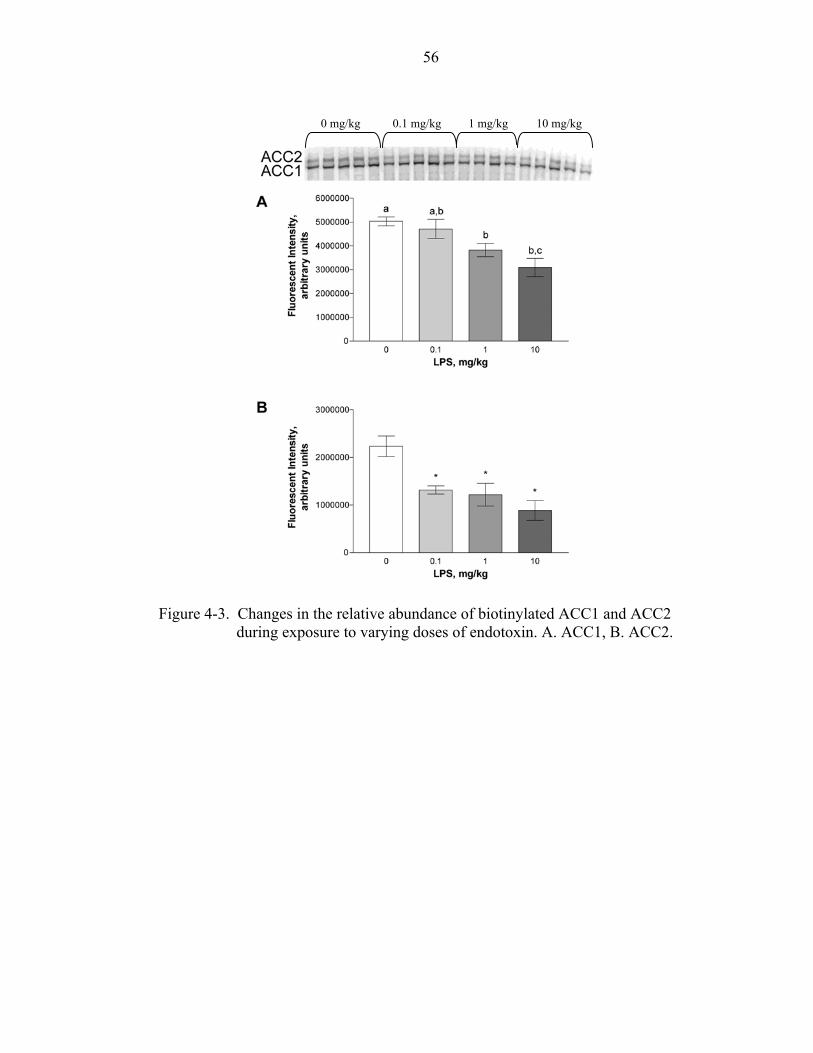
56
0 mg/kg 0.1 mg/kg 1 mg/kg 10 mg/kg
Figure 4-3. Changes in the relative abundance of biotinylated ACC1 and ACC2 during exposure to varying doses of endotoxin. A. ACC1, B. ACC2.

57
0 0.1 1 100
5000
10000
15000
20000
** *
LPS, mg/kg
10 mg/kg 1 mg/kg 0.1 mg/kg 0 mg/kg
Figure 4-4. Changes in biotinylated PC during exposure to varying doses of endotoxin. * Indicates significant difference (P<0.05).
10 mg/kg 1 mg/kg0.1 mg/kg0 mg/kg
Fluo
resc
ent I
nten
sity
, ar
bitr
ary
units
Figure 4-5. Changes in the relative abundance of biotinylated MCC and PCC during exposure to varying doses of endotoxin. A. MCC, B. PCC. * Indicates significant difference (P<0.05).
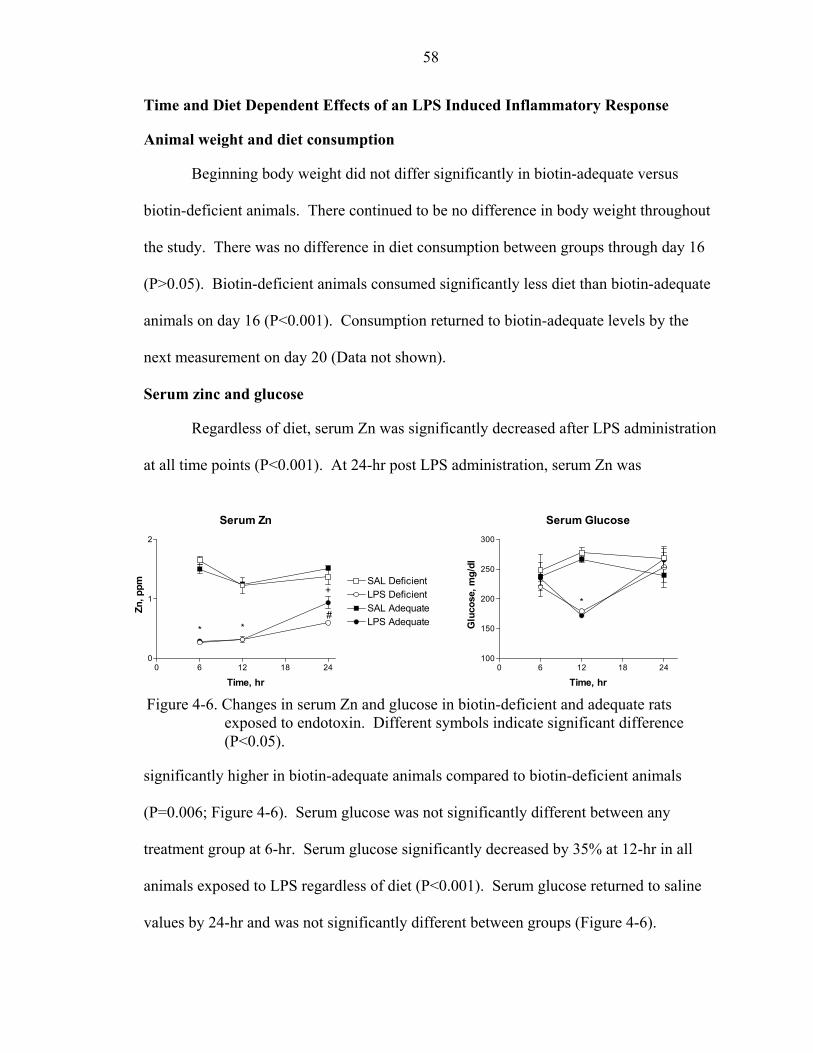
58
Serum Zn
0 6 12 18 240
1
2
* *#
+SAL DeficientLPS DeficientSAL AdequateLPS Adequate
Time, hr
Zn, p
pm
Serum Glucose
0 6 12 18 24100
150
200
250
300
Time, hr
Glu
cose
, mg/
dl
*
Time and Diet Dependent Effects of an LPS Induced Inflammatory Response
Animal weight and diet consumption
Beginning body weight did not differ significantly in biotin-adequate versus
biotin-deficient animals. There continued to be no difference in body weight throughout
the study. There was no difference in diet consumption between groups through day 16
(P>0.05). Biotin-deficient animals consumed significantly less diet than biotin-adequate
animals on day 16 (P<0.001). Consumption returned to biotin-adequate levels by the
next measurement on day 20 (Data not shown).
Serum zinc and glucose
Figure 4-6. Changes in serum Zn and glucose in biotin-deficient and adequate rats exposed to endotoxin. Different symbols indicate significant difference (P<0.05).
Regardless of diet, serum Zn was significantly decreased after LPS administration
at all time points (P<0.001). At 24-hr post LPS administration, serum Zn was
significantly higher in biotin-adequate animals compared to biotin-deficient animals
(P=0.006; Figure 4-6). Serum glucose was not significantly different between any
treatment group at 6-hr. Serum glucose significantly decreased by 35% at 12-hr in all
animals exposed to LPS regardless of diet (P<0.001). Serum glucose returned to saline
values by 24-hr and was not significantly different between groups (Figure 4-6).

59
Relative abundance of hepatic biotinylated carboxylases
Acetyl CoA carboxylase isoform 1 was significantly decreased in biotin-deficient
saline treated animals at the 6 and 12-hr time points compared to biotin-adequate saline
ACC1
0 6 12 18 240
2000000
4000000
6000000
8000000LPS DeficientSAL DeficientLPS AdequateSAL Adequate
*+
#
*+ *
#
Time, hr
Fluo
resc
ent I
nten
sity
,ar
bitr
ary
units
ACC2
0 6 12 18 240
2500000
5000000
7500000
* * *
#
##
Time, hr
Fluo
resc
ent I
nten
sity
,ar
bitr
ary
units
Statistical Key: * LPS Adequate significantly different than SAL Adequate, LPS Deficient significantly different than SAL Deficient, + LPS Adequate significantly different than LPS Deficient, # SAL Adequate significantly different than SAL Deficient
LPS 6hr LPS 12hr LPS 24hr SAL 24hr SAL 12hr SAL 6hr
ACC1
ACC1
ACC2
ACC2
Deficient
Adequate
Figure 4-7. Changes in the relative abundance of biotinylated ACC1 and 2 in biotin-deficient and adequate rats after exposure to endotoxin.

60
treated animals (P<0.001). LPS administration to biotin-adequate animals significantly
decreased the relative abundance of biotinylated ACC1 at all time points by 50%
(P<0.005). The relative abundance of biotinylated ACC1 began to decrease at the 12-hr
time point in biotin deficient LPS treated animals compared to biotin-deficient saline
treated animals; however, this trend was not significantly different until the 24-hr time
point (P=0.005). The relative abundance of biotinylated ACC1 was significantly
decreased at the 6 and 12-hr time points in biotin-adequate LPS treated animals compared
to biotin-deficient LPS treated animals (Figure 4-7; P<0.001). By 24-hr, the relative
abundance of biotinylated ACC1 in biotin-deficient LPS treated animals had decreased to
biotin-adequate LPS treated animals.
Acetyl CoA carboxylase 2 was significantly decreased by 55% in biotin-deficient
saline treated animals at all time points compared to biotin-adequate saline treated
animals (P<0.001). LPS administration to biotin-adequate animals significantly
decreased the relative abundance of biotinylated ACC2 by 80% at all time points
compared to biotin-adequate saline treated animals (P<0.001). LPS administration to
biotin-deficient animals significantly decreased the relative abundance of biotinylated
ACC2 at the 12 and 24-hr time points compared to biotin-deficient saline treated animals
(50%, P<0.01, 12-hr; 68%, P<0.001, 24-hr). There was no significant difference in the
relative abundance of biotinylated ACC2 between biotin-adequate LPS treated and
biotin-deficient LPS treated groups (Figure 4-7).
Pyruvate carboxylase was significantly reduced in biotin-deficient compared to
biotin-adequate animals by 65% regardless of treatment or time after treatment
(P<0.001). The relative abundance of biotinylated PC was significantly decreased at the

61
LPS 6hr LPS 12hr LPS 24hr SAL 6hr SAL 12hr SAL 24hr
Deficient
0 6 12 18 240
10000
20000
30000LPS DeficientSAL DeficientLPS AdequateSAL Adequate
##
#*+
*+
*+
Time, hr
Fluo
resc
ent I
nten
sity
,ar
bitr
ary
units
Adequate
Statistical Key: * LPS Adequate significantly different than SAL Adequate, LPS Deficient significantly different than SAL Deficient,+ LPS Adequate significantly different than LPS Deficient, # SAL Adequate significantly different than SAL Deficient
Figure 4-8. Changes in the relative abundance of biotinylated PC in biotin-deficient and adequate rats after exposure to endotoxin.
6-hr time point in LPS treated animals compared to saline treated animals regardless of
diet (53% P<0.001, biotin-adequate; 38% P<0.05, biotin-deficient). At 12-hr,
biotinylated PC remained significantly decreased in biotin-adequate LPS treated animals
by 50% compared to biotin-adequate saline treated animals (P<0.001), while the relative
abundance of biotinylated PC in biotin-deficient LPS treated animals returned to biotin-
deficient saline animal levels at the 12 and 24-hr time points. At the 24-hr time point, the
relative abundance of biotinylated PC in biotin-adequate LPS treated animals was
significantly increased over biotin-adequate saline treated animals by 20% (P<0.001,
Figure 4-8).

62
SAL 6hr SAL 12hr SAL 24hr LPS 24hr LPS 12hr LPS 6hr
MCC PCC Deficient
0 6 12 18 240
10000
20000
30000
40000
50000LPS DeficientSAL DeficientLPS AdequateSAL Adequate
# # #
*+
*+
+
Time, hr
Fluo
resc
ent I
nten
sity
,ar
bitr
ary
units
Statistical Key: * LPS Adequate significantly different than SAL Adequate, LPS Deficient significantly different than SAL Deficient,+ LPS Adequate significantly different than LPS Deficient, # SAL Adequate significantly different than SAL Deficient
AdequateMCC PCC
Figure 4-9. Changes in the relative abundance of biotinylated MCC in biotin-deficient and adequate rats after endotoxin exposure.
MCC was significantly decreased in biotin-deficient saline treated animals by
50% at all time points compared to biotin-adequate saline treated animals (P<0.001).
LPS administration significantly increased the relative abundance of biotinylated MCC at
the 6 and 12-hr time points regardless of diet compared to saline treated animals (127%
6-hr adequate, 45% 12-hr adequate, 163% 6-hr deficient, 95% 12-hr deficient; P<0.001).
Interestingly, LPS treatment increased MCC levels in the biotin-deficient animals to the
same levels seen in biotin-adequate saline controls. By 24-hr, MCC levels in LPS treated
biotin-adequate animals had returned to the level of biotin-adequate saline treated
animals; however, biotin-deficient LPS treated animals were still significantly increased
by 51% at 24-hr versus biotin-deficient saline treated animals (P=0.02, Figure 4-9).

63
Relative abundance of biotinylated P61
Administration of LPS to rats increased the relative abundance of an unknown
biotinylated protein with an apparent molecular weight of 61 kDa. The relative
abundance of biotinylated P61 was significantly lower in saline treated biotin-deficient
compared to biotin-adequate rats at the 6-hr time point only (P=0.01). At 6, 12, and 24-
hr, the relative abundance of biotinylated P61 was significantly increased in LPS treated
animals versus saline treated animals regardless of diet (300%, 340%, 100% adequate 6,
12, and 24-hr; 700%, 530%, 200% deficient 6, 12, and 24-hr; P<0.001). P61 was
significantly increased in biotin-adequate LPS treated animals versus biotin-deficient
0 6 12 18 240
800000
1600000
2400000
3200000 LPS DeficientSAL DeficientLPS AdequateSAL Adequate
*+
*+
*+
#
Time, hr
Fluo
resc
ent I
nten
sity
,ar
bitr
ary
units
LPS 6hr LPS 12hr LPS 24hr SAL 24hr SAL 12hr SAL 6hr
P61
P61 Deficient
Adequate
Statistical Key: * LPS Adequate significantly different than SAL Adequate, LPS Deficient significantly different than SAL Deficient,+ LPS Adequate significantly different than LPS Deficient, # SAL Adequate significantly different than SAL Deficient
Figure 4-10. Changes in the relative abundance of biotinylated P61 in biotin-deficient and adequate rats after endotoxin exposure.

64
LPS treated animals at all time points (110% 6-hr, 96% 12-hr, 63% 24-hr; P<0.001)
(Figure 4-10).
PC and MCC Activity
PC activity, expressed as pmol oxaloacetate formed/min*mg protein, was
significantly reduced at all time points in biotin-deficient compared to biotin-adequate
animals by 60% regardless of treatment (P<0.001). There was no change in PC activity
in biotin-deficient or biotin-adequate animals with LPS administration at any time point
(P>0.05, Figure 4-11).
Pyruvate Carboxylase
0 6 12 18 240
2500
5000
7500
SAL DeficientLPS Deficient
SAL AdequateLPS Adequate
+#+# +#
Time, hr
activ
ity, p
mol
/min
*mg
Methylcrotonyl CoACarboxylase
0 6 12 18 240
500
1000
1500
+#+#
#
*+
Time, hr
activ
ity, p
mol
/min
*mg
Statistical Key: * LPS Adequate significantly different than SAL Adequate, LPS Deficient significantly different than SAL Deficient,+ LPS Adequate significantly different than LPS Deficient, # SAL Adequate significantly different than SAL Deficient
Figure 4-11. Changes in the activity of pyruvate carboxylase and methylcrotonyl CoA carboxylase in biotin-deficient and adequate rats after endotoxin exposure.
MCC activity, expressed as pmol methylglutaconyl CoA formed/min*mg protein,
was significantly reduced at all time points in biotin-deficient compared to biotin-
adequate animals by 80% regardless of treatment (P<0.001; Figure 4-11). In biotin-
adequate animals, MCC activity was significantly increased by 26% at only the 24-hr
time point in LPS treated animals compared to saline treated animals (P=0.01). There

65
was no difference in MCC activity with LPS treatment in biotin-deficient animals at any
time point (P>0.05, Figure 4-11).
Discussion
It is well established that biotin deficiency affects immunity (31,52,139,141,142).
However, very little is known on how biotin metabolism is changed during immune
stimulation. Recently, studies have shown that isolated PBMC’s stimulated with
mitogens increase their biotin uptake possibly to supply biotin for increased formation of
the holocarboxylases (140). This indicates that changes in biotin metabolism may occur,
but this has not been evaluated in vivo. In the present study, endotoxin was administered
to Sprague-Dawley rats in order to determine the in vivo effects of an acute inflammatory
response on the metabolism and function of biotin.
The animals in these studies were first acclimatized on purified AIN 76A based
diet with spray-dried egg-white as the sole protein source and 0.06 mg biotin/kg diet.
This level of biotin was chosen because it closely approximates the physiologic daily
intake of biotin for humans when adjusted to the amount per kg body weight, and has
been shown to be an adequate amount of biotin for rats over this time period (143).
Commercial rodent diet contains much higher amounts of biotin (~ 0.22 mg biotin/kg
diet). When adjusted to the amount per kg body weight intake, this is a supplemented
dose of biotin for humans, which may in itself affect biotin metabolism. After
acclimation, endotoxin was administered immediately in the dose-response experiment.
In the time and diet dependent study, the rats were first acclimatized on the
purified AIN 76A diet containing egg-white as the sole protein source and 0.06 mg
biotin/kg for 5 days. After acclimation, the rats consumed this same diet containing 0.06
mg biotin/kg diet or the same diet with no biotin for 3 weeks before endotoxin
66
administration. Serum Zn and glucose were measured to validate the efficacy of the
administration of LPS. It is well established that these parameters are decreased during
endotoxin exposure (83,144). At all doses of LPS, serum Zn was significantly reduced.
In biotin-adequate LPS injected animals, serum Zn was significantly decreased at all time
points. At 24-hr, serum Zn had recovered to 62% of saline levels. Serum Zn in biotin-
deficient rats treated with LPS was also significantly lower than biotin-deficient saline
treated rats; however, by 24-hr had only recovered to 44% of saline animals. Serum
glucose was significantly decreased in LPS treated rats at 12-hr only regardless of diet.
This explains why we saw no change in serum glucose in the dose response study at 6-hr.
The decreased recovery of serum Zn indicates that biotin-deficient rats may recover more
slowly than biotin-adequate animals; however, the same trend might be expected in
serum glucose, which does not occur.
Administration of varying doses of endotoxin decreased the relative abundance of
the biotinylated forms of ACC1 and ACC2 (Figures 4-3). ACC1 is a cytosolic enzyme
responsible for catalyzing the conversion of acetyl CoA to malonyl CoA during de novo
fatty acid synthesis (49). ACC2 is a mitochondrial membrane bound enzyme that also
catalyzes the conversion of acetyl CoA to malonyl CoA an inhibitor of the carnitine
palmitoyl CoA shuttle that transports long chain fatty acids into the mitochondria for β-
oxidation (9). The decreased relative abundance of the biotinylated form of ACC1 and
ACC2 may indicate that the liver is decreasing fatty acid synthesis and increasing fatty
acid β-oxidation. This detection method measures only the amount of ACC1 and 2 to
which biotin is covalently linked. It provides no information on the amount of total

67
ACC1 and 2 in the liver; however, an earlier study indicated that the biotin-dependent
carboxylases may be affected by endotoxin exposure.
In 1983, Pekala et al. used endotoxin to study how infection induced cachexia,
shock, and death. It was determined that an endotoxin induced product (now known to
be cytokines and other inflammatory mediators) secreted into culture supernatant by
stimulated macrophages could modify fatty acid metabolism in 3T3-L1 adipocytes.
When incubated with this endotoxin induced macrophage product, 3T3-L1 cells
suppressed ACC activity by 75% and ACC synthesis by 95% (82). These data indicate
that the normal response of biotin-adequate rats to endotoxin is to decrease fatty acid
synthesis and increase fatty acid β-oxidation. This normal adaptation may be perturbed
in biotin-deficient animals. In adequate animals, the reduction of biotinylated ACC1 and
2 with endotoxin exposure was detected as early as 6-hr after administration and
remained reduced through 24-hr. Biotin deficiency delayed this decrease until 24-hr in
ACC1 and 12-hr in ACC2 (Figure 4-7). This could reduce the ability of the deficient rat
to decrease fatty acid synthesis and increase β-oxidation possibly depriving the deficient
rats a valuable energy source during the inflammatory response.
The relative abundance of the biotinylated form of pyruvate carboxylase was
decreased with endotoxin exposure (Figures 4-4 and 4-8). These data in part, suggest a
possible mechanism for the decreased gluconeogenesis seen during endotoxin exposure
(83). Endotoxin is known to decrease gluconeogenesis from lactate, pyruvate, and
alanine in the livers of endotoxin-treated rats. Several enzymes in the gluconeogenic
pathway have been suggested as contributing to the inhibition of gluconeogenesis from
these substrates, in particular pyruvate carboxylase. Pyruvate carboxylase catalyzes the

68
conversion of pyruvate to oxaloacetate in gluconeogenesis as well as to replenish the
TCA cycle. Jones and Titheradge (83) provided evidence that pyruvate carboxylase is
inhibited during endotoxin-induced inflammation. In hepatocytes isolated from rats
injected with endotoxin, the flux of pyruvate through PC decreased 50%. They
concluded that the reduced flux may be due to feedback inhibition of PC by high levels of
oxaloacetate produced by the inhibition of PEPCK. However, our data indicate that the
reduced flux of PC may be due to a reduction in biotinylated PC, the only form capable
of carboxylating pyruvate to oxaloacetate.
In biotin-adequate animals, PC was reduced 50% at 6 and 12-hr after endotoxin
administration and had recovered to slightly above saline levels by 24-hr. PC was also
reduced in biotin-deficient animals at 6-hr but to a lesser degree (38%) and had recovered
to saline values by 12-hr. The relative abundance of PC in saline injected biotin-deficient
rats was reduced by 65% compared to saline injected biotin-adequate animals. This
follows the same trend seen in previous studies of deficient rats having 50% less
biotinylated PC than adequate rats when fed a biotin-deficient diet for 3 weeks (143).
This indicates that the anapleurotic reaction catalyzed by PC is already reduced in biotin-
deficient rats to levels lower than the reduction caused by endotoxin administration in
adequate rats. This may explain the ability of the LPS treated biotin-deficient rats to
quickly return to saline treated biotin-deficient rat levels. The reduction in biotinylated
PC in biotin-deficient LPS treated animals at 6-hr may be an initial reaction to LPS that
does not need to be sustained due to already reduced PC levels.
To determine if the decrease in the relative abundance of biotinylated PC during
an inflammatory response corresponded to a decrease in the ability to catalyze the
69
carboxylation of pyruvate to oxaloacetate, the activity of PC was measured. The activity
of PC in biotin-deficient rat liver was reduced 60% compared to biotin-adequate rats.
This value is comparable to the 65% reduction in biotinylated PC abundance seen in
biotin-deficient rats compared to biotin-adequate rats. While the abundance of
biotinylated PC decreased due to endotoxin administration, PC activity did not change.
This indicates that other factors influencing PC activity may be involved. This could
include the allosteric activation of PC from increasing levels of acetyl CoA from the
decreased activities of ACC1 and 2 seen during endotoxin exposure, or dilution effects of
PC (145,146).
The relative abundance of the biotinylated form of MCC significantly increased
with varying doses of endotoxin (Figures 4-5). MCC is involved in the degradation of
leucine by converting methylcrotonyl CoA to methylglutaconyl CoA (49). Our observed
increase in the relative abundance of biotinylated MCC could indicate that the liver may
also be increasing its degradation of leucine as seen in the muscle. Protein catabolism
occurs during endotoxin-induced inflammation to release branched-chain amino acids in
the muscle, which can be immediately used by muscle cells as a source of energy or to
generate amino nitrogen groups that are combined with pyruvate or other carbon sources
for the synthesis of alanine and glutamine (147). As a result, the amino acid composition
of muscle is altered. It has recently been demonstrated that leucine levels double in liver
perfusate of rats treated with endotoxin; however, it is still unknown if leucine
degradation is increased (148).
Consumption of a biotin deficient diet for 3 weeks decreased the abundance of
biotinylated MCC by 50% compared to biotin-adequate rats (Figure 4-9). This
70
corresponds with results presented in Chapter 3 showing decreased levels of biotinylated
MCC after consumption of a biotin deficient diet for 3 weeks (143). In biotin-adequate
rats, the relative abundance of biotinylated MCC was significantly increased by 127% in
endotoxin treated rats compared to saline treated rats at 6-hr. MCC levels began to
return to saline levels in endotoxin treated rats by 12-hr but were still elevated by 45%.
By 24-hr, MCC levels had returned to saline levels. Biotin deficiency did not prevent the
elevation of MCC with endotoxin exposure; however, this increase was only to biotin-
adequate saline treated levels. At 24-hr, MCC had not returned to saline levels in biotin-
deficient rats. These data may indicate that because of the reduced ability to increase
active levels of MCC, deficient rats require MCC levels to remain increased for longer
periods of time to cope with increased leucine loads.
To determine if the decrease in the relative abundance of biotinylated MCC
during an inflammatory response corresponded to a decrease in the ability to catalyze the
carboxylation of methylcrotonyl CoA to methylglutaconyl CoA, the activity of MCC was
measured. The activity of MCC in biotin-deficient rat liver was reduced 80% compared
to biotin-adequate rats. This value is consistent with a 50% reduction in biotinylated
MCC seen in biotin-deficient rats compared to biotin-adequate rats. Although
biotinylated MCC levels were increased at the 6 and 12-hr time points in LPS injected
biotin-adequate rats and had returned to saline levels by 24-hr, MCC activity was only
increased at the 24-hr time point. This indicates that there may be a delay between the
increase in active MCC and the concurrent increase in MCC activity. In contrast, MCC
activity did not increase at any time point measured in biotin-deficient rats. It can not be
ruled out that MCC activity may be increased at later time points in biotin-deficient rats.

71
In contrast to the other carboxylases, no change in the relative abundance of
biotinylated PCC was detected (Figure 4-5). Propionyl CoA carboxylase catalyzes the
conversion of propionyl CoA to methylmalonyl CoA during the degradation of odd-chain
fatty acids and the side chain of cholesterol, and the catabolism of isoleucine, methionine,
threonine, and valine (49). The fact that the relative abundance of biotinylated PCC did
not change during endotoxin exposure indicates that the changes in the relative
abundance of the biotinylated form of the other carboxylases is specific, not a general
change of all carboxylases due to endotoxin exposure.
Serum biotin increased with increasing doses of endotoxin (Figure 4-1A). This
effect is opposite that seen in serum Zn. This increase may be a result of the changes in
the biotinylated forms of the carboxylases seen in the liver of endotoxin-injected rats.
The decreases in the relative abundance of biotinylated ACC1 and 2, and PC could result
in an increase of liver free biotin that could then be released into the serum. However,
other possible explanations exist. Several tissues in the body are known to contain pools
of free biotin. LPS stimulation could cause a redistribution of these free biotin pools
from one or more organs to the serum. In this study, only the free pool of biotin in the
liver was measured. Liver free biotin increased significantly with LPS administration
and could provide a source of biotin for the serum (Figure 4-1B). Although the free pool
did change it could not be evaluated whether the flux of free biotin into or out of the liver
changed. Free biotin released from ACC1, ACC2, and PC, which showed decreases in
the relative abundance of their biotinylated forms, could explain the increase in free
biotin in the liver. The free biotin released from these proteins could have been used to
increase the relative abundance of MCC and P61. The liver free biotin could have been

72
released into the serum supplying free biotin for proliferating immune cells. Other
explanations include a reduction in urinary excretion of biotin or a reduction in the
conversion of serum biotin to its metabolites. Urinary excretion of biotin could not be
accurately measured in this study due to the severe alterations in the urine volume
excreted by the LPS treated animals. Normally this could be accounted for by adjusting
the measured value to the normally constant excretion of creatinine into the urine.
However, it is well known that LPS administration effects urinary creatinine excretion
(149) which was confirmed in our study. Finally, although highly variable between
animals, no changes were detected in the profile of biotin metabolites in the serum of
LPS treated animals, except BNB arguing against a reduction in biotin’s conversion to its
metabolites. Serum BNB increased significantly at the 10mg/kg dose possibly due to an
increased state of β-oxidation.
Endotoxin administration also increased the relative abundance of a previously
undescribed biotinylated protein with a molecular weight of 61 kDa (Figure 4-10). This
protein was increased in both biotin-deficient and adequate animals exposed to LPS;
however, biotin-adequate LPS injected animals had a significantly increased level of
biotinylated P61 compared to biotin-deficient LPS injected animals. The characterization
of this protein is described in the next chapter.
This study reports several novel observations of biotin metabolism during
endotoxin-induced inflammation. It is clear that changes in both free and protein-bound
pools of biotin are normal in the response to LPS-induced inflammation. What these
changes signify remains unknown. Are they a normal beneficial response of the body to
clear the inflammatory stimulus, or one of the many detrimental responses brought on by
73
the inflammatory stimulus that leads to the many derangements seen during sepsis?
Many times in sepsis, these two possibilities are one and the same with cytokines and
other inflammatory mediators released by the body to fight the infection eventually
overwhelming the body and causing damage and death. These studies also show that
biotin deficiency delays or decreases the changes in carboxylase abundance and activity
induced by endotoxin. It is well known that biotin deficiency impairs immune function.
However, the only indication of a decreased inflammatory response to endotoxin was a
slower recovery of serum Zn in biotin-deficient LPS rats. The biotin-deficient rats
showed no outward signs of increased sickness due to endotoxin exposure and their
serum glucose closely followed endotoxin exposed biotin-adequate animals. Further
research evaluating other immune parameters will be required to determine if biotin-
deficiency impairs recovery from endotoxin exposure.

CHAPTER 5 ISOLATION AND CHARACTERIZATION OF P61
Introduction
In Chapter 4, a previously undescribed protein with an apparent molecular weight
of ~55-61 kDa was visualized by avidin blot in liver homogenate of rats treated with
endotoxin. This protein is also present in liver homogenate from saline treated animals;
however, at a very light intensity previously thought to be background from nonspecific
binding of avidin. With endotoxin exposure, the intensity of this band increases 6-10
fold.
In animals, biotin is thought to be covalently bound only to the five biotin-
dependent carboxylases: ACC isoforms 1and 2, PC, MCC, and PCC. In bacteria, several
other proteins covalently attached to biotin have been described including
transcarboxylase, geranyl-CoA carboxylase, urea carboxylase, methylmalonyl-CoA
decarboxylase, and oxaloacetate decarboxylase (26). It is possible P61 is the mammalian
form of one of these bacterial proteins. In fact, when molecular weights of these bacterial
proteins are compared to P61, the α-chain of oxaloacetate decarboxylase stands out with
a molecular weight of 63.5 kDa.
Oxaloacetate decarboxylase from several bacterial species has been well
characterized (150-154). Oxaloacetate decarboxylase catalyzes the reaction of
oxaloacetate to pyruvate, which is coupled to the translocation of Na+. It contains an α,
β, and γ subunit. The α-subunit is a peripheral membrane protein containing both
carboxyltransferase activity and the biotin carrier function. The β-subunit is an integral
74

75
membrane protein that catalyzes the decarboxylation of carboxybiotin, which is coupled
to Na+ pumping. Finally, the Zn containing γ-subunit is thought to keep the complex
together and accelerate the carboxytransfer reaction.
In this chapter, we describe the characterization and isolation of P61. We first
determined if P61 was a membrane bound protein using differential centrifugation and
detergent extraction. We then isolated P61 using a monomeric avidin column capable of
reversibly binding biotin containing compounds. The isolated P61 was sent to Emory
University School of Medicine, Microchemical Facility (Atlanta, GA) for sequencing.
Materials and Methods
Localization of P61 by Differential Centrifugation
Animal treatment
Sprague Dawley rats (n=6) were acclimated on standard rodent diet for 5 days.
The rats were then injected with 5 mg LPS/kg BW in 0.9% saline (n=4) or 0.9% saline
only (n=2). After 6-hr, the animals were euthanized by cardiac puncture and 0.5 g liver
removed.
Differential centrifugation
The liver pieces were homogenized in 10 volumes ice-cold HEM (300 mmol/L
mannitol, 10 mmol/L HEPES (pH 7.2), 1 mmol/L EDTA, and 1:100 (v/v) protease
inhibitor cocktail) and processed by differential centrifugation as described below. An
aliquot of homogenate was saved for each animal at this point. The remainder was
centrifuged at 500 x g for 10 min to isolate a crude nuclear fraction. This fraction
contains primarily cellular debris, plasma membrane, and nuclei. The pellet was
resuspended in 2 ml HEM and the supernatant centrifuged at 3,000 x g for 10 min to
isolate a heavy mitochondrial fraction. The pellet was resuspended in 1 ml HEM and the

76
supernatant centrifuged at 17,000 x g for 15 min to isolate a light mitochondrial fraction.
The pellet was resuspended in 1 ml HEM and the supernatant centrifuged at 200,000 x g
to isolate both microsomal and cytosolic fractions. The cytosolic fraction was saved and
the microsomal pellet resuspended in 1 ml HEM. All samples were stored at –80oC until
analyzed.
Separation and detection of P61
Samples from each group were pooled and 100 µg of protein from each fraction
were separated on a 10% SDS-PAGE (pH 8.8) overnight. The gel was then transferred to
PVDF, probed with avidin-AP, and P61 detected with ECF on a fluorescent imager as
described in Chapter 2.
Inhibition of Detection of P61 after Competition with Free Biotin
Homogenate samples from each group in the differential centrifugation
experiment were pooled and 75 µg of protein were separated on a 10% SDS-PAGE (pH
8.8) overnight. The gel was then transferred to PVDF. Avidin-AP was then incubated in
0.5% NFDM-TBST, 1 µM biotin for 1-hr. The free biotin binds all free avidin-binding
sites so that only nonspecific interactions remain. The PVDF blot was then incubated
with the avidin-AP, NFDM-TBST, biotin mixture for 45 min and detected with ECF on a
fluorescent imager.
Solubilization of P61
Liver samples from LPS and saline treated animals were homogenized in 10
volumes of HEM. The homogenates were centrifuged at 200,000 x g for 30 min at 4oC.
The cytosolic fractions were saved and the pellets homogenized in HEM containing 1%
Triton X-100 or 2% SDS. The resuspended samples were incubated on ice for 20 min
77
and then centrifuged at 200,000 x g for 30 min at 4oC. The supernatant from each sample
was saved and the pellets resuspended in HEM without detergents. Each sample (80 µg
protein) was separated on a 10% SDS-PAGE, transferred to PVDF, probed with avidin-
AP, and detected with ECF on a fluorescent imager as described in Chapter 2.
Solubilization of Peripherally Bound Constituents of P61
A liver sample from a LPS treated animal was homogenized in 10 volumes HEM.
The homogenate was centrifuged at 17,000 x g for 15 min at 4oC. The pellets were
resuspended in HEM with and without 50 mM sodium carbonate (unadjusted pH). Each
sample (75 µg protein) was separated on a 10% SDS-PAGE, transferred to PVDF, probed
with avidin-AP, and detected with ECF on a fluorescent imager as described in Chapter
2.
P61 Isolation
Three rat livers removed from biotin-adequate animals euthanized 6-hr after LPS
administration in the LPS: Time-dependent and Dietary Status Experiments in Chapter 4
were homogenized together in 10 volumes (of combined weight) of phosphate buffer (20
mM KPi (pH 7.5), 0.5 M NaCl, 1 mM EDTA, 1:100 protease inhibitors). The sample
was centrifuged at 17,000 x g for 15 min at 4oC and the supernatant removed. The pellet
was resuspended in phosphate buffer containing 2% Triton X-100 and incubated on ice
for 30 min. The resuspended pellet was then centrifuged at 200,000 x g for 30 min at
4oC. The supernatant was collected and the pellet resuspended in phosphate buffer.
Streptomycin sulfate (3% wt/volume) was added to the supernatant to precipitate nucleic
acids and the sample centrifuged at 28,000 x g for 20 min at 4oC. The supernatant was
saved and the pellet resuspended in phosphate buffer. Ammonium sulfate was added to

78
the supernatant to 30% saturation and the sample centrifuged again at 28,000 x g for 20
min at 4oC. The precipitate was removed and resuspended in phosphate buffer and the
supernatant removed and biotin containing proteins isolated on a monomeric avidin
column as described in Chapter 2. Fractions eluted from the avidin column were
separated on a 10% SDS-PAGE and stained with coomassie blue for detection of P61.
The detected band was then sliced from the gel and sent to Emory University School of
Medicine, Microchemical Facility for sequencing. The Microchemical Facility first
attempted to perform N-terminal sequencing by Edman degradation; however, the protein
did not yield any sequence, as the amount of the sample was below the detection limit of
the instrument (~200 fmol). Mass spectrometry analysis (MALDI TOF) of the protein
was then attempted. The sample was concentrated four fold in an Amicon stirred cell
(Millipore, regenerated cellulose membrane, 10 kDa NMWCO) and separated by SDS-
PAGE as described in Chapter 2. The P61 band was excised from the gel and washed 3 x
5 min with 50% acetonitrile in 10 mM ammonium bicarbonate. The washed gel was then
dried for 30 min in a Speed-Vac, rehydrated in 10 mM ammonium bicarbonate
containing 0.25 µg trypsin, and digested overnight at 37oC. The reaction was stopped by
the addition of 1.5 µl 10% TFA. Peptides were extracted from the gel by vortexing the
gel in 60% acetonitrile/10 mM ammonium bicarbonate, and the supernatant concentrated
in the Speed-Vac to 10 µl. The sample was then drawn into a C18 Zip tip. The Zip tip
was washed three times with 0.1% TFA and the sample eluted with 70:30
acetonitrile:0.1% TFA. The eluent was mixed with α-cyano-4-hydroxycinnamic acid
matrix and spotted onto a sample plate for MALDI TOF analysis. The sample was then
analyzed by MALDI TOF in positive reflector mode.

79
Results
Localization of P61 by Differential Centrifugation
P61 was subjected to differential centrifugation in order to characterize its
distribution within the liver cell. P61 was detected in the nuclear, heavy mitochondrial,
and light mitochondrial fractions. This indicates that P61 is either an integral or
peripherally bound membrane protein (Figure 5-1).
Competitive Inhibition of the Detection of P61
The possibility exists that P61 is not a biotinylated protein but a protein detected
through nonspecific interactions with avidin. To determine if P61 is a biotinylated
protein, P61 was detected using avidin as well as avidin that had been preincubated with
1 µM biotin. P61 was detected only when avidin alone was used. Avidin preincubated
with biotin eliminated the detection of P61 indicating the specific nature of avidin
binding to P61 (Figure 5-2).
P61
Hom
Nuc
HM
F
Mic
C
yt
LMF
Hom
Nuc
HM
F
Mic
Cyt
LMF
Saline LPS
Figure 5-1. Differential centrifugation and detection of P61 in saline and LPS treated rats. Hom: Homogenate, Nuc: Nuclear fraction, HMF: Heavy mitochondrial fraction, LMF: Light mitochondrial fraction, Mic: Microsomes, Cyt: Cytosol.

80
Solubilization of P61
Many times membrane bound proteins can be solubilized using detergents. P61
could be solubilized using 1% Triton X-100 or 2% SDS. While P61 was solubilized by
SDS, Triton X-100 seemed to be the better choice (Figure 5-3).
Saline LPS Saline LPS
P61
Avidin Avidin + Biotin
Figure 5-2. Detection of P61 and its competition by the incubation of biotin with avidin.
Solubilization of Peripherally Bound Constituents of P61
In oxaloacetate decarboxylase, the α-chain of the complex contains biotin
covalently attached to the biotinylation motif. The α-chain is considered a peripherally
bound membrane protein attached to the integral membrane β and γ-chains through ionic
P61
Sal T
riton
supe
rnat
ant
LPS
Trito
n su
pern
atan
t
Sal C
yt
LPS
Cyt
Sal M
ic
LPS
Mic
LPS
SDS
supe
rnat
ant
Sal S
DS
supe
rnat
ant
Figure 5-3. Solubilization of P61 using 1% Triton X-100 or 2% SDS.

81
interactions. If P61 is a peripherally attached membrane protein, incubation of the
membrane pellet with high salt concentrations should disrupt these ionic interactions
releasing P61 into the supernatant. Figure 5-4 shows that P61 is only detectable in liver
homogenate from rats treated with LPS. When this homogenate is centrifuged at
17,000 x g, P61 is found in the membrane pellet and not the supernatant. If the
membrane pellet is resuspended in HEM and centrifuged at 200,000 x g, P61 is still
found only in the membrane pellet. If resuspended in 50 mM Na2CO3 and centrifuged at
200,000 x g, P61 was released from the membrane pellet to the supernatant. This
indicates that P61 is a peripherally attached membrane protein.
LPS
200K
x g
N
a 2C
O3 s
uper
nata
nt
LPS
17K
x g
pel
let
LPS
200K
x g
H
EM su
pern
atan
t
LPS
200K
x g
N
a 2C
O3 p
elle
t
LPS
200K
x g
H
EM p
elle
t
LPS
17K
x g
su
pern
atan
t
LPS
Hom
Sal H
om
P61
Figure 5-4. Solubilization of P61 using 50 mM sodium carbonate.
Isolation of P61
The characterization of P61 as a biotin containing protein allows the use of the
binding characteristics of a monomeric avidin column for isolation. In contrast to
tetrameric avidin, monomeric avidin has a reduced affinity for biotin allowing for the
release of bound biotinylated proteins using gentle nondenaturing conditions. Solubilized
P61 resolved on a monomeric avidin column eluted in fractions B2 and R2 as shown in
Figure 5-5.
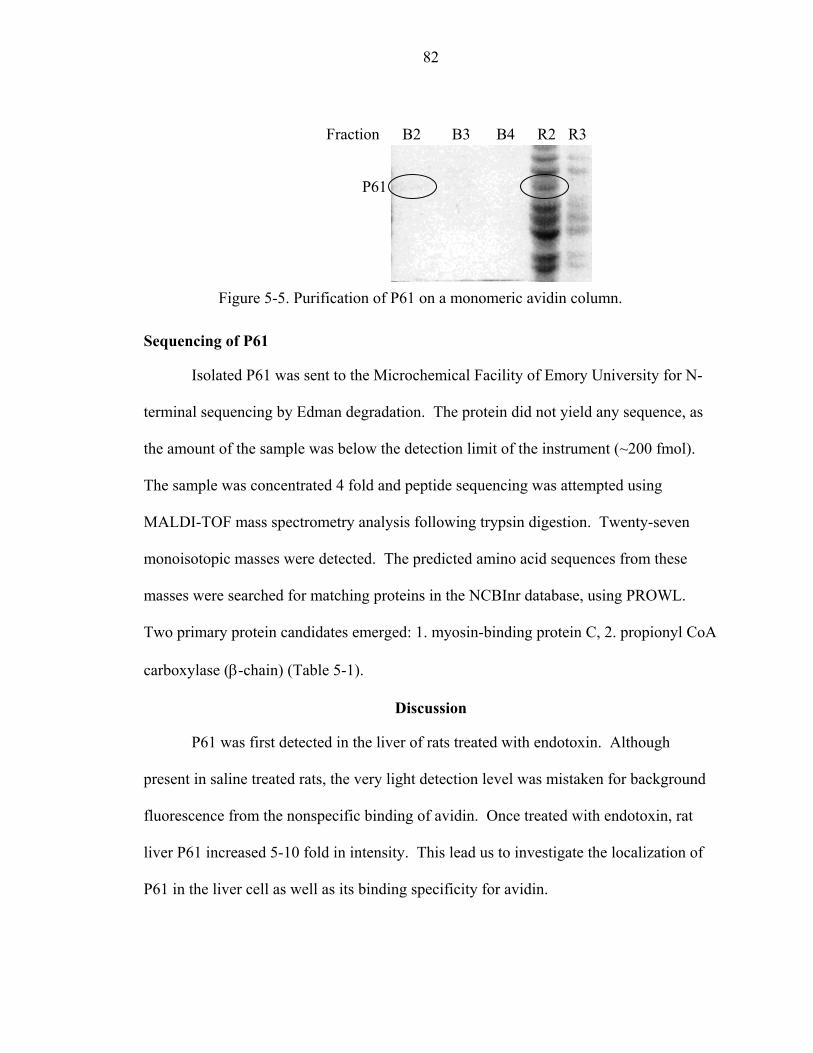
82
Fraction B2 B3 B4 R2 R3
P61
Figure 5-5. Purification of P61 on a monomeric avidin column.
Sequencing of P61
Isolated P61 was sent to the Microchemical Facility of Emory University for N-
terminal sequencing by Edman degradation. The protein did not yield any sequence, as
the amount of the sample was below the detection limit of the instrument (~200 fmol).
The sample was concentrated 4 fold and peptide sequencing was attempted using
MALDI-TOF mass spectrometry analysis following trypsin digestion. Twenty-seven
monoisotopic masses were detected. The predicted amino acid sequences from these
masses were searched for matching proteins in the NCBInr database, using PROWL.
Two primary protein candidates emerged: 1. myosin-binding protein C, 2. propionyl CoA
carboxylase (β-chain) (Table 5-1).
Discussion
P61 was first detected in the liver of rats treated with endotoxin. Although
present in saline treated rats, the very light detection level was mistaken for background
fluorescence from the nonspecific binding of avidin. Once treated with endotoxin, rat
liver P61 increased 5-10 fold in intensity. This lead us to investigate the localization of
P61 in the liver cell as well as its binding specificity for avidin.
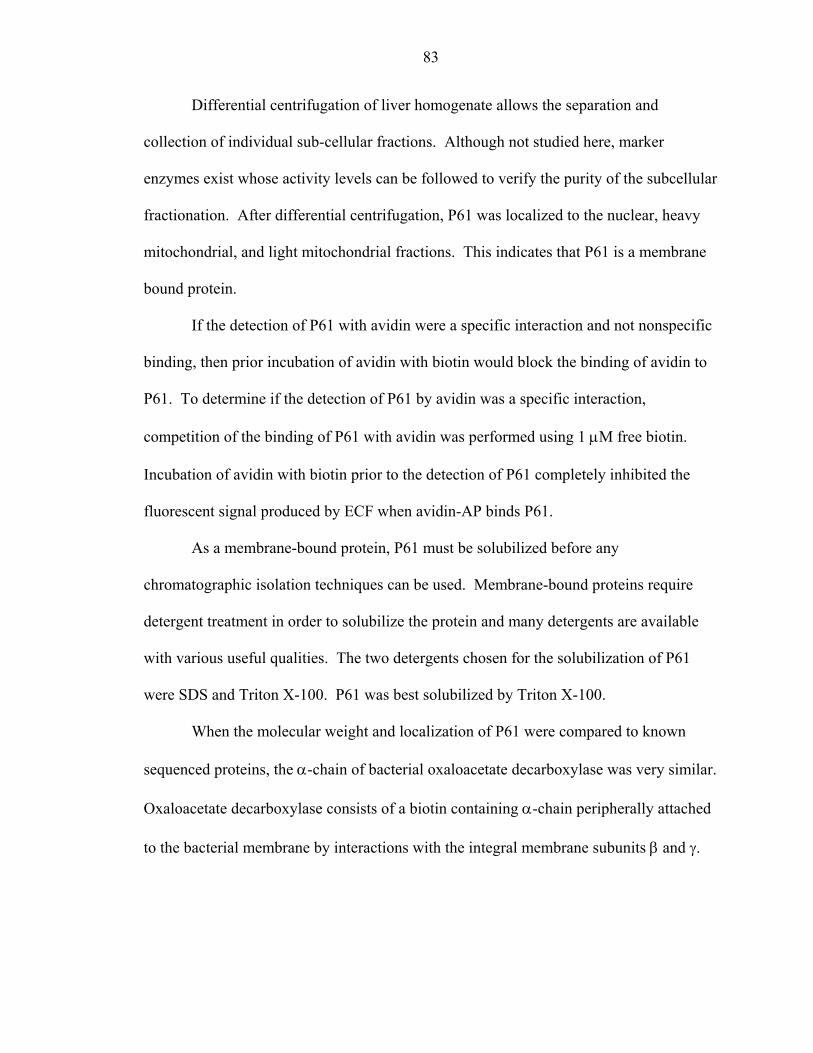
83
Differential centrifugation of liver homogenate allows the separation and
collection of individual sub-cellular fractions. Although not studied here, marker
enzymes exist whose activity levels can be followed to verify the purity of the subcellular
fractionation. After differential centrifugation, P61 was localized to the nuclear, heavy
mitochondrial, and light mitochondrial fractions. This indicates that P61 is a membrane
bound protein.
If the detection of P61 with avidin were a specific interaction and not nonspecific
binding, then prior incubation of avidin with biotin would block the binding of avidin to
P61. To determine if the detection of P61 by avidin was a specific interaction,
competition of the binding of P61 with avidin was performed using 1 µM free biotin.
Incubation of avidin with biotin prior to the detection of P61 completely inhibited the
fluorescent signal produced by ECF when avidin-AP binds P61.
As a membrane-bound protein, P61 must be solubilized before any
chromatographic isolation techniques can be used. Membrane-bound proteins require
detergent treatment in order to solubilize the protein and many detergents are available
with various useful qualities. The two detergents chosen for the solubilization of P61
were SDS and Triton X-100. P61 was best solubilized by Triton X-100.
When the molecular weight and localization of P61 were compared to known
sequenced proteins, the α-chain of bacterial oxaloacetate decarboxylase was very similar.
Oxaloacetate decarboxylase consists of a biotin containing α-chain peripherally attached
to the bacterial membrane by interactions with the integral membrane subunits β and γ.

84
Table 5-1. P61 Monoisotopic Masses Determined by MALDI-TOF Rat Myosin-Binding Protein C
Measured Mass Computed Mass Peptide Sequence 888.502 888.51 LGKEVCLK
1088.542 1088.575 AIMEGSGRIR 1110.492 1110.603 EEIVPGPKSR 1513.722 1513.871 ITTPLTDQTVKLGK 1703.782 1703.787 SMEWFAVIEHYHR 1779.852 1779.863 DDGNAAITGYTIQKADK 1850.912 1850.889 AESYPDSSTLVIDVAER
Unmatched Masses 1157.580, 1197.550, 1357.640, 1383.690, 1465.790, 1536.720, 1541.660, 1548.660 1561.720, 1568.820, 1601.860, 1673.790, 1735.820, 1772.930, 1830.960, 1880.970 1965.030, 2005.000, 2115.990, 2155.090 Mouse Propionyl CoA Carboxylase (beta chain)
Measured Mass Computed Mass Peptide Sequence 1088.542 1088.576 FANPFPAAVR 1464.782 1464.666 AFDNDVDALCNLR 1567.812 1567.813 DTSYLFITGPEVVK 1672.782 1672.768 GHQDVEAAQAEYVEK 1771.922 1771.892 AYNMLDIIHAVIDER 1879.962 1879.967 IQEGVESLAGYADIFLR 2154.082 2154.109 IMDQAITVGAPVIGLNDSGGAR
Unmatched Masses 889.510, 1111.500, 1157.580, 1197.550, 1357.640, 1383.690, 1514.730, 1536.720 1541.660, 1548.660, 1561.720, 1601.860, 1704.790, 1735.820, 1780.860, 1830.960 1851.920, 1965.030, 2005.000, 2115.990
Ionic interactions between subunits are the primary forces involved with keeping
peripherally attached membrane proteins in contact with the membrane and other protein
subunits. In most cases, these interactions can be disrupted by high salt concentrations or
alterations of pH. To determine if P61 was a peripherally attached membrane protein,
solubilization of P61 with 50 mM Na2CO3 was used. This technique uses the high salt
concentration and high pH to disrupt any ionic interactions that may be holding P61 to
the membrane. Resuspension of the 17,000 x g pellet of liver homogenate in 50 mM
Na2CO3 followed by centrifugation at 200,000 x g successfully interrupted ionic
interactions connecting P61 to the membrane fraction allowing its solubilization into the

85
200,000 x g supernatant. This provided further evidence that P61 may be the mammalian
form of bacterial oxaloacetate decarboxylase α-chain.
Definitive evidence that P61 is the mammalian form of the α-chain of
oxaloacetate decarboxylase would come from comparison of sequence of the two
proteins. Several bacterial species of oxaloacetate decarboxylase have been sequenced;
however, P61 must be isolated from the liver before sequence can be obtained. All biotin
containing proteins solubilized by Na2CO3 were first isolated by affinity chromatography
using immobilized monomeric avidin. The reduced binding affinity of monomeric avidin
compared to tetrameric avidin allows for the reversible binding of biotinylated proteins
and polypeptides. Once biotin-containing proteins were isolated using the monomeric
avidin column, the fractions containing the eluted biotinylated proteins were further
separated by SDS-PAGE. The molecular weight of P61 is less than the other biotin
containing proteins allowing the discrete isolation of P61 for sequencing.
Peptide sequencing of isolated P61 produced 27 monoisotopic masses. When
these masses were searched in the NCBInr database using PROWL, no confidant matches
could be made. Only 8 of the 27 masses matched any previously sequenced protein. The
top three matches were: 1. myosin-binding protein C, 2. propionyl CoA carboxylase (β-
chain), and 3. phosphatidylinositol phosphate kinase. Of these, myosin-binding protein
and phosphatidylinositol phosphate kinase can be dismissed due to discrepancies in
molecular weight of these proteins compared to P61 (68 and 47 kDa respectively).
Propionyl CoA carboxylase (β-chain) has a similar molecular weight (58 kDa) to
P61; however, the complete sequence of both α and β-chains of PCC have been
determined revealing that the α-chain is the only portion of PCC that contains the
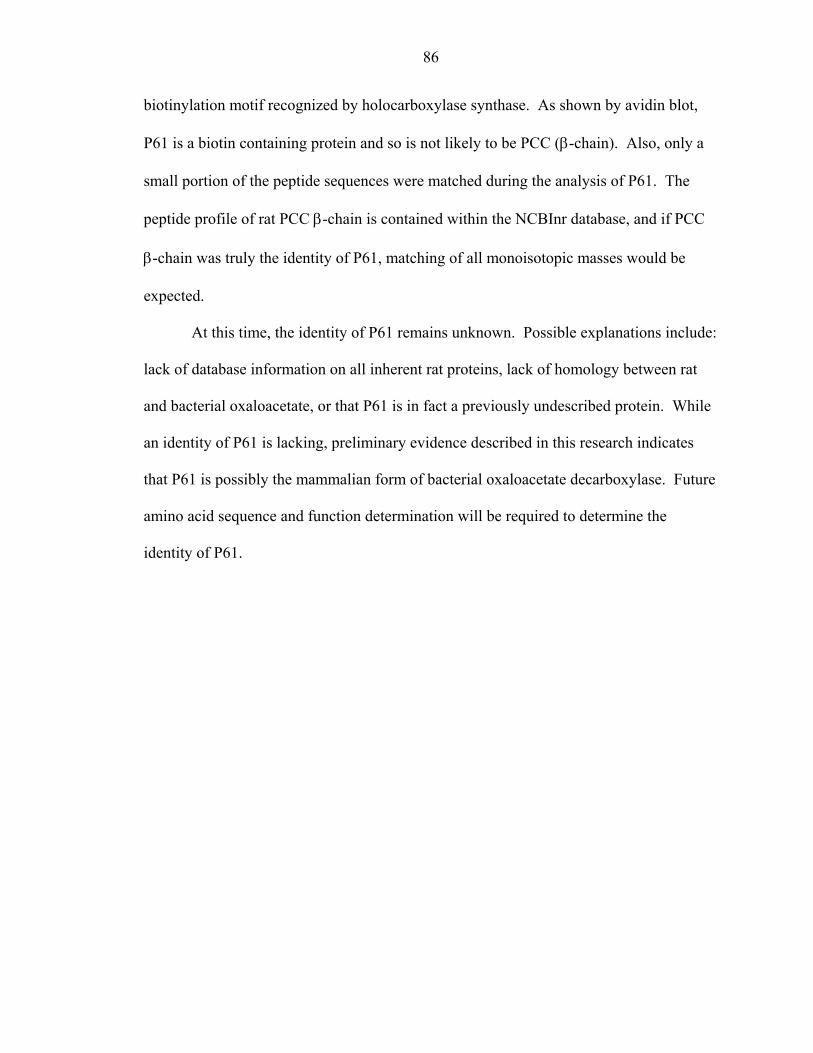
86
biotinylation motif recognized by holocarboxylase synthase. As shown by avidin blot,
P61 is a biotin containing protein and so is not likely to be PCC (β-chain). Also, only a
small portion of the peptide sequences were matched during the analysis of P61. The
peptide profile of rat PCC β-chain is contained within the NCBInr database, and if PCC
β-chain was truly the identity of P61, matching of all monoisotopic masses would be
expected.
At this time, the identity of P61 remains unknown. Possible explanations include:
lack of database information on all inherent rat proteins, lack of homology between rat
and bacterial oxaloacetate, or that P61 is in fact a previously undescribed protein. While
an identity of P61 is lacking, preliminary evidence described in this research indicates
that P61 is possibly the mammalian form of bacterial oxaloacetate decarboxylase. Future
amino acid sequence and function determination will be required to determine the
identity of P61.

CHAPTER 6 SUMMARY
As a cofactor for the biotin-dependent carboxylases, the importance of biotin in
intermediary metabolism is indisputable; however, it is debatable whether concern of
biotin deficiency in the general public is warranted. In advanced societies, a frank biotin
deficiency is unheard of unless caused by the consumption of a large quantity of egg-
whites or the placement of a patient with short bowel syndrome on unsupplemented total
parenteral nutrition. Even disorders of biotin metabolism such as biotinidase deficiency
and single or multiple carboxylase deficiencies are rare. However, with the advancement
of analytical techniques of biotin measurement, new evidence indicates even a marginal
biotin deficiency with no outward signs of deficiency may have metabolic consequences.
In animals, a marginal biotin deficiency can have devastating effects on the fetus
(45,46). Marginally biotin deficient hens produce chicks with higher mortality rates,
reduced hatchability, parrot beak deformity, perosis, micromelia, and syndactyly. Fetal
malformations in marginally biotin deficient hamsters and rats are similar including cleft
palate, micrognathia, and micromelia. Recently, evidence has emerged indicating an
increased biotin requirement and a marginal biotin deficiency during human pregnancy as
shown by increased urinary excretion of 3-HIA and decreased excretion of urinary biotin
and bisnorbiotin (44).
Outside of gestation, few deficiency studies have looked at a marginal deficiency.
Measurements of biotin metabolism have normally occurred after several weeks of avidin
induced biotin deficiency and outward signs of frank biotin deficiency have emerged. In
87

88
Chapter 3, we sought to add to the current body of literature by inducing a marginal
biotin deficiency in male Sprague Dawley rats and comparing levels of free and protein-
bound biotin to those of biotin-adequate, supplemented, and pharmacologically
supplemented rats. Plasma, urine, and liver free biotin as well as liver protein-bound
biotin were significantly reduced in rats fed an egg-white based AIN 76A biotin deficient
diet compared to rats fed the same diet but with adequate, supplemented, or
pharmacologically supplemented levels of biotin. This suggests that the lack of
physiologic manifestations of frank biotin deficiency may not be a reliable measure by
which to gauge biotin status.
Previous studies of biotin metabolism have used a purified diet with spray-dried
egg-white as the sole protein source and a free biotin level of 0.6 mg biotin/kg diet
(72,73,109). At this level of supplementation, the rat consumes 900 ng biotin/day, which
is equivalent to a 70 kg human consuming 4.2 mg/day. This level of consumption is
highly supplemented when compared to the ESADDI of 30-100 µg/day. In this study we
compared a more relevant dietary intake of 0.06 mg biotin/kg diet to the previously used
intake of 0.6 mg biotin/kg diet as well as to a pharmacologically supplemented level of
100 mg biotin/kg diet. Only plasma free biotin and the relative abundance of liver ACC2
were significantly lower in rats consuming 0.06 mg biotin/kg diet than in supplemented
rats consuming 0.6 mg biotin/kg diet. Since urinary excretion was not reduced and
ACC1, PC, MCC, and PCC were fully biotinylated, it was concluded that 0.06 mg
biotin/kg diet was an adequate amount of biotin for Sprague-Dawley rats over the three
week time period. We also saw no indication of toxicity in rats consuming 100 mg
biotin/kg body weight over this time period.

89
The importance of biotin in normal immune function is well documented. Biotin
deficiency leads to reduced antibody production, immunological reactivity, T and B-cell
differentiation, and cytotoxic T-cell response (30,52,132,133). Recently, the uptake and
metabolism of biotin during mitogen stimulation was investigated to determine the effect
of an immune response on biotin metabolism in vitro. Mitogen stimulation resulted in a
substantial increase in biotin uptake into proliferating lymphocytes through an increase in
biotin transporters per cell with evidence suggesting that this increase is to support
biotinylation of biotin-dependent carboxylases (96,115). Chapter 4 sought to extend the
literature by measuring biotin metabolism in vivo during an immune response triggered
by the administration of endotoxin to rats.
In biotin-adequate animals (Figure 6-1), endotoxin administration significantly
reduced the relative abundance of biotinylated liver ACC1, ACC2, and PC while
significantly increasing biotinylated MCC and P61. A reduction in these carboxylases
provides possible mechanisms by which the body controls fatty acid synthesis, fatty acid
β-oxidation, and gluconeogenesis. Acetyl CoA carboxylase 1 and 2 in the liver would
indicate a mechanism by which the body is able to reduce fatty acid synthesis and
increase fatty acid β-oxidation, a known occurrence during endotoxin exposure. The
decrease in biotinylated PC would further corroborate evidence for decreased
gluconeogenesis during endotoxin exposure. Leucine levels are known to increase in the
liver during endotoxin exposure and the increase in MCC, the biotin-dependent
carboxylase involved in leucine degradation, may occur to help remove the extra leucine.
The significance of the increase in P61, a previously undescribed biotinylated protein,

90
remains unknown at this time but reinforces the fact that other functions of biotin in the
body remain undiscovered.
We were also able to compare the normal response of biotin metabolism to that of
biotin-deficient animals exposed to endotoxin (Figure 6-2). For the majority of the
carboxylases, the response to endotoxin was blunted or delayed compared to biotin-
adequate animals. What this means to recovery of the animal from endotoxin exposure
remains unknown; however, data from serum Zn levels from biotin-deficient rats indicate
an impaired immune response. Other indicators of immune response should be measured
to determine how biotin-deficiency impairs the body’s response to endotoxin.
Of particular interest was the appearance of a novel biotinylated protein (P61) in
liver from rats exposed to endotoxin. In Chapter 5, we sought to characterize this novel
protein through sub-cellular localization, specificity to avidin detection, definition of
membrane interactions, and finally sequencing of the protein. Through these
experiments, P61 was localized to the nuclear and mitochondrial membrane fractions. It
was determined to specifically bind avidin as shown by competition of the detection of
P61 when avidin was preincubated with free biotin. P61 was also determined to be a
peripherally attached membrane protein due to the ability of high ionic strength and pH to
solubilize this protein. Although isolated, no confident matches of P61 could be made to
existing proteins in the NCBInr database. Amino acid sequence will be required to
obtain a true identity of P61.
These data reinforce the importance of biotin in intermediary metabolism and
immune function. They also agree with old and new findings showing how biotin may
have functions other than as the cofactor for the biotin-dependent carboxylases. This
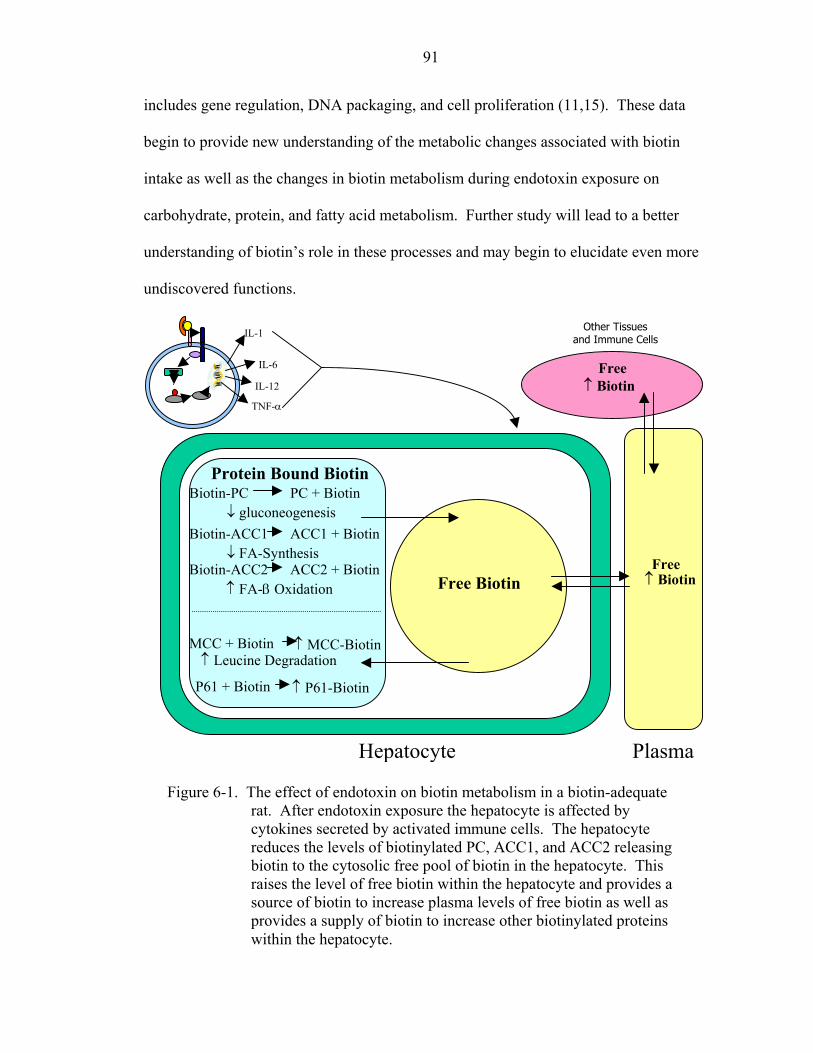
91
includes gene regulation, DNA packaging, and cell proliferation (11,15). These data
begin to provide new understanding of the metabolic changes associated with biotin
intake as well as the changes in biotin metabolism during endotoxin exposure on
carbohydrate, protein, and fatty acid metabolism. Further study will lead to a better
understanding of biotin’s role in these processes and may begin to elucidate even more
undiscovered functions.
P61 + Biotin
↓ gluconeogenesis
↑ P61-Biotin
Free Biotin
Free ↑ Biotin
Other Tissues and Immune Cells
TNF-α
IL-12
IL-6
IL-1
Free ↑ Biotin
↑ FA-β OxidationACC2 + Biotin
↓ FA-Synthesis Biotin-ACC2
ACC1 + BiotinBiotin-ACC1
Biotin-PC PC + BiotinProtein Bound Biotin
MCC + Biotin ↑ MCC-Biotin↑ Leucine Degradation
Hepatocyte Plasma Figure 6-1. The effect of endotoxin on biotin metabolism in a biotin-adequate
rat. After endotoxin exposure the hepatocyte is affected by cytokines secreted by activated immune cells. The hepatocyte reduces the levels of biotinylated PC, ACC1, and ACC2 releasing biotin to the cytosolic free pool of biotin in the hepatocyte. This raises the level of free biotin within the hepatocyte and provides a source of biotin to increase plasma levels of free biotin as well as provides a supply of biotin to increase other biotinylated proteins within the hepatocyte.
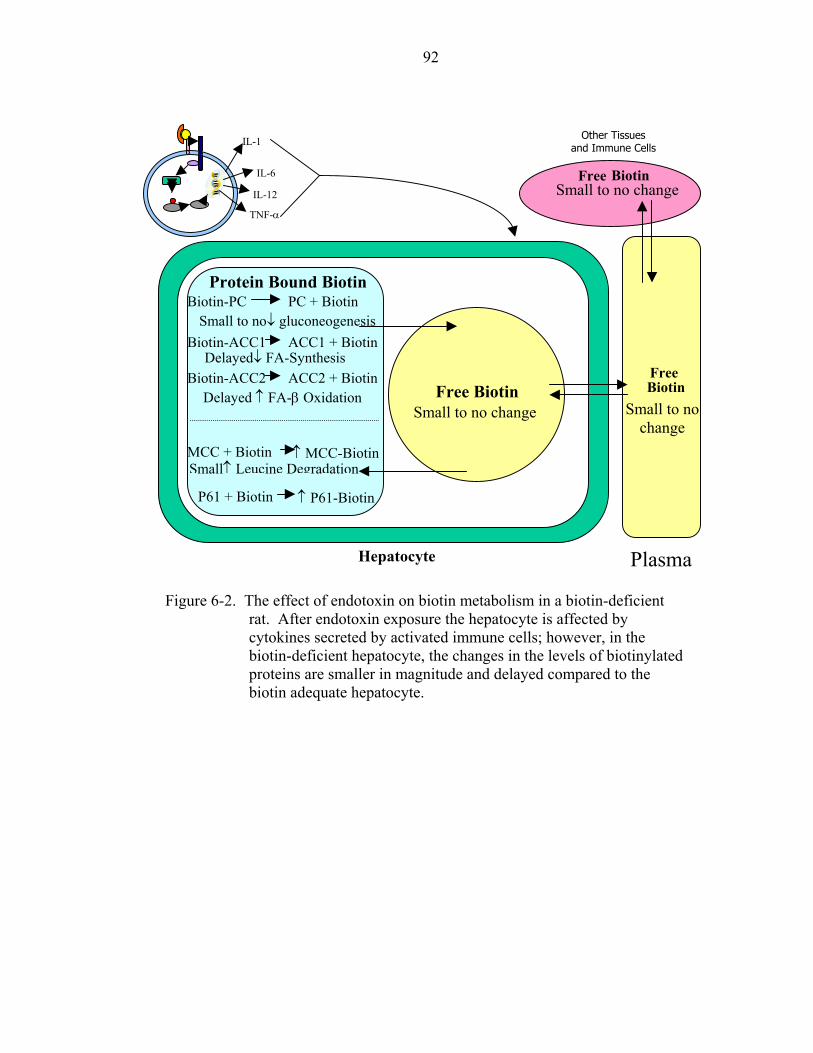
92
Delayed ↑ FA-β Oxidation Biotin-ACC2
↑ P61-BiotinP61 + Biotin
Small to no↓ gluconeogenesis
Small to no change
Small to no changeFree Biotin
Free Biotin Small to no change
ACC2 + Biotin
ACC1 + BiotinBiotin-ACC1 Delayed↓ FA-Synthesis
Biotin-PC PC + BiotinProtein Bound Biotin
MCC + Biotin ↑ MCC-BiotinSmall↑ Leucine Degradation
Free Biotin
Other Tissues and Immune Cells
TNF-α
IL-12
IL-6
IL-1
Plasma Hepatocyte
Figure 6-2. The effect of endotoxin on biotin metabolism in a biotin-deficient rat. After endotoxin exposure the hepatocyte is affected by cytokines secreted by activated immune cells; however, in the biotin-deficient hepatocyte, the changes in the levels of biotinylated proteins are smaller in magnitude and delayed compared to the biotin adequate hepatocyte.
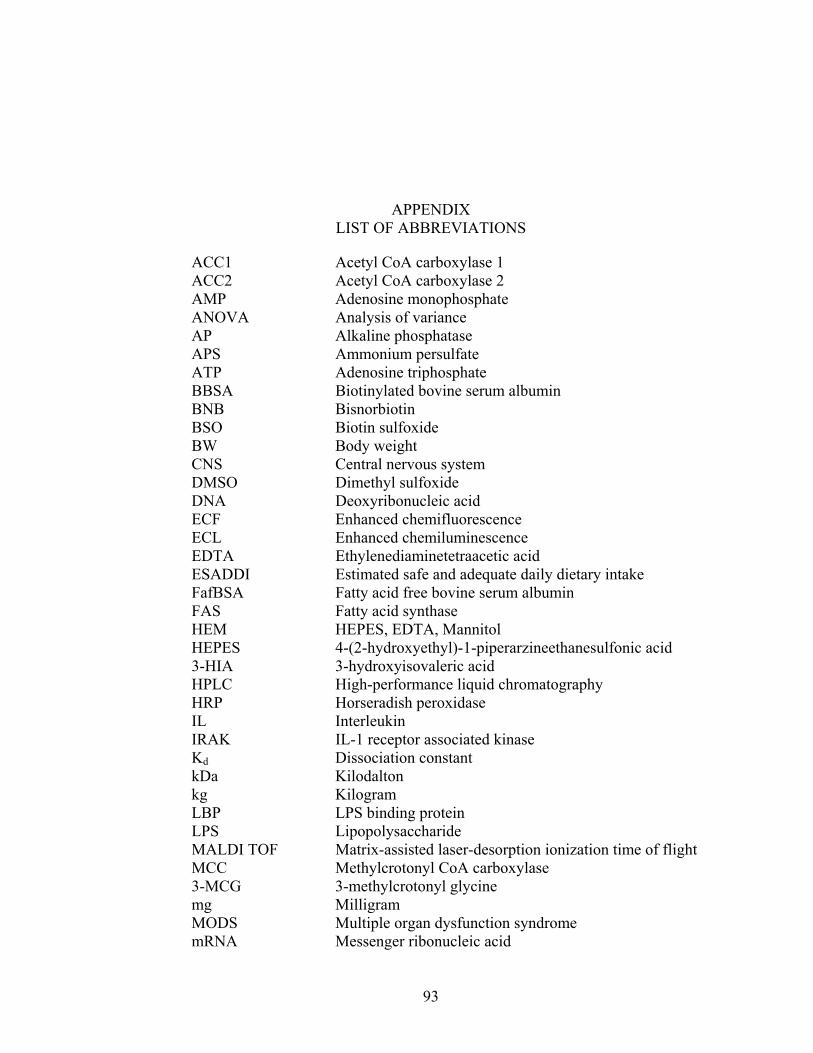
APPENDIX
LIST OF ABBREVIATIONS
ACC1 Acetyl CoA carboxylase 1 ACC2 Acetyl CoA carboxylase 2 AMP Adenosine monophosphate ANOVA Analysis of variance AP Alkaline phosphatase APS Ammonium persulfate ATP Adenosine triphosphate BBSA Biotinylated bovine serum albumin BNB Bisnorbiotin BSO Biotin sulfoxide BW Body weight CNS Central nervous system DMSO Dimethyl sulfoxide DNA Deoxyribonucleic acid ECF Enhanced chemifluorescence ECL Enhanced chemiluminescence EDTA Ethylenediaminetetraacetic acid ESADDI Estimated safe and adequate daily dietary intake FafBSA Fatty acid free bovine serum albumin FAS Fatty acid synthase HEM HEPES, EDTA, Mannitol HEPES 4-(2-hydroxyethyl)-1-piperarzineethanesulfonic acid 3-HIA 3-hydroxyisovaleric acid HPLC High-performance liquid chromatography HRP Horseradish peroxidase IL Interleukin IRAK IL-1 receptor associated kinase Kd Dissociation constant kDa Kilodalton kg Kilogram LBP LPS binding protein LPS Lipopolysaccharide MALDI TOF Matrix-assisted laser-desorption ionization time of flight MCC Methylcrotonyl CoA carboxylase 3-MCG 3-methylcrotonyl glycine mg Milligram MODS Multiple organ dysfunction syndrome mRNA Messenger ribonucleic acid
93

94
NFDM Nonfat dry milk NHS-biotin N-hydroxysuccinimide ester NMWCO Nominal molecular weight cut off PBMC Peripheral blood mononuclear cells PBS Phosphate buffered saline PC Pyruvate carboxylase PCC Propionyl CoA carboxylase PEPCK Phosphoenolpyruvate carboxykinase PGE2 Prostaglandin E2 PVDF Polyvinylidene fluoride SAL Saline SDS Sodium dodecyl sulfate SDS-PAGE SDS-Polyacrylamide gel electrophoresis TBST Tris buffered saline, tween 20 TCA Trichloroacetic acid TEMED N,N,N’,N’-Tetramethylethylenediamine TFA Trifluoroacetic acid TLR Toll-like receptor TNF Tumor necrosis factor TRAF6 TNF receptor associated factor 6

LIST OF REFERENCES
1. Bonjour, J. P. (1991) Biotin. In: Handbook of Vitamins, 2nd ed. (Machlin, L. J., ed.), pp. 393-427. Marcel Dekker, New York.
2. Scheiner, J. (1984) Biotin. In: Methods of Vitamin Assay, 4 ed. (Augustin, J., Klein, B., Becker, D. & Venugopal, P., eds.), pp. 535-553. John Wiley & Sons, New York.
3. Lopez-Casillas, F., Bai, D. H., Luo, X. C., Kong, I. S., Hermodson, M. A. & Kim, K. H. (1988) Structure of the coding sequence and primary amino acid sequence of acetyl-coenzyme A carboxylase. Proc Natl Acad Sci U S A 85: 5784-5788.
4. Bianchi, A., Evans, J. L., Iverson, A. J., Nordlund, A. C., Watts, T. D. & Witters, L. A. (1990) Identification of an isozymic form of acetyl-CoA carboxylase. J Biol Chem 265: 1502-1509.
5. Lehn, D. A., Moran, S. M. & MacDonald, M. J. (1995) The sequence of the rat pyruvate carboxylase-encoding cDNA. Gene 165: 331-332.
6. Browner, M. F., Taroni, F., Sztul, E. & Rosenberg, L. E. (1989) Sequence analysis, biogenesis, and mitochondrial import of the alpha- subunit of rat liver propionyl-CoA carboxylase [published erratum appears in J Biol Chem 1991 Mar 5;266(7):4660]. J Biol Chem 264: 12680-12685.
7. Chapman-Smith, A. & Cronan, J. E., Jr. (1999) In vivo enzymatic protein biotinylation. Biomol Eng 16: 119-125.
8. Streyer, L. (1995) Biochemistry. W. H. Freeman, New York.
9. Abu-Elheiga, L., Brinkley, W. R., Zhong, L., Chirala, S. S., Woldegiorgis, G. & Wakil, S. J. (2000) The subcellular localization of acetyl-CoA carboxylase 2. Proc Natl Acad Sci U S A 97: 1444-1449.
10. Wolf, B., Heard, G. S., McVoy, J. R. & Raetz, H. M. (1984) Biotinidase deficiency: the possible role of biotinidase in the processing of dietary protein-bound biotin. J Inherit Metab Dis 7: 121-122.
11. Dakshinamurti, K. & Cheah-Tan, C. (1968) Liver glucokinase of the biotin deficient rat. Can J Biochem 46: 75-80.
95

96
12. Chauhan, J. & Dakshinamurti, K. (1991) Transcriptional regulation of the glucokinase gene by biotin in starved rats. J Biol Chem 266: 10035-10038.
13. Rodriguez-Melendez, R., Cano, S., Mendez, S. T. & Velazquez, A. (2001) Biotin regulates the genetic expression of holocarboxylase synthetase and mitochondrial carboxylases in rats. J Nutr 131: 1909-1913.
14. Collins, J. C., Paietta, E., Green, R., Morell, A. G. & Stockert, R. J. (1988) Biotin-dependent expression of the asialoglycoprotein receptor in HepG2. J Biol Chem 263: 11280-11283.
15. Hymes, J., Fleischhauer, K. & Wolf, B. (1995) Biotinylation of histones by human serum biotinidase: assessment of biotinyl-transferase activity in sera from normal individuals and children with biotinidase deficiency. Biochem Mol Med 56: 76-83.
16. Pietrelli, F., Marsili, G. & Moretti, P. (1976) RNA, DNA, histones and interactions between histone proteins and DNA in the liver of biotin-deficient rats. Biochem Exp Biol 12: 461-465.
17. Stanley, J. S., Griffin, J. B. & Zempleni, J. (2001) Biotinylation of histones in human cells. Effects of cell proliferation. Eur J Biochem 268: 5424-5429.
18. van den Berg, H. (1997) Bioavailability of biotin. Eur J Clin Nutr 51 Suppl 1: S60-61.
19. Frigg, M. (1977) Comparative study on the effect of biotin contained in various cereals on chicken growth. Nutr Metab 21: 236-237.
20. McMahon, R. J. (2002) Biotin in metabolism and molecular biology. Annu Rev Nutr 22: 221-239.
21. Said, H. M., Redha, R. & Nylander, W. (1987) A carrier-mediated, Na+ gradient-dependent transport for biotin in human intestinal brush-border membrane vesicles. Am J Physiol 253: G631-636.
22. Bowman, B. B., Selhub, J. & Rosenberg, I. H. (1986) Intestinal absorption of biotin in the rat. J Nutr 116: 1266-1271.
23. Bowman, B. B. & Rosenberg, I. H. (1987) Biotin absorption by distal rat intestine. J Nutr 117: 2121-2126.
24. Said, H. M. (1991) Movement of biotin across the rat intestinal basolateral membrane. Studies with membrane vesicles. Biochem J 279: 671-674.
25. Ng, K. Y. & Borchardt, R. T. (1993) Biotin transport in a human intestinal epithelial cell line (Caco-2). Life Sci 53: 1121-1127.
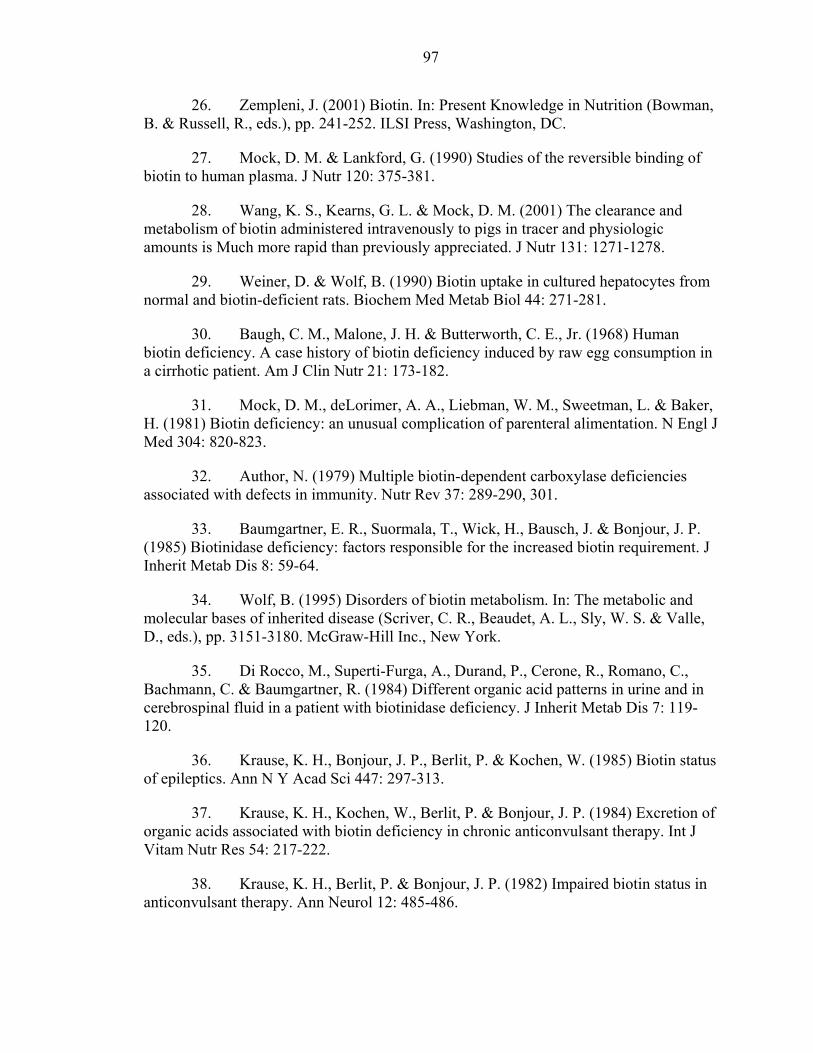
97
26. Zempleni, J. (2001) Biotin. In: Present Knowledge in Nutrition (Bowman, B. & Russell, R., eds.), pp. 241-252. ILSI Press, Washington, DC.
27. Mock, D. M. & Lankford, G. (1990) Studies of the reversible binding of biotin to human plasma. J Nutr 120: 375-381.
28. Wang, K. S., Kearns, G. L. & Mock, D. M. (2001) The clearance and metabolism of biotin administered intravenously to pigs in tracer and physiologic amounts is Much more rapid than previously appreciated. J Nutr 131: 1271-1278.
29. Weiner, D. & Wolf, B. (1990) Biotin uptake in cultured hepatocytes from normal and biotin-deficient rats. Biochem Med Metab Biol 44: 271-281.
30. Baugh, C. M., Malone, J. H. & Butterworth, C. E., Jr. (1968) Human biotin deficiency. A case history of biotin deficiency induced by raw egg consumption in a cirrhotic patient. Am J Clin Nutr 21: 173-182.
31. Mock, D. M., deLorimer, A. A., Liebman, W. M., Sweetman, L. & Baker, H. (1981) Biotin deficiency: an unusual complication of parenteral alimentation. N Engl J Med 304: 820-823.
32. Author, N. (1979) Multiple biotin-dependent carboxylase deficiencies associated with defects in immunity. Nutr Rev 37: 289-290, 301.
33. Baumgartner, E. R., Suormala, T., Wick, H., Bausch, J. & Bonjour, J. P. (1985) Biotinidase deficiency: factors responsible for the increased biotin requirement. J Inherit Metab Dis 8: 59-64.
34. Wolf, B. (1995) Disorders of biotin metabolism. In: The metabolic and molecular bases of inherited disease (Scriver, C. R., Beaudet, A. L., Sly, W. S. & Valle, D., eds.), pp. 3151-3180. McGraw-Hill Inc., New York.
35. Di Rocco, M., Superti-Furga, A., Durand, P., Cerone, R., Romano, C., Bachmann, C. & Baumgartner, R. (1984) Different organic acid patterns in urine and in cerebrospinal fluid in a patient with biotinidase deficiency. J Inherit Metab Dis 7: 119-120.
36. Krause, K. H., Bonjour, J. P., Berlit, P. & Kochen, W. (1985) Biotin status of epileptics. Ann N Y Acad Sci 447: 297-313.
37. Krause, K. H., Kochen, W., Berlit, P. & Bonjour, J. P. (1984) Excretion of organic acids associated with biotin deficiency in chronic anticonvulsant therapy. Int J Vitam Nutr Res 54: 217-222.
38. Krause, K. H., Berlit, P. & Bonjour, J. P. (1982) Impaired biotin status in anticonvulsant therapy. Ann Neurol 12: 485-486.

98
39. Leonard, J. V., Daish, P., Naughten, E. R. & Bartlett, K. (1984) The management and long term outcome of organic acidaemias. J Inherit Metab Dis 7: 13-17.
40. Roth, K. S., Yang, W., Foremann, J. W., Rothman, R. & Segal, S. (1980) Holocarboxylase synthetase deficiency: a biotin-responsive organic acidemia. J Pediatr 96: 845-849.
41. Saunders, M., Sweetman, L., Robinson, B., Roth, K., Cohn, R. & Gravel, R. A. (1979) Biotin-response organicaciduria. Multiple carboxylase defects and complementation studies with propionicacidemia in cultured fibroblasts. J Clin Invest 64: 1695-1702.
42. Dupuis, L., Campeau, E., Leclerc, D. & Gravel, R. A. (1999) Mechanism of biotin responsiveness in biotin-responsive multiple carboxylase deficiency. Mol Genet Metab 66: 80-90.
43. Wolf, B. & Feldman, G. L. (1982) The biotin-dependent carboxylase deficiencies. Am J Hum Genet 34: 699-716.
44. Mock, D. M., Stadler, D. D., Stratton, S. L. & Mock, N. I. (1997) Biotin status assessed longitudinally in pregnant women. J Nutr 127: 710-716.
45. Watanabe, T., Dakshinamurti, K. & Persaud, T. V. (1995) Biotin influences palatal development of mouse embryos in organ culture. J Nutr 125: 2114-2121.
46. Watanabe, T. (1993) Dietary biotin deficiency affects reproductive function and prenatal development in hamsters. J Nutr 123: 2101-2108.
47. Benschoter, C. A. (1967) Effect of dietary biotin on reproduction of the house fly. J Econ Entomol 60: 1326-1328.
48. Watanabe, T. (1996) Morphological and biochemical effects of excessive amounts of biotin on embryonic development in mice. Experientia 52: 149-154.
49. Mock, D. M. (1996) Biotin. In: Present Knowledge in Nutrition (Ziegler, E. & Filer, L., eds.), pp. 220-235. ILSI Press, Washington, DC.
50. Mock, N. I., Malik, M. I., Stumbo, P. J., Bishop, W. P. & Mock, D. M. (1997) Increased urinary excretion of 3-hydroxyisovaleric acid and decreased urinary excretion of biotin are sensitive early indicators of decreased biotin status in experimental biotin deficiency. Am J Clin Nutr 65: 951-958.
51. Rabin, B. S. (1983) Inhibition of experimentally induced autoimmunity in rats by biotin deficiency. J Nutr 113: 2316-2322.
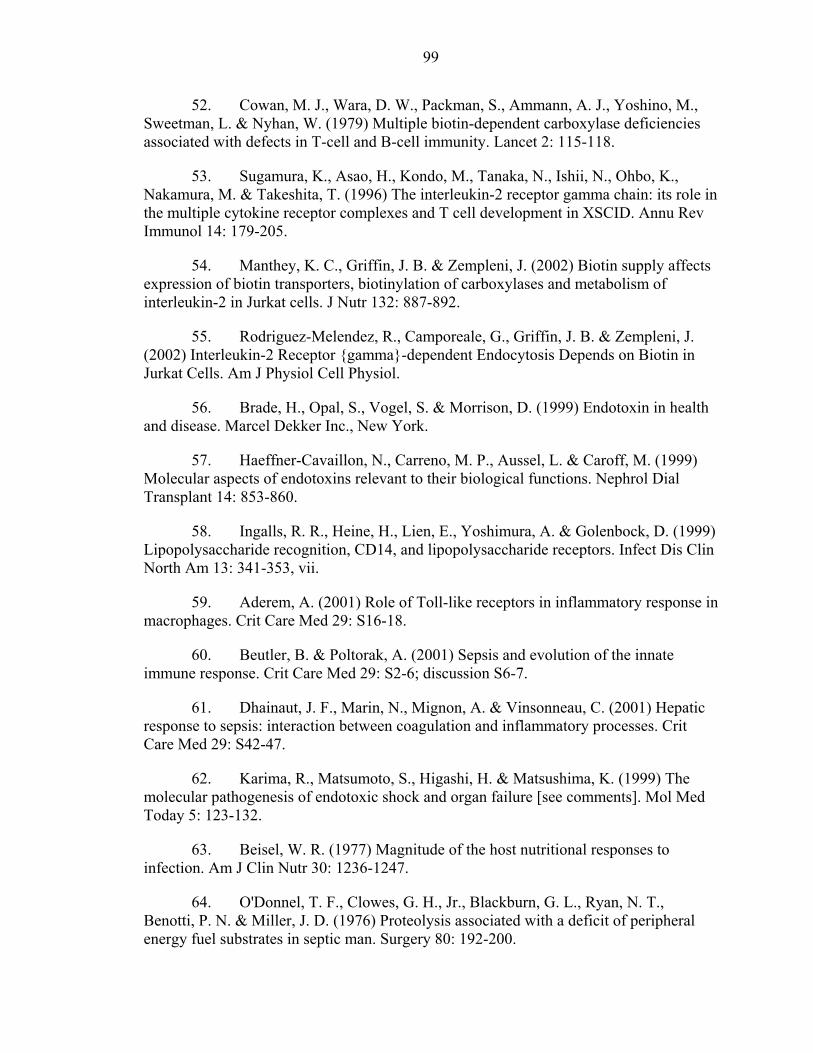
99
52. Cowan, M. J., Wara, D. W., Packman, S., Ammann, A. J., Yoshino, M., Sweetman, L. & Nyhan, W. (1979) Multiple biotin-dependent carboxylase deficiencies associated with defects in T-cell and B-cell immunity. Lancet 2: 115-118.
53. Sugamura, K., Asao, H., Kondo, M., Tanaka, N., Ishii, N., Ohbo, K., Nakamura, M. & Takeshita, T. (1996) The interleukin-2 receptor gamma chain: its role in the multiple cytokine receptor complexes and T cell development in XSCID. Annu Rev Immunol 14: 179-205.
54. Manthey, K. C., Griffin, J. B. & Zempleni, J. (2002) Biotin supply affects expression of biotin transporters, biotinylation of carboxylases and metabolism of interleukin-2 in Jurkat cells. J Nutr 132: 887-892.
55. Rodriguez-Melendez, R., Camporeale, G., Griffin, J. B. & Zempleni, J. (2002) Interleukin-2 Receptor {gamma}-dependent Endocytosis Depends on Biotin in Jurkat Cells. Am J Physiol Cell Physiol.
56. Brade, H., Opal, S., Vogel, S. & Morrison, D. (1999) Endotoxin in health and disease. Marcel Dekker Inc., New York.
57. Haeffner-Cavaillon, N., Carreno, M. P., Aussel, L. & Caroff, M. (1999) Molecular aspects of endotoxins relevant to their biological functions. Nephrol Dial Transplant 14: 853-860.
58. Ingalls, R. R., Heine, H., Lien, E., Yoshimura, A. & Golenbock, D. (1999) Lipopolysaccharide recognition, CD14, and lipopolysaccharide receptors. Infect Dis Clin North Am 13: 341-353, vii.
59. Aderem, A. (2001) Role of Toll-like receptors in inflammatory response in macrophages. Crit Care Med 29: S16-18.
60. Beutler, B. & Poltorak, A. (2001) Sepsis and evolution of the innate immune response. Crit Care Med 29: S2-6; discussion S6-7.
61. Dhainaut, J. F., Marin, N., Mignon, A. & Vinsonneau, C. (2001) Hepatic response to sepsis: interaction between coagulation and inflammatory processes. Crit Care Med 29: S42-47.
62. Karima, R., Matsumoto, S., Higashi, H. & Matsushima, K. (1999) The molecular pathogenesis of endotoxic shock and organ failure [see comments]. Mol Med Today 5: 123-132.
63. Beisel, W. R. (1977) Magnitude of the host nutritional responses to infection. Am J Clin Nutr 30: 1236-1247.
64. O'Donnel, T. F., Clowes, G. H., Jr., Blackburn, G. L., Ryan, N. T., Benotti, P. N. & Miller, J. D. (1976) Proteolysis associated with a deficit of peripheral energy fuel substrates in septic man. Surgery 80: 192-200.

100
65. Powanda, M. C., Dinterman, R. E., Wannemacher, R. W., Jr. & Beisel, W. R. (1975) Tryptophan metabolism in relation to amino acid alterations during typhoid fever. Acta Vitaminol Enzymol 29: 164-168.
66. Cerra, F. B., Siegel, J. H., Border, J. R., Wiles, J. & McMenamy, R. R. (1979) The hepatic failure of sepsis: cellular versus substrate. Surgery 86: 409-422.
67. Nolan, J. P. (1975) The role of endotoxin in liver injury. Gastroenterology 69: 1346-1356.
68. Beisel, W. R. & Fiser, R. H., Jr. (1970) Lipid metabolism during infectious illness. Am J Clin Nutr 23: 1069-1079.
69. Carpentier, Y. A., Askanazi, J., Elwyn, D. H., Jeevanandam, M., Gump, F. E., Hyman, A. I., Burr, R. & Kinney, J. M. (1979) Effects of hypercaloric glucose infusion on lipid metabolism in injury and sepsis. J Trauma 19: 649-654.
70. Beisel, W. R. (1983) Mediators of fever and muscle proteolysis. N Engl J Med 308: 586-587.
71. Wrinkler, M. & Manchester, S. (1996) Nutritional Care in Metabolic Stress: Sepsis, Trauma, Burns, and Surgery. In: Krause's Food, Nutrition, & Diet Therapy (Mahan, L. & Excott-Stump, S., eds.), pp. 663-670. W.B. Saunders, Philadelphia.
72. Mock, N. I. & Mock, D. M. (1992) Biotin deficiency in rats: disturbances of leucine metabolism are detectable early. J Nutr 122: 1493-1499.
73. Kramer, T. R., Briske-Anderson, M., Johnson, S. B. & Holman, R. T. (1984) Effects of biotin deficiency on polyunsaturated fatty acid metabolism in rats. J Nutr 114: 2047-2052.
74. Maeda, Y., Kawata, S., Inui, Y., Fukuda, K., Igura, T. & Matsuzawa, Y. (1996) Biotin deficiency decreases ornithine transcarbamylase activity and mRNA in rat liver. J Nutr 126: 61-66.
75. Rodriguez-Melendez, R., Perez-Andrade, M. E., Diaz, A., Deolarte, A., Camacho-Arroyo, I., Ciceron, I., Ibarra, I. & Velazquez, A. (1999) Differential effects of biotin deficiency and replenishment on rat liver pyruvate and propionyl-CoA carboxylases and on their mRNAs. Mol Genet Metab 66: 16-23.
76. Failla, M. L., Craft, N. E. & Weinberg, G. A. (1983) Depressed response of plasma iron and zinc to endotoxin and LEM in STZ- diabetic rat. Proc Soc Exp Biol Med 172: 445-448.
77. Etzel, K. R., Swerdel, M. R., Swerdel, J. N. & Cousins, R. J. (1982) Endotoxin-induced changes in copper and zinc metabolism in the Syrian hamster. J Nutr 112: 2363-2373.
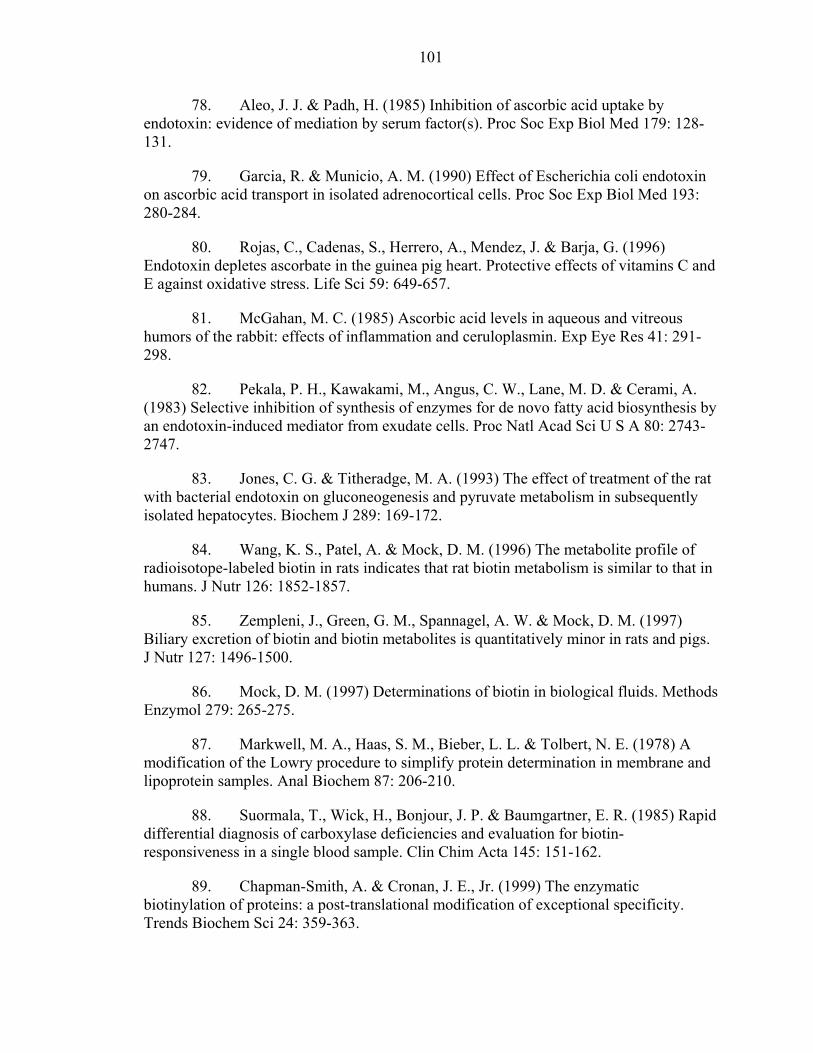
101
78. Aleo, J. J. & Padh, H. (1985) Inhibition of ascorbic acid uptake by endotoxin: evidence of mediation by serum factor(s). Proc Soc Exp Biol Med 179: 128-131.
79. Garcia, R. & Municio, A. M. (1990) Effect of Escherichia coli endotoxin on ascorbic acid transport in isolated adrenocortical cells. Proc Soc Exp Biol Med 193: 280-284.
80. Rojas, C., Cadenas, S., Herrero, A., Mendez, J. & Barja, G. (1996) Endotoxin depletes ascorbate in the guinea pig heart. Protective effects of vitamins C and E against oxidative stress. Life Sci 59: 649-657.
81. McGahan, M. C. (1985) Ascorbic acid levels in aqueous and vitreous humors of the rabbit: effects of inflammation and ceruloplasmin. Exp Eye Res 41: 291-298.
82. Pekala, P. H., Kawakami, M., Angus, C. W., Lane, M. D. & Cerami, A. (1983) Selective inhibition of synthesis of enzymes for de novo fatty acid biosynthesis by an endotoxin-induced mediator from exudate cells. Proc Natl Acad Sci U S A 80: 2743-2747.
83. Jones, C. G. & Titheradge, M. A. (1993) The effect of treatment of the rat with bacterial endotoxin on gluconeogenesis and pyruvate metabolism in subsequently isolated hepatocytes. Biochem J 289: 169-172.
84. Wang, K. S., Patel, A. & Mock, D. M. (1996) The metabolite profile of radioisotope-labeled biotin in rats indicates that rat biotin metabolism is similar to that in humans. J Nutr 126: 1852-1857.
85. Zempleni, J., Green, G. M., Spannagel, A. W. & Mock, D. M. (1997) Biliary excretion of biotin and biotin metabolites is quantitatively minor in rats and pigs. J Nutr 127: 1496-1500.
86. Mock, D. M. (1997) Determinations of biotin in biological fluids. Methods Enzymol 279: 265-275.
87. Markwell, M. A., Haas, S. M., Bieber, L. L. & Tolbert, N. E. (1978) A modification of the Lowry procedure to simplify protein determination in membrane and lipoprotein samples. Anal Biochem 87: 206-210.
88. Suormala, T., Wick, H., Bonjour, J. P. & Baumgartner, E. R. (1985) Rapid differential diagnosis of carboxylase deficiencies and evaluation for biotin-responsiveness in a single blood sample. Clin Chim Acta 145: 151-162.
89. Chapman-Smith, A. & Cronan, J. E., Jr. (1999) The enzymatic biotinylation of proteins: a post-translational modification of exceptional specificity. Trends Biochem Sci 24: 359-363.

102
90. Lee, H. M., Wright, L. D. & McCormick, D. B. (1972) Metabolism of carbonyl-labeled 14 C-biotin in the rat. J Nutr 102: 1453-1463.
91. Lee, H. M., McCall, N. E., Wright, L. D. & McCormick, D. B. (1973) Urinary excretion of biotin and metabolites in the rat. Proc Soc Exp Biol Med 142: 642-644.
92. Iwahara, S., McCormick, D. B., Wright, L. D. & Li, H. C. (1969) Bacterial degradation of biotin. 3. Metabolism of 14C-carbonyl-labeled biotin. J Biol Chem 244: 1393-1398.
93. Brady, R. N., Ruis, H., McCormick, D. B. & Wright, L. D. (1966) Bacterial degradation of biotin. Catabolism of 14C-biotin and its sulfoxides. J Biol Chem 241: 4717-4721.
94. Brady, R. N., Li, L. F., McCormick, D. B. & Wright, L. D. (1965) Bacterial and enzymatic degradation of biotin. Biochem Biophys Res Commun 19: 777-782.
95. Mock, D. M. & Malik, M. I. (1992) Distribution of biotin in human plasma: most of the biotin is not bound to protein. Am J Clin Nutr 56: 427-432.
96. Zempleni, J. & Mock, D. M. (1998) Uptake and metabolism of biotin by human peripheral blood mononuclear cells. Am J Physiol 275: C382-388.
97. Chiang, G. S. & Mistry, S. P. (1974) Activities of pyruvate carboxylase and propionyl CoA carboxylase in rat tissues during biotin deficiency and restoration of the activities after biotin administration. Proc Soc Exp Biol Med 146: 21-24.
98. Bitsch, R., Toth-Dersi, A. & Hoetzel, D. (1985) Biotin deficiency and biotin supply. Ann N Y Acad Sci 447: 133-139.
99. Bhagavan, H. N., Coursin, D. B. & Dakshinamurti, K. (1965) In vivo oxidation of glucose-C14 to C14O2 in biotin deficiency. Arch Biochem Biophys 110: 422-426.
100. Mock, D. M. & Heird, G. M. (1997) Urinary biotin analogs increase in humans during chronic supplementation: the analogs are biotin metabolites. Am J Physiol 272: E83-85.
101. Mock, D. M. & Mock, N. I. (1997) Serum concentrations of bisnorbiotin and biotin sulfoxide increase during both acute and chronic biotin supplementation. J Lab Clin Med 129: 384-388.
102. Deodhar, A. D. & Mistry, S. P. (1969) Control of gluconeogenesis in biotin-deficient rat liver. Arch Biochem Biophys 129: 321-328.

103
103. Shriver, B. J., Roman-Shriver, C. & Allred, J. B. (1993) Depletion and repletion of biotinyl enzymes in liver of biotin-deficient rats: evidence of a biotin storage system. J Nutr 123: 1140-1149.
104. Klevay, L. M. (1976) The biotin requirement of rats fed 20% egg white. J Nutr 106: 1643-1646.
105. Mock, D. M., Mock, N. I., Nelson, R. P. & Lombard, K. A. (1998) Disturbances in biotin metabolism in children undergoing long-term anticonvulsant therapy. J Pediatr Gastroenterol Nutr 26: 245-250.
106. Said, H. M., Redha, R. & Nylander, W. (1989) Biotin transport in the human intestine: inhibition by anticonvulsant drugs. Am J Clin Nutr 49: 127-131.
107. Said, H. M., Horne, D. W. & Mock, D. M. (1990) Effect of aging on intestinal biotin transport in the rat. Exp Gerontol 25: 67-73.
108. Said, H. M., Sharifian, A., Bagherzadeh, A. & Mock, D. (1990) Chronic ethanol feeding and acute ethanol exposure in vitro: effect on intestinal transport of biotin. Am J Clin Nutr 52: 1083-1086.
109. Patel, M. S. & Mistry, S. P. (1968) Effect of biotin deficiency on food intake and body and organ weights of male albino rats. Growth 32: 175-187.
110. Wolf, B. & Hsia, Y. E. (1978) Biotin responsiveness in propionicacidaemia. Lancet 2: 901.
111. Wolf, B., Hsia, Y. E., Sweetman, L., Feldman, G., Boychuk, R. B., Bart, R. D., Crowell, D. H., Di Mauro, R. M. & Nyhan, W. L. (1981) Multiple carboxylase deficiency: clinical and biochemical improvement following neonatal biotin treatment. Pediatrics 68: 113-118.
112. Wolf, B., Heard, G. S., Weissbecker, K. A., McVoy, J. R., Grier, R. E. & Leshner, R. T. (1985) Biotinidase deficiency: initial clinical features and rapid diagnosis. Ann Neurol 18: 614-617.
113. Zempleni, J. & Mock, D. M. (1999) Bioavailability of biotin given orally to humans in pharmacologic doses. Am J Clin Nutr 69: 504-508.
114. Mock, D. M. (1999) Biotin status: which are valid indicators and how do we know? J Nutr 129: 498S-503S.
115. Zempleni, J. & Mock, D. M. (2000) Utilization of biotin in proliferating human lymphocytes. J Nutr 130: 335S-337S.
116. Liu, Y. Y., Shigematsu, Y., Bykov, I., Nakai, A., Kikawa, Y., Fukui, T. & Sudo, M. (1994) Abnormal fatty acid composition of lymphocytes of biotin-deficient rats. J Nutr Sci Vitaminol (Tokyo) 40: 283-288.

104
117. Matsusue, S., Kashihara, S., Takeda, H. & Koizumi, S. (1985) Biotin deficiency during total parenteral nutrition: its clinical manifestation and plasma nonesterified fatty acid level. JPEN J Parenter Enteral Nutr 9: 760-763.
118. Mock, D. M., Johnson, S. B. & Holman, R. T. (1988) Effects of biotin deficiency on serum fatty acid composition: evidence for abnormalities in humans. J Nutr 118: 342-348.
119. Mock, D. M. (1990) Evidence for a pathogenic role of omega 6 polyunsaturated fatty acid in the cutaneous manifestations of biotin deficiency. J Pediatr Gastroenterol Nutr 10: 222-229.
120. Packman, S. & Whitney, S. (1990) Fatty acid transport in multiple carboxylase deficiency fibroblasts. J Inherit Metab Dis 13: 716-720.
121. Packman, S., Whitney, S. C., Fitch, M. & Fleming, S. E. (1989) Abnormal fatty acid composition of biotin-responsive multiple carboxylase deficiency fibroblasts. J Inherit Metab Dis 12: 47-57.
122. Poston, H. A. & McCartney, T. H. (1974) Effect of dietary biotin and lipid on growth, stamina, lipid metabolism and biotin-containing enzymes in brook trout (Salvelinus fontinalis). J Nutr 104: 315-322.
123. Proud, V. K., Rizzo, W. B., Patterson, J. W., Heard, G. S. & Wolf, B. (1990) Fatty acid alterations and carboxylase deficiencies in the skin of biotin-deficient rats. Am J Clin Nutr 51: 853-858.
124. Puddu, P., Zanetti, P., Turchetto, E. & Marchetti, M. (1967) Aspects of liver lipid metabolism in the biotin-deficient rat. J Nutr 91: 509-513.
125. Suchy, S. F., Rizzo, W. B. & Wolf, B. (1986) Effect of biotin deficiency and supplementation on lipid metabolism in rats: saturated fatty acids. Am J Clin Nutr 44: 475-480.
126. Suchy, S. F. & Wolf, B. (1986) Effect of biotin deficiency and supplementation on lipid metabolism in rats: cholesterol and lipoproteins. Am J Clin Nutr 43: 831-838.
127. Watkins, B. A. & Kratzer, F. H. (1987) Tissue lipid fatty acid composition of biotin-adequate and biotin-deficient chicks. Poult Sci 66: 306-313.
128. Borboni, P., Magnaterra, R., Rabini, R. A., Staffolani, R., Porzio, O., Sesti, G., Fusco, A., Mazzanti, L., Lauro, R. & Marlier, L. N. (1996) Effect of biotin on glucokinase activity, mRNA expression and insulin release in cultured beta-cells. Acta Diabetol 33: 154-158.
129. Dakshinamurti, K. & Cheah-Tan, C. (1968) Biotin-mediated synthesis of hepatic glucokinase in the rat. Arch Biochem Biophys 127: 17-21.
105
130. Dakshinamurti, K. & Li, W. (1994) Transcriptional regulation of liver phosphoenolpyruvate carboxykinase by biotin in diabetic rats. Mol Cell Biochem 132: 127-132.
131. Mock, D. M., Mock, N. I. & Weintraub, S. (1988) Abnormal organic aciduria in biotin deficiency: the rat is similar to the human. J Lab Clin Med 112: 240-247.
132. Fischer, A., Munnich, A., Saudubray, J. M., Mamas, S., Coude, F. X., Charpentier, C., Dray, F., Frezal, J. & Griscelli, C. (1982) Biotin-responsive immunoregulatory dysfunction in multiple carboxylase deficiency. J Clin Immunol 2: 35-38.
133. Williams, M. L., Packman, S. & Cowan, M. J. (1983) Alopecia and periorificial dermatitis in biotin-responsive multiple carboxylase deficiency. J Am Acad Dermatol 9: 97-103.
134. Kien, C. L., Kohler, E., Goodman, S. I., Berlow, S., Hong, R., Horowitz, S. P. & Baker, H. (1981) Biotin-responsive in vivo carboxylase deficiency in two siblings with secretory diarrhea receiving total parenteral nutrition. J Pediatr 99: 546-550.
135. Munnich, A., Saudubray, J. M., Cotisson, A., Coude, F. X., Ogier, H., Charpentier, C., Marsac, C., Carre, G., Bourgeay-Causse, M. & Frezal, J. (1981) Biotin dependent multiple carboxylase deficiency presenting as a congenital lactic acidosis. Eur J Pediatr 137: 203-206.
136. Strom, C. M. & Levine, E. M. (1998) Chronic vaginal candidiasis responsive to biotin therapy in a carrier of biotinidase deficiency. Obstet Gynecol 92: 644-646.
137. Marklova, E., Vonsovska, M. & Nozickova, M. (1994) Screening for biotinidase deficiency in some skin diseases. Sb Ved Pr Lek Fak Karlovy Univerzity Hradci Kralove 37: 33-36.
138. Abbas, A. K., Lichtman, A. H. & Pober, J. S. (2000) Cellular and Molecular Immunology, 4th ed. W.B. Saunders, Philadelphia.
139. Baez-Saldana, A., Diaz, G., Espinoza, B. & Ortega, E. (1998) Biotin deficiency induces changes in subpopulations of spleen lymphocytes in mice. Am J Clin Nutr 67: 431-437.
140. Zempleni, J. & Mock, D. M. (1999) Mitogen-induced proliferation increases biotin uptake into human peripheral blood mononuclear cells. Am J Physiol 276: C1079-1084.
141. Bartlett, K., Bennett, M. J., Hill, R. P., Lashford, L. S., Pollitt, R. J. & Worth, H. G. (1984) Isolated biotin-resistant 3-methylcrotonyl CoA carboxylase deficiency presenting with life-threatening hypoglycaemia. J Inherit Metab Dis 7: 182.
106
142. Beemer, F. A., Bartlett, K., Duran, M., Ghneim, H. K., Wadman, S. K., Bruinvis, L. & Ketting, D. (1982) Isolated biotin-resistant 3-methylcrotonyl-CoA carboxylase deficiency in two sibs. Eur J Pediatr 138: 351-354.
143. Lewis, B., Rathman, S. & McMahon, R. (2001) Dietary biotin intake modulates the pool of free and protein-bound biotin in rat liver. J Nutr 131: 2310-2315.
144. DiSilvestro, R. A. & Cousins, R. J. (1984) Mediation of endotoxin-induced changes in zinc metabolism in rats. Am J Physiol 247: E436-441.
145. Attwood, P. V. & Geeves, M. A. (2002) Changes in catalytic activity and association state of pyruvate carboxylase which are dependent on enzyme concentration. Arch Biochem Biophys 401: 63-72.
146. Khew-Goodall, Y. S., Johannssen, W., Attwood, P. V., Wallace, J. C. & Keech, D. B. (1991) Studies on dilution inactivation of sheep liver pyruvate carboxylase. Arch Biochem Biophys 284: 98-105.
147. Beisel, W. R. (1988) Metabolic response to infection. In: Nutrition and Metabolism in Patient Care (Kinney, J. M., Jeejeebhoy, K. N., Hill, G. L. & Owen, O. E., eds.), pp. 605-624. W. B. Saunders, Philadelphia.
148. Holecek, M., Sprongl, L., Tichy, M. & Pecka, M. (1998) Leucine metabolism in rat liver after a bolus injection of endotoxin. Metabolism 47: 681-685.
149. Mitaka, C., Hirata, Y., Yokoyama, K., Nagura, T., Tsunoda, Y. & Amaha, K. (1999) Improvement of renal dysfunction in dogs with endotoxemia by a nonselective endothelin receptor antagonist. Crit Care Med 27: 146-153.
150. Di Berardino, M. & Dimroth, P. (1995) Synthesis of the oxaloacetate decarboxylase Na+ pump and its individual subunits in Escherichia coli and analysis of their function. Eur J Biochem 231: 790-801.
151. Dimroth, P. (1986) Preparation, characterization, and reconstitution of oxaloacetate decarboxylase from Klebsiella aerogenes, a sodium pump. Methods Enzymol 125: 530-540.
152. Dimroth, P. & Thomer, A. (1983) Subunit composition of oxaloacetate decarboxylase and characterization of the alpha chain as carboxyltransferase. Eur J Biochem 137: 107-112.
153. Jockel, P., Schmid, M., Choinowski, T. & Dimroth, P. (2000) Essential role of tyrosine 229 of the oxaloacetate decarboxylase beta-subunit in the energy coupling mechanism of the Na(+) pump. Biochemistry 39: 4320-4326.

107
154. Schmid, M., Wild, M. R., Dahinden, P. & Dimroth, P. (2002) Subunit gamma of the oxaloacetate decarboxylase Na(+) pump: interaction with other subunits/domains of the complex and binding site for the Zn(2+) metal ion. Biochemistry 41: 1285-1292.

BIOGRAPHICAL SKETCH
Brandon Lewis was born in Pensacola, FL, where he graduated from B. T.
Washington High School in 1993. He attended the University of Florida and was
awarded a Bachelor’s of Science degree in food science and human nutrition in 1997. He
then began the combined MS/DI program from which he progressed to the Doctor of
Philosophy in nutritional sciences program at the University of Florida.
108