Messer Griesheim Holding AG Consolidated Financial ...
98
Consolidated Financial Statements 2002 Messer Griesheim Holding AG
Transcript of Messer Griesheim Holding AG Consolidated Financial ...

Consolidated Financial Statements 2002Messer Griesheim Holding AG

Abridged Annual Report
Messer Griesheim Holding AG (Successor)
Messer Griesheim GmbH (Predecessor)
Financial Statements of the Messer Group for the periods:
�� January 01 to April 30, 2001 (Predecessor)
�� May 01 to December 31, 2001 (Successor)
On April 30, 2001 the former stockholders of Messer Griesheim GmbH, Hoechst AG and the Messer family, together with the new shareholders performed a series of acquisition transactions. As a result of these transactions, Messer Griesheim Holding AG owns 100 % of Messer Griesheim GmbH. All the shares in Messer Griesheim Holding AG are held directly and indirectly by the Messer Griesheim Group GmbH & Co. KGaA. The shareholders in Messer Griesheim Group GmbH & Co. KGaA as of 31.12.2001 are six equity funds managed by Goldman Sachs Group (33.665 %), Allianz Capital Partners (33.665 %)
and Messer Industrie GmbH (32.67 %). As a consequence of the change in ownership we have had to prepare separate financial statements for the periods 1 - 4/01 (predecessor) and 5 - 12/01 (successor). In this connection it was necessary to revalue all assets to market prices. This accounting policy, together with the refinancing programme and the various deconsolidation transactions which were to be concluded within a year of the sale, have the result that the periods 1 - 4/01 and 5 - 12/01 are neither comparable nor to be added together. For the same reasons no comparison with the figures from previous years is meaningful.
1
THIS DOCUMENT IS AN EXCERPT FROM THE COMPANY’S FORM 20-F _________________________________________________________________
SECURITIES AND EXCHANGE COMMISSION
Washington, D.C. 20549 ___________
FORM 20-F/A
AMENDMENT NO.1 TO ANNUAL REPORT
ANNUAL REPORT PURSUANT TO SECTION 13 OR 15(d) OF THE SECURITIES EXCHANGE ACT OF 1934
for the fiscal year ended December 31, 2002
Commission file number 333-73020
___________ Messer Griesheim Holding AG
(Exact name of registrant as specified in its Charter) ___________
FEDERAL REPUBLIC OF GERMANY
(Jurisdiction of incorporation or organization)
KOOGSTRAAT 10, 25870-NORDERFRIEDRICHSKOOG, GERMANY (Address of principal executive offices)
___________
TABLE OF CONTENTS
(I) MANGEMENT DISCUSSION AND ANALYSIS: Operating and Financial Review and Prospects
A. Operating Results ...................................................................................................... 2 B. Liquidity and Capital Resources ............................................................................. 23 C. Research and Development ...................................................................................... 28 D. Trends.......................................................................................................................... 28
(II) FINANCIAL STATEMENTS INDEX........................................................................... F1

2
OPERATING AND FINANCIAL REVIEW AND PROSPECTS A OPERATING RESULTS You should read the following discussion in conjunction with Messer Griesheim's and Messer Holding's financial statements included in this Form 20-F starting on page F-1. Messer Griesheim’s and Messer Holding's financial statements are prepared in accordance with the International Financial Reporting Standards of the International Accounting Standards Board, or IFRS, which differ in certain significant respects from U.S. GAAP. You can find reconciliations of net income, shareholders' equity and disclosures regarding differences between IFRS and U.S. GAAP in note 40 “Reconciliation to U.S.GAAP” to Messer Holding's consolidated financial statements. The Company calculates normalized EBITDA as operating profit before depreciation and amortization, after adding back charges for impairment of intangible assets and property, plant and equipment, restructuring and reorganization charges and cash dividends from non-consolidated subsidiaries. Normalized EBITDA is not a measure recognized by IFRS or U.S. GAAP. This and similar measures are used by different companies for differing purposes and are often calculated in ways that reflect the unique situations of those companies. We urge you to be very cautious in comparing our normalized EBITDA data to the EBITDA data of other companies. Normalized EBITDA is not a substitute for operating profit as a measure of operating results. Likewise, normalized EBITDA is not a substitute for cash flow as a measure of liquidity.
Forward Looking Statements May Prove Inaccurate This report contains certain forward-looking statements and information relating to us that is based on the beliefs of our management as well as assumptions made by and information currently available to us. These statements include, but are not limited to, statements about our strategies, plans, objectives, expectations, intentions, expenditures, and assumptions as well as other statements contained in this Form 20-F that are not historical facts. When used in this document, words such as "anticipate", "believe", "estimate", "expect", "intend", "plan" and "project" and similar expressions, as they relate to us or our management, are intended to identify forward-looking statements. These statements reflect our current views with respect to future events, are not guarantees of future performance and involve risks and uncertainties that are difficult to predict. Further, certain forward-looking statements are based upon assumptions as to future events that may not prove to be accurate. Investors are cautioned that forward-looking statements contained in this section involve both risk and uncertainty. Several important factors could cause actual results to differ materially from those anticipated by these statements. Many of these statements are macroeconomic in nature and are, therefore, beyond the control of management.
Overview We are a producer and distributor of industrial gases, including oxygen, nitrogen, argon, carbon dioxide, hydrogen, helium, specialty gases and acetylene. The industrial gases we produce are used in a broad range of industries, including the steel, chemicals, electronics, pulp and paper, health-care, food and beverage, automotive, lighting and glass industries. We operate in 45 countries through more than 407 facilities, including production plants, distribution and filling stations and research centers as of December 31, 2002. In 2002, we had an estimated global market share of approximately 4% of the total

3
industrial gases market, making us the seventh largest industrial gas producer worldwide with leading market shares in Germany and certain other countries in central and Eastern Europe. We also have strong businesses in selected industrial areas of the United States and in selected niche markets in other western European countries. In the twelve months ended December 31, 2002, we generated net sales of €1,526.0 million and normalized EBITDA of €402.9 million. Please note that our normalized EBITDA for periods preceding and subsequent to April 30, 2001 are not comparable, due to the consummation of the acquisition transaction on April 30, 2001. Our primary or core markets are Europe and North America. Our two largest markets, Germany and North America, collectively accounted for 65% of our net sales and 72% of our normalized EBITDA for the twelve months ended December 31, 2002. Within each of our geographic markets, we generally organize our business based upon how we deliver industrial gases to our customers: delivery of large volumes from on-site production facilities or by pipeline, delivery in bulk tanks transported by truck or rail and delivery in gas cylinders. In addition to our core markets of Europe and North America, we also operate in Asia, Africa and Latin America. We are in the process of divesting of substantially all of the assets outside our core markets, along with certain non-strategic assets in our core markets. As of December 31, 2002, other than the joint ventures in Central America and China and our subsidiaries in Indonesia and Peru, we have completed all divestitures that were targeted to be completed by the end of calendar year 2002. Acquisition Transactions, Refinancing and Divestiture Program As discussed elsewhere in this report, the acquisition transactions have been accounted for at fair value and, accordingly, our assets and liabilities have been recorded at their estimated fair values as of April 30, 2001, the date of the acquisition transactions. As a result, the consolidated financial statements of Messer Griesheim for periods prior to the acquisition transactions are not comparable to our consolidated financial statements for periods subsequent to the acquisition transactions. To highlight this lack of comparability, a solid vertical line has been inserted, where applicable, between columns in the tables and schedules of this document, and in our consolidated financial statement to distinguish information pertaining to the pre-acquisition and post-acquisition periods. The Acquisition of Messer Griesheim Prior to the completion of the acquisition transactions described below, Messer Griesheim was owned: • 33 1/3% by the Messer family through a holding company, Messer Industrie GmbH, and • 66 2/3% by Hoechst AG, a subsidiary of Aventis S.A. Aventis was formed in December
1999 as the result of the merger of Hoechst AG and Rhone-Poulenc S.A., two of Europe's largest chemical companies.
On December 31, 2000, Messer Industrie, Hoechst and our parent company Messer Griesheim Group, entered into certain acquisition transactions. As a result of the acquisition transactions, Messer Holding owns 100% of Messer Griesheim and Messer Holding is wholly owned by Messer Griesheim Group. Messer Holding and Messer Griesheim Group are both holding companies with no material assets other than their direct or indirect interests in Messer Griesheim (and, in the Messer Holding's case, the payments under the intercompany loan to Messer Griesheim). During the twelve months ended December 31, 2002, our employees and members
4
of the shareholders’ committee purchased shares through the share purchase and option plan. The employees hold their shares through Messer Employee. Consequently Messer Griesheim Group is owned as of December 31, 2002:
�� 32.11% by the Messer family, through Messer Industrie; �� 33.08% by Allianz Capital Partners; �� 33.08% by six private equity funds managed by affiliates of The Goldman Sachs Group, Inc.
; and �� 1.73% by Messer Employee and certain members on the Shareholders’ committee of MGB.
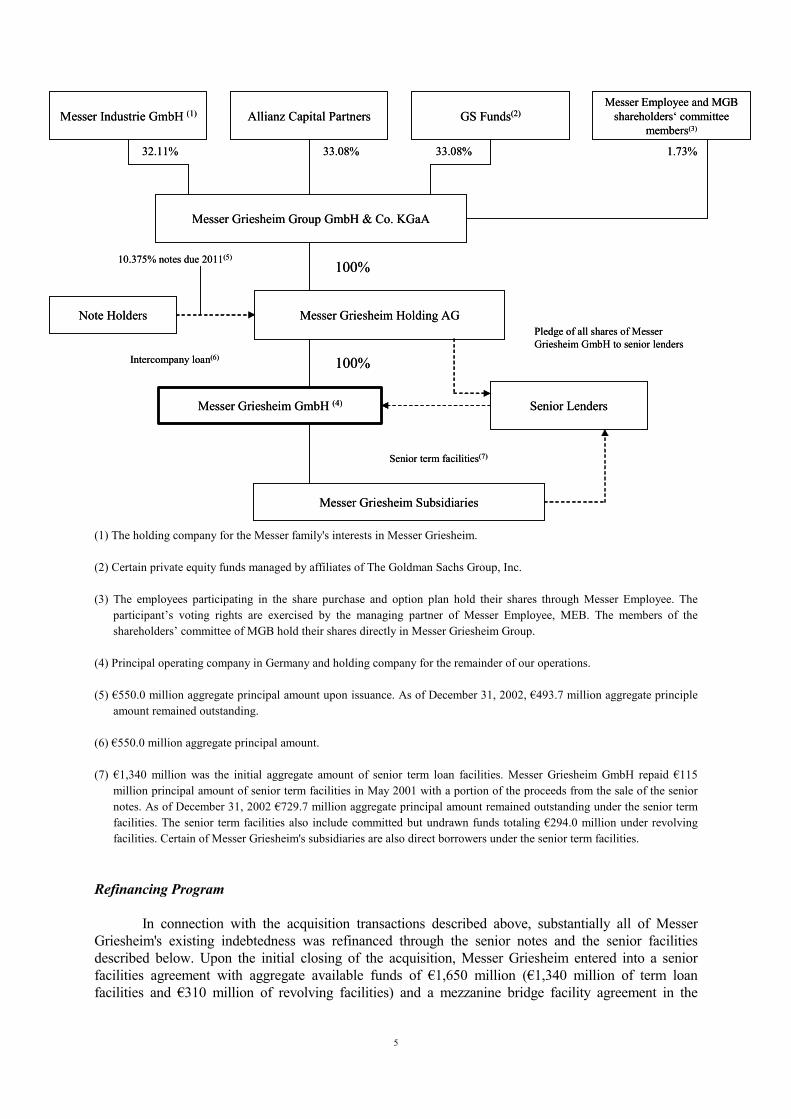
In connection with these acquisition transactions, the shareholders of Messer Griesheim Group entered into a shareholders' agreement governing their respective voting control and other ownership rights with respect to Messer Holding and Messer Griesheim. See Item 7. "Major Shareholders and Related Party Transactions” – “Major Shareholders” – “Shareholders' Agreement”. Due to certain antitrust related considerations relating to the equity interest of Allianz AG in a competitor of Messer Griesheim, the agreement generally allocates the rights of the financial sponsors relating to corporate governance and management to the GS Funds until such time as the antitrust related considerations are no longer relevant. Accordingly, until then, members of the shareholders’ committee appointed by the GS Funds will represent all votes of the financial sponsors constituting 66.16% of all votes in the shareholders committee. Thereafter, the rights will be shared by Allianz Capital Partners and the GS Funds, with Allianz Capital Partners having a deciding vote in the event of a lack of consensus between Allianz Capital Partners and the GS Funds, subject to certain exceptions. Transaction Structure The following diagram shows our ownership structure and the structure of our principal indebtedness as of December 31, 2002 following completion of the acquisition transactions on or about April 30, 2001, reflecting the issuance of the senior notes and the refinancing of our indebtedness to the extent completed, including repayment in full of the €400 million mezzanine bridge facility and repayment of €115 million of our senior term facilities and subsequent share purchases by our employees and shareholders’ committee members through the share purchase and option plans indicated above.
5
(1) The holding company for the Messer family's interests in Messer Griesheim. (2) Certain private equity funds managed by affiliates of The Goldman Sachs Group, Inc. (3) The employees participating in the share purchase and option plan hold their shares through Messer Employee. The
participant’s voting rights are exercised by the managing partner of Messer Employee, MEB. The members of the shareholders’ committee of MGB hold their shares directly in Messer Griesheim Group.
(4) Principal operating company in Germany and holding company for the remainder of our operations. (5) €550.0 million aggregate principal amount upon issuance. As of December 31, 2002, €493.7 million aggregate principle
amount remained outstanding. (6) €550.0 million aggregate principal amount. (7) €1,340 million was the initial aggregate amount of senior term loan facilities. Messer Griesheim GmbH repaid €115
million principal amount of senior term facilities in May 2001 with a portion of the proceeds from the sale of the senior notes. As of December 31, 2002 €729.7 million aggregate principal amount remained outstanding under the senior term facilities. The senior term facilities also include committed but undrawn funds totaling €294.0 million under revolving facilities. Certain of Messer Griesheim's subsidiaries are also direct borrowers under the senior term facilities.
Refinancing Program In connection with the acquisition transactions described above, substantially all of Messer Griesheim's existing indebtedness was refinanced through the senior notes and the senior facilities described below. Upon the initial closing of the acquisition, Messer Griesheim entered into a senior facilities agreement with aggregate available funds of €1,650 million (€1,340 million of term loan facilities and €310 million of revolving facilities) and a mezzanine bridge facility agreement in the
Messer Industrie GmbH (1) Allianz Capital Partners GS Funds(2)Messer Employee and MGB
shareholders‘ committeemembers(3)
Messer Griesheim Group GmbH & Co. KGaA
Messer Griesheim Holding AG
Messer Griesheim GmbH (4)
Messer Griesheim Subsidiaries
100%
100%
33.08% 33.08%32.11% 1.73%
Senior Lenders
Note HoldersPledge of all shares of Messer Griesheim GmbH to senior lenders
Intercompany loan(6)
Senior term facilities(7)
10.375% notes due 2011(5)

6
aggregate amount of €400 million. On May 16, 2001, the Company issued €550 million principal amount of 10.375% senior notes maturing on June 1, 2011. Upon the closing of the sale of the senior notes, Messer Holding made an intercompany loan to Messer Griesheim with the gross proceeds from the senior notes, and Messer Griesheim used the intercompany loan to repay the mezzanine bridge facility in full and repay €115 million principal amount of outstanding term borrowings under the facilities. Business Practices We believe the following selected business practices are important for a proper understanding of our financial reporting risks. Net Sales We primarily earn revenues from • sales of industrial gases, and to a lesser extent • sales of hardware related to industrial gas usage. Our sales of industrial gases, which amount to greater than 90% of our total revenue, are divided into three business fields corresponding to their mode of delivery: on-site and pipeline sales, bulk delivery sales and cylinder delivery sales. Contracts in our on-site production and pipeline supply businesses in Europe and the United States typically have terms of 10 to 15 years and usually have "take-or-pay" minimum purchase provisions. In each of the last three years, the "take-or-pay" minimum purchase requirements in our on-site and pipeline supply contracts accounted for approximately 60% to 70% in Germany and 40% to 45% in the United States of the total amount of net sales that we generated under these contracts. Contracts in our bulk business generally have terms of two to three years in Europe and five to seven years in the United States. Customers in our on-site and pipeline and bulk businesses have historically exhibited high renewal rates, with over 90% of customers whose contracts expired in the past five years renewing their contracts with us. Our on-site, pipeline and bulk businesses in Germany and the United States accounted for approximately 39% of our total net sales and approximately 50% of our normalized EBITDA in the year 2002. We generally sell our cylinder gases by purchase orders or by contracts with terms ranging between one to two years in Europe and two to five years in the United States. Our net sales are dependent on the economic conditions in the markets in which we operate. However, we believe that we have limited exposure to the cyclical nature in demand of any particular industry because of the wide diversity of industries represented by our customer base. Although industrial gas prices appear to have stabilized in many of the markets in which we operate, prices have consistently decreased for at least the last 10 years, especially in the bulk and commodity gas cylinder segments, due to aggressive efforts by most producers to increase market share. The profit margin impact of this price erosion has been partially offset by efficiency improvements throughout the supply chain and regional consolidation among large participants in the industry, permitting economies of scale. In addition, new applications for industrial gases have provided opportunities for increased sales volumes and profit margins.

7
Cost of Sales Our principal raw material is air, which is free and which we separate into its component gases. Cost of sales principally consists of: • capital costs of plants; • costs of energy required for production; and • labor costs relating to production. Energy costs consist principally of electrical power costs. Electricity represents approximately 29% of cost of sales in the year 2002. We are able to pass on a portion of increases in energy costs to many, but not all, of our on-site and pipeline customers with long-term supply contracts, although these adjustments in cost often occur only on an annual basis. The amount and other terms of these energy cost pass-through provisions vary by contract. Labor costs relating to production consist principally of wages and salaries, social security contributions and other expenses related to employee benefits. Social security contributions include our portion of social security payments as well as our contributions to workers' insurance associations. We depreciate fixed assets on a straight-line basis. Our depreciation rates assume useful lives ranging from 10 to 50 years for buildings, 10 to 20 years for plant and machinery and 3 to 20 years for other plant, factory and office equipment. Divestiture Program Our core markets are Europe and North America. In May 2001 immediately following our change of ownership resulting from the acquisition transactions described elsewhere in this Form 20-F, we adopted a divestiture program. Pursuant to the divestiture program, we intend to sell substantially all of our assets and operations in our non-core markets in Asia, Africa and Latin America, as well as certain non-strategic assets and operations in our core markets. The proceeds from the divestiture program will be used to reduce our consolidated debt. Pursuant to our divestiture program, as of December 31, 2002, we have completed disposals of our home care business in Germany, our health care business in Canada and our non-cryogenic plant production operations in Germany, the United States, Italy and China. We also have completed disposals of our operations in Argentina, Brazil, Canada, Egypt, Mexico, South Africa, South Korea, Trinidad & Tobago and Venezuela, our nitric oxide business in Austria, substantially all our carbon dioxide business in the United States and our nitrogen services business in the United Kingdom. We have substantially completed the disposal of our investments included in subsidiaries available for sale. As a result, we completed repayment of our senior term disposal facility in the second quarter of 2002. The remaining divestiture of certain of our assets and operations may require additional expenditures prior to their disposal. Cost-Savings Plan We are implementing a plan to reduce our operating costs, principally in Europe. This plan involves eliminating duplication in support positions for certain process functions, reducing energy costs, centralizing key process functions and simplifying our management structure. We have identified

8
most of the specific cost savings measures that we anticipate to achieve by year end 2003. We expect that these measures will reduce the cost base of our operations in our core markets relative to its level for the year 2000 by approximately €100 million by year end 2003. To implement these measures, we expect to spend approximately €64.5 million in total between April 30, 2001 and year end 2003, principally to be applied towards severance payments and efficiency improvements. For the twelve months ended December 31, 2002, we have reduced the cost base of our operations in our core markets relative to its level for the year 2000 by €71.1 million. As a result of implementation of these measures, we incurred one time costs of approximately €38.1 million (excluding €12.5 million of costs that were included as part of the purchase price accounting adjustments) for the twenty months from May 1, 2001 to December 31, 2002, of which €12.8 million was recorded in the year 2002. We expect to incur an additional €26.4 million of one-time costs by the end of 2003 of which €8.8 million, €17.6 million is expected to relate to divestitures and reduction in work force as well as and various other reductions in operating costs, respectively. Critical Accounting Policies The results of our operations and financial condition are dependent upon the utilization of accounting methods, assumptions and estimates that are used as a basis for the preparation of the consolidated financial statements. This affects the reported amounts of assets, liabilities, revenues and expenses, as well as disclosure of contingent assets and liabilities. Some of these assumptions and estimates can be subjective in nature and complex, and consequently actual results could differ. If the accounting estimate required assumptions to be made about matters that were highly uncertain at the time the estimate was made and if different estimates could have reasonably been used which would have a material impact on the presentation of the financial condition or results of operations, the accounting estimate would constitute a critical accounting policy. We have identified the following critical accounting policies and related assumptions, estimates and uncertainties, which management believes are essential to understanding the underlying financial reporting risks and the impact that these accounting methods, assumptions, estimates and uncertainties have on our reported financial results. This information should be read in conjunction with the audited consolidated financial statements. Pension plans
We accounted for pensions on the basis of actuarial valuations, which rely on statistical and other factors in order to anticipate future events. These factors include key actuarial assumptions about the discount rate and rate of future compensation increases as well as the expected return on assets. In addition, our actuarial consultants also make use of subjective assumptions such as fluctuations and mortality rates. These actuarial assumptions may differ materially from actual developments due to changing market and economic conditions, changes in fluctuation rates or changes in live expectancy of participants, thereby resulting in a significant variation of the projected benefit obligation (PBO).
Also, the calculation of pension expenses is partly based on an expected long-term rate of return on plan assets and the market related value of plan assets. The expected return on plan assets assumption is determined on a uniform basis, considering long-term historical returns, asset allocation, and future estimates of long-term investment returns. The expected return of each asset class is based on an average over the historical long-term return on risk-free government bonds and moderate specific risk premiums varying for equities and for lower credit bonds. Accordingly, we calculated an expected return on plan assets of approximately 8% at December 31, 2002. The market-related value of plan assets for the company’s pension plans are based upon the fair value of plan

9
assets at the measurement date. Actual return on plan assets may differ significantly from the expected amounts. Purchase Accounting We accounted for the acquisition transactions similar to that of an acquisition of Messer Griesheim by Messer Holding. The accounting for this acquisition resulted in significant amounts of long-lived intangible assets. Our accounting policy relating to purchase business combinations requires the use of the purchase method whereby the purchase price is allocated to identifiable tangible and intangible assets based upon their fair value. The allocation of purchase price is judgmental and requires the extensive use of estimates and fair value assumptions, which can have a significant impact on operating results. Changes in the industry conditions, technological advances and other economic factors could result in revisions to the judgments, estimates and valuation techniques utilized in the application of purchase accounting. Such differing allocations could impact future operating results. Recoverability of Long-Lived Assets Our business is capital intensive and, historically, requires a significant investment in property, plant and equipment. As of December 31, 2002, the carrying value of our property, plant and equipment was €1,516 million and long-lived intangible assets amounted to €791 million. We review long-lived assets, including intangible assets, for impairment whenever events or changes in circumstances indicate that the carrying value of an asset may not be recoverable. Recoverability of assets to be held and used is measured by a comparison of the carrying value of an asset to the higher of net selling price and value in use. Net selling price is the amount obtainable from the sale of an asset in an arm's length transaction between knowledgeable, willing parties, after deducting any direct incremental disposal costs. Value in use is the present value of estimated future cash flows expected to arise from continuing use of an asset and from its disposal at the end of its useful life. A continuation of the currently competitive economic conditions in the industrial gas industry could result in an increasingly adverse pricing environment due to significant industry over-capacity. This could result in decreased production and reduced capacity utilization. Such events could result in reductions of future net cash flows expected to be generated to the extent that both long-lived tangible and intangible assets could be considered impaired, negatively impacting future operating results. Recoverability of Investments in Subsidiaries Available for Sale We have made a series of investments in, and advances to, companies that are principally engaged in the manufacture, sale and distribution of industrial gases which are located in regional markets which we no longer consider part of our core markets. As of December 31, 2002, the carrying amounts of investments in subsidiaries available for sale aggregate approximately €18.1 million. Our accounting policy is to value such investments at estimated net realizable value. In determining estimated net realizable value, we consider the forecasted results of the investee, the economic environment in the regional market and our ability and intent to hold the investment until the estimated sale date. A slump in demand for industrial gases could adversely impact the operations of these investments and their capability to generate future net cash flows. Furthermore, since these investments are not publicly traded, further judgments and estimates are required to determine their fair value. As a result, potential impairment charges to write-down such investments to net realizable value could adversely affect future operating results.
10
Realization of Deferred Tax Assets As of December 31, 2002, we had total deferred tax assets of approximately €80.2 million. Included in this total are the benefit of net operating loss and tax credit carry forwards of approximately €27.9 million. Such tax loss and credit carry forwards generally do not expire under current law, except certain amounts attributable to operations in the United States that expire in 20 years. Realization of these amounts is dependent upon the generation of future taxable income at a level sufficient to absorb the loss and credits carry forwards. These deferred tax assets were recognized to the extent that it is probable that future taxable profit will be available. The amount of total deferred tax assets considered realizable prospectively could be reduced if our estimates of projected future taxable income are lowered from present levels or changes in current tax regulations are revised which could impose restrictions on the time or extent of our ability to utilize tax loss and credit carry forwards in the future. Currently, the German government is contemplating new tax legislation which could limit the net operating loss (“NOL”) carry forward to 7 years and which could limit the use of the NOL carry forward to only 50% of the taxable income in any given year. This contemplated new tax legislation could affect our ability to use our NOL. This future new tax legislation might also contain other features which could affect us. Given that the new tax legislation has not yet become law, and certain elements of which are subject to change, we have not yet considered the effects of these potential changes on our consolidated financial statements. Restructuring Charges Subsequent to the acquisition transactions, management approved plans to restructure the Group and reduce costs. These changes were intended to, among other things, improve operational efficiencies and improve profitability. While management approved a detailed restructuring plan, the calculation of the provision requires the use of estimates and management judgment. Additionally, if industry conditions continue to deteriorate or an economic downturn is experienced in the future, further restructuring charges may be incurred. Resulting variances from estimates previously utilized may adversely impact future financial results. Reclassifications Certain reclassifications have been made to the presentation of prior periods to conform to the current period classifications as explained elsewhere in this document. See Note 2 (“Accounting principles”) to the financial statements.
Results of Operations When comparing the twelve months ended December 31, 2002 and the eight months ended December 31, 2001, with the four months ended April 30, 2001 and the twelve months ended December 31, 2000, consideration should be given to the impact on comparability arising from the acquisition transactions, the refinancing program, the divestiture program and the other developments described above. As a result of these events, comparability is impacted by a number of factors, the most significant of which are (i) the new cost base of the Company’s assets and liabilities as a result of the acquisition transactions, (ii) the refinancing program and the resulting impact on financing costs and (iii) the divestiture program. All of these factors impacted the comparability of the results presented for the twelve months ended December 31, 2002 and the eight months ended December 31, 2001, to periods prior to the acquisition transactions.

11
To highlight this lack of comparability, a solid vertical line has been inserted, where applicable, between columns in the tables below, in our consolidated financial statements and elsewhere in this document in order to distinguish information pertaining to the pre-acquisition and post-acquisition periods. The following table sets forth a summary of our results for the twelve months ended December 31, 2002, eight months ended December 31, 2001, four months ended April 30, 2001 and the twelve months ended December 31, 2000.
Successor Predecessor Messer GriesheimHolding AG Messer Griesheim GmbH
Twelve months ended (2)
December 31, 2002
Eight months ended (2)
December 31, 2001
Four months ended
April 30, 2001
Twelve months ended
December 31, 2000 (in € millions) (in € millions) (in € millions) (in € millions)
Net sales ............................................................................. 1,526.0 1,046.6 574.5 1,695.9Cost of sales........................................................................ (748.8) (528.4) (293.4) (844.5)Gross profit ....................................................................... 777.2 518.2 281.1 851.4Distribution and selling costs............................................. (476.5) (342.2) (177.2) (568.9)General and administrative costs ....................................... (127.6) (90.8) (45.0) (127.7)Other, net(1)......................................................................... (41.9) (47.7) (12.4) (157.6)Operating profit (loss)...................................................... 131.2 37.5 46.5 (2.8)Interest expense, net ........................................................... (140.0) (103.4) (36.4) (88.5)Loss before income taxes and minority Interests .......... (44.0) (90.8) (6.6) (336.2)Income tax benefit/(expense) ............................................. (34.8) 26.2 (4.8) 138.2Net loss............................................................................... (89.9) (69.5) (13.5) (205.6)Normalized EBITDA ....................................................... 402.9 245.0 126.0 359.0
(1) Amounts include total net of research and development costs, other operating income, other operating expense, impairment of intangible assets and property, plant and equipment and restructuring and reorganization charges.
(2) Certain reclassifications have been made to the presentation of prior periods to conform to the current period classification as explained elsewhere in this document.
Major Events for Year 2002
�� Pursuant to the divestiture program we have completed disposals of our operations in Egypt, Trinidad & Tobago and Venezuela, and our nitrogen services business in the United Kingdom. We substantially completed the disposal of our investments included in subsidiaries available for sale. As a result, we completed repayment of our senior term disposal facility in the second quarter of 2002. Transaction costs associated with the above divestitures amounting to €8.2 million for 2002 are shown in restructuring and reorganisation costs.
�� For the twelve months ended December 31, 2002, we have maintained our capital
expenditures at no more than 10% of our total net sales, and we intend to maintain such reduced level of capital expenditures for the foreseeable future. Our capital expenditures in the future will be focused on making modest additions to our existing operations in our core markets that will allow us to exploit the full potential of earlier investments.
�� In June 2002, the company made voluntary debt repayments of €66.5 million and
mandatory excess cash flow repayments of €33.0 million. Further, in December 2002, the company made an additional €10.3 million mandatory repayment from the proceeds of permitted disposals.
12
�� During August 2002, the company sold all operating assets of Messer Griesheim Industries
of Canada Inc., Canada to Air Liquide. �� From September 1, 2002 until October 8, 2002, Messer Griesheim repurchased senior notes
amounting to €56.3 million for an average price of 102.9%. In connection with the repurchase, unamortized finance costs of €4.0 million, and fees and a tender premium of €2.2 million were incurred.
�� In October 2002, Messer Singapore Pte. Ltd. sold its Air Separation and Vacuum Flasher
Units to Singapore Syngas Pte. Ltd. and its remaining assets to Air Products Singapore Pte. Ltd. and Singapore Oxygen Air Liquide Pte. Ltd. Following these transactions, Messer Singapore Holding GmbH sold all its shares in Singapore Syngas Pte. Ltd. to Chevron Texaco Singapore Energy Company. In conjunction with the agreements, certain guarantees totaling €16.0 million were given. We have evaluated these guarantees and set up a provision for the remaining risks.
�� For the twelve months ended December 31, 2002, we have reduced the cost base of our
operations in our core markets relative to its level for the year 2000 by €71.1 million. As a result of implementation of these measures we incurred total one time costs of approximately €25.3 million (excluding €12.5 million of costs that were included as part of the purchase price accounting adjustments) for the eight months ended December 31, 2001 and an additional €12.8 million for the twelve month ended December 31, 2002. We expect to incur an additional €26.4 million of one time costs for the year 2003.
Twelve Months Ended December 31, 2002 Management believes that the following material trends have affected our continuing operations for 2002. Net sales in Germany decreased as a result of the continuing economic climate in Germany resulting in lower sales of our bulk and packaged gases businesses. This decrease was offset by sales from new production facilities such as the Carbon Monoxide plant in Dormagen, Germany. The additional increase in our operating profit in Germany results from the successful implementation of our cost saving program. The development in Western Europe, excluding Germany, was mixed. A decline in our U.K. financial results, due to lower sales primarily in the beverage business, was offset by stronger sales in France, Spain and Italy. Sales in Eastern Europe were flat, resulting from improving financial performance in Serbia, Finland, Poland and Slovenia offset by poor performance in Bulgaria due to a temporary product sourcing shortfall. The business climate in North America improved continuously with the exception of the cylinder business but slowed down during the second half of the year. Sales in North America increased particularly due to a strong performance of the pipeline business and successful bulk sales resulting from effective pricing increases. Operating profit improvement in North America results from the improved sales performance, lower energy costs and successful cost reduction activities. Twelve Months Ended December 31, 2002 Compared with Eight Months Ended December 31, 2001 As a result of the fact that the periods ended December 31, 2002 and December 31, 2001 are for periods of twelve months and eight months, respectively, management does not believe that a comparison of such periods is meaningful. Eight Months Ended December 31, 2001 Compared with Four Months Ended April 30, 2001 As a result of the acquisition transactions (including the change in cost basis resulting there from), the refinancing program and the divestiture program, and the fact that the periods ended

13
December 31, 2001 and April 30, 2001 are for periods of eight months and four months, respectively, management does not believe that the comparison of such periods is meaningful. Four Months Ended April 30, 2001 Compared with Twelve Months Ended December 31, 2000 As a result of the fact that the periods ended April 30, 2001 and December 31, 2000 are for periods of four months and twelve months, respectively, management does not believe that a comparison of such periods is meaningful. Three Months Ended December 31, 2002 Compared with Three Months Ended September 30, 2002 Management believes that comparing the three months ended December 31, 2002 with the three months ended September 30, 2002, as presented below, is a meaningful comparison because these periods can be compared of the same cost-basis and are otherwise no longer disproportionally impacted by the acquisition transactions.. The following table sets forth a summary of Messer Griesheim's results of operations for the three months ended December 31, 2002 and September 30, 2002, in terms of amounts as well as a percentage of net sales.
Messer Griesheim Holding AG
Three months ended
December 31, 2002
Three months ended
September 30, 2002 (in € millions) % (in € millions) %
Net sales........................................................................... 382.1 100.0 380.4 100.0Cost of sales..................................................................... (181.6) (47.5) (186.7) (49.1)Gross profit .................................................................... 200.5 52.5 193.7 50.9Distribution and selling costs.......................................... (121.1) (31.7) (116.9) (30.7)General and administrative costs..................................... (31.7) (8.3) (28.1) (7.4)Other, net(1) ...................................................................... (9.6) (2.5) (15.7) (4.1)Operating profit............................................................. 38.1 10.0 33.0 8.7Interest expense, net ........................................................ (31.2) (8.2) (32.5) (8.6)Loss before income taxes and minority interests........ (15.4) (4.0) (12.6) (3.3)Income tax (expenses) ..................................................... (13.1) (3.4) (10.5) (2.8)Net loss............................................................................ (31.8) (8.3) (25.8) (6.8)Normalized EBITDA(2) ................................................. 106.0 27.7 99.3 26.1
(1) Amounts include total net of research and development costs, other operating income, other operating expense, impairment of intangible assets and property, plant and equipment and restructuring and reorganization charges.
(2) Calculated as operating profit before depreciation and amortization, after adding back charges for impairment of intangible assets and property, plant and equipment, restructuring & reorganization charges and cash dividends from non consolidated subsidiaries. Normalized EBITDA is not a measure recognized by IFRS or U.S. GAAP and may not be comparable to similar measures presented by our competitors.

14
The following table presents a reconciliation of our Normalized EBITDA to operating profit and to cash from operating activities for the periods indicated. Messer Griesheim Holding AG
Three months ended
December 31, 2002
Three months ended
September 30, 2002
(in € millions)
Normalized EBITDA....................................................................................... 106.0 99.3Depreciation and amortization and impairment of property, plant and
equipment and intangible assets ................................................................... (58.2) (63.3)
Change in goodwill ........................................................................................... (1.8) —Restructuring and reorganization charges ......................................................... (5.6) (3.0)Chas dividends from non-consolidated subsidiaries ......................................... (2.3) —Operating profit (loss)..................................................................................... 38.1 33.0
Income taxes (paid) refunded............................................................................ 1.9 (16.1)Adjustments to reconcile operating profit to cash provided.............................. 55.4 81.2Changes in operating assets and liabilities ........................................................ 0.3 2.5Cash flow from (used in) operating activities................................................ 95.7 100.6
A substantial portion of the adjustments to reconcile operating profit to cash provided for the periods indicated above consist of depreciation and amortization and impairment of property, plant and equipment and intangible assets. Net sales Net sales increased slightly to €382.1 million in the fourth quarter 2002 from €380.4 million in the third quarter 2002 and are shown by business areas below:
Messer Griesheim Holding AG
Three months ended
December 31, 2002
Three months ended
September 30, 2002
(in € millions) (in € millions) Net sales (Business Areas) Germany.............................................................................................................................. 167.3 168.8 Western Europe, excluding Germany................................................................................. 66.5 63.6 Eastern Europe.................................................................................................................... 56.5 54.3 North America .................................................................................................................... 76.1 80.0 Others.................................................................................................................................. 14.4 13.8 Reconciliation/Corporate.................................................................................................... 1.3 (0.1) Total .................................................................................................................................... 382.1 380.4
�� Net sales in Germany decreased 0.9% to €167.3 million in the fourth quarter 2002 from
€168.8 million in the third quarter 2002. This slight decrease was caused by lower demand of speciality gases from the weak performing semiconductor industry. Net sales in Germany in the fourth quarter 2002 were otherwise flat compared to the third quarter 2002 as a result of the continuing weak business climate.
�� Net sales in Western Europe (excluding Germany) increased 4.6% to €66.5 million in the
fourth quarter 2002 from €63.6 million in the third quarter 2002. This overall increase resulted from the favourable development in sales throughout Western Europe, especially in

15
Italy and the U.K., due to a seasonally related stronger carbon dioxide beverage business. Additional explanations for this overall increase in sales are new application technologies in the food industry in France as well as stronger demand from the chemical industry in Spain.
�� Net sales in Eastern Europe increased 4.1% to €56.5 million in the fourth quarter 2002 from
€54.3 million in the third quarter 2002. All countries of the region excluding Bulgaria and the Czech Republic contributed to the sales increases. Due to a temporary product sourcing shortfall resulting from production problems of our joint venture partner in Bulgaria and a biannual planned maintenance of one of our production facilities in the Czech Republic, net sales and operating profit in these countries decreased in the fourth quarter. The strongest sales growth was achieved in Greece due to higher demand of medical specialty gases and in the Slovak Republic and Serbia where demand for steel favorably impacted net sales of the region.
�� Net sales in North America decreased 4.9% to €76.1 million in the fourth quarter 2002 from
€80.0 million in the third quarter 2002. Excluding the effects of the disposal of our Canadian gas business, which accounted for approximately €1.1 million of sales in North America during the third quarter 2002, and the weakening of the U.S. dollar against the Euro in the fourth quarter 2002, which accounted for approximately €1.6 million of sales in the fourth quarter 2001, our operations in North America decreased €1.2 million or 1.6% from the third to the fourth quarter 2002. This decrease was primarily due to poorer results from our North American cylinder business resulting from the weakness in the manufacturing sector of the U.S. economy particularly in the fourth quarter.
�� Net sales in Other Business Areas increased 4.3% to €14.4 million in the fourth quarter
2002 from €13.8 million in the third quarter 2002. This increase principally resulted from our business activities in China due to the overall strong demand of our onsite customers especially in the steel production area.
Cost of sales. Cost of sales decreased 2.7% to €181.6 million in the fourth quarter 2002 from €186.7 million in the third quarter 2002. Cost of sales consists primarily of raw material costs (e.g. energy), purchased parts and direct labor, as well as manufacturing overheads and depreciation. The decrease in cost of sales primarily resulted from the expiration of depreciation of fully depreciated property, plant and equipment. Distribution and selling costs. Distribution and selling costs increased 3.6% to €121.1 million in the fourth quarter 2002 from €116.9 million in third quarter 2002. Distribution and selling costs consist primarily of sales organization costs, transport of gases and cylinders from the production site or filling station to the customer, depreciation of the cylinders and tanks at the customer site, advertising and sales promotions, commissions and freight. The increase in distribution and selling costs was caused by slightly higher sales as compared to the third quarter 2002 and increased transport costs in Bulgaria caused by additional third-party product purchases due to temporary internal product sourcing problems. General and administrative costs. General and administrative costs increased by 12.8% to €31.7 million in the fourth quarter 2002 from €28.1 million in the third quarter 2002. General and administrative costs consist primarily of personnel costs attributable to general management, finance and human resources functions, as well as other corporate overheads.

16
Operating profit. Operating profit increased by 15.5% to €38.1 million in the fourth quarter 2002 from €33.0 million in the third quarter 2002.
Messer Griesheim Holding AG
Three months ended
December 31, 2002
Three months ended
September 30, 2002 (in € millions) (in € millions)
Operating profit (loss) (Business Areas) Germany...................................................................................................................... 29.1 30.8 Western Europe, excluding Germany......................................................................... 3.6 (0.2) Eastern Europe............................................................................................................ 9.5 9.7 North America............................................................................................................. 9.9 2.0 Others .......................................................................................................................... 0.9 2.1 Reconciliation/Corporate............................................................................................ (14.9) (11.4) Total............................................................................................................................ 38.1 33.0 • In Germany, we achieved an operating profit of €29.1 million in the fourth quarter 2002
compared to an operating profit of €30.8 million in the third quarter 2002. In addition to slightly lower sales in the fourth quarter the reduction in operating profit was impacted by an additional maintenance expense for the ASU production facility in Duisburg lowering operating profit by €1.9 million.
• In Western Europe (excluding Germany) we achieved an operating profit of €3.6
million in the fourth quarter 2002 compared to an operating loss of €0.2 million in the third quarter 2002. The increase in operating profit was a result of stronger operational performance in all countries as well as a decrease in low margin engineering business sales in the U.K compared to the third quarter 2002.
• In Eastern Europe we achieved an operating profit of €9.5 million in the fourth quarter
2002 compared to an operating profit of €9.7 million in the third quarter 2002. Despite the sales growth of 4.1% in the fourth quarter 2002, the operating profit is flat compared to the third quarter due to a temporary product sourcing shortfall resulting from production problems of our joint venture partner in Bulgaria and a biannual planned maintenance of one of our production facilities in the Czech Republic.
• In North America we achieved an operating profit of €9.9 million in the fourth quarter
2002 compared to an operating profit of €2.0 million in the third quarter 2002. The operating profit in the third quarter included a one time loss from the sales of the Canadian gas business in August 2002 (€2.4 million). Excluding this item the operating profit in the third quarter 2002 was €4.4 million. The remaining €5.5 million increase in operating profit in the fourth quarter 2002 is primarily caused by the expiration of depreciation of fully depreciated assets, a release of a provision as a result of a successful insurance settlement and lower energy costs resulting from less market volatility.
• Operating profit in Other Business Areas decreased to €0.9 million in the fourth quarter
2002 from €2.1 million in the third quarter 2002. This reduction is primarily caused by write downs on accounts receivables, in our Chinese operations.
17
Interest expense, net. Net interest expenses decreased 4.0% to €31.2 million in the fourth quarter 2002 from €32.5 million in the third quarter 2002. This was due to mandatory and voluntary repayments as well as the partial Senior Notes repurchase. Income taxes. In the fourth quarter 2002, the Company recorded income tax expense of €13.1 million, compared to an income tax expense of €10.5 million in the third quarter 2002. Despite our loss before income taxes and minority interest, income tax expenses are incurred mainly due to non-deductible interest expense and goodwill amortization. Net loss. In addition to the factors discussed above, net loss in the forth quarter 2002 has also been negatively impacted by an impairment charge on an equity method investment in North America amounting to €18.7 million described elsewhere in this document. In the third quarter 2002 net loss was also impacted by the realization of cumulative translation adjustment resulting from dividend payment. Recent IAS Accounting Standards The Group has adopted each of the following standards effective January 1, 2001. Unless otherwise stated, adoption of these standards did not have a material impact on the Group's financial position or results of operations. In 1998 the IASB issued IAS 39 "Financial Instruments: Recognition and Measurement". The standard significantly increases the use of fair values in accounting for financial instruments and establishes specific criteria relating to hedge accounting. IAS 39 has been adopted on January 1, 2001. In 2000 the IASB issued IAS 40 "Investment Property". IAS 40 was effective for financial statements covering periods beginning on or after January 1, 2001. IAS 40 prescribes the accounting treatment for investment property and related disclosure requirements and replaces previous requirements in IAS 25 "Accounting for Investments". Under IAS 40, investment property is defined as property held to earn rentals or for capital appreciation or both rather than for use in the production or supply of goods or services or for administrative purposes or for sale in the ordinary course of business. The Group has opted for the cost model under which investment property is measured at depreciated cost less any impairment losses. In 2000 the IASB revised IAS 19 "Employee Benefits". IAS 19 (revised 2000) was effective for fiscal periods beginning on or after January 1, 2001. The standard changes the definition of plan assets and introduces recognition, measurement and disclosure requirements for reimbursements. The standard prescribes the accounting and disclosure by employers for employee benefits, post employment benefits, other long term employee benefits, termination benefits and equity compensation benefits. Recent U.S. GAAP Accounting Pronouncements New U.S. accounting pronouncements In June 1998, the FASB issued SFAS 133 "Accounting for Derivative Instruments and Hedging Activities". SFAS 133 was subsequently amended by SFAS 137 "Deferral of the Effective Date of FASB 133", which allowed entities which had not adopted SFAS 133 to defer its effective date to all fiscal quarters of all fiscal years beginning after June 15, 2000, and SFAS 138 "Accounting for Certain Derivative Instruments and Certain Hedging Activities—an amendment of FASB Statement No. 133" which addresses a limited number of issues causing implementation difficulties for entities that apply SFAS 133.

18
SFAS 133, as amended, establishes accounting and reporting standards for derivative instruments, including derivative instruments embedded in other contracts, and hedging activities. Similar to IAS 39, SFAS 133, as amended, requires the Group to recognize all derivatives in the consolidated balance sheet at fair value. The financial statement recognition of the change in fair value of a derivative depends on a number of factors, including the intended use of the derivative and the extent to which it is effective as part of a hedge transaction. SFAS 133, as amended, was adopted by the Group effective January 1, 2001. Although IAS 39 and SFAS 133, as amended, are similar in many respects, the transition adjustments resulting from the adoption of IAS 39 must be reported in shareholders' equity, whereas the transition adjustments resulting from adoption of SFAS 133, as amended, must be reported in earnings or other comprehensive income, as appropriate. Adoption of SFAS 133 did not have a material impact on the Group's consolidated financial statements. In September 2000, the FASB issued SFAS 140 "Accounting for Transfers and Servicing of Financial Assets and Extinguishments of Liabilities—a replacement of FASB No. 125". This statement revises the standards for accounting for securitizations and other transfers of financial assets and collateral and requires certain financial statement disclosures. SFAS 140 is effective for transactions occurring after March 31, 2001, except for certain disclosure requirements which were effective December 31, 2000. Adoption of this replacement standard did not have a material effect on the Group's consolidated financial statements.
Effective July 1, 2001, the Group adopted Statement 141 "Business Combinations" and certain provisions of SFAS 142 "Goodwill and Other Intangible Assets". The Group adopted SFAS 142 in its entirety on January 1, 2002. SFAS 141 requires that the purchase method of accounting be used for all business combinations initiated after June 30, 2001, as well as all purchase method business combinations completed after June 30, 2001. SFAS 141 also specifies criteria intangible assets acquired in a purchase method business combination must meet to be recognized and reported separately from goodwill, and also indicates that any purchase price allocable to an assembled workforce may not be accounted for separately. Additionally, SFAS 141 required, upon adoption of SFAS 142 in its entirety, that the Group evaluate its existing intangible assets and goodwill that were acquired in a prior purchase business combination, and to make any necessary reclassifications in order to conform with the new criteria in SFAS 141 for recognition apart from goodwill. SFAS 142 requires that goodwill and intangible assets with indefinite useful lives no longer be amortized, but instead be tested for impairment annually (or more frequently if impairment indicators arise) in accordance with the provisions of SFAS 142. Intangible assets with definite useful lives are amortized over their respective estimated useful lives to their estimated residual values, and reviewed for impairment in accordance with SFAS 144 "Accounting for the Impairment or Disposal of Long-Lived Assets".
Goodwill and intangible assets acquired in business combinations completed before July 1, 2001 continued to be amortized through December 31, 2001. As of December 31, 2001, the amount of unamortized goodwill under U.S. GAAP was €598,756. Unamortized assembled workforce totaled €13,917 as of December 31, 2001, was required to be reallocated to goodwill upon adoption of SFAS 141 and SFAS 142. Related deferred tax liabilities of €5,567 were also required to be eliminated through a corresponding reduction under U.S. GAAP. The amount of unamortized goodwill under U.S. GAAP as of December 31, 2002 was €566,744.
As discussed above, upon adoption of SFAS 142, the Group was required to evaluate its existing intangible assets and goodwill that were acquired in a prior purchase combination, and to make any reclassifications in order to conform with the new criteria in SFAS 141 for recognition apart

19
from goodwill. As a consequence, the Group was required to reallocate as additional goodwill the unamortized assembled workforce balance upon adoption of SFAS 142. This evaluation did not result in any other significant reclassifications. Upon adoption of SFAS 142, the Group was also required to reassess the useful lives and residual values of all intangible assets acquired, and make any necessary amortization period adjustments by the end of the first interim period after adoption. This reassessment did not result in any significant amortization period adjustments. In addition, to the extent an intangible asset is identified as having an indefinite useful life, the Group is required to test the intangible asset for impairment in accordance with the provisions of SFAS 142 within the first interim period. Any impairment loss should be measured as of the date of adoption and recognized as the cumulative effect of a change in accounting principle in the first interim period. No impairment loss was recognized as a result of these impairment tests, as the Group did not identify any intangible asset as having an indefinite useful life.
SFAS 142 requires the Group to perform an assessment of whether there is an indication that goodwill and/or equity method goodwill is impaired as of the date of adoption. To accomplish this, the Group identified its reporting units and determined the carrying value of each reporting unit by assigning the assets and liabilities, including the existing goodwill and intangible assets, to those reporting units as of January 1, 2002. By June 30, 2002, the Group determined the fair value of each reporting unit and compared it to the carrying amount of the reporting unit. To the extent the carrying amount of a reporting unit exceeded the fair value of the reporting unit, an indication existed that the reporting unit goodwill may be impaired and the Group then had to perform the second step of the transitional impairment test. In the second step, the Group then had to compare the implied fair value of the reporting unit goodwill with the carrying amount of the reporting unit goodwill, both of which were be measured as of the date of adoption. The implied fair value of goodwill is determined by allocating the fair value of the reporting unit to all of the assets (recognized and unrecognized) and liabilities of the reporting unit in a manner similar to a purchase price allocation, in accordance with SFAS 141. The residual fair value after this allocation is the implied fair value of the reporting unit goodwill. The Group has performed this second step of the impairment test in the fourth quarter 2002 and recognized a transitional impairment loss of €7,713 for the additional goodwill under U.S. GAAP as the cumulative effect of a change in accounting principle in the reconciliation of net loss to U.S. GAAP for the twelve months ended December 31, 2002.
In August 2001, the FASB issued SFAS 143 "Accounting for Asset Retirement Obligations". This Statement addresses financial accounting and reporting for obligations associated with the retirement of tangible long-lived assets and the associated asset retirement costs. SFAS 143 requires an enterprise to record the fair value of an asset retirement obligation as a liability in the period in which it incurs a legal obligation associated with the retirement of a tangible long-lived asset. SFAS 143 also requires the enterprise to increase the carrying amount of the related long-lived asset by the associated asset retirement costs and to depreciate that cost over the remaining useful life of the asset. The liability is changed at the end of each period to reflect the passage of time (i.e., accretion expense) and changes in the estimated future cash flows underlying the initial fair value measurement. Enterprises are required to adopt SFAS 143 for fiscal years beginning after June 15, 2002. The Group has started its analysis of the new pronouncement, but has not yet determined if the adoption of the new pronouncement will have a material effect on its financial statements.
In August 2001, the FASB approved for issuance SFAS 144. This Statement addresses financial accounting and reporting for the impairment or disposal of long-lived assets. This Statement supersedes SFAS 121 and the accounting and reporting provisions of APB Opinion No. 30 "Reporting the Results of Operations—Reporting the Effects of Disposal of a Segment of a Business, and Extraordinary, Unusual and Infrequently Occurring Events and Transactions", for the disposal of a segment of a business (as previously defined in that Opinion). This Statement also amends ARB No. 51 "Consolidated Financial Statements" to eliminate the exception to consolidation for a subsidiary

20
for which control is likely to be temporary. The Group adopted the provisions of this Statement on January 1, 2002. The adoption of the new pronouncement did not have a material effect on the Group’s consolidated financial statements. However, the Group has noted that certain provisions of SFAS 144 will potentially impact its accounting and reporting for the remaining subsidiaries to be sold under its divestiture program. The Group has also noted that the provisions of SFAS 144 supersede certain provisions of EITF 87-11 as they relate to allocation of purchase price in a business combination where the acquirer intends to sell a portion of the operations of the acquired enterprise (see Note 40b) and, as a result, had SFAS 144 been applied in accounting for the acquisition transactions, certain of the differences between U.S. GAAP and IFRS relating to operations and entities included in the divestiture program would not have occurred.
The FASB issued SFAS 145 “Rescission of FASB Statements No. 4, 44, and 64, Amendment of FASB Statement No. 13, and Technical Corrections”, on April 30, 2002. SFAS 145 rescinds SFAS 4, which required all gains and losses from extinguishment of debt to be aggregated and, if material, classified as an extraordinary item, net of related income tax effect. Upon adoption of SFAS 145, the Group is required to apply the criteria in APB Opinion No. 30, in determining the classification of gains and losses resulting from the extinguishment of debt. Additionally, SFAS 145 amends SFAS 13 to require that certain lease modifications that have economic effects similar to sale-leaseback transactions be accounted for in the same manner as sale-leaseback transactions. The rescission of SFAS 4 is effective to fiscal years beginning after May 15, 2002. The provisions of SFAS 145 related to SFAS 13 are effective for transactions occurring after May 15, 2002. The adoption of these provisions had no impact on the Group’s consolidated financial statements.
In July 2002, the FASB issued Statement 146, Accounting for Costs Associated with Exit or Disposal Activities. SFAS 146 replaces previous accounting guidance provided by EITF 94-3, Liability Recognition for Certain Employee Termination Benefits and Other Costs to Exit an Activity (including Certain Costs incurred in a Restructuring), and requires companies to recognize costs associated with exit or disposal activities when they are incurred (subsequent to a commitment to a plan) rather than at the date of a commitment to an exit or disposal plan. Examples of costs covered by the standard include lease termination costs and certain employee severance costs that are associated with a restructuring, discontinued operation, plant closing, or exit or disposal activity. The provisions of SFAS 146 are to be applied prospectively to exit or disposal activities initiated after December 31, 2002. The adoption of SFAS 146 is not expected to have a material impact on the Group’s consolidated financial statements.
In November 2002, the FASB issued Interpretation No. 45, Guarantor’s Accounting and
Disclosure Requirements for Guarantees, Including Indirect Guarantees of Indebtedness of Others (“FIN No. 45”), which addresses the disclosure to be made by a guarantor in its interim and annual financial statements about its obligation under guarantees. FIN No. 45 also requires the recognition of a liability by a guarantor at the inception of certain guaranties entered into or modified subsequent to adoption. FIN No. 45 requires the guarantor to recognize a liability for the non-contingent component of the guarantee, this is the obligation to stand ready to perform in the event that specified triggering events or conditions occur. The initial measurement of this liability is the fair value of the guarantee at inception. The recognition of the liability is required even if it is not probable that payment will be required under the guarantee or if the guarantee was issued with a premium payment or as part of a transaction with multiple elements. The Group has adopted the disclosure requirements (see Note 33 “Commitments and contingencies”) and will apply the recognition and measurement provisions for all guarantees entered into or modified after December 31, 2002.
In November 2002, the Emerging Issue Task Force („EITF“) reached a final consensus on
EITF 00-21, „Revenue arrangements with Multiple Deliverables”. EITF 00-21 addresses certain aspects of the accounting of revenue arrangements with multiple deliverables by a vendor. The Issue

21
outlines an approach to determine when a revenue arrangement for multiple deliverables should be divided into separate units of accounting and, if separation is appropriate, how the arrangement consideration should be allocated to the identified accounting units. The consensus reached in the Issue will be effective for the Group in its financial statements beginning July 1, 2003. The Group will apply the consensus prospectively in 2003. The Group is currently determining the impact of the adoption of EITF 00-21 on the Group’s consolidated financial statements but does not believe that the adoption of the consensus will have a material impact.
In December 2002, the FASB issued Statement No. 148, Accounting for Stock-Based
Compensation – Transition and Disclosure, which amends FASB Statement No. 123, Accounting for Stock-Based Compensation. Statement 148 provides alternative methods of transition for a voluntary change to the fair value based method of accounting for stock-based employee compensation. In addition, Statement 148 amends the disclosure requirements of Statement 123 to improve the clarity and prominence of disclosures about the pro forma effects of using the fair value based method of accounting for stock-based compensation for all companies – regardless of the accounting method used – by requiring that the data be presented more prominently and in a more user-friendly format in the footnotes to the financial statements.
The transition guidance and annual disclosure provisions of Statement 148 are effective for
fiscal years ending after December 15, 2002, with earlier application permitted in certain circumstances. The interim disclosure provisions are effective for financial reports containing financial statements for interim periods beginning after December 15, 2002.
The Group has adopted the disclosure requirements of SFAS 148 as presented in Note 37,
“Stock purchase and option plan”. In January 2003, the FASB issued FIN 46, “Consolidation of Variable Interest Entities – an
interpretation of ARB No. 51”, which clarifies the application of the consolidation rules to certain variable entities. FIN 46 established a new multi-step model for the consolidation of variable interest entities when a company has a controlling financial interest based either on voting interests or variable interests. Consolidation based on variable interests is required by the primary beneficiary if the equity investors lack essential characteristics of a controlling financial interest or if the equity investment at risk is not sufficient for the entity to finance its activities without additional subordinated financial support from other parties. The primary beneficiary of a variable interest entity is the party that absorbs a majority of the entity’s expected losses, receives a majority of its expected residual returns, or both, as a result of holding variable interests. FIN 46 also provides disclosure requirements related to investments in variable interest entities, whether or not those entities are consolidated. For the Group, FIN 46 applies immediately to variable interest entities created after January 31, 2003, and to variable interest entities in which the Group obtains an interest after that date. For variable interest entities created prior to February 1, 2003, the consolidation requirements of FIN 46 will be effective as of July 1, 2003.
The adoption of the disclosure requirements under Interpretation No. 46 did not have
consequences on the Group’s consolidated financial statements. Similarly, the full adoption of Interpretation No. 46 is not expected to have a material impact on the Group’s consolidated financial statements.

22
Reconciliation to U.S. GAAP Our results as reported under IFRS differ from our results as reconciled to U.S. GAAP, principally as a result of the different treatment under U.S. GAAP of: • allocation of purchase price to assets to be sold, • amortization of goodwill for periods after December 31, 2001, • restructuring costs, • transaction costs incurred by our parent on our behalf, • impairment of long lived assets and goodwill, • assembled workforce (intangible asset), • foreign currency gains and losses on borrowing costs directly attributable to
construction, • provisions for pensions and similar obligations, and • gains and losses related to financial instruments. The significant differences between IFRS and U.S. GAAP applicable to the consolidated financial statements are summarized below. Further discussion of significant differences between IFRS and U.S. GAAP applicable to the consolidated financial statements is presented elsewhere in this document. Twelve Months Ended December 31, 2002 In the twelve months ended December 31, 2002, the net loss reported under IFRS was €89.9 million and €67.8 million as reconciled to U.S. GAAP. During this period, there were reconciling adjustments of €28.7 million between IFRS and U.S. GAAP relating to the reversal of the IFRS goodwill amortization. The remaining difference between the net loss under IFRS and the net loss reported under U.S. GAAP is primarily the impairment charge of €7.7 million on U.S. GAAP goodwill as a result of the change in accounting principles. Eight Months Ended December 31, 2001 In the eight months ended December 31, 2001, the net loss reported under IFRS was €69.5 million and €66.6 million as reconciled to U.S. GAAP. During this period, there were reconciling adjustments of €5.5 million between IFRS and U.S. GAAP relating to assets to be sold within one year of the date of the business combination. The remaining difference between net loss under IFRS and net loss reported under U.S. GAAP is primarily due to the amortization impact and the tax effect under U.S. GAAP associated with these adjustments. Four Months Ended April 30, 2001 In the four months ended April 30, 2001 (prior to the acquisition transactions), the net loss reported under IFRS and U.S. GAAP was €13.5 million with no significant differences.

23
Twelve Months Ended December 31, 2000 Net loss as reported under IFRS was €205.6 million in the twelve months ended December 2000 and €179.8 million as reconciled to U.S. GAAP. There were reconciling adjustments of €27.4 million relating to impairment of property, plant and equipment. In addition, in the twelve months ended December 31, 2000 we recognized losses, but not gains, in the fair value of derivative financial instruments as required by IFRS in effect prior to January 1, 2001. Under U.S. GAAP in effect prior to January 1, 2001, both the losses and gains on those instruments were recognized. This adjustment reflects the recognition of losses of €2.5 million in the twelve months ended December 31, 2000. The remaining difference between net loss reported under IFRS and net loss reported under U.S. GAAP is primarily due to the tax effect associated with these adjustments. B LIQUIDITY AND CAPITAL RESOURCES The following table summarizes the cash flow activity during the twelve months ended December 31, 2002, the eight months ended December 31, 2001, the four months ended April 30, 2001 and the twelve months ended December 31, 2000. Consideration should be given to the effects of the acquisition transactions, the refinancing program, and the divestiture program when comparing historical financial information, including the selected financial data, for periods prior to April 30, 2001 to periods thereafter. The solid vertical line separates the information for periods prior to and subsequent to the acquisition transactions:
Successor Predeccessor Messer Griesheim Holding AG Messer Griesheim GmbH
Twelve months ended
December 31, 2002
Eight months ended
December 31, 2001
Four months ended
April 30, 2001
Twelve months ended
December 31, 2000 (in € millions) (in € millions) (in € millions) (in € millions)
Cash flow from (used in) operating activities............... 370.4 137.9 (8.9) 261.0 Cash flow from (used in) investing activities ............... (76.1) (86.8) (66.0) (335.1) Cash flow from (used in) financing activities............... (340.2) (75.0) 247.6 86.0 Cash and cash equivalents, end of reporting period..... 135.2 188.0 226.6 50.4
Cash flow from (used in) operating activities. The cash flow from operating activities was €370.4 million in the twelve months ended December 31, 2002. The cash flow from operating activities in the twelve months ended December 31, 2002 principally reflects a loss before income taxes and minority interests of €44.0 million which was offset mainly by depreciation and amortization of property, plant and equipment and intangible assets and by interest expenses. The depreciation and amortization of property, plant and equipment and intangible assets was €253.5 million. The cash flow from operating activities was €137.9 million in the eight months ended December 31, 2001. The cash flow from operating activities in the eight months ended December 31, 2001 principally reflects a loss before income taxes and minority interests of €90.8 million which was offset mainly by depreciation and amortization of property, plant and equipment and intangible assets and by interest expenses. For the four months ended April 30, 2001, cash flow from operating activities principally reflects a decrease due to the Singapore operations and changes in working capital in the four months ended April 30, 2001. Messer Griesheim's cash flow from operations was €261.0 million in 2000. This principally reflects a loss before income taxes and minority interests of €336.2 million in 2000. Depreciation and
24
amortization of property, plant and equipment and intangible assets amounted to €341.6 million in 2000 and included the impairment charges of the Singapore operations. Cash flow from (used in) investing activities. The cash flow used in investing activities for the twelve months ended December 31, 2002 was €76.1 million in 2002 and principally reflects purchases of property, plant and equipment and of intangible assets of €135.9 million proceeds from sales of investments of €40.5 million and proceeds from sales of property, plant and equipmentof €18.4 million. The cash flow used in investing activities for the eight months ended December 31, 2001 was €86.8 million. It principally reflects that in addition to the credit agreements provided to several subsidiaries for working capital, Messer Griesheim made cash investments in subsidiaries available for sale for the purpose of extinguishing the subsidiary debt as part of the divestiture program. For the four months ended April 30, 2001 the cash used in investing activities principally reflects capital expenditure on property, plant and equipment as well as investments and loans to related parties. In 2000, the predecessor's net cash used in investing activities was €335.1 million. This negative figure principally reflects €321.5 million in purchases of property, plant and equipment and of intangible assets. Cash flow from (used in) financing activities. During the twelve months ended December 31, 2002, our net cash used in financing activities was €340.2 million. It reflects interest paid of €132.0 million, and debt repayments of €184.5 million during 2002. In the eight months ended December 31, 2001, our net cash used in financing activities was €75.0 million. This negative figure principally reflects the repayment of corporate debt and the increased interest payments. These effects were partially offset by the proceeds from the refinancing program. The cash flow from financing activities for the four months ended April 30, 2001 principally reflects additional borrowings that resulted in an increase of cash, which was used to refinance debt in addition to establishing restricted cash collateral on debt. Messer Griesheim's cash flow from financing activities was €86.0 million in 2000. Cash flows from financing activities principally reflect in net proceeds from additions to non-current corporate debt to €205.7 million in 2000. In relation to the financing of the business, interest paid was €94.4 million in 2000.
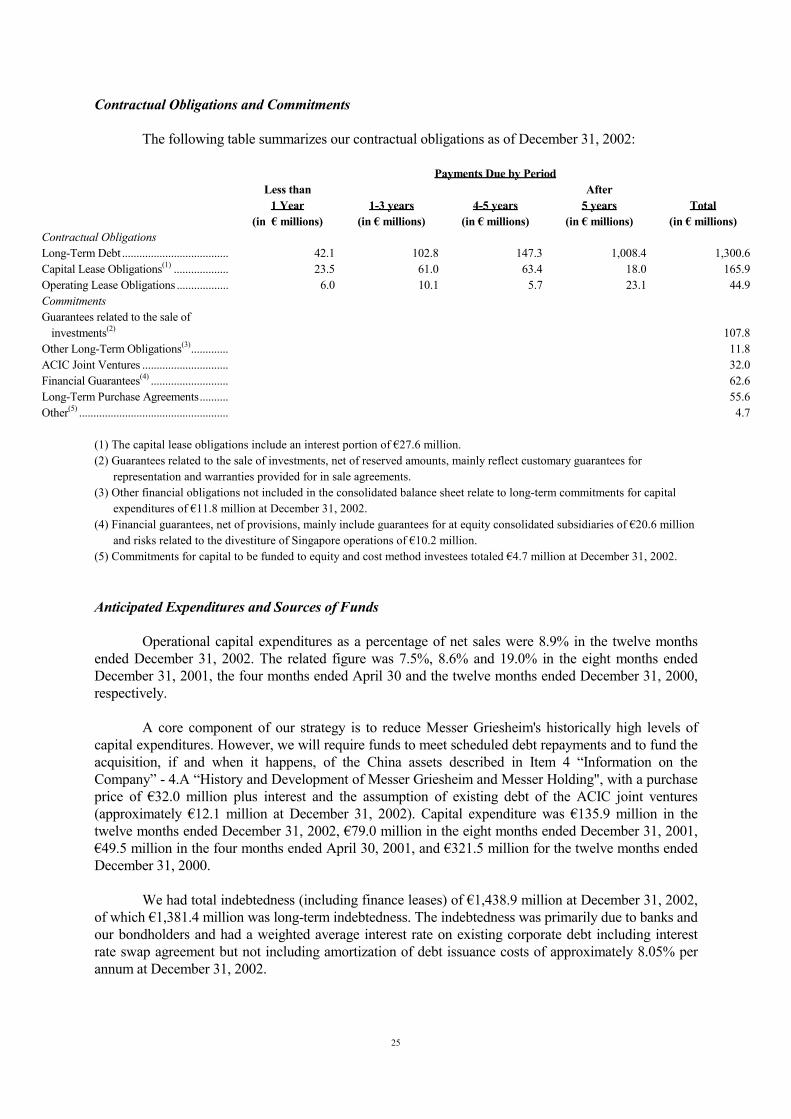
25
Contractual Obligations and Commitments The following table summarizes our contractual obligations as of December 31, 2002:
Payments Due by Period
Less than
1 Year 1-3 years 4-5 years After
5 years Total (in € millions) (in € millions) (in € millions) (in € millions) (in € millions)
Contractual Obligations Long-Term Debt ..................................... 42.1 102.8 147.3 1,008.4 1,300.6 Capital Lease Obligations(1) ................... 23.5 61.0 63.4 18.0 165.9 Operating Lease Obligations .................. 6.0 10.1 5.7 23.1 44.9 Commitments Guarantees related to the sale of
investments(2) 107.8 Other Long-Term Obligations(3)............. 11.8 ACIC Joint Ventures .............................. 32.0 Financial Guarantees(4) ........................... 62.6 Long-Term Purchase Agreements.......... 55.6 Other(5) .................................................... 4.7
(1) The capital lease obligations include an interest portion of €27.6 million. (2) Guarantees related to the sale of investments, net of reserved amounts, mainly reflect customary guarantees for
representation and warranties provided for in sale agreements. (3) Other financial obligations not included in the consolidated balance sheet relate to long-term commitments for capital
expenditures of €11.8 million at December 31, 2002. (4) Financial guarantees, net of provisions, mainly include guarantees for at equity consolidated subsidiaries of €20.6 million
and risks related to the divestiture of Singapore operations of €10.2 million. (5) Commitments for capital to be funded to equity and cost method investees totaled €4.7 million at December 31, 2002. Anticipated Expenditures and Sources of Funds Operational capital expenditures as a percentage of net sales were 8.9% in the twelve months ended December 31, 2002. The related figure was 7.5%, 8.6% and 19.0% in the eight months ended December 31, 2001, the four months ended April 30 and the twelve months ended December 31, 2000, respectively. A core component of our strategy is to reduce Messer Griesheim's historically high levels of capital expenditures. However, we will require funds to meet scheduled debt repayments and to fund the acquisition, if and when it happens, of the China assets described in Item 4 “Information on the Company” - 4.A “History and Development of Messer Griesheim and Messer Holding", with a purchase price of €32.0 million plus interest and the assumption of existing debt of the ACIC joint ventures (approximately €12.1 million at December 31, 2002). Capital expenditure was €135.9 million in the twelve months ended December 31, 2002, €79.0 million in the eight months ended December 31, 2001, €49.5 million in the four months ended April 30, 2001, and €321.5 million for the twelve months ended December 31, 2000. We had total indebtedness (including finance leases) of €1,438.9 million at December 31, 2002, of which €1,381.4 million was long-term indebtedness. The indebtedness was primarily due to banks and our bondholders and had a weighted average interest rate on existing corporate debt including interest rate swap agreement but not including amortization of debt issuance costs of approximately 8.05% per annum at December 31, 2002.

26
Messer Griesheim's principal sources of funds have been cash flow from operations and borrowings from banks. We expect that, going forward, we will finance ongoing operations and implement our cost-savings measures and information-technology improvements with a combination of bank borrowings and operating cash flows. We expect that our other cash requirements will be met through operating cash flows. As of December 31, 2002, we had in place unused credit lines totaling €294.0 million. In addition, certain of our subsidiaries have unused available credit lines under local facilities. We have scheduled finance and operating lease payments over the next three years equal to €29.5 million in 2003, €35.3 million in 2004 and €35.8 million in 2005. Interest Rate Risk Management We are exposed to interest rate risk mainly through our debt instruments. We manage interest rate risk on a group-wide basis with a combination of fixed and floating rate instruments. We have entered into interest rate swap agreements that effectively convert a major portion of our floating rate indebtedness to a fixed rate basis for the next two years, thus reducing the impact of interest rate changes on future interest expense. As of December 31, 2002, approximately 77% of our debt facilities were hedged satisfying the terms of the senior facilities agreement. The remaining 23% of our multicurrency debt facilities have floating rates. With respect to such portion of the debt facilities for each fluctuation in market interest rates of 1%, the interest expense related to such portion of the debt facilities would fluctuate by €3.3 million. Foreign Exchange Risk Management We also are exposed to foreign currency exchange risk related to foreign currency denominated assets and liabilities including debt service payments denominated in foreign currencies. We manage foreign currency exchange risk on a group-wide basis using exchange forward contracts. Our current policy with respect to limiting foreign currency exposure is to economically hedge foreign currency exposures when appropriate. For the majority of our operations, we have local production facilities which generate cash flows in local currencies. These cash flows generally match local expenditures and debt service of these operations, resulting in a 95% or greater "natural hedge" as of December 31, 2002. The most significant foreign exchange rate risks exist in North and Central America, Eastern Europe and China where we produce locally. A portion of our debts serviced by these facilities are in € and U.S. dollars. Accordingly, we are dependent on the stability of currencies in these countries in order to service these debts. The total "hard currency" debt in these countries is €30.1 million. The single largest debt is approximately €14.0 million in Poland. An increase or decrease of 10% of the PLN against the € would result in an impact of approximately €1.4 million on our results of operations. If all the currencies in these countries depreciate against the € and the U.S. dollar, a 10% depreciation would decrease our consolidated net income by approximately €3.0 million. Our functional currency is the €. The net assets outside the "€ zone" are subject to currency fluctuations. The most volatile currencies are those of Eastern Europe, China and Central America. Normally, we do not hedge the net assets of foreign subsidiaries. In the event the € significantly increases in value relative to other currencies, the accounting treatment would result in a charge against our equity without any effect on net income.
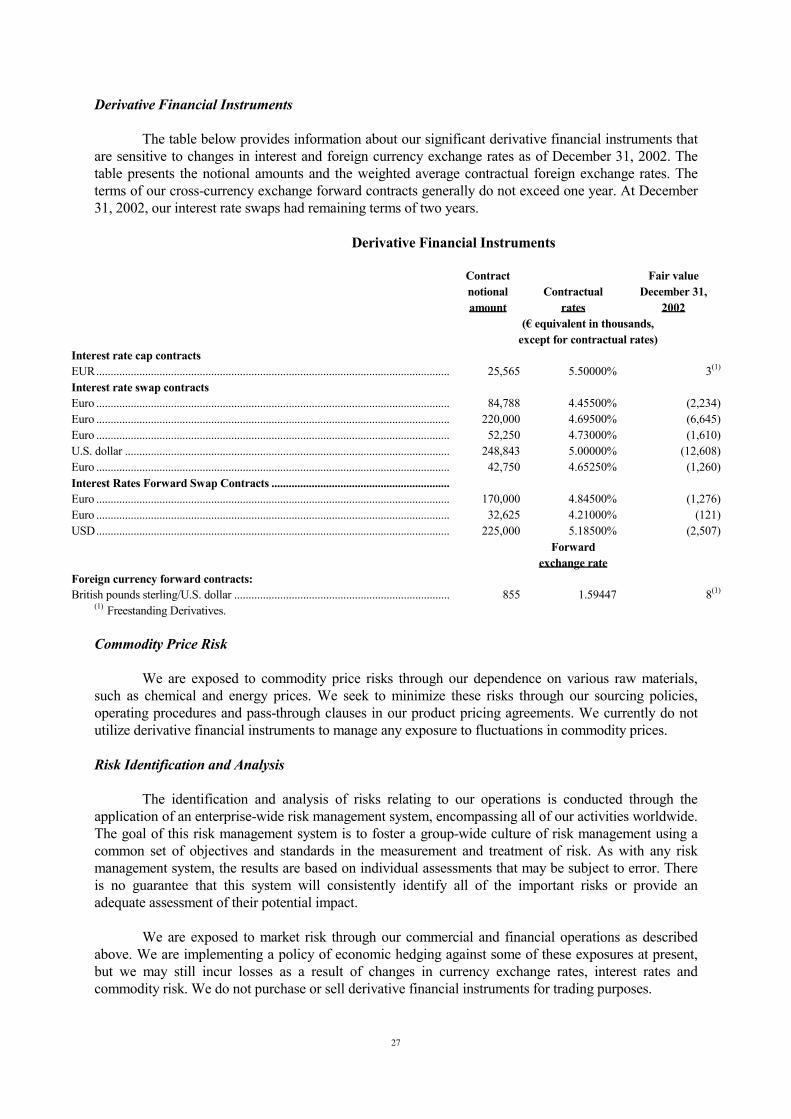
27
Derivative Financial Instruments The table below provides information about our significant derivative financial instruments that are sensitive to changes in interest and foreign currency exchange rates as of December 31, 2002. The table presents the notional amounts and the weighted average contractual foreign exchange rates. The terms of our cross-currency exchange forward contracts generally do not exceed one year. At December 31, 2002, our interest rate swaps had remaining terms of two years. Derivative Financial Instruments
Contract notional amount
Contractual rates
Fair value December 31,
2002
(€ equivalent in thousands,
except for contractual rates) Interest rate cap contracts EUR........................................................................................................................... 25,565 5.50000% 3(1)
Interest rate swap contracts Euro ........................................................................................................................... 84,788 4.45500% (2,234)Euro ........................................................................................................................... 220,000 4.69500% (6,645)Euro ........................................................................................................................... 52,250 4.73000% (1,610)U.S. dollar ................................................................................................................. 248,843 5.00000% (12,608)Euro ........................................................................................................................... 42,750 4.65250% (1,260)Interest Rates Forward Swap Contracts ............................................................... Euro ........................................................................................................................... 170,000 4.84500% (1,276)Euro ........................................................................................................................... 32,625 4.21000% (121)USD........................................................................................................................... 225,000 5.18500% (2,507)
Forward
exchange rate Foreign currency forward contracts: British pounds sterling/U.S. dollar ........................................................................... 855 1.59447 8(1)
(1) Freestanding Derivatives. Commodity Price Risk We are exposed to commodity price risks through our dependence on various raw materials, such as chemical and energy prices. We seek to minimize these risks through our sourcing policies, operating procedures and pass-through clauses in our product pricing agreements. We currently do not utilize derivative financial instruments to manage any exposure to fluctuations in commodity prices. Risk Identification and Analysis The identification and analysis of risks relating to our operations is conducted through the application of an enterprise-wide risk management system, encompassing all of our activities worldwide. The goal of this risk management system is to foster a group-wide culture of risk management using a common set of objectives and standards in the measurement and treatment of risk. As with any risk management system, the results are based on individual assessments that may be subject to error. There is no guarantee that this system will consistently identify all of the important risks or provide an adequate assessment of their potential impact. We are exposed to market risk through our commercial and financial operations as described above. We are implementing a policy of economic hedging against some of these exposures at present, but we may still incur losses as a result of changes in currency exchange rates, interest rates and commodity risk. We do not purchase or sell derivative financial instruments for trading purposes.

28
Outlook A challenging economic environment, highlighted by a downturn of the business climate in Germany and the deterioration of the recovery of the U.S. market in the second half of the year, marked the year 2002. At the same time energy prices which had historical highs in the prior period, decreased throughout the year primarily in the U.S. Following the ongoing economic downturn, especially in Germany, in 2002, we do not expect any significant improvements for the business year 2003. C RESEARCH AND DEVELOPMENT, PATENTS AND LICENSES We have a research and development group which operates primarily in Krefeld, Germany, and in Malvern, Pennsylvania. Research and development activities are also conducted to a minor extent on the local level. The objective of this group is to develop new applications technology that provides solutions to specific customer problems. Additionally, through AGS, our in-house engineering division, we design and manufacture cryogenic industrial gas production facilities at our facilities in Krefeld and Malvern. We spent €12.9 million, €9.5 million, €6.6 million and €24.9 million, on research and development in the twelve months ended December 31, 2002, eight months ended December 31, 2001, the four months ended April 30, 2001 and the twelve months ended December 31, 2000, respectively. A significant portion of our bulk business results from applications developed in cooperation with customers or invented by us for use by our customers. We have proprietary knowledge in the form of approximately 300 application processes and 485 patents in the areas of metallurgy, chemistry, environmental processes, foods, rubber, plastic, paints, cutting and welding, medicine, electronics and cryogenics. As most of our net sales are derived from sales of industrial gases produced through processes that use widely available technology, we do not believe that our business is materially dependent on intellectual property rights. D TRENDS Our future results of operations involve a number of risks and uncertainties. Factors that could affect our future operating results and cause actual results to vary materially from historical results include but are not limited to the following items: • The industrial gas business is highly competitive, which has resulted in a steady trend of
decreasing prices. This highly competitive environment could reduce the profitability and cash flows of our operations in the future.
• We supply a cross section of industries including steel, primary metal, chemicals, oil
refining, food and beverages, healthcare, electronics and glass and enter into long-term contracts over periods of up to 15 years. A significant decline in market demand in any one of these industries could adversely affect future operating results. No single customer represents a significant portion of total revenues. The majority of our revenues are derived in Germany, the rest of Europe and the United States of America, which makes us sensitive to market or economic conditions in these geographic areas.

29
• Energy is the single most significant production cost for us. Although we often can pass through a portion of these energy costs to our customers, increases in energy costs can reduce our profitability significantly.
• We operate globally, making us subject to risks related to the differing political, social
and economic conditions of the various countries in which we conduct our operations.

Page 1 of 66
INDEX TO THE FINANCIAL STATEMENTS MESSER GRIESHEIM HOLDING AG Page Independent Auditors' Reports ..................................................................................................................................... F-3 Consolidated Statements of Operations for the twelve months ended December 31, 2002, the eight months ended
December 31, 2001, the four months ended April 30, 2001 (predecessor) and for the twelve months ended December 31, 2000 (predecessor) ................................................................................................................................
F-4
Consolidated Balance Sheets as of December 31, 2002 and as of December 31, 2001 .............................................
F-5
Consolidated Statements of Changes in Stockholders’ Equity for the twelve months ended December 31, 2002,
the eight months ended December 31, 2001, the four months ended April 30, 2001 (predecessor) and for the twelve months ended December 31, 2000 (predecessor) ............................................................................................
F-6
Consolidated Cash Flow Statements for the twelve months ended December 31, 2002, the eight months ended
December 31, 2001, the four months ended April 30, 2001 (predecessor) and for the twelve months ended December 31, 2000 (predecessor) ................................................................................................................................
F-7
Notes to the Consolidated Financial Statements..........................................................................................................
F-8

Page 2 of 66
INDEPENDENT AUDITOR'S REPORT To the Management Board of Messer Griesheim Holding AG We have audited the accompanying consolidated balance sheets of Messer Griesheim Holding AG ("Messer Holding", "the Successor" or "the Company") and its subsidiaries as of December 31, 2002 and 2001, the related consolidated statements of operations, changes in stockholders' equity and cash flows for the twelve months ended December 31, 2002 and the eight months ended December 31, 2001, and the related consolidated statements of operations, changes in stockholders' equity and cash flows of Messer Griesheim GmbH (“Messer Griesheim” or “the Predecessor”) and its subsidiaries for the four months ended April 30, 2001 and the twelve months ended December 31, 2000. The Successor and Predecessor consolidated financial statements are the responsibility of management. Our responsibility is to express an opinion on these consolidated financial statements based on our audits. We did not audit the financial statements of Singapore Syngas Pte Ltd, a 50% owned equity method investee company of the Predecessor in the year ended December 31, 2000. The Predecessor's equity in losses of Singapore Syngas Pte Ltd for the twelve months ended December 31, 2000 was €165.3 million (after giving effect to provisions and write-offs of the investment by the Predecessor of €61.2 million). The Singapore Syngas Pte Ltd financial statements as of December 31, 2000 and for the year then ended were audited by other auditors whose report has been provided to us, and our opinion, insofar as it relates to the amounts included for Singapore Syngas Pte Ltd, is based solely on the report of the other auditors. We conducted our audits in accordance with auditing standards generally accepted in the United States of America. Those standards require that we plan and perform an audit to obtain reasonable assurance about whether the financial statements are free of material misstatement. An audit includes examining, on a test basis, evidence supporting the amounts and disclosures in the financial statements. An audit also includes assessing the accounting principles used and significant estimates made by management, as well as evaluating the overall financial statement presentation. We believe that our audit and the report of other auditors provide a reasonable basis for our opinion. In our opinion, based on our audit and, with respect to the twelve months ended December 31, 2000, the report of the other auditors, the consolidated financial statements referred to above present fairly, in all material respects, the financial position of the Successor and its subsidiaries as of December 31, 2002 and 2001, and the results of their operations and their cash flows for the twelve months ended December 31, 2002 and the eight months ended December 31, 2001, and the results of operations and cash flows of the Predecessor and its subsidiaries for the four months ended April 30, 2001 and the twelve months ended December 31, 2000, in conformity with International Financial Reporting Standards as promulgated by the International Accounting Standards Board. The report of the other auditors on the financial statements of Singapore Syngas Pte Ltd as of and for the year ended December 31, 2000, includes an explanatory paragraph regarding substantial doubt about Singapore Syngas Pte Ltd's ability to continue as a going concern. As disclosed in Note 18 to the Messer Griesheim Holding AG consolidated financial statements, the Predecessor had recorded losses of €165.3 million with respect to the Singapore Syngas Pte Ltd for the year ended December 31, 2000. International Financial Reporting Standards vary in certain significant respects from accounting principles generally accepted in the United States of America. Application of accounting principles generally accepted in the United States of America would have affected the results of operations for the twelve months ended December 31, 2002, the eight months ended December 31, 2001, the four months ended April 30, 2001 and the twelve months ended December 31, 2000 and stockholders' equity as of December 31, 2002 and 2001, to the extent summarized in Note 40 to the accompanying consolidated financial statements. Duesseldorf
March 27, 2003 KPMG Deutsche Treuhand-Gesellschaft Aktiengesellschaft Wirtschaftsprüfungsgesellschaft

Page 3 of 66
MESSER GRIESHEIM HOLDING AG
CONSOLIDATED STATEMENTS OF OPERATIONS (Amounts in € thousands, unless otherwise stated)
Successor Predecessor
Note Twelve months ended
December 31, 2002
Eight months ended
December 31, 2001(1)
Four months ended
April 30, 2001
Twelve months ended
December 31, 2000
Net sales.............................................................................. 1,525,996 1,046,588 574,463 1,695,923 Cost of sales........................................................................ (748,783) (528,416) (293,414) (844,534) Gross profit........................................................................ 777,213 518,172 281,049 851,389
Distribution and selling costs ............................................. (476,502) (342,184) (177,182) (568,942) Research and development costs........................................ (12,918) (9,542) (6,599) (24,938) General and administrative costs........................................ (127,555) (90,829) (45,027) (127,722) Other operating income...................................................... 7 25,665 10,658 10,242 38,010 Other operating expense..................................................... 8 (40,396) (23,526) (11,133) (21,723) Impairment of intangible assets and property, plant and
equipment ........................................................................ 10 (1,543) — (2,356) (128,592)
Restructuring and reorganization charges.......................... 11 (12,782) (25,266) (2,540) (20,361) Operating profit (loss)...................................................... 131,182 37,483 46,454 (2,879)
Equity method investments expense, net ........................... 18 (12,621) (15,213) (5,106) (207,952) Other investment expense, net ........................................... 9 (4,693) (4,456) (4,544) (14,757) Interest expense, net ........................................................... 12 (140,022) (103,379) (36,364) (88,520) Changes in fair value of investments in subsidiaries
available for sale..............................................................
13
(1,577)
(5,472)
—
— Other financial income (expense), net ............................... (16,261) 255 (6,990) (4,959) Non-operating expense..................................................... (175,174) (128,265) (53,004) (316,188)
Loss from continuing operations .................................... (43,992) (90,782) (6,550) (319,067) Loss from disposal of discontinuing operations ................ 14 _____— _____— ____— (17,120) Loss before income taxes and minority interests .......... (43,992) (90,782) (6,550) (336,187) Income tax benefit (expense) ............................................. 15 (34,759) 26,163 (4,813) 138,232
Loss before minority interests......................................... (78,751) (64,619) (11,363) (197,955) Minority interests, net of income taxes .............................. 30 (11,120) (4,912) (2,135) (7,610)
Net loss ............................................................................... (89,871) (69,531) (13,498) (205,565) (1) Certain reclassifications have been made to conform to the current period classification (see Note 2 “Accounting Principles”). The accompanying Notes are an integral part of these consolidated financial statements.

Page 4 of 66
MESSER GRIESHEIM HOLDING AG CONSOLIDATED BALANCE SHEETS
(Amounts in € thousands, unless otherwise stated)
Note As of December 31,
2002
As of December 31,
2001(1)
Assets Intangible assets....................................................................................... 16 790,878 852,809 Property, plant and equipment ................................................................ 17 1,516,310 1,697,679 Equity method investments ..................................................................... 18 13,200 19,186 Other investments and longterm loans.................................................... 19,20 36,861 59,347 Deferred tax assets................................................................................... 15 3,734 4,546 Other long-term receivables, net and other assets .................................. 21,966 43,081 Non-current assets ................................................................................. 2,382,949 2,676,648
Inventories ............................................................................................... 21 72,585 80,098 Trade accounts receivable, net ................................................................ 22 279,099 290,743 Investments in subsidiaries available for sale......................................... 13 18,078 42,183 Other receivables and other assets .......................................................... 23 50,879 71,796 Cash and cash equivalents....................................................................... 24 135,218 188,018 Current assets ........................................................................................ 555,859 672,838
Total assets ............................................................................................. 2,938,808 3,349,486
Stockholders’ equity and liabilities Issued capital and reserves ...................................................................... 967,180 967,180 Accumulated deficit................................................................................. (159,402) (69,531) Cumulative other comprehensive income............................................... (72,291) 5,740 Stockholders’ equity.............................................................................. 29 735,487 903,389
Minority interests .................................................................................. 30 84,012 88,138
Provisions for pensions and similar obligations ..................................... 25 169,287 166,356 Other provisions ...................................................................................... 26 68,529 39,127 Corporate debt, less current portion ........................................................ 27 1,327,120 1,540,312 Deferred tax liabilities ............................................................................. 15 104,523 135,933 Other liabilities ........................................................................................ 23,723 25,353
Non-current liabilities ........................................................................... 1,693,182 1,907,081
Other provisions ...................................................................................... 26 106,849 136,863 Corporate debt ......................................................................................... 27 48,298 40,927 Trade accounts payable ........................................................................... 124,697 122,639 Miscellaneous liabilities .......................................................................... 28 146,283 150,449 Current liabilities................................................................................... 426,127 450,878
Total stockholders’ equity and liabilities ............................................ 2,938,808 3,349,486 (1) Certain reclassifications have been made to conform to the current period classification (see Note 2 “Accounting Principles”). The accompanying Notes are an integral part of these consolidated financial statements.

Page 5 of 66
MESSER GRIESHEIM HOLDING AG CONSOLIDATED STATEMENTS OF CHANGES IN STOCKHOLDERS’ EQUITY
(Amounts in € thousands, unless otherwise stated)
Predecessor Other comprehensive income
Subscribed
capital
Additional Paid-in capital
Retained earnings (deficit)
Hedging reserve
Translation
Reserve
Cumulative other comprehensive
income
Total Stockholders’
equity Balance as of December 31, 1999(1).................
276,098 118,722 269,074
—
53,113
53,113 717,007
Capital contribution .................... — 39,664 — — — — 39,664Dividend payments..................... — — (143,673) — — — (143,673)Net loss ....................................... — — (205,565) — — — (205,565)Translation adjustment ............... — — — — 31,091 31,091 31,091Balance as of December 31, 2000....................
276,098 158,386 (80,164)
—
84,204
84,204 438,524
IAS 39 transition adjustment...... — — 335 — — — 335Net loss ....................................... — — (13,498) — — — (13,498)Translation adjustment ............... — — — — 3,522 3,522 3,522 Balance as of April 30, 2001 .... 276,098 158,386 (93,327) — 87,726 87,726 428,883
Successor Other comprehensive income
Subscribed
capital
Additional Paid-in capital
Retained earnings (deficit)
Hedgingreserve
Translation
Reserve
Cumulative other comprehensive
income
Total Stockholders’
equity Balance as of May 1, 2001................... 90 967,090 — — — — 967,180 Change in fair value of derivatives....... — — — (9,199) — (9,199) (9,199) Net loss .................................................... — — (69,531) — — — (69,531) Cumulative Translation adjustment...... — — — — 14,939 14,939 14,939 Balance as of December 31, 2001 ...... 90 967,090 (69,531) (9,199) 14,939 5,740 903,389 Change in fair value of derivatives....... — — — (7,744) — (7,744) (7,744) Net loss .................................................... — — (89,871) — — — (89,871) Cumulative Translation adjustment...... — — — — (70,287) (70,287) (70,287)
Balance as of December 31, 2002 ...... 90 967,090 (159,402) (16,943) (55,348) (72,291) 735,487
(1)These amounts have been converted using the official rate of €1.00 to DM 1.95583. The accompanying Notes are an integral part of these consolidated financial statements.
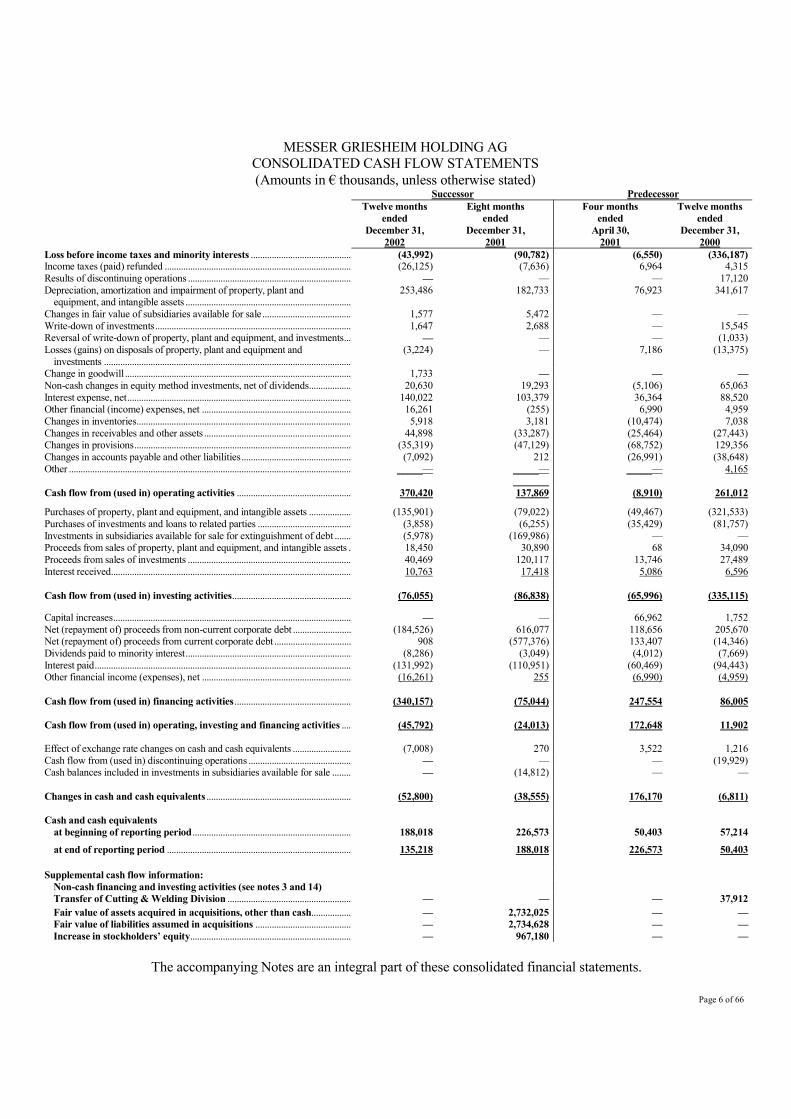
Page 6 of 66
MESSER GRIESHEIM HOLDING AG CONSOLIDATED CASH FLOW STATEMENTS (Amounts in € thousands, unless otherwise stated)
Successor Predecessor Twelve months
ended December 31,
2002
Eight months ended
December 31, 2001
Four months ended
April 30, 2001
Twelve months ended
December 31, 2000
Loss before income taxes and minority interests ........................................... (43,992) (90,782) (6,550) (336,187) Income taxes (paid) refunded ................................................................................ (26,125) (7,636) 6,964 4,315 Results of discontinuing operations ...................................................................... — — — 17,120 Depreciation, amortization and impairment of property, plant and
equipment, and intangible assets .......................................................................253,486 182,733 76,923 341,617
Changes in fair value of subsidiaries available for sale...................................... 1,577 5,472 — — Write-down of investments.................................................................................... 1,647 2,688 — 15,545 Reversal of write-down of property, plant and equipment, and investments... — — — (1,033) Losses (gains) on disposals of property, plant and equipment and
investments ..........................................................................................................(3,224) — 7,186 (13,375)
Change in goodwill ................................................................................................. 1,733 — — — Non-cash changes in equity method investments, net of dividends.................. 20,630 19,293 (5,106) 65,063 Interest expense, net................................................................................................ 140,022 103,379 36,364 88,520 Other financial (income) expenses, net ................................................................ 16,261 (255) 6,990 4,959 Changes in inventories............................................................................................ 5,918 3,181 (10,474) 7,038 Changes in receivables and other assets ............................................................... 44,898 (33,287) (25,464) (27,443) Changes in provisions............................................................................................. (35,319) (47,129) (68,752) 129,356 Changes in accounts payable and other liabilities............................................... (7,092) 212 (26,991) (38,648) Other ......................................................................................................................... _____— _____— _____— 4,165 _______ Cash flow from (used in) operating activities ................................................. 370,420 137,869 (8,910) 261,012
Purchases of property, plant and equipment, and intangible assets .................. (135,901) (79,022) (49,467) (321,533) Purchases of investments and loans to related parties ........................................ (3,858) (6,255) (35,429) (81,757) Investments in subsidiaries available for sale for extinguishment of debt ....... (5,978) (169,986) — — Proceeds from sales of property, plant and equipment, and intangible assets . 18,450 30,890 68 34,090 Proceeds from sales of investments ...................................................................... 40,469 120,117 13,746 27,489 Interest received....................................................................................................... 10,763 17,418 5,086 6,596 Cash flow from (used in) investing activities................................................... (76,055) (86,838) (65,996) (335,115)
Capital increases...................................................................................................... — — 66,962 1,752 Net (repayment of) proceeds from non-current corporate debt ......................... (184,526) 616,077 118,656 205,670 Net (repayment of) proceeds from current corporate debt ................................. 908 (577,376) 133,407 (14,346) Dividends paid to minority interest....................................................................... (8,286) (3,049) (4,012) (7,669) Interest paid.............................................................................................................. (131,992) (110,951) (60,469) (94,443) Other financial income (expenses), net ................................................................ (16,261) 255 (6,990) (4,959) Cash flow from (used in) financing activities.................................................. (340,157) (75,044) 247,554 86,005 Cash flow from (used in) operating, investing and financing activities .... (45,792) (24,013) 172,648 11,902 Effect of exchange rate changes on cash and cash equivalents ......................... (7,008) 270 3,522 1,216 Cash flow from (used in) discontinuing operations ............................................ — — — (19,929) Cash balances included in investments in subsidiaries available for sale ........ — (14,812) — — Changes in cash and cash equivalents .............................................................. (52,800) (38,555) 176,170 (6,811) Cash and cash equivalents at beginning of reporting period.................................................................... 188,018 226,573 50,403 57,214
at end of reporting period ............................................................................... 135,218 188,018 226,573 50,403
Supplemental cash flow information: Non-cash financing and investing activities (see notes 3 and 14) Transfer of Cutting & Welding Division ..................................................... — — — 37,912 Fair value of assets acquired in acquisitions, other than cash................. — 2,732,025 — — Fair value of liabilities assumed in acquisitions ......................................... — 2,734,628 — — Increase in stockholders’ equity..................................................................... — 967,180 — — The accompanying Notes are an integral part of these consolidated financial statements.

Page 7 of 66
MESSER GRIESHEIM HOLDING AG NOTES TO THE CONSOLIDATED FINANCIAL STATEMENTS (Amounts in € thousands, unless otherwise stated) 1. Background and basis of presentation Messer Griesheim Holding AG ("the Company" or "Successor") is a supplier of industrial gases. The Company produces and markets industrial gases (including oxygen, nitrogen, argon, helium, carbon dioxide, hydrogen and rare & high-purity gases), gas application processes and customer-site gas production systems. The Company's primary customers include major industrial, chemical and pharmaceutical manufacturers, and the food processing and waste treatment industries. As of December 31, 2002 the sole owner of the shares of Messer Griesheim Holding AG is Messer Griesheim Group GmbH & Co. KGaA. The Company is a holding company, whose consolidated financial statements include the accounts of Messer Griesheim GmbH and all companies which it controls (collectively, "the Messer Group", "Messer" or "the Group"). The Successor, incorporated on November 6, 1996, was a dormant company until April 30, 2001, when it was activated to become the holding company for the shares of Messer Griesheim GmbH ("Messer Griesheim" or "Predecessor"). As of December 31, 2000, the Successor had net assets aggregating €44.9, represented by current assets of €50.7 and current liabilities of €5.8. As discussed in Note 3 “Acquisition transactions”, the Predecessor was re-capitalized to effect the acquisition transactions which have been accounted for at fair value. Accordingly, the assets and liabilities of the Group have been recorded at their estimated fair values as of April 30, 2001, the date of the acquisition transactions. As a result, the financial statements of the Group for periods prior to the acquisition are not comparable to the Group's financial statements for periods subsequent to the acquisition. To highlight this lack of comparability, a solid vertical line has been inserted, where applicable, to distinguish information pertaining to the pre-acquisition and post-acquisition periods. The refinancing transactions and the divestiture program adopted by the Group are described in Notes 4 “Financing transactions” and 13 “Divestiture program”, respectively. 2. Accounting Principles The consolidated financial statements have been prepared in accordance with International Financial Reporting Standards ("IFRS") as adopted by the International Accounting Standards Board. The Group applied all International Accounting Standards and Interpretations of the Standing Interpretations Committee (SIC) effective as of December 31, 2002, 2001 and 2000, respectively. Consolidation The complete list of Group ownership interests is provided in a joint listing and filed with the Commercial Register in Husum, Germany. Significant subsidiaries as of December 31, 2002 are as follows:

Page 8 of 66
Name and Office of Subsidiary Country of
Incorporation or Residence
Ownership Percentage
Messer Griesheim GmbH (Frankfurt a.M.) .................................................................... Germany 100% Messer Griesheim Industries, Inc. (Malvern, Pennsylvania) ......................................... United States 100% Messer France S.A. (Asnieres)........................................................................................ France 100% Messer Hungarogáz Kft. (Budapest)............................................................................... Hungary 100% Messer U.K. Ltd. (Reigate) ............................................................................................. United Kingdom 100% Messer Austria GmbH (Gumpoldskirchen).................................................................... Austria 100% Messer B.V. (Moerdijk) .................................................................................................. Netherlands 100% Messer Croatia Plin d.d. (Zapresic)................................................................................. Croatia 99.96% Messer Belgium N.V. (Machelen) .................................................................................. Belgium 99.41% Messer Polska Spólka z.o.o. (Chorzów) ......................................................................... Poland 98.54% Tehnogas AD (Beograd) ................................................................................................. Serbia 60%
The consolidated financial statements as of December 31, 2002 include the accounts of Messer Griesheim Holding AG and subsidiaries. The difference between the acquisition cost of a subsidiary and the book value at the time of the acquisition of the portion of the net equity acquired is allocated to the subsidiary's assets and liabilities based on their respective fair values. Any remaining excess is capitalized as goodwill and amortized over its estimated useful life. Intercompany accounts and transactions are eliminated in consolidation. Purchase price allocation In 2000 and 2001, former shareholders Hoechst AG and Messer family entered into several transactions with the new shareholders of the Company. At the end of these transactions, all shares of Messer Griesheim GmbH became owned by Messer Griesheim Holding AG. The foregoing transactions have been accounted for in a manner similar to an acquisition of Messer Griesheim and, accordingly, the acquisition costs have been allocated to the assets acquired and liabilities assumed based on their estimated fair values as of April 30, 2001, the acquisition date. IAS 22 requires that the cost of an acquisition be allocated to the identifiable assets and liabilities as recognized by reference to their fair values at the date of the exchange transaction. The Company engaged the services of an outside specialist to determine the fair value and assist in allocating the purchase price, which was completed in March 2002. As a result, the December 31, 2001 financial statements reflect the finalization of all adjustments to assets acquired and liabilities assumed. The cost of acquisition may be adjusted pending resolution of certain contingencies (see Note 3 “Acquisition transaction”). Investments in subsidiaries available for sale As described in Note 3 “Acquisition transactions”, a change in ownership of the Group occurred on April 30, 2001. Following the acquisition, in May 2001, the Group adopted a divestiture program pursuant to which it intended to sell substantially all of the assets and operations in its non-core markets, located in Asia, Africa and Latin America, as well as certain non-strategic operations in its core markets. As further described in Note 3 “Acquisition transactions”, the acquisition transaction was accounted for in a manner similar to a "purchase" business combination and, accordingly, the cost of the acquisition has been allocated to the assets acquired and liabilities assumed, including those to be disposed of under the divestiture program, based on their estimated fair values as of April 30, 2001, the date of the acquisition transaction.

Page 9 of 66
The assets and operations included in the divestiture program include certain subsidiaries, and net assets comprising other operations. Management originally expected to substantially divest of these assets and operations by no later than the end of calendar year 2002. The subsidiaries and net assets included in the divestiture program have been accounted for in the following manner: • Subsidiaries expected to be sold within twelve months from the date of the acquisition transaction (i.e., by
no later than April 30, 2002) are not consolidated, as control is intended to be temporary. The Group's interests in such subsidiaries are classified as financial instruments and are reflected in the Group's balance sheet at their estimated fair value in current assets, under the caption: "Investments in subsidiaries available for sale". Current period changes in the estimated fair value of such subsidiaries resulting from operating results are reflected in the consolidated statements of operations under the caption: "Changes in fair value of subsidiaries available for sale". As of December 31, 2002 the sale of the remaining subsidiaries in Indonesia and Peru has not yet been consummated (see also Note 38 “Subsequent Events”).
• Subsidiaries originally expected to be sold subsequent to April 30, 2002, as well as the net assets of other
operations held for sale, are consolidated until sold. Intangible assets The excess of the Group's cost of acquired businesses over the fair value of the assets acquired and liabilities assumed (goodwill) resulting from the acquisition transactions is capitalized and amortized on a straight-line basis over an estimated useful life of 20 years. In determining the economic useful life of goodwill, the Group considers the stability of the acquired company's markets and the strength of the acquired company's market position. Amortization of goodwill is included in "other operating expense". Intangible assets other than goodwill, including patents, licenses, trademarks, software and other similar assets, are capitalized at acquisition cost and amortized on a straight-line basis over their estimated useful lives of 3 to 20 years. Amortization of intangible assets, other than goodwill, is included as an expense in the related functional costs. Property, plant and equipment Property, plant and equipment are capitalized at acquisition or manufacturing costs, net of government grants, and depreciated over their estimated useful lives. The manufacturing costs of self-constructed assets are based on directly allocable itemized costs and appropriate overhead costs, including depreciation. Finance costs related to the construction of property, plant and equipment are capitalized as part of the manufacturing costs. In the case of disposals, the assets and related accumulated depreciation are removed from the accounts and the net amount, less proceeds from disposal, is charged to the income statement. Repair costs are charged to expense when incurred. Depreciation of property, plant and equipment is based on a straight-line basis over the assets useful lives as follows: Buildings…………………………………………………………. 10 to 50 years Plant and machinery…………………………………... 10 to 20 years Other plant, factory and office equipment…………….. 3 to 20 years
When the Group leases assets under the terms of a long-term contract or other arrangement that transfers substantially all of the benefits and risks of ownership to the Group, the leased property is capitalized at the lower of the fair value of the asset or the present value of future minimum lease payments and the corresponding obligation is recorded as a liability. Leased assets are amortized on a straight-line basis over the lives of the respective leases.
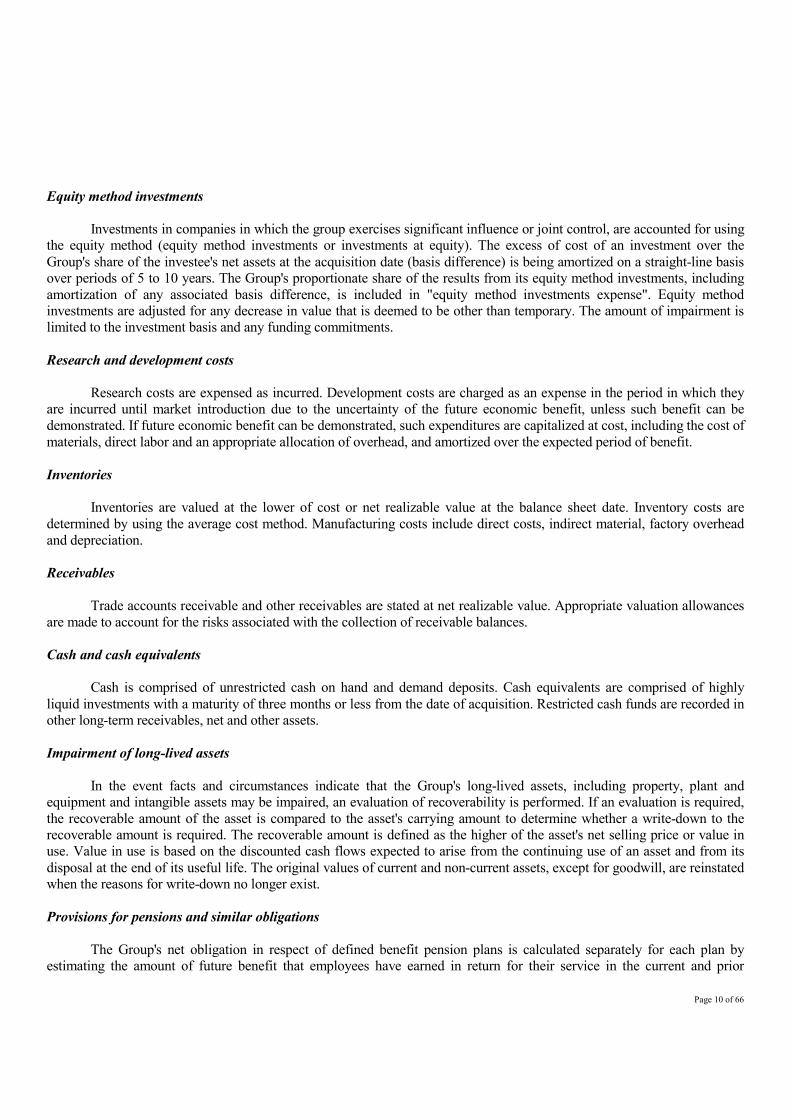
Page 10 of 66
Equity method investments Investments in companies in which the group exercises significant influence or joint control, are accounted for using the equity method (equity method investments or investments at equity). The excess of cost of an investment over the Group's share of the investee's net assets at the acquisition date (basis difference) is being amortized on a straight-line basis over periods of 5 to 10 years. The Group's proportionate share of the results from its equity method investments, including amortization of any associated basis difference, is included in "equity method investments expense". Equity method investments are adjusted for any decrease in value that is deemed to be other than temporary. The amount of impairment is limited to the investment basis and any funding commitments. Research and development costs Research costs are expensed as incurred. Development costs are charged as an expense in the period in which they are incurred until market introduction due to the uncertainty of the future economic benefit, unless such benefit can be demonstrated. If future economic benefit can be demonstrated, such expenditures are capitalized at cost, including the cost of materials, direct labor and an appropriate allocation of overhead, and amortized over the expected period of benefit. Inventories Inventories are valued at the lower of cost or net realizable value at the balance sheet date. Inventory costs are determined by using the average cost method. Manufacturing costs include direct costs, indirect material, factory overhead and depreciation. Receivables Trade accounts receivable and other receivables are stated at net realizable value. Appropriate valuation allowances are made to account for the risks associated with the collection of receivable balances. Cash and cash equivalents Cash is comprised of unrestricted cash on hand and demand deposits. Cash equivalents are comprised of highly liquid investments with a maturity of three months or less from the date of acquisition. Restricted cash funds are recorded in other long-term receivables, net and other assets. Impairment of long-lived assets In the event facts and circumstances indicate that the Group's long-lived assets, including property, plant and equipment and intangible assets may be impaired, an evaluation of recoverability is performed. If an evaluation is required, the recoverable amount of the asset is compared to the asset's carrying amount to determine whether a write-down to the recoverable amount is required. The recoverable amount is defined as the higher of the asset's net selling price or value in use. Value in use is based on the discounted cash flows expected to arise from the continuing use of an asset and from its disposal at the end of its useful life. The original values of current and non-current assets, except for goodwill, are reinstated when the reasons for write-down no longer exist. Provisions for pensions and similar obligations The Group's net obligation in respect of defined benefit pension plans is calculated separately for each plan by estimating the amount of future benefit that employees have earned in return for their service in the current and prior
Page 11 of 66
periods; that benefit is discounted to determine the present value, and the fair value of any plan assets is deducted. The calculation is performed by a qualified actuary using the projected unit credit method. When the benefits of a plan are improved, the portion of increased benefit relating to past service by employees is recognized as an expense in the income statement on a straight-line basis over the average period until the benefits become vested. To the extent that any cumulative unrecognized actuarial gain or loss exceeds ten percent of the greater of the present value of the defined projected benefit obligation or the fair value of the plan assets, it is recognized in the income statement over the expected average remaining working lives of the employees participating in the plan. Otherwise, the cumulative unrecognized actuarial gain or loss is not recognized. Obligations for severance and early retirement benefits are generally determined through actuarial calculations using discount rates and salary trends prevailing in the respective countries. Obligations for contributions to defined contribution plans are recognized as an expense in the income statement as incurred. Other provisions Other provisions are recognized when it is probable that an obligation has been incurred and a reasonable estimate of the amount can be made. Trade accounts payable and other liabilities Trade accounts payable and other liabilities are carried at the expected settlement amount. Derivative financial instruments The Group's activities expose it to a variety of financial risks, including the effects of foreign currency exchange rates and interest rates. The Group's overall risk management program focuses on the unpredictability of financial markets and seeks to minimize potential adverse effects on the financial performance of the Group. The Group uses derivative financial instruments such as foreign exchange contracts and interest rate swaps to hedge interest rate and foreign exchange risks. Risk management is carried out by a central treasury department (Group Treasury) under policies approved by the Management Board. Group Treasury identifies, evaluates and hedges financial risks. The policies contain written principles for overall risk management, as well as written policies covering specific areas, such as foreign exchange risk, interest rate risk, and use of derivative financial instruments and investing excess liquidity. The Group operates internationally and is exposed to foreign exchange risk arising from various currency exposures primarily U.S. dollars (US$) and British Pound (GBP). Group Treasury is responsible for hedging the exposure to foreign currency risk by using currency borrowings and external forward currency contracts. Additionally, the Group hedges the foreign currency exposure of its major foreign contract commitments to purchase or sell certain production parts mainly in US$ and GBP denominated transactions. The Group's income and operating cash flows are substantially independent of changes in market interest rates. The Group has no significant interest-bearing assets. The Group borrows at variable rates and uses interest rate swaps as cash flow hedges of future interest payments, which have the economic effect of converting borrowings from floating rates to fixed rates. Under the interest rate swaps, the Group agrees with other parties to exchange, at specified intervals, the difference between fixed contract rates and floating rate interest amounts calculated by reference to the agreed notional principal amounts.

Page 12 of 66
Derivative financial instruments are initially recognized in the balance sheet at cost and subsequently are remeasured to fair value. The method of recognizing the resulting gain or loss is dependent on the nature of the item being hedged. On the date a derivative contract is entered into, the Group designates certain derivatives as either (1) a hedge of the fair value of a recognized asset or liability (fair value hedge), or (2) a hedge of a forecasted transaction or of a firm commitment (cash flow hedge). Changes in the fair value of derivatives that are designated and qualify as fair value hedges and that are highly effective, are recorded in the income statement, along with any changes in the fair value of the hedged asset or liability that is attributable to the hedged risk. Changes in the fair value of derivatives that are designated and qualify as cash flow hedges and that are highly effective, are recognized in equity. Where the forecasted transaction or firm commitment results in the recognition of an asset or a liability, the gains and losses previously deferred in equity are transferred from equity and included in the initial measurement of the cost of the asset or liability. Otherwise, amounts deferred in equity are transferred to the income statement and classified as revenue or expense in the same periods during which the hedged firm commitment or forecasted transaction affects the income statement. Certain derivative transactions, while providing effective economic hedges under the Group's risk management policies, do not qualify for hedge accounting under the specific rules in IAS 39. Changes in the fair value of any derivative instruments that do not qualify for hedge accounting under IAS 39 are recognized immediately in the statement of operations. When a hedging instrument expires or is sold, or when a hedge no longer meets the criteria for hedge accounting under IAS 39, any cumulative gain or loss existing in equity at that time remains in equity and is recognized when the committed or forecasted transaction ultimately is recognized in the statement of operations. However, if a committed or forecasted transaction is no longer expected to occur, the cumulative gain or loss that was reported in equity is immediately recognized in the statement of operations. Deferred income taxes Deferred income taxes are recorded for temporary differences between the carrying amounts of assets or liabilities in the balance sheet and their associated tax bases, as well as for operating loss and tax credit carry forwards. Deferred taxes are based on the currently enacted tax rates. Deferred tax assets are recognized to the extent that it is probable that future taxable profit will be available against which the unused tax losses can be utilized. Deferred tax assets and deferred tax liabilities are offset only if they relate to income taxes levied by the same tax authority and the enterprise has a legally enforceable right to offset tax assets against tax liabilities. Stock-Based Compensation As described in Note 37 “Stock purchase and option plan”, and in the absence of a specific standard for the measurement of compensation expenses under IFRS, the Company has elected to measure compensation costs by using the intrinsic value approach, pursuant to which compensation cost is equal to the difference between the market value of the share under option and the exercise price at the measurement date. The measurement date is the first date on which both the exercise price and the number of shares under option become fixed. This method of measurement is consistent with Accounting Principles Board Opinion (APBO) No. 25, "Accounting for Stock Issued to Employees". In accordance with the requirements of SFAS No. 123 "Accounting for Stock Based Compensation" the pro forma disclosures relating to net income as if SFAS No. 123 had been used to measure compensation costs are presented when appropriate.
Page 13 of 66
Revenue recognition a Bulk supply sales Bulk supplies are stored in tanks, which the Group owns and leases to the customer on the customers’ premises. The Group delivers gases to customers by tanker trucks, tube trailers or rail cars, from which it transfers the gases to the leased tanks. The agreements used in the bulk supply business in Germany typically have a term of two to three years. Bulk-supply contracts in the United States typically have a five to seven year term. Revenue is recognized on bulk supply sales when the gases are delivered to the tanks. Income from rental of tanks is recognized on a straight line basis over the terms of the rental agreements. b Cylinder sales Customers requiring small volumes of gases (including most specialty gases) are supplied products in cylinders which the Group typically owns and rents to the customer. Cylinder gases are generally sold by purchase orders or by contracts with terms ranging between one to two years in Europe and three to five years in the United States. Revenue is recognized on the gas sale when delivery occurs. Income on the rental of cylinder is recognized on a straight line basis over the terms of the rental agreements. c On-site sales and pipeline sales Customers that require large volumes of industrial gases (typically oxygen, nitrogen, hydrogen and carbon monoxide) and that have a relatively constant demand are typically supplied by plants built adjacent to or on these customers' facilities. The Messer Group owns and maintains these plants. The product supply contracts typically have terms of 10 to 15 years, and contain minimum take or pay purchase requirements and price escalation provisions under the terms of the contract. Revenue is recognized when delivery has taken place. Where the customer does not take delivery of the minimum purchase requirements, the Group records the additional revenue up to the contractual minimum on a periodic basis. Contractual sales made through pipelines typically have similar terms and accounting treatment. Distribution and selling costs Distribution and selling costs include all expenses which are related to the sale and marketing of a product. This mainly includes expenses for the sales department, representatives' commissions, packaging and delivery, freight, transportation insurance, insurance coverage for receivables, securing of foreign currency receivables, bank fees for exporting, advertising (related to the product), technical customer consulting, samples and exhibitions. Reclassifications Certain reclassifications have been made to the presentation of prior periods to conform to the current period classification.
a. Consolidated statements of operations In 2002, the Successor included the depreciation for tanks and cylinders representing packaging costs in distribution and selling costs. In the consolidated statement of operations for the eight months ended December 31, 2001, these costs were treated as an expense in cost of sales of the Successor. This change in classification resulted in a decrease amounting to €36,500 in cost of sales and a corresponding increase in distribution and selling costs for the eight months ended December 31, 2001, respectively. Additionally, during 2002, the allocation of overhead costs for the bulk centers was changed from distribution and selling costs to general and administrative costs for the twelve months ended 2002. To conform with the current period, €8,161 were reclassified from the distribution and selling costs to general and administrative costs for the eight months ended December 31, 2001.

Page 14 of 66
The following table gives the reclassifications made to the consolidated statements of operations for the eight months ended December 31, 2001, as it relates to the successor’s consolidated financial statements:
As Reported in
2001 Reclassifications As Reported in
2002 Net sales.......................................................................................................................... 1,046,588 — 1,046,588 Cost of sales.................................................................................................................... (564,916) 36,500 (528,416) Gross profit ................................................................................................................... 481,672 36,500 518,172 Distribution and selling costs ....................................................................................... (313,845) (28,339) (342,184) Research and development costs.................................................................................. (9,542) — (9,542) General and administration costs ................................................................................. (82,668) (8,161) (90,829) Other operating income................................................................................................. 10,658 — 10,658 Other operating expense................................................................................................ (23,526) — (23,526) Restructuring and reorganization charges................................................................... (25,266) — (25,266) Operating profit ........................................................................................................... 37,483 — 37,483
b. Consolidated balance sheet In 2002, liabilities representing the fair value of derivative financial instruments were classified as miscellaneous liabilities. To conform the balance sheet presentation as of December 31, 2001, with the presentation as at December 31, 2002, an amount of €14,217 was reclassified from other non-current provisions to miscellaneous liabilities. Additionally, accruals for outstanding invoices and employee related accruals in 2002 were classified as trade accounts payable and miscellaneous liabilities, respectively, resulting in a reclassification of €22,352 from other provisions to trade accounts payable (€4,295) and miscellaneous liabilities (€18,057) to conform the balance sheet presentation as of December 31, 2001 with the presentation as of December 31, 2002. The following table presents the reclassifications made to the consolidated balance sheet as of December 31, 2001:
As Reported in
2001 Reclassifications As Reported in
2002 Provisions for pensions and similar obligations......................................................... 166,356 — 166,356 Other provisions ............................................................................................................ 53,344 (14,217) 39,127 Corporate debt, less current portion............................................................................. 1,540,312 — 1,540,312 Deferred tax liabilities ................................................................................................... 135,933 — 135,933 Other long term liabilities ............................................................................................. 25,353 — 25,353 Non-current liabilities................................................................................................. 1,921,298 (14,217) 1,907,081 Other provision .............................................................................................................. 159,215 (22,352) 136,863 Corporate debt................................................................................................................ 40,927 — 40,927 Trade accounts payable................................................................................................. 118,344 4,295 122,639 Miscellaneous liabilities................................................................................................ 118,175 32,274 150,449 Current liabilities......................................................................................................... 436,661 14,217 450,878 Total liabilities .............................................................................................................. 2,357,959 — 2,357,959
Use of estimates The preparation of financial statements in conformity with IFRS requires management to make certain estimates and assumptions that affect the reported amounts of assets, liabilities and disclosure of contingent assets and liabilities at the date of financial statements, and the reported amounts of revenues and expenses during the reporting period. Principal estimates

Page 15 of 66
required to be made in preparing its financial statements include those related to the purchase price allocation, the investment in subsidiaries available for sale, the valuation allowances on deferred tax assets and the pension provision. Other estimates are used in the computation of potential impairment on long lived assets, the allowance for bad debt and the inventory valuation. Actual results could differ from those estimates. Risks and uncertainties The Group's future results of operations involve a number of risks and uncertainties. Factors that could affect the Group's future operating results and cause actual results to vary materially from historical results include but are not limited to the following items. The industrial gas business is highly competitive, which has resulted in a continued trend of decreasing prices. This highly competitive environment could potentially reduce the profitability and cash flows of the Group in the future. The Group supplies a cross section of industries including steel, metal working, primary metal, chemicals, oil refining, food and beverages, healthcare, electronics and glass and include long-term contracts over periods of up to 15 years. A significant decline in market demand in any one of these industries could adversely affect future operating results. No single customer represents a significant portion of total revenues. Energy is the single most significant production cost for the Group. Although the Group often can pass through a portion of these energy costs to their customers, increases in energy costs can reduce the Group's profitability significantly. The Group operates globally, making it subject to risks related to the differing political, social and economic conditions of the various countries in which it conducts its operations. The majority of the Group's revenues are derived in Germany, the rest of Europe and the United States of America, which makes the Group sensitive to market or economic conditions in these geographic areas. New IAS accounting standards The Group has adopted each of the following standards effective January 1, 2001. Unless otherwise stated, adoption of these standards did not have a material impact on the Group's financial position or results of operations. In 1998 the IASC issued IAS 39 "Financial Instruments: Recognition and Measurement". The standard significantly increases the use of fair values in accounting for financial instruments and establishes specific criteria relating to hedge accounting. IAS 39 has been adopted on January 1, 2001. Adoption of this standard on January 1, 2001 resulted in a €335 cumulative effect of change in accounting principles, which is net of deferred taxes totaling €223, reported in other comprehensive income. In 2000 the IASC issued IAS 40 "Investment Property". IAS 40 was effective for financial statements covering periods beginning on or after January 1, 2001. IAS 40 prescribes the accounting treatment for investment property and related disclosure requirements and replaces previous requirements in IAS 25 "Accounting for Investments". Under IAS 40, investment property is defined as property held to earn rentals or for capital appreciation or both rather than for use in the production or supply of goods or services or for administrative purposes or for sale in the ordinary course of business. The Group has opted for the cost model under which investment property is measured at depreciated cost less any impairment losses. In 2000 the IASC revised IAS 19 "Employee Benefits". IAS 19 (revised 2000) was effective for fiscal periods beginning on or after January 1, 2001. The standard changes the definition of plan assets and introduces recognition, measurement and disclosure requirements for reimbursements. The standard prescribes the accounting and disclosure by employers for employee benefits, post employment benefits, other long term employee benefits, termination benefits and equity compensation benefits.

Page 16 of 66
Currency translation For Group companies, the functional currency is their local currency. The financial statements of Group companies located outside the European Monetary Union are translated into Euro. Assets and liabilities of these companies are translated into Euro at the closing exchange rate on the balance sheet date. The items in the income statement are translated into Euro using average annual exchange rates. Differences resulting from movements in exchange rates are included as a separate component of stockholders’ equity. Foreign currency gains and losses from trade receivables and trade payables denominated in a currency other than the reporting currency are included in "other operating income" or "other operating expense." The Group has a subsidiary operating in Serbia that is considered hyperinflationary. The Group applies the principles of IAS 29 "Financial Reporting in Hyperinflationary Economies", to the entities it considers affected by such economies. As such, the local currency financial statements in 2002, 2001 and 2000 of the entity operating in Serbia have been restated using the consumer price indices to current values at the balance sheet date prior to translation into the Group's reporting currency. Currencies, which are of particular importance to the Group, that have experienced exchange-rate fluctuations are shown below:
Exchange rate applicable on the balance sheet date
Average exchange rate
December 31,
December 31,
Twelve months ended
December 31,
Eight months ended
December 31,
Four months ended
April 30,
Twelve months ended
December 31, Selected currencies 2002 2001 2002 2001 2001 2000 1 U.S. Dollar : Euro……..… 0.96 1.13 1.05 1.13 1.10 1.08 1 Pound Sterling : Euro….... 1.54 1.64 1.59 1.63 1.59 1.64 100 Hungarian Forint : Euro 0.42 0.41 0.41 0.40 0.38 0.38 100 Yugoslavian Dinar : Euro. 1.61 1.70 1.66 1.66 1.70 2.62
3. Acquisition transactions On December 31, 2000, Aventis S.A. (parent company to Hoechst AG ("Hoechst")) entered into an agreement with Allianz Capital Partners GmbH ("ACP") and six private equity funds managed by affiliates of The Goldman Sachs Group, Inc. (the "GS Funds"), regarding the purchase of Hoechst's shares in Messer Griesheim. The transaction was consummated on April 30, 2001. In order to facilitate the purchase of Hoechst's shares in Messer Griesheim by ACP and the GS Funds, Hoechst transferred its 66 2/3% share interest in Messer Griesheim to the Company on April 30, 2001. In addition, on the same date Messer Industrie GmbH ("MIG") transferred its 33 1/3% equity interest in Messer Griesheim to the Company for nominal cash and a 33 1/3% equity interest in the Company. As explained in the following paragraph, the Company was then immediately acquired by Messer Griesheim Group GmbH & Co. KGaA. ACP and the GS funds formed a new company, Messer Griesheim Group GmbH & Co. KGaA. On April 30, 2001, through Messer Griesheim Group GmbH & Co. KGaA, ACP and the GS Funds acquired Hoechst's share of the Company for €618 million, payable in cash €388 million and deferred notes €230 million. The €230 million note is due from Messer Griesheim Group GmbH & Co. KGaA on November 11, 2011, together with interest which, although not currently payable, will accrue thereon at a rate of 250 basis points above the three month EURIBOR. In certain circumstances, the deferred purchase price may be payable earlier. Further, Hoechst has been issued 300,000 bonds (€300) which are convertible into 3% of the equity shares of Messer Griesheim Group GmbH & Co. KGaA upon the occurrence of certain events at a nominal

Page 17 of 66
conversion price. In addition, MIG transferred its share in the Company for a 32.67% share in Messer Griesheim Group GmbH & Co. KGaA and cash of €33.2 million. MIG is also entitled to receive additional cash consideration of up to €35.8 million upon the occurrence of certain events. As a result of the foregoing transactions, the Company was 100% owned by Messer Griesheim Group GmbH & Co. KGaA, which in turn was owned by ACP (33.665%), the GS Funds (collectively 33.665%) and Messer Industrie GmbH (32.67%) at April 30, 2001. Also as a result of the foregoing transactions, the Company owns 100% of Messer Griesheim.
The foregoing transactions have been accounted for in a manner similar to an acquisition of Messer Griesheim. Accordingly, the purchase consideration for the acquisition transaction has been allocated to the assets acquired and liabilities assumed as of April 30, 2001, the date of consummation of the acquisition transactions, based on their estimated fair values.
As part of the business combination agreement, Hoechst and Messer Griesheim Group GmbH & Co. KGaA
received a “call” option and a “counter-call” option, respectively, on 66 2/3% of the shares of the Company. During January 2002, a subsidiary of Hoechst (“DIOGENES 20. Vermögensverwaltung GmbH”) exercised its “call” option to acquire the 66 2/3% of the Company for a promissory note in the amount equal to the purchase price paid by Messer Griesheim Group GmbH & Co. KGaA for its interest in the Company. Messer Griesheim Group GmbH & Co. KGaA subsequently exercised its “counter-call” option to acquire the Hoechst subsidiary (and re-acquire indirectly the shares of the Company) for a nominal amount. The “call” and “counter-call” provisions were included as part of the business combination agreement to meet German tax planning requirements of Hoechst. In October 2002, DIOGENES 20. Vermögensverwaltungs GmbH was merged into Messer Griesheim Group. 4. Financing transactions Refinancing transactions Pursuant to the debt covenants, a substantial portion of Messer Griesheim's existing debt became due and payable upon the change in control, which occurred on April 30, 2001 (see Note 3 “Acquisition transactions”). As a result, Messer Griesheim entered into refinancing transactions with a consortium of banks during April and May 2001. The refinancing transactions involved borrowings under a senior facilities agreement with aggregate available funds of €1,650 million (€1,340 million of term loan facilities and €310 million under a revolving facility), and a mezzanine bridge facility in the aggregate amount of €400 million. The amounts borrowed under the "senior facilities agreement" €1,160 million and under the mezzanine bridge facility (€400 million) were used to repay Messer Griesheim's existing debt obligations of €1,303 million. As the existing debt was repaid in connection with the acquisition transactions, the prepayment penalties aggregating €19.1 million have been reflected as part of the purchase accounting adjustments. No part of the existing debt or the refinanced debt was used to finance the acquisition transactions. Refinancing costs of €90.0 million were capitalized, and are being amortized over the period of maturities of the borrowings using the effective interest rate method. The senior facilities agreement contains certain covenants that require Messer Griesheim, among other things, to maintain certain specified financial ratios, to observe capital expenditure limits, and to ensure that the combination of the repayment of the senior term disposal facility and the assumption of indebtedness by third parties in connection with the divestment of assets will result in the reduction of the aggregate indebtedness of Messer Griesheim and its consolidated subsidiaries by at least €255 million by April 2003.
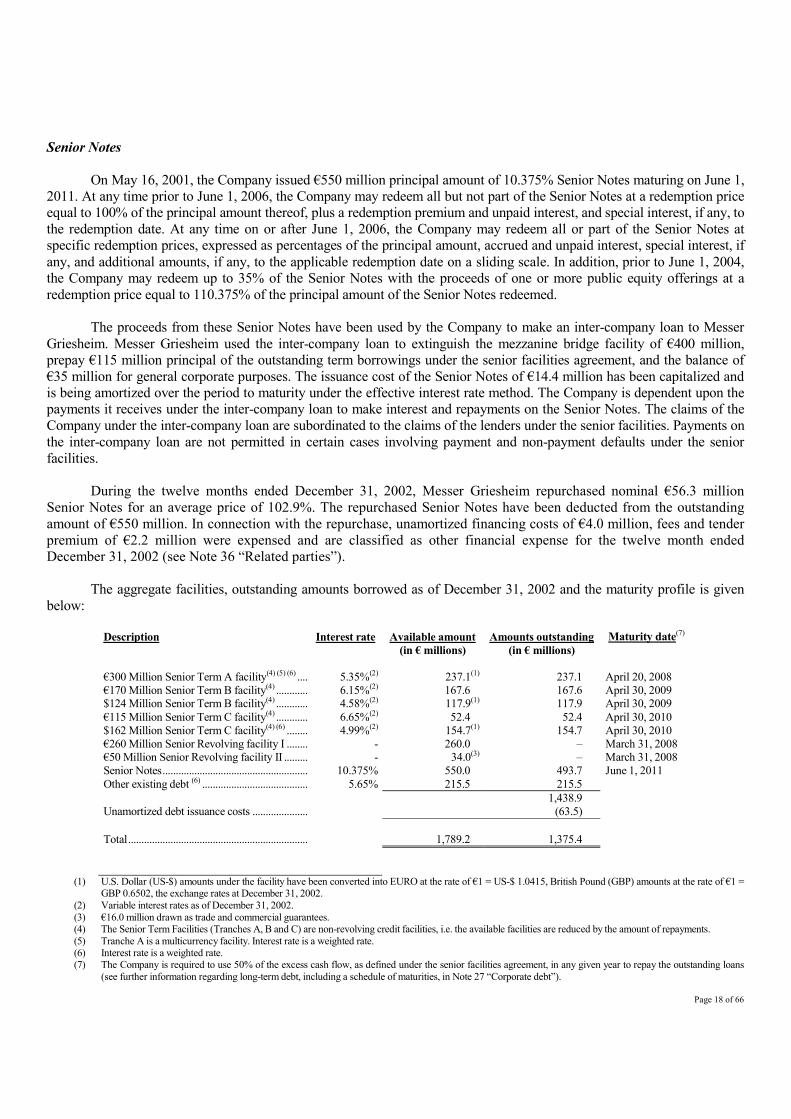
Page 18 of 66
Senior Notes On May 16, 2001, the Company issued €550 million principal amount of 10.375% Senior Notes maturing on June 1, 2011. At any time prior to June 1, 2006, the Company may redeem all but not part of the Senior Notes at a redemption price equal to 100% of the principal amount thereof, plus a redemption premium and unpaid interest, and special interest, if any, to the redemption date. At any time on or after June 1, 2006, the Company may redeem all or part of the Senior Notes at specific redemption prices, expressed as percentages of the principal amount, accrued and unpaid interest, special interest, if any, and additional amounts, if any, to the applicable redemption date on a sliding scale. In addition, prior to June 1, 2004, the Company may redeem up to 35% of the Senior Notes with the proceeds of one or more public equity offerings at a redemption price equal to 110.375% of the principal amount of the Senior Notes redeemed. The proceeds from these Senior Notes have been used by the Company to make an inter-company loan to Messer Griesheim. Messer Griesheim used the inter-company loan to extinguish the mezzanine bridge facility of €400 million, prepay €115 million principal of the outstanding term borrowings under the senior facilities agreement, and the balance of €35 million for general corporate purposes. The issuance cost of the Senior Notes of €14.4 million has been capitalized and is being amortized over the period to maturity under the effective interest rate method. The Company is dependent upon the payments it receives under the inter-company loan to make interest and repayments on the Senior Notes. The claims of the Company under the inter-company loan are subordinated to the claims of the lenders under the senior facilities. Payments on the inter-company loan are not permitted in certain cases involving payment and non-payment defaults under the senior facilities. During the twelve months ended December 31, 2002, Messer Griesheim repurchased nominal €56.3 million Senior Notes for an average price of 102.9%. The repurchased Senior Notes have been deducted from the outstanding amount of €550 million. In connection with the repurchase, unamortized financing costs of €4.0 million, fees and tender premium of €2.2 million were expensed and are classified as other financial expense for the twelve month ended December 31, 2002 (see Note 36 “Related parties”). The aggregate facilities, outstanding amounts borrowed as of December 31, 2002 and the maturity profile is given below:
Description Interest rate Available amount Amounts outstanding Maturity date(7) (in € millions) (in € millions)
€300 Million Senior Term A facility(4) (5) (6) .... 5.35%(2) 237.1(1) 237.1 April 20, 2008 €170 Million Senior Term B facility(4) ............ 6.15%(2) 167.6 167.6 April 30, 2009 $124 Million Senior Term B facility(4) ............ 4.58%(2) 117.9(1) 117.9 April 30, 2009 €115 Million Senior Term C facility(4) ............ 6.65%(2) 52.4 52.4 April 30, 2010 $162 Million Senior Term C facility(4) (6) ........ 4.99%(2) 154.7(1) 154.7 April 30, 2010 €260 Million Senior Revolving facility I ........ - 260.0 – March 31, 2008 €50 Million Senior Revolving facility II ......... - 34.0(3) – March 31, 2008 Senior Notes....................................................... 10.375% 550.0 493.7 June 1, 2011 Other existing debt (6) ........................................ 5.65% 215.5 215.5 1,438.9 Unamortized debt issuance costs ..................... (63.5)
Total.................................................................... 1,789.2 1,375.4
(1) U.S. Dollar (US-$) amounts under the facility have been converted into EURO at the rate of €1 = US-$ 1.0415, British Pound (GBP) amounts at the rate of €1 =
GBP 0.6502, the exchange rates at December 31, 2002. (2) Variable interest rates as of December 31, 2002. (3) €16.0 million drawn as trade and commercial guarantees. (4) The Senior Term Facilities (Tranches A, B and C) are non-revolving credit facilities, i.e. the available facilities are reduced by the amount of repayments. (5) Tranche A is a multicurrency facility. Interest rate is a weighted rate. (6) Interest rate is a weighted rate. (7) The Company is required to use 50% of the excess cash flow, as defined under the senior facilities agreement, in any given year to repay the outstanding loans
(see further information regarding long-term debt, including a schedule of maturities, in Note 27 “Corporate debt”).

Page 19 of 66
Interest expense and interest swap agreements Interest expense for the twelve months ended December 31, 2002, the eight month ended December 31, 2001, the four month ended April 30, 2001 and the twelve months ended December 31, 2000 was €150.8 million, €120.8 million, €41.5 million, and €96.1 million, respectively. Interest expense for the twelve month ended December 31, 2002 and the eight month ended December 31, 2001 included amortization of capitalized debt issuance costs of €18.9 million and €7.6 million, respectively. The Group has entered into interest rate swaps in order to hedge future interest rate variability for its senior term facilities. Approximately, €638.7 million and €812.4 million of the Group’s outstanding indebtedness was designated as hedged by interest rate swap agreements as of December 31, 2002 and 2001, respectively. Due to the refinancing agreements, the Group agreed to enter into loan agreements with fixed interest rates, interest swap agreements, caps or other instruments so as to ensure that interest payments on at least 75% of the Group's total debt is hedged. Had the Company not entered into interest swap agreements, the interest expense would have been reduced by €13,339 and €3,266 for the twelve month ended December 31, 2002 and the eight month ended December 31, 2001, respectively. Pledges In connection with the refinancing program, the Company has given several pledges to the lenders of the senior facilities. Substantially all of the assets of the Group are pledged as collateral. In addition, the lenders of the senior facilities have obtained irrevocable and unconditional guarantees from certain subsidiaries of the Company. These guarantees will remain outstanding until the repayment of the Senior Facilities. Additionally, in connection with the refinancing program, Messer Griesheim Holding AG has pledged all of its shares in Messer Griesheim to the senior lenders as security for the senior facilities. Moreover, Messer Griesheim Holding AG has agreed that if the senior lenders foreclose on that share pledge following an event of default and seek to sell the Company's shares of Messer Griesheim, the Company will release its claims against Messer Griesheim for payment of the inter-company loan. If the Company is ever required to release its claims for repayment of the inter-company loan, its only source of repayment for the notes will be net proceeds, if any, from a foreclosure sale of the Messer Griesheim shares after the senior lenders have been repaid in full. In addition, the inter-company loan is effectively subordinated to all existing and future debt of Messer Griesheim's subsidiaries. 5. Divestment of Cuban subsidiaries As a precondition to the consummation of the acquisition transaction, on April 24, 2001, the Group sold its interest in a holding company that controls three operating companies in Cuba to an entity which is controlled by Mr. Stefan Messer, a member of the management board of the Group. Mr. Stefan Messer is also a director and minority shareholder in MIG. The total purchase price for the Cuban holding company was US$7.0 million, of which US$1.2 million was paid in cash and the remainder by an unsecured note in the principal amount of US$5.8 (€5.6) million, which matures in 2006 and accrues interest at the rate of 5.5% per year. The sale resulted in a pre tax loss of €5.6 million, which has been reflected in the statement of operations for the period ended April 30, 2001. 6. Segment information Messer Group reports its segment information in accordance with IAS 14 "Segment reporting" and complies with the provisions of the U.S. Financial Accounting Standards Board Statement of Financial Accounting Standards (SFAS) 131 "Disclosures about Segments of an Enterprise and Related Information".

Page 20 of 66
Messer Group operates its business as a single business - the production, supply and distribution of industrial gases. The Group’s segment reporting follows the management structure and internal management reporting system of the Messer Group. Based upon the characteristics of the industrial gas market, Messer's business operations are separated into geographic regions. The geographic regions and principal countries included in each segment are as follows: Geographic Regions Countries Germany........................ Germany Western Europe ............ France, Switzerland, Netherlands, Spain, Belgium, Italy and Great Britain Eastern Europe..............
Austria, Slovakia, Czech Republic, Hungary, Slovenia, Croatia, Poland, Finland, Bulgaria, Serbia, Bosnia-Herzegovina, and Greece
North America .............. United States of America and Canada Other.............................. China, Guatemala and El Salvador,
Each of these geographic regions has a segment manager reporting directly to the Chief Executive Officer who effectively serves as the Chief Operating Decision Maker ("CODM"). The CODM makes decisions about resources to be allocated to the segments and assesses their performance using sales and operating profits. The accounting policies of segments are the same as those described in the summary of significant accounting policies included in the Group's annual consolidated financial statements. Performance of the segments is evaluated on net sales and operating profit before income taxes. The following tables present selected segment data for the twelve months ended December 31, 2002, the eight months ended December 31, 2001, four months ended April 30, 2001 and the twelve months ended December 31, 2000: Statement of operations segment disclosures Successor Twelve months ended December 31, 2002 Business Areas
Germany Western Europe
Eastern Europe
North America
Others*
Reconciliation/ Corporate
Total
Total sales...................................... 718,952 283,051 239,820 338,593 56,792 12,068 1,649,276 Inter-segment sales ....................... 69,384 21,565 20,991 1,615 490 9,235 123,280
Net sales ........................................ 649,568 261,486 218,829 336,978 56,302 2,833 1,525,996 Operating profit (loss) 110,744 8,237 33,539 22,905 7,633 (51,876) 131,182 Depreciation and amortization of
intangibles and property, plant and equipment ............................ 85,402 46,824 35,565 70,170 8,738 6,787 253,486
Thereof impairment losses ........... — 1.251 — — 292 — 1.543 Interest income.............................. 403 509 3,737 800 291 5,023 10,763 Interest expense............................. 2,383 1,368 836 22,776 1,869 121,553 150,785 Equity method investments income
(expense), net ........................... 2,109 — (68) (20,564) 5.902 — (12,621) Income tax benefit (expense) (50,173) (205) (6,402) (4,321) (580) 26,922 (34,759)
* includes Latin America and Asia

Page 21 of 66
Eight months ended December 31, 2001 Business Areas
Germany Western Europe
Eastern Europe
North America
Others*
Reconciliation/Corporate
Total
Total sales...................................... 472,694 189,817 153,483 259,511 39,433 5,252 1,120,190 Inter-segment sales ....................... 45,841 13,313 10,096 717 284 3,351 73,602
Net sales ........................................ 426,853 176,504 143,387 258,794 39,149 1,901 1,046,588 Operating profit (loss) 38,234 7,652 15,336 (894) 5,676 (28,521) 37,483 Depreciation and amortization of
intangibles and property, plant and equipment ............................ 66,413 28,422 21,427 59,413 6,759 299 182,733
Interest income.............................. 89 196 2,622 1,823 431 12,257 17,418 Interest expense............................. 17,997 1,878 1,813 22,364 2,010 74,735 120,797 Equity method investments income
(expense), net ........................... 2,231 — — (1,244) (16,200) — (15,213) Income tax benefit (expense) (22,482) (2,981) (4,042) 9,538 (438) 46,568 26,163
* includes Latin America and Asia
Predecessor Four months ended April 30, 2001 Business Areas
Germany Western Europe
Eastern Europe
North America
Latin America
Asia/ Africa
Reconciliation/ Corporate
Total
Total sales ............................................. 241,280 91,423 74,802 131,785 26,395 35,707 2,003 603,395 Inter-segment sales .............................. 16,173 5,813 4,357 125 1,279 275 910 28,932 Net sales ............................................... 225,107 85,610 70,445 131,660 25,116 35,432 1,093 574,463
Operating (loss) profit ......................... 50,314 5,871 9,197 7,446 (4,258) (814) (21,302) 46,454 Depreciation, amortization and
impairment of intangibles and property, plant and equipment ........ 16,072 11,119 9,858 22,729 10,122 4,214 2,809 76,923
Thereof impairment losses .............. 2,356 — — — — — — 2,356 Interest income..................................... — 75 959 384 245 368 3,055 5,086 Interest expense.................................... 2,558 1,781 1,691 6,891 2,041 3,476 23,012 41,450 Share of loss in equity investments.... — — — — (1,966) (3,140) — (5,106) Income tax benefit (expense).............. (29,398) (1,229) (1,807) 3,756 544 (3,144) 26,465 (4,813)
Twelve months ended December 31, 2000 Business Areas
Germany Western Europe
Eastern Europe
North America
Latin America
Asia/ Africa
Reconciliation/ Corporate
Total
Total sales ......................................... 788,314 278,529 213,432 414,743 80,997 92,662 — 1,868,677 Inter-segment sales .......................... 116,566 16,043 15,294 20,407 3,148 1,296 — 172,754 Net sales ........................................... 671,748 262,486 198,138 394,336 77,849 91,366 — 1,695,923 Operating (loss) profit ..................... 103,108 19,799 25,656 (7,490) (65,900) (17,791) (60,261) (2,879) Depreciation, amortization and
impairment of intangibles and property plant and equipment ..... 73,819 33,704 29,944 99,775 68,381 35,994 — 341,617
Thereof impairment losses .............. 23,150 — 3,469 31,645 48,241 22,087 — 128,592 Interest income................................. (1,859) 461 2,689 2,104 766 718 2,732 7,611 Interest expense................................ 2,816 5,290 4,226 27,885 16,310 3,534 36,070 96,131 Share of profit (loss) in equity
investments.................................... 1,797 — 3,716 — (6,372) (207,093) — (207,952) Income tax benefit (expense).......... 179,845 (7,557) (6,739) 17,069 (487) (913) (42,986) 138,232

Page 22 of 66
Balance sheet segment disclosures Successor December 31, 2002 Business Areas Germany Western
Europe Eastern Europe
North America
Others(*) Reconciliation/ Corporate
Total
Operating assets ..................................... 940,599 426,836 407,728 617,571 103,405 209,182 2,705,321 Operating liabilities ............................... 157,574 62,272 39,976 45,755 11,115 196,153 512,845 Capital expenditures .............................. 35,864 23,794 29,028 37,531 8,827 857 135,901 Equity method investments................... 256 — 2,732 — 10,212 — 13,200
* includes Latin America and Asia. December 31, 2001 Business Areas Germany Western
Europe Eastern Europe
North America
Others(*) Reconciliation/ Corporate
Total
Operating assets ...................................... 1,101,224 437,976 393,116 785,652 122,540 143,327 2,983,835 Operating liabilities ................................ 175,451 64,805 40,651 61,707 12,236 168,054 522,904 Capital expenditures ............................... 30,006 16,527 13,271 14,993 4,100 125 79,022 Equity method investments.................... 256 — 200 6,453 12,277 — 19,186
* includes Latin America and Asia.
The column reconciliation/corporate primarily includes income and expenses as well as assets and liabilities related to corporate items that are included separately within the Group, which are not allocated to the segments. Segment operating assets are defined as total assets excluding investments, deposits, certain receivables and deferred tax assets. Segment operating liabilities are defined as total liabilities excluding deferred tax liabilities, certain provisions, derivative financial instruments, minority interest, corporate debt and taxes payable. The pricing of inter-segment sales is based on an arms length principle. The United States of America is the only country, other than Germany, with sales greater than 10% of the Group's consolidated net sales. Selected information relating solely to the United States of America is presented in the table below:
Successor Predecessor
Twelve months ended
December 31, 2002
Eight months ended
December 31, 2001
Four months ended
April 30, 2001
Twelve months ended
December 31, 2000
Net sales....................................................... 327,858 243,922 121,335 360,715Operating profit (loss) ................................ 25,010 (1,136) 7,118 (9,070)Capital expenditures ................................... 37,354 14,307 7,043 51,262Operating assets .......................................... 620,397 771,102 701,720 670,413
The reconciliation of segment operating assets and liabilities to the consolidated total assets and liabilities at the end of each year is as follows:

Page 23 of 66
December 31,
2002 December 31,
2001 Assets Segment operating assets for total reportable business segments ...................................... 2,496,139 2,840,508Items excluded from segment assets...................................................................................... 233,487 365,651Other corporate assets.............................................................................................................. 209,182 143,327 Total.......................................................................................................................................... 2,938,808 3,349,486 Liabilities Segment operating liabilities for total reportable business segments ................................ 316,692 354,850Items excluded from segment liabilities................................................................................ 1,606,464 1,835,055Other corporate liabilities........................................................................................................ 196,153 168,054 Total.......................................................................................................................................... 2,119,309 2,357,959
The reconciliation of segment operating profit to the consolidated net loss for each year is as follows:
Successor Predecessor
Twelve months ended
December 31, 2002
Eight months ended
December 31, 2001
Four months ended
April 30, 2001
Twelve months ended
December 31, 2000
Segment operating profit for total reportable business segments .. 183,058 66,004 67,756 57,382 Items excluded from segment operating profit ................................ (221,053) (107,014) (59,952) (202,686) Other corporate expense ..................................................................... (51,876) (28,521) (21,302) (60,261) Total ..................................................................................................... (89,871) (69,531) (13,498) (205,565) 7. Other operating income
Successor Predecessor
Twelve months ended
December 31, 2002
Eight months ended
December 31, 2001
Four months ended
April 30, 2001
Twelve months ended
December 31, 2000
Gains on disposal of intangible assets and property, plant and equipment........ 2,829 — 1,196 14,362 Legal settlement with foreign government............................................................ — — — 6,240 Release of provisions ............................................................................................... 7,977 — 105 3,265 Rental income ........................................................................................................... 2,374 2,271 413 2,637 Appreciation of property, plant and equipment .................................................... — — — 1,026 Foreign currency exchange gains ........................................................................... 2,202 752 783 783 Recovery of accounts receivable written-off......................................................... — — 617 519 Insurance claims ....................................................................................................... 456 155 101 355 Revaluation due to inflation accounting ................................................................ 513 952 67 — Miscellaneous ........................................................................................................... 9,314 6,528 6,960 8,823
Total .......................................................................................................................... 25,665 10,658 10,242 38,010
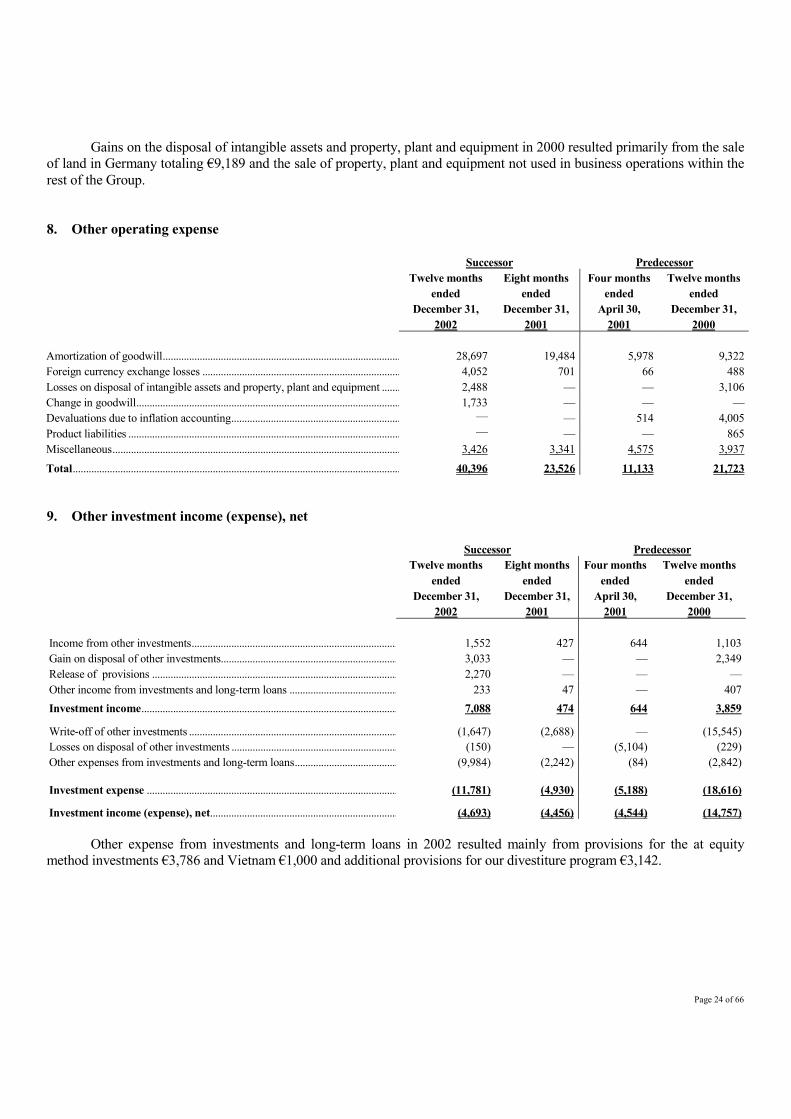
Page 24 of 66
Gains on the disposal of intangible assets and property, plant and equipment in 2000 resulted primarily from the sale of land in Germany totaling €9,189 and the sale of property, plant and equipment not used in business operations within the rest of the Group. 8. Other operating expense
Successor Predecessor
Twelve months ended
December 31, 2002
Eight months ended
December 31, 2001
Four months ended
April 30, 2001
Twelve months ended
December 31, 2000
Amortization of goodwill.......................................................................................... 28,697 19,484 5,978 9,322Foreign currency exchange losses ........................................................................... 4,052 701 66 488Losses on disposal of intangible assets and property, plant and equipment ....... 2,488 — — 3,106Change in goodwill.................................................................................................... 1,733 — — —Devaluations due to inflation accounting................................................................ — — 514 4,005Product liabilities ....................................................................................................... — — — 865Miscellaneous............................................................................................................. 3,426 3,341 4,575 3,937
Total............................................................................................................................ 40,396 23,526 11,133 21,723 9. Other investment income (expense), net
Successor Predecessor
Twelve months ended
December 31, 2002
Eight months ended
December 31, 2001
Four monthsended
April 30, 2001
Twelve months ended
December 31, 2000
Income from other investments.............................................................................. 1,552 427 644 1,103 Gain on disposal of other investments................................................................... 3,033 — — 2,349 Release of provisions ............................................................................................. 2,270 — — — Other income from investments and long-term loans ......................................... 233 47 — 407 Investment income................................................................................................. 7,088 474 644 3,859
Write-off of other investments ............................................................................... (1,647) (2,688) — (15,545) Losses on disposal of other investments ............................................................... (150) — (5,104) (229) Other expenses from investments and long-term loans....................................... (9,984) (2,242) (84) (2,842)
Investment expense ............................................................................................... (11,781) (4,930) (5,188) (18,616)
Investment income (expense), net....................................................................... (4,693) (4,456) (4,544) (14,757) Other expense from investments and long-term loans in 2002 resulted mainly from provisions for the at equity method investments €3,786 and Vietnam €1,000 and additional provisions for our divestiture program €3,142.

Page 25 of 66
10. Impairment of intangible assets and property, plant and equipment
Successor Predecessor
Twelve months ended
December 31, 2002
Eight months ended
December 31, 2001
Four months ended
April 30, 2001
Twelve months ended
December 31, 2000
Goodwill and other intangible assets (see Note 16)......................................... — — 2,356 11,842 Property, plant and equipment ........................................................................... 1,543 — __— 116,750 _______ Impairment of intangible assets and property, plant and equipment.... 1,543 — 2,356 128,592
During the twelve months ended December 31, 2002, impairment charges amounting to €1,251 and €292 related to plants in Spain and in China respectively, were recorded. During the twelve months ended December 31, 2000, the Group recorded impairment charges relating to property, plant and equipment aggregating €116,750, included in additions to depreciation of property, plant and equipment, as follows: • €89,402 relating to values of filling stations and on-site plants located in Germany, the United States, Brazil,
Singapore, Mexico, Peru and Argentina. Discounted future cash flows of these plants indicated that impairment had occurred.
• €8,129 relating to plants located in Mexico and Trinidad and Tobago. The plants were purchased for
production, initially for permanent use, while additional plants were under construction. Upon completion of the additional plants, it was determined that there would be no future uses for the purchased facilities.
• €19,219 relating to equipment and other assets (primarily in the United States and Trinidad and Tobago) to
be disposed of. The impaired assets in the United States relate to on-site assets and assets used as spare parts. The assets are non-revenue producing and accordingly valued at disposal value. The impairment charge in Trinidad and Tobago relates to nitrogen compressors which were built specifically for Messer Trinidad and Tobago, but never put into operation. The valuation of these assets was determined based on previous experience and third party appraisals.
11. Restructuring and reorganization charges During 2000, and as a direct result of the anticipated changes in the Group's ownership, the Group has realigned itself and was planning to exit from the Asian, African and Latin American markets. The Group has recognized restructuring and reorganization costs in connection with this realignment, as summarized below:
Successor Predecessor
Twelve months ended
December 31, 2002
Eight months ended
December 31, 2001
Four months ended
April 30, 2001
Twelve months ended
December 31, 2000
Severance costs................................................................................................ 4,630 16,231 2,540 16,868Other ................................................................................................................. 8,152 9,035 __— 3,493 _______ Total ................................................................................................................. 12,782 25,266 2,540 20,361
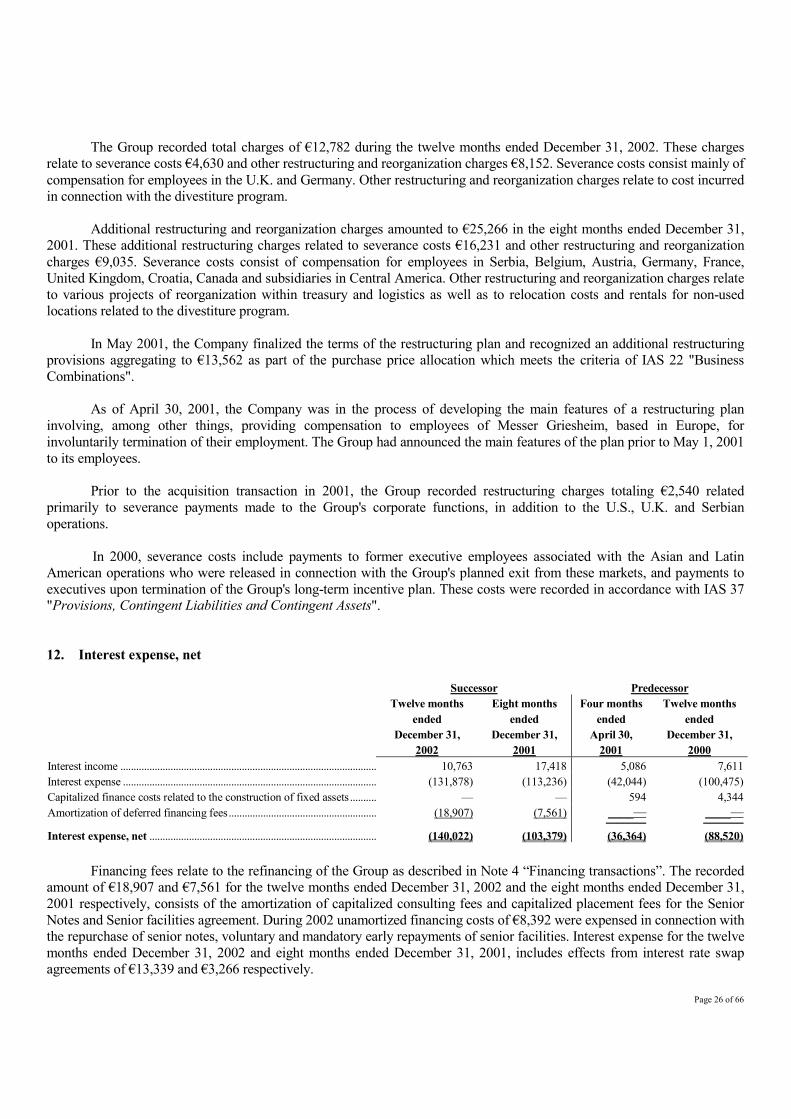
Page 26 of 66
The Group recorded total charges of €12,782 during the twelve months ended December 31, 2002. These charges relate to severance costs €4,630 and other restructuring and reorganization charges €8,152. Severance costs consist mainly of compensation for employees in the U.K. and Germany. Other restructuring and reorganization charges relate to cost incurred in connection with the divestiture program. Additional restructuring and reorganization charges amounted to €25,266 in the eight months ended December 31, 2001. These additional restructuring charges related to severance costs €16,231 and other restructuring and reorganization charges €9,035. Severance costs consist of compensation for employees in Serbia, Belgium, Austria, Germany, France, United Kingdom, Croatia, Canada and subsidiaries in Central America. Other restructuring and reorganization charges relate to various projects of reorganization within treasury and logistics as well as to relocation costs and rentals for non-used locations related to the divestiture program. In May 2001, the Company finalized the terms of the restructuring plan and recognized an additional restructuring provisions aggregating to €13,562 as part of the purchase price allocation which meets the criteria of IAS 22 "Business Combinations". As of April 30, 2001, the Company was in the process of developing the main features of a restructuring plan involving, among other things, providing compensation to employees of Messer Griesheim, based in Europe, for involuntarily termination of their employment. The Group had announced the main features of the plan prior to May 1, 2001 to its employees. Prior to the acquisition transaction in 2001, the Group recorded restructuring charges totaling €2,540 related primarily to severance payments made to the Group's corporate functions, in addition to the U.S., U.K. and Serbian operations.
In 2000, severance costs include payments to former executive employees associated with the Asian and Latin American operations who were released in connection with the Group's planned exit from these markets, and payments to executives upon termination of the Group's long-term incentive plan. These costs were recorded in accordance with IAS 37 "Provisions, Contingent Liabilities and Contingent Assets". 12. Interest expense, net
Successor Predecessor
Twelve months ended
December 31, 2002
Eight months ended
December 31, 2001
Four months ended
April 30, 2001
Twelve months ended
December 31, 2000
Interest income ................................................................................................. 10,763 17,418 5,086 7,611 Interest expense ................................................................................................ (131,878) (113,236) (42,044) (100,475) Capitalized finance costs related to the construction of fixed assets.......... — — 594 4,344 Amortization of deferred financing fees........................................................ (18,907) (7,561) ____— ____— _______ _______ Interest expense, net ...................................................................................... (140,022) (103,379) (36,364) (88,520) Financing fees relate to the refinancing of the Group as described in Note 4 “Financing transactions”. The recorded amount of €18,907 and €7,561 for the twelve months ended December 31, 2002 and the eight months ended December 31, 2001 respectively, consists of the amortization of capitalized consulting fees and capitalized placement fees for the Senior Notes and Senior facilities agreement. During 2002 unamortized financing costs of €8,392 were expensed in connection with the repurchase of senior notes, voluntary and mandatory early repayments of senior facilities. Interest expense for the twelve months ended December 31, 2002 and eight months ended December 31, 2001, includes effects from interest rate swap agreements of €13,339 and €3,266 respectively.
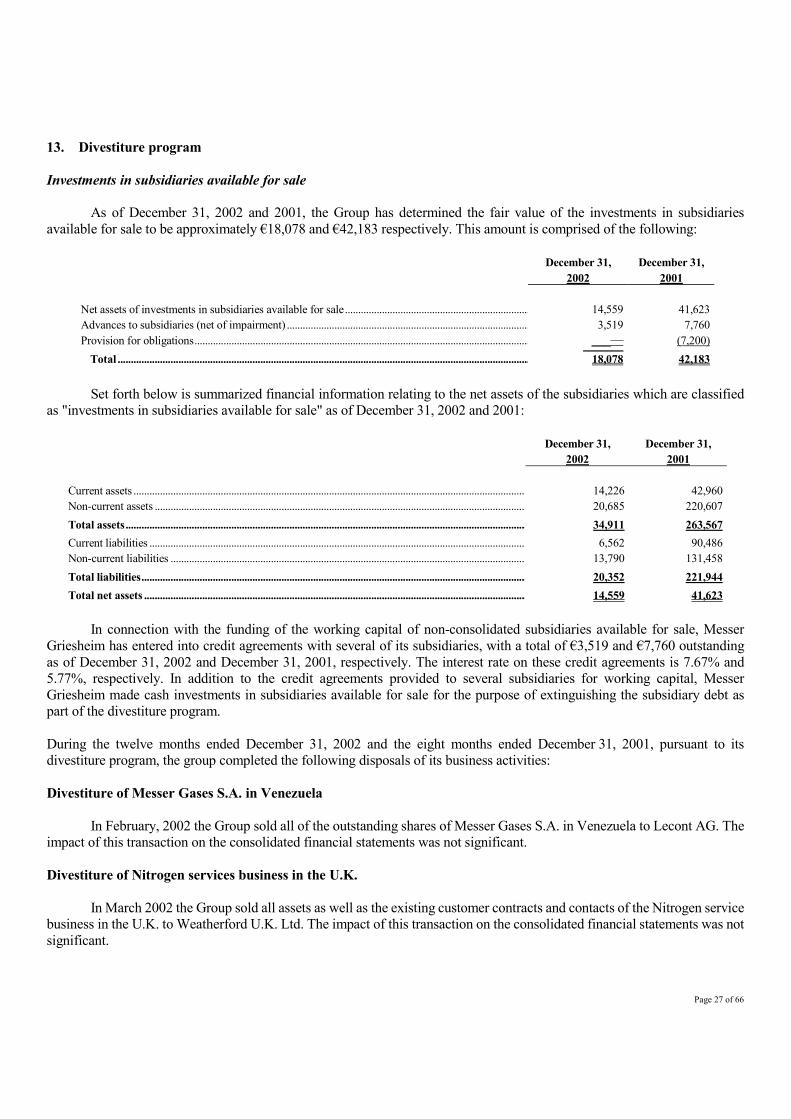
Page 27 of 66
13. Divestiture program Investments in subsidiaries available for sale As of December 31, 2002 and 2001, the Group has determined the fair value of the investments in subsidiaries available for sale to be approximately €18,078 and €42,183 respectively. This amount is comprised of the following:
December 31,
2002 December 31,
2001 Net assets of investments in subsidiaries available for sale...................................................................... 14,559 41,623 Advances to subsidiaries (net of impairment) ............................................................................................ 3,519 7,760 Provision for obligations............................................................................................................................... ___— (7,200) _______ Total ............................................................................................................................................................ 18,078 42,183
Set forth below is summarized financial information relating to the net assets of the subsidiaries which are classified as "investments in subsidiaries available for sale" as of December 31, 2002 and 2001:
December 31,
2002 December 31,
2001 Current assets ..................................................................................................................................................... 14,226 42,960Non-current assets ............................................................................................................................................. 20,685 220,607 Total assets........................................................................................................................................................ 34,911 263,567 Current liabilities ............................................................................................................................................... 6,562 90,486Non-current liabilities ....................................................................................................................................... 13,790 131,458 Total liabilities.................................................................................................................................................. 20,352 221,944 Total net assets ................................................................................................................................................. 14,559 41,623
In connection with the funding of the working capital of non-consolidated subsidiaries available for sale, Messer Griesheim has entered into credit agreements with several of its subsidiaries, with a total of €3,519 and €7,760 outstanding as of December 31, 2002 and December 31, 2001, respectively. The interest rate on these credit agreements is 7.67% and 5.77%, respectively. In addition to the credit agreements provided to several subsidiaries for working capital, Messer Griesheim made cash investments in subsidiaries available for sale for the purpose of extinguishing the subsidiary debt as part of the divestiture program. During the twelve months ended December 31, 2002 and the eight months ended December 31, 2001, pursuant to its divestiture program, the group completed the following disposals of its business activities: Divestiture of Messer Gases S.A. in Venezuela In February, 2002 the Group sold all of the outstanding shares of Messer Gases S.A. in Venezuela to Lecont AG. The impact of this transaction on the consolidated financial statements was not significant. Divestiture of Nitrogen services business in the U.K. In March 2002 the Group sold all assets as well as the existing customer contracts and contacts of the Nitrogen service business in the U.K. to Weatherford U.K. Ltd. The impact of this transaction on the consolidated financial statements was not significant.
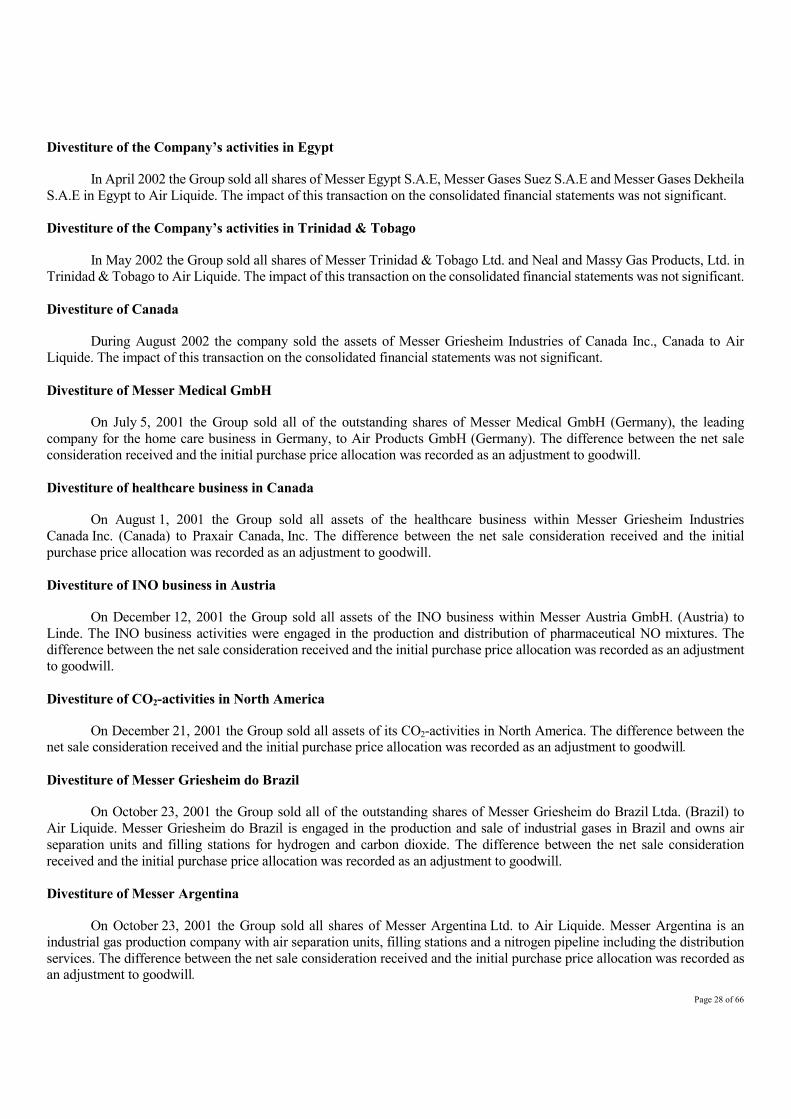
Page 28 of 66
Divestiture of the Company’s activities in Egypt In April 2002 the Group sold all shares of Messer Egypt S.A.E, Messer Gases Suez S.A.E and Messer Gases Dekheila S.A.E in Egypt to Air Liquide. The impact of this transaction on the consolidated financial statements was not significant. Divestiture of the Company’s activities in Trinidad & Tobago In May 2002 the Group sold all shares of Messer Trinidad & Tobago Ltd. and Neal and Massy Gas Products, Ltd. in Trinidad & Tobago to Air Liquide. The impact of this transaction on the consolidated financial statements was not significant. Divestiture of Canada During August 2002 the company sold the assets of Messer Griesheim Industries of Canada Inc., Canada to Air Liquide. The impact of this transaction on the consolidated financial statements was not significant. Divestiture of Messer Medical GmbH On July 5, 2001 the Group sold all of the outstanding shares of Messer Medical GmbH (Germany), the leading company for the home care business in Germany, to Air Products GmbH (Germany). The difference between the net sale consideration received and the initial purchase price allocation was recorded as an adjustment to goodwill. Divestiture of healthcare business in Canada On August 1, 2001 the Group sold all assets of the healthcare business within Messer Griesheim Industries Canada Inc. (Canada) to Praxair Canada, Inc. The difference between the net sale consideration received and the initial purchase price allocation was recorded as an adjustment to goodwill. Divestiture of INO business in Austria On December 12, 2001 the Group sold all assets of the INO business within Messer Austria GmbH. (Austria) to Linde. The INO business activities were engaged in the production and distribution of pharmaceutical NO mixtures. The difference between the net sale consideration received and the initial purchase price allocation was recorded as an adjustment to goodwill. Divestiture of CO2-activities in North America On December 21, 2001 the Group sold all assets of its CO2-activities in North America. The difference between the net sale consideration received and the initial purchase price allocation was recorded as an adjustment to goodwill. Divestiture of Messer Griesheim do Brazil On October 23, 2001 the Group sold all of the outstanding shares of Messer Griesheim do Brazil Ltda. (Brazil) to Air Liquide. Messer Griesheim do Brazil is engaged in the production and sale of industrial gases in Brazil and owns air separation units and filling stations for hydrogen and carbon dioxide. The difference between the net sale consideration received and the initial purchase price allocation was recorded as an adjustment to goodwill. Divestiture of Messer Argentina On October 23, 2001 the Group sold all shares of Messer Argentina Ltd. to Air Liquide. Messer Argentina is an industrial gas production company with air separation units, filling stations and a nitrogen pipeline including the distribution services. The difference between the net sale consideration received and the initial purchase price allocation was recorded as an adjustment to goodwill.

Page 29 of 66
Divestiture of Messer Mexico On December 14, 2001 the Group sold all shares of Messer Griesheim de Mexico S.A. de C.V. to Air Products. Messer Mexico was engaged in the production and sale of industrial gases and operated air separation units and filling stations especially in the production of oxygen. The difference between the net sale consideration received and the initial purchase price allocation was recorded as an adjustment to goodwill. Divestiture of the non-cryogenic business On October 3, 2001 the Group sold all shares of Mahler Italfilo Holding GmbH, Generon Inc. and Messer Shareholdings in SMC to Management. Mahler Italfilo Holding was the shareholder of Mahler Italfilo Engineering S.r.l. and Mahler AGS GmbH, which owned the non-cryogenic plant production operations with locations in Germany, United States, Italy and China. The difference between the net sale consideration received and the initial purchase price allocation was recorded as an adjustment to goodwill. Divestiture of Fedgas (South Africa) On October 23, 2001 the Group sold all shares of Fedgas, the leading subsidiary of the Company`s activities in Southern Africa, to Air Liquide. Fedgas and its subsidiaries were engaged in the production and distribution of industrial and specialty gases, the sale of compressed industrial gases and welding equipment, services for safety, inspection and downtime services during shutdowns to their clients and the distribution of liquid petroleum gases and diesel fuel. The difference between the net sale consideration received and the initial purchase price allocation was recorded as an adjustment to goodwill. Divestiture of Messer Korea On December 20, 2001 the Group sold all shares of Messer Korea to a local Joint Venture partner. Messer Korea operated three filling stations and was engaged in the production and distribution of Carbon dioxide and other special gases. The difference between the net sale consideration received and the initial purchase price allocation was recorded as an adjustment to goodwill. Change in fair value of investments in subsidiaries available for sale During the twelve months ended December 31, 2002, the eight months ended December 31, 2001, the four months ended April 30, 2001 and the twelve months ended December 31, 2000 changes in the estimated fair value of investments in subsidiaries available for sale amounted to a loss of €1,577, €5,472, €0 and €0 respectively, which has been reflected as "changes in fair value of subsidiaries available for sale" in the consolidated statement of operations. Other subsidiaries included in the divestiture program The Group continues to consolidate in its financial statements the subsidiaries included in the divestiture program which were originally expected to be sold subsequent to April 30, 2002 (see Note 40 “Reconciliation to U.S. GAAP” for a discussion of SFAS 144). These operations are reflected in the "Others" segment in the Successor's financial statements. Summarized condensed financial information related to these subsidiaries and net assets at December 31, 2002 and 2001 are set forth below:

Page 30 of 66
December 31,
2002 December 31,
2001 Balance Sheet Current assets of other operations held for sale................................................................................. 28,208 38,091 Non-current asset of other operations held for sale .......................................................................... 87,423 100,686 Total assets ............................................................................................................................................ 115,631 138,777 Current liabilities of other operations held for sale........................................................................... 15,329 13,221 Non-current liabilities of other operations held for sale................................................................... 18,523 30,946 Total liabilities...................................................................................................................................... 33,852 44,167
Results of operations, included in consolidated totals: Twelve months ended
December 31, 2002 Eight months ended December 31, 2001
Net sales............................................................................................................................... 56,302 39,149 Cost of sales ........................................................................................................................ (33,598) (22,716) Other expenses (net)........................................................................................................... (16,449) (13,048) Income tax expense ............................................................................................................ (580) (438) Net income.......................................................................................................................... 5,675 2,947
Cash flows, included in consolidated totals: Twelve months ended
December 31, 2002 Eight months ended December 31, 2001
Operating activities............................................................................................................. 14,415 11,713 Investing activities.............................................................................................................. (6,640) (4,228) Financing activities............................................................................................................. (10,374) (11,292)
Total .................................................................................................................................... (2,599) (3,807) Results of operations for all subsidiaries and net assets included in the divestiture program for all periods prior to the acquisition transactions are included in the consolidated totals in the Company's consolidated financial statements. Summarized condensed results of operations related to such subsidiaries and net assets are set forth below:
Four months
ended April 30, 2001 Twelve months ended
December 31, 2000 Net sales .................................................................................................................................. 84,793 407,692Cost of sales............................................................................................................................ (64,541) (273,372)Losses of investments accounted for under the equity method of accounting................ (499) (2,283)Other expenses (net) .............................................................................................................. (36,826) (251,464)Income tax income (expense)............................................................................................... (438) 12,779 Net loss.................................................................................................................................... (17,511) (106,648)
14. Results from discontinuing operations In 1999, the Company announced a plan to dispose of the Group's cutting and welding division ("C&W"). C&W manufactures products used for steel and aluminium materials in oxy-fuel and laser technology, and did not represent a core business area for the Group. In connection with this plan, on December 30, 1999, the Group entered into an agreement with

Page 31 of 66
MIG, the Group's minority shareholder, to acquire the C&W shares. The transaction was to be facilitated via a non-pro rata special dividend to MIG for the amount of the fair value of C&W, followed by (i) a purchase of the C&W shares by MIG, using the dividend as currency, and (ii) a cash payment from MIG to Hoechst for an amount equal to two-thirds of the special dividend. At December 30, 1999, the €150,341 carrying value of the C&W net assets exceeded its then estimated fair value of €136,000. Accordingly, the Group recorded a €14,341 loss and a related tax benefit of €11,588 in 1999. In 2000, the Group declared the €136,000 special dividend. As a result of the final determination of the purchase price, the Group was released of its obligation to make a capital contribution to C&W in April 2000. In addition, the price to be paid by MIG to Hoechst was reduced in August 2000. Accordingly, subsequent to settlement, the Group recorded an additional loss of €18,066 and a related tax benefit of €946 during fiscal 2000. The operating results of C&W have been classified as discontinuing operations in the consolidated statements of operations for all periods presented. 15. Income taxes The components of the provision for income taxes from continuing operations are as follows:
Successor Predecessor
Twelve months ended
December 31, 2002
Eight months ended
December 31, 2001
Four months ended
April 30, 2001
Twelve months ended
December 31, 2000
Current income tax benefit (expense): Germany ..................................................................................................... (21,369) (1,389) 716 (1,207)Abroad ........................................................................................................ (13,076) (12,886) 2,701 (9,058)
Current income tax benefit (expense) ................................................. (34,445) (14,275) 3,417 (10,265)Deferred income tax benefit (expense): Germany ..................................................................................................... (1,929) 25,475 (6,851) 137,982Abroad ........................................................................................................ 1,615 14,963 (1,379) 10,515
Deferred income tax benefit (expense)................................................ (314) 40,438 (8,230) 148,497
Total income tax benefit (expense) ...................................................... (34,759) 26,163 (4,813) 138,232 In 2000, the German government enacted new tax legislation which, among other changes, reduces the Group's statutory corporate tax rate for German companies from 40% on retained earnings and 30% on distributed earnings to a uniform 25%. In general, retained (undistributed) German corporate income was initially subject to federal corporation income tax at a rate of 40% for 2000 plus a surcharge of 5.5% on federal corporate taxes payable. Giving effect to this surcharge, the federal corporate tax rate was 42.2% for 2000. For 2002 and 2001, the combined federal corporation income tax rate was 26.38%. Including German trade tax of approximately 13% (net), the total income tax rate for the German companies is 40% for 2002 and 2001. In September 2002, the German government enacted new tax legislation effective for the Group on January 2003 which will increase the federal corporation income tax rate by 1.5% only for 2003. The effect of this change is immaterial to the Group’s financial statements. In December 2002 the Group used approximately €324 million of its tax loss carry forwards in Germany through an intercompany transaction, as part of its tax planning strategy. These transactions resulted in a decrease of deferred tax assets of approximately €130 million offset by a decrease of deferred tax liabilities for intangible and tangible assets.

Page 32 of 66
For the twelve months ended December 31, 2002, the eight months ended December 31, 2001, the four months ended April 30, 2001 and the twelve months ended December 31, 2000, income tax expense differed from the amounts computed by applying the German federal corporation income tax rate of 26.38% for the twelve months ended December 31, 2002, the eight months ended December 31, 2001, and the four months ended April 30, 2001, 42.2% for 2000, to (loss) income from continuing operations as a result of the following:
Successor Predecessor
Twelve months ended
December 31, 2002
Eight months ended
December 31, 2001
Four months ended
April 30, 2001
Twelve months Ended
December 31, 2000
Statutory tax rate.................................................................................... 26,38% 26,38% 26,38% 42,20% (Loss) income from continuing operations .................................... (43,992) (90,782) (6,550) (319,067) Corporation tax benefit including solidarity tax ................................ (11,605) (23,944) (1,728) (134,646) Tax losses of entities not recognized................................................... 492 4,273 1,347 103,540 Non tax deductible expense 23,733 — — — Non taxable income............................................................................... — (16,147) (741) (124,641) Change in fair value of subsidiaries available for sale...................... (151) 1,443 — — Non-deductible goodwill ...................................................................... 8,840 4,611 839 4,460 Effect of German tax law changes....................................................... — — — (10,892) Income tax (benefit) loss for previous years ...................................... (2,475) — — 2,759 Withholding tax ..................................................................................... 8,025 — — — Tax rate differences at foreign subsidiaries ........................................ (5,712) (255) (128) 429 Utilization of tax loss carry forwards not previously recognized .... (309) — — (230) Trade tax on income in Germany ........................................................ 7,436 (17,224) (5,317) 862 Non-deductible interest......................................................................... 6,527 19,473 9,736 — Other (net) .............................................................................................. (42) 1,607 889 20,127
Income tax (benefit) expense from continuing operations.......... 34,759 (26,163) 4,897 (138,232) The utilization of tax loss carry forwards lowered the tax charge by €309, €0, €0 and €230 for the twelve months ended December 31, 2002, the eight months ended December 31, 2001, the four months ended April 30, 2001 and the twelve months ended December 31, 2000, respectively. Deferred tax assets are recognized for tax loss carry forwards only to the extent that realization of the related tax benefit is probable. Total tax loss carry forwards amount to €206,528, €582,123, €508,631 and €502,081 at December 31, 2002, December 31, 2001, April 30, 2001, and December 31, 2000, respectively, the majority of which have no expiration dates. Tax loss carry forwards resulted in deferred tax benefit amounting to €3,435, €26,550, €2,620 and €122,304 for the twelve months ended December 31, 2002, the eight months ended December 31, 2001, the four months ended April 30, 2001 and the twelve months ended December 31, 2000, respectively. Deferred taxes as of December 31, 2002, December 31, 2001 are attributable to the following balance sheet items:
December 31,
2002 December 31,
2001 Deferred tax assets Tax loss carry forwards............................................................................................................................... 27,869 130,310Property, plant and equipment.................................................................................................................... 4,204 7,683Inventories .................................................................................................................................................... 2,465 —Provisions for pensions ............................................................................................................................... 18,015 17,262Other provisions........................................................................................................................................... 15,603 35,472Other items ................................................................................................................................................... 12,048 7,741Total.............................................................................................................................................................. 80,204 198,468

Page 33 of 66
Deferred tax liabilities Intangible assets ........................................................................................................................................... 35,325 100,062Property, plant and equipment.................................................................................................................... 104,250 179,600Investments................................................................................................................................................... 10,889 14,494Unamortized debt issuance costs ............................................................................................................... 24,708 32,327Other provisions........................................................................................................................................... 2,465 1,518Other items ................................................................................................................................................... 3,356 1,854Total.............................................................................................................................................................. 180,993 329,855 Deferred tax assets (liabilities), net ........................................................................................................ (100,789) (131,387)
Net deferred income tax assets and liabilities in the consolidated balance sheets are as follows:
December 31,
2002 December 31,
2001 Deferred tax assets...................................................................................................................................... 3,734 4,546 Deferred tax liabilities ................................................................................................................................ 104,523 135,933 Deferred tax assets (liabilities), net ....................................................................................................... (100,789) (131,387)
16. Intangible assets
Goodwill
Other Intangible
Assets Total Acquisition cost Balance as of January 1, 2002 ...................................................................................................................... 585,682 326,212 911,894 Additions............................................................................................................................................................ 103 15,945 16,048 Disposals ............................................................................................................................................................ (2,967) (899) (3,866) Exchange rate changes ..................................................................................................................................... (23,064) (3,161) (26,225) Balance as of December 31, 2002................................................................................................................. 559,754 338,097 897,851 Amortization Balance as of January 1, 2002 ...................................................................................................................... 19,506 39,579 59,085 Additions............................................................................................................................................................ 28,697 23,360 52,057 Disposals ............................................................................................................................................................ (1,234) (897) (2,131) Exchange rate changes ..................................................................................................................................... (1,358) (680) (2,038) Balance as of December 31, 2002................................................................................................................. 45,611 61,362 106,973 Net Book value as of December 31, 2001 ................................................................................................... 566,176 286,633 852,809 Net Book value as of December 31, 2002 ................................................................................................... 514,143 276,735 790,878
Other intangible assets consist of trademarks and similar rights, customer base and other intangible assets for which the net book values as of December 31, 2002 are €140,348, €101,345 and €35,042 and as of December 31, 2001 are €148,453, €109,516 and €28,664, respectively.

Page 34 of 66
17. Property, plant and equipment
Land and buildings
Plant and machinery
Other plants, factory and
office equipment
Advance payments and construction in progress Total
Acquisition or production costs Balance as of January 1, 2002 ................................. 386,111 2,548,978 409,924 65,229 3,410,242 Additions....................................................................... 4,038 73,874 38,878 3,063 119,853 Disposals ....................................................................... (11,343) (52,929) (21,933) (655) (86,860) Transfers........................................................................ 201 (6,793) 14,894 (8,302) — Exchange rate changes ................................................ (11,148) (141,961) (6,109) (2,661) (161,879) Balance as of December 31, 2002............................ 367,859 2,421,169 435,654 56,674 3,281,356 Accumulated depreciation Balance as of January 1, 2002 ................................. 165,232 1,322,848 221,613 2,870 1,712,563 Additions....................................................................... 11,483 157,784 32,161 1 201,429 Disposals ....................................................................... (7,284) (41,377) (20,092) — (68,753) Exchange rate changes ................................................ (4,602) (79,809) 4,658 (440) (80,193) Transfers........................................................................ ____— 805 (805) __— _____— _______ _______ _______ Balance as of December 31, 2002............................ 164,829 1,360,251 237,535 2,431 1,765,046 Net Book value as of December 31, 2001 220,879 1,226,130 188,311 62,359 1,697,679 Net Book value as of December 31, 2002 .............. 203,030 1,060,918 198,119 54,243 1,516,310
The Company leases certain property, plant and equipment under various operating and finance lease arrangements. Assets capitalized and recorded under finance lease agreements included in property, plant and equipment consist of the following:
December 31,
2002 December 31,
2001 Land and buildings...................................................................................................................... 11,172 10,813Machinery, equipment and other leased assets........................................................................ 164,597 164,042 175,769 174,855Accumulated depreciation.......................................................................................................... (49,219) (49,335) Total ............................................................................................................................................. 126,550 125,520
Depreciation of property, plant and equipment under capital leases is included in depreciation expense.

Page 35 of 66
18. Equity method investments The following significant investments are accounted for under the equity method at December 31, 2002:
Name and headquarters of the company Ownership percentage
Messer de Honduras S.A. de C.V., Tegucigalpa/Honduras .................................................................................................................................. 50.0 Technische Gase Hoesch Messer Griesheim GmbH & Co. KG, Dortmund/Germany ..................................................................................... 50.0 Goyal MG Gases Pvt.Ltd., New Delhi/India .......................................................................................................................................................... 49.0 Secomex Manufacturing (M) Snd. Bhd., Kuala Lumpur/Malaysia ..................................................................................................................... 49.0 Messer Singapore Holding GmbH, Frankfurt am Main/Germany ...................................................................................................................... 39.0 Constar LLC, Norcross, Georgia/USA.................................................................................................................................................................... 50.0
___________________ The table below contains summarized financial information for the equity method investments of the Group:
Successor Predecessor
Twelve months ended
December 31, 2002
Eight months ended
December 31, 2001
Four months ended
April 30, 2001
Twelve months ended
December 31, 2000
Net Sales ................................................................................................. 45,178 56,043 32,653 76,149 Operating loss ................................................................................................ (3,755) (21,873) (9,065) (114,949) Net loss ........................................................................................................... (1,057) (32,994) (16,373) (127,363) Property, plant and equipment ..................................................................... 22,121 118,188 253,327 220,982 Current liabilities ........................................................................................... 18,857 25,844 60,311 205,359 Non-current liabilities ................................................................................... 32,853 333,438 242,430 142,169 Stockholders' Equity deficit.......................................................................... (17,278) (186,778) (19,829) (11,693) Equity method investments and changes therein, are as follows: Balance as of January 1, 2002 ............................................................................................................................................................................... 19,186 Additions..................................................................................................................................................................................................................... 957 Disposals ..................................................................................................................................................................................................................... (5,443) Exchange rate changes .............................................................................................................................................................................................. (3,495) Changes resulting from the at equity method ......................................................................................................................................................... 1,995 Balance as of December 31, 2002.......................................................................................................................................................................... 13,200
The changes resulting from the at equity method include the proportionate share of the investee's income (losses) and other elements such as dividends.
Successor Predecessor
Twelve months ended
December 31, 2002
Eight months ended
December 31, 2001
Four months ended
April 30, 2001
Twelve months ended
December 31, 2000
Proportionate share of investees' income (losses)........................................... 6,036 (15,213) (5,106) 2,883 Amortization of basis differences..................................................................... — — — (2,263) Impairment charges on equity method investments ....................................... (18,657) ____— ___— (208,572) _______ _______ Total .................................................................................................................... (12,621) (15,213) (5,106) (207,952)

Page 36 of 66
Impairment charges of €18,657 in fiscal year 2002 related to Constar LLC, Norcross, Georgia/USA (“Constar”). Constar is an equity method investee of MG Industries (“MGI”) a wholly owned company of the Group. MGI maintains investments in and holds notes due from Constar. MGI has also guaranteed a portion of Constar’s third party financing arrangements. The provisions of the third party financing arrangements require Constar to adhere to certain financial and non-financial covenants. Constar was not in compliance with these covenants at December 31, 2002. At December 31, 2002, amounts available and outstanding under Constar’s guaranteed financing arrangements were US$20 million and US$19.3 million, respectively, of which approximately US$18.2 million are due on September 15, 2003.
On January 17, 2002, Constar’s entire executive management team was replaced. During the period from January 1, 2002 through October 1, 2002, Constar’s new management team expended significant effort in transitioning key customer relationships, identifying excessive costs, and developing a new strategic plan. In October 2002, management developed a revised 2002 budget and a multi year plan. Actual cash flows having been significantly below previously budgeted amounts, combined with the newly developed management plan resulted in management reviewing Constar’s goodwill for impairment.
In connection with management’s October 2002 analysis and in accordance with IAS 36, management also reviewed the recoverability of its cash generating units (CGU’s) including goodwill. The application of IAS 36 resulted in an impairment charge of approximately €18.7 million which was recorded as a component of Constar’s €20.7 million loss for the twelve months ended December 31, 2002.
Constar’s members equity was completely exhausted effective June 1, 2002 as a result of continued losses. For the year ended December 31, 2002, in accordance with the provisions of IAS 28 “Accounting for Investments in Associates” and Standing Interpretations Committee 20, (SIC-20) “Equity Accounting Method – Recognition of losses” the Group through its wholly owned subsidiary MGI has recorded €20.5 million of Constar’s total €20.7 million operating loss in its consolidated statement of operations as equity method investments expense, net (see Note 40 “Reconciliation to U.S. GAAP). Impairment charges in fiscal year 2000 related to the Group’s equity method investments are summarized below: Singapore Syngas Pte. Ltd. ......................................................................................................................................................................................... 165,270 Bombay Oxygen Corporation Ltd. (Messer Holdings Ltd.) ................................................................................................................................... 32,400 Other equity method investments............................................................................................................................................................................... 10,902 Total .............................................................................................................................................................................................................................. 208,572
Singapore Syngas Pte. Ltd. In 1998, the Group established Singapore Syngas Pte. Ltd. ("Syngas"), a joint venture with Texaco Nederland B.V. for the production and distribution of synthesized gases in Singapore. The basis for the joint venture was a significant carbon monoxide supply contract with a major customer (Celanese). The development of the plant was financed via bank debt, which was guaranteed by the joint venture partners. The Celanese supply contract provided for, among other things, penalty provisions if the Syngas plant were unable to produce carbon monoxide meeting certain specified properties and volume levels by July 1, 2000, a "date certain", for which the joint venture partners provided a performance guarantee. Although the plant was constructed by the date certain, the plant did not meet the required specifications due to technical and operational problems in plant construction. As of December 31, 2000, Syngas became liable for liquidated damages, as the plant still had not met the required performance specifications. The project also incurred significant cost overruns, which were funded by the joint venture partners. Syngas and the joint venture partners entered into a settlement agreement with Celanese for liquidated damages in March 2001 (see below).

Page 37 of 66
In view of the operational and technical difficulties encountered by the joint venture, the Group made a determination during 2000 that its investment in Syngas was impaired, based on a discounted cash flow analysis. Although the Company held a 50% joint venture equity interest in Syngas at the time, the Company calculated its share of losses arising from the joint venture at 75% due to the fact that Texaco had a "put option" to sell 50% of its 50% ownership in Syngas to the Group, which was "in-the-money" as of December 31, 2000. As a precondition to the acquisition transactions, the Group was required to limit its exposure to its Singapore investments. On April 30, 2001, the Group transferred its 100% interest in Messer Singapore Pte. Ltd. and its 50% interest in Syngas to Messer Singapore Holding GmbH. The Group has a non-controlling 39% equity interest in Messer Singapore Holding GmbH. The other shareholders are Hoechst AG (39%), Bandinelli GmbH, a special purpose company owned by MIG (11%), and members of the group's senior management (11%). On June 20, 2001, Texaco transferred half of its 50% interest in Syngas to Messer Singapore Holding GmbH. As a result of these transactions, Messer Griesheim holds an indirect 29.25% interest in Syngas through its equity interest in Messer Singapore Holding GmbH. Concurrently with the transfer of the Syngas business, Messer Singapore Holding GmbH indemnified the Group for its outstanding guarantee obligations in connection with the Singapore operations. To finance Messer Singapore Holding GmbH, the Group and Hoechst have made shareholder loans. The loans have been allocated two-thirds to Hoechst and one-third to the Group, as per the shareholders' agreement. Although the transfer to Messer Singapore Holding occurred on April 30, 2001, this funding arrangement takes account of all funding of Messer Griesheim to its Singapore operations since September 1, 2000. Under the shareholders' agreement, the Group's funding obligations (shareholder loans and other financial support including funding provided by the Group to its Singapore operations since September 1, 2000) has been limited to €92 million. Messer Griesheim received from Hoechst a €26.4 million cash payment representing two-thirds of the funding by the Group for the Singapore operations since September 1, 2000 and has accounted for the receipt as an advance towards a capital contribution in the Predecessor balance sheet at April 30, 2001. This payment excludes amounts funded by Hoechst with respect to payments to Celanese Singapore Pte. Ltd (“Celanese”) and Texaco as described below. Further, as of May 1, 2001, the Successor's obligations to fund loss commitments of Syngas have been revalued to give effect to the portion which are expected to be funded by Hoechst. Accordingly, Messer Griesheim's remaining funding obligations under this cap, net of 33 1/3% of various shareholder loans and other financial support already provided by Messer Griesheim to its Singapore operations since September 1, 2000, were €63.2 million as of April 30, 2001, €14.5 million as of December 31, 2001 and €10.2 million as of December 31, 2002. In March 2001, Texaco and Messer Griesheim entered into settlement arrangements with Celanese which settled the claims of Celanese under the completion guarantee provided by Messer Griesheim, and amended the existing gas supply agreement between Syngas and Celanese. These amendments and modifications involved, among other things, cash payments by Messer Griesheim to Celanese, the liability for which is included in the overall allocation of Syngas exposures of one-third to Messer Griesheim and two-thirds to Hoechst. The settlement amount allocated to and paid by Messer Griesheim was €28.6 million, of which €19.8 million was financed by Hoechst as an advance towards a capital contribution in the Predecessor balance sheet at April 30, 2001. The repayment claim against Messer Griesheim for this financing was waived by Hoechst on April 30, 2001. In conjunction with the Celanese settlement, Messer Griesheim and Texaco modified their put option. The original put option agreement gave Texaco an option to sell 25% of the shares in Syngas to Messer Griesheim. Under the modified put option agreement, Messer Griesheim purchased from Texaco the outstanding shareholder loans made by Texaco to Syngas in excess of Texaco's remaining 25% equity interest in Syngas and related funding obligations. Messer Griesheim paid a purchase price of €17.2 million for the loans. Of that amount, Hoechst loaned €11.3 million to Messer Griesheim as an advance towards a capital contribution in the Predecessor balance sheet at April 30, 2001. In exchange, Texaco agreed that Hoechst can require Texaco to exercise the put option with respect to 25% of the shares in Syngas at any time on or after May 1, 2001 and no later than June 30, 2001 for a consideration of US-$1. The put was exercised on June 20, 2001, at which time the Syngas shares acquired from Texaco were transferred directly to Messer Singapore Holding GmbH. As a result of the change in ownership that occurred when the Texaco put option was exercised, Syngas was required to repay its
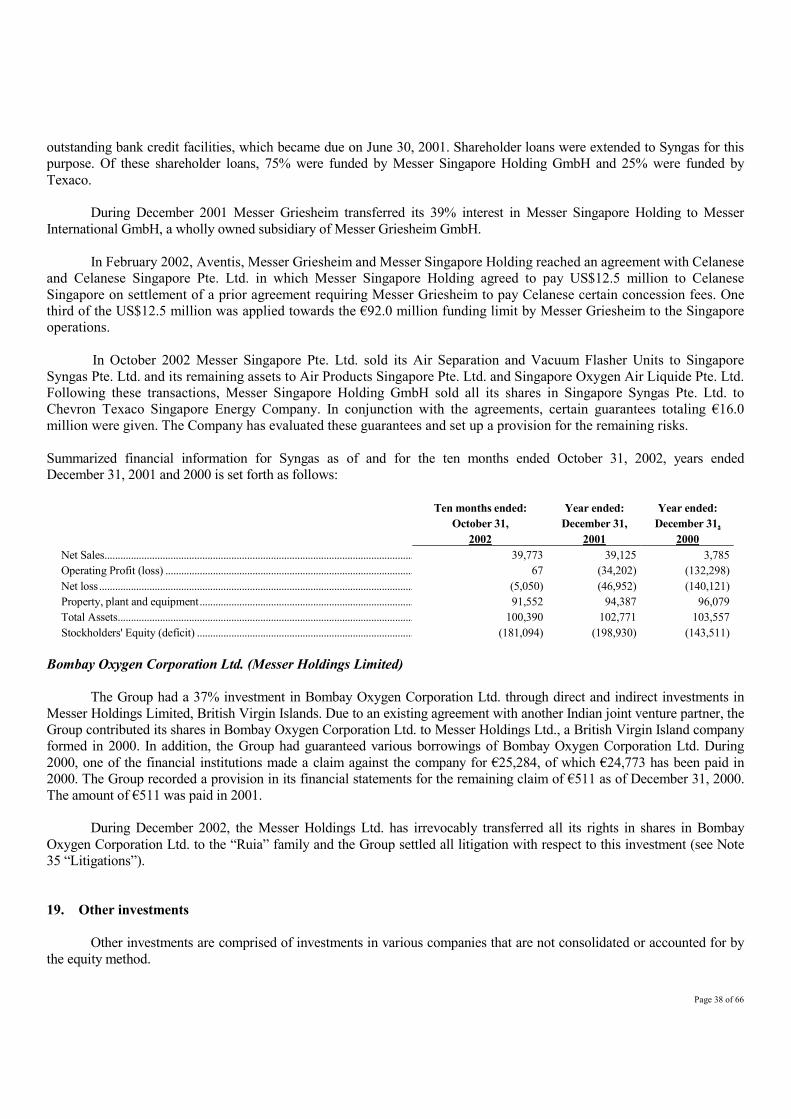
Page 38 of 66
outstanding bank credit facilities, which became due on June 30, 2001. Shareholder loans were extended to Syngas for this purpose. Of these shareholder loans, 75% were funded by Messer Singapore Holding GmbH and 25% were funded by Texaco. During December 2001 Messer Griesheim transferred its 39% interest in Messer Singapore Holding to Messer International GmbH, a wholly owned subsidiary of Messer Griesheim GmbH. In February 2002, Aventis, Messer Griesheim and Messer Singapore Holding reached an agreement with Celanese and Celanese Singapore Pte. Ltd. in which Messer Singapore Holding agreed to pay US$12.5 million to Celanese Singapore on settlement of a prior agreement requiring Messer Griesheim to pay Celanese certain concession fees. One third of the US$12.5 million was applied towards the €92.0 million funding limit by Messer Griesheim to the Singapore operations.
In October 2002 Messer Singapore Pte. Ltd. sold its Air Separation and Vacuum Flasher Units to Singapore Syngas Pte. Ltd. and its remaining assets to Air Products Singapore Pte. Ltd. and Singapore Oxygen Air Liquide Pte. Ltd. Following these transactions, Messer Singapore Holding GmbH sold all its shares in Singapore Syngas Pte. Ltd. to Chevron Texaco Singapore Energy Company. In conjunction with the agreements, certain guarantees totaling €16.0 million were given. The Company has evaluated these guarantees and set up a provision for the remaining risks. Summarized financial information for Syngas as of and for the ten months ended October 31, 2002, years ended December 31, 2001 and 2000 is set forth as follows:
Ten months ended: October 31,
2002
Year ended: December 31,
2001
Year ended: December 31,
2000 Net Sales..................................................................................................................... 39,773 39,125 3,785 Operating Profit (loss) .............................................................................................. 67 (34,202) (132,298) Net loss....................................................................................................................... (5,050) (46,952) (140,121) Property, plant and equipment................................................................................. 91,552 94,387 96,079 Total Assets................................................................................................................ 100,390 102,771 103,557 Stockholders' Equity (deficit) .................................................................................. (181,094) (198,930) (143,511)
Bombay Oxygen Corporation Ltd. (Messer Holdings Limited) The Group had a 37% investment in Bombay Oxygen Corporation Ltd. through direct and indirect investments in Messer Holdings Limited, British Virgin Islands. Due to an existing agreement with another Indian joint venture partner, the Group contributed its shares in Bombay Oxygen Corporation Ltd. to Messer Holdings Ltd., a British Virgin Island company formed in 2000. In addition, the Group had guaranteed various borrowings of Bombay Oxygen Corporation Ltd. During 2000, one of the financial institutions made a claim against the company for €25,284, of which €24,773 has been paid in 2000. The Group recorded a provision in its financial statements for the remaining claim of €511 as of December 31, 2000. The amount of €511 was paid in 2001. During December 2002, the Messer Holdings Ltd. has irrevocably transferred all its rights in shares in Bombay Oxygen Corporation Ltd. to the “Ruia” family and the Group settled all litigation with respect to this investment (see Note 35 “Litigations”). 19. Other investments Other investments are comprised of investments in various companies that are not consolidated or accounted for by the equity method.
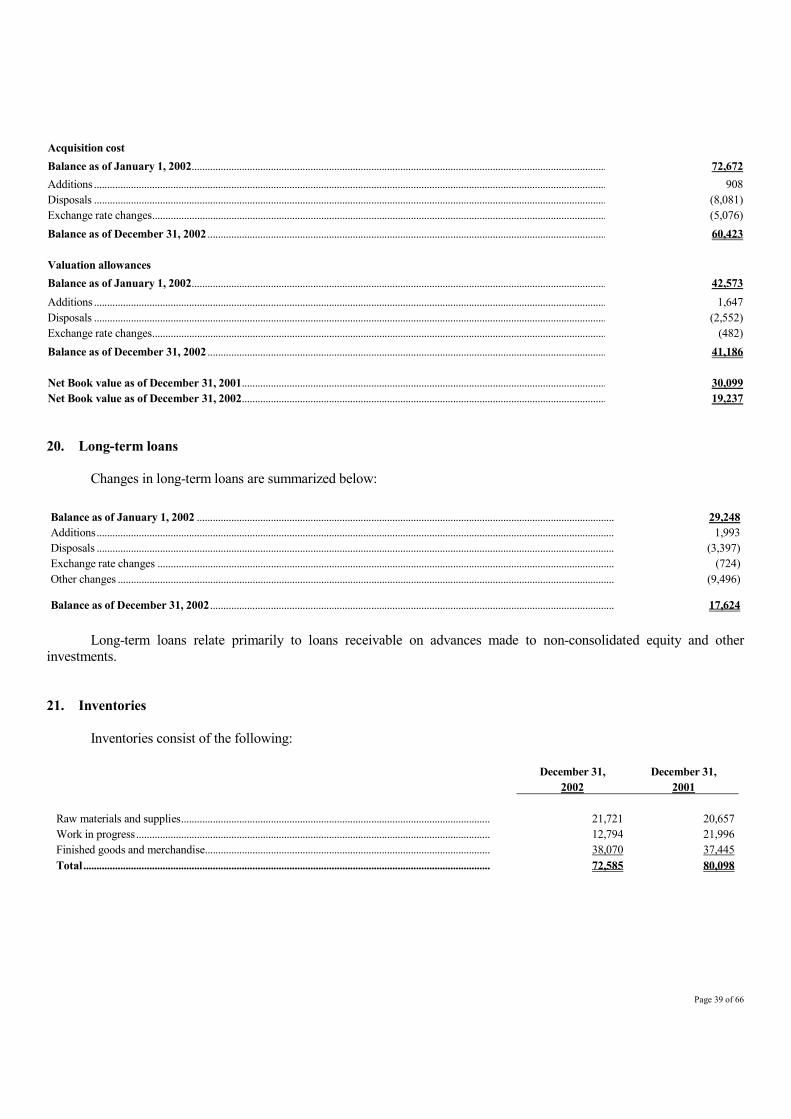
Page 39 of 66
Acquisition cost Balance as of January 1, 2002............................................................................................................................................................. 72,672 Additions .................................................................................................................................................................................................. 908 Disposals .................................................................................................................................................................................................. (8,081) Exchange rate changes............................................................................................................................................................................ (5,076) Balance as of December 31, 2002 ....................................................................................................................................................... 60,423 Valuation allowances Balance as of January 1, 2002............................................................................................................................................................. 42,573 Additions .................................................................................................................................................................................................. 1,647 Disposals .................................................................................................................................................................................................. (2,552) Exchange rate changes............................................................................................................................................................................ (482) Balance as of December 31, 2002 ....................................................................................................................................................... 41,186 Net Book value as of December 31, 2001.......................................................................................................................................... 30,099 Net Book value as of December 31, 2002.......................................................................................................................................... 19,237 20. Long-term loans Changes in long-term loans are summarized below: Balance as of January 1, 2002 .............................................................................................................................................................. 29,248 Additions.................................................................................................................................................................................................... 1,993 Disposals .................................................................................................................................................................................................... (3,397) Exchange rate changes ............................................................................................................................................................................. (724) Other changes ............................................................................................................................................................................................ (9,496)
Balance as of December 31, 2002......................................................................................................................................................... 17,624 Long-term loans relate primarily to loans receivable on advances made to non-consolidated equity and other investments. 21. Inventories Inventories consist of the following:
December 31,
2002 December 31,
2001 Raw materials and supplies..................................................................................................................... 21,721 20,657Work in progress...................................................................................................................................... 12,794 21,996Finished goods and merchandise............................................................................................................ 38,070 37,445Total.......................................................................................................................................................... 72,585 80,098

Page 40 of 66
22. Trade accounts receivable
December 31,
2002 December 31,
2001 Trade accounts receivable (current) ........................................................................................................ 304,685 317,059Allowance for doubtful accounts ............................................................................................................ (25,586) (26,316)Trade accounts receivable, net ............................................................................................................. 279,099 290,743
23. Other receivables and other assets
December 31,
2002 December 31,
2001 Receivables from related parties............................................................................................................... 7,251 7,058 Tax receivables ........................................................................................................................................... 8,265 6,720 Prepaid assets .............................................................................................................................................. 4,816 8,596 Advance payments ..................................................................................................................................... 2,183 4,155 Receivable from sale of fixed assets ........................................................................................................ — 1,277 Other loans .................................................................................................................................................. 1,272 8,088 Interest receivable....................................................................................................................................... 396 89 Prepaid employee expenses....................................................................................................................... 2,279 1,695 Receivables from suppliers and agents .................................................................................................... 2,290 1,713 Receivables from insurance companies ................................................................................................... 846 629 Security deposits......................................................................................................................................... 4,594 1,470 Marketable securities ................................................................................................................................. 8,160 8,331 Sundry receivables from non-operating activities .................................................................................. 1,467 6,418 Miscellaneous ............................................................................................................................................. 7,060 15,557 Total ............................................................................................................................................................ 50,879 71,796
24. Cash and cash equivalents The Company defines cash and cash equivalents as cash on hand, demand deposits and short term, highly liquid investments that are readily convertible to known amounts of cash and which are subject to an insignificant risk of change in value in the future. In addition, cash and cash equivalent include unrestricted cash balances at subsidiaries in foreign jurisdictions from which those amounts cannot easily be transferred. These cash balances amounted to approximately €62.2 million and €56.5 million, as of December 31, 2002 and December 31, 2001, respectively. The Company provided cash collateral for bank guarantees relating to the operating business and for long term loan facilities which were not refinanced on certain of its foreign subsidiaries. As the cash collateral is not available to the Company while the facilities remain outstanding, the cash collateral has been classified within non-current "other assets". As of December 31, 2002 and 2001, the cash collateral balances were approximately €6.3 million and €28.3 million, respectively.
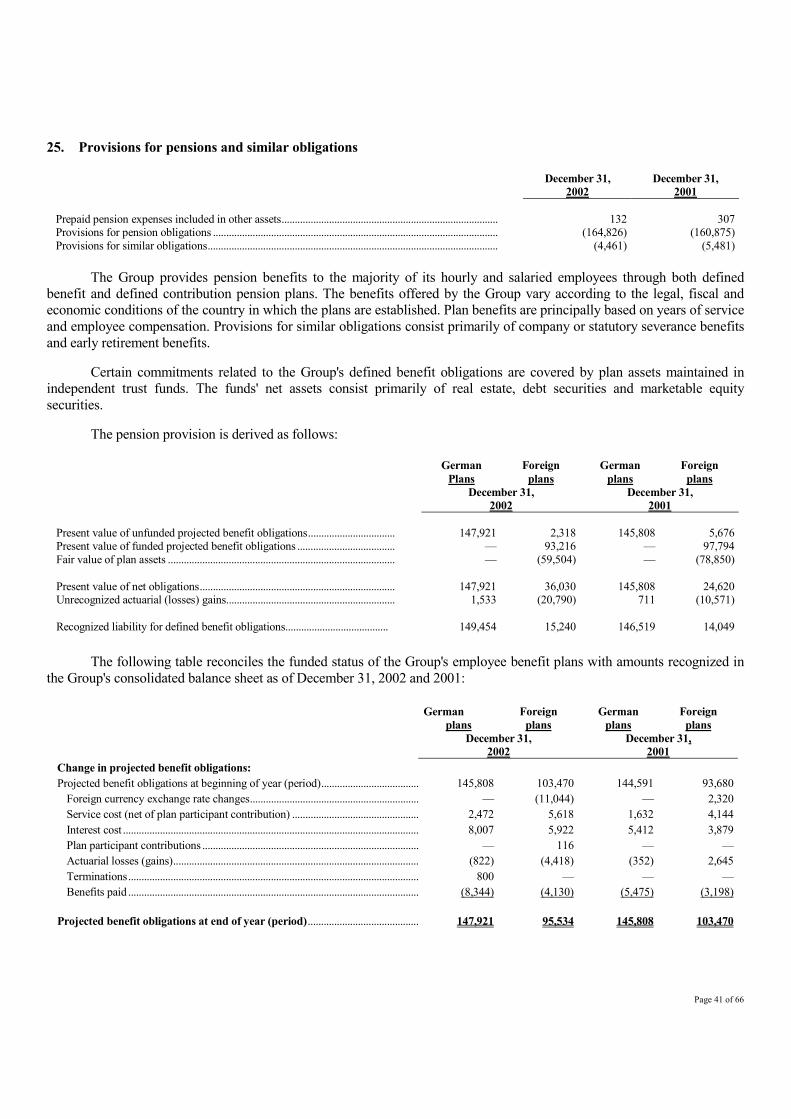
Page 41 of 66
25. Provisions for pensions and similar obligations
December 31,
2002 December 31,
2001 Prepaid pension expenses included in other assets.................................................................................. 132 307Provisions for pension obligations ............................................................................................................ (164,826) (160,875)Provisions for similar obligations.............................................................................................................. (4,461) (5,481)
The Group provides pension benefits to the majority of its hourly and salaried employees through both defined benefit and defined contribution pension plans. The benefits offered by the Group vary according to the legal, fiscal and economic conditions of the country in which the plans are established. Plan benefits are principally based on years of service and employee compensation. Provisions for similar obligations consist primarily of company or statutory severance benefits and early retirement benefits. Certain commitments related to the Group's defined benefit obligations are covered by plan assets maintained in independent trust funds. The funds' net assets consist primarily of real estate, debt securities and marketable equity securities. The pension provision is derived as follows:
German
Plans Foreign
plans German
plans Foreign
plans
December 31,
2002 December 31,
2001 Present value of unfunded projected benefit obligations................................. 147,921 2,318 145,808 5,676Present value of funded projected benefit obligations ..................................... — 93,216 — 97,794Fair value of plan assets ...................................................................................... — (59,504) — (78,850) Present value of net obligations.......................................................................... 147,921 36,030 145,808 24,620Unrecognized actuarial (losses) gains................................................................ 1,533 (20,790) 711 (10,571) Recognized liability for defined benefit obligations....................................... 149,454 15,240 146,519 14,049
The following table reconciles the funded status of the Group's employee benefit plans with amounts recognized in the Group's consolidated balance sheet as of December 31, 2002 and 2001:
German
plans Foreign
plans German
plans Foreign
plans
December 31,
2002 December 31,
2001 Change in projected benefit obligations: Projected benefit obligations at beginning of year (period)..................................... 145,808 103,470 144,591 93,680 Foreign currency exchange rate changes................................................................ — (11,044) — 2,320 Service cost (net of plan participant contribution) ................................................ 2,472 5,618 1,632 4,144 Interest cost ................................................................................................................ 8,007 5,922 5,412 3,879 Plan participant contributions .................................................................................. — 116 — — Actuarial losses (gains)............................................................................................. (822) (4,418) (352) 2,645 Terminations.............................................................................................................. 800 — — — Benefits paid .............................................................................................................. (8,344) (4,130) (5,475) (3,198) Projected benefit obligations at end of year (period).......................................... 147,921 95,534 145,808 103,470

Page 42 of 66
Change in plan assets: Fair value of plan assets at beginning of year ........................................................... — 78,850 — 82,285 Foreign currency exchange rate changes................................................................ — (7,590) — 2,110 Actual return on plan assets ..................................................................................... — (10,984) — (5,264) Employer contributions ............................................................................................ — 2,849 — 2,042 Plan participant contributions .................................................................................. — 262 — — Benefits paid .............................................................................................................. — (3,883) — (2,323) - Fair value of plan assets at end of year (period) .................................................. — 59,504 — 78,850
The components of net periodic costs for defined benefit plans consist of the following:
Successor Predecessor
German
Plans Foreign
plans German
plans Foreign
plans German
plans Foreign
plans German
plans Foreign
plans
Twelve months Ended
December 31, 2002
Eight months ended
December 31, 2001
Four months ended
April 30, 2001
Twelve months ended
December 31, 2000 Service cost ............................................. 2,472 5,618 1,632 4,144 928 2,072 2,990 5,109Interest cost ............................................. 8,007 5,922 5,412 3,879 2,630 1,940 8,318 5,189Terminations........................................... 800 — — — — — — —Expected return on plan assets.............. — (5,672) — (4,810) — (2,405) — (6,778)Amortization of unrecognized net
annual losses (gains)........................... __— 344 __— __— __— (86) ___— (63) _______ _______ _______ _______ Net periodic pension cost .................... 11,279 6,212 7,044 3,213 3,558 1,521 11,308 3,457
The following table shows the principal actuarial assumptions for these plans (expressed as weighted averages):
Successor Predecessor
German
Plans Foreign Plans
German plans
Foreign Plans
German plans
Foreign plans
German plans
Foreign plans
December 31, 2002 December 31, 2001 April 30, 2001 December 31, 2000 (in %) (in %) (in %) (in %) (in %) (in %) (in %) (in %)
Discount rate................................................. 5.75 6.40 5.75 6.43 6.25 6.43 6.5 6.9Expected rate of wage increases................. 3.0 3.65 3.0 4.3 2.75 4.3 2.75 6.7Expected rate of salary increases ............... 3.0 3.65 3.0 4.3 2.75 4.3 1.75 6.7Expected return on assets............................ N/A 8.15 N/A 7.1 N/A 7.1 N/A 5.8
Expenses related to defined contribution plans totaled €1,447, €1,033, €516 and €1,625 in the twelve months ended December 31, 2002, the eight months ended December 31, 2001, the four months ended April 30, 2001 and the twelve months ended December 31, 2000, respectively.

Page 43 of 66
26. Other provisions
January 1,
2002 Consumption Release Additions Exchange
rate changes December 31,
2002 Non-current Tax provision........................................................................................ 20,303 (337) — 32,959 (69) 52,856 Employee-related provisions.............................................................. 9,667 (2,783) — 1,956 (13) 8,827 Purchase and sales contracts............................................................... 4,482 — (1,249) — (12) 3,221 Other...................................................................................................... 4,675 (587) (268) — (195) 3,625 Total non-current .............................................................................. 39,127 (3,707) (1,517) 34,915 (289) 68,529
Current Divestiture program............................................................................. 24,200 (9,063) — 6,993 — 22,130 Provisions on equity method investments ........................................ 4,200 (4,200) — 15,296 (1,117) 14,179 Employee-related provisions.............................................................. 21,047 (4,993) (2,659) 472 (1,429) 12,438 Restructuring ........................................................................................ 10,234 (4,465) — 738 — 6,507 Litigation............................................................................................... 21,604 (8,576) (2,270) 884 — 11,642 Other...................................................................................................... 55,578 (15,248) (3,801) 3,113 311 39,953 Total current....................................................................................... 136,863 (46,545) (8,730) 27,496 (2,235) 106,849 Employee-related provisions as of December 31, 2002, as shown under non-current provisions relate primarily to long-service bonuses. Employee-related provisions as of December 31, 2002 as shown under current provisions relate primarily to paid vacation, severance payments and to part-time employment of employees prior to their retirement. 27. Corporate debt
December 31,
2002 December 31,
2001 Non-current Senior Notes .......................................................................................................................................................... 493,708 550,000Due to banks .......................................................................................................................................................... 728,490 929,414Finance leases........................................................................................................................................................ 122,769 130,827Due to related parties............................................................................................................................................ 35,854 2,068Other loans............................................................................................................................................................. 539 600 1,381,360 1,612,909Current Due to banks .......................................................................................................................................................... 36,056 32,868Finance leases........................................................................................................................................................ 15,494 8,200Due to related parties............................................................................................................................................ 1,041 1,342Other loans............................................................................................................................................................. 5,008 8,368 57,599 50,778 1,438,959 1,663,687Unamortized debt issuance costs ........................................................................................................................ (63,541) (82,448) TOTAL DEBT..................................................................................................................................................... 1,375,418 1,581,239
Debt with fixed interest rate................................................................................................................................. 657,850 695,227Debt with floating interest rate (hedged)............................................................................................................ 638,715 812,439Debt with floating interest rate (not hedged) ..................................................................................................... 142,394 156,021 1,438,959 1,663,687Unamortized debt issuance costs ........................................................................................................................ (63,541) (82,448) Total....................................................................................................................................................................... 1,375,418 1,581,239

Page 44 of 66
The weighted average nominal interest rates are: Due to Senior Notes holders................................................................................................................................ 10.375% 10.375%Due to banks including Hedges........................................................................................................................... 7.07% 7.266%Finance leases........................................................................................................................................................ 6.04% 5.858%Other loans............................................................................................................................................................. 5.10% 6.288%
The weighted average interest rate on existing corporate debt including interest rate swap agreements but not including amortization of debt issuance costs was 8.05% and 8.21% at December 31, 2002 and at December 31, 2001. A description of the Company's corporate debt instruments is included in Note 4 ”Financing transactions”. The Group had unused long-term credit lines of €294.0 million and €300.5 million at December 31, 2002 and December 31, 2001. Aggregate amounts of corporate debt maturing excluding unamortized debt issuance costs during the next five years and thereafter are as follows:
2003................................................................................................................................................................................................... 57,5992004................................................................................................................................................................................................... 66,2632005................................................................................................................................................................................................... 84,9032006................................................................................................................................................................................................... 81,3602007................................................................................................................................................................................................... 122,876Thereafter.......................................................................................................................................................................................... 1,025,958 1,438,959
Principal repayments on the Senior Term Disposal facility are due earlier upon the sale of certain subsidiaries identified as part of the disposal program. In addition, Messer is required to use 50% of its excess cash flow in any given year or 50% if the leverage ratio is less than four to one , as defined, to repay its outstanding loans. Future minimum lease payments under noncancelable finance and operating leases are as follows:
Finance
Leases Operating
Leases 2003 ............................................................................................................................................................................................... 23,490 6,042 2004 ............................................................................................................................................................................................... 29,885 5,431 2005 ............................................................................................................................................................................................... 31,098 4,669 2006 ............................................................................................................................................................................................... 31,046 3,101 2007 ............................................................................................................................................................................................... 32,362 2,617 Thereafter ...................................................................................................................................................................................... 18,054 23,015 Total minimum payments ........................................................................................................................................................ 165,935 44,875 Amount representing interest.................................................................................................................................................. (27,672) Obligations under finance leases............................................................................................................................................. 138,263 Obligations due within one year ............................................................................................................................................. 15,494
Rental expenses under operating leases amounted to €8,561, €6,359, €2,720 and €9,358, for the twelve months ended December 31, 2002, the eight months ended December 31 2001, the four months ended April 30, 2001, and for the twelve months ended December 31, 2000, respectively.

Page 45 of 66
28. Miscellaneous liabilities
December 31,
2002 December 31,
2001
Accrued interest....................................................................................................................................... 23,910 25,202Advance payments received on orders ................................................................................................. 2,018 3,450Liabilities due to customers ................................................................................................................... 10,345 11,633Payroll liabilities ..................................................................................................................................... 29,983 26,901Taxes payable .......................................................................................................................................... 10,658 17,366Social security payable ........................................................................................................................... 4,083 3,387Deferred income...................................................................................................................................... 2,261 2,429Bills of exchange payable ...................................................................................................................... 129 850Fair value of derivatives ......................................................................................................................... 28,260 14,217Other liabilities ........................................................................................................................................ 34,636 45,014 Total ......................................................................................................................................................... 146,283 150,449
The fair value of derivatives as of December 31, 2002 and December 31, 2001, respectively, includes interest rate swap agreements, which are designated as cash flow hedges. 29. Stockholders' equity Issued Capital and additional Paid-in Capital Successor Stockholders' equity of the Successor prior to the acquisition transactions consisted of 50,000 shares held by Hoechst with a balance of €51 (par value and additional paid-in capital). As part of the Acquisition Transactions (see Note 3 “Acquisition transactions”), Hoechst and MIG contributed their shares in Messer Griesheim to the Company for 10,000 and 30,000 new shares, respectively, resulting in a total issued capital of 90,000 shares with a stated value of €1 per share. The shares issued were recorded at the fair value of Messer Griesheim at April 30, 2001, the date of the acquisition transactions. As a result, the excess of fair value over the stated value of the shares has been recorded as additional paid-in capital. Predecessor Stockholders' equity of the Predecessor consisted of 276,098 shares held by Hoechst (184,065 shares) and MIG (92,033 shares) with subscribed and additional paid-in capital of €394,820 as of January 1, 2000. During fiscal 2000, the predecessor recorded an increase in additional paid-in capital arising from the disposal of Cutting & Welding (see Note 14 “Results from discontinuing operations”). Retained Earnings (Accumulated Deficit) Successor According to the German Commercial Code, the Group may pay a dividend to its stockholders only from the unappropriated retained earnings of Messer Griesheim Holding AG. In addition, the German Stock Code requires the funding of statutory reserves (based upon 10% of annual net income) up to an amount no less than 10% of the issued capital (€90).

Page 46 of 66
Predecessor Retained earnings at December 31, 1999 include a €5,710 charge relating to the initial application of IAS 19 (revised 1998). On January 1, 2001, the Predecessor recorded a €335 credit resulting from a transition adjustment pursuant to IAS 39. 30. Minority interests The following represents minority stockholder interests in the equity of consolidated subsidiaries. Significant minority interests are held by third party stockholders in Germany, Serbia, Switzerland, Bulgaria, Guatemala and China. Balance as of January 1, 2002 ..................................................................................................................................................................................... 88,138 Dividend payments .......................................................................................................................................................................................................... (8,286) Profit after taxes ............................................................................................................................................................................................................... 11,120 Exchange rate changes .................................................................................................................................................................................................... (6,960) Balance as of December 31, 2002................................................................................................................................................................................ 84,012
31. Personnel expenses
Successor Predecessor
Twelve months ended
December 31, 2002
Eight months ended
December 31, 2001
Four months ended
April 30, 2001
Twelve months ended
December 31, 2000
Personnel expenses................................................................................ 321,055 224,633 117,932 393,280
Personnel expenses consist of wages, salaries and payments for social security and pensions. 32. Number of employees The average number of employees totaled:
Successor Predecessor
Twelve months ended
December 31, 2002
Eight months ended
December 31, 2001
Four months ended
April 30, 2001
Twelve months ended
December 31, 2000
Germany............................................................................................................ 2,208 2,244 2,395 2,589Western Europe................................................................................................ 997 1,017 1,077 1,074Eastern Europe ................................................................................................. 2,283 2,369 2,484 2,569North America.................................................................................................. 996 1,163 1,408 1,397Others(1) ............................................................................................................. 741 1,555 2,434 2,414 Total number of employees.......................................................................... 7,225 8,348 9,798 10,043
(1)Others include the employees of the companies of the regions Asia, Africa and Latin America.
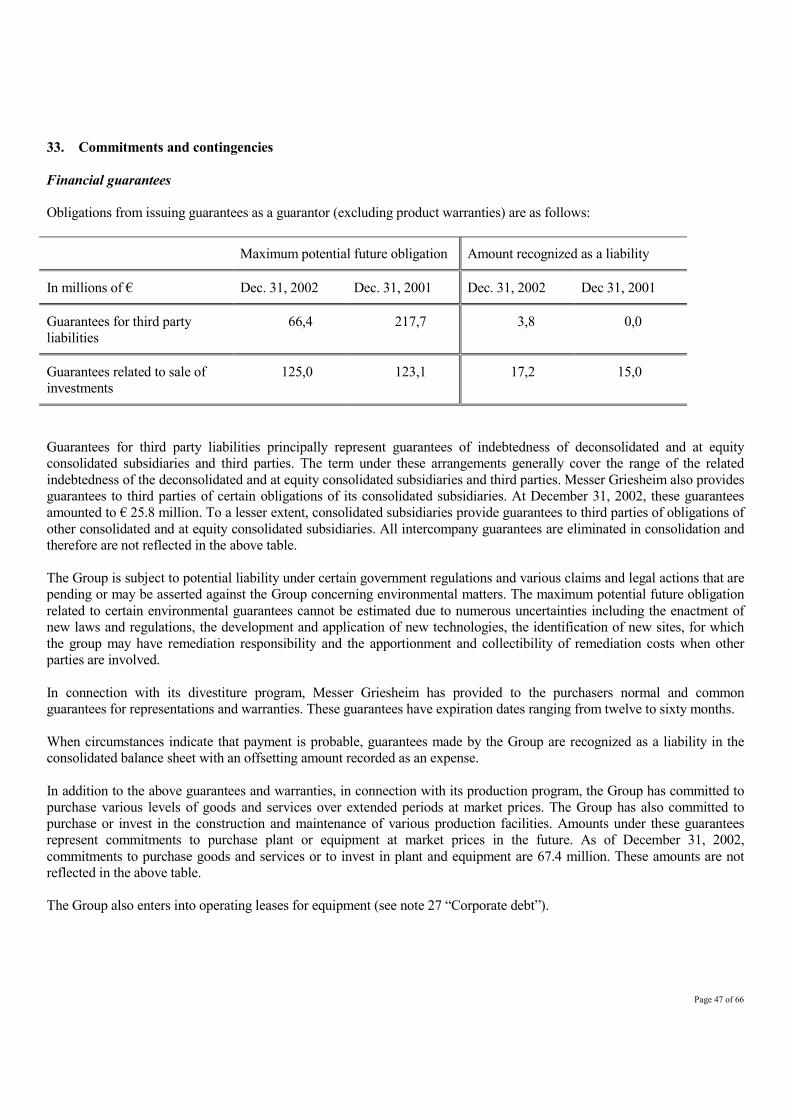
Page 47 of 66
33. Commitments and contingencies Financial guarantees Obligations from issuing guarantees as a guarantor (excluding product warranties) are as follows:
Maximum potential future obligation Amount recognized as a liability
In millions of € Dec. 31, 2002 Dec. 31, 2001 Dec. 31, 2002 Dec 31, 2001
Guarantees for third party liabilities
66,4 217,7 3,8 0,0
Guarantees related to sale of investments
125,0 123,1 17,2 15,0
Guarantees for third party liabilities principally represent guarantees of indebtedness of deconsolidated and at equity consolidated subsidiaries and third parties. The term under these arrangements generally cover the range of the related indebtedness of the deconsolidated and at equity consolidated subsidiaries and third parties. Messer Griesheim also provides guarantees to third parties of certain obligations of its consolidated subsidiaries. At December 31, 2002, these guarantees amounted to € 25.8 million. To a lesser extent, consolidated subsidiaries provide guarantees to third parties of obligations of other consolidated and at equity consolidated subsidiaries. All intercompany guarantees are eliminated in consolidation and therefore are not reflected in the above table. The Group is subject to potential liability under certain government regulations and various claims and legal actions that are pending or may be asserted against the Group concerning environmental matters. The maximum potential future obligation related to certain environmental guarantees cannot be estimated due to numerous uncertainties including the enactment of new laws and regulations, the development and application of new technologies, the identification of new sites, for which the group may have remediation responsibility and the apportionment and collectibility of remediation costs when other parties are involved. In connection with its divestiture program, Messer Griesheim has provided to the purchasers normal and common guarantees for representations and warranties. These guarantees have expiration dates ranging from twelve to sixty months. When circumstances indicate that payment is probable, guarantees made by the Group are recognized as a liability in the consolidated balance sheet with an offsetting amount recorded as an expense. In addition to the above guarantees and warranties, in connection with its production program, the Group has committed to purchase various levels of goods and services over extended periods at market prices. The Group has also committed to purchase or invest in the construction and maintenance of various production facilities. Amounts under these guarantees represent commitments to purchase plant or equipment at market prices in the future. As of December 31, 2002, commitments to purchase goods and services or to invest in plant and equipment are 67.4 million. These amounts are not reflected in the above table. The Group also enters into operating leases for equipment (see note 27 “Corporate debt”).

Page 48 of 66
Other financial obligations Substantially all of the assets of the Group are pledged as security for the Group's senior facilities at December 31, 2002 and December 31, 2001 (see Note 4 “Financing transactions”). Other financial obligations not included in the consolidated balance sheet relate to long-term commitments for capital expenditures of €11.8 million and €32.0 million at December 31, 2002 and 2001, respectively. Commitments under long-term purchase agreements amounted to €55.6 million and €68.6 million at December 31, 2002 and 2001, respectively. Commitments for capital to be funded to equity and cost method investees totaled €4.7 million and €22.8 million at December 31, 2002 and 2001, respectively. Pursuant to the acquisition transactions and the related China sale and purchase agreement, Messer Griesheim has agreed to purchase ACIC's [Aventis (China) Investment Co. Ltd.] interests in the six ACIC joint ventures, subject to certain conditions. The committed purchase price for the ACIC joint ventures is €32.0 million plus interest from April 30, 2001 until the completion of the purchase of the ACIC joint ventures. The purchase agreement requires that the purchase close no later than April 30, 2003. Upon acquiring the ACIC interests, Messer Griesheim has agreed to assume the debt of the ACIC joint ventures upon the date of completion of the transaction. As of December 31, 2002, such debt amounted to approximately €12.1 million and as of December 31, 2001 such debt amounted to approximately €17.1 million, respectively. Payment of the purchase price is guaranteed by Messer Griesheim Group, the Company's parent. 34. Derivative financial instruments IAS 39 "Financial Instruments: Recognition and Measurement" sets standards for recognition, measurement and reporting of information relating to financial instruments of an enterprise as an asset or liability, including the reporting of hedging instruments. Under this Standard, all financial assets and liabilities are recognized on the balance sheet, including all derivatives. They are initially measured at cost. Subsequent to initial recognition, all financial assets are remeasured to fair value, with the exception of certain assets and liabilities listed in the standard. Adoption of this standard on January 1, 2001 resulted in a €335 cumulative effect of change in accounting principles, net of deferred taxes totaling €223, and is reflected in equity. IAS 39 and FASB 133 "Accounting for Derivative Instruments and Hedging Activities" require companies to recognize all derivative instruments as either assets or liabilities in the statement of financial position at fair value. The accounting for changes in the fair value (i.e. gains or losses) of a derivative instrument depends on whether it has been designated and qualifies as part of a hedging relationship and further, on the type of hedging relationship. For those derivative instruments that are designated and qualify as hedging instruments, a company must designate the hedging instrument, based upon the exposure being hedged, as a fair value hedge, cash flow hedge or a hedge of a net investment in a foreign operation. The Group has entered into interest rate swap agreements that effectively convert a portion of its floating-rate indebtedness to a fixed rate basis for approximately the next two years, thus reducing the impact of interest rate changes on future interest expense. Approximately 44% (€638.7) million of the Group's outstanding indebtedness was designated as hedged due to interest rate swap agreements as of December 31, 2002. The fair values of the interest rate swaps designated for cash flow hedges were (€28.3) million as of December 31, 2002 and (€14.2) million as of December 31, 2001. Interest expense for the twelve months ended December 31, 2002 includes net losses resulting from hedging activities of €2.0 million and €0 million for the eight months ended December 31, 2001. Due to mandatory and voluntary loan prepayments in June 2002 amounting to €99.5 million, parts of the existing swaps have been terminated at the end of June 2002. The termination payments of €2.0 million of these swaps are shown as interest expense in the twelve months ended December 31, 2002. For the other existing swaps, there was no ineffectiveness in the cash flow hedges as the critical terms of the interest rate swaps (e.g. basis, re-pricing dates etc), matched the critical terms of the hedged loans.

Page 49 of 66
Unless otherwise noted, all components of the interest rate swap gains or losses are included in the assessment of hedge effectiveness. Changes in the fair value of interest rate swaps designated as hedging instruments of the variability of cash flow associated with floating-rate loans are reported in equity. The amount recorded in the comprehensive income related to the cash flow hedges was €7.8 million (net of deferred tax effect of €6.3 million) and €9.2 million (net of deferred tax effect of €5.0 million) for the twelve months ended December 31, 2002 and the eight months ended December 31, 2001 and €0 for the four months ended April 30, 2001 and the twelve months ended December 31, 2000, respectively. As the hedge is deemed completely effective and held to the full term, the swap market value changes are recorded as adjustments to the swap asset or liability and equity. A part of the foreign exchange forwards and the interest rate caps provide effective economic hedges under the Group's risk management policies, but do not qualify for hedge accounting under the specific rules in IAS 39. The fair values of these foreign exchange forwards and the interest rate caps were €8 and €3 as of December 31, 2002, €(18) and €122 as of December 31, 2001. Changes in the fair value of these derivative instruments that do not qualify for hedge accounting under IAS 39 are recognized immediately in the statement of operations. The Group recorded a (loss)/gain from changes in the fair value of €(93) and €106 in the twelve months ended December 31, 2002 and the eight months ended December 31, 2001, respectively. 35. Litigation Messer is involved from time to time in various claims and lawsuits incidental to the ordinary course of the business. Management is of the opinion that the risks connected with the pending or threatened litigations described below are adequately provided for. Messer acquired its interest in Bombay Oxygen Corporation Limited (Bombay Oxygen), a publicly traded company in India, in 1997 for a total of €12.2 million. It acquired this interest through the purchase of shares from Bombay Oxygen's major shareholder, and purchased additional shares by way of a public offer. The shares in Bombay Oxygen held by Messer were transferred in 2000 to a company jointly owned by Messer and indirectly Goyal MG Gases Pvt. Ltd (Goyal MG). The Securities and Exchange Board of India is investigating whether some of the purchases of Bombay Oxygen shares by Messer or the subsequent transfer of such shares to the jointly owned company involved a violation with respect to a change of control under Indian takeover regulations. In addition, Messer was involved in litigation with respect to this investment with the major shareholder of Bombay Oxygen. During December 2002, all such litigation with Bombay Oxygen was settled and Messer no longer holds any investment in Bombay Oxygen. Various law suits are pending or threatened by Goyal MG and/or its major shareholders. Messer has received a notice from Goyal MG alleging that Messer has breached a confidentiality clause contained in a shareholders' agreement among Messer, Goyal MG and certain other shareholders. The notice requests payment of Rupees 5.0 billion (approximately €100.1 million) for damages allegedly suffered on account of lost business due to certain press announcements by Messer which allegedly prejudicially affected the business of Goyal MG. During 2001, Goyal MG defaulted on a bank loan. As a result, the Group, as guarantor, was required to repay the US$4.7 million (approximately €4.5 million) loan in full. The Group is currently seeking reimbursement from Goyal MG for this amount. In 1999, the Company's Brazilian subsidiary, Messer Griesheim do Brazil Ltda., entered into a letter of agreement to pursue research into a new technique for the production of ethanol with an individual, who in April 2001, following a termination of the agreement, filed a suit against Messer Griesheim do Brazil Ltda. and certain other affiliates. The claim, mainly for damages for lost opportunities and potential earnings as a result of the subsidiary's alleged breach of the

Page 50 of 66
agreement, is for an amount of Reals 593 million (approximately €159.8 million). In addition, in August 2001 a former employee filed a lawsuit against the Group's Brazilian subsidiary for an amount of €4.3 million. In connection with the disposal of this Brazilian subsidiary, management agreed to indemnify the buyer for any loss relating to these claims. In August 1999, Messer Griesheim GmbH discovered that one of its executives, who then had senior management responsibility in Central and South America, had misappropriated corporate funds, which he represented to others within Messer Griesheim had been paid to third parties in connection with our business. This executive is no longer an employee. In June 2000, Messer Griesheim was informed that the U.S. Attorney's Office for the Eastern District of Pennsylvania was conducting an investigation relating to the conduct of this former executive. In April 2001, this former executive was arrested on a criminal complaint charging him with three counts of fraud against Messer Griesheim Industries, our principal subsidiary in the United States. Thereafter, the employee pled guilty to wire fraud in connection with a scheme to defraud Messer Griesheim Industries of US$ 550,000 and was sentenced to a prison term of 15 months. In April 2002, the Assistant U.S. Attorney handling the matter notified attorneys for the Company that the investigation was being dropped by their office and referred to the U.S. Customs Agency for possible civil enforcement action. The Company is not aware of any action being pursued by the Customs Agency. The Company can give no assurance as to the ultimate scope or outcome of the overall investigation. Under the business combination agreement entered into in connection with the acquisitions described above, Hoechst has agreed to indemnify the Company with respect to any losses arising out of such investigation of any related proceedings, although this indemnity is generally limited to two-thirds of the loss incurred. Messer Griesheim has received a notice from NLP, a South American agent/service provider for Merger & Acquisitions, alleging that Messer Griesheim has yet not paid a fee for the procurement of potential investors for two subsidiaries of Messer Griesheim. In 2001, the Group’s subsidiary PT Aneka in Indonesia entered into an agreement for the purchase of machinery and equipment. In November 2001, the agreement partner filed suit against the subsidiary due to the alleged unlawful termination of the contract by PT Aneka. The claim, mainly for damages for lost opportunities and potential earnings, is for an amount of US$1.5 million (see Note 38 “Subsequent events”). While there can be no assurance as to the ultimate outcome of these matters due to the uncertainties involved in matters of litigation, management believes that the outcome of all pending legal proceedings, either individually or in the aggregate, will not have a material effect on the Company's consolidated financial position, results of operations, or cash flows. 36. Related parties Hoechst Prior to the acquisition transactions on April 30, 2001, Hoechst was the majority stockholder of Messer Griesheim. Messer Griesheim has entered into certain transactions relating to sale and service contracts with companies within the Hoechst group which are not material. The transactions are settled at terms substantially equivalent to similar transactions negotiated on an arm's length basis. Related party transactions with respect to the Group`s Singapore operations have been described in note 18 “Equity method investments”. Hoechst has indemnified the Group resulting in a payment of 9.4 million for bank guarantees provided to Bombay Oxygen, which has been reflected as an advance towards capital contribution at April 30, 2001 and as equity at December 31, 2002 and December 31, 2001, respectively.

Page 51 of 66
Allianz As a result of the acquisition transactions ACP, directly or indirectly, owns or controls 33.08% of Messer Griesheim Group GmbH & Co. KGaA at December 31, 2002. ACP is a 20% shareholder in Mahler Italfilo Holding GmbH, which is currently in liquidation. During April 2001, Mahler Italfilo Holding GmbH acquired the shares of Mahler AGS GmbH and Italfilo Engineering S.r.l. from Messer Griesheim prior the consummation of the acquisition transactions. ACP provided certain financial advisory services to the Company and Messer Griesheim, for which it has been paid in aggregate approximately €3.0 million in advisory fees by Messer Griesheim during the eight month period ended December 31, 2001. No transactions between the Group and ACP took place during the twelve months ended December 31, 2002. Goldman Sachs As a result of the acquisition transactions six private equity funds managed by affiliates of The Goldman Sachs Group, Inc. hold 33.08% of Messer Griesheim Group GmbH & Co. KGaA. Goldman Sachs International also is an affiliate of The Goldman Sachs Group, Inc. Goldman Sachs and its affiliates, in the ordinary course of business, engage in commercial banking, investment banking and financial advisory transactions with Messer Griesheim Group GmbH & Co. KGaA and the Group. Goldman Sachs Group, Inc., Goldman Sachs International and their affiliates have provided merger and acquisition advisory services in connection with the acquisition transactions of the Group, and have received no related advisory fees for these services. Goldman Sachs International was a lender under the mezzanine facility of Messer Griesheim. Goldman Sachs International also is a lender under the senior facilities program of Messer Griesheim. Goldman Sachs International received €20.4 million in financing/syndication fees in connection with these transactions for the eight months ended December 31, 2001 and €0 million for the twelve months ended December 31, 2002. Goldman Sachs International and its affiliates were the underwriters of the original Senior Notes and the lead arrangers of the senior and mezzanine facilities of Messer Griesheim. In connection with these activities, approximately €14.4 million were paid during the eight months period ended December 31, 2001 and €0 million for the twelve months ended December 31, 2002.
Goldman Sachs was our agent in repurchasing the Senior Notes during the twelve months ended December 31, 2002 and received fees for this service of €0.6 million.
The Group enters into derivative contracts to hedge their exposure to changes in interest rates and foreign currency. Affiliates of the Goldman Sachs Group act as a counterparty to certain interest rate swap contracts and forward exchange contracts, which have a notional amount of €511.2 million and €0.9 million at December 31, 2002 and €622.6 million and €4.2 million at December 31, 2001. In addition on June 24, 2002 the Group entered into €386.0 million notional forward interest rate swaps with the same counterparty, which will partly replace the existing swaps when they expire in 2004. The company made termination payments of €0.9 million, €0 million and €0 million to Goldman Sachs for the twelve months ended December 31, 2002, the eight months ended December 31, 2001 and the four months ended April 30, 2001, respectively.
Goldman Sachs International and its affiliates are involved with providing investment banking services in connection with the Group's divestiture program, and are entitled to receive fees based upon a percentage of debt relief to the Group achieved by completed divestitures on which it has advised the Company. Fees paid or payable to Goldman

Page 52 of 66
Sachs International in connection with this arrangement, based on completed divestitures under the program, aggregated €7.5 million, €5.4 million and €0 million for the twelve months ended December 31, 2002, the eight months ended December 31, 2001 and the four months ended April 30, 2001, respectively.
An affiliate of Goldman Sachs Group, Inc. is a 20% shareholder in Mahler Italfilo Holding GmbH, which is currently in liquidation. On April 1, 2001, Mahler Italfilo Holding GmbH acquired the shares of Mahler AGS GmbH and Italfilo Engineering S.r.l. from the Messer Griesheim prior to the consummation of the acquisition transactions. Messer Industrie GmbH ("MIG") Prior to the acquisition transactions in April 30, 2001 MIG was the minority shareholder of Messer Griesheim GmbH. As a result of the acquisition transactions MIG holds 32.11% of Messer Griesheim Group GmbH & Co. KGaA. MIG owns through its 100% affiliate Bandinelli GmbH 22% of Mahler Italfilo Holding GmbH (currently in liquidation), which acquired two subsidiaries of the Group (Mahler AGS GmbH and Italfilo Engineering S.r.l) in April 2001. Bandinelli GmbH is also an 11% shareholder in Messer Singapore Holding GmbH, the transactions of which are explained in Note 18 “Equity method investments”. Other Related party transactions with respect to the sale of operating companies in Cuba are discussed in Note 5 “Divestment of Cuban subsidiaries”. See also “Loans to related parties” below. Loans to and from related parties As of December 31, 2002 and 2001, loans to related parties primarily relate to a non-interest bearing note due from an equity method investment in Malaysia of approximately €5.1 million and €5.1 million, respectively. In October 2002 Messer Griesheim has received a loan from its shareholder Messer Griesheim Group amounting to €33.0 million. During October 18, 2002 to December 31, 2002 the interest expense amounted to €335. The loan bears a fixed interest rate of 5.0% per annum and has a maturity of five years. Interest is payable on the loan at such time as the principal amount is due and payable. The principal amount is due on the earlier of the maturity of the loan or the date following three months after either Messer Griesheim or Messer Griesheim Group declares the termination of the loan. Shareholders' Agreement MIG, ACP and the GS Funds have entered into a shareholders' agreement. The shareholders' agreement provides, among other things, for the corporate governance of the Group and Messer Griesheim Group GmbH & Co. KGaA, including the right to appoint board members and other voting rights. The shareholders’ agreement generally allocates rights and obligations concerning matters between MIG, on the one hand, and ACP and the GS Funds, on the other hand, considered collectively, as the financial sponsors. The shareholders' agreement provides that all important decisions regarding Messer Griesheim's management, in particular decisions on divestitures and capital expenditures are to be taken by Messer Griesheim Group GmbH & Co. KGaA and in certain cases requires 75% of shareholder approval. This includes divestitures in Europe, with the exception of the United Kingdom. With respect to a sale of Messer Griesheim, a 75% approval will be required until September 30, 2004, thereafter only a majority approval is required. The shareholders' agreement also contains share transfer restrictions, including rights of first offer, rights to participate in sales by other shareholders and provisions regarding change of control. Additionally, the shareholders’ agreement grants MIG a call option between April and September 2004 for all shares held by the financial sponsors, subject to certain significant conditions and requirements. After September 2004, a shareholder may freely transfer its shares if they have first been offered to the other shareholder.

Page 53 of 66
Due to certain antitrust considerations relating to ACP's equity interest in a competitor of Messer Griesheim, ACP and the GS Funds entered into a separate agreement. The agreement generally allocates the rights of ACP relating to the corporate governance and management of the Group to the GS Funds, until such time the antitrust related considerations are no longer relevant. Accordingly, until then, the members of the shareholders' committee appointed by the GS Funds will represent all votes of the ACP and the GS Funds, which as of December 31, 2002 constitute 66.16% of all votes in the shareholders' committee. The agreement also limits ACP and the GS Fund's ability to sell their shares in Messer Griesheim Group GmbH & Co. KGaA independently of each other. 37. Stock purchase and option plan During November 2001, the shareholders of Messer Griesheim Group GmbH & Co. KGaA approved a stock compensation plan for the benefit of key managers of the Group. The plan allows these employees to purchase shares of Messer Griesheim Group GmbH & Co. KGaA (original option). The shareholders of Messer Griesheim Group GmbH & Co. KGaA have agreed among each other that the maximum number of shares to be acquired by the managers under the stock purchase and option plan shall be limited to 6.5% of the then-outstanding stock of Messer Griesheim Group GmbH & Co. KGaA. The options to acquire shares have been priced at €74.25, the fair market value at the date of the change in control under the acquisition transactions (April 30, 2001). Upon exercise of the original options and for each share purchased, the participants receive conditionally exercisable, non transferable options to acquire three new shares in Messer Griesheim Group GmbH & Co. KGaA at the same price of €74.25. The conditionally exercisable options become exercisable no earlier than two years after the date of grant, and only upon the attainment of certain operating performance and investment yield targets, but in any case not before an exit event. All shares offered under this plan are subject to certain put and call provisions upon the occurrence of certain events. In November 2001, 176,563 original options were granted. Subsequent to December 31, 2001, 156 participants had purchased a total of 148,861 shares and were granted 446,583 conditionally exercisable options. None of these options were exercised, forfeited or expired as of and for the twelve months ended December 31, 2002 and the eight months ended December 31, 2001, respectively. During the second quarter 2002, a substantially similar stock purchase and option plan was approved for certain members of the shareholders’ committee of the general partner of Messer Griesheim Group GmbH & Co. KGaA (the Messer Griesheim Group), Messer Griesheim Beteiligungsverwaltungs GmbH. The participating members were offered to acquire the shares in Messer Griesheim Group for a purchase price of €74.25, which was the fair market value at the date of the change in control under the acquisition transactions (April 30, 2001). In addition to the shares acquired by them from the shareholders of Messer Griesheim Group, Messer Griesheim Group has issued to the participants conditionally exercisable, non transferable convertible bonds for a purchase price of €1 each, convertible into one or more shares of Messer Griesheim Group for an additional payment of €73.25 for each share. The conversion rights become exercisable only upon the attainment of certain operating performance and investment yield targets and the number of years the participants have served as members of the shareholders’ committee, but in any case not before an exit event. All shares offered under this plan are subject to certain put and call provisions upon the occurrence of certain events. Subsequent to March 31, 2002, six participants had purchased a total of 24,612 shares and 38,112 conditionally exercisable, non transferable convertible bonds were issued for a purchase price of €1 each. None of these convertible bonds were exercised, forfeited or expired as of and for the twelve months ended December 31, 2002 The Company’s stock purchase and option plans for management and the Board are accounted for as provided by APB Opinion No. 25. No compensation cost has been recognized in connection with the granting of original options and convertible bonds for the twelve months ended December 31, 2002, or the eight months ended December 31, 2001, respectively, as the purchase price the participants were required to pay was equivalent to the fair value of the shares of the Company with like features on the date of grant. With respect to the contingently exercisable options and convertible bonds, compensation cost will be measured and recognized immediately upon the occurrence of the contingent exit event.

Page 54 of 66
As an alternative to accounting for stock based compensation under APB No. 25, SFAS No. 123, “Accounting for Stock Based Compensation”, as amended by SFAS’ 148 “Accounting for Stock Based compensation – Transition and Disclosures” establishes a fair value method of accounting for stock purchase and option plan or similar equity instruments. Had compensation cost for these plans been determined in accordance with SFAS No. 123 as amended by SFAS 148, the Company’s net earnings would not have been affected. Therefore, a pro forma table is not presented. 38. Subsequent events During January 2003, the Company completed the sale of its activities in Indonesia to PT Tira Austenite Tbk. In connection with this divestiture the mainly claim for damages for lost opportunities and potential earnings was settled (see Note 35 “Litigations”). The impact of this transaction on the consolidated statements of operations is not significant. In January 2003, Messer Griesheim has received a claim for alleged breach of contract concerning the sale of Messer Medical GmbH, claiming about €4.1 million. Management is in the process of investigating the matter. Based on the advice of its counsel, management is in the opinion that the allegations have no merit. In February 2003, the Group successfully finalized and filed amendments to the senior facilities agreement. These amendments provide the Group with more favourable terms with respect to its required level of interest hedging, access to an ancillary facility of €50 million for overdrafts, an increase in its ability to incur debt in the form of local facilities and a decrease in its ability to incur debt in the form of capital lease. As a result of these amendments to the senior facilities agreement, the Group is no longer permitted to repurchase senior notes in the future. 39. Restricted Assets of Subsidiaries As discussed in Note 1 “Background and basis of presentation”, Messer Griesheim Holding AG was a dormant company until the acquisition transactions, at which time it was established as a holding company. Messer Griesheim Holding AG has issued debentures, which have been exchanged for senior notes in the capital markets. Since Messer Griesheim Holding AG has limited sources to generate funds necessary to repay the notes, it must look to the inter-company loan to its subsidiary, Messer Griesheim GmbH to assist it in meeting its principal and interest obligations. In the event that operations of Messer Griesheim GmbH are not sufficiently profitable to generate sufficient funds to meet its principal and interest obligations on the inter-company loan, additional capital contributions by its shareholders may be necessary to avoid an event of default. Certain of Messer Griesheim GmbH's debt agreements contain restrictive covenants which restrict, among other things, Messer Griesheim GmbH from declaring or paying dividends, repurchasing any of its capital stock, or making cash advances or guarantees of obligations of affiliates. The condensed financial information of Messer Griesheim Holding AG (on a parent-only basis under IFRS) as of December 31, 2002 and 2001 and for the twelve months ended December 31, 2002 and the eight months ended December 31, 2001 is as follows:

Page 55 of 66
December 31,
2002 December 31,
2001 Condensed Balance Sheet: Investments in subsidiaries ................................................................................................................................ 735,492 903,428 Loans to subsidiaries........................................................................................................................................... 550,000 550,000 Other assets .......................................................................................................................................................... 4,782 6,706 Total assets.......................................................................................................................................................... 1,290,274 1,460,134 Senior notes, long term....................................................................................................................................... 550,000
550,000
Other liabilities, short term................................................................................................................................. 4,787 6,745 Total liabilities ................................................................................................................................................... 554,787 556,745 Capital subscribed ............................................................................................................................................... 90
90
Additional paid-in capital................................................................................................................................... 967,090 967,090 Cumulative translation adjustment.................................................................................................................... (55,348) 14,939 Hedging reserve................................................................................................................................................... (16,943) (9,199) Accumulated deficit ............................................................................................................................................ (159,402) (69,531) Stockholders’ equity ......................................................................................................................................... 735,487 903,389
Total liabilities and stockholders’ equity ..................................................................................................... 1,290,274 1,460,134
Twelve months ended
December 31, 2002
Eight months ended
December 31, 2001
Condensed results of operations: Equity in earnings /(losses) of investments in subsidiaries........................................................................... (89,905) (69,448) Interest income................................................................................................................................................... 57,064 35,679 Interest expense.................................................................................................................................................. (57,062) (35,679) Other expenses, net............................................................................................................................................ 32 (83) Net loss................................................................................................................................................................ (89,871) (69,531) Cash inflows (outflows) from:
Operating activities: Interest received on inter-company loan...................................................................................................... 57,064 35,679 Interest paid on Senior Notes ........................................................................................................................ (57,062) (35,679) Other ................................................................................................................................................................ 149 52 Net cash flows from operating activities......................................................................................................... 151 52 Investing activities: Inter-company loan to subsidiaries............................................................................................................... — (550,000) Financing activities: Issuance of Senior Notes ............................................................................................................................... — 550,000 Net cash flow for the period ............................................................................................................................. 151 52 Cash balance at beginning of reporting period............................................................................................... 52 — Cash balance at ending of reporting period .................................................................................................... 203 52
In 2002 and 2001 Messer Griesheim Holding AG received no cash dividends.

Page 56 of 66
40. Reconciliation to U.S. GAAP The Group's consolidated financial statements have been prepared in accordance with IFRS, which differs in certain significant respects from accounting principles generally accepted in the United States of America (“U.S. GAAP”). The differences that have a significant impact on net loss and stockholders' equity of the Group are set out below: Reconciliation of net loss to U.S. GAAP for the twelve months ended December 31, 2002, the eight months ended December 31, 2001, the four months ended April 30, 2001, and the twelve months ended December 31, 2000, respectively:
Successor Predecessor
Note
Twelve months ended
December 31, 2002
Eight months ended
December 31, 2001
Four months ended
April 30, 2001
Twelve monthsended
December 31, 2000
Net loss as reported in the consolidated statements of operations under IAS...................................................... (89,871) (69,531) (13,498) (205,565)
U.S. GAAP adjustments: Amortization expense ........................................................ a,b,c,d,e 28,697 (2,864) — — Assets to be sold ................................................................. b 630 5,472 — — Restructuring costs ............................................................. c (640) — — — Property, plant and equipment .......................................... f — — (74) 27,405 Provisions for pensions and similar obligations.............. g 1,349 (547) 176 542 Financial instruments ......................................................... h — — — (2,495) Equity method investments expenses, net i 19,846 — — — Tax effect of U.S. GAAP adjustments............................. j (280) 915 (41) 334 Net loss under U.S. GAAP before cumulative effect
of change in accounting principle ................................. (40,269) (66,555) (13,437) (179,779) Cumulative effect of change in accounting principle
(net of taxes €0)............................................................... a, i (27,559) ___— ___— ___— Net loss under U.S. GAAP................................................ (67,828) (66,555) (13,437) (179,779)
Reconciliation of stockholders' equity to U.S. GAAP as of December 31, 2002 and 2001, respectively:
Note December 31,
2002 December 31,
2001 Stockholders' equity as reported in the consolidated balance sheets under IAS 735,487 903,389 U.S. GAAP adjustments: Amortization expense ....................................................................................... a,b,c,d,e 25,833 (2,864) Cumulative effect of change in accounting principle.................................... a, i (27,559) — Assets to be sold ................................................................................................ b 6,102 5,472 Restructuring costs ............................................................................................ c (640) — Transaction costs............................................................................................... d 33,200 33,200 Provisions for pensions and similar obligations ............................................ g (10,917) (547) Equity method investments expenses…………………………………..... i 19,846 — Tax effect of U.S. GAAP adjustments............................................................ j 4,280 915 Cumulative translation adjustment .................................................................. k (1,220) ___— _______ Stockholders' equity under U.S. GAAP............................................................. 784,412 939,565

Page 57 of 66
a. Goodwill and Other Intangible Assets
The Group was required to adopt SFAS 142 "Goodwill and Other Intangible Assets" in its entirety on January 1, 2002. SFAS 142 requires that goodwill and intangible assets with indefinite useful lives no longer be amortized, but instead tested for impairment annually (or more frequently if impairment indicators arise) in accordance with the provisions of SFAS 142. Under IFRS, goodwill and intangible assets continue to be amortized on a systematic basis over their estimated useful lives not to exceed twenty years. This difference in accounting treatment results in a decrease in amortization expense under U.S. GAAP of €28,697 during the twelve months ended December 31, 2002. See “New U.S. accounting pronouncements” below for further discussion of the impact of the implementation of this new standard.
In the fourth quarter 2002 the Group finalized the second step of the impairment test and changed the method of
evaluating goodwill from the recoverability test based upon undiscounted cash flow to a fair value approach. Accordingly, the Group’s previously recognized goodwill was tested for impairment based on the fair value of the reporting units using a discounted cash flow analysis. As a result of this analysis, the Company concluded that goodwill was impaired and recorded an impairment charge for the additional goodwill under U.S. GAAP in the amount of €6,802 and €911 for reporting units in North America and Eastern Europe, respectively. This impairment charge is recorded as a cumulative effect of change in accounting principle (transition adjustment resulting from adoption of SFAS 142).
The transitional disclosure provisions of SFAS 142 require disclosures of what reported income before
extraordinary items and net income would have been in all periods presented exclusive of amortization expense (including any related tax effects) recognized in those periods related to goodwill, intangible assets that are no longer being amortized, any deferred credit related to an excess over cost, equity method goodwill, and changes in amortization periods for intangible assets that will continue to be amortized (including any related tax effects). The amortization expense and adjusted net loss of Messer Griesheim Holding AG for the periods prior to the period of initial application are as follows: Successor Messer
Griesheim Holding AG
Predecessor Messer Griesheim GmbH
Eight months ended
December 31, 2001
Four months ended
April 30, 2001
Twelve months Ended
December 31, 2000
Twelve months ended
December 31, 1999
Twelve months ended
December 31, 1998
Twelve months ended
December 31, 1997
Reported net loss in accordance with U.S. GAAP………………………….
(66,555)
(13,437) (179,779)
(21,346) N/A N/A
Add back: Goodwill amortization……... 22,348 5,978 9,322 8,181 N/A N/A Adjusted net loss in accordance with
U.S.GAAP……………………………
(44,207)
(7,459) (170,457)
(13,165) N/A N/A Such goodwill and other intangible assets were pushed down to the individual reporting units upon adoption of SFAS 142 at January 1, 2002. The Group has decided to test for goodwill impairment in accordance with SFAS 142 on January 1 of each fiscal year. b. Divestiture of subsidiaries EITF Issue No. 87-11 "Allocation of Purchase Price to Assets to Be Sold" addresses issues relating to the allocation of the purchase price in a purchase business combination when the acquiring enterprise intends to sell certain operations of the acquired enterprise within one year of the date of the business combination. This EITF provides that the (i) estimated cash flows from the date of acquisition until the date of sale, (ii) estimated interest on incremental debt
Page 58 of 66
incurred during the holding period to finance the purchase of these subsidiaries and (iii) expected sales price less costs to sell should usually not affect earnings or losses reported in the acquiring enterprise's consolidated statement of operations for acquired operations that are expected to be sold within one year of the date of the business combination. Instead, these amounts should be considered in the purchase price allocation associated with the business combination. IFRS does not allow a similar treatment in regards to the (i) estimated cash flows from the date of acquisition until the date of sale, or (ii) estimated interest on incremental debt incurred during the holding period to finance the purchase of these operations.
For the twelve months ended December 31, 2002 and the eight months ended December 31, 2001 under U.S. GAAP these differences result in a reduction to net loss of €630 and €5,472 respectively. No deferred taxes have been recorded on these divestitures because under German tax law, the sale of subsidiaries is a non taxable transaction. Subsequent to April 30, 2002, the Company has started to apply to EITF 90-6 “Accounting for Certain Events Not Addressed in Issue No. 87-11 Relating to an Acquired Operating Unit to be Sold” for the subsidiaries which were not sold during twelve months following the beginning of the divestiture program. From that point forward results of operations and incremental interest expense incurred in financing the purchase of those entities are reported in the operations of the Group under U.S. GAAP.
The impact to the statement of operations of the goodwill difference, utilizing an estimated useful life of 20 years
for the amortization of basis difference, was €568 for the eight months ended December 31, 2001, which is reflected as a difference in the reconciliation of stockholders' equity to U.S. GAAP as of both December 31, 2002 and December 31, 2001. In accordance with SFAS 142, goodwill and intangible assets with indefinite useful lives are no longer amortized, but instead tested for impairment annually (or more frequently if impairment indicators arise) in accordance with the provisions of SFAS 142. See “New U.S. accounting pronouncements” below for further discussion of the impact of the implementation of this new standard.
During the twelve months ended December 31, 2002 acquisition goodwill was adjusted by €10,943 to €6,102 to
reflect the difference between estimated and released cash flow from the date of acquisition, estimated interest on incremental debt during the holding period to finance the purchase, for those subsidiaries sold until April 30, 2002. c. Restructuring costs
In accordance with IAS 37, a provision for restructuring charges is recognized when a detailed formal plan for the restructuring has been developed and the company has raised a valid expectation in those affected that it will carry out the restructuring by starting to implement that plan or announcing its main features to those affected. U.S. GAAP (see “New U.S. accounting pronouncements” below for a discussion regarding the initial application of SFAS 146) applies similar criteria to determine when a provision for restructuring charges should be established. However, under U.S. GAAP, a rebuttable presumption exists that an exit plan should be completed and all exit costs and involuntary employee termination costs should be incurred within one year from the commitment date. No similar provisions exist under IFRS. This difference in accounting treatment results in a €640 and €0 increase to net loss during the twelve months ended December 31, 2002 and the eight months ended December 31, 2001, respectively.
Based on the difference in provisions, an adjustment to decrease acquisition goodwill totaling €7,147 was
recorded under U.S. GAAP. This adjustment is primarily related to involuntary employee termination costs recorded in association with the acquisition transactions not expected to be incurred within one year from the commitment date. The impact to the statement of operations of this difference, utilizing an estimated useful life of 20 years for the amortization of basis difference, was a decrease to goodwill amortization of €238 for the eight months ended December 31, 2001, which is reflected as a difference in the reconciliation of stockholders' equity to U.S. GAAP as of both December 31, 2002 and December 31, 2001. In accordance with SFAS 142, goodwill and intangible assets with indefinite useful lives are no longer amortized, but instead tested for impairment annually (or more frequently if impairment indicators arise) in accordance with the provisions of SFAS 142. See “New U.S. accounting pronouncements” below for further discussion of the impact of the implementation of this new standard.

Page 59 of 66
d. Transaction costs
Transaction costs totaling €33,200 were incurred by Messer Griesheim Group GmbH & Co. KGaA in connection with the acquisition transactions described in Note 3 “Acquisition transactions”. Under IFRS, these transaction costs would not be treated as part of the purchase consideration. However, under U.S. GAAP, these costs are required to be considered as part of the purchase price allocation in the application of "push-down" accounting to the acquisition transactions. This difference in accounting treatment results in an increase to acquisition goodwill and equity of €33,200 as of the acquisition date and an increase to goodwill amortization of €1,107 during the eight months ended December 31, 2001 under U.S. GAAP, which is reflected as a difference in the reconciliation of stockholders' equity to U.S. GAAP as of both December 31, 2002 and December 31, 2001. In accordance with SFAS 142, goodwill and intangible assets with indefinite useful lives are no longer amortized, but instead tested for impairment annually (or more frequently if impairment indicators arise) in accordance with the provisions of SFAS 142. See “New U.S. accounting pronouncements” below for further discussion of the impact of the implementation of this new standard. e. Assembled workforce
APB Opinion No. 17 “Intangible Assets” (“APB 17”) requires that the cost of identifiable intangible assets be separated from goodwill and assigned part of the total cost of assets acquired in a business combination. In accordance with APB 17, the Group recorded an intangible asset under U.S. GAAP totaling €15,657 associated with the Group’s assembled workforce as of the date of the acquisition transactions described in Note 3 “Acquisition transactions”. This asset was amortized over an estimated useful life of 6 years through December 31, 2001. Additionally, SFAS 109 “Accounting for Income Taxes” requires that deferred taxes be recognized for differences between the financial statement carrying amount and the tax basis of all identifiable intangible assets, excluding goodwill. Accordingly, the Group established a deferred tax liability of €6,263 associated with the Group’s assembled workforce as of the date of the acquisition transactions, which resulted in a corresponding increase in acquisition goodwill under U.S. GAAP. IAS 38 states that an enterprise typically has insufficient control over the expected future economic benefits arising from a team of skilled staff and from training to consider that these items meet the definition of an intangible asset. Accordingly, the cost of acquiring the Group’s assembled workforce forms part of the acquisition goodwill under IFRS and is being amortized over an estimated useful life of 20 years. Under U.S. GAAP, these differences in accounting treatment resulted in an increase in intangible assets of €15,657 and a decrease in goodwill of €9,394 as of the acquisition date, as well as an increase in amortization expense of €1,427 for the eight months ended December 31, 2001, which is reflected as a difference in the reconciliation of stockholders' equity to U.S. GAAP as of both December 31, 2002 and December 31, 2001.
The Group was required to adopt SFAS 141 "Business Combinations" effective July 1, 2001, and SFAS 142 in its entirety on January 1, 2002. SFAS 141 states explicitly that an assembled workforce is not an identifiable intangible asset apart from goodwill if acquired in a purchase business combination. Additionally, at the date of adoption of SFAS 142, amortization has ceased for goodwill and intangible assets determined to have indefinite lives. Any intangible assets acquired in a business combination completed before July 1, 2001 that do not meet the criteria for separate recognition in Statement 141 must be subsumed into goodwill (e.g., assembled workforce). Accordingly, effective January 1, 2002, the Group was required to reallocate as additional goodwill the unamortized assembled workforce balance of €13,917 recorded by the Group under prior U.S. GAAP standards in effect prior to the adoption of SFAS 141 and SFAS 142. See “New U.S. accounting pronouncements” below for further discussion of the impact of the implementation of this new standard. f. Property, plant and equipment
In accordance with IAS 23, foreign currency gains and losses on borrowing costs directly attributable to construction can be capitalized. Such costs are not capitalizable under U.S. GAAP. An additional €47 of depreciation expense would have been recognized under U.S. GAAP during the four months ended April 30, 2001 as a result of not capitalizing such foreign currency gains in prior years.

Page 60 of 66
Additionally, under IFRS, impairments must be reversed in certain situations, while under U.S. GAAP impairments on assets to be held for use may not be reversed. During the four months ended April 30, 2001, the Group reversed impairment charges under IFRS of €27 which are not reversed under U.S. GAAP. g. Provisions for pensions and similar obligations
The Group's net obligation in respect of defined benefit pension plans and similar obligations is calculated using the projected unit credit method under IAS 19, which is the same valuation method required under U.S. GAAP. In reconciling its defined benefit pension plans and similar obligations from IFRS to U.S. GAAP, the Company has applied SFAS 87 "Employer's Accounting for Pensions" effective January 1, 1999, as it was not feasible to apply it as of January 1, 1987, the date specified in the standard. The principal actuarial assumptions used by the Company's actuaries in determining pension provisions and related costs under SFAS 87 are the same as those utilized in applying IAS 19. In applying the late adoption rules under SFAS 87, pension provisions and related costs differ from those calculated under IAS 19, as the amortization components for the transitional liabilities differ in certain respects. Further, under U.S. GAAP, when the accumulated benefit obligation (“ABO”) exceeds the fair value of the plan assets and the already recognized liability for unfunded accrued pension costs, the excess is immediately recognized as an additional minimum liability. The cost of this is capitalized as an intangible asset up to the amount of any unrecognized net transition obligation, plus the unrecognized prior service costs, and the remainder is charged through other comprehensive income. IAS 19 has no similar requirements equivalent to U.S. GAAP in such circumstances. These differences result in a decrease in net periodic pension cost of €38 for the twelve months ended December 31, 2002 and a decrease in net periodic pension costs and other comprehensive income totaling €95 and €709, respectively, for the four months ended April 30, 2001 and an increase (decrease) in net periodic pension cost and other comprehensive loss totaling €(257) and €2,068, respectively, for the twelve months ended December 31,2000. As of May 1, 2001, all previously existing unrecognized net actuarial gains or losses, prior service costs and transition obligations or assets related to the Group's pension plans have been eliminated as a result of the allocation of the purchase price in the acquisition transactions (see Note 3 “Acquisition transactions”).
At December 31, 2002 the fair value of certain foreign defined benefit plan assets was less than the accumulated
benefit obligation, a situation that requires special treatment under SFAS 87. When the accumulated benefit obligation exceeds the fair value of the plan assets and the already recognized liability for unfunded accrued pension costs, the excess is immediately recognized as an additional minimum liability. If an additional minimum liability is recognized, SFAS 87 also prescribes that an amount shall be recognized as an intangible asset of no more than the unrecognized prior service cost. The difference between the minimum liability and the intangible asset is then a charge to other comprehensive income. No similar provision exists under IFRS. These differences in accounting treatment result in a decrease in other comprehensive income totaling €8,074, for the twelve months ended December 31, 2002.
Under IFRS, the Group has established accruals for an estimated number of employees that are expected to elect participation in a voluntary early retirement program. Under U.S. GAAP, such accruals are only established when the employee has entered into a binding contractual agreement (see “New U.S. accounting pronouncements” below for a discussion regarding the initial application of SFAS 146). In addition, the Group accrues certain amounts related to the early retirement program as a termination benefit that is recognized when the plan is adopted under IFRS. Under U.S. GAAP, such amounts are accrued over the employees' remaining service period. These differences result in a reduction/(increase) in expense of €1,311, €(547), €81 and €(285) for the twelve months ended December 31, 2002, the eight months ended December 31, 2001, the four months ended April 30, 2001 and the twelve months ended December 31, 2000, respectively. h. Financial instruments In accordance with IFRS effective prior to January 1, 2001, the Group recognized losses from changes in fair values of currency and interest rate derivatives, however, the Group did not recognize income from gains related to such instruments. In comparison, U.S. GAAP during such period required the recognition of both gains and losses from changes

Page 61 of 66
in fair value unless certain hedging criteria were met. This adjustment reflects the recognition loss of €2,495 in 2000 related to currency and interest rate derivatives. i. Equity method investments expense, net
On January 1, 2002, Constar adopted SFAS No. 142, and completed the required goodwill impairment test, which resulted in an impairment charge of approximately €19,846, which has been recorded as a component of Constar’s €20.7 million loss for the year ended December 31, 2002. In accordance with the provisions of SFAS 142 and APB 18 “The Equity Method of Accounting for Investments in Common Stock”, the Group’s share of Constar’s goodwill impairment charge has been recorded in the Group’s consolidated statement of operations as cumulative effect of change in accounting principle as of January 1, 2002. The difference between the impairment amount of €19,846 under U.S. GAAP and the impairment amount under IAS of €18,657 is due to the additional amortization of goodwill under IAS from January to October 2002, which has been recorded in proportionate share of investees’ income (losses) under IAS (see Note 18 “Equity method investments”). j. Tax effect of U.S. GAAP adjustments
This reconciliation item includes all tax effects due to the aforementioned reconciling items. k. Cumulative translation adjustment Upon the adoption of SFAS 142 the Group allocated goodwill to the individual reporting units. This reconciliation item represents the net foreign exchange effect of this allocation. Additional U.S. GAAP information Acquisition transactions As a result of the acquisition transactions (see Note 3 “Acquisition transactions”), Messer Griesheim has become a wholly-owned subsidiary of Messer Griesheim Holding AG, which in turn was 100% acquired by Messer Griesheim Group GmbH & Co. KGaA in a purchase transaction. The series of transactions requires "push-down" of the Messer Griesheim Group GmbH & Co. KGaA's basis under U.S. GAAP in accordance with EITF Topic D-97 "Push-Down Accounting", and SAB No. 54 " "Pushdown" Basis of Accounting in Financial Statements of Subsidiaries Acquired by Purchase". The "pushdown" of basis under U.S. GAAP differs from the allocation of cost to the net assets acquired under IFRS. The U.S. GAAP reconciliation of net loss for the twelve months ended December 31, 2002, the eight months ended December 31, 2001 and stockholders' equity as of December 31, 2002 and 2001 also reflect differences arising from the new bases of accounting under U.S. GAAP and IFRS. The consolidated financial statements reflect the deferred notes payable to Hoechst (see Note 3 “Acquisition transactions”) by the Group's parent, Messer Griesheim Group GmbH & Co. KGaA, as part of equity under IFRS and U.S. GAAP as the Company does not meet any of the criteria enumerated in SAB No. 73, which would require the recognition of such obligation as a liability in the Group consolidated financial statements. Therefore, the interest payable by Messer Griesheim Group GmbH & Co. KGaA relating to these deferred notes is not recorded under IFRS or U.S. GAAP. Statement of operations Certain items in the consolidated statements of operations would be classified differently under U.S. GAAP. These items include the reversal of certain provisions and allowances for doubtful accounts that would generally be recorded in the same line items as the provisions were originally recorded under U.S. GAAP, rather than as other income.

Page 62 of 66
U.S. GAAP requires the operating results of those subsidiaries which are expected to be divested more than one year from the measurement date to continue to be reflected in the consolidated statement of operations. Under IFRS, the Company has exercised the option of disclosing discontinuing operations in the notes to the financial statements (see Note 13 “Divestiture program”). As a result, there is no difference between IFRS and U.S. GAAP in sales, net income and total assets as reflected in the consolidated financial statements with respect to these subsidiaries. Balance sheet Certain items in the consolidated balance sheets would be classified differently under U.S. GAAP, including the net assets of entities included in the divestiture program which are classified as "available for sale" under IFRS and which are no longer presented as “available for sale” under U.S. GAAP. In accordance with IFRS, all deferred tax assets and liabilities are classified as non-current. Under U.S. GAAP, deferred tax assets and liabilities would be classified as current or non-current depending on when the related benefit or expense is expected to be realized. As of December 31, 2002 and December 31, 2001 €22,737 and €6,227, respectively, would be classified as current deferred tax assets and €2,846 and €4,041, respectively, would be classified as current deferred tax liabilities. Additionally, under U.S. GAAP, tax loss carry forwards and other credits that are available to reduce future taxes are recognized as deferred tax assets. Such amounts are reduced by a valuation allowance to the extent that it is deemed more likely than not that the tax benefit related to the utilization of such tax loss carry forwards or credits will not be realized. Under IFRS, a deferred tax asset should be recognized for the carry forwards of unused tax losses and unused tax credits to the extent that it is probable that future taxable profit will be available against which the unused tax losses and unused tax credits can be utilized. Deferred tax assets related to tax loss carry forwards amounted to €27,869 and €130,310, net of valuation allowances of €5,471 and €3,471 as of December 31, 2002 and December 31, 2001, respectively. Cash flow statement The cash flow statement is prepared in accordance with IAS 7. Reporting of comprehensive income SFAS No. 130 "Reporting Comprehensive Income" requires the reporting of comprehensive income, which includes all changes in stockholders' equity except those resulting from investments by or distributions to shareholders. Statement of comprehensive income for the twelve months ended December 2002, the eight months ended December 31, 2001, the four months ended April 30, 2001, and the twelve months ended December 31, 2000, respectively:
Successor Predecessor
Twelve months ended
December 31, 2002
Eight months ended
December 31, 2001
Four months ended
April 30, 2001
Twelve months ended
December 31, 2000
Net loss in accordance with U.S. GAAP.................................................. (67,828) (66,555) (13,437) (179,779) Other comprehensive income (loss), net of tax: Foreign currency translation adjustments ............................................. (71,507) 14,939 3,522 31,091 Change in fair value of derivative financial instruments, net of
deferred taxes of €6,293 and €5,024, respectively............................... (7,744) (9,199) — — Additional minimum pension liability, net of deferred tax €3,645,
€0, €0 and €0, respectively ..................................................................... (8,074) — (709) (2,068) _______ Comprehensive loss, net of tax.................................................................. (155,153) (60,815) (10,624) (150,756)

Page 63 of 66
Hyperinflation In accordance with IFRS, the financial statements of certain subsidiaries of the Messer Group have been restated in accordance with IAS 29. This treatment is different from that which would have been calculated under U.S. GAAP. No difference is included within the reconciliation of U.S. GAAP as foreign private issuers applying IAS 29 are granted relief from such requirement. New U.S. accounting pronouncements In June 1998, the FASB issued SFAS 133 "Accounting for Derivative Instruments and Hedging Activities". SFAS 133 was subsequently amended by SFAS 137 "Deferral of the Effective Date of FASB 133", which allowed entities which had not adopted SFAS 133 to defer its effective date to all fiscal quarters of all fiscal years beginning after June 15, 2000, and SFAS 138 "Accounting for Certain Derivative Instruments and Certain Hedging Activities—an amendment of FASB Statement No. 133" which addresses a limited number of issues causing implementation difficulties for entities that apply SFAS 133. SFAS 133, as amended, establishes accounting and reporting standards for derivative instruments, including derivative instruments embedded in other contracts, and hedging activities. Similar to IAS 39, SFAS 133, as amended, requires the Group to recognize all derivatives in the consolidated balance sheet at fair value. The financial statement recognition of the change in fair value of a derivative depends on a number of factors, including the intended use of the derivative and the extent to which it is effective as part of a hedge transaction. SFAS 133, as amended, was adopted by the Group effective January 1, 2001. Although IAS 39 and SFAS 133, as amended, are similar in many respects, the transition adjustments resulting from the adoption of IAS 39 must be reported in shareholders' equity, whereas the transition adjustments resulting from adoption of SFAS 133, as amended, must be reported in earnings or other comprehensive income, as appropriate. Adoption of SFAS 133 did not have a material impact on the Group's consolidated financial statements. In September 2000, the FASB issued SFAS 140 "Accounting for Transfers and Servicing of Financial Assets and Extinguishments of Liabilities—a replacement of FASB No. 125". This statement revises the standards for accounting for securitizations and other transfers of financial assets and collateral and requires certain financial statement disclosures. SFAS 140 is effective for transactions occurring after March 31, 2001, except for certain disclosure requirements which were effective December 31, 2000. Adoption of this replacement standard did not have a material effect on the Group's consolidated financial statements.
Effective July 1, 2001, the Group adopted Statement 141 "Business Combinations" and certain provisions of SFAS 142 "Goodwill and Other Intangible Assets". The Group adopted SFAS 142 in its entirety on January 1, 2002. SFAS 141 requires that the purchase method of accounting be used for all business combinations initiated after June 30, 2001, as well as all purchase method business combinations completed after June 30, 2001. SFAS 141 also specifies criteria intangible assets acquired in a purchase method business combination must meet to be recognized and reported separately from goodwill, and also indicates that any purchase price allocable to an assembled workforce may not be accounted for separately. Additionally, SFAS 141 required, upon adoption of SFAS 142 in its entirety, that the Group evaluate its existing intangible assets and goodwill that were acquired in a prior purchase business combination, and to make any necessary reclassifications in order to conform with the new criteria in SFAS 141 for recognition apart from goodwill. SFAS 142 requires that goodwill and intangible assets with indefinite useful lives no longer be amortized, but instead be tested for impairment annually (or more frequently if impairment indicators arise) in accordance with the provisions of SFAS 142. Intangible assets with definite useful lives are amortized over their respective estimated useful lives to their estimated residual values, and reviewed for impairment in accordance with SFAS 144 "Accounting for the Impairment or Disposal of Long-Lived Assets".

Page 64 of 66
Goodwill and intangible assets acquired in business combinations completed before July 1, 2001 continued to be amortized through December 31, 2001. As of December 31, 2001, the amount of unamortized goodwill under U.S. GAAP was €598,756. Unamortized assembled workforce totaled €13,917 as of December 31, 2001, was required to be reallocated to goodwill upon adoption of SFAS 141 and SFAS 142. Related deferred tax liabilities of €5,567 were also required to be eliminated through a corresponding reduction under U.S. GAAP. The amount of unamortized goodwill under U.S. GAAP as of December 31, 2002 was €566,744.
As discussed above, upon adoption of SFAS 142, the Group was required to evaluate its existing intangible assets and goodwill that were acquired in a prior purchase combination, and to make any reclassifications in order to conform with the new criteria in SFAS 141 for recognition apart from goodwill. As a consequence, the Group was required to reallocate as additional goodwill the unamortized assembled workforce balance upon adoption of SFAS 142. This evaluation did not result in any other significant reclassifications. Upon adoption of SFAS 142, the Group was also required to reassess the useful lives and residual values of all intangible assets acquired, and make any necessary amortization period adjustments by the end of the first interim period after adoption. This reassessment did not result in any significant amortization period adjustments. In addition, to the extent an intangible asset is identified as having an indefinite useful life, the Group is required to test the intangible asset for impairment in accordance with the provisions of SFAS 142 within the first interim period. Any impairment loss should be measured as of the date of adoption and recognized as the cumulative effect of a change in accounting principle in the first interim period. No impairment loss was recognized as a result of these impairment tests, as the Group did not identify any intangible asset as having an indefinite useful life.
SFAS 142 requires the Group to perform an assessment of whether there is an indication that goodwill and/or equity method goodwill is impaired as of the date of adoption. To accomplish this, the Group identified its reporting units and determined the carrying value of each reporting unit by assigning the assets and liabilities, including the existing goodwill and intangible assets, to those reporting units as of January 1, 2002. By June 30, 2002, the Group determined the fair value of each reporting unit and compared it to the carrying amount of the reporting unit. To the extent the carrying amount of a reporting unit exceeded the fair value of the reporting unit, an indication existed that the reporting unit goodwill may be impaired and the Group then had to perform the second step of the transitional impairment test. In the second step, the Group then, had to compare the implied fair value of the reporting unit goodwill with the carrying amount of the reporting unit goodwill, both of which were measured as of the date of adoption. The implied fair value of goodwill is determined by allocating the fair value of the reporting unit to all of the assets (recognized and unrecognized) and liabilities of the reporting unit in a manner similar to a purchase price allocation, in accordance with SFAS 141. The residual fair value after this allocation is the implied fair value of the reporting unit goodwill. The Group has performed this second step of the impairment test in the fourth quarter 2002 and recognized a transitional impairment loss of €7,713 for the additional goodwill under U.S. GAAP as the cumulative effect of a change in accounting principle in the reconciliation of net loss to U.S. GAAP for the twelve months ended December 31, 2002.
In August 2001, the FASB issued SFAS 143 "Accounting for Asset Retirement Obligations". This Statement addresses financial accounting and reporting for obligations associated with the retirement of tangible long-lived assets and the associated asset retirement costs. SFAS 143 requires an enterprise to record the fair value of an asset retirement obligation as a liability in the period in which it incurs a legal obligation associated with the retirement of a tangible long-lived asset. SFAS 143 also requires the enterprise to increase the carrying amount of the related long-lived asset by the associated asset retirement costs and to depreciate that cost over the remaining useful life of the asset. The liability is changed at the end of each period to reflect the passage of time (i.e., accretion expense) and changes in the estimated future cash flows underlying the initial fair value measurement. Enterprises are required to adopt SFAS 143 for fiscal years beginning after June 15, 2002. The Group has started its analysis of the new pronouncement, but has not yet determined if the adoption of the new pronouncement will have a material effect on its financial statements.
In August 2001, the FASB approved for issuance SFAS 144. This Statement addresses financial accounting and reporting for the impairment or disposal of long-lived assets. This Statement supersedes SFAS 121 and the accounting and reporting provisions of APB Opinion No. 30 "Reporting the Results of Operations—Reporting the Effects of Disposal
Page 65 of 66
of a Segment of a Business, and Extraordinary, Unusual and Infrequently Occurring Events and Transactions", for the disposal of a segment of a business (as previously defined in that Opinion). This Statement also amends ARB No. 51 "Consolidated Financial Statements" to eliminate the exception to consolidation for a subsidiary for which control is likely to be temporary. The Group adopted the provisions of this Statement on January 1, 2002. The adoption of the new pronouncement did not have a material effect on the Group’s consolidated financial statements. However, the Group has noted that certain provisions of SFAS 144 will potentially impact its accounting and reporting for the remaining subsidiaries to be sold under its divestiture program. The Group has also noted that the provisions of SFAS 144 supersede certain provisions of EITF 87-11 as they relate to allocation of purchase price in a business combination where the acquirer intends to sell a portion of the operations of the acquired enterprise (see Note 40b) and, as a result, had SFAS 144 been applied in accounting for the acquisition transactions, certain of the differences between U.S. GAAP and IFRS relating to operations and entities included in the divestiture program would not have occurred.
The FASB issued SFAS 145 “Rescission of FASB Statements No. 4, 44, and 64, Amendment of FASB Statement No. 13, and Technical Corrections”, on April 30, 2002. SFAS 145 rescinds SFAS 4, which required all gains and losses from extinguishment of debt to be aggregated and, if material, classified as an extraordinary item, net of related income tax effect. Upon adoption of SFAS 145, the Group is required to apply the criteria in APB Opinion No. 30, in determining the classification of gains and losses resulting from the extinguishment of debt. Additionally, SFAS 145 amends SFAS 13 to require that certain lease modifications that have economic effects similar to sale-leaseback transactions be accounted for in the same manner as sale-leaseback transactions. The rescission of SFAS 4 is effective to fiscal years beginning after May 15, 2002. The provisions of SFAS 145 related to SFAS 13 are effective for transactions occurring after May 15, 2002. The adoption of these provisions had no impact on the Group’s consolidated financial statements.
In July 2002, the FASB issued Statement 146, Accounting for Costs Associated with Exit or Disposal Activities. SFAS 146 replaces previous accounting guidance provided by EITF 94-3, Liability Recognition for Certain Employee Termination Benefits and Other Costs to Exit an Activity (including Certain Costs incurred in a Restructuring), and requires companies to recognize costs associated with exit or disposal activities when they are incurred (subsequent to a commitment to a plan) rather than at the date of a commitment to an exit or disposal plan. Examples of costs covered by the standard include lease termination costs and certain employee severance costs that are associated with a restructuring, discontinued operation, plant closing, or exit or disposal activity. The provisions of SFAS 146 are to be applied prospectively to exit or disposal activities initiated after December 31, 2002. The adoption of SFAS 146 is not expected to have a material impact on the Group’s consolidated financial statements.
In November 2002, the FASB issued Interpretation No. 45, Guarantor’s Accounting and Disclosure
Requirements for Guarantees, Including Indirect Guarantees of Indebtedness of Others (“FIN No. 45”), which addresses the disclosure to be made by a guarantor in its interim and annual financial statements about its obligation under guarantees. FIN No. 45 also requires the recognition of a liability by a guarantor at the inception of certain guaranties entered into or modified subsequent to adoption. FIN No. 45 requires the guarantor to recognize a liability for the non-contingent component of the guarantee, this is the obligation to stand ready to perform in the event that specified triggering events or conditions occur. The initial measurement of this liability is the fair value of the guarantee at inception. The recognition of the liability is required even if it is not probable that payment will be required under the guarantee or if the guarantee was issued with a premium payment or as part of a transaction with multiple elements. The Group has adopted the disclosure requirements (see Note 33 “Commitments and contingencies”) and will apply the recognition and measurement provisions for all guarantees entered into or modified after December 31, 2002.
In November 2002, the Emerging Issue Task Force („EITF“) reached a final consensus on EITF 00-21, „Revenue
arrangements with Multiple Deliverables”. EITF 00-21 addresses certain aspects of the accounting of revenue arrangements with multiple deliverables by a vendor. The Issue outlines an approach to determine when a revenue arrangement for multiple deliverables should be divided into separate units of accounting and, if separation is appropriate, how the arrangement consideration should be allocated to the identified accounting units. The consensus reached in the Issue will be effective for the Group in its financial statements beginning July 1, 2003. The Group will apply the consensus prospectively in 2003. The Group is currently determining the impact of the adoption of EITF 00-21 on the

Page 66 of 66
Group’s consolidated financial statements but does not believe that the adoption of the consensus will have a material impact.
In December 2002, the FASB issued Statement No. 148, Accounting for Stock-Based Compensation – Transition
and Disclosure, which amends FASB Statement No. 123, Accounting for Stock-Based Compensation. Statement 148 provides alternative methods of transition for a voluntary change to the fair value based method of accounting for stock-based employee compensation. In addition, Statement 148 amends the disclosure requirements of Statement 123 to improve the clarity and prominence of disclosures about the pro forma effects of using the fair value based method of accounting for stock-based compensation for all companies – regardless of the accounting method used – by requiring that the data be presented more prominently and in a more user-friendly format in the footnotes to the financial statements.
The transition guidance and annual disclosure provisions of Statement 148 are effective for fiscal years ending
after December 15, 2002, with earlier application permitted in certain circumstances. The interim disclosure provisions are effective for financial reports containing financial statements for interim periods beginning after December 15, 2002.
The Group has adopted the disclosure requirements of SFAS 148 as presented in Note 37, “Stock purchase and
option plan”. In January 2003, the FASB issued FIN 46, “Consolidation of Variable Interest Entities – an interpretation of ARB
No. 51”, which clarifies the application of the consolidation rules to certain variable entities. FIN 46 established a new multi-step model for the consolidation of variable interest entities when a company has a controlling financial interest based either on voting interests or variable interests. Consolidation based on variable interests is required by the primary beneficiary if the equity investors lack essential characteristics of a controlling financial interest or if the equity investment at risk is not sufficient for the entity to finance its activities without additional subordinated financial support from other parties. The primary beneficiary of a variable interest entity is the party that absorbs a majority of the entity’s expected losses, receives a majority of its expected residual returns, or both, as a result of holding variable interests. FIN 46 also provides disclosure requirements related to investments in variable interest entities, whether or not those entities are consolidated. For the Group, FIN 46 applies immediately to variable interest entities created after January 31, 2003, and to variable interest entities in which the Group obtains an interest after that date. For variable interest entities created prior to February 1, 2003, the consolidation requirements of FIN 46 will be effective as of July 1, 2003.
The adoption of the disclosure requirements under Interpretation No. 46 did not have consequences on the
Group’s consolidated financial statements. Similarly, the full adoption of Interpretation No. 46 is not expected to have a material impact on the Group’s consolidated financial statements.

www.messer.de
www.messergroup.com