Merrington G., Winder L., Parkinson R. & Redman M. 2002. Agricultural Pollution
258
-
Upload
camilo-lopez-t -
Category
Documents
-
view
18 -
download
1
description
jscsj
Transcript of Merrington G., Winder L., Parkinson R. & Redman M. 2002. Agricultural Pollution


Agricultural Pollution
Spon’s Environmental Science and Engineering Series
This new series covers a wide range of water, waste and contaminated land issues in the context ofcurrent best practice, perception and legislation.
Series coverage is broad. On the water and wastewater side it includes resource management,treatment, distribution and collection, monitoring and regulation. In relation to wastemanagement it extends across the waste hierarchy, covering a range of technical and regulatoryissues in areas such as waste minimisation, separation and sorting, recycling and disposal, and thedetermination of appropriate waste strategy.
The series is targeted at engineers and scientists in the process, waste, and environmental sectors.Titles will also be of interest to economists, lawyers, legislators, regulators, and advancedstudents.
Series EditorJeremy Joseph, JBJ Environment, Hydrogeological and Waste Management Consultant, C/o SponPress, 11 New Fetter Lane, London EC4P 4EE, UK
Topics under consideration for the series include
• Potable/usable water• Waste and polluted waters and sludges• Water control and management issues• Contaminated land• Non-disposal strategies for waste• Waste disposal routes• Wastes from agriculture
The series editor will be pleased to hear from potential authors interested in writing on any topicsrelevant to the series including, but not limited to, the issues cited above. Please contact him at theabove address with an indication of the scope of any proposed volume together with detailsregarding its intended readership.
All volumes are published by Spon Press, part of the Taylor and Francis Group, and are soldthrough our worldwide distribution networks.
Visit us on the web at:www.sponpress.com

Agricultural Pollution
Environmental problems and practical solutions
Graham Merrington, Linton Winder, Robert Parkinson andMark Redman
London and New York
First published 2002by Spon Press
11 New Fetter Lane, London EC4P 4EE
This edition published in the Taylor & Francis e-Library, 2005
“To purchase your own copy of this or any of Taylor & Francis or Routledge’s collection of thousands ofeBooks please go to www.eBookstore.tandf.co.uk.”
Simultaneously published in the USA and Canadaby Spon Press
29 West 35th Street, New York, NY 10001
Spon Press is an imprint of the Taylor & Francis Group
© 2002 Graham Merrington, Linton Winder, Robert Parkinsonand Mark Redman
Publisher’s NoteThis book has been prepared from camera-ready copy supplied
by the authors
All rights reserved. No part of this book may be reprinted or reproduced or utilized in any form or by anyelectronic, mechanical, or other means, now known or hereafter invented, including photocopying and
recording, or in any information storage or retrieval system, without permission in writing from thepublishers.
British Library Cataloguing in Publication DataA catalogue record for this book is available
from the British Library
Library of Congress Cataloging in Publication DataA catalog record for this book has been requested
ISBN 0-203-30202-8 Master e-book ISBN
ISBN 0-203-34177-5 (Adobe eReader Format)ISBN 0-415-27340-4 (hbk)ISBN 0-419-21390-2 (pbk)
.

Contents
List of figures xii
List of tables xiv
Acknowledgements xvi
1 Agriculture and pollution 1
1.1 Setting the scene 1
Defining agricultural pollution 3
1.2 Solving the problem 5
Monitoring impacts 5
Cost—the driver for pollution control 7
2 Nitrates and nitrogen loss 11
2.1 Introduction 11
Nitrogen and agriculture 11
2.2 The nitrogen cycle 13
Atmospheric deposition 13
Biological fixation 14
Fertilisers 15
Animal manures 16
2.3 Nitrogen transformations 16
Nitrogen mineralisation 17
Nitrogen immobilisation 17
Nitrification 18
Adsorption and fixation 18
Nitrogen uptake and losses 18
Nitrate leaching 18

Nitrous oxide and nitric oxide emissions from nitrification and denitrification 20
Ammonia volatilisation 21
2.4 Nitrogen fertiliser use in agriculture 22
2.5 The causes of nitrate pollution 24
2.6 Problems caused by nitrate pollution 27
Nitrate and drinking water quality 27
Eutrophication 28
Nitrates in food 29
2.7 Reducing nitrate losses from agriculture 29
Source management—optimisation of fertiliser N use 32
Cultivation and crop management 33
3 Phosphorus 41
3.1 Introduction 41
Phosphorus and agriculture 41
3.2 The phosphorus cycle 42
Phosphorus inputs and outputs 43
Fertilisers 44
Atmospheric inputs 45
Animal manures 46
P transformations in soil 47
Distribution of P in soil 47
P sorption 50
3.3 Phosphorus losses 51
Surface run-off 52
Leaching and drain flow 54
3.4 Environmental implications of P pollution 56
N and P balance in natural waters 56
3.5 Environmental problems caused by P pollution 57
P in ground and surface waters 57
Eutrophication 59
vi

3.6 Practical solutions 60
Source management—optimisation of fertiliser P use 61
Animal feeds 62
P transfer management by soil conservation 63
4 Soil erosion 69
4.1 Introduction 69
4.2 Vulnerability of soil to erosion and degradation 69
Extent of erosion 69
Processes and products of erosion 71
Water erosion 72
Wind erosion 74
Agricultural land management practices and accelerated erosion 75
4.3 Environmental impacts of soil erosion 77
Impacts of sediment on aquatic environments 77
Physical impacts 77
Chemical impacts 78
Impacts of sediments on land 80
4.4 Practical solutions to soil erosion 80
Assessment of erosion risk 81
Field and crop based erosion control strategies 81
Farm and catchment based erosion control strategies 84
5 Organic wastes 89
5.1 Introduction 89
Organic wastes and agriculture 89
5.2 Farm wastes 92
Changes in farming systems 92
Pollution risks from farm wastes 94
Ammonia in watercourses 95
Pathogens from farm wastes 97
Veterinary products in farm wastes 97
vii
Water pollution incidents 98
5.3 Non-agricultural organic soil amendments 99
Sewage sludge or biosolids 99
Pollution risks from applying sewage sludge to agricultural land 101
N and P pollution from sewage sludge 104
Odours 105
Pathogens 105
Other non-agricultural organic wastes 106
Detrimental effects of applying non-agricultural wastes to land 107
5.4 Practical solutions 109
Farm waste handling, storage and disposal 110
Solid manures 110
Silage 111
Slurry 111
Dirty water 112
Good agricultural practice 113
5.5 Non-agricultural organic wastes 119
Avoiding pollution problems by potentially toxic elements in sewage sludge 120
Avoiding crop contamination by pathogens 121
5.6 Alternative technologies for farm waste treatment 123
Biogas production 123
Reed bed treatment 123
6 Gaseous emissions 131
6.1 Introduction 131
Agriculture and gaseous emissions 131
6.2 Ammonia emissions 133
Pollution problems 133
Sources of ammonia pollution 134
Practical solutions 135
Minimising ammonia emissions by good practice 135
viii

6.3 Methane emissions 136
Pollution problems 136
Sources 136
Practical solutions 137
6.4 Nitrous oxide emissions 139
Pollution problems 139
Sources of pollution 139
Practical solutions 141
6.5 Carbon dioxide emissions 142
Pollution problems 142
Sources of pollution 143
Practical solutions 143
6.6 Farm odours 144
Sources of pollution 144
Practical solutions 145
The location and design of new livestock units 147
Minimising odour nuisance by good management practice 148
Technologies for reducing odour nuisance 148
7 Pesticides 153
7.1 Introduction 153
Pesticide history 153
Pesticide use 154
7.2 Pesticides and their application 155
7.3 Mode of action 156
7.4 Insecticides 157
Organophosphates 158
Carbamates 158
Pyrethroids 159
7.5 Herbicides 159
Triazines 159
ix

Phenoxyacetic acids 160
Carbamates 160
7.6 Fungicides 160
Traditional inorganics 161
Phenylamides 161
Carboxamides or oxathins 161
7.7 The causes of pesticide pollution 161
Pesticides as pollutants 161
Resistance and resurgence 162
7.8 Behaviour and fate of pesticides in the environment 164
Persistence 164
The fate of pesticides in soil 165
Loss of pesticides from soil 167
7.9 Environmental problems caused by pesticide residues 168
Pesticides in surface and ground waters 168
Effects on non-farmed organisms 170
7.10 Practical solutions 174
Good practice 174
User training 175
Planning and preparation 175
Working with pesticides 176
Disposal of waste 177
Keeping records 177
Other considerations 177
7.11 New technology 178
Adjuvants 179
New formulations 180
7.12 Alternatives to synthetic pesticides 180
Naturally derived pesticides 180
Microbial pesticides 180
x

Non-chemical weed control 181
Non-chemical pest control 183
8 Genetic modification 193
8.1 Introduction 193
8.2 Risks and benefits 196
Herbicide-resistant crops 196
Insect-resistant crops 202
8.3 Assessing environmental risk 206
8.4 The future for GMOs 208
9 Policy strategies for reducing pollution 213
9.1 Introduction 213
9.2 The emergence of contemporary agri-environmental policy 213
Agri-environment regulation 2078/92 214
Rural development regulation 1297/1999 216
9.3 Policy instruments, strategies and implementation 216
Policy strategies 217
Policy instruments 217
Implementation and dissemination 220
9.4 Learning from experience 221
Policies for reducing nitrate pollution 221
Nitrate pollution control policies in the UK and Europe 223
Policies for reducing pesticide pollution 225
Pesticide reduction programmes in Europe 226
9.5 Future directions 229
Adoption of sustainable farming practices 229
Legislative changes 230
Author index 235
Subject index 237
xi

Figures
1.1 Annual use of nitrogen fertiliser in the UK 21.2 Water pollution incidents recorded within a range of economic sectors 31.3 Number of agricultural pollution incidents recorded between 1979 and 1999 in
England and Wales 5
2.1 The agricultural N cycle 142.2 Relative yield from the addition of N 162.3 Percentage of total N available to crop after application of manure 172.4 Variation in soil nitrate under a cereal crop 202.5 Nitrogen fertiliser use in the UK 232.6 Mean concentration of nitrate in river waters in Eastern England 252.7 The change in mean nitrate concentrations in ground waters in Eastern UK 252.8 Measured N inputs, outputs and surpluses for two types of dairy farm 262.9 Location of nitrate vulnerable zones in England and Wales 302.10 Variation in nitrate loss from application of manures 323.1 Agricultural P cycle 433.2 The contribution of farming types to the UK annual P surplus 453.3 Transfers and transformations of P in soil 493.4 Influence of pH on the retention of P 513.5 P inputs from non-point sources and main hydrological flow pathways 523.6 The enrichment ratios of sediment run-off as a function of fertiliser P application 543.7 The relationship between P input and biodiversity in freshwater systems 583.8 The potential cycling of P between various forms in aquatic systems 593.9 Nutrient and transport management options for the control of P loss 634.1 Rill erosion in a winter cereal crop 724.2 Soils at risk of water erosion in England 734.3 Catchment based soil conservation scheme on cultivated land 855.1 Deep litter housing system 935.2 Distribution of total pollution incidents from organic waste in 1999 1005.3 The fate of sewage sludge in the UK in 1996/7 1025.4 The change in selected metal content of sewage sludges 1025.5 Slurry/sludge injection 1065.6 Manure spreading 1075.7 The effect of adding organic residues with high C/N ratio 1095.8 A typical walled silo 1125.9 An above-ground circular slurry store 1125.10 A weeping wall slurry store 1135.11 An earth-banked store suitable for solid, liquid or semi-liquid wastes 113

5.12 Cut out colour key to aid identification of high risk areas 1166.1 Cumulative N2O emissions from grassland cut for silage 1416.2 The carbon cycle 1426.3 Spreading slurry using a vacuum tanker 1466.4 Alternatives to conventional slurry spreaders 1497.1 Development of resistance 1637.2 Aquatic pollution incidents from pesticides and sheep dips 1697.3 Number of grey partridges 1966 to 1998 1748.1 Worldwide use of genetically modified crops 1948.2 Assessment of potential for transgene flow 201
xiii

Tables
1.1 Changes in agricultural practice in the UK between 1930 and 1990 12.1 Typical nutrient removal in winter wheat 122.2 Nitrogen containing chemicals used in fertilisers 153.1 Phosphorus content of plant parts 423.2 Common P containing fertilisers 463.3 Effect of carbon and phosphorus ratios on organic P transformations 473.4 Distance moved by macronutrient ions by diffusion 3.5 Fertiliser P recommendations for cereal crops in the UK 503.6 Factors responsible for controlling P loss by erosion and leaching 533.7 Some practical management techniques for the reduction of P loss 654.1 Typical erosion rates under natural vegetation and cultivated land 714.2 Land management practices which increase vulnerability of soils to erosion 754.3 Physical impacts of increased sediment load on aquatic organisms 774.4 Physical impacts of sediment transport and deposition 804.5 Erosion risk classes for areas of England and Wales 824.6 Field/soil erosion risk definitions 824.7 Recommended cropping strategy for high and very high risk sites 825.1 Examples of amounts of excreta produced by livestock 905.2 Value of organic manures produced in the UK 915.3 Problems caused through organic waste application for crops and livestock 915.4 Characteristics of silage effluent 945.5 Relative tolerance to oxygen depletion by river organisms 955.6 BOD of farm wastes 955.7 Chemical composition of farmyard slurry 985.8 Classification of water quality based on suitability as fishery 5.9 Typical N and P content of sewage sludges 1015.10 General characteristics of industrial wastes applied to agricultural land 105.11 ADAS farm waste management plan 1155.12 Areas needed to spread slurry during months when livestock are housed 5.13 Permissible total metal concentrations in sludge amended soil in EC and US 1215.14 The safe sludge matrix 1226.1 Changes in soil carbon and nitrogen under different cultivation practices 1436.2 Points of good practice for reducing odour emissions from livestock production systems 1487.1 Global agrochemical usage and market value in 1999 1547.2 Common pesticides and their target organisms 1557.3 General properties of some common insecticides 1587.4 General properties of some common herbicides 159
50
100
8
611

7.5 General properties of some common fungicides 1607.6 Proportions of pesticide applied found in drainage water 1687.7 Pesticides detected in ground waters in the UK 1717.8 Precautions needed by pesticide application methods 1767.9 Wind speed conditions and the suitability of pesticide spraying 1778.1 Potential hazards associated with GM crops 1978.2 Potential benefits and risks of transgenic-resistant crops 1998.3 Herbicide applied in Roundup Ready and conventional soybean crops 1998.4 Yields and yield drag 2038.5 US crop acreage planted with Bt crops 2048.6 Environmental indicators measured during UK farm scale evaluations 2079.1 National pesticide reduction targets in Sweden, Denmark and the Netherlands 227
xv

Acknowledgements
The authors would like to thank the following for the provision of material, helpful suggestionsand comment: Tom Misselbrook, Institute of Grassland and Environmental Science, North WykeResearch Station. Helen Stokes, Matt Lobley and Mick Fuller at Seale Hayne, Department ofEcology, Lithuanian University of Agriculture, Noreikiskes. Environment Agency (North West) fordata for case studies: Jeremy Joseph, John Quinton, National Soil Resources Institute, CranfieldUniversity (Figure 4.1) Cam Grant and Brian Williams, Department of Soil Water, AdelaideUniversity. Crown copyright material is reproduced under Class Licence Number C02P0000070with the permission of the Controller of HMSO and the Queen’s Printer of Scotland. Finally, theauthors express personal thanks to their respective families for their encouragement and supportthroughout the project.

1Agriculture and Pollution
1.1SETTING THE SCENE
During the latter half of the twentieth century, the global human population doubled from lessthan 3000 million to 6000 million. As the global population increases, demand for food continuesto rise. This leads to the intensification of agriculture which in turn places increasing demands onthe natural environment (Brown et al., 2000).
Agriculture is of fundamental importance to any national economy and the lifeblood of ruralcommunities throughout the world. It occupies 35% of the world’s land surface with 11% underdirect cultivation and 24% managed as permanent pasture (UNEP, 1992). In the United Kingdommore than 76% of land is under agricultural production (MAFF, 2000a). The first evidence ofagricultural activity in the UK can be traced back to 5000 BC (Reed, 1990), although our book isconcerned with changes occurring only in the last 70 years or so. The UK agricultural industry hasundergone a major revolution since the 1930s; progress in animal and crop breeding, theavailability of pesticides and fertilisers, and ever-advancing technology has resulted in asubstantial increase in productivity and levels of national self-sufficiency.
Successive government policies, notably the farm support measures of the Agriculture Act 1947and adherence to European policy (Box 1.1) have provided UK farmers with markets for theirproducts and a price structure that has encouraged agricultural intensification (MAFF, 1995,2000a). This drive towards intensive production (Table 1.1) has led to a major increase in the useof agrochemicals like fertilisers (Figure 1.1) and pesticides. In parallel, there have been manytechnological advances adopted by the agriculture industry in recent years, such as the geneticmodification of crop plants and precision farming.
Table 1.1 Changes in agricultural practice in the UK between 1930 and 1990 (Edwards andWithers, 1998).

The area of land affected by agriculture, its reliance on natural processes and the use oftechnology to intensify production results in a unique system both economically and ecologicallywith the following four key characteristics (OECD, 1997):
• Economic viability of agriculture is influenced greatly by the natural environment. Productivitydepends upon factors such as climate, soil fertility and water supply.
• Agricultural activities affect the quality of the environment. Crops and livestock form part of theagroecosystem, utilising natural resources for growth. Environmental benefits such as themaintenance of traditional landscapes may be apparent, but equally there may be costs such asdeterioration in soil, water and air quality or the loss of habitats important for conservation.
• The relationship between agricultural activity and the environment is complex and site-specific.Interacting factors include the physical, chemical and biological attributes of the localenvironment, the mix of farm enterprises, management practices, and the productiontechnologies adopted.
• Cultural and political influences affect the agriculture impacts on the environment. Mostdeveloped nations support food production by public subsidy and government intervention(OECD, 1996; MAFF, 2000a). Such measures inevitably affect the level of food production, itslocation and management.
BOX 1.1THE EUROPEAN UNION AND AGRICULTURAL INTENSIFICATION
Many of the changes in UK agriculture have been influenced by initiatives within the EU.The Common Agricultural Policy (CAP) was conceived by the original members of theEuropean Community in order to encourage food production at a time when food shortagewas still a recent memory. The original objectives contained in the 1957 Treaty of Romeincluded increasing productivity, stabilising markets, ensuring reasonable food prices forconsumers, and maintaining a fair standard of living for farming communities. Theplentiful supply of food and the extent of EU exports are a testament to its success.However, the CAP has been criticised because it created an economic climate in which foodproduction was encouraged at the expense of other considerations such as the
Figure 1.1 Annual use of nitrogen fertiliser in the UK (‘000’s of tonnes) (Winter, 1996).
2 CHAPTER 1

environment. Food surpluses were created that were dealt with either by being destroyed,or by export with subsidies (damaging international trade and affecting agriculture indeveloping countries).
The CAP has also reinforced the post-war trend in many European countries towards theexpansion, intensification and specialisation of crop and livestock production. The price structure ofmarkets reduced the economic risks associated with specialisation, stimulated the use of higherinputs to increase output, and encouraged the expansion of production into previously uncultivated areas. Farms grew larger, more capital-intensive and eager to adopt further improved technologieswith which to intensify production (Clunies-Ross and Hildyard, 1992).
Escalating financial costs, environmental concerns, the approaching enlargement of the EU andthe distorting effect of the CAP on world trade continue to move towards fundamental reform. Thelatest ‘Agenda 2000’ reforms will result in the internal market prices for cereal, beef and dairyproducts being reduced to the level of global market prices by 2006. In addition, the Rural DevelopmentRegulation (the so-called ‘second pillar’ of the CAP) provides further evidence of a long-term desireto shift support from production to rural development and environmental management (althoughclose to 90% of the CAP budget is still devoted to commodity regime support and compensationpayments).
This book focuses upon the UK, and is illustrated primarily with European examples. The need toidentify, understand and solve the problems caused by agricultural activity is clear from statisticsthat show that it can be a major cause of pollution (Figure 1.2). Seven key types of agriculturalpollution: nitrates, phosphates, sediment loss, organic wastes, gaseous emissions, pesticides andgenetic modification are included. We describe why pollution may occur and how such problemscan be overcome. Before we investigate these topics individually, the underlying causes ofagricultural pollution and responses to them are considered. The final chapter reviews the role ofagricultural policy, and reflects on how it may be used as a tool to deliver environmentallysensitive agricultural systems.
Figure 1.2 Water pollution incidents recorded within a range of economic sectors (EnvironmentAgency, 2001).
Defining agricultural pollution
At its most inclusive, the term pollution can be used to describe all unwanted environmentaleffects of human activity. The Oxford English Dictionary defines pollution as ‘the presence in theenvironment, or the introduction into it, of products of human activity which have harmful or
AGRICULTURE AND POLLUTION 3

objectionable effects’. This definition could include ‘visual’ pollution such as unsightly farmbuildings (Conway and Pretty, 1991) but we use a definition whereby a pollutant is a substance,including those:
• deliberately introduced into the environment (e.g. pesticides, fertilisers, genetically modifiedcrops and sewage sludge);
• produced by agricultural processes as wastes (e.g. silage effluent and livestock slurry);• produced by the enhancement of natural processes in the course of agricultural activity (e.g.
increased nitrous oxide emissions from cultivated soils or soil erosion).
A further distinction between a ‘contaminant’, which is, any substance introduced by humanactivity into the environment with no evidence of harm, and a ‘pollutant’, which is causing damageor harm may be made (Crathorne et al., 1996). Substances entering the environment may only causepollution if they are:
• present in excessive quantities—‘concentration effects’;• in the ‘wrong place at the wrong time’;• transformed into harmful ‘secondary pollutants’ as a result of biological or chemical processes.
Pollutants from agricultural systems have the potential to have a major impact, ranging from theimmediate on-farm environment to food products at the point of sale, and from local groundwatersources to the stratosphere. The impacts of agricultural pollution can be categorised into thefollowing areas (OECD, 1997):
• quality of natural resources, notably the physical, biological and chemical condition of soil,water and air;
• composition and functioning of terrestrial, aquatic and marine ecosystems, including issues ofbiodiversity and habitat quality;
• other environmental impacts such as public nuisance caused by odours from livestockproduction.
The occurrence of pollution in agricultural systems is well documented (Baldock et al., 1996;OECD, 1997; Edwards and Withers, 1998; Isherwood, 2000; EFMA, 2001) and the precise effecton the natural environment is mediated by the interaction between environmental factors andfarm management. The move towards more intensive farming methods has led to a marked increasein the number of pollution incidents recorded (Figure 1.3) and this has driven the development ofpollution control strategies designed to reverse this trend.
This book addresses agricultural pollution although the full environmental and socio-economicimpact of post-war agriculture also includes declines in farmland wildlife, the loss of traditionallandscapes, rural depopulation, animal welfare, and health related issues (Baldock et al., 1996;Corpet, 1996; DoE, 1996; Jones, 1999; MAFF, 2000a, 2001).
In this book we consider the following environmental issues:
4 CHAPTER 1

• contamination of ground and surface water by nitrates (Chapter 2), phosphates (Chapter 3),organic wastes (Chapter 5) and pesticides (Chapter 7), all of which can disrupt aquatic andmarine ecosystems and have significant effects on drinking water quality;
• disruption of agroecosystems by pesticides (Chapter 7) or genetically modified crops(Chapter 8), including flora and fauna in crops and semi-natural habitats;
• the effect of sediment loss due to erosion (Chapter 4);• contamination of soil and crops by metals, organic micropollutants and pathogens from the
application of livestock wastes and non-agricultural industrial wastes (Chapter 5);• atmospheric contamination by ammonia, methane and nitrous oxide which play various roles in
acid rain production, global warming and ozone depletion (Chapter 6).
1.2SOLVING THE PROBLEM
Monitoring impacts
Assessment of the environmental consequences of agricultural pollution is needed beforesolutions to the problems can be formulated. Agriculture is only one of many economic activitiesthat cause pollution and so its ‘share of responsibility’ for any environmental impact incurredmust be identified before control priorities are set. For example, pesticide pollution is not justcaused by agriculture. Most of the herbicides commonly detected in water also have non-agricultural uses with local authorities and public utilities regularly spraying public parks,roadside verges, railway lines and playing fields to control weeds. Until their prohibition from non-agricultural use in 1992, this included the use of atrazine and simazine, two of the most commonlydetected herbicides in drinking water. Further investigation of the effects of agricultural pollutionis complicated by:
• The complexity of contamination and pollution pathways: for example, pesticides may affectwildlife by direct contact with the chemical or its breakdown products, indirectly bycontamination of food sources, or by the destruction of habitats and resources upon whichspecies depend.
Figure 1.3 Number of agricultural pollution incidents recorded between 1979 and 1999 in England and Wales(NRA, 1992; Environment Agency, 2001).
AGRICULTURE AND POLLUTION 5

• Spatial and temporal variations in the occurrence of harm or damage: There are essentially twomain sources of pollution from agriculture: ‘point’, involving discrete and easily identifiableincidents such as leakage from a slurry store or silage clamp, and ‘diffuse’, involving theleaching and run-off of pollutants from large areas of agricultural land to ground and surfacewater.
• The unpredictable nature of pollution due to variations caused by climate, soil type and otherenvironmental factors.
The challenge is to identify the effects of pollution and then translate this understanding intoappropriate action to manage the problem. Common responses (OECD, 1997) include:
• government action through changes in policy and law, research and development, training andinformation programmes and economic instruments such as financial subsidies and taxes;
• responses by the agricultural industry, such as the voluntary adoption of new quality standardsand the imposition of stricter quality;
• modified behaviour by farmers, including changes in the use of agrochemical inputs and otherfarm management practices;
• consumer reactions expressed via changing patterns of purchase and consumption.
Pollution management can be achieved in two ways. Firstly, we can attempt to ‘cure’ the problemby acting against the pollutants themselves (e.g. by water treatment). Secondly, we may ‘prevent’the problem by addressing the underlying causes of pollution (e.g. by encouraging the adoption ofalternative agricultural practices that are less polluting). In both cases, the actions that can betaken are technical; whether they are adopted depends upon the presence of appropriateknowledge, effective legal regulations and adequate financial incentives (Conway and Pretty, 1991;MAFF, 1998a, b). This book includes solutions that are essentially farm-based, modifyingmanagement practices and business decisions via:
• the availability of new technologies;• the provision of information and advice to encourage ‘good agricultural practice’;• statutory controls and regulations that enforce change;• agri-environmental policy and the provision of financial incentives in the form of taxes or
subsidies;• the emergence of alternative agricultural systems with a market linkage offering financial
incentives in the form of price.
For each pollutant we describe current practical solutions to control their impact by consideringnew technology, good agricultural practice and regulation. We also describe the development andimplementation of contemporary agri-environmental policy in the UK and western Europe,including the emergence of alternative agricultural systems such as Integrated Crop Management(Chapter 9).
6 CHAPTER 1

Cost—the driver for pollution control
It has been recognised by government and industry that the ‘external costs’ or ‘externalities’caused by economic activity should be considered when making decisions regarding pollutioncontrol (DoE, 1994). An externality is a side effect (or by-product) of agricultural practice which isunpriced within the economy of the farming system but which nonetheless incurs a cost forsomeone (or something) else by reducing their profit or welfare (Hanley, 1991). These externalitiesinclude:
• the depreciation of natural capital through the use of non-renewable natural resources such asoil and coal or the loss of other natural assets such as biodiversity and landscape;
• declines in personal or collective ‘welfare’ such as public health;• the cost of environmental degradation including the cost of cleaning up damage;• the cost of defensive expenditure including the cost of preventative action to avoid
environmental damage.
The principal challenge when accounting for agricultural externalities is not in their identification,but the assignment of monetary value. Costs may be financial (e.g. incurred in water treatment) oreconomic (e.g. due to the loss of a landscape feature valued by people). Examples showing howcosts may be evaluated are given in Box 1.2. It is a challenge for agricultural policy makers tofacilitate the transition of farm practice to those which are environmentally sensitive, allowingfarmers to modify their farming practices whilst maintaining the economic viability of theirbusinesses.
BOX 1.2THE COSTS OF AGRICULTURAL POLLUTION
Nitrates in drinking waterThe EC maximum admissible concentration (MAC) of nitrate in human drinking water is 50 mgl−1
(50 parts per million). However, an increasing number of raw water sources in the UK exceed thisconcentration and water supply companies have been forced to introduce treatment programmes(DWI, 2000). Treatment options (Croll and Hayes, 1988) include blending high nitrate content waterwith that which is less polluted, biological denitrification, ion exchange, reverse osmosis andelectrodialysis. Estimates of the investment incurred in the installation of denitrification equipmentranges from £148 million to £200 million (DoE, 1986; Ofwat, 1992), with annual running costs of atleast £10 million per year.
Phosphates in watersThe total polluting loads from sewage treatments works in the UK has fallen by between 30 and
40% during the 1990s and phosphate loads specifically by 37%. This has been due to improvedsewage treatment with investment of £250 million combined with a reduction of phosphate usage indetergents (Environment Agency, 2000a, b). Agriculture is a diffuse source, accounting for over 50%of the Europe-wide phosphate in surface waters (Environment Agency, 2000b). Estimated annualcosts for the removal of phosphate from surface waters from agriculture in the UK are in the order of£55 million (ENDS, 2000b).
Organic wastes
AGRICULTURE AND POLLUTION 7
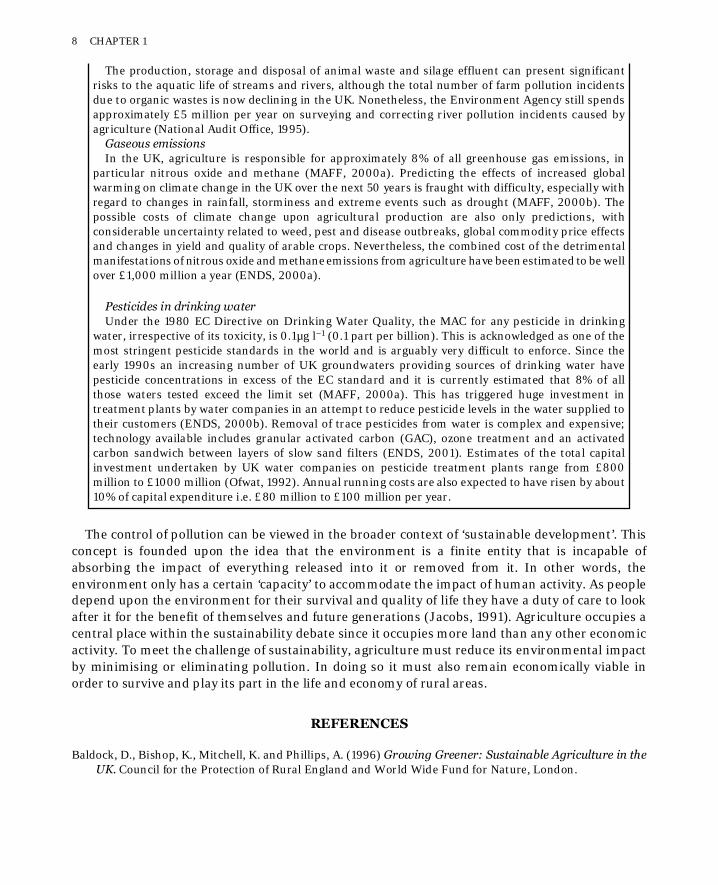
The production, storage and disposal of animal waste and silage effluent can present significantrisks to the aquatic life of streams and rivers, although the total number of farm pollution incidentsdue to organic wastes is now declining in the UK. Nonetheless, the Environment Agency still spendsapproximately £5 million per year on surveying and correcting river pollution incidents caused byagriculture (National Audit Office, 1995).
Gaseous emissionsIn the UK, agriculture is responsible for approximately 8% of all greenhouse gas emissions, in
particular nitrous oxide and methane (MAFF, 2000a). Predicting the effects of increased globalwarming on climate change in the UK over the next 50 years is fraught with difficulty, especially withregard to changes in rainfall, storminess and extreme events such as drought (MAFF, 2000b). Thepossible costs of climate change upon agricultural production are also only predictions, withconsiderable uncertainty related to weed, pest and disease outbreaks, global commodity price effectsand changes in yield and quality of arable crops. Nevertheless, the combined cost of the detrimentalmanifestations of nitrous oxide and methane emissions from agriculture have been estimated to be wellover £1,000 million a year (ENDS, 2000a).
Pesticides in drinking waterUnder the 1980 EC Directive on Drinking Water Quality, the MAC for any pesticide in drinking
water, irrespective of its toxicity, is 0.1µg l−1 (0.1 part per billion). This is acknowledged as one of themost stringent pesticide standards in the world and is arguably very difficult to enforce. Since theearly 1990s an increasing number of UK groundwaters providing sources of drinking water havepesticide concentrations in excess of the EC standard and it is currently estimated that 8% of allthose waters tested exceed the limit set (MAFF, 2000a). This has triggered huge investment intreatment plants by water companies in an attempt to reduce pesticide levels in the water supplied totheir customers (ENDS, 2000b). Removal of trace pesticides from water is complex and expensive;technology available includes granular activated carbon (GAC), ozone treatment and an activatedcarbon sandwich between layers of slow sand filters (ENDS, 2001). Estimates of the total capitalinvestment undertaken by UK water companies on pesticide treatment plants range from £800million to £1000 million (Ofwat, 1992). Annual running costs are also expected to have risen by about10% of capital expenditure i.e. £80 million to £100 million per year.
The control of pollution can be viewed in the broader context of ‘sustainable development’. Thisconcept is founded upon the idea that the environment is a finite entity that is incapable ofabsorbing the impact of everything released into it or removed from it. In other words, theenvironment only has a certain ‘capacity’ to accommodate the impact of human activity. As peopledepend upon the environment for their survival and quality of life they have a duty of care to lookafter it for the benefit of themselves and future generations (Jacobs, 1991). Agriculture occupies acentral place within the sustainability debate since it occupies more land than any other economicactivity. To meet the challenge of sustainability, agriculture must reduce its environmental impactby minimising or eliminating pollution. In doing so it must also remain economically viable inorder to survive and play its part in the life and economy of rural areas.
REFERENCES
Baldock, D., Bishop, K., Mitchell, K. and Phillips, A. (1996) Growing Greener: Sustainable Agriculture in theUK. Council for the Protection of Rural England and World Wide Fund for Nature, London.
8 CHAPTER 1

Brown, L., Flavin, C. and French, H. (2000) State of the World 2000. Worldwatch Institute, 262pp.Clunies-Ross, T. and Hildyard, N. (1992) The Politics of Industrial Agriculture. Earthscan Publications,
London.Conway, G. and Pretty, J. (1991) Unwelcome Harvest: Agriculture and Pollution. Earthscan Publications,
London.Corpet, D.E. (1996) Microbiological hazards for humans of antimicrobial growth promoter use in animal
production. Revue de Médecine Vétérinaire 147, 851–862.Crathorne, B., Dobbs, A.J. and Rees, Y. (1996) Chemical Pollution of the Aquatic Environment by Priority
Pollutants and its Control. In: Pollution, Causes, Effects and Control (Ed. R.M.Harrison). 3rd Edition.The Royal Society of Chemistry, Cambridge, pp. 1–25.
Croll, B. and Hayes, C. (1988) Nitrate and water supplies in the United Kingdom. Environmental Pollution50, 163–187.
DoE (1986) Nitrate in Water: a Report by the Nitrate Co-ordination Group. Department of EnvironmentPollution Paper No. 26, HMSO, London.
DoE (1994) Sustainable Development: the UK Strategy. Department of Environment Command Paper 2426,HMSO, London.
DoE (1996) UK Indicators of Sustainable Development. HMSO, London.DWI (2000) Overview of Water Quality in England and Wales, Drinking Water 1999. Drinking Water
Inspectorate, Department of the Environment, Transport and the Regions, London.Edwards, A.C. and Withers, P.J.A. (1998) Soil phosphorus management and water quality: a UK perspective.
Soil Use and Management 14, 124–130.EFMA (2001) Sustainable Soil Management: an Achievable Goal. European Fertilizer Manufacturers
Association, Brussels.ENDS (2000a) The diffuse pollution challenge. ENDS Report 310 (November).ENDS (2000b) Farming’s environmental costs top £1.5 billion per year says Agency. ENDS Report 309
(October).ENDS (2001) Water firms urged to end chlorine addition. ENDS Report 314 (March).Environment Agency (2000a) Achieving the Quality, the Environment Agency’s Views of the Benefits to the
Environment of Water Company Investment over the Next Five Years. Environment Agency,Department of the Environment, Transport and the Regions, London.
Environment Agency (2000b) Aquatic Eutrophication in England and Wales: a Management Strategy.Environment Agency, Department of the Environment, Transport and the Regions.
Environment Agency (2001) Water Pollution Incidents 1999. URL: http://www.environment-agency.gov.uk.Hanley, N. (Ed.) (1991) Farming and the Countryside: An Economic Analysis of External Costs and Benefits.
CAB International, Wallingford.Isherwood, K.F. (2000) Fertilizer Use and the Environment. (Revised Edition). International Fertilizer
Industry Association, Paris.Jacobs, M. (1991) The Green Economy. Pluto Press, London.Jones, D.L. (1999) Escherichia coli O157 in the environment. Soil Use and Management 15, 76–83.MAFF (1995) European Agriculture: the Case for Radical Reform. Ministry of Agriculture, Fisheries and
Food, London.MAFF (1998a) Code of Good Agricultural Practice for the Protection of Water. Revised 1998. Ministry of
Agriculture, Fisheries and Food , London.MAFF (1998b) Guidelines for Farmers in Nitrate Vulnerable Zones. Ministry of Agriculture, Fisheries and
Food, London.MAFF (2000a) Towards Sustainable Agriculture: Pilot set of Indicators. Ministry of Agriculture, Fisheries
and Food, London.MAFF (2000b) Climate Change and Agriculture in the United Kingdom. Ministry of Agriculture, Fisheries
and Foods, London.
AGRICULTURE AND POLLUTION 9

MAFF (2001) Foot and Mouth Disease: Public Information Factsheet 1. Ministry of Agriculture, Fisheriesand Food, London.
National Audit Office (1995) National Rivers Authority: River Pollution From Farms in England. House ofCommons Paper 235. HMSO, London.
NRA (1992) The Influence of Agriculture on the Quality of Natural Waters in England and Wales. NationalRivers Authority, Bristol.
OECD (1996) Agricultural Policies, Markets and Trade in OECD Countries—Monitoring and Evaluation1996. Organisation for Economic Co-operation and Development, Paris.
OECD (1997) Environmental Indicators for Agriculture. Organisation for Economic Co-operation andDevelopment, Paris.
Ofwat (1992) The Cost of Quality—a Strategic Assessment of the Prospects for Future Water Bills. Ofwat,Birmingham.
Reed, M. (1990) The Landscape of Britain: from the Beginnings to 1914. Routledge, London.UNEP (1992) The World Environment 1972–1992: Two Decades of Challenge. Chapman and Hall (on behalf
of the United Nations Environment Programme), London.Winter, M. (1996) Rural Politics: Policies for Agriculture, Forestry and the Environment. Routledge,
London.
10 CHAPTER 1

2Nitrates and Nitrogen Loss
2.1INTRODUCTION
The present structure and output of agricultural systems could not be maintained without theadvent and widespread use of synthetic or mineral fertilisers. Of the major plant nutrients N, notonly provides the greatest responses in crop yield from fertiliser addition but is also the mostreadily lost from the agroecosystem.
In parallel with increased agricultural production over the last 50 years has been the increase innitrate (NO3
−) concentrations in rivers, lakes and underground aquifers. There is strong evidenceto suggest that this is due to pollution from agriculture. Furthermore, this loss of N fromagriculture as leachate in the form of NO3
−, but also to a lesser extent as gaseous forms of N orerosion as N associations with soil particles, represents an economic shortfall, in that the appliedN is not being utilised for food production. This chapter tackles three major questions:
• Why have NO3− levels increased in waters?
• Is this increase harmful to the environment?• What can be done to reduce and stop further increases in NO3
− pollution and losses fromagricultural systems?
Nitrogen and agriculture
Nitrogen is an essential constituent of all nucleic acids, amino acids and proteins, and thereforefundamental to the reproduction and growth of all organisms. In a general introduction to theglobal N cycle, Jenkinson (1990) estimated that in 1990 the world’s human population contained atotal 10 million tonnes of N. Although this is small compared to the total amounts of N in theatmosphere (3.9×10⁹ million tonnes), soil organic matter (1.5×10⁵ million tonnes) or plants (1.5×10⁴ million tonnes), the human population is increasing and is inextricably linked viaagriculture and the food industry to the global N cycle (Schlesinger, 1997).
Nitrogen occurs naturally in soils and is closely associated with soil organic matter. However, itis the simple ionic forms of ammonia (NH4
+) and NO3− which plants can easily absorb and utilise
(Whitehead, 2000). Of the elements essential for plant growth, N is required in the greatestquantity by agricultural crops (Table 2.1). The exceptions to this rule-of-thumb are those crops

which form large underground storage organs, notably potatoes, since these also require largequantities of phosphorus (P) and potassium (K).
Nitrogen-containing compounds are involved in virtually all of the biochemistry of the cropplant. This includes chlorophyll that is essential for photosynthesis, the nucleic acids in which thepattern for the plant’s growth and development is encoded, and a variety of plant proteins rangingfrom lipoprotein membranes to enzymes such as ribulose 1, 5-biphosphate carboxylase-oxygenase(Rubisco) which plays a key role in the conversion of atmospheric carbon dioxide (CO2) into organiccarbon during photosynthesis.
Nitrogen deficiency is generally characterised by the yellowing or chlorosis (i.e. loss ofchlorophyll) of the lower leaves of crop plants, starting from the tip and extending to the whole leafwith increasing deficiency. In severe cases, the whole plant is stunted and the leaves remain small.
While the timely application of relatively small amounts of additional NH4+ and NO3
− to the soilwill often relieve the symptoms of sickly-looking crops, much higher levels of mineral N arerequired to significantly increase crop yield. An abundant supply of mineral N increases crop yieldby influencing leaf area in two distinct ways:
• By encouraging the rapid growth of above-ground vegetation: This can have an importantinfluence upon crop yield, since any increase in the size of the crop canopy promotes both theinterception of sunlight and the absorption of CO2 thereby increasing photosynthetic efficiency.
• By promoting the duration of the crop canopy: Nitrogen is very mobile within the plant and anyshortage of N in young tissue is usually met by the mobilisation of N from the older leavesresulting in their chlorosis and eventual death. An abundant N supply avoids this problem andmaintains more leaves to carry on photosynthesising for longer.
In certain crops, a good supply of mineral N may also help to improve the quality, as well as theyield, of the final harvested produce. For example, bread-making wheat varieties need to contain atleast 11–12% protein in order to form a satisfactory dough. This requires a sufficiently high N supply(late in the growing season) to achieve an N concentration in the grain of around 2.0% on a drymatter (DM) basis. In other crops, increased supplies of mineral N are not so welcome. Theavailability of too much N for potato plants can produce too many over-large tubers, while barleygrown for malting needs grain with as much starch and as little protein content as possible (ideallynot in excess of 1.6% N). Too much N may also reduce the sugar content of sugar beet (Isherwood,2000). Excessive amount of N also produces vegetative growth with large succulent thin-walledcells. This can cause two problems:
• the leaves and stems are more readily attacked by insect pests and fungal diseases;
Table 2.1 Typical nutrient removal (kg ha−1) in a harvested winter wheat crop nutrient offtake per tonne ofplant material.
12 CHAPTER 2

• the stems are less mechanically strong and crops are subsequently prone to ‘lodging’ i.e. beingblown over in wet and windy weather.
Despite being the most important crop nutrient in agriculture, N is also an environmentalpollutant causing significant ecological disturbance. This chapter will consider the ‘leakage’ of Nfrom agriculture into the wider environment in detail and discuss those factors influencing theoccurrence and behaviour of N within agricultural systems.
2.2THE NITROGEN CYCLE
Nitrogen is a transient nutrient and the amount available in the soil at any one time to meet thedemands of a growing crop is the product of the complex network of physical, biological andchemical pathways through which the various forms of N move:
• into the soil (inputs);• within the soil (transformations); and• out of the soil (losses).
Together these pathways are known as the soil N cycle (Figure 2.1) and are an integral part of theoverall cycling of N within nature. A full discussion of this cycle and its significance foragricultural production is beyond the scope of this book, but it has been extensively reviewedelsewhere (e.g. Wild, 1988; Powlson, 1993; Tisdale et al., 1993).
Nitrogen can enter the soil N cycle in a number of ways and in different forms. Atmosphericdeposition, biological N2 fixation, fertilisers and animal feeds effectively import N from outside ofthe farm, whilst animal manures typically transfer N from one part of the farm (e.g. wherelivestock which have been overwintering in sheds and barns) to another.
Atmospheric deposition
Agricultural land receives significant quantities of N via the deposition of N oxides and NH3 fromthe atmosphere. The major source of N oxides in the atmosphere is fuel combustion and the so-called NOx emissions from power stations and motor vehicles. Atmospheric NH3 is derived from anumber of sources including industrial emissions, coal burning, livestock wastes and otheragricultural sources (Schlesinger, 1997) (Chapter 6).
Since most atmospheric N compounds are highly soluble in water, deposition may occur inrainfall, although the dry deposition of gaseous and particulate material may also occur. Anestimated 30–50 kg N ha−1 year−1 are deposited on agricultural land from the atmosphere insouthern and eastern England (and the same for some parts of Germany). Of this, when depositedonto land in cereals, it is estimated that 5% is leached, 12% denitrified, 30% immobilised and theremaining taken off by the crop (Goulding et al., 1998). Total N deposition in intensive livestockproduction area of the Netherlands may range from 40–80 kg N ha−1 year−1 (Whitehead, 2000).For the farmer this may represent a useful N input, but may be particularly detrimental in natural
NITRATES AND NITROGEN LOSS 13

and semi-natural ecosystems (Box 2.1). Even in areas remote from intensive productionagriculture deposition may still be in the region of 15 kg N ha−1 year−1 (Brady and Weil, 1999).
Biological fixation
Certain species of bacteria and algae are capable of reducing atmospheric N to NH3. The mostimportant agricultural example is the Rhizobia bacteria that form a close symbiotic relationshipwith leguminous crops such as peas, beans and clover. Legumes are mainly grown on the farm aseither arable or forage crops. Arable legumes (e.g. field peas and beans) are grown and harvestedto produce a dried grain for inclusion as a protein source in the diet of farm animals, while foragelegumes (e.g. red and white clover) are commonly grown mixed with grass, and are either used forlivestock grazing or cut for hay and silage. Legume crops usually leave large quantities of highprotein content crop residues which can make a significant contribution to levels of organic N inthe soil and, upon decomposition and mineralisation, to soil mineral N levels and the growth andyield of subsequent crops. Some legume crops are grown specifically for incorporation into the soilas green manures although in recent times their use in conventional agriculture has diminished(Parsons, 1984).
In the UK crop rotations including leguminous crops formed the traditional base of agriculturefor many centuries. One of the best known rotations in the 1700s was the ‘Norfolk four course’.This originally took the form of roots, barley, seed and wheat. The seed component of the courseof the rotation was some form of legume, notably a one-year red clover ley (sometimes with ryegrass)or an arable legume crop. In some parts of the country, the 1-year seeds crop was extended into ashort-term 2-year ley, or into the medium to long-term leys which form the basis of traditional ley/
Figure 2.1 The agricultural N cycle (adapted from Rowell, 1994).
14 CHAPTER 2

arable farming systems e.g. 4–5 year forage legume or grass/clover ley followed by up to 3 yearscereals (Laity, 1948).
Biological N2 fixation by legumes is highly variable depending upon the number of activenodules, their size and longevity, and the bacterial strains occupying them. These factors in turnare affected by the complex interaction of legume species and cultivar, crop management andconditions of growth (notably water availability and soil nutrient status). In an extensive review ofNorth American work, LaRue and Patterson (1981) quoted estimates of annual N2 fixation in therange of 10–100 kg N ha−1 for arable legumes and 100–250 kg N ha−1 for forage legumes. InEurope, productive grass-clover swards would be expected to fix between 100 and 300 kg N ha−1,without the addition of N fertiliser (Whitehead, 2000).
Fertilisers
The industrial fixation of atmospheric di-nitrogen gas (N2) is directly analogous to biologicalfixation since it also involves the reduction of N2 to NH3. During the commercial manufacture ofNH3 (Haber-Bosch process), hydrogen and atmospheric N2 are combined at high temperature(300–500 °C) and pressure (400–1000 atmospheres) in the presence of a catalyst. The NH3
produced may be used as a fertiliser material itself (Table 2.2), but is more commonly processed tofertiliser materials such as ammonium nitrate or urea (so-called ‘straight’ N fertilisers), or mono-and di-ammonium phosphates used for the manufacture of ‘compound’ NPK fertilisers.
Compared to the use of legumes as an N source, fertilisers directly supplement soil mineral Nlevels with NH4
+ and/or NO3−, and therefore rapidly increase the amount of N available for crop
uptake. As a guide (and assuming that the fertiliser is applied at an appropriate time), the yield ofa wheat crop may increase by a maximum of 24kg for each additional kilogram of fertiliser Napplied, up to where the response begins to plateau (Figure 2.2) (Mackenzie and Traureau, 1997).As application rates are increased, a point of ‘optimum’ application is reached at which theavailability of extra N ceases to be worthwhile for crop growth and is thus surplus to requirement(Figure 2.2).
Table 2.2 N-containing chemicals and materials commonly used in ‘straight’ and ‘compound’fertilisers (White, 1997).
NITRATES AND NITROGEN LOSS 15

Figure 2.2 Relative yield from the addition of a growth factor, such as N, as described by theMitscherlich Equation (data from Tisdale et al., 1993).
Animal manures
Of the N consumed by livestock in the form of herbage and concentrate feeds, a relatively smallproportion is actually utilised for the production of meat or milk (Whitehead et al., 1986). Instead,the majority (typically 70% of the N consumed by cattle and 80% consumed by sheep) of N isexcreted as dung and urine (Haygarth et al., 1998). When cattle and sheep are grazing this excretais voided directly to the soil surface, but once the animals are housed in the winter it accumulatesin yards and buildings as slurry and manure which needs to be stored and spread on the land at anappropriate time (Chapter 5).
The amount of N available to crops following the surface application of manure varies with arange of factors, including soil type, form and source of manure and time of year. Figure 2.3 showsthe percentage of total N available to the next crop following the winter and autumnal applicationof different manure types to a sandy soil. The usefulness of this type of information to farmersattempting to account for the fertiliser value of manures and reduce N leakage will become evidentas the chapter continues (Box 2.2).
Manure N comprises two major fractions of agronomic interest, readily available inorganic N(mainly NH4
+) and organic N (Chapter 5) (MAFF, 2001). Ammoniacal N is water soluble,comprising of urea and NH4
+, and when the manure/slurry is applied to the soil supplements soilmineral N levels in a similar manner to fertiliser N. The organic N fraction must undergomineralisation before being available for crop uptake.
2.3NITROGEN TRANSFORMATIONS
Within the soil N cycle, a number of important biological and chemical transformations occur(Figure 2.1) which influence both the amount of N available for crop uptake and that which is atrisk of ‘leaking’ into the wider environment. Two of the most important of these are mineralisationand immobilisation that involve the transformation of N between organic and inorganic forms inthe soil.
16 CHAPTER 2
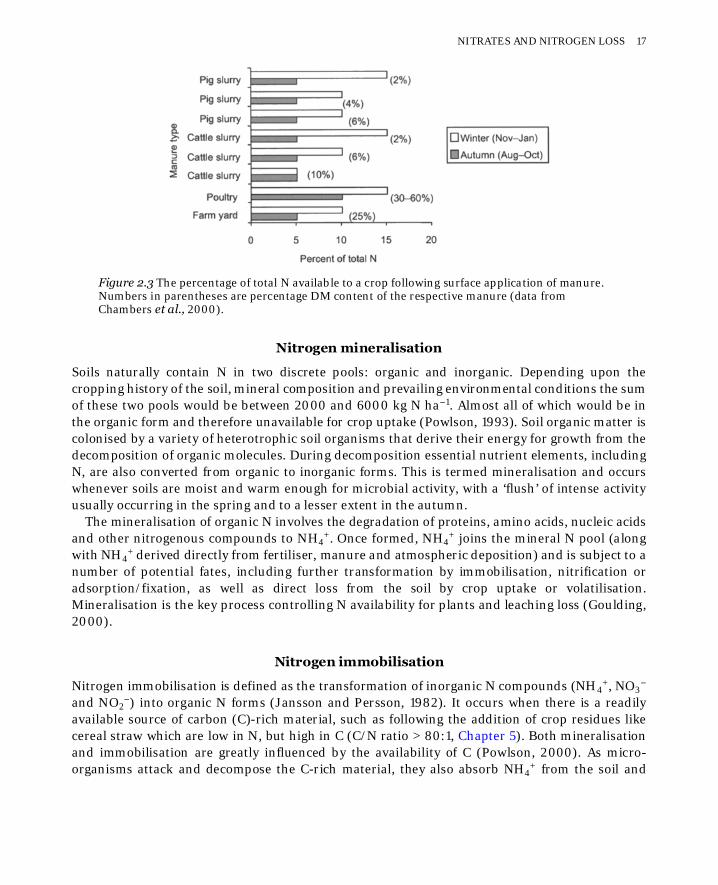
Figure 2.3 The percentage of total N available to a crop following surface application of manure.Numbers in parentheses are percentage DM content of the respective manure (data fromChambers et al., 2000).
Nitrogen mineralisation
Soils naturally contain N in two discrete pools: organic and inorganic. Depending upon thecropping history of the soil, mineral composition and prevailing environmental conditions the sumof these two pools would be between 2000 and 6000 kg N ha−1. Almost all of which would be inthe organic form and therefore unavailable for crop uptake (Powlson, 1993). Soil organic matter iscolonised by a variety of heterotrophic soil organisms that derive their energy for growth from thedecomposition of organic molecules. During decomposition essential nutrient elements, includingN, are also converted from organic to inorganic forms. This is termed mineralisation and occurswhenever soils are moist and warm enough for microbial activity, with a ‘flush’ of intense activityusually occurring in the spring and to a lesser extent in the autumn.
The mineralisation of organic N involves the degradation of proteins, amino acids, nucleic acidsand other nitrogenous compounds to NH4
+. Once formed, NH4+ joins the mineral N pool (along
with NH4+ derived directly from fertiliser, manure and atmospheric deposition) and is subject to a
number of potential fates, including further transformation by immobilisation, nitrification oradsorption/fixation, as well as direct loss from the soil by crop uptake or volatilisation.Mineralisation is the key process controlling N availability for plants and leaching loss (Goulding,2000).
Nitrogen immobilisation
Nitrogen immobilisation is defined as the transformation of inorganic N compounds (NH4+, NO3
−
and NO2−) into organic N forms (Jansson and Persson, 1982). It occurs when there is a readily
available source of carbon (C)-rich material, such as following the addition of crop residues likecereal straw which are low in N, but high in C (C/N ratio > 80:1, Chapter 5). Both mineralisationand immobilisation are greatly influenced by the availability of C (Powlson, 2000). As micro-organisms attack and decompose the C-rich material, they also absorb NH4
+ from the soil and
NITRATES AND NITROGEN LOSS 17

rapidly convert it to microbial biomass. Subsequently, the microbial biomass dies, enters theactive phase of the soil organic matter and becomes liable to decomposition again. Some of themicrobial N may enter the passive phase to form humus, or it may be released as mineral N. Thecontinuous turnover of NH4
+ in this manner forms a sub-cycle within the overall N cycle of theagricultural soil and produces a net effect—net mineralisation or net immobilisation—whichinfluences the supply of NH4
+ for other N cycle processes.
Nitrification
When (as is usual in most soils) the microbial population is limited by available C, most of themineralised NH4
+ is oxidised rapidly to NO3− by the process of nitrification. This is a two-stage
process mediated by two important groups of bacteria: Nitrosomonas that oxidise NH4+ to NO2
−
and Nitrobacter which oxidise NO2− to NO3
−. Since the oxidation of NO2− is more rapid than that
of NH4+, there are only ever trace amounts of NO2
− in the soil. Importantly, the mineralisation oforganic N in soil and in crop residues is seen as one of the major sources of NO3
− in agriculture(Powlson, 2000).
Adsorption and fixation
Ammonium can be adsorbed onto the surface of clay minerals and soil organic matter (the ‘cationexchange sites’), from where it is freely exchangeable with other cations in the soil solution.Ammonium is also approximately the same size as the K+ potassium ion and readily enters theinterlayer portions of clay minerals (e.g. vermiculite). The collapse of this interlayer space, forexample by drying, effectively fixes the NH4
+, making it only very slowly available to enter the soilsolution. This is thought of as being a partial reversal of the weathering processes undertaken byalumino-silicate minerals.
Nitrogen uptake and losses
There are a number of pathways by which N is lost from an agricultural soil. The most desirableroute is via crop uptake and subsequent removal by grazing or harvest since this produces both aneconomic return for the farmer, and is not a direct cause of pollution. The proportion of applied Ntaken during a growing season should, under controlled conditions, be between 50 and 70% (forphosphorus <15% and potassium 50–60%) (Isherwood, 2000). However, in practice, any N whichis available in the soil for crop uptake at any time is also vulnerable to loss from the soil (withouteconomic return and as a potential pollutant) in any one of three ways: NO3
− leaching; gaseousemissions during denitrification and nitrification, and NH4
+ volatilisation (Chapter 7). Theimportance of each of these loss pathways vary considerably and depends on the agriculturalsystem.
Nitrate leaching
Due to the chemical and biological processes described previously, NO3− is generally the most
prevalent form of soil mineral N in well-drained and aerated soils. Much of this NO3− is derived
18 CHAPTER 2

from the nitrification of NH4+, but levels are also supplemented directly by applications of
fertiliser and, to a lesser extent, atmospheric deposition. When crops are growing rapidly they takeup NO3
− very quickly, thus reducing its susceptibility to loss. However, once plants stop growingany NO3
− that continues to be made available in the soil (e.g. by mineralisation or the applicationof fertiliser) is vulnerable to losses, such as leaching.
Nitrate is a very soluble anion and, unlike NH4+, is not readily adsorbed or fixed by the soil. It may
be considered as behaving ‘conservatively’ in the soil, in that it does not readily react with the soilmineral and organic surfaces and so tends to remain in soil solution in relatively highconcentrations (cf. phosphate, Chapter 3). Therefore, NO3
− moves through the soil predominantlyby the mechanism of mass flow, which is the movement of ions in soil solution down hydraulicgradients, which may be created by a transpiring plant (Tisdale et al., 1993).
Agricultural soils can be prone to ‘leak’ substantial quantities of NO3− in drainage water and this
is frequently cited as one the main causes of N loss from soils (>40 kg N ha−1 in many UK soils)(Lord and Anthony, 2000). Major leaching losses occur when two conditions are met:
• Soil water movement is large i.e. the influx of water (either rainfall or irrigation) is greater thanthe evapotranspiration. This is further influenced by soil texture and structure that may affectthe hydraulic conductivity and water storage capacity of the soil. Nitrate leaching losses aregenerally greater from poorly structured sandy soils than well structured clay soils.
• Soil NO3− levels are high due to the mineralisation of organic N (possibly from the application of
animal manures), or the presence of excessive or unused fertiliser. For example, a Septemberapplication of animal manure at the maximum recommended rate of 250 kg (total) N ha−1
(MAFF, 1998a) on a sandy soil would supply just 14 kg N ha−1 to a winter cereal crop, but 9 kg Nha−1 may be lost by leaching (MAFF, 2001). The proportion of leached NO3
− derived from organicor fertiliser N sources will depend upon environmental conditions, the rate of applied N and thecrop management systems employed. However, considerable quantities of NO3
− leached fromarable soils can originate from the rapid mineralisation of organic N rather than directly fromapplied fertiliser. Particularly under horticultural crops, where large N residues may be left inthe soil (>300 kg N ha−1 may remain after some brassicas) (Rahn et al., 1996). Figure 2.4 givesan indication of the variation in NO3
− levels in a soil under arable cropping conditions in the UKand illustrates the time leaching and leakage is most likely to happen (Davies, 2000). Acomparison of this Figure with Figure 2.3 highlights the importance of time of year in regardNO3
− leaching from manure or fertiliser applications.
Seasonal rainfall and evapotranspiration patterns interact with soil NO3− levels to affect leaching
losses. Although these vary greatly from year to year, and between regions, some general statementscan be made based upon research in the UK and Denmark (Powlson, 1988; Addiscott, 1996;Simmelsgaard, 1999; Chambers et al., 2000):
• in summer evapotranspiration generally exceeds rainfall and leaching is usually minimal.However, fertiliser N losses can occur if application coincides with intense, heavy rainfall;
• a particularly dry summer can limit crop N uptake and lead to the accumulation of NO3− in the
soil which is then susceptible to autumn/winter leaching;
NITRATES AND NITROGEN LOSS 19

• provided that the soil is approaching or has returned to field capacity, autumn rainfall will leachany NO3
− remaining from pre-harvest fertiliser application or derived from late summer/autumn mineralisation. Applications of fertiliser N to the seedbed of autumn sown crops arealso very susceptible to leaching;
• in winter there is a large excess of rainfall over evapotranspiration and any NO3− present in the
soil profile is readily leached;• spring applied fertiliser N is susceptible to leaching if application coincides with heavy rainfall
or NO3− is not rapidly removed from the available pool by crop uptake.
The leaching of soluble organic nitrogen forms has also been suggested as being a majorpathway of N loss from agricultural soils. It is thought that in soils this pool may be of similarsize to the mineral N pool, but it is less subject to fluctuation and change (Murphy et al., 2000).
Nitrous oxide and nitric oxide emissions from nitrification anddenitrification
Another route by which significant amounts of N may leak from an agricultural soil is via gaseousemissions of nitric oxide, NO, nitrous oxide, N2O, and molecular nitrogen, N2 (Fowler et al.,1996). The predominant source of these emissions is microbial nitrification (see above) anddenitrification.
Denitrification is the dissimilatory reduction of NO3− is the major natural process by which
oxidised N is returned to the atmosphere (Chapter 6) (Royal Society, 1983). It occurs underanaerobic soil conditions, when NO3
− replaces O2 as the terminal electron acceptor in microbialrespiration. Conditions favouring denitrification are the presence of: adequate NO3
− levels,denitrifying organisms, high soil water contents (low soil oxygen) and poor soil structure (both ofwhich result in low air filled porosity and potential anaerobic conditions) (De Klein et al., 2001). The
Figure 2.4 Variation in soil NO3− levels under a cereal crop over a period of one year (Davies, 2000).
20 CHAPTER 2

main rate determining factors are soil temperature and the amount of readily available carbonsubstrate present (Smith and Arah, 1990) (Chapter 6).
Denitrification can be a very important N loss process in agricultural soils, particularly fromheavy soils in wet conditions, but its measurement is frequently complicated by high spatial andtemporal variability and difficulties of determining total denitrification loss from themeasurement of N2O emissions (Folorunso and Rolston, 1984; Arah et al., 1991; De Klein et al.,2001).
As well as representing a further economic loss to the farmer by reducing the availability ofmineral N for crop uptake, emissions of NO and N2O are pollutants that may pose anenvironmental hazard (Chapter 6) and also cause damage to natural and semi-natural ecosystems(Box 2.1).
BOX 2.1CRITICAL NITROGEN LOAD
Critical load is the maximum atmospheric ‘pollutant’ load that sensitive ecological systemscan tolerate without incurring long-term harmful effects (RCEP, 1996). The concept hasmainly been applied to acid pollutants, indicating the capacity of soils in sensitiveenvironmental areas to buffer atmospheric acid inputs.
Critical loads for N inputs are less easy to determine (N compounds, such as NH3, can both acidfyand act as a nutrient), but have been estimated at 5–45 kg ha−1 year−1 for a range of ecosystems fromheathland to commercial forestry; the poorer the soil and the sparser the vegetation, the smaller thecritical load.
An annual deposition of up to 40 kg N ha−1, as estimated by Goulding et al. (1998), suggests thatsome natural and semi-natural ecosystems are likely to be receiving much more N than their criticalload (Asman et al., 1998). This will cause changes in the flora and fauna of the ecosystems due to theincreased N supply, and increased soil acidification as the NH3 deposited is nitrified and releases H+
ions into the soil solution. Localised N deposition and soil acidification has, for example, been notedin field crops due to NH3 volatilisation from a nearby intensive poultry unit (Speirs and Frost, 1987).
Ammonia volatilisation
Although NH4+ is not generally at risk of leaching because of its retention in the soil on negatively
charged cation ion sites, gaseous losses of NH3 do occur in agricultural systems, includingemissions from soil (Figure 2.1). In Europe, the largest source of atmospheric pollution by NH3 isagriculture, although oceans and biomass burning are also important and an estimated 60% ofglobal emissions are from anthropogenic sources (Fowler et al., 1996; Asman et al., 1998).
Gaseous losses of NH3 are most significant from agricultural systems involving livestock(especially intensive production systems) due to the breakdown of urea in animal urine and faeces(Whitehead et al., 1986). Indeed, 92% of all ammonia in Western Europe originates fromagriculture of which about 30% is from livestock (Isherwood, 2000). Ammonia loss is likely to begreatest where high concentrations of ammoniacal N occur. For example, from urine or slurry.Losses of N as NH3 may be as great as 80% of the total when slurry is surface applied to grassland(depending on weather and sward conditions) (Whitehead, 2000).
NITRATES AND NITROGEN LOSS 21

In arable soils, the greatest losses occur when ammoniacal fertilisers or urea are applied underalkaline conditions. Ammonia losses resulting from surface volatilisation are aggravated by highsoil temperatures and drying conditions, but can largely be prevented by placing fertilisers belowthe soil surface or working them in thoroughly with the top soil (Tisdale et al., 1993).
2.4NITROGEN FERTILISER USE IN AGRICULTURE
Sustained agricultural production depends upon the continual fixation of atmospheric N2 toreplenish the N lost from the soil in harvested crops, livestock production and the natural soil lossprocesses, such as leaching and denitrification, already described above.
Since the late 1940s agriculture has undergone rapid modernisation as political and economicsupport created a favourable economic climate in which technical efficiency and technologicaladvancement were encouraged and flourished. In the modern agricultural systems now typical ofareas such as northern Europe, reliance upon legumes has long been superseded by the use ofindustrial N2 fixation and the application of synthetic or mineral N fertilisers. For example, in1850, wheat yields in France where 1000 kg ha−1, by 1950 this had reached 1600 kg ha−1, with afertiliser input of 1.1 million tonnes. By 1994–1996 yields had reached 6772 kg ha−1 with an inputof total fertiliser of 4.8 million tonnes (of which 2.4 million tonnes was N) (Isherwood, 2000). Asimilar pattern has occurred in the UK (Figure 2.5), but importantly since 1982 N fertiliserapplication to winter wheat have remained relatively constant (180 kg N ha−1), whereas as yieldshave increased significantly (from <6.0 to >7.5 t ha−1) (FMA, 2000). This is thought to be largelydue to technological improvements in other aspects of crop production including advances in seedstrategies.
According to Wild (1993), three developments were important in establishing the place offertilisers in modern agriculture:
• Long-term field experiments (e.g. those at the Rothamsted Experimental Station) showed thatcrop yields could be maintained with continuous cropping when the required plant nutrientswere applied as fertiliser. In practice, good management also requires at least some croprotation (e.g. inclusion of break crops for pest and disease control), as well as the addition oforganic matter in some form.
• The industrial synthesis of N fertilisers in the 1920s, based upon the ‘Haber process’, madelarge-scale fertiliser production possible. Later developments in the oil industry provided cheapenergy for the process.
• The introduction of higher-yielding, mainly short-stemmed, varieties of cereal crops which hasmade it profitable to add greater amounts of fertiliser. Improved cultivations, irrigation and theuse of pesticides have also justified the use of more fertiliser.
Global fertiliser N use has dramatically increased since the mid-1940s and by the late 1980s,average fertiliser N rates in the most intensively farmed countries of northern Europe and easternAsia were in the region of 120–550 kg N ha−1 (FAO, 1988). In contrast, the rates of total fertiliserapplications in the countries of sub-Saharan African were in many cases less than 5% of those used
22 CHAPTER 2

in intensive agricultural systems. Between 1993/4 and 1997/8 world fertiliser nutrient usageincreased by 13% (Isherwood, 2000).
An estimated 9.6 million tonnes of N fertiliser are applied to 140 million ha of agricultural landacross Europe, of which half is used on wheat, barley, oats, maize and rye and a quarter ongrassland (Aldinger, 2001). However, fertiliser N usage reached a peak in the mid to late 1980sand is expected to continue to decline to 2006 (by approximately 7% of the current total), from whenit is thought that demand will remain stable (Aldinger, 2001).
Worldwide fertiliser N use has had an enormous impact upon agricultural productivity. It isdifficult to separate out precisely the contribution of fertiliser N to increased output from that ofthe other technological inputs identified above by Wild (1993). Estimates in the UK (Hood, 1982)suggested that fertiliser N had been responsible for 30–50% of crop yield increases, with theremaining 50–70% due to improved varieties, increased agrochemical inputs and betterhusbandry techniques.
Increases in fertiliser N use have not occurred uniformly across all regions. In the UK, increasedfertiliser use has tended to be concentrated in those areas of the country most suited to intensiveagricultural production. These areas have seen significant changes in agricultural land use,notably a decline in traditional ley/arable rotational systems and an increase in continuous arablecropping. In much of eastern England agricultural land use is now dominated by intensive cerealproduction (Edwards and Withers, 1998).
Similar changes have been observed in many parts of the world as the availability of N fertiliserhas helped to facilitate a profound change in cropping patterns. This has lead to a shift from mixedand multiple-cropping systems with relatively closed and self-sustaining N cycles to intensivelymanaged monocultures with large N inputs in the form of synthetic fertilisers (Rosswall andPaustian, 1984). However, in some low-income developing countries this shift has also beenwelcomed, in that the cycle low-input low-output technologies that are perceived to perpetuatehuman drudgery with the ever present risk of hunger is broken (Isherwood, 2000).
With these increases in fertiliser usage and the accompanying changes in global croppingpatterns, increasing attention has focussed on N leakage from the agroecosystem. Some concernscan be linked directly to fertiliser use, others relate to the overall intensification of modern
Figure 2.5 Nitrogen fertiliser use in the UK (‘000s tonnes) (FMA, 1998).
NITRATES AND NITROGEN LOSS 23

agriculture resulting in part from the increased use of fertiliser N and the miscalculation ofrequirements for crop growth.
2.5THE CAUSES OF NITRATE POLLUTION
The application of more N to a soil than can be assimilated by the soil or taken up by a cropcreates a surplus of N. In the UK, in the early 1980s this surplus was in the order of 70 kg ha−1, butis now down to 25 kg ha−1 (FMA, 1998). This surplus is particularly evident on dairy farms whereinputs are often in the region of 400 kg N ha−1 but offtakes may only be in the order of 60–80 kg Nha−1 (Peel et al., 1997). However, it is important to stress that even under well-managed arableland the N surplus may still be in the order of 20kg ha−1 due to the mineralisation of organic N(Goulding, 2000).
The transfer and fate of this surplus has created many environmental concerns in Europe. Themanifestations of the effect of the N surplus produced through agricultural production areconsiderable, especially as this surplus often behaves so conservatively in the soil system. Thecomplexity of the behaviour of N in the agroecosystem has been illustrated in Figure 2.1 and withso many potential diffuse pathways for its loss from the agroecosystem, it is little surprise that theefficiency of applied N used by farmers never approaches 100%. Indeed it may even be as low as10% in some grassland systems (Davies, 2000; Jarvis, 2000).
Over 80% of the total N in river waters is found in the form of NO3−, and in the last 30–40 years,
NO3− levels in many European ground, surface and coastal waters have been gradually rising
(House of Lords, 1990; DoE, 1986; Pau Vall and Vidal, 1999). An analysis of 12 UK rivers for whichdata was available over a 20-year period showed increases in concentration of between 50 and400% (Wilkinson and Greene, 1982). Figure 2.6 shows the mean concentrations of NO3
− in theAnglian region of eastern England from 1980 to 1998 and all are very close to the EU limit for NO3− in waters of 50 mg l−1 (DETR, 2001). The concentration of nitrate in rivers and reservoirs on theChannel island of Jersey have been found to consistently exceed 50 mg NO3
−l−1, due mainly to thelarge proportion of agricultural land that is devoted to the production of early potatoes. Lossesfrom this crop can exceed 100 kg N ha−1 year−1 (Lott et al., 1999).
Rivers with the highest NO3− concentrations are found in the Midlands and south-east England,
with the lowest levels in the mountainous regions of Wales, northern England and Scotland. Thetemporal and regional trends in river water quality are also reflected in lakes and reservoirs. Forexample, there has been a noticeable increase in reservoir NO3-N levels in south-east England.Between 1992 and 1996 over 65% of European rivers had average annual NO3
− concentrationsgreater than 1 mg l−1, and of those 15% were greater than 7.5 mg l−1 (Pau Vail and Vidai, 1999).
Considerable quantities of freshwater are stored in groundwater aquifers, the most important ofwhich are the chalk and Triassic sandstones. Long-term data on the NO3− N concentration ofgroundwater are less common than for surface waters. Nevertheless there is a marked upwardtrend in many catchment areas (Figure 2.7), particularly in the dry eastern areas of England(Wilkinson and Greene, 1982; Davies, 2000; DETR, 2001). This is probably due to the fact thatthe NO3
− concentrations in water draining from agricultural land are dependent upon both theamount leached but also the dilution rate. For example, catchments in the wetter west of the UK
24 CHAPTER 2

have considerable leaching (50 kg N ha−1 year−1) but also greater rainfall, so reducing average NO3− concentrations (Davies, 2000).
Figure 2.6 The mean concentration of NO3− (mg l−1) in river waters from the Anglian region of
Eastern England between 1980 and 1998 (DETR, 2001).
There is little doubt that the intensification of agriculture has been responsible for theincreasing levels of NO3
− in UK ground and surface waters (e.g. Royal Society, 1983; DoE, 1986;House of Lords, 1990; MAFF, 1993; Isherwood, 2000). It cannot be assumed, however, that thisnitrate pollution is linked directly or solely to the increased use of N fertilisers; a correlationbetween the increase in NO3
− pollution and the increase in fertiliser N use does not implycausality. On the contrary, NO3
− loss from agricultural land is a complicated process that involvesmany factors.
Figure 2.7 The change in mean NO3− concentrations (mgl−1) from 1980 to1998 in two groundwater
sources in Eastern England (DETR, 2001).
For example, intensive livestock production systems, produce large quantities of animal manurewhich can present disposal problems with excessive or untimely land application leading to bothdiffuse and/or point source NO3
− pollution (Chapter 5). Furthermore, the surplus N in these
NITRATES AND NITROGEN LOSS 25

systems can be considerable even when a low input minimal-loss strategy is taken (Figure 2.8)(Peel et al., 1997).
The balance of the two major N inputs to agricultural soils, mineral fertilisers and livestockmanures varies greatly across Europe, with the former being of greater importance in Denmark,Germany, Greece, France, Luxembourg, Finland and Sweden and the latter in Belgium and TheNetherlands (Pau Vall and Vidal, 1999).
It is widely acknowledged that a major factor contributing to the increased pollution of theaquatic environment by NO3
− has been the specialisation and intensification of agriculturalenterprises (Chapter 3) (Edwards and Withers, 1998). Notably, the decline in traditional mixedfarming systems (i.e. crops and livestock on the same farm) and the increase in specialist arableand livestock farms. These increase with the intensity of agricultural production and arise where Ninputs (e.g. livestock feed) exceed N outputs (e.g. sales of crops and livestock). Nitrogen surplusesmay be evident at a farm, regional or national level, although their occurrence and extent differsconsiderably between farming types and different countries. Specialist livestock farms (notablydairy, pigs and poultry) are particularly prone to accumulating excessive amounts of N in the formof manure because they use relatively high levels of N fertiliser and/or import large amounts ofconcentrate feed, and are commonly found in geographically concentrated areas (Chapter 5) (Lordet al., 1999).
A specific trend observed in many areas of the UK has been the transition (stimulated largely byUK and subsequently EU agricultural policy) from pastoral and balanced rotational cropping tointensive arable production. The initial ploughing of grassland is a significant cause of NO3
−
leaching and elevated nitrate levels in groundwater have been specifically linked to the increasedcultivation of permanent grassland to produce arable cropland during the 1940–1950s. Guidanceexists to aid the farmer in taking into account the potential release of N following the ploughing ofgrass, which is dependent upon the amount of fertiliser N the grass received each year, theintensity of grass utilisation and time since ploughing (MAFF, 1994a). Importantly, it has alsobeen established that even with this guidance it is possible to greatly over estimate N fertiliserrequirements for cereal crops following grass leys. It is suggested that a reduction in N surplus
Figure 2.8 Measured N inputs, outputs and surpluses (kg N ha−1) for two systems of dairy farm managementin the Minimal Impact Dairy Systems (MIDAS1) experiment (Peel et al., 1997).
26 CHAPTER 2

would more likely be achieved if crop yield was removed as a determinant and an assessment ofmineralisable soil N was made during the growing season (Withers and Sylvester-Bradley, 1999).
Furthermore, intensive arable cropping systems are intrinsically leaky (Powlson, 1988; MAFF,1993) and prone to nitrate leaching since:
• they include periods of incomplete crop cover which are vulnerable to leaching events;• regular cultivations stimulate N mineralisation and increase the NO3
− availablity;• repeated applications of fertiliser N increase the level of potentially mineralisable N in the soil,
thereby increasing the amount of organically-derived NO3− that can be available for leaching;
• there is the risk of direct leaching losses from excessive (surplus due to poor N accounting) orpoorly timed fertiliser N applications and organic manures (Richards et al., 1999; Chambers etal., 2000; Goulding, 2000; MAFF, 2000) (Chapter 5).
Nitrate pollution of ground, surface and marine waters is a major environmental issue in manyEuropean countries, with potential implications for human health, which has attracted considerablepublic and political attention. In contrast to pesticides, however, the control of NO3
− pollution isnot simply a question of rationalising and reducing an agrochemical input as outlined above.While the steady increase in the use of N fertilisers is undoubtedly significant in causing NO3
−
pollution, the overall relationship between the rate of N applied and the incidence of NO3−
leaching is not always clear and direct. Nitrate leaching is caused by a number of factors and arisesfrom a variety of sources, and this potentially complicates the control of NO3
− pollution.
2.6PROBLEMS CAUSED BY NITRATE POLLUTION
There are two key concerns regarding the NO3− pollution of water resources: the quality of drinking
water and public health, and the eutrophication of surface waters. There is also some concernabout increased levels of NO3
− in foods and, although this is not strictly an agricultural pollutionissue, it is given some consideration below.
Nitrate and drinking water quality
Much of Europe’s drinking water is sourced from rivers and groundwaters. However, extensiveleaching of NO3
− from soils into these sources resulted in waters in many areas that approach orexceed the EU maximum mandatory limit concentration of 50 mg NO3
− l−1. An estimated 1 millionpeople in the UK regularly drink water with greater than 50 mg NO3
−l−1 concentration (Packham,1996).
Drinking water normally provides approximately up to 30% of the daily intake of NO3− ingested
by humans, with the rest coming from fruit, vegetables and meat products (Isherwood, 2000).Nevertheless, the ingestion of large amounts of NO3
− in drinking water may be harmful to humanssince, although nitrate is relatively non-toxic and rapidly excreted from the body it can be reducedto potentially toxic nitrite in the mouth and gut (Magee, 1982). The main alleged health hazards ofNO3
− in drinking water are methaemoglobinaemia in young babies (<6 months old) and gastriccancer.
NITRATES AND NITROGEN LOSS 27

It has been known since the 1940s that excessive quantities of NO3− in drinking water may
potentially present a health risk to young, bottle-fed babies (Fraser and Chilvers, 1981). Nitrite,derived from the bacterial reduction of ingested NO3
−, is absorbed into the bloodstream where itcombines with haemoglobin to form methaemoglobin that cannot transport oxygen. Globallythere have been some 3000 cases of methaemoglobinaemia, commonly called ‘blue babysyndrome’ (Conway and Pretty, 1991). Most of these cases occurred prior to 1965 and wereassociated with bacterially contaminated private supplies or bottles. Cases still occur regularly inHungary and Romania although the exact reason is not clearly known (Isherwood, 2000).
Under certain conditions, NO3− reacts with various amines to form nitrosamines and other N-
nitroso compounds. Most of these compounds are strongly carcinogenic in animals (Magee, 1982)and there is evidence, for example, that N-nitroso compounds from tobacco can cause oral cancer(Hecht and Hoffmann, 1989). One site commonly regarded as being at risk from nitrosamines isthe stomach and it has been suggested that an increase in human NO3
− intake may lead to anincreased risk of gastric cancer. However, no link to cancer (or diabetes in children) from thisparticular pathway has been demonstrated in humans (Isherwood, 2000; Wilson et al., 1999).Indeed, some NO3
− may even be beneficial in the reduction of potentially harmful pathogens inthe human gut (Leifert et al., 1999; Wilson et al., 1999). For the moment, however, the gastriccancer debate is somewhat academic since international limits on NO3
− levels have beenimplemented. The 1980 EC Directive on the Quality of Water Intended for Human Consumption,for example, set a ‘maximum allowable concentration’ of 50 mg NO3
− l−1 and a guide level of 25 mgl−1. The WHO reviewed this limit in 1997 in the light of increased scientific evidence on the topic,yet maintained the 50 mg NO3
−l−1 (Isherwood, 2000).
Eutrophication
Many surface waters, such as rivers and lakes, have a limited supply of N and P and are describedas oligotrophic (nutrient poor, low biological productivity). An environmental concern is that theenrichment of these waters with an available source of N and/or P can transform them into beingeutrophic (nutrient rich, high biological activity). The most extreme examples of which are thedramatic algal blooms witnessed in some areas. The main problems associated with eutrophicwaters are:
• changes in nutrient levels may affect the species composition of algal communities, with knock-on effects to other animals in the aquatic/marine food chain;
• decomposing algae and weeds can deoxygenate water causing fish mortality;• algal blooms are often responsible for taints and problems with filtration in surface-drawn
public water supplies, thereby increasing the cost of purification;• surface algal blooms detract from the appearance of waters and impair their amenity value;• some algal species produce ecologically-disruptive toxins which can also be hazardous to
humans.
In most freshwaters in the UK, N is more abundant than P, yet the main cause of eutrophication isgenerally thought be increased levels of P (Chapter 3). However, opinions on this issue areconflicting (HCEC, 1987) and there are several instances where NO3
− is considered to be the
28 CHAPTER 2

specific cause of freshwater eutrophication. Increasing concern is also being expressed aboutmarine eutrophication in UK coastal and estuary waters, and it is thought that this may bespecifically linked to N rather than P levels (Environment Agency, 2000).
Nitrates in food
Nitrate in drinking water is not the only source for consumers, since crops and ultimately foodproducts may also contain significant quantities of NO3
−, indeed in some cases this may be themain source of NO3
− in the diet (RCEP, 1979).Although NO3
− is present in all crops, under some circumstances certain plants can accumulatevery high concentrations. This is principally in the foliage e.g. spinach and cabbage, but may alsooccur in some storage roots (e.g. swedes and turnips) (Conway and Pretty, 1991). How much NO3
−
is in the harvested crop depends upon the amount of fertiliser N added, the crop characteristicsand a variety of environmental factors, including season, sunlight and drought. The NO3
−
concentration of lettuce, for example, increases with increasing fertiliser N application and ishigher in summer crops than those harvested in spring (Maynard et al., 1976).
The full health implications of NO3− in food are again unclear and the overall picture is
complicated by the NO3− intake from drinking water, as well as other dietary sources (e.g. some
meats and cheeses) to which NO3− and nitrite are routinely added as preservatives. Claims that
crops grown with the use of synthetic or mineral fertilisers have less taste and are not asnutritional beneficial as those that are organically grown has been shown to be incorrect (Woese etal., 1995). While organically grown vegetables have higher DM contents and lower NO3
−
concentrations than those receiving synthetic fertilisers, there is little difference in regard to theparameters which affect sensory assessment and nutrition (Isherwood, 2000).
2.7REDUCING NITRATE LOSSES FROM AGRICULTURE
Reduction in N fertiliser applications may be thought of as being the most straightforward methodfor effectively controlling N leakage from agriculture. However, this may not be the case, as profitis usually only made on the last few percent of the yield, and the reduction in N to below theeconomic optimum would sacrifice this profit. It has also been suggested that cutting fertiliser Ninputs would have a limited impact on NO3
− leaching in the short to medium-term (Davies,2000). In the context of the EU and its CAP there is scope for developing a policy on fertiliser Nrestriction and reduce NO3
− pollution which encompasses both the problems of N leakage andoverproduction (DoE, 1986; MAFF, 1994a; MAFF, 1998b,c). To this end, interest has continued tobe expressed in mechanisms such as N quotas and taxation (Clunies-Ross, 1993) (Chapter 9). Forexample in Denmark, the Netherlands and Norway fertiliser plans or schemes of nutrientaccounting are now compulsory; if nutrient applications are over the maximum then fines may beimposed. In Denmark, it is also required to ensure that 65% of the cultivated area is covered with agreen crop in winter, again to reduce NO3
− loss (Isherwood, 2000).Similarly, in England, in the early 1990s, 32 Nitrate Sensitive Areas (NSA) were designated in
order to test practical measures for farmers to control NO3− loss. The areas were selected in regions
NITRATES AND NITROGEN LOSS 29

in which groundwater sources had been shown to have high NO3− concentrations. The practical
measures focussed on reducing the NO3− being generated or remaining in the soil in autumn and
winter and maximising plant uptake of NO3− in autumn and early winter. The farmers were
offered remuneration for adoption of measures being tested by the scheme and although there wasconsiderable variation between individual areas, estimated reductions in NO3
− losses were in theorder of 30% (MAFF, 1994a; Lord et al., 1999).
Further to the NSA scheme and in order to comply with the European Union Nitrate Directive,68 Nitrate Vulnerable Zones (NVZs) were designated in the England and Wales in 1996(Figure 2.9). In each of the zones, which in total cover an area of 600,000 ha, farmers are requiredto control fertiliser N inputs and ensure the appropriate and timely application of manure. Anexample of which may be the top dressing of manures to crops in spring rather than autumn(Dampney et al., 2000). These zones are located in areas that are prone to NO3
− leaching. Forexample, they may have sandy or course textured soils overlying unconfined aquifers that aresignificant sources of drinking water but are at particular risk of exceeding 50 mg NO3
−l−1 (Davies,2000). In contrast to the NSA scheme, the NVZ measures equate to good practice and so there areno financial incentives.
Figure 2.9 Location of nitrate vulnerable zones in England and Wales (DEFRA, 2001).
30 CHAPTER 2

Significant control of N leakage from agriculture will only be achieved through theencouragement of management practices that minimise the opportunities for N (whether fertiliser-,soil- or manure-derived) to accumulate in a form that is susceptible to loss. Management practicesthat need to be encouraged in the UK and Europe to reduce NO3
− leaching (especially during theautumn and winter months) include (MAFF, 1993, 1994b, 1998b, c; Chambers et al., 2000;Dampney et al., 2000; MAFF, 2000):
• ensuring fertiliser N is applied according to the crop’s requirement, which depends upon thecrop species/variety, expected yield and required quality; the soil N supply, including thatreleased from soil organic matter, crop residues and applied manures (calculate fertiliserreplacement values of manures (Box 2.2) and the extent to which available N will be lost beforethe crop takes it up;
• maximising usage of fertiliser technologies (Box 2.3);• avoiding applications of N fertilisers and organic manures in autumn and very early spring
when crop requirements are minimal;• taking special care when applying fertilisers and organic manures on fields where there is a risk
of run-off to surface waters;• ensuring accurate calibration of fertiliser spreading equipment to minimise excessive
application and ensure accurate and even placement (also for manures);• using reduced cultivation techniques (e.g. direct drilling) rather than ploughing in the autumn
to avoid enhancing soil N mineralisation and the production of excessive nitrate levels;• minimising the period when the soil is left bare and susceptible to nitrate leaching by
decreasing the area sown to spring crops and/or increasing the use of winter or cover crops(Box 2.4);
• sowing autumn crops early to increase nitrate uptake prior to the onset of the winter leachingperiod;
• restricting the ploughing of old grassland.
These practices already apply on voluntary basis to all UK farms as part of a comprehensive Codeof Good Agricultural Practice for the Protection of Water (MAFF, 1998a) addressing all aspects ofpotential water pollution on the farm. This is a Statutory Code under the 1989 Water Act, whichmeans that although contravention will not itself give rise to liability, failure to comply with theCode could be taken into account during any legal proceedings.
In the UK, the Department for the Environment, Food and Rural Affairs (DEFRA, formerlyMAFF) currently invests £2.5 million per year on research and development programs studying theloss of NO3
− from agricultural systems (MAFF, 2001). The European Fertiliser ManufacturersAssociation also provides guidance for usage of N fertiliser through codes of best agriculturalpractice for N, focusing on budgets and fertiliser plans, and urea targeting recommendation foreffective use (EFMA, 2001).
The management strategies above fall into two categories: firstly, those that target the input orsource of N into the agricultural system; and secondly, those that tackle reducing NO3
− loss oncethe N is in the soil. Examples of how some of the strategies above may be put into practice and theexpected results in regard to the reduction of NO3
− leakage from agricultural systems are nowconsidered. The results from many of the examples below have been incorporated into practical
NITRATES AND NITROGEN LOSS 31

guidelines farmers can adopt to minimise the risk of NO3− pollution from their farming activities
(Dampney et al., 2000).
Source management—optimisation of fertiliser N use
The optimisation of fertiliser N usage is dependant upon adhering to the first 5 bullet points above.Central to this optimisation process is the calibration, upkeep and maintenance of manure andsynthetic fertiliser spreaders is also crucial in the reduction of N loss, enabling accurateapplication and evenness of spread (Chapter 5). As well as calculation of the available N content ofmanures (Box 2.2) and the application rate, the timing of application, in regard to season and alsopreceding and forecast weather conditions is also crucial. Figure 2.10, emphasises the importanceof timing in regard to manure application and the reduction of N leakage from a freely drainingarable soil. In particular, it demonstrates the need to restrict autumnal applications, especially latein the season when rainfall is high and the manure contains large amounts of mineral N (as in thiscase, which is slurry/poultry manure).
Figure 2.10 The variation in NO3− loss, expressed as a percentage of total N applied from manure
(at 250 kg ha−1) with month of application (Chambers et al., 2000).
BOX 2.2FERTILISER REPLACEMENT VALUE OF MANURES
The value of livestock manures as adjunct/alternatives to artificial inorganic fertilisers iswell established, yet it still appears that some farmers have difficulty in determining theirpotential nutrient value, and so make little allowance for the nutrients supplied in manuresin fertiliser plans (Chapter 5) (Owen, 1998).
Guidance on the fertiliser replacement value of manures can be calculated through a simplecomputer-based decision support program called the Manure Nitrogen Evaluation Routine(MANNER) which was developed through ADAS. Danish and Dutch models already exist but therequired input information is somewhat complex. However, this model incorporates manure Nanalysis, NH3 volatilisation, NO3
− leaching and mineralisation of manure organic N (Chambers et al.,
32 CHAPTER 2

1999). Validation of the model outputs against independently collected data from a range of manuresspread onto a variety of arable treatments has given very good agreement (Chambers et al., 1999).
Cultivation and crop management
As cultivation stimulates N mineralisation, manipulation of the timing and practice of cultivationhas a key role to play in control of nitrate loss from agricultural land. Some of the key factors areincorporated into recommendations for NVZs, and include:
• Minimising the opportunity for N mineralisation by reduced cultivation techniques (e.g. directdrilling) rather than ploughing in the autumn. Experiments conducted at Brimstone Farm,Oxfordshire during the 1980s confirmed that ploughing and secondary cultivations increasedthe loss of nitrate by 21% compared with direct drilling (Goss et al., 1994). Average losses fromwinter wheat over an 8-year period were 30 kg N ha−1 from the ploughed soil and 23 kg N ha−1
from the direct drilled soil. If cultivation is necessary to establish a uniform seedbed, thenlosses can be minimised by shallow ploughing or using a non-inversion rigid tine cultivator orheavy discs as primary cultivation (Johnson et al., 1997).
• The length of time that the soil is left bare and susceptible to nitrate leaching after the harvestof the previous crop has also been found to be important in controlling nitrate losses. Goss etal. (1994) observed that the fate of the decomposing residues from the previous crop exerted astrong control on the magnitude of nitrate losses in arable soils. Hence, sowing autumn cropsearly will increase nitrate uptake prior to the onset of the winter leaching period.
• Restricting the ploughing of old grassland careful management of residues. Grass crops canleave large amounts of residual plant material in or on the soil are potentially considerablesources of N leakage. Residues from crops such as potatoes, peas and oil seeds (and also leycrops) need to be managed and considered in regard to fertiliser plans (Adams and Jan, 1999).Simultaneous sowing a cover crop and lifting potatoes (‘liftsowing’) has been shown to increasethe amount of N in the above ground plant material and reduce the mineralised N in the soilcompared with a conventionally drilled cover crops (Box 2.4) (Buchner et al., 1997).
BOX 2.3FERTILISER PRODUCTS LIMITING N LOSS
Improvements in the utilisation of fertilisers and reductions in the N surplus inagroecosystems are often largely attributable to changes in agricultural practice, fertiliserapplication techniques or crop plant manipulation (Isherwood, 2000). There has beenvery little change in the basic fertiliser product in many years, which is thought to thelack of incentive to invest in the development of a bulky low-priced commodity thatoffers limited scope for product differentiation (Isherwood, 2000).
Slow release or slowly available N compoundsSlow release N fertilisers extend the period over which N is released into the soil compared to
the conventional highly water soluble rapidly available fertilisers. The advantages of this are thatit may be possible to match the requirements of the crop and reduce the need for repeatedfertiliser applications through the growing season (Tisdale et al., 1993).
NITRATES AND NITROGEN LOSS 33
Nitrogen containing fertiliser compounds that are sparingly soluble (or requiring microbialaction for release on reaching the soil) and so slower release sources, in comparison toconventional fertilisers include:
• ureaforms, a generic term for a range of materials which are mixtures of methyleneureas, these may have approximately 40% N in a relatively insoluble form;
• coated urea, in which the solubilisation of the N-containing urea is reduced by coatingwith sulphur or acrylic waxes;
• sparingly soluble simple compounds such as magnesium ammonium phosphate, inwhich solubility is largely controlled by particle size.
These fertilisers tend to be expensive and so their use is often restricted to high-yieldingcash crops and not broad-scale agriculture. They are especially useful when used onirrigated sandy soils from which leaching losses would be expected to be high (Tisdale etal., 1993).
A further approach to the slow release of N is to maximise efficiency and reduce losses byactively attempting to inhibit the micro-organisms responsible for the nitrification reaction (theconversion of NH4
+ to NO3−) in soil. The period of inhibition is temporary and losses of N will be
restricted only if the period of maximum loss (e.g. excessive rainfall) coincides with the period ofinhibition. One of the most common inhibitors is N-Serve or nitrapyrin, acts by inhibitingcytochrome oxidase involved in the oxidation of NH4
+ by Nitrosamonas. Concentrations of 0.1–20mg nitrapyrin kg−1 soil are generally required to produce an effect that lasts for 4–6 weeks.Improvements in fertiliser efficiency and reduction in N loss have been observed using thesemethods. Again, expense of testing and subsequent technology transfer to farmers are given asreasons limited adoption of this alternative.
Other, even less widely used alternatives are nutrient absorption enhancers and microbialinoculants. Absorption enhancers basically restrict the plant availability (and solubility) of addedN through absorption to polymers. Microbial seed inoculants are used to enhance the biological Nfixation and to supplement the synthetic fertilisers. For example, the inoculation of Rhizobiumcan be beneficial to leguminous plants, such as peas and beans (Isherwood, 2000).
Returning arable land to low-input grassland grassland has been shown to be one of the mosteffective strategies in reducing NO3
− leaching (Lord et al., 1999). However, this may not beeconomically possible for many farmers, although rotational grazing of livestock is an option.Unsurprisingly, increased stocking density and fertiliser rates increase NO3
− losses, but it hasbeen suggested that through the use of clover-based swards (that biologically fix atmosphericN) and cutting inputs, losses may be greatly reduced. However, the evidence for this is mixed,and of greater importance is probably the number of livestock grazing days spent in the fieldwhich closely relates to N inputs from animal excreta (Cuttle et al., 1998). Attempts to counterthis input by and reducing fertiliser N inputs, both spatially and temporally and so reduce NO3
−
losses are technically possible, although probably prohibitively expensive (Cuttle et al., 2001).Finally, it is important to realise that one of the most important factors that determine loss
and impact of NO3− from agricultural systems is the weather. While this may be beyond the
control of the farmer, it can nevertheless be taken into consideration. Temperature and rainfallhave a large bearing on drainage and crop growth (and or course N mineralisation). This hasbeen clearly observed by Adams and Jan (1999) who noted that rainfall forecasts 4–6 weeks in
34 CHAPTER 2

advance and calculations of soil moisture deficit could be used to maximise the utilisation ofbiologically fixed N for autumn sown crops and therefore limit N leakage in the form of NO3
−
loss.It is a widely held view that whilst some of the above strategies may, when practised in
isolation, have a modest impact on N loss, it is through the adoption of a combination of thesepractical measures that losses will be reduced (Peel et al., 1997).
BOX 2.4COVER CROPS
As crops are being harvested during the summer the soil beneath them is accumulatingmineral N, in particular NO3
−, derived from the microbial breakdown of soil organicmatter. In autumn, still more NO3
− will be produced which will eventually be leachedfrom the soil in drainage water by winter rain. Growing a cover crop during this ‘leaky’stage in a rotation ‘soaks-up’ much of the excess NO3
− and also increases rates ofevapotranspiration, reducing drainage. Furthermore, the valuable N absorbed iseffectively stored for re-release at a time when, upon incorporation and decomposition ofthe cover crop, it can be used by subsequent crops or used as fodder. The effect of acover crop grown before spring crops (and after barley) on reducing NO3
− leachate inwinter, compared to winter sown cereals is shown in the figure below (Lord et al., 1999).
Research suggests that an early-sown and well-established autumn crop can reduce N losses bybetween 20 and 50 kg ha−1 year−1. However, this may be variable and is dependent upon initialestablishment of the cover crop (Lord et al., 1999). In a 3-year study Harrison et al. (1996)observed that winter rye was most effective in uptake of N when compared to white mustard,oilseed rape, turnips and winter barley, yet still varied between 8 and 27kg ha−1 year−1. This wasthought to be attributable to weather and soil conditions.
The principle objective of sowing a cover crop must be to establish soil cover as soon aspossible, thereby obtaining the maximum autumn growth. Ideally, cover should beestablished and actively growing by mid-September; sowing any later than mid-Octoberis likely to have little effect on NO3
− leaching. It has also been suggested that by delayingcultivation to this time (when the soil is colder and so mineralisation of N slower) mayalso result in reduced N loss (Johnson et al., 1997).
NITRATES AND NITROGEN LOSS 35

In Sweden, undersown catch crops, such as a grass crop sown with spring cereals, have beenshown to be particularly effective in limiting N leakage. Reductions of 40–50% of leached N weremeasured from beneath the plots sown with the catch crop when compared with the control tillagetreatment. The main crop is harvested at the normal time, but the catch crop remains covering thesoil until the following spring. Importantly, the time of sowing is crucial so as to ensure that the maincrop does not suffer adversely from competition effects from the catch crop (Aronsson andTorstensson, 1998). A drawback is that weed, pest and disease problems are thought to be moreprevalent when cover and catch crops are used (Goulding, 2000).
To conclude, agricultural land is the main source of nitrate in most UK groundwaters andrivers. Extensive research has been conducted throughout Europe over the last three decades,such that the relationship between nitrate inputs, outputs and transformations is now wellunderstood. The EU Nitrates Directive, adopted in 1991, places the onus on Member States toreduce nitrate pollution by introducing controls on agricultural practices where theconcentration of nitrate in water exceeds, or is risk of exceeding 50 mg NO3l−1. Guidance isavailable from many sources, for example DEFRA and the EA, to demonstrate the mosteffective way of reducing nitrate losses in water draining from agricultural land. Currentlegislation has targeted vulnerable catchments that have been designated as NVZs. In theseareas, farmers are required to change their practice to reduce pollution risk, with no directcompensation. The NSAs scheme, which provides payment for loss of income associated withchanges in practice, comes to an end in 2005. The future extension of schemes to limit nitratelosses from agricultural land will depend on the success of the NVZ scheme and the on-goingdebate surrounding the health risks associated with the supply of drinking water containingelevated nitrate concentrations.
Technological developments will play a major role in the continuing advances made toenhance the efficiency of nitrogen use in agriculture. For example, targeting N fertiliser inputsin cereal systems through the application of precision farming techniques offers the opportunityto further reduce nitrate losses. Considerable investment in global positioning systemequipment and yield monitoring combine harvesters, together with a detailed programme ofsoil mineral nitrogen analyses is necessary to provide the information from which variable rateapplications of fertiliser and other inputs can be made (Welsh et al., 1999; Taylor et al., 2000).Research has demonstrated that the main factors influencing the optimum N rate are soil typeand supply of N from the soil. Further work is on-going across Europe to assess the condition ofthe cover canopy during the season, with the aim of utilising variable rate applicationtechnology to adjust inputs to optimum levels. The techniques look promising. For example,AGCO/ADAS (1999) observed that adjusting N inputs based on variations in soil mineral Nassessment within fields lead to lower fertiliser N inputs and reduced soil N levels in residueswhile maintaining yields at levels equivalent to conventional winter wheat crops.
The net effect of the increased uptake of new technology, together with the adoption ofnutrient-conserving practices based on more traditional approaches will be a continuedreduction of N losses from agricultural land. In parallel with these environmentally beneficialchanges in farming practice, economic benefits will accrue to individual farmers due to themore efficient use of inputs, machinery and farm labour.
36 CHAPTER 2

REFERENCES
Adams, W.A. and Jan, M.T. (1999) Utilization of nitrogen accumulated by a clover containing ley followingcultivation. Soil Use and Management 15, 247–253.
Addiscott, T. (1996) Fertilisers and nitrate leaching. In: Issues in Environmental Science and Technology 5:Agricultural Chemicals and the Environment (Eds R.E.Hester and R.M.Harrison). The Royal Society ofChemistry, Letchworth, pp. 1–26.
AGCO/ADAS (1999) Yield Mapping and Precision Farming: an Appraisal of Potential Benefits on RecentResearch and Farmer Experience. AGCO, Coventry, pp. 17.
Aldinger, H. (2001) The Fertiliser Sector in Western Europe, Market Trends and Industry Outlook.Presented to the 2nd International Conference on the Chemical and Petrochemical Industries of Russiathe CIS and Central and Eastern Europe. Budapest, 23–24th April. European Fertiliser ManufacturersAssociation, Brussels.
Arah, J.R.M., Smith, K.A., Crichton, I.J. and Hesheng, L. (1991) Nitrous oxide production and denitrificationin Scottish soils. Journal of Soil Science 42, 351–367.
Aronsson, H. and Torstensson, G. (1998) Measured and simulated availability and leaching of nitrogenassociated with frequent use of cash crops. Soil Use and Management 14, 6–13.
Asman, W.A.H., Sutton, M.A. and Schjørring, J.K. (1998) Ammonia: emission, atmospheric transport anddeposition. New Phytologist 139, 27–48.
Brady, N.C. and Weil, R.R. (1999) The Nature and Properties of Soil. 12th Edition. Prentice Hall, NewJersey.
Buchner, W., Knechtges, H. and Sroka, J. (1997) Liftsowing’ at the potato harvest. For a faster uptake ofnitrogen by cover crops. Kartoffelbau 48, 308–310.
Chambers, B.J., Lord, E.I., Nicholson, F.A. and Smith, K.A. (1999) Predicting nitrogen availability and lossesfollowing application of organic manures to arable land: MANNER. Soil Use and Management 15, 137–143.
Chambers, B.J., Smith, K.A. and Pain, B.F. (2000) Strategies to encourage better use of nitrogen in animalmanures. Soil Use and Management 16, 157–161.
Clunies-Ross, T. (1993) Taxing nitrogen fertilisers. The Ecologist 23, 13–17.Conway, G.R. and Pretty, J.N. (1991) Unwelcome Harvest: Agriculture and Pollution. Earthscan, London.Cuttle, S.P., Scurlock, R.V. and Davies, B.M.S. (1998) A 6-year comparison of nitrate leaching from grass/
clover and N-fertilized grass pastures grazed by sheep. Journal of Agricultural Science 131, 39–50.Cuttle, S.P., Scurlock, R.V. and Davies, B.M.S. (2001) Comparison of fertiliser strategies for reducing nitrate
leaching from grazed grassland, with particular reference to the contribution from urine patches. Journalof Agricultural Science 136, 221–230.
Dampney, P.M.R., Lord, E.I. and Chambers, B.J. (2000) Development of improved advice for farmers andadvisers. Soil Use and Management 16, 162–166.
Davies, D.B. (2000) The nitrate issue in England and Wales. Soil Use and Management 16, 142–144.De Klein, C.A.M., Sherlock, R.R., Cameron, K.C. and Van der Weerden, T.J. (2001) Nitrous oxide emissions
from agricultural soils in New Zealand—a review of current knowledge and directions for future research.Journal of The Royal Society of New Zealand (in press).
DoE (1986) Nitrate in Water: a report by the Nitrate Co-ordination Group. Department of the EnvironmentPollution, HMSO, London, Paper No. 26.
DETR (2001) Chapter 3 Inland Water Quality and Use. In: Digest of Environmental Statistics. Departmentof the Environment, Transport and the Regions, London.
Edwards, A.C. and Withers, P.J.A. (1998) Soil phosphorus management and water quality: a UK perspective.Soil Use and Management 14, 124–130.
EFMA (2001) Sustainable Soil Management an Achievable Goal. European Fertiliser ManufacturersAssociation, Brussels.
NITRATES AND NITROGEN LOSS 37
Environment Agency (2000) Aquatic Eutrophication in England and Wales: a Management Strategy.Department of the Environment, Transport and the Regions.
FAO (1988) Fertiliser Yearbook Volume 37. Food and Agriculture Organisation, Rome.FMA (1998) The Fertiliser Review 1998. Fertiliser Manufacturers Association, Peterbourough.FMA (2000) The Fertiliser Review 2000. Fertiliser Manufacturers Association, Peterbourough.Folorunso, O.A. and Rolston, D.E. (1984) Spatial variability of field-measured denitrification gas fluxes. Soil
Society of America Proceedings 48, 1214–1219.Fowler, D., Sutton, M.A., Skiba, U. and Hargreaves, K.J. (1996) Agricultural nitrogen and emissions to the
atmosphere. In: Issues in Environmental Science and Technology 5: Agricultural Chemicals and theEnvironment (Eds R.E.Hester and R.M.Harrison). The Royal Society of Chemistry, Letchworth, pp. 57–84.
Fraser, P. and Chilvers, C. (1981) Health aspects of nitrate in drinking water. Science of the TotalEnvironment 18, 103–116.
Goss, M.J., Howse, K.R., Lane, P.W., Christian, D.G. and Harris, G.L. (1994) Losses of nitrate-nitrogen inwater draining from under autumn-sown crops established by direct drilling or mouldboard ploughing.Journal of Soil Science 44, 35–48.
Goulding, K.W.T., Bailey, N.J., Bradbury, N.J., Hargreaves, P., Howe, M., Murphy, D.V., Poulton, P.R. andWillison, T.W. (1998) Nitrogen deposition and its contribution to nitrogen cycling and associated soilprocesses. New Phytologist 139, 49–58.
Goulding, K. (2000) Nitrate leaching from arable and horticultural land. Soil Use and Management 16, 145–151.
Harrison, R., Davies, D.B., Peel, S., van Cleemput, O., Hofman, G. and Vermoesen, A. (1996) Nitrogen uptakeby cover crops at 7 sites in the UK: 1990–1993. Developments in Plant and Soil Sciences 68, 203–205.
Haygarth, P.M., Chapman, P.J., Jarvis, S.C. and Smith, R.V. (1998) Phosphorus budget for two contrastinggrassland farming systems in the UK. Soil Use and Management 14, 160–167.
HCEC (1987) Pollution of rivers and estuaries, Vol. II: Minutes of evidence and appendices. House ofCommons Environment Committee, Third Report, Session 1986–87. HMSO, London.
Hecht, S.S. and Hoffmann, D. (1989) The relevance of tobacco and specific nitrosamines to human cancer.Cancer Surveys 8, 273–294.
Hood, A.E.M. (1982) Fertiliser Trends in Relation to Biological Productivity Within the UK. PhilosophicalTransactions of the Royal Society, London, B 296, 315–328.
House of Lords (1990) Nitrate in Water. 16th Report of the Select Committee on the European Communities(HL Paper 73). HMSO, London.
Isherwood, K.F. (2000) Fertiliser Use and the Environment. (Revised Edition). International FertiliserIndustry Association. Paris.
Jansson, S.L. and Persson, J. (1982) Mineralisation and immobilisation of soil nitrogen. In: Nitrogen inAgricultural Soils (Ed. Stevenson, F.J.), Agronomy Monograph No. 22, American Society of Agronomy,Madison, Wisconsin, pp. 229–252.
Jarvis, S.C. (2000) Progress in studies of nitrate leaching from grassland soils. Soil Use and Management16, 152–156.
Jenkinson, D.S. (1990) An introduction to the global nitrogen cycle. Soil Use and Management 6, 56–60.Johnson, P.A., Shepherd, M.A. and Smith, P.N. (1997) The effects of crop husbandry on nitrate leaching from
a shallow limestone soil growing a five course combinable crop rotation. Soil Use and Management 15,17–23.
Laity, J. (1948) Profitable Ley Farming. Crosby Lockwood & Son Ltd, London.LaRue, T.A. and Patterson, T.G. (1981) How much nitrogen do legumes fix? Advances in Agronomy 34, 15–
38.Leifert, C., Fite, A., Hong, Li., Golden, M., Mowet, A. and Frazer, A. (1999) Human health effects of nitrate.
IFA Conference on managing plant nutrition. Barcelona, July 1999.
38 CHAPTER 2

Lord, E.I., Johnson, P.A. and Archer, J.R. (1999) Nitrate sensitive areas: a study of large scale control of nitrateloss in England. Soil Use and Management 15, 201–207.
Lord, E.I. and Anthony, S.G. (2000) MAGPIE: A modeliing framework for evaluating nitrate losses atnational and catchment scales. Soil Use and Management 16, 167–174.
Lott, J., Parkinson, R.J., Fuller, M.P. and Beattie, L. (1999). Evaluating strategies to reduce nitrate andphosphate loss to surface water from agricultural land on Jersey. International Association ofHydrological Sciences Publication 257, 221–228.
Mackenzie, G.H. and Traureau, J.C. (1997) Recommendation Systems for Nitrogen. The Fertiliser Society.Proceedings No. 403.
MAFF (1993) Solving the Nitrate Problem: progress in research and development. Publication No. 1092,Ministry of Agriculture, Fisheries and Food Publications, London.
MAFF (1994a) The Nitrate Sensitive Areas Scheme. Ministry of Agriculture, Fisheries and Food, London.MAFF (1994b) Fertiliser Recommendations for Agricultural and Horticultural Crops. Ministry of
Agriculture, Fisheries and Food Reference Book 209. HMSO, London.MAFF (1998a) Code of Good Agricultural Practice for the Protection of Water. Revised 1998. Ministry of
Agriculture, Fisheries and Food, London.MAFF (1998b) Guidelines for Farmers in Nitrate Vulnerable Zones. Ministry of Agriculture, Fisheries and
Food, London.MAFF (1998c) Manure Planning in Nitrate Vulnerable Zones. Ministry of Agriculture, Fisheries and Food,
London.MAFF (2000) Towards Sustainable Agriculture: Pilot Set of Indicators. Ministry of Agriculture, Fisheries
and Food, London.MAFF (2001) Factors affecting the fate of organic nitrogen. Environmental R+D Newsletter Ministry of
Agriculture, Fisheries and Foods, London. No. 7, p. 8.Magee, P.N. (1982) Nitrogen as a potential health hazard. Philosophical Transactions of the Royal Society
London B 296, 543–550.Maynard, D.N., Barker, A.V., Minotti, P.L. and Peck, N.H. (1976) Nitrate accumulation in vegetables.
Agronomy Journal 28, 71–118.Murphy, D.V., MacDonald, A.J., Stockdale, E.A., Goulding, K.W.T., Fortune, S., Gaunt, J.L., Poulton, P.R.,
Wakefield, J.A., Webster, C.P. and Wilmer, W.S. (2000) Soluble organic nitrogen in agricultural soils.Biological Fertility of Soils 30, 374–387.
Owen, L. (1998) Use of Organic Manure; Storage of Liquid Fertilisers. The British Survey of FertiliserPractice, 1994, Edinburgh University Data Library, pp. 18.
Packham, R.F. (1996) Drinking water quality and health. In: Pollution, Causes, Effects and Control (Ed.R.M.Harrison). 3rd Edition. The Royal Society of Chemistry, Cambridge, pp. 52–65.
Pau Vall, M. and Vidal, C. (1999) Nitrogen in agriculture. In: Agriculture, Environment, Rural Development:Facts and Figures-A Challenge for Agriculture. European Union, Brussels.
Parsons, J.W. (1984) Green manuring. Outlook on Agriculture 13, 20–23.Peel, S., Chambers, B.J., Harrison, R. and Jarvis, S.C. (1997) Reducing nitrogen emssions from complete
dairy farm systems. In: Gaseous Nitrogen Emissions from Grasslands (Eds S.C.Jarvis and B.F.Pain).CAB International, Wallingford, pp. 383–390.
Powlson, D.S. (1988) Measuring and minimising losses of fertiliser nitrogen in arable agriculture. In:Nitrogen Efficiency in Agricultural Soils (Eds D.S.Jenkinson and K.A.Smith). Elsevier, London, pp. 231–245.
Powlson, D.S. (1993) Understanding the soil nitrogen cycle. Soil Use and Management 9, 86–94.Powlson, D.S. (2000) Tackling nitrate from agriculture. Soil Use and Management 16, 141.Rahn, C.R., Paterson, C.D., Willison, T.W. and Lillywhite, R. (1996) The fate of nitrogen from brassica crop
residues in intensive cropping rotations. In: Proceedings of COST 814 Conference on ‘Nitrogen supply
NITRATES AND NITROGEN LOSS 39

and nitrogen fixation of crops for cool wet climates’. Trømso, Norway. European Commission, Brussels,pp. 219–226.
Richards, I.R., Turner, I.D.S. and Wallace, P.A. (1999) Manure and fertiliser contributions to soil mineralnitrogen and the yield of forage maize. Nutrient Cycling in Agroecosystems 55, 175–185.
RCEP (1979) Agriculture and Pollution. 7th Report of the Royal Commission on Environmental Pollution(Cmnd 7644). HMSO, London.
RCEP (1996) Sustainable Use of Soil. Royal Commission on Environmental Pollution 19th Report (Cm 3165).HMSO, London.
Rosswall, T. and Paustian, K. (1984). Cycling of nitrogen in modern agricultural systems. Plant and Soil 76,3–21.
Rowell, D.L. (1994) Soil Science, Methods and Applications. Longman Scientific and Technical, Harlow.Royal Society (1983) The Nitrogen Cycle of the United Kingdom: a Study Group Report. Royal Society,
London.Schlesinger, W.H. (1997) Biogeochemistry, an Analysis of Global Change. 2nd Edition. Academic Press, San
Diego.Simmelsgaard, S.E. (1999) The effect of crop, N-level, soil type and drainage on nitrate leaching from Danish
soil. Soil Use and Management 14, 30–36.Smith, K.A. and Arah, J.R.M. (1990) Losses of Nitrogen by Denitrification and Emissions of Nitrogen Oxides
from Soils. Proceedings No. 299, The Fertiliser Society, London.Speirs, R.B. and Frost, C.A. (1987) The enhanced acidification of a field soil by very low concentrations of
atmospheric ammonia. Research and Development in Agriculture 4, 83–86.Taylor, J.C., Wood, G.A., Welsh, J.P. and Knight, S. (2000) Exploring management strategies for precision
farming of cereals assisted by remote sensing, aspects of applied biology. Remote Sensing in Agriculture60, 53–60.
Tisdale, S.L, Nelson, W.L., Beaton, J.D. and Halvin, J.L (1993) Soil Fertility and Fertilisers. 5th Edition.Prentice Hall, New Jersey.
Welsh, J.P., Wood, G.A., Godwin, R.J., Taylor, J.C., Earl, R., Blackmore, B.S., Spoor, G. and Thomas, G.(1999) Developing strategies for spatially variable nitrogen application. In: Precision Agriculture ’99(Ed. J.Stafford). Proceedings of the 2nd European Conference on Precision Agriculture, OdenseCongress Centre, Denmark, pp. 729–738.
White, R.E. (1997) Principles and Practice of Soil Science, the Soil as a Natural Resource. 3rd Edition.Blackwell Science Ltd, Oxford.
Whitehead, D.C., Pain, B.F. and Ryden, J.C. (1986) Nitrogen in UK grassland agriculture. Journal of theRoyal Agricultural Society of England 147, 190–201.
Whitehead, D.C. (2000) Nutrient Elements in Grassland: Soil-Plant-Animal Relationships. CABI Publishing,Wallingford.
Wild, A. (1988) Plant nutrients in soil: nitrogen. In: Russell’s Soil Conditions and Plant Growth (11thEdition) (Ed. A.Wild), Longman, Harlow, pp. 652–694.
Wild, A. (1993) Soils and the Environment: an Introduction. Cambridge University Press, Cambridge.Wilkinson, W.B. and Greene, L.A. (1982) The water industry and the nitrogen cycle. Philosophical
Transactions of the Royal Society London B 296, 459–475.Wilson, W.S., Ball, A.S. and Hinton, R.H. (Eds) (1999) Managing the risk of nitrates to humans and the
environment. Proceedings of a Masterclass Conference Organised by the Agricultural Sector andToxicology Group of the Royal Society of Chemistry. The Royal Society of Chemistry, Cambridge.
Withers, P.J.A. and Sylvester-Bradley, R. (1999) Nitrogen fertiliser requirements of cereals following grass.Soil Use and Management 15, 221–229.
Woese, K., Lange, D., Boess, C. and Bögl, K.W. (1995) Ökologisch und konventionell erzeugte Lebensmittel imVergleich. Eine Literaturstudie. Bundesinsitut für gesundheitlichen Verbraucherschutz undVerterinärmedizin 4.
40 CHAPTER 2

3Phosphorus
3.1INTRODUCTION
Before the 1980s research into phosphorus (P) in agro-ecosystems focussed on crop growth, yieldand quality. Contemporary interest in the environmental behaviour of P is now largelyconcentrated on its movement to rivers, lakes and seas. It was thought that, unlike nitrates,phosphates were held so strongly within the soil matrix that movement to natural waters wasnegligible. However, the increased incidence of eutrophic waters, algal blooms and otherecologically damaging effects for which P is a major contributing factor, indicate this not to be thecase. Agricultural land is now recognised to be the largest non-point source of P reaching surfacewaters. Morse et al. (1993) estimate that 43% of the phosphorus inputs into surface waters in theUK are attributable to agriculture. The build-up of P levels in soils over the last 45 years also hadan impact upon plant species diversity in grassland meadows and semi-natural habitats. Thischapter addresses:
• the reasons for the increase in P movement within the environment;• the potential environmental and human health implications of this increase;• strategies to minimise P losses and maximise usage within agroecosystems.
Phosphorus and agriculture
Phosphorus is a macronutrient that is essential to all forms of life. The most essential functions ofP in organisms are in energy storage and transfer and as a component of DNA, vital for the passingon of heredity traits from one generation to another. Phosphorus is only found in combinationwith other elements due to the reactive nature of elemental P.
Phosphorus, water and N tend to be the dominant yield-limiting factors for agricultural cropgrowth. Concentrations of P in plants are normally in the range of 0.1–0.4% (expressed by weighton a DM basis), which is very much lower than those of N (1.5%) and K (1%). However, there isconsiderable variation in P content between species, with seed bearing and root crops having agreater P demand. There is also considerable variation in P content between parts of the sameplant, with seeds and grain showing higher contents than straw, stalks and stover (Table 3.1).
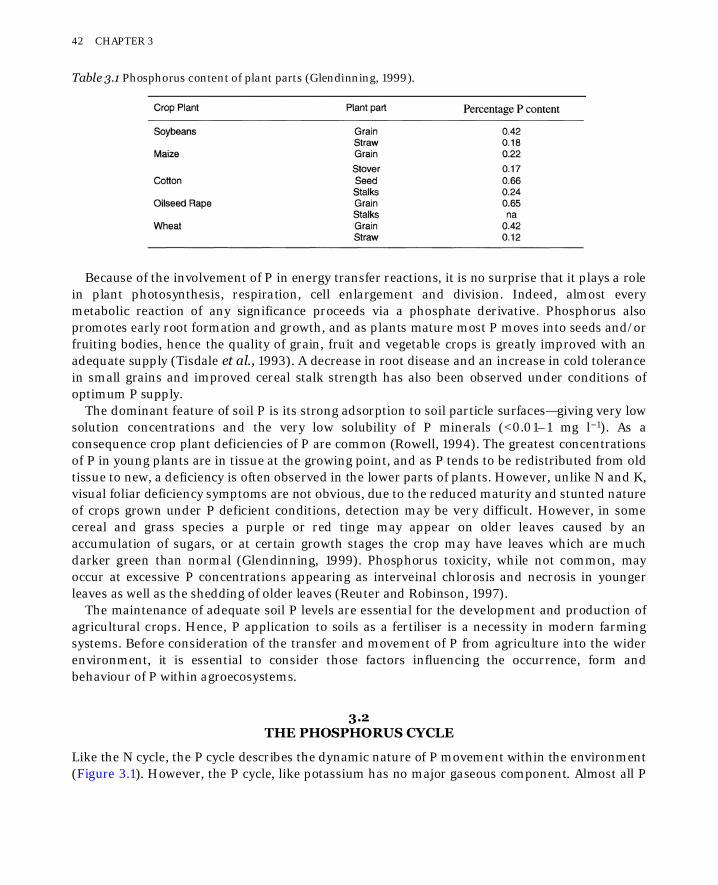
Because of the involvement of P in energy transfer reactions, it is no surprise that it plays a rolein plant photosynthesis, respiration, cell enlargement and division. Indeed, almost everymetabolic reaction of any significance proceeds via a phosphate derivative. Phosphorus alsopromotes early root formation and growth, and as plants mature most P moves into seeds and/orfruiting bodies, hence the quality of grain, fruit and vegetable crops is greatly improved with anadequate supply (Tisdale et al., 1993). A decrease in root disease and an increase in cold tolerancein small grains and improved cereal stalk strength has also been observed under conditions ofoptimum P supply.
The dominant feature of soil P is its strong adsorption to soil particle surfaces—giving very lowsolution concentrations and the very low solubility of P minerals (<0.01–1 mg l−1). As aconsequence crop plant deficiencies of P are common (Rowell, 1994). The greatest concentrationsof P in young plants are in tissue at the growing point, and as P tends to be redistributed from oldtissue to new, a deficiency is often observed in the lower parts of plants. However, unlike N and K,visual foliar deficiency symptoms are not obvious, due to the reduced maturity and stunted natureof crops grown under P deficient conditions, detection may be very difficult. However, in somecereal and grass species a purple or red tinge may appear on older leaves caused by anaccumulation of sugars, or at certain growth stages the crop may have leaves which are muchdarker green than normal (Glendinning, 1999). Phosphorus toxicity, while not common, mayoccur at excessive P concentrations appearing as interveinal chlorosis and necrosis in youngerleaves as well as the shedding of older leaves (Reuter and Robinson, 1997).
The maintenance of adequate soil P levels are essential for the development and production ofagricultural crops. Hence, P application to soils as a fertiliser is a necessity in modern farmingsystems. Before consideration of the transfer and movement of P from agriculture into the widerenvironment, it is essential to consider those factors influencing the occurrence, form andbehaviour of P within agroecosystems.
3.2THE PHOSPHORUS CYCLE
Like the N cycle, the P cycle describes the dynamic nature of P movement within the environment(Figure 3.1). However, the P cycle, like potassium has no major gaseous component. Almost all P
Table 3.1 Phosphorus content of plant parts (Glendinning, 1999).
42 CHAPTER 3

in terrestrial ecosystems is derived from weathering of minerals, such as apatite. Unlike N, themajor source of mineral P is not provided by microbial reactions. In many ecosystems theorganically associated P is the greatest source of available P for biogeochemical cycling(Schlesinger, 1997). While certain P solubilising mechanisms exists to increase availability inimpoverished soils (Box 3.1) there is no process akin to N-fixation which can have such a markedaffect upon N soil status. These factors coupled with the relatively low P content of most rocks andthe limited bioavailability of P in soils has meant that many organisms in terrestrial and marineecosystems survive due to the efficient recycling of organic forms of P.
Figure 3.1 The agricultural P cycle (adapted from Glendinning, 1999).
Phosphorus inputs and outputs
Perturbations in the P cycle caused by anthropogenic activity are considerable, but themanifestations of these vary greatly in magnitude and scale, depending to a large extent upon thefluxes within the cycle. The management of soils for agricultural use has a considerable influenceupon the P cycle, particularly with respect to the dramatic shift in the balance between P inputsand offtakes. Calculation of the annual agricultural P budget within the EU has shown that in allcountries a surplus exists (P inputs to the farming systems such as inorganic and organicfertilisers are more than the rates of outputs in the form of crops and livestock). Belgium and theNetherlands have the greatest annual surpluses in the EU of 40 kg P ha−1 (Brouwer et al., 1995). Ithas been estimated that in the EU the P status of agricultural soils has increased by 45 milliontonnes during the last 30 years—equivalent to >10kg ha−1 year−1 (Tunney, 1992). In the UK, a
PHOSPHORUS 43

national assessment of inputs and outputs of P to a range of farming systems suggested an annualsurplus of approximately 16 kg P ha−1.
One of the results of this imbalance between inputs and outputs (or ‘offtakes’) is a build up insoil P to levels that are of environmental rather than agronomic concern (Daniel et al., 1998). Theincrease in soil P content over time was, and in some scientific circles, still is, thought to bebeneficial to long-term soil fertility (Glendinning, 1999). In the UK, between 1979 and 1985, anincrease in topsoil (0–15 cm) P of over 200 mg kg−1 has occurred under both arable and grasslandsystems, representing an increase of almost 20% (MAFF, 2000a).
Across Europe, grain production systems are regarded as having the greatest P surplus, with269 kg ha−1, compared with an average of all-farming systems of 19 kg ha−1 (Brouwer et al., 1995).The importance of each farming category in terms of percent land area and percent P surplus isshown for the UK in Figure 3.2. In catchments where similar farming systems operate, such as pigand poultry production, the large P surpluses may be expected to present potential environmentalproblems to local drainage channels (Haygarth et al., 1998; MAFF, 2000b).
The relationship between surplus and loss of P from agricultural land is not solely governed bythe size of that surplus. Indeed, Edwards and Withers (1998) suggest that losses from farmingsystems are often independent of the surplus and often related to changes in farming systemswhich have reduced residence times within components of the P cycle and increased the rates oftransfer between them. Such changes are thought to include increases in livestock density, areasown to winter cereals, area which is underdrained and a shift to slurry-based livestock systems, withexpansion of indoor slurry based systems being a major culprit (Withers, 1996). Total andextractable or ‘available’ P loss is always greatest from cultivated compared to uncultivated soils.
This excess of P inputs over outputs in agricultural systems highlights the relatively poorefficiency of P usage within European agricultural systems and gives an indication of the potentialfor leakage. The following headings will address the individual components contributing to the Pbalance and assess their environmental importance and impact upon the P cycle.
Fertilisers
It has been broadly accepted in intensive agriculture systems that good crop yields requireappreciable applications of P to most types of soil. The birth of the modern P fertiliser industrywas some 160 years ago. The acidulation of rock phosphates with sulphuric acid to producesoluble phosphates in 1840 still forms the basis of the modern day process (Tisdale et al., 1993).
Rock phosphates (Ca10 (PO4)6(X)2, where X is either F, OH, or Cl) or apatites are the originalsource of P used in all P fertiliser manufacture. Although under some circumstances rockphosphates may be used directly for the supply of plant P if finely ground, for the most part theytend not to be used because of relatively low P content (14–17%), low solubility and inconvenienceof handling compared with other P fertilisers.
44 CHAPTER 3

Figure 3.2 The contribution of farming types to the UK annual P surplus, as a percentage of thetotal agricultural land (Edwards and Withers, 1998). *Remaining includes mixed farms andhorticulture.
Rock phosphate and the most commonly used agricultural fertilisers, their P content andavailability are shown in Table 3.2. Other major elements contained in these fertilisers are alsoshown and may be used in the manufacture of ‘compound’ NPK fertilisers. Up until the early1960s triple super phosphate (TSP) was the most commonly used P fertiliser source, especially inthe USA, but since then the ammonium phosphates have become increasingly popular, although,in Australia and New Zealand, single super phosphate and TSP are still widely used. Thepopularity of ammonium phosphates is due not only to increased P content and solubility but alsoto the fact that increased plant P uptake occurs when ammonium is included in P fertiliser(Tisdale et al., 1993).
The efficiency of applied P fertilisers in terms of crop uptake is dependent upon many soil,environment and management factors but is generally between 11 and 38% (Withers andSharpley, 1995). While this may seem particularly inefficient, it does compare favourably withlivestock production systems (Chapter 5).
It is important to note that many of the factors influencing native or indigenous soil P behaviouralso affect fertiliser P additions. Therefore, whilst Table 3.2 gives figures for fertiliser P efficiencyin terms of crop uptake these also vary upon addition to soil.
Atmospheric inputs
Atmospheric P cycling is, unlike N, limited, with no major gaseous phase. The annual cycling of Pthrough the atmosphere as dust and sea spray is less than 1×10¹² g, compared with 21×1012 gwhich is carried by rivers to the sea (Schlesinger, 1997). Rainfall tends to have very low P content(<0.1–0.05 kg ha−1 year−1) and more P reaches the soil surface as dry deposition from wind blowndust or soil (White, 1997). In the UK, the annual atmospheric deposition of P onto soil varies
PHOSPHORUS 45

according to geographic location, but is thought to range from 0.11 to 0.22 kg ha−1 for rural areas(Haygarth et al., 1998).
Table 3.2 Common P containing fertilisers and their P content and availability (Tisdale et al., 1993;Pierzynski et al., 2000).
Animal manures
In the UK, over 200 million tonnes of manure from livestock is produced annually, containingaround 119,000 tonnes of P. The recycling of this manure to agricultural land (55% to arable landand 45% to grassland) is estimated to have a potential value of over £80 million based on the totalP (Smith et al., 1998).
Like N, almost 70% of the P consumed by cattle and over 80% consumed by sheep inconcentrated feeds, fresh grass and silage is excreted (Haygarth et al., 1998). From a range oflivestock production systems in a selection of European countries the recycling of P was found tobe between 10 and 34%. Phosphorus supplements in livestock feeds are particularly important, astoo little P may cause reduced milk yields, poor live weight gains, reduced food intakes andfertility. However, too much will mean more P will be excreted, therefore a careful balance isrequired (Withers and Sharpley, 1995).
Phosphorus present in manure and slurry may be in a range of forms, from solid-phaseinorganic P to dissolved organic P complexes. However, the composition and content of manure ishighly variable and depends upon many factors including the proportion of mineral P in theanimal feed, fertiliser P additions to grazed pasture and livestock type and age (Table 3.2). Storage of animal manures tends to increase the inorganic P content as microbial mineralisationbreaks down the organic P fraction. While the P present in manures from livestock tends to beonly slowly available compared with water-soluble inorganic fertilisers, it may be totally availablein the long-term (Withers and Sharpley, 1995). This coupled with the relatively poor efficiency of P
46 CHAPTER 3

recycling in livestock suggests that large surpluses and potential soil accumulation may occur inareas where livestock production systems predominate.
P transformations in soil
Phosphorus transformations may involve the microbially mediated mineralisation andimmobilisation reactions of soil organic P. Like N transformations in soil, the reactions associatedwith organically associated P are affected by a range of soil, organic substrate, climatic andseasonal factors (Sharpley and Halvorson, 1994). Both mineralisation and immobilisationreactions take place simultaneously, with the former resulting in the release inorganic P intosolution and the latter the conversion of inorganic P to less readily available biochemicalcompounds. The net reaction depends upon total organic P and organic carbon contents of theresidue. Some organic substrates are extremely resistant to microbial degradation, but almost allorganic phosphates of plant origin may be broken down eventually by the phosphatase enzyme inmicrobes (Tisdale et al., 1993).
Table 3.3 Effect of carbon and P ratios on microbially mediated organic P transformations (SoilFertility and Fertilisers, 5/E by Tisdale, S. © Reprinted by permission of Person Education, Inc.,Upper Saddle River, NJ).
Table 3.3 shows the importance of the ratio of the carbon to P content of the organic matter. Theaddition of organic manures and wastes to soils has been shown to elevate total inorganic P levelsand not, as would be expected, total organic P, highlighting the role of mineralisation reactions.
Distribution of P in soil
The physical and chemical distribution of P within soils has an enormous bearing upon theenvironmental behaviour and subsequent management of P both in agricultural systems and thebroader environment. Phosphorus in soils is present in inorganic or organic forms with totalconcentrations in topsoils of 100–3000 mg kg−1 (Laegreid et al., 1999). Phosphorus may becategorised into a series of nutrient pools:
• non-labile inorganic P—particularly in Al, Fe and Ca minerals (or occluded P, only becomingavailable to plants and organisms very slowly);
• labile P—P adsorbed to soil particles;• biomass P—P associated with living organisms;• organic P—P associated with non-living soil organic matter;• dissolved P—P in both inorganic and organic forms.
PHOSPHORUS 47

There are a range of organic P compounds in soils including nucleic acids, inositol phosphates andphospholipids, but only 50% of soil organic P compounds have been identified. Due to its closeassociation with organic matter, organic P is found primarily in the topsoil and amounts decreaserapidly with depth. Apart from the benefit of being a potentially available source of P, organic Passociations in soils are also considered beneficial by facilitating the plant uptake of P by formingorganophosphate complexes which remain in solution and coating Fe and Al particles to reducesorption (Tisdale et al., 1993).
Although P is a relatively abundant element, its availability to plants and other organisms insoils may be relatively low. For example, in a relatively fertile soil the total P in the top 10cm maybe 480mgkg−1. However, the distribution of P into various soil pools is typically (mg kg−1);
Inorganic stable 200labile 20
Organic stable 200labile 20
Biomass plants 20Micro-organisms 20
Soil solution <0.1
Soil solution is considered the critical pool from which plants take up nutrients. Soil solution Pconcentrations are typically 0.05 mg l−1, whereas concentrations required by plants are between 0.003 and 0.3 mg l−1. Plants generally take up P as orthophosphate ions (H2PO4
− or HPO42
depending upon soil pH) from soil solution, but the soil solution pool of P can be a very smallfraction of the total (<0.002%). Throughout a growing season crop plants will rapidly deplete this,hence the solution P must therefore be replaced on a regular basis as it is depleted (thought tooccur at least 300 times during a growing season) to maintain sufficient P levels for plant growth.Figure 3.3 shows the inter-relationship between soil solution P, the ‘labile pool’ (i.e. the Padsorbed to surfaces that may be desorbed and the solution P) and the ‘non-labile pool’ whichtends not to be available to plants.
This replenishment of P in soil solution is critical if soil fertility is to be maintained. However,while P in soil solution may be maintained and therefore be available for plant uptake, it may notbe accessible to plants, therefore nutrient ions also move through the soil to the plant roots.Differences in water potential in soil gives rise to water movement in soils and ions or moleculespresent in solution will also move, the process is known as mass flow or convective flow. As thereare relatively small concentrations of P in soil solutions, mass flow accounts for 1–20% of Ptransport to the root surface (Tisdale et al., 1993). Mass flow is an important mechanism for NO3
−,Ca2+ and Cl− movement, but is limited in terms of P transfer to plant roots.
48 CHAPTER 3

Figure 3.3 Transfers and transformations of P in soil, the arrows in the diagram give an indicationof the direction P may move and the relative speed at which this may occur (Reproduced fromWhite, 1997 with kind permission of Blackwell Science Ltd).
Consequently, diffusion, the movement of ions down concentration gradients, is the primarymode of P transport to the plant root. The diffusion coefficient is a term used to describe themovement of a solute from a region of high concentration (e.g. fertiliser pellet) to a region of lowerconcentration (e.g. in the vicinity of a plant root). The diffusion coefficient varies greatly betweenions and with soil properties. Estimates of how far an ion will move through the soil in a period of6 days are shown in Table 3.4 and highlight the limited distance orthophosphate moves bydiffusion compared to the more mobile nitrate and potassium ions (Wild, 1981).
The relatively low mobility of P in soils may lead to the development of depletion zones aroundplant roots i.e. when the uptake of the nutrient by the plant exceeds the rate at which the labilepool can replace the solution P (Cooke, 1981).
Due to the complex relationships within soils that govern the distribution of P and ultimatelythe availability of P to plants, it has become essential to be able to estimate the amount of P in thelabile or ‘plant available’ pool, as the total amount of P in a soil may have very little bearing on thefraction that is agronomically important. One of the main methods used to routinely determinethe availability of P in soils from the field is by chemical extraction. By using a dilute chemicalextractant, such as 0.5M NaHCO3, (Olsen’s reagent), the process of mineral dissolution thatoccurs when plants take up P from solution by precipitating solution Al and Ca is simulated (Tisdaleet al., 1993). The use of such extractants is undertaken following their calibration with plant tissueP analysis under various rates of P application. This calibration means the P solubilised by aparticular extractant may be used to estimate P availability and fertiliser recommendations(Rowell, 1994) (Table 3.5).
The use of chemical extractants such as NaHCO3 should only be considered as a guide only assite-specific factors often need to be taken into consideration if recommendations are beingmade. Some of the inherent flaws and potential problems associated with using and interpretingthese tests are given elsewhere (Barber, 1995). For all of these problems, the use of chemicalextractants gives a broad indication of an operationally defined measure of P availability
PHOSPHORUS 49

Table 3.5 Fertiliser P recommendations (kg P2O5) for cereal crops in the UK using the Olsen orbicarbonate extractable P and availability index (MAFF, 1988).
*Application to maintain soil P status and replace crop removal.
P sorption
Phosphorus sorption is the term used to describe the adsorption/precipitation of P from solutionas sparingly soluble solid forms. On addition of amendments to soil, P may be taken up by cropplants, held as organic P or become weakly or strongly bound with inorganic soil components.Precipitation reactions are responsible for P retention and removal from solution when theconcentration of solution P and relevant cations exceeds the solubility product of the mineral.Adsorption is more likely to account for P removal from solution when P solution concentrationsare low, although, it has been suggested that P retention is probably a continuing mix of bothmechanisms (Tisdale et al., 1993; Rowell, 1994).
The sorption of P from solution is initially rapid, followed by a slower conversion toprogressively less plant available forms of P, including insoluble Fe, Al and Ca phosphate minerals,depending on soil pH (Figure 3.4).
Sorption of phosphorus is influenced by a range of soil physico-chemical factors including soiltexture and mineralogy, soil pH, cation and anion effects, organic matter and reaction times andtemperature (Tisdale et al., 1993). The retention of P in soils has important implications for theresidual value of P fertilisers, where 70% of that added may be fixed in a single growing season. Arelatively small proportion of this fixed P may be available for plant uptake in the next growingseason. Studies in New South Wales in Australia have shown this may be as little as 24%(Glendinning, 1999). Whereas others have observed this figure to be somewhere between 6 and70% depending on the type and form of P fertiliser added and land management factors (Larsen,1971; Sharpley and Halvorson, 1994). In some soils with a high P sorption capacity, large-one off Papplications (>200 kg ha−1) (Table 3.5) followed by normal annual rates are required to increasethe soil solution P concentration above the critical limit for crop growth (Laegreid et al., 1999).
The retention of P by sorption can influence solution P concentrations so will also influenceplant uptake and subsequent fertiliser management, affecting the movement and loss of P fromthe agroecosystem.
50 CHAPTER 3
Table 3.4 Distance moved by macronutrient ions by diffusion in 6 days (in mm).

BOX 3.1UTILISING INDIGENOUS SOIL P
Due to the inherently low mobility of P in soil, some organisms have developed mechanismsto improve supply. These range from the secretion of organic acids and solubilisingchemicals to symbiotic fungal associations. For example, lupins (Lupinus albus) secretecitric acid that precipitates calcium, promoting the release of soluble P from insolublephosphates (Laegried et al., 1999).
Mycorrhizas are symbiotic associations between a fungus and the plant root. The relationship ismutually beneficial with the fungus growing from the plant root and taking up increased P (and alsoCu, Zn and Co) and supplying it to the plant in return for carbohydrate (Rowell, 1994). Themycorrhizal infection increases the soil volume exploited by the roots (in some cases through anextensive network of hyphae amounting to 1–20 m−2 g−1 of soil) and improves P storage and releasein times of deficiency (White, 1997). Over 80% of all plant species may form mycorrhizal associations,however these tend to work more effectively in P deficient soils. Industrial usage and field scalemanipulation of mycorrhizal inoculants have shown only limited success.
The commercial development of plant-beneficial P solubilising fungi is not limited to mycorrhiza,‘Provide’, a biological product sold in Canada contains Penicillium bilaii which solubilises soil boundP (Cunningham and Kuiack, 1992). In Australia, a similar fungus P. radicum (sp. nov.) has beenobserved to increase wheat yields by 14% in the field and laboratory by stimulating plant growthdirectly via improved P nutrition (Whitelaw et al., 1997). The success of these under Europeanconditions is yet to be determined.
3.3PHOSPHORUS LOSSES
There are a number of pathways by which P is lost from an agricultural soil, with the mostdesirable route being via crop uptake and subsequent removal by grazing or harvest. It followsfrom the above discussion of P behaviour within soil systems that little if any P would betransferred from soils or ‘leak’ into adjoining ecosystems. Consequently, the loss of P from
Figure 3.4 The influence of pH on the retention of P (Soil Fertility and Fertilisers, 5/E by Tisdale, S. ©Reprinted by permission of Person Education, Inc., Upper Saddle River, NJ).
PHOSPHORUS 51

agricultural systems is relatively low, certainly in comparison to the agronomic requirements for P.However, concentrations of P as low as 20 µg l−1 can cause environmental problems in somewaters, it is clear that even limited movement of P, be it soluble or adsorbed onto soil particles ororganic matter, may be of considerable importance (Figure 3.5).
Figure 3.5 P inputs from non-point sources and main hydrological flow pathways (Johnes andHodgkinson, 1998).
There are a number of point sources of P contamination of the environment (Box 3.2). The lossof P from agricultural systems may occur from point sources including accidental spillage frommanure stores, livestock housing, direct contamination during spreading of manure or inorganicfertilisers and consented discharges from livestock farms (Withers and Sharpley, 1995). Pointsources are easily identified and have therefore seen greater and more effective controls placedupon them compared to diffuse or non-point sources of P (Sharpley and Halvorsen, 1994; Daniel,et al., 1998). The reduction in losses from these point sources of P has drawn greater attention tothe non-point source forms of P loss from agricultural systems—i.e. losses from agricultural soils.The P may be transported from soils by a range of mechanisms including surface runoff, soilerosion, leaching and subsurface flow (Figure 3.5).
Phosphorus is transported from agricultural soils as either dissolved or particulate forms andgenerally a mix of both, depending on a range of soil, hydrology and land-use factors (Table 3.6).
Surface run-off
Surface run-off is the main mechanism of P loss from agricultural systems, and may account for90% of the P transported from arable land in the UK, although considerable problems arise inquantifying the magnitude of diffuse inputs (Catt et al., 1998). Phosphorus losses can be from anumber of source areas in an agricultural catchment. The form, quantity and temporal variabilityof losses are influenced by a host of short-term changes in farm practice and hydrologicalconditions (Sharpley et al., 2000).
The loss of P via surface run-off is influenced to a large extent by the rate, timing, form(inorganic manure, type of manure etc.) and method of P fertiliser applications, as well as
52 CHAPTER 3

antecedent and post application rainfall and farm type (Sharpley and Halvorsen, 1994). Inaddition to these factors, catchment properties that control soil, stream bed and channel bankerosion and sediment transport such as steepness of slope, surface roughness and other soilphysical properties (aggregate stability, dispersion, texture, etc.) will also have an effect on P loss.
Water flowing across the surface of the soil may entrain particles and desorb and transportsoluble P. The majority of P in run-off is in the particulate form, especially if the run-off isdominated by suspended sediment—which tends to occur during storm events (Pierzynski et al.,2000). The association of P with fine particulate material was observed by Edwards (1996) in acultivated soil which had received regular inorganic P applications, where the <0.1 mm particlesize fraction had 1.5 times more total P compared with the 1–2 mm fraction. However, the ratio of‘total P: available P’ declined from 49 to only 14.
This reduction in available P occurs due to the increased sorption on the relative large surfaceareas of the fine material (i.e. clays sized <2 µm) being transported. It also explains the relativeenrichment of P in eroded particulate material compared to the source soils due to the preferentialtransport of fine particles (Withers and Sharpley, 1995). Because of this process the enrichmentratio is commonly used to describe the relative difference between the concentration of P insediment removed from soil as rainfall run-off and the concentration of P in the source soil.Figure 3.6 shows the enrichment ratios for P in rainfall runoff for two soils (1 and 2) from the USAtreated with a range of inorganic P applications and subjected to simulated rainfall. An increase inthe fertiliser application rate increased the enrichment ratio and the P content of the run-offsediment compared to the source soil. The increase in the enrichment ratio even in the zerotreatments, highlights the preferential movement of fine particulate material, commonlyassociated with greater total P content (Sharpley, 1980).
Table 3.6 Factors responsible for controlling P loss by erosion and leaching on a range of scales(Edwards and Withers, 1998).
Soluble P makes up a greater component of P in run-off from sites that frequently receiveapplications of organic manures and slurries. Up to 20% of the total P in poultry manures may bewater soluble and contain a considerable quantity of low density organic material which greatlyincreases the susceptibility to water entrainment. The pattern of P distribution in run-off changesif the manure is deposited onto land directly from livestock rather than being spread, with greatertotal and particulate P losses tending to occur when stocking densities are high (Withers andSharpley, 1995).
PHOSPHORUS 53

Figure 3.6 The enrichment ratios of sediment run-off as a function of fertiliser P application(Sharpley, 1980).
The temporal variation in P losses via run-off from soils receiving manure may be considerable.Averaged over a year, losses of P from agricultural land are unlikely to produce a situation wheredetrimental environmental effects occur. However, single run-off events following manure orslurry applications can have total P concentrations of up to 25 mg l−1 (Smith et al., 1998). Thecritical concentration of total P entering water bodies to prevent accelerated eutrophication hasbeen set by a range of organisation at 0.1 mg l−1 (Withers and Sharpley, 1995). Losses of P frommanures and slurries via surface run-off are also promoted by a capping or sealing effect that canoccur on land receiving high slurry applications (>80 m3 ha−1). This effectively reduces rainfallinfiltration, heightening the risk of run-off. The greatest likelihood of P loss from farming systemsoccurs when (Withers, 1996):
• the catchment has erodible soils;• the levels of P in the soils have accumulated to excess;• rainfall closely follows fertiliser or manure application.
Phosphorus surplus in topsoils have increased the potential for loss of P from agriculturalsystems. These loses reduce the efficiency of P utilisation in terms of providing an agronomicreturn and provide evidence that calls into question the sustainability of management practicesthat accelerate the loss of a finite resource in a non-recoverable and environmentally degradingform.
Leaching and drain flow
Solution concentrations of P in most soils are extremely low and the distances moved by P ions insolution are so small that leaching to ground and surface waters would be expected to take manythousands of years. Unlike NO3
−, the leaching of P is rarely thought of as being an environmentalissue (Pierzynski et al., 2000).
There are exceptions to this general observation. Whilst some are related to soil types (organicsoils with fluctuating water tables and soils with well-developed macropore structure) pH andweather conditions, it has been observed that fertiliser usage may also be important in P leachingfrom agricultural land. In experiments performed in the Broadbalk Continuous Wheat
54 CHAPTER 3

Experiment at Rothamsted, Heckrath et al. (1995) suggested that leaching and subsurface runofffrom fertilised soil plots could be greater than previously thought and may be related to soil Psurplus. Samples of drain flow from pipes under the middle of fields receiving a range of inorganicfertiliser and manure amendments were collected for two years. Concentrations of total P in thewaters draining through the soils ranged from 0.03 to 0.23 mg l−1 in unfertilised plots and up to 0.55–2.75 mg l−1 in inorganically fertilised plots. The highest values of NaHCO3 extractable P (90 mgkg−1) were also observed in the soils receiving inorganic fertiliser treatments, and a strong positivecorrelation was observed between values of NaHCO3 extractable P (when >60 mg kg−1) in the ploughlayer and P in the drainage water. This increase of P in drainage waters is thought to reflect thelong-term accumulation of P in soils, beyond the level likely to result in beneficial agronomiceffects (Sharpley et al., 2000).
The use of artificial drainage in heavy or organic soils increases infiltration and decreasing thepotential for runoff, but may increase the chance of leaching. Compared with natural subsurfacemovement, drains greatly accelerate P transfer. Considerable losses of P may occur via subsurfacepathways, including field drains (>2.5 kg P ha−1 year−1) in arable land, which would be sufficient tocause water quality issues (Catt et al., 1998). It has been estimated that almost 50% of theproductive agricultural land in England and Wales is underdrained, with the primary reason beingthe reduction of soil water and allowing autumn access to sow winter cereals (Withers et al.,2000). Unlike surface run-off which may be intercepted before reaching surface drainage channelsby landscape features, such as hedgerows or riparian buffer strips, a field drain will usually leaddirectly into an open drainage channel.
Large applications of animal manures to coarse sandy textured soils (these soils often have verylow sorption capacities for P), necessitated by shortages of land for appropriate disposal, may resultin increased concentrations of P migrating below the plant rooting zone to ground waters and fielddrains. Increased P movement via leaching has also been observed when slurries are injected intograssland soils (Tunney et al., 1997). Subsurface drains and preferential flow pathways such asmacropores (Brookes et al., 1997; Hooda et al., 1999) act as conduits for the transport of P whichby-pass the potential sorption sites in the subsoil that would otherwise reduce P movement andtransport (Withers and Sharpley, 1995; Johnes and Hodgkinson, 1998). Consequently, the resultmay be an increased transfer of P, at concentrations of up to 10 mg l−1 in a single storm event tolocal waterways (Smith et al., 1998).
Leaching and subsurface loss of P from agricultural systems would suggest that P is beingtransferred primarily in the dissolved form. This is not always the case; finer soil fractions mayalso be transferred, with P sorbed to soil colloids, along subsurface pathways. The proportion of Ptransferred in particulate form can range from 17 to 60% of the P lost via drainage water(Heckrath et al., 1995; Hooda et al., 1996) and is dependent on a range of soil, management andhydrological factors. This is further complicated as during the transfer of P from soil to water, theform of P may continuously change between the dissolved and particulate phases.
PHOSPHORUS 55

3.4ENVIRONMENTAL IMPLICATIONS OF P POLLUTION
We have demonstrated that post 1945 agricultural intensification in many European farmingsystems has lead to an increase in soil P content to levels beyond those that would realisticallybenefit crop and grassland production (Johnes and Hodgkinson, 1998). This combined with arange of other factors has resulted in significant proportion of the P applied to agricultural land inthe form of manures and inorganic fertilisers being transferred via a variety of routes to surfaceand ground waters. The environmental implications of this transfer of P and resulting enrichmentwill now be considered.
N and P balance in natural waters
It is important to note that water quality issues, such as eutrophication, are not solely causedexcessive P inputs. A host of environmental factors including water salinity, temperature, depthand light as well as the presence and interaction of N and P are all involved (Pierzynski et al.,2000).
The influence of N upon primary biological productivity in aquatic systems, particularly coastalwaters and estuaries, was discussed in Chapter 2. However, in freshwaters the biologically limitingelement is almost always P. The importance of the balance between N and P in terms of primaryproduction, such as algal growth, in aquatic systems has long been recognised. Under favourablegrowth conditions algae have an N and P elemental composition that falls within a set ratio. This isknown as the Redfield ratio, and commonly falls between 15 and 16:1 (Correll, 1998). However, itdoes vary with a range of environmental conditions, when values exceed 16:1 it has been suggestedthat P will be the element limiting algal growth. Conditions which tend to favour water qualityproblems are when the total P concentration of the water body is >0.05 mg l−1 and the Redfieldratio of N: P is 20 or less (Peirzynski et al., 2000). Aquatic systems naturally low in P are verysensitive to inputs of P.
The inter-linkage of P and N in freshwater algal populations demonstrates the importance of anholistic fertiliser management strategy on a range of scales if nutrient leakage from agroecosystemsis to be reduced and problems with water quality are to be tackled successfully.
BOX 3.2POINT SOURCES OF P LOSS
Phosphorus may enter aquatic systems from a range of point sources including urbanwaste water drains (including P containing detergents and sewage wastes), sewage-treatment works, fish farms, meat, dairy and food processing plants (Lennox et al., 1997).In the EU, it has been suggested that over 50% of the anthropogenic P entering aquaticsystems is from urban waste-water (Mariën, 1997), with a strong correlation betweenpopulation density and P concentrations in river waters. The highest concentrations (often80% of the rivers have >0.125 mg P l−1) in European rivers are in Northern Ireland,southern England and across central Europe through Romania to the Ukraine (Steén,1997). Agricultural non-point source losses of P account for less than 50% of the total (of
56 CHAPTER 3

which 16% is thought to originate from fertilisers and 34% from livestock), but this is thehardest and most costly to control (Environment Agency, 2000a). It is estimated almost90% of the P entering rivers in East Anglia is from sewage works effluent. Areas which havebeen particularly susceptible P enrichment from this source also include Loch Leven inScotland, Lough Neagh in Northern Ireland, the Shropshire and Cheshire meres and anumber of water supply reservoirs in southern England (Foy and Bailey-Watts, 1998). In1999, 23% of all substantiated water pollution incidents (those in which a prosecutionfollowed) in England and Wales were caused by sewage, only those caused by fuels and oilwere greater at 26% (Environment Agency, 2000a). However, the inputs of P from pointsources are easier to identify and so have seen more attempts at control than diffuse or non-point sources as industrial and sewage discharges are brought into line under the UrbanWaste Water Treatment Directive (Heathwaite, 1997; Foy and Bailey-Watts, 1998). Yetthere is limited evidence to suggest that the reductions of P input from these point sourceshas had any dramatic effect on P content in aquatic systems, suggesting diffuse sources of P(or even P release from sediments) may be playing a critical role (Steén, 1997).
3.5ENVIRONMENTAL PROBLEMS CAUSED BY P POLLUTION
The overriding concern associated with P loss from agricultural land is the pollution of surfacewaters causing eutrophication. However, a further issue is the loss of indigenous vegetation typesin naturally nutrient poor grassland systems which have received increased P inputs. The humanhealth effects of excessive P are, unlike N, primarily limited to those effects resulting from impactson surface water quality.
P in ground and surface waters
Phosphorus concentration in ground waters tends to be relatively low and subsequently of limitedenvironmental importance (Sharpley et al., 1987). Nevertheless, the total concentration of P insurface waters (often considered critical in terms of the potential to accelerate biologicalproductivity and potentially eutrophication) is only 0.01 mg l−1 (cf. N 1–0.5 mg l−1) (Daniel et al.,1998). This is 10 times lower than the concentration in soils commonly thought to be required forcrop growth. This difference is of fundamental importance in regard to issues of water quality andthe management of P usage in agricultural systems. The loss of P from these systems is of limitedagronomic value, but crucial in regard to environmental quality.
The effects of these losses depend upon the characteristics of the receiving water. For example inrivers, where ecology is largely determined by flow regime, residence times may be too short forphytoplankton to develop. Favourable conditions may be reached when the speed of the water ischecked, such as in reservoirs, dams or slower moving reaches (Gibson, 1997). The biologicalresponses in streams and rivers to increased P loading are site and season specific (Edwards et al.,2000). In the UK, rivers flowing through areas dominated by arable farming tend to have greater Pconcentrations than similar lowland areas in which pastoral activity is the main use (EnvironmentAgency, 2000a).
PHOSPHORUS 57

Increases in P in surface waters may cause rapid rises in the growth of algae and other waterplants. Indeed, a linear relationship is thought to exist between biomass production andconcentrations of total P in waters of less than 0.1 mg l−1, but above this other factors such as lightavailability become more important (Gibson, 1997).
A schematic of the relationship between primary production, the input of P and the trophicstatus of a freshwater system is given in Figure 3.7. Generally, there are four consecutive stages ofeutrophication; oligotrophic, mesotrophic, eutrophic and hypereutrophic. The progressionthrough these stages results in changes in the biodiversity, ecology and oxygen status of the waterbody (Peirszynski et al., 2000).
Figure 3.7 The relationship between P input and biodiversity in freshwater systems, the valuesbelow each trophic status are examples of possible water quality characteristics (adapted fromCorrell, 1998 and Mason, 1996).
On reaching surface waters the form of P can change, so while dissolved P may be the form inwhich it reaches a lake, it may well be sorbed onto sediments and organic matter in the watercolumn (Figure 3.8). Soluble P may represent an immediately bioavailable source on reaching areceiving water body. Particulate P is a long-term source to the aquatic system and the rate of Prelease is determined by the physico-chemical characteristics of the specific sediment and watercolumn (Sharpley et al., 1987). In nutrient poor aquatic systems, for example a freshwater lake,the P will remain predominantly in the bottom sediments. However, if this system receives a largeinput of P it may become eutrophic. The resulting increase in primary production can promoteanoxic conditions in the water close to the bottom which causes the increased release of P from thesediments back into the water column (Correll, 1998). A common pattern of P cycling in lakes isthat in winter most P is in the dissolved form, but as spring begins the increased light favours
58 CHAPTER 3

photosynthetic activity and phytoplankton populations increase and dissolved P concentrationsfall (Gibson, 1997).
Figure 3.8 The potential cycling of P between various forms in aquatic systems (adapted fromCorrell, 1998).
The P transformations occurring in feeder channels may impact greatly upon the biologicalproductivity of the receiving lake, reservoir or stream. This is very important, as net P input to alake or stream from agricultural non-point sources may increase the chances of water qualityproblems such as eutrophication, but the transformations of P between the various forms affectingbioavailabity will determine the extent to which nutrient enrichment will occur.
Eutrophication
The eutrophication of surface waters is a global issue and is a result, in part, of elevated Pconcentrations. It can be defined as ‘an increase in the nutrient status of natural waters thatcauses an accelerated growth of algae or water plants’ (Pierzynski et al., 2000). It is essentially anatural process, but over stimulation through anthropogenic inputs (cultural eutrophication)results in an increase in algal growth and plant production (Figure 3.7). It is common for lakes tohave a peak in the population of diatoms (Bacillariophyta) in spring with a late spring flush ofgreen algae (Chlorophyta). However, in eutrophic systems one may expect a large summer peak inblue-green algae (Cyanophyta) (Mason, 1996).
Approximately 6% of river lengths in the UK are designated as Eutrophic Sensitive Areas andinstances of blue-green algal blooms are reported from over 200 sites a year (EnvironmentAgency, 2000a, b). The long-term change in the trophic status of freshwater systems in the UK isdifficult to determine, but between 1994 and 1998 a doubling in the number of designated sitessensitive to eutrophication has occurred.
Accelerated eutrophication of aquatic systems is associated with surface rather than subsurfaceinputs of P, a consideration of importance in the following discussion of management objectives to
PHOSPHORUS 59

reduce P leakage. The detrimental effects associated with eutrophication of surface waters in theUK were outlined in Chapter 2 and include restrictions in water use for fisheries, recreation,drinking for humans and livestock and industry. Further discussion of these issues are given inother texts (Harper, 1992; Sakamoto, 1996; Moss, 1998).
3.6PRACTICAL SOLUTIONS
The optimisation and effective use of soil P surpluses and fertiliser inputs are required for thesustainable use of P in productive agricultural systems. An improvement in understanding inthese areas will enable the development of measures to reduce the loss of P from agricultural landand the subsequent transfer to surface waters (Sharpley et al., 2000).
As the primary mechanism of P transport is via run-off, both dissolved and particulate P forms,the reduction of non-point sources of P requires management strategies that address both thesources and transfer mechanisms. Source management, such as better farm-scale nutrientbudgeting and balancing P inputs for livestock and crop production may offer considerablefinancial savings along with environmental benefits. Transport management focuses on thereduction of the main P transfer pathways through the use of soil conservation, land-usemanagement and buffer zones (MAFF, 1998).
It is clear from the preceeding chapter on N, that many of the management practices set out aspart of the Code of Good Agricultural Practice for the Protection of Water (MAFF, 1998) will alsoapply to the reduction of P leakage. However, the Code also recommends that for soils containingover 25 mg kg−1 Olsen P the rates of manure application match P crop offtake and that no P isapplied to soils containing >45 mg kg−1 Olsen P (soil P Index 3—Table 3.5). Furthermore, nutrientbudgeting targets are given along with guidance for the environmental suitability of changes inmanagement on soils with a high soil P index (Withers et al., 2000).
Concern in regard to eutrophication and the impact of non-point source P losses fromagricultural systems at the national level is acknowledged by the publication of a national strategy—Aquatic Eutrophication in England and Wales: a Management Strategy (Environment Agency,2000a). This document outlines an holistic approach to aquatic eutrophication, which requiresaction under a range of statutory and international commitments entered into by the UK (ECdirectives, UK Biodiversity Plan, the OSPAR Convention). The Environment Agency strategy is tofocus primarily on N and P and their impacts upon ‘controlled waters’ (lakes, streams, canals,reservoirs, estuaries and coastal waters), and the overall objectives are to:
• provide a framework to manage cultural eutrophication, to protect, rehabilitate and restorewaters adversely affected;
• deliver on the Environment Agency’s ‘Environmental Vision’, particularly its commitments toeutrophication control;
• ensure contribution to the UK Biodiversity Plan, especially implementation of Habitat ActionPlans for standing waters;
• promote a reduction in nutrient content of waters nationally, coordinate catchment basedmanagement of policies and procedures for the assessment and control of local eutrophication.
60 CHAPTER 3

The document outlines a series of actions that will be performed to achieve these objectives whichinclude:
• the setting up of eutrophication control action plans through the Environment Agency’scatchment-based local Environment Agency Plan;
• promote the use of recycled phosphorus from soaps and detergents;• refine and promote the uptake of the current codes of practice;• with other organisations (e.g. LEAF) provide demonstration farms of good nutrient
management and commercial success;• review current eutrophication monitoring procedures via the National Collaborative Forum on
Environmental Monitoring;• further work on assessing the cost-effectiveness of current eutrophication control;• provide interim targets (annual means) for P in freshwaters (eutrophic in standing water—0.
085 mg Pl−1, running water—0.200 mg soluble Pl−1).
A range of practical strategies and options for reducing P leakage from agricultural systems currentlyexist and several examples are discussed below and shown in Figure 3.9 (Withers et al., 2000). Atfield level, costs are generally high, but the methods effective. However on a catchment scalelosses can be greatly reduced at relatively low costs. Increasingly approaches focus on anintegrated catchment management plan, whereby site and catchment specific factors are takeninto account and risk areas targeted.
Source management—optimisation of fertiliser P use
The reduction of P surpluses in soils is a long-term issue and rectification will take many years.Nevertheless, targeted use of fertilisers and nutrient management planning (and budgeting) maybe effective in the short-term in reducing P losses through run-off (Sharpley et al., 1993). The keyaspects of P fertiliser management include:
• accurate estimates of crop and forage plant P requirements;• use of soil, manure and plant tissue testing;• monitoring of soil P levels;• timely and efficient fertiliser practices (Daniel et al., 1997; Pierzynski et al., 2000).
Many soils in the UK have a P surplus and the greatest risks of further accumulation are wherethere is a limited land area for manure disposal. In particular, this occurs where manureapplications are limited solely by N requirement—the ratio N: P is often lower in manure (e.g. 3)than is removed in the crop (e.g. 8) and so N tends to taken up, where as P may build up in the soil(Sharpley et al., 1993; Smith et al., 1998). It is therefore necessary that farmers adequatelyaccount for the P contribution in manures (even basing manure applications on P requirement notN) with the framework of an appropriate fertiliser plan (MAFF, 2000b).
Following the determination of a P requirement then the rate, timing, method and amount offertiliser application need to be determined. The form of P fertiliser is thought to have a limitedimpact on P loss via run-off if the fertiliser is incorporated to the soil (Pierzynski et al., 2000).
PHOSPHORUS 61

Inorganic fertiliser applications may be placed and banded with crops to ensure more efficientusage in terms of crop uptake and crop recovery of applied P and less chance of loss through run-off(Tisdale et al., 1993; Sharpley and Halvorsen, 1994). Estimates of P loss in runoff suggest thatfields receiving broadcast P may be two orders of magnitude greater than from fields in which thefertiliser has been incorporated into the soil. Similar results have also been observed for broadcastand incorporated manure applications (Sharpley et al., 1993).
Greater challenges exist in regard to manure usage and P loss. Best management practice for therecycling of animal manures and organic wastes to land are outlined in Chapter 5. However,specific measures to reduce P loss include composting, pelletising, transport from P surplus todeficient areas and the use of additions such as alum which can reduce P solubility (Sharpley etal., 2000). Improved utilisation of the residual P content in soils and the more effective use offertiliser applications could be possible through crop selection/ rotation tillage and plant stubblemanagement.
Animal feeds
Livestock feed is often seen as one of the major contributary factors to excessive P input into soils.Like the reduction and targeted use of P in fertilisers, the reduction of P inputs into livestock feedsis unlikely to have an impact in the short-term, as soil concentrations will change only slowly(Withers et al., 2000). Therefore, this may be considered as a long-term preventative measure incomparison to the soil conservation and transfer management strategies below, which are likely tohave immediate measurable impacts on leakage rates.
The manipulation of dietary P intake of livestock includes methods for increasing P adsorptionby the animal, and refining animal feed rations. This issue is clouded by the variability in Pavailability in forages, feeds and supplements and the clear need to balance production andanimal performance. Purchased feeds account for about 60% of the P inputs into intensive dairyoperations and are mostly consumed as phytate. It is thought that limiting the amount of P fed tolivestock is only going to be effective in reducing loss in intensive farming systems. Reducingstocking densities, the use of inorganic P fertiliser applications and using less purchased feedswould probably have a larger effect on reducing the P surplus and subsequent losses (Valk et al.,2000).
Nevertheless, the amount of P in livestock feeds need to be balanced with dietary requirements.Recent studies in the Netherlands suggested that feeds for dairy cows contained up to 20% more Pthan was required, due to the P content of grass silage. An overall reduction of dietary P to dairycattle of 10% could be made (20% in the UK) without impacting upon production (Valk et al.,2000). A further strategy that is currently being adopted to increase dietary utilisation of P by pigsand poultry is the supplementation of grain feed with phytase enzymes. This enzyme is absent inthe guts of these animals and enables the digestion of a greater proportion of the P from the grain(the phytate P). Furthermore, grain varieties, low in phytic acid, are now being grown as feeds toreduce the need for the enzyme addition. Both these measures may reduce P in excreta by over20% (Pierszynski et al., 2000).
In the Netherlands there is combination of approaches being adopted to reduce excessive use ofP. The policy is to bring about a stepwise reduction of the P supply towards an equilibrium level
62 CHAPTER 3

based on calculated removals and known inputs (Van der Molen et al., 1997). The equilibrium levelis defined as the sum of the manure and fertiliser supply that meets the need of the crops andcompensates for inevitable losses. This approach defines losses under ‘good agricultural practice’which are often higher than those losses considered acceptable in order to meet environmentalstandards. It is estimated that a relatively small excess of P inputs, in the order of 5 kg P ha−1 year−1, will increase the area of land in the Netherlands that is defined as strongly P-saturated by 100%by the year 2050. In some parts of the country where P-induced eutrophication is a severe risk,manure-P returns to land are restricted based on a manure quota (Hotsma, 1997), with excessbeing exported to other regions with a lower P input. This is just part of a strategy being employedin the Netherlands where the intensity of livestock production has lead to serious environmentalproblems. Other approaches include the restoration of buffer zones and wetland margins,lowering groundwater levels and applying ferric and aluminium compounds to soils (Van derMolen et al., 1997).
P transfer management by soil conservation
Soil conservation practices promote environmental and economic sustainability, irrespective ofthe potential influences upon P losses. In a recent study of 13 erosion susceptible catchments inthe UK (MAFF, 1997) erosion occurred in 40%, of which the majority where cropped to winter
Figure 3.9 The nutrient and transport management options for the control of P lossfrom non-point sources(adapted from Withers et al., 2000).
PHOSPHORUS 63
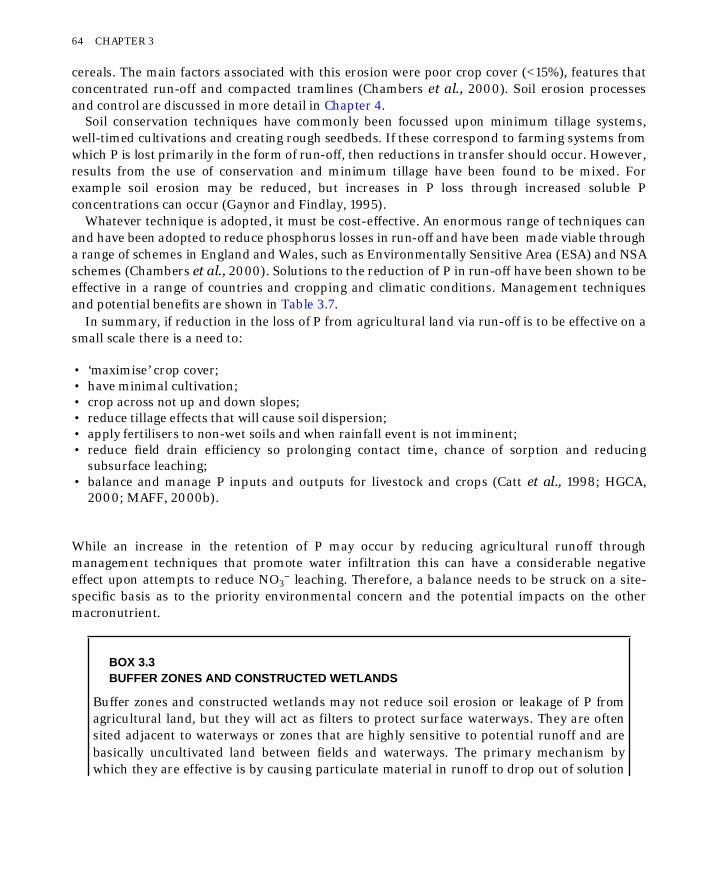
cereals. The main factors associated with this erosion were poor crop cover (<15%), features thatconcentrated run-off and compacted tramlines (Chambers et al., 2000). Soil erosion processesand control are discussed in more detail in Chapter 4.
Soil conservation techniques have commonly been focussed upon minimum tillage systems,well-timed cultivations and creating rough seedbeds. If these correspond to farming systems fromwhich P is lost primarily in the form of run-off, then reductions in transfer should occur. However,results from the use of conservation and minimum tillage have been found to be mixed. Forexample soil erosion may be reduced, but increases in P loss through increased soluble Pconcentrations can occur (Gaynor and Findlay, 1995).
Whatever technique is adopted, it must be cost-effective. An enormous range of techniques canand have been adopted to reduce phosphorus losses in run-off and have been made viable througha range of schemes in England and Wales, such as Environmentally Sensitive Area (ESA) and NSAschemes (Chambers et al., 2000). Solutions to the reduction of P in run-off have been shown to beeffective in a range of countries and cropping and climatic conditions. Management techniquesand potential benefits are shown in Table 3.7.
In summary, if reduction in the loss of P from agricultural land via run-off is to be effective on asmall scale there is a need to:
• ‘maximise’ crop cover;• have minimal cultivation;• crop across not up and down slopes;• reduce tillage effects that will cause soil dispersion;• apply fertilisers to non-wet soils and when rainfall event is not imminent;• reduce field drain efficiency so prolonging contact time, chance of sorption and reducing
subsurface leaching;• balance and manage P inputs and outputs for livestock and crops (Catt et al., 1998; HGCA,
2000; MAFF, 2000b).
While an increase in the retention of P may occur by reducing agricultural runoff throughmanagement techniques that promote water infiltration this can have a considerable negativeeffect upon attempts to reduce NO3
− leaching. Therefore, a balance needs to be struck on a site-specific basis as to the priority environmental concern and the potential impacts on the othermacronutrient.
BOX 3.3BUFFER ZONES AND CONSTRUCTED WETLANDS
Buffer zones and constructed wetlands may not reduce soil erosion or leakage of P fromagricultural land, but they will act as filters to protect surface waterways. They are oftensited adjacent to waterways or zones that are highly sensitive to potential runoff and arebasically uncultivated land between fields and waterways. The primary mechanism bywhich they are effective is by causing particulate material in runoff to drop out of solution
64 CHAPTER 3

by sedimentation. The vegetation in the buffer zone or wetland reduces overland flowvelocity, increases the surface roughness and decreases the sediment carrying capacity. Psorption and plant uptake may also play a role in reducing P concentrations in runoff,although this is probably minor in the short-term (Uusi-Kämppä et al., 2000).
The vegetation characteristics in the zone are crucial, as surface roughness needs to be at itsmaximum when the transport potential via run-off is also at its greatest. This does not often occur ashigh rainfall and run-off occur primarily in winter months when the vegetation cover may beminimal (Heathwaite, 1997).
The significance of livestock grazing on riparian land can be considerable, especially if watering orfeeding areas are also located in the riparian zones. (Heathwaite, 1997). However, the Code of GoodAgricultural Practice for the Protection of Water recommends the leaving of a 10-m buffer stripeither side of watercourses and agricultural land (MAFF, 1998).
A range of options exists for construction of zones to reduce P loss from agricultural land,including wetlands, ponds and grassed and wooded strips. The effectiveness of these zones willdepend to a certain extent upon the form of P fertiliser applied. Therefore, if slurries, which may havea large dissolved P load, are transported via run-off through a buffer zone, one may expect only alimited reduction in P load (Heathwaite, 1997).
Studies on small mixed farming catchments in Scandinavia have shown that grassed buffer zonesmay retain between 27 and 97% of total P load of which the majority was in particulate, whereasconstructed wetlands and ponds reduced total P loads by only 41 and 17% respectively. Theeffectiveness of a range of buffer zones were observed to increase considerably with increasing width(Uusi-Kämppä et al., 2000).
Nevertheless, catchment hydrology and the presence of preferential subsurface flow pathway, suchas drains, will reduce the effectiveness of buffer strips, and therefore remedial efforts should still bedirected at the agricultural source of P.
Table 3.7 Some practical management techniques for the reduction of P loss (modified and adapted fromPierzynski et al., 2000).
PHOSPHORUS 65

REFERENCES
Barber, S.A. (1995) Soil Nutrient Bioavailability; A Mechanistic Approach. 2nd Edition. Wiley, New York.Brookes, P.C., Heckrath, G., De Smet, J., Hofman, G. and Vanderdeelen, J. (1997) Losses of phosphorus in
drainage water. In: Phosphorus Loss from Soil to Water. (Eds H.Tunney, O.T.Carton, P.C.Brookes andA.E.Johnston). CAB International, Wallingford, pp. 253–271.
Brouwer, F.M., Godeschalk, F.E., Hellegers, P.J.G.J. and Kelholt, H.J. (1995) Mineral Balances at FarmLevel in the European Union. Agricultural Economics Research Institute (LEI-DLO), The Hague.
Catt, J.A., Howse, K.R., Farina, R., Brockie, D., Todd, A., Chambers, B.J., Hodgkinson, R., Harris, G.L. andQuinton, J.N. (1998) Phosphorus losses from arable land in England. Soil Use and Management 14,168–174.
Chambers, B.J., Garwood, T.W.D. and Unwin, R.J. (2000) Controlling soil water erosion and phosphoruslosses from arable land in England and Wales. Journal of Environmental Quality 29, 145–150.
Cooke, G.W. (1981) The fate of fertilisers. In: The Chemistry of Soil Processes. (Eds D.J.Greenland andM.H.B. Hayes). John Wiley and Sons, Chichester, pp. 563–592.
Correll, D.L. (1998) The role of phosphorus in the eutrophication of receiving waters: a review. Journal ofEnvironmental Quality 27, 261–266.
Cunningham, J.E. and Kuiack, C. (1992) Production of citric and oxalic acids and solubilization of calciumphosphate by Penicillium bilaii. Applied Environmental Microbiology 58, 1451–1458.
Daniel, T.C., Carton., O.T. and Magette, W.L. (1997) Nutrient-management planning. In: Phosphorus Lossfrom Soil to Water (Eds H.Tunney, O.T.Carton, P.C.Brookes and A.E.Johnston). CAB International,Wallingford, pp. 297–309.
Daniel, T.C., Sharpley, A.N. and Lemunyon, J.L. (1998) Agriculture phosphorus and eutrophication: Asymposium overview. Journal of Environmental Quality 27, 251–257.
Edwards, A.C. (1996) Soluble and particulate phosphorus losses for contrasting soil types and land usesituations. Soil Use and Management 29, 223.
Edwards, A.C. and Withers, P.J.A. (1998) Soil phosphorus management and water quality: a UK perspective.Soil Use and Management 14, 124–130.
Edwards, A.C., Twist, H. and Codd, G.A. (2000) Assessing the impact of terrestrially derived phosphorus onflowing water systems. Journal of Environmental Quality 29, 117–124.
Environment Agency (2000a) Inland Water Quality and Use. In: Digest of Environmental Statistics. http://www.environment.detr.gov.uk/des/index.htm
Environment Agency (2000b) Aquatic Eutrophication in England and Wales: A Management Strategy.Department of the Environment, Transport and the Regions.
Foy, R.H. and Bailey-Watts, A.E. (1998) Observations on the spatial and temporal variation in the phosphorusstatus of lakes in the British Isles. Soil Use and Management 14, 131–138.
Gaynor, J.D. and Findlay, W.I. (1995) Soil and phosphorus loss from conservation and conventional tillage incorn production. Journal of Environmental Quality 24, 734–741.
Gibson, C.E. (1997) The dynamics of phosphorus in freshwater and marine environemnts. In: PhosphorusLoss from Soil to Water. (Eds H.Tunney, O.T.Carton, P.C.Brookes and A.E.Johnston). CABInternational, Wallingford, pp. 119–135.
Glendinning, J.S. (1999) Australian Soil Fertility Manual. CSIRO Publishing, Collingwood, Australia.Harper, D.M. (1992) Eutrophication of Freswaters: Principles, Problems and Restoration. Chapman and
Hall, London.Haygarth, P.M., Chapman, P.J., Jarvis, S.C. and Smith, R.V. (1998) Phosphorus budget for two contrasting
grassland farming systems in the UK. Soil Use and Management 14, 160–167.
66 CHAPTER 3

Heathwaite, A.L. (1997) Sources and pathways of phosphorus loss from agriculture. In: Phosphorus Lossfrom Soil to Water (Eds H.Tunney, O.T.Carton, P.C.Brookes and A.E.Johnston). CAB International,Wallingford, pp. 205–223.
Heckrath, G., Brooks, P.C., Poulton, P.R. and Goulding, K.W.T. (1995) Phosphorus leaching from soilscontaining different P concentrations in the Broadbalk experiment. Journal of Environmental Quality24, 904–910.
HGCA (2000) P & K Fertiliser Planning; Using Soils and Plant Analysis to Plan Fertiliser Use. Home-Grown Cereals Authority, London. Autumn 2000.
Hooda, P.S., Moynagh, M. and Svobada, I.F. (1996) A comparison of phosphate losses in drainage water fromtwo different grassland systems. Soil Use and Management 12, 224.
Hooda, P.S., Moynagh, M., Svoboda, I.F., Edwards, A.C., Anderson, H.A. and Sym, G. (1999) Phosphorus lossin drainflow from intensively managed grassland soils. Journal of Environmental Quality 28, 1235–1242.
Hotsma, P. (1997) Present and future Dutch regulations to reduce phosphorus loss to water from agriculture.In: Phosphorus Loss from Soil to Water. (Eds H.Tunney, O.T.Carton, P.C.Brookes and A.E.Johnston).CAB International, Wallingford, pp. 410–412.
Johnes, P.J. and Hodgkinson, R.A. (1998) Phosphorus loss from agricultural catchments: pathways andimplications from management. Soil Use and Management 14, 175–185.
Laegreid, M., Bøckman, O.C. and Kaarstad, O. (1999) Agriculture Fertilisers and the Environment. CABinternational, Wallingford, Oxfordshire, pp. 150–157.
Larsen, S. (1971) Residual phosphate in soils. In: Residual Value of Applied Nutrients. MAFF Technical BulletinNo. 20, pp. 34–40.
Lennox, S.D., Foy, R.H., Smith, R.V. and Jordan, C. (1997) Estimating the contribution from agriculture to thephosphorus load in surface water . In: Phosphorus Loss from Soil to Water (Eds H.Tunney, O.T.Carton,P.C.Brookes and A.E.Johnston). CAB International, Wallingford, pp. 55–75.
Mariën, F. (1997) European perspective on phosphorus and agriculture. In: Phosphorus Loss from Soil toWater (Eds H.Tunney, O.T.Carton, P.C.Brookes and A.E.Johnston). CAB International, Wallingford, pp.329–337.
Mason, C.F. (1996) Water Pollution Biology. In: Pollution, Causes, Effects and Control (Ed. R.M.Harrison). 3rdEdition. The Royal Society of Chemistry, Cambridge, pp. 66–92.
MAFF (1997) Controlling Soil Erosion—an Advisory Booklet for the Management of Agricultural Land.MAFF Publications, MAFF, London.
MAFF (1988) Fertiliser Recommendations. Reference Book 209. HMSO, London.MAFF (1998) Budgets and Buffers. R+D Newsletter, No. 4 Autumn 1998.MAFF (2000a) Predicting Phosphorus Lost from Agriculture to Water. R+D Newsletter, No. 6 Summer
2000 , p. 9.MAFF (2000b) Fertiliser Recommendations for Agricultural and Horticultural Crops. MAFF Publications
MAFF, London.Morse, G.K., Lester, J.N. and Perry, R. (1993) The Economic and Environmental Impact of Phosphorus
Removal from Wastewater in the European Community. Selper Publications, London.Moss, B. (1998) Ecology of Fresh Waters, Man and Medium, Past to Future. 3rd Edition. Blackwell Science,
Oxford.Pierzynski, G.M., Sims, J.T. and Vance, G.F. (2000) Soils and Environmental Quality. 2nd Edition. CRC
Press LLC, Boca Raton, Fla, pp. 155–207.Reuter, D.J. and Robinson, J.B. (1997) Plant Analysis, an Interpretation Manual. 2nd Edition. CSIRO
Publishing, Collingwood, Australia.Rowell, D.L. (1994) Soil Science, Methods and Applications. Longman Scientific and Technical. Harlow.Sakamoto, M. (1996) Eutrophication. In: Water Resources, Environmental Planning, Management and
Development (Ed. A.K.Biswas). McGraw-Hill, New York, pp. 297–379.
PHOSPHORUS 67

Schlesinger, W.H. (1997) Biogeochemistry, an Analysis of Global Change. 2nd Edition. Academic Press, SanDiego, pp. 383–401.
Sharpley, A.N. (1980) The enrichment of soil phosphorus in runoff sediments. Journal of EnvironmentalQuality 9, 521–526.
Sharpley, A.N., Daniel, T.C. and Edwards, D.R. (1993) Phosphorus movement in the landscape. Journal ofProduction Agriculture 6, 492–500.
Sharpley, A., Foy, B. and Withers, P. (2000) Practical and innovative measures for the control of agriculturalphosphorus losses to water: an overview. Journal of Environmental Quality 29, 1–9.
Sharpley, A.N. and Halvorson, A.D. (1994) The management of soil phosphorus availability and its impact onsurface water quality. In: Soil Processes and Water Quality (Eds R.Lal and B.A.Stewart). CRC Press, Inc,Boca Raton, Fla, pp. 7–90.
Sharpley, A.N., Smith., S.J. and Naney, J.W. (1987) Environmental impact of agricultural nitrogen andphosphorus use . Journal of Agricultural Food Chemistry 35, 812–817.
Smith, K.A., Chalmers, A.G., Chambers, B.J. and Christie, P. (1998) Organic manure phosphorusaccumulation, mobility and management. Soil Use and Management 14, 154–159.
Steén, I. (1997) A European fertiliser industry view on phosphorus retention and loss from agricultural soils.In: Phosphorus Loss from Soil to Water. (Eds H.Tunney, O.T.Carton, P.C.Brookes and A.E.Johnston).CAB International, Wallingford, pp. 311–328.
Tisdale, S.L, Nelson, W.L., Beaton, J.D. and Halvin, J.L. (1993) Soil Fertility and Fertilisers. 5th Edition.Prentice Hall, New Jersey.
Tunney, H. (1992) Some environmental implications of phosphorus use in the European Community. In:Phosphorus, Life and Environment, from Research to Application. Proceedings of the 4th InternationalIMPHOS Conference, Ghent, Belgium. World Phosphate Institute, Casablanca, Morocco, pp. 347–359.
Tunney, H., Breeuwsma, A., Withers, P.J.A. and Ehlert, P.A.I. (1997) Phosphorus fertiliser strategies: presentand future . In: Phosphorus Loss from Soil to Water (Eds H.Tunney, O.T.Carton, P.C.Brookes and A.E.Johnston). CAB International, Wallingford, pp. 177–203.
Uusi-Kämppä, J., Braskerud, B., Jansson, H., Syversen, N. and Uusitalo, R. (2000) Buffer zones andconstructed wetlands as filters for agricultural phosphorus. Journal of Environmental Quality 29, 151–158.
Valk, H., Metcalf, J.A. and Withers, P.J.A. (2000) Prospects of minimizing phosphorus excretion inruminants by dietary manipulation. Journal of Environmental Quality 29, 28–36.
Van der Molen, D.T., Breeuwsma, A., Boers, P.C.M. and Roest, C.W.J. (1997) Dutch policy towardsphosphorus losses in agriculture. In: Phosphorus Loss from Soil to Water (Eds H.Tunney, O.T.Carton,P.C.Brookes and A.E.Johnston). CAB International, Wallingford, pp. 407–409.
White, R.E. (1997) Principles And Practice Of Soil Science, The Soil as a Natural Resource. 3rd Edition.Blackwell Science Ltd, Oxford.
Whitelaw, M.A., Harden, T.J. and Bender, G.L. (1997) Plant growth promotion of wheat inoculated withPenicillium radicum sp. nov. Australian Journal of Soil Research 35, 291–300.
Wild, A (1981) Mass flow and diffusion. In: The Chemistry of Soil Processes (Eds D.J.Greenland and M.H.B.Hayes). John Wiley and Sons, Chichester, pp. 37–80.
Withers, P.J.A. (1996) Phosphorus cycling in UK agriculture and implications for water quality. Soil Use andManagement 12, 221.
Withers, P.J.A., Davidson, I.A. and Foy, R.H. (2000) Prospects for controlling non-point phosphorus loss towater: a UK perspective. Journal of Environmental Quality 29, 167–175.
Withers, P.J.A. and Jarvis, S.C. (1998) Mitigation options for diffuse phosphorus loss to water. Soil Use andManagement 14, 186–192.
Withers, P.J. and Sharpley, A.N. (1995) Phosphorus fertilisers. In: Soil Amendments and EnvironmentalQuality (Ed. J.E.Rechcigl). CRC Pres, Inc, Boca Raton, Fla, pp. 65–107.
68 CHAPTER 3

4Soil Erosion
4.1INTRODUCTION
The erosion of soil by water and wind is linked intimately with the cultivation of land, which canbe traced back to at least 5000 BC (Goudie, 2000). Natural rates of erosion tend to be highest insemi-arid regions of the world, where sparse vegetation cover and intense climatic conditionscombine to generate significant erosive potential. Historically, rates of soil loss by erosion havebeen lower in temperate and tropical regions, where more continuous vegetation cover reduces theerosive potential of heavy rainstorms or strong winds. The repeated cultivation of land for cropproduction and the removal of protective forest cover have resulted in soil becoming morevulnerable to erosion. The consequences of these losses can be severe not only for the productivecapacity of the land, but also for habitats and environments downstream or downwind whereproducts of erosion are deposited.
The impact of soil erosion within individual fields that have been affected by run-off or wind-blow is obvious, and has been the subject of much research activity since the 1940s, particularly inthe United States (Morgan, 1995; Hudson, 1995). Off-farm impacts have received less attention,but are now recognised as an equally important component of the sediment loss issue. This chapteris subdivided into three sections that focus on the main causes of soil erosion from agriculturalland, the resultant impacts on aquatic and terrestrial environments, and strategies that can beadopted to mitigate against soil erosion. The impacts associated with nutrients and pesticides lostfrom agricultural land in run-off are described in Chapters 2 (Nitrates), 3 (Phosphates) and 7(Pesticides). In this chapter, the processes, extent and management of sediment loss by soilerosion are considered.
4.2VULNERABILITY OF SOIL TO EROSION AND DEGRADATION
Extent of erosion
The serious widespread consequences of erosion from agricultural land were demonstrated in theSouth Western United States during the 1920s and 1930s, a period that is still referred to as the‘dust-bowl years’ (Tivy, 1990). The repeated cultivation of semi-arid temperate grassland lead to

accelerated erosion by wind and water. Soils degraded and lost their productive potential, whilewind blown sediment was transported many hundreds of kilometres from the source. Despite theintroduction of soil conservation strategies in many parts of the world particularly vulnerable toerosion, notably the semi-arid climatic zones, soil loss by erosion and consequent pollutioncontinue to be a major environmental concern. In the United States, the Agricultural ResearchService estimated total erosion losses of soil from cultivated land in 1992 of 3100 Mt year−1 (USDA,2001). Current rates of erosion average 8.5 t ha−1, which has lead to the US Environmental ProtectionAgency classifying siltation and nutrient enrichment as the major pollutant of freshwater in theUnited States, affecting 45% of rivers and lakes (NRCS, 1997). About 90% of US cropland iscurrently losing soil above the sustainable rate (i.e. that is faster than it is being formed). The Foodand Agriculture Organisation (FAO) estimate that soil erosion rates in parts of Asia, Africa andSouth America are estimated to be about twice as high as in the USA. The FAO estimates that 140million ha of high quality soil, mostly in Africa and Asia, will be degraded by 2010, unless bettermethods of land management are adopted (FAO, 2001).
In temperate regions sediment loss by erosion is perceived to be a less serious problem than insemi-arid environments. In the UK rates of soil loss are generally low, but have been increasing inrecent years (Evans, 1996a). Successive reports by the Royal Commission on EnvironmentalPollution (RCEP, 1979, 1984, 1996) have drawn attention to the increasing environmental impactof sediment and nutrient losses by erosion. Soil surveys have shown that between 37 and 45% ofarable land is at risk of erosion, and that on average 5% of that arable land will erode in any oneyear (Morgan, 1995). In a review of the impact of modern farming practices on the soil, Webb etal. (2001) noted that some soils, notably those on chalk parent materials or with sand/light loamtexture, tended to be most vulnerable to erosion, but that in most cases crop yield was not affectedby these losses, provided adequate fertiliser was applied. However, these authors did note thatwhere erosion was occurring regularly, there was a need to reduce the off-farm impacts, such assilting of reservoirs and damage to fish spawning grounds.
Soils in upland areas are also vulnerable. Increased grazing pressure on the deep peat moors ofNorthern England, Wales and Scotland has lead to erosion and consequent loss of habitat anddownstream impacts, such as water supply contamination (Evans, 1996a; Grieve and Hipkin,1996). In some areas up to 20% of peat has been eroded, although it is difficult to distinguishhuman and natural causes of this soil loss. The RCEP 19th Report ‘The Sustainable Use of Soil’concluded that erosion is a problem in soil upland areas of the UK, where it can have seriousimplications for conservation of habitats or plant communities. Erosion of arable land was notidentified as a major national problem, nor was it seen to be seriously affecting the productivity ofagricultural land. However, loss of soil particles carrying nutrients and pesticides were identifiedas a significant cause of environmental damage beyond the farm boundary (RCEP, 1996).
Elsewhere in Europe, soil erosion is also a serious problem, especially in southern Europe. It iscaused by a combination of climatic conditions, steep slopes, thin vegetation cover and agriculturalpractices that leave the soil exposed to erosive agents. The areas with the greatest severity of soilloss due to both wind and water erosion are the Mediterranean, the Balkan Peninsula and thecountries surrounding the Black Sea. In Ukraine, for example, 41% (17 million ha) of agriculturalland was subjected to water and wind erosion in 1996 (EEA, 2001). In Sweden, rill and gullyerosion by water affects on average 7% of arable fields each year, with typical rates of soil loss
70 CHAPTER 4

averaging 0.8 t ha−1 year−1, and ranging up to 120 t ha−l year−l (Alstrom and Akerman, 1992). Theextent of vulnerable soils in Western Europe was described in the soil erosion map produced onbehalf of the European Union (De Ploey, 1989).
Processes and products of erosion
Erosion and sediment transfer is a natural process that progressively transforms landscapes at arate dependent primarily upon climate and geology. Unmanaged landscapes change imperceptiblyin human terms. Removal of the natural vegetation cover leads to accelerated erosion. The ratio ofnatural to accelerated erosion varies widely according to climatic controls. Table 4.1 illustrates thetypical erosion rates under natural vegetation and cultivated land. Removal of the protectivevegetation cover results in losses being accelerated by several orders of magnitude. Typical soilloss rates in the UK are 0.1–0.5 t ha−1 year−1, which equates to a layer of soil approximately 0.01–0.05 mm deep. This is equivalent to the rate at which soils form in temperate climates, and can bedescribed as a sustainable loss to which adjacent aquatic and terrestrial habitats are naturallyadjusted. However, the topsoil lost by erosion is the most fertile, as it contains the main soilorganic matter and nutrient reserves. Accelerated erosion induced by cultivation can lead to soillosses up to 20 t ha−1 year−1 or greater. These losses are often very localised, and can thereforehave a major impact on adjacent habitats, such as streams and rivers.
Table 4.1 Typical erosion rates under natural vegetation and cultivated land in selected countries(Morgan, 1995).
Soil erosion is the process by which sediment is detached and transported, usually by water orwind, from one location to another. The detachment and transport of material from one locationcan be quantified in terms of an erosion rate, and can be related to causal processes, either naturalor human-induced. The impact of these sediments and associated chemical pollutants depends onthe depositional environment, which may be many kilometres from the source. However, todevelop effective management strategies, a clear understanding of erosion processes is essential,as it is the nature of the process, acting on a particular material, that controls the potentialenvironmental impact.
Soil loss and sediment transport depends upon:
• erosivity—the potential of the rainfall or wind to erode the soil surface;• erodability—the susceptibility of the soil to erosion.
Erosivity is controlled by natural climatic processes, while the erodability can be directlyinfluenced by human activities associated with the cultivation of land. The two main erosive
SOIL EROSION 71
agents that operate on agricultural soils are water and wind. In both cases soil particles must firstbe detached from adjacent particles, prior to being transported (Box 4.1).
Water erosion
Particle detachment by raindrop impact depends upon the kinetic energy of the rain, KE, which isgiven by:
where m is the raindrop mass and v is the terminal velocity. As raindrop diameter and hence massincreases with intensity, the characteristics of the rainfall are important in controlling thelikelihood of detachment. In UK conditions, erosivity of rainfall reaches a maximum at 25–50 mmh−1, rates that are experienced in heavy conventional storms. Field-based monitoring of watererosion incidents has shown that regularly cultivated soils in the UK are being eroded by lowintensity rainfall, in the range 5–10 mm h−1 (Evans, 1996a). Amounts of soil lost from individualfields can exceed 20 t ha−1 in severe localised cases. The impact of such events depends on thecharacteristics of the depositional environment (Figure 4.1). If immediate, localised deposition of
Figure 4.1 Rill erosion in a winter cereal crop.
fine sand and silt-sized sediment occurs in a watercourse, then the impacts on aquatic organismscan be dramatic. More usually, sediment disperses through the downstream channel network andas a result the environmental impact is more diffuse.
72 CHAPTER 4

Particle transport by flow over the soil surface occurs when surface depression storage and theinfiltration capacity is exceeded (Morgan, 1995). Flow is rarely uniform, but concentrates inshallow natural topographic depressions, or man-made channels, such as tractor wheelings. Forparticles larger than 0.2-mm diameter (fine sand sized and greater, the potential to transportdetached particles is controlled by the velocity of the run-off and the particle diameter. Erosionrisk is greater with higher water velocity and smaller particle size. Coarser sand and gravel-sizedmaterial moves less frequently, and tends to be redistributed within fields during an erosionevent, as is evidenced by the fans of material deposited at the base of rills and gullies. For finermaterial, below 0.2-mm diameter, erosion potential depends on whether the particles derive froma cohesive (clay-rich) or non-cohesive soil, with the latter being more vulnerable to transport.
Figure 4.2 Soils at risk of water erosion in England (MAFF, 1999a).
The spatial distribution of soils vulnerable to water erosion reflects the importance rainfallcharacteristics, surface topography and soil texture. Figure 4.2 shows the soils at risk from watererosion in England. The highest risk soils are those containing a high proportion of sand and siltthat occur on slopes >7°. The assessment of erosion risk, and methods for reducing the
SOIL EROSION 73

vulnerability of soils to erosion, such as maintaining a high soil infiltration rate and reducing thecatchment area to minimise the risk of sediment associated run-off are discussed later in thischapter.
BOX 4.1PROCESSES OF EROSION (MORGAN, 1995)
The two major transport agents are water and wind. Erosion is a two-phase process:detachment of soil particles, followed by transport. When sufficient energy is no longeravailable to transport the particles, then deposition occurs.
WaterDetachmentRainsplash, controlled by intensity of rainfall, soil characteristics (e.g. texture and organic matter
content) and soil antecedent conditions. Coarse silt and fine sand-sized particles (0.05–0.20-mmdiameter) are most easily detached by rain.
Overland flow, occurs when surface storage and infiltration capacity of the soil is exceeded. Flowvelocity and soil coherence controls particle detachment rate. For example, clay particles are moreresilient to detachment because of the cohesiveness of individual clay particles.
TransportOnce a particle has become entrained, it will be transported by water until the energy in the flow
reduces below a threshold that is grain size dependent. Coarser, sand-sized particles are depositedfirst (closest to the source of the sediment) while silt and clay-sized material (<0.06-mm diameter)tends to remain in suspension for longer.
WindDetachmentThe capacity of wind to detach particles depends upon the critical shear velocity of the wind, which
is controlled by wind speed and surface roughness. Particles between 0.10 and 0.20-mm diameterare most susceptible to wind erosion.
TransportOnce detached in motion, sediment transport takes place in suspension (for particles <0.2-mm
diameter) or saltation (bouncing). This saltation process will detach other particles. Depositionoccurs when wind speed is reduced, for example by a barrier such as a hedge.
Wind erosion
Soil erosion by wind is most common in arid areas, and on coastlines, where winds are strong andvegetation is sparse due to salt deposition. The severity of wind erosion depends on wind speedand soil/vegetation surface roughness (Box 4.1). Once soil particles have become detached and arein motion, they can be transported considerable distances. A sequence of drought years in the1930s in the South West USA resulted in the transport of fine sand and silt-sized particles morethan 1000km from the source of the erosion (Goudie, 2000). The resulting sedimentation isregarded as one of the most widespread forms of water pollution (Tivy, 1990). As with watererosion, the disaggregation and transport of surface soil horizons by wind removes particulatematerial that includes organic, nutrient-rich components associated with the finer fractions of the
74 CHAPTER 4

eroded material. These fractions tend to fall within the range 0.05–0.5-mm diameter (Morgan,1995).
In the UK, the more temperate climate and surface topography tends to restrict the area of soilsvulnerable to wind erosion. Mostly, it is the fine sandy and peat soils in arable cultivation that arevulnerable to loss. Most ‘wind-blows’ tend to occur in the spring and early summer, and affectfields planted to high value crops such as sugar beet, onions and carrots (Evans, 1996a; MAFF,1998). Estimates of the spatial extent and quantity of soil lost during periods of wind erosion arenecessarily tentative, due to the difficulties in measuring deposition rates across large areasdownwind of a ‘wind-blow’. Evans and Cook (1986) observed moderate and severe blows in theCambridge peat fens and Nottinghamshire sandlands in 5 or 6 years in 10, with soil loss rates of 5–10 m3 ha−1 being typical.
Agricultural land management practices and accelerated erosion
Many land management practices have been found to increase erosion risk. Often these areintegral with the progressive intensification of agriculture that has occurred in recent decades.Globally, it is acknowledged that the progressive increase in area of cultivated land during thetwentieth century has exposed more land, often unsuitable for arable cultivation, to the erosiveforces of water and wind (Parkinson, 1995; Brown et al., 2000).
Agricultural land management practices that are known to increase the vulnerability of soils toerosion are given in Table 4.2. In many cases, it is the combination of a number of these practiceswith naturally erodible soils or steep slopes that leads to enhanced risk of serious erosion.Repeated cultivation changes the soil configuration, and has been shown to reduce the organicmatter content of soils such that structure stability can be compromised. Surveys conducted by theNational Soil Resources Institute in England and Wales have revealed that soil organic matter levelsin arable and ley-arable cropping have declined by an average 0.5% over the 15-year period 1980–1995 (MAFF, 2000). For sandy soils that tend to have a naturally low organic matter content, thecontinued loss of organic matter can lead to capping of the soil surface on rainfall impact. Thisreduces infiltration and allows runoff to occur more frequently. For a detailed review of soilfactors influencing accelerated water erosion, see Evans (1996b).
Table 4.2 Land management practices which increase vulnerability of soils to erosion.
Crop rotation exerts a significant influence on susceptibility to erosion. Evans (1996a) notesthat the shift from spring to winter cereals in the UK since the 1970s, encouraged by changing EU
SOIL EROSION 75

price support mechanisms, has lead to an increase in incidence of within-field river bank and ditcherosion, accompanied by the siltation of more gently sloping reaches of rivers. Cultivation anddrilling of autumn sown crops such as winter wheat and oilseed rape leaves the soils with a finesurface during the autumn period. Late drilling and heavy autumn rainfall have lead to theincreased incidence of water erosion in recent years in the UK (Davidson and Harrison, 1995).Similarly, spring sown crops such as potatoes and sugar beet have been implicated in seriouserosion of vulnerable soils. In a survey of erosion and farming practices in England and Wales,Skinner and Chambers (1996) asked farmers to consider which land management practices wouldaffect the severity of soil erosion. The factors identified in order of priority were arable cropping(20%), tractor wheelings (16%) and tramlines (8%). Removal of hedges, which leads to anincreased catchment area for developing rills and gullies has also been found to be important(MAFF, 1998, 1999b). In the United States, continuous maize production in the absence of soilconservation measures has made a significant contribution to soil loss from agricultural land(NRCS, 1997).
Ultimately, it may be that major changes in methods of cultivation and the intensity of land useare needed to reduce rates of erosion from agricultural land. Reganold et al. (1987) reported onthe long-term effects of conventional and organic farming on soil productivity, depth and erosionrates on soils in Washington State, USA. Silt loam soils on two adjacent farms were cultivated withwinter cereals for 37 years. At the end of the period the topsoil of the organically farmed soil was16cm deeper than the conventionally farmed soil. The differences were attributed to significantlygreater losses of soil by erosion on the conventionally farmed soil. Measured losses on theconventional field in this area, where soil erosion rates were high, averaged 32 t ha−1, while thosefrom the organically farmed soil were four times lower, typically 8 t ha−1. It was predicted that atthe current rate of erosion, all the topsoil on conventional farms growing cereals would be lost bythe third decade of the twenty-first century.
76 CHAPTER 4

4.3ENVIRONMENTAL IMPACTS OF SOIL EROSION
Impacts of sediment on aquatic environments
The transfer of soil particles eroded from farmland to adjacent watercourses can have significantimpacts on water quality. Some impacts, primarily those of a physical nature, are transient, aserosion is an episodic process, linked to infrequent, high magnitude climatic events. Otherimpacts, associated with chemical pollutants, tend to have a cumulative in effect on aquaticorganisms. Most authorities (for example, NRA, 1992) classify these impacts as diffuse pollution,as major erosion events tend to affect large areas of land within a given catchment. Successfulstrategies to control losses and mitigate against these impacts tend to be catchment based(Napier, 1990).
Physical impacts
Erosion generates particulate material, predominantly of an inorganic nature, that can havedeleterious impacts on both plant and animal life. Despite the fact that erosion events are short-lived, the impacts can be very persistent. Clearly, the frequency of storm events controls the abilityof an aquatic ecosystem to re-adjust to less sediment rich conditions after run-off events. Physicalimpacts on aquatic organisms tend to be difficult to assess, as periods of high suspended sedimentconcentration are accompanied by oxygen depletion and elevated concentrations of chemicalpollutants, such as pesticides bound to silt and clay. Example impacts of lowland rivers in the UKare given in Table 4.3.
Table 4.3 Physical impacts of increased sediment load on aquatic organisms (Leeks, 1995; Evans,1996a).
The impacts of soil erosion can be very localised. For example, at a confluence between a smallditch or stream which is supplying the sediment, and a larger river inhabited by a wide range of
SOIL EROSION 77

aquatic organisms. Sand-sized sediment (<0.06-mm diameter) tends to deposit close to the sourceof the erosion, where the energy of the flow medium declines below the critical thresholdnecessary to maintain the sand in suspension. Finer silt and clay-sized sediment can betransported many kilometres from the sediment source and present a pollution risk to rivers andestuaries downstream. Ironically, the impact of sedimentation in gravel-bedded rivers can beexacerbated by drought after a period of flooding (Leeks, 1995). Dry periods and low flow cancause the consolidation of the bed matrix, resulting in persistent long-term difficulties forspawning fish.
Long-term studies such as that conducted by Heaney et al. (2001) demonstrate that declines inthe freshwater survival of salmonids may at least in part be attributed to diffuse inputs of finesediment which smothers salmon spawning redds. Susceptibility of juvenile salmon during the eggto smolt stages is particularly evident; the deposition of sediment creates anaerobic conditionsthat favour nitrate and ammonia production, which is particularly toxic to salmonids (Massa etal., 2000). Sediment also reduces oxygen availability to eggs buried within the redds which alsocontributes to mortality (Soulsby et al., 2001). Hence, changes to the management of agriculturalland is necessary if this problem is to be reduced. As well as attempts to improve the managementof soil to minimise sediment losses, organisations such as the Environment Agency also conductremedial actions (for example, by ‘ploughing’ spawning areas inundated with sediment) toimprove spawning success.
Reduction in water quality and the consequent decline in fish numbers due to persistentaccelerated erosion have impacts on economically important fisheries (Evans, 1996a). Waterpurification and treatment costs increase as sediment concentration increases, but it is notpossible to identify the proportion of the costs that can be attributed to the removal of sediment asopposed to other treatment costs. Evans (1996a) noted that the water industry in England andWales invested £1.8bn between 1991 and 1996 in drinking water treatment, and postulated that ifonly 1% of these costs were attributed to treatment to remove excess sediment in the water, thatamounted to £3.6 m year−1. Young and Osborn (1990) noted that the Conservation ReserveProgram (CRP) in the United States in the 1970s and 1980s produced economic benefits estimatedbetween US$6 bn and US$13 bn. The principal benefit was the reduction in off-farm impacts oferosion, which were cut by 25%. In particular, surface water quality increased significantly,reducing water treatment costs and eutrophication/sediment problems. There will be additional,largely unquantified water supply costs in catchments where reservoirs are used to store water.Sedimentation at rates greater than that predicted at the reservoir design stage due to greaterrates of soil erosion will decrease the effective life-span of the reservoir and increase the waterpurification costs.
Chemical impacts
The main chemical pollutant impact of sediment derived from erosion of agricultural land relatesto those materials bound to soil particles that desorb in receiving freshwaters. These chemicalspecies include macronutrients, notably phosphorus, that contribute to eutrophication, andpesticides. Previous studies have demonstrated the close link between phosphorus losses fromagricultural land and the extent of surface runoff and erosion (Heathwaite, 1997). Phosphorus is
78 CHAPTER 4

strongly bound to clays and sequioxides, and is an integral component of soil organic matter(Chapter 4). Disaggregation of soil particles leads to preferential transport of clay, silt and finelydivided organic matter, that contains bound particulate P. Studies in small catchments inDenmark showed that between 45 and 82% of the P transported to watercourses can be inparticulate form, equating to 0.05–0.47 kg P ha−1 (Kronvang, 1990; Hasholt, 1991). Sharpley andSmith (1990) reported that particulate P accounted for an average 85% of P transported fromcropped watersheds in South West USA. Run-off derived particulate P typically accounted for 90%of the total P losses from arable land observed by Catt et al. (1994) in experiments conducted insouthern England.
Once sediment-bound P has been transported and deposited in river channels, the ecologicalimpact will be dependant upon the rates of P desorption. This process is complex, both physicallyand chemically, and is discussed in detail by Gibson (1997). Physical disturbance of sediments, forexample during subsequent flood episodes, or by human activity, will stimulate the release ofsoluble P that is bio-available to algae and diatoms. Changes in the chemical environment in riversand lakes, notably the redox potential and the availability of free Fe and Ca to form complexes,will have a marked impact on P release rates. Actual release rates are very variable, but sedimentscontaining in excess of 1 mg Pg−1 dry sediment are liable to release P that has been transportedinto the waterbody bound to the sediment (Gibson, 1997).
The transfer of pesticides bound to sediment eroded from agricultural land is another seriousimpact of accelerated soil loss. Routine analysis of drinking water is conducted throughout Europein order to assess compliance with standards set by the European Commission. Maximumadmissible concentrations for potable water should not exceed 0.1 µg l−1 for a single pesticide and0.5 µg l−1 for all pesticides (Chapter 7). Residual herbicides such as the triazine group are designedto bind to soil particles and then kill germinating seedlings during the early phases of cropestablishment. Experimental evidence describing the magnitude of pesticide loss from agriculturalland directly associated with surface runoff and soil erosion is restricted, as few samplingprogrammes are adapted to sample sediment being transported from fields during runoff events.In a study conducted on arable land in Herefordshire, UK, Matthiessen et al. (1992) observedconcentrations for individual herbicides up to 680 times higher than under background, low flowconditions.
The increased frequency of erosion from forage maize crops, particularly in south west Englandhas lead to concerns expressed by the Environment Agency. The area of forage maize grown in southwest England has increased six-fold between 1988 and 1995 (Environment Agency, 2001). Surveysof water quality indicate that although the total amount of the herbicide atrazine, which is usedwidely on maize seedbeds, has declined in recent years, it still forms a significant proportion of thetotal pesticide load. The Environment Agency also note that land used for growing maize is also atrisk from erosion because fields are often left compacted and bare over winter.
Horticultural crops can be particularly prone to loss of pesticides bound to sediment due to lowground cover and high rates of pesticide applications. Harrod (1994) measured concentrations ofthe organochlorine insecticides aldrin and deldrin in excess of 1000 µg kg−1 in sediment rich run-offfrom daffodil bulb fields in South West Cornwall, UK. Subsequent analysis of dieldrin levels in eelsdownstream the Newlyn River, Cornwall showed concentrations greater than 20,000 µg l−1 freshweight. These organochlorine pesticides have residence times in excess of 12 months, which
SOIL EROSION 79

accounts for the continued measurement of these persistent pesticides in sediments and 3 yearsafter their use was banned in intensive horticultural production systems (Chapter 7).
Impacts of sediments on land
Although not regarded as pollution in the traditional sense, sediment losses from within fields andredeposition elsewhere within the terrestrial environment can have a significant local impact onenvironmental quality as well as having consequences for human health and the local ruraleconomy. Some of these physical impacts, which are very difficult to quantify, are summarised inTable 4.4. Severe erosion can lead to reductions in crop yields (for example, Catt et al., 1994;Chambers and Davies, 1995) and increased reliance in inputs of fertilisers and otheragrochemicals to maintain yields. Crops downslope of an eroded field may be smothered bysediment, hence retarding growth. The deposition of nutrient-rich sediment may impact on theecology of surrounding non-farmed habitats. A number of off-farm impacts are listed in Table 4.4.These are not discussed further here, but further information may be obtained from Evans(1996a) and Boardman et al. (1990).
Table 4.4 Physical impacts of sediment transport and deposition on the terrestrial environment.
4.4PRACTICAL SOLUTIONS TO SOIL EROSION
The consequences of accelerated soil erosion can be severe, resulting in loss of the productivitycapacity of soil on-farm, and major environmental degradation off-farm. Strategies to control soilloss and hence minimise pollution attributable to this source vary from very simple, cost-effectiveand locally applied measures to catchment-wide government support initiatives, supported byfinancial and technical aid. Morgan (1995) defined the aim of soil conservation ‘to obtain themaximum sustained level of production from a given area of land whilst maintaining soil lossbelow a threshold level which, theoretically, permits the natural rate of soil formation to keep pacewith the rate of soil erosion’.
80 CHAPTER 4

In essence, the function of erosion control strategies is to reduce rates of sediment loss close tothat which would occur under natural conditions. In theory, this will reduce loss of nutrients andpesticides to a minimum, decrease rates of sedimentation of watercourses and minimiseterrestrial impacts. It is unlikely that accelerated erosion impacts can ever be completely halted inagricultural systems that utilise field scale cultivation methods to establish crops. The target is toreduce loss rates to the rate of soil formation, which in temperate climates average 0.1 mm year−1
(approximately equivalent to 1 t ha−1, assuming a soil bulk density of 1 tm−3). Sound strategies forcontrol of erosion are based on detailed assessment of erosion risk, prior to the implementation ofcontrol measures at either the field or the catchment scale.
Erosion control strategies can operate at different scales and utilise contrasting approaches.Agronomic and soil management measures control soil detachment and transport, operate at thefield and farm scale, and through a concerted regional or catchment co-ordinated approach can beapplied across many farms in vulnerable areas. Several of these approaches are described here.Mechanical or physical methods will control transport of sediment rather but do little to preventdetachment, and tend to be expensive solutions to erosion problems. Examples of mechanicalmethods include bunding and terracing, which are described in detail by Hudson (1995) andMorgan (1995). This section focusses on erosion risk assessment and control using appropriatesoil management and crop husbandry.
Assessment of erosion risk
The assessment of potential vulnerability to erosion is based on conducting a rigorous, farm scaleevaluation (FSE) of site characteristics (MAFF, 1999a). In the UK, most advice is directed towardsthe control of water erosion. Key criteria are soil texture, slope and annual rainfall. A riskassessment should be based on a field by field examination, noting topographical features thatmight be of importance in controlling run-off, such as hollows where gullies might form. Table 4.5gives the erosion risk for soils in areas of England and Wales where the rainfall exceeds 800 mmyear−1. Additional factors such as organic matter content, soil structure, land use history and localknowledge are important in assessing erosion potential. Once the risk has been assessed forindividual fields, the preparation of a farm erosion risk assessment map will indicate wherecontiguous fields can increase the risk. For example, two high risk fields separated by a fence linewill pose a greater risk of erosion due to the impact that the combined surface run-off could haveon the topographically lower parts of the farm. Risk assessment definitions are given in Table 4.6.For land classed as high and very high risk to erosion, it is recommended that precautions be takenprior to the cultivation of those crops which are known to increase erosion potential.
Field and crop based erosion control strategies
Evaluation of site susceptibility to erosion allows the adoption specific soil and crop managementstrategies that usually concentrate on high and very high risk land categories. The recommendedcropping for these categories of land in England and Wales are shown in Table 4.7. If crops knownto be associated with high erosion risk are to be grown, then appropriate soil and crop husbandrymeasures should be carried out prior to and during the growth of the crop.
SOIL EROSION 81

Table 4.6 Field/soil erosion risk definitions (MAFF, 1999a).
Table 4.7 Recommended cropping strategy for high and very high risk sites (after MAFF, 1999a).
There are a variety of management strategies that can be adopted once the vulnerability of a soilhas been recognised and the appropriate choice of crop made for that site. Strategies tend to beadapted to particular climatic zones and agricultural systems. For UK cropping situations detailedguidelines are given by MAFF (1998, 1999a, b). These guidelines identify a number of goodmanagement practices for the control of water erosion:
• plan the type and timing of cultivations to minimise the period when the soil is left vulnerableto erosion. Fine seedbeds and bare land after root crop harvesting are noted as potential risks.Compaction at plough depth or in tramlines should be avoided in high risk situations;
Table 4.5 Erosion risk classes for areas of England and Wales where average annual rainfall exceeds 800 mmyear−1 (MAFF, 1999a).
82 CHAPTER 4

• cultivating across the slope is noted as likely to reduce the risk of run-off on gentle slopes, but willhave less effect on steeper, undulating topography;
• avoid the preparation of fine seedbeds for vulnerable soils, and if possible use non-inversiontillage methods that retain some residues from the previous crop on the soil surface;
• avoid deep ploughing to retain organic matter near the soil surface;• increase the stability of topsoils by the regular use of bulky organic manures, taking care to
avoid excessive amounts of nitrogen due to the nitrate leaching risk. Application of slurries canalso help to increase organic matter content of soils, but the impact is less than for manures dueto the lower DM content of slurry;
• consider adjusting the crop rotation to maximise the winter cover and extend the use of longgrass leys;
• select varieties that can be harvested in a more timely manner to avoid wetter periods of theyear and to allow more timely establishment of the next crop.
Specific recommendations for winter cereals are given as an example below.
• remove any compaction present before establishing the crop, and time operations to minimiserisks of causing further compaction;
• where possible establish without ploughing and allow some chopped straw to be left on thesurface;
• avoid overworking the soil; leave seedbeds as coarse as practicable and sow early enough toachieve a minimum of 25% crop cover before early winter;
• ideally, drill without tramlines, or avoid using tramlines until the spring and avoid rolling in theautumn, especially if the soil is wet;
• following harvest, leave land in stubble, preferable with a cover of chopped straw, until the nextcrop can be established.
Strategies to control wind erosion in the UK, based on MAFF (1999b), include:
• provision of shelter belts of trees or hedges on vulnerable sites to reduce the erosive potential ofthe wind. Shelter belts should allow 30–50% of the wind to pass through. The benefit of ashelter belt usually extends about 20 times its height downwind;
• provision of extra protection for establishing crops by use of nurse crops, such as winter barleyor rye, or plant straw to increase soil surface roughness;
• use of mulches, for example paper sludge or sugar beet waste to help stabilise the soil surface;• where possible increase the soil surface roughness, by using fewer cultivations.
Within field soil conservation and crop management strategies in tropical and sub-tropical regionsis based on similar good management to that recommended for the UK, but with particularemphasis on maximising and maintaining ground cover (Hudson, 1995; Morgan, 1995). Cropsthat are grown in rows, tall tree crops and low-growing crops with large leaves are particularlyvulnerable to erosion. For example, the continuous cultivation of maize and soybeans in theCornbelt of the United States has produced serious, persistent erosion problems that have beeneffectively tackled through Soil Conservation Service programmes focussing on stubble-mulch
SOIL EROSION 83

cultivation (Napier, 1990). For successful implementation of erosion control measures, changes incrop husbandry practices must be technically sound, and socially and economically acceptable.
Farm and catchment based erosion control strategies
In order to be fully effective, erosion control strategies must operate at field, farm and catchmentscale. Vulnerability to water and to a lesser extent wind erosion is topography-dependent. Farmscale approaches are based on understanding water and wind erosion concentration zones withinthe farmed landscape. MAFF (1999a) recommend the use of grassed buffer strips and set-asideland to reduce erosion risks in concentration zones such as valley floors, particularly at the base ofsteep slopes. These zones are also able to act as semi-natural filters to retain sediment that hasmobilised upslope. In this way, the impact on off-farm environments can be minimised. Bufferstrips are discussed in more detail in Chapter 3 in relation to the control of P losses from farmland.To effectively detain sediment from runoff, it is recommended that these strips be at least 20-mwide (Davies and Christal, 1996). Verstraeten and Poesen (1999) report on the use of earth-bunded retention ponds, usually <1 ha in area, to detain sediment generated by surface run-off inBelgium. These ponds need to be regularly cleaned out and the sediment returned to farmland inorder to maintain their effectiveness.
BOX 4.2THE US CONSERVATION RESERVE PROGRAMME (NAPIER, 1990; YOUNG ANDOSBORN, 1990; USDA, 2001).
The Conservation Reserve Programme was introduced in the early 1980s, and wasdesigned to remove highly erodible land from agricultural production. Agents of the USFederal Government are authorised to enter into contractual agreements with landownersfor removing land from production for a 10-year period. Compensation payments weremade to farmers who could not use registered land for the production of food or fibrecrops. Registered land had to have a continuous groundcover, which could be establishedwith grant aid, but thereafter should be maintained by the landowner.
Landowners were allowed to register land that had been cultivated at least once during the period1981–1985. Approximately 9 million hectares have been enrolled in the scheme, at a cost of $1.1million year−1 for the late 1980s and early 1990s. Overall the programme has been estimated to haveproduced a net economic benefit of between $3400 and 11,000 m, 25% of which have been attributedto the reduction in water treatment costs.
Assessments of the environmental impact of the CRP have demonstrated that significant reductionsin soil loss have been achieved. In Ohio, 60,000 ha have been enrolled with reductions in sedimentlosses averaging 37 t ha−1. Much of this land is now eroding at rates of <2 t ha−1. Average erosion rateon CRP-enrolled lands across the US has declined from 50 to 3 t ha−1 year−1, and there has been anestimated reduction in erosion of 694 t year−1.
The implementation of catchment and region-wide schemes, supported by governmentinvestment, has been shown to be very effective in reducing sediment loss rates. The US CRP issummarised in Box 4.2. This is an example of an approach to soil erosion that considers sediment
84 CHAPTER 4

pollution and the reduction of the productive potential of farmland to be a serious problem. Therehave been many examples of effective catchment-based erosion control schemes. Most of theserely on improving traditional systems instead of imposing new techniques from outside. Morgancites an example from Mali, West Africa where serious erosion to land producing a range of arablecrops and fodder for livestock. After a series of experimental measures were evaluated, it becameclear that a combination of tree planting, contoured grass strips, stone bunds, diversion drains andsome terracing provided more protection for the land. These measures were zoned across thelandscape (see Figure 4.3). In this way, it is possible to integrate measures that when combined tominimise within-field erosion losses and detain any material that does become mobilised as closeto the source as possible. Hence off-farm pollution risks are reduced to a minimum.
Figure 4.3 Catchment based soil conservation scheme on cultivated land in southern Mali (Hijkoop,van der Poel and Kaya, 1991, cited in Morgan, 1995).
The re-establishment of a permanent ground cover may be the only solution to persistent soilerosion problems, particularly in regions where the sediments impact upon sensitive habitats.Predictions are that in a changed climatic scenario of warmer, wetter winters for much of WesternEurope, the incidence of soil erosion will increase (Boardman and Favis-Mortlock, 1993). Theimpact of climate change will be complex, but two important factors will directly affect erosionrates. Greater winter rainfall will increase the erosivity, while warmer temperatures will increaserates of organic matter loss and reduce soil structural stability, thus increasing erodability. Hencethe need for effective erosion control strategies to control pollution associated with sediment fromagricultural land will become more important in the future.
SOIL EROSION 85

REFERENCES
Alstrom, K. and Akerman, A.B. (1992) Contemporary soil erosion rates on arable land in Southern Sweden.Geografiska Annaler 74A, 101–108.
Boardman, J., Foster, I.D.L. and Dealing, J.A. (1990) Soil Erosion on Agricultural Land. Wiley, Chichester.Boardman, J. and Favis-Mortlock, D.T. (1993) Climate change and soil erosion in Britain. Geographical
Journal 159, 179–183.Brown, L., Flavin, C. and French, H. (2000) State of the World 2000. Worldwatch Institute, 262pp.Catt, J.A., Quinton, J.N., Rickson, R.J. and Styles, P. (1994) Nutrient losses and crop yields in the Woburn
erosion reference experiment. In: Conserving Soil Resources: European Perspectives (Ed. R.J.Rickson).CAB International, Wallingford, pp. 94–104.
Chambers, B. and Davies, D.B. (1995) The impact of water erosion on crop productivity and soil fertility inthe UK. In: Soil Management in Sustainable Agriculture (Eds H.F.Cook and H.C.Lee), Wye CollegePress.
Davidson, D.J. and Harrison, D.J. (1995) The nature, causes and implications of water erosion on arable landin Scotland. Soil Use and Management 11, 63–68.
Davies, D.H.K. and Christal, A. (1996) Buffer strips—a review. In: Diffuse Pollution and Agriculture (EdsT.Petchey, B.D’Arcy and A.Frost), SAC, Aberdeen.
De Ploey, J. (1989) Soil erosion map of Western Europe. Catena, Germany.Environment Agency (2001) Environment South West. A report on the state of the environment in the South
West of England.EEA (2001) Down to earth: Soil Degradation and Sustainable Development in Europe. Environmental
Issues Series 16.Evans, R. (1996a) Soil Erosion and its Impacts in England and Wales. Friends of the Earth, London.Evans, R. (1996b) Some soil factors influencing water erosion of arable land. Progress in Physical Geography
20, 205–215.Evans, R. and Cook, S. (1986) Soil erosion in Britain. SEESOIL 3, 28–59.FAO (2001) http://www.fao.org/Gibson, C.E. (1997) The dynamics of phosphorus in freshwater and marine environments. In Phosphorus
Losses from Soil to Water (Eds H.Tunney, O.T.Carton, P.C.Brookes and A.E. Johnston). CABInternational, Wallingford, UK, pp. 119–135.
Goudie, A. (2000) The Human Impact on the Natural Environment. 5th Edition. Blackwell, Oxford.Grieve, I. and Hipkin, J.A. (1996) Soil erosion and sustainability. In: Soils, Sustainability and the Natural
Heritage (Eds A.G.Taylor, J.E.Gordon and M.B.Usher). Scottish Natural Heritage, Edinburgh, pp. 236–248.
Harrod, T. (1994) Runoff, soil erosion and pesticide pollution in Cornwall. In: Conserving Soil Resources:European Perspectives (Ed. R.J.Rickson). CAB International, Wallingford, pp. 105–115.
Hasholt, B. (1991) Influence of erosion on the transport of suspended sediment and phosphorus.International Association of Hydrological Sciences Publication 203, 329–338.
Heathwaite, A.L. (1997) Sources and pathways of phosphorus loss from agriculture. In: Phosphorus Lossfrom Soil to Water (Eds H.Tunney, O.T.Carton, P.C.Brookes and A.E.Johnston). CAB International,Wallingford, pp. 205–224.
Heaney, S.I., Foy, R.H., Kennedy, G.J.A., Crozier, W.W. and O’Connor, W.C.K. (2001) Impacts of agricultureon agriculture systems: lessons learnt and new unknowns in Northern Ireland. Marine and FreshwaterResearch 52, 151–163.
Hudson, N. (1995) Soil Conservation. Batsford, London.Kronvang, B. (1990) Sediment-associated phosphorus transport from two intensively farmed catchment
areas. In: Soil Erosion on Agricultural Land (Eds J.Boardman, I.D.L.Foster and J.A.Dealing). Wiley,Chichester, UK, pp. 313–330.
86 CHAPTER 4

Leeks, G.J.L. (1995) Effects of agricultural soil erosion on watercourses. National Rivers Authority R&DNote 409.
MAFF (1998) Code of Good Agricultural Practice for the Protection of Soil. Ministry of Agriculture, Fisheriesand Food, London.
MAFF (1999a) Controlling soil erosion: a manual for the assessment and management of agricultural landat risk of water erosion in lowland England. Ministry of Agriculture, Fisheries and Food, London.
MAFF (1999b) Controlling soil erosion—an advisory booklet for the management of agricultural land.Ministry of Agriculture, Fisheries and Food, London.
MAFF (2000) Towards sustainable agriculture—a pilot set of indicators. Ministry of Agriculture, Fisheriesand Food, London.
Massa, F., Bagliniere, J.L., Prunet, P. and Grimaldi, C. (2000) Egg-to-fry survival of brown trout (Salmotrutta) and chemical environment in the redd. Cybium 24, 129–140.
Matthiessen, P., Allchin, C., Williams, R.J., Bird, S.C., Brooke and Glendinning, P.J. (1992) The translocationof some herbicides between soil and water in a small catchment. Journal of the Institution of Water andEnvironmental Management 6, 496–504.
Morgan, R.P.C. (1995) Soil Erosion and Conservation. 2nd Edition. Longmans, Harlow.Napier, T. (1990) The evolution of US soil conservation policy: from voluntary adoption to coercion. In: Soil
Erosion on Agricultural Land (Eds J.Boardman, I.D.L.Foster and J.A.Dealing). Wiley, Chichester, pp.627–644.
NRA (1992) The influence of agriculture on the quality of natural waters in England and Wales. NationalRivers Authority, Bristol. NRA Water Quality Series No. 6.
NRCS (1997) Water Quality and Agriculture: Status, Conditions, and Trends. Working Paper No. 16,Washington DC.
Parkinson, R.J. (1995) Soil Management. In: The Agricultural Notebook (Ed. R.J.Soffe). Blackwell, Oxford,pp. 87–117.
RCEP (1979) Agriculture and Pollution. Royal Commission on Environmental Pollution 7th report (Cm7644). HMSO, London.
RCEP (1984) Tackling Pollution—Experience and Prospects. Royal Commission on Environmental Pollution10th report. HMSO, London.
RCEP (1996) Sustainable Use of Soil. Royal Commission on Environmental Pollution 19th Report (Cm 3165).HMSO, London.
Reganold, J.P., Elliot, L.F. and Unger, Y.L. (1987) Long-term effects of organic and conventional farming onsoil erosion. Nature 330, 370–372.
Sharpley, A. and Smith, S.J. (1990). Phosphorus transport in agricultural runoff: the role of soil erosion. In:Soil Erosion on Agricultural Land (Eds J.Boardman, I.D.L.Foster and J.A.Dealing). Wiley, Chichester,pp. 350–366.
Skinner, R.J. and Chambers, B.J. (1996) A survey to assess the extent of soil water erosion in lowlandEngland and Wales. Soil Use and Management 12, 214–220.
Soulsby, C., Youngson, A.F., Moir, H.J. and Malcolm, I.A. (2001). Fine sediment influence on salmonidspawning habitat in a lowland agricultural stream: a preliminary assessment. Science of the TotalEnvironment 265, 295–307.
Tivy, J. (1990) Agricultural Ecology. Longmans, London.USDA (2001) http://www.nhq.nrcs.usda.gov/land/env/soil1Verstraeten, G. and Poesen, J. (1999) The nature of small-scale flooding, muddy floods and retention pond
sedimentation in central Belgium. Geomorphology 29, 275–292.Webb, J., Loveland, P.J., Chambers, B.J., Mitchell, R. and Garwood, T. (2001) The impact of modern farming
practices on soil fertility and quality in England and Wales. Journal of Agricultural Science (Camridge),137, 127–138.
SOIL EROSION 87

Young, C.E. and Osborn, C.T. (1990) The Conservation Reserve Program: and economic assessment. USDepartment of Agriculture, Washington.
88 CHAPTER 4
5Organic Wastes
5.1INTRODUCTION
This chapter deals with two distinct forms of organic waste that can cause agricultural pollution.Firstly, there are those organic wastes that are produced by agricultural activity. These areprincipally the excretion products (i.e. faeces and urine) of farm animals, but may also includeother materials such as silage effluent and dirty water from milking parlours. Secondly, there arewastes such as sewage sludge, paper pulps and food processing wastes which, although producedoff-farm (i.e. mainly from domestic household and industrial sources), are commonly broughtonto farms and applied or recycled to agricultural land. These agricultural and non-agriculturalorganic wastes contain a range of materials including carbohydrates, fats, proteins, nitrates,phosphates and ammonia, as well as potentially being subject to contamination by pesticides, oils,veterinary products, trace metals and pathogens.
This chapter will address:
• the production and form of agricultural organic wastes;• the pollution risks associated with organic farm wastes and non-agricultural organic wastes;• management options and practical sustainable solutions to limit these risks.
Organic wastes and agriculture
The application of organic wastes, notably livestock manures, to land has historically beenimportant for maintaining soil fertility in terms of both nutrient status and organic matter levels.However, with the increased specialisation and intensification of livestock farming (Chapter 1) anumber of important trends have emerged. Firstly, livestock manures and slurries are produced inconsiderable quantities and, unlike most domestic sewage, are usually disposed of withouttreatment. It is estimated that the annual livestock waste production on UK farms totals some 191million tonnes per year (Smith and Chambers, 1995). Of this approximately 80 million tonnes isslurry or manure requiring handling, storage and spreading, whilst the majority is voided directlyto the land by grazing animals (Smith et al., 2000). An estimated 95% of all cattle manure isreturned to land in the UK, with rates of application between 30 and 300 t ha−1 (Johnes et al.,1996; Jackson and Smith, 1997). Secondly, intensification within the livestock industry leads to

large numbers of animals being concentrated in relatively small areas and consequently theproduction of large volumes of waste at a single site. For example, a dairy cow typically produces50–60 litres of excreta per day, and uses upto 3 kg of straw for bedding (loose housing) and up to351 of water to wash the milking parlour and dairy equipment. A typical dairy farm might have100 milking cows. Over a six-month winter period alone these would generate over 1,000,0001 ofurine and faeces, plus 55 tonnes of soiled straw bedding and 640,0001 of dirty water; all of whichhas to be disposed of safely. Similar calculations can be made for other types of livestock(Table 5.1). Thirdly, The predominance of livestock farming in the west of the UK and arable farmsin the east, means that the traditional use of farm wastes on arable land is increasingly restricted.
Many farmers have come to regard the application of livestock manures to agricultural land aslittle more than a waste disposal exercise (MAFF, 2000), yet the potential financial value of thenutrient content of livestock wastes is very high. It is estimated that the livestock excreta producedannually in the UK has a potential fertiliser value of over £200 million per year (Table 5.2),approximately one-third the value of equivalent nutrients applied as inorganic fertiliser (HMSO,1993; Smith and Chambers, 1995). A single dairy cow voids approximately 21 kg of phosphate, 52kg of potassium and 47 kg of available nitrogen in faeces and urine during a 6-month housingperiod.
Although organic wastes are a valuable alternative to artificial inorganic fertilisers, somefarmers have relatively little perception of their nutrient value and consequently may manage theminefficiently, although many claim to make allowances for the nutrients supplied in manures infertiliser plans (Owen, 1998; MAFF, 2000; Smith et al., 2001). This may lead to:
• Poor utilisation of their nutrient content (Chapter 2): For example, farmers may make only smalland/or inconsistent reductions in the use of fertilisers following the application of livestockslurries and manures, whereas they could be making significant savings in fertiliser costswithout loss of crop yield (Smith et al., 2001).
• Risk of environmental pollution: A common practice has been the application of large amountsof slurry and manure to relatively small areas of land during the autumn and winter monthswhen there is a risk of rainfall causing surface run-off and/or nutrient leaching.
The polluting effects of organic wastes can occur in a number of ways and therefore require abroad range of approaches to control. All watercourses (notably lakes, ponds, rivers, streams andfield ditches) adjacent to areas of production, storage or application of organic wastes are
Table 5.1 Examples of amounts of excreta produced by livestock in respect to body weight (MAFF, 1998a).
90 CHAPTER 5

potentially at risk of point source pollution. This risk is different from the diffuse pollution thatoccurs when the microbial breakdown of manure applied to the soil occurs out of phase with the Nuptake of a growing crop and leads to nitrate leaching.
The remainder of this chapter describes the nature and causes of pollution by agricultural andnon-agricultural organic wastes on farms, and introduces some practical solutions to minimiseenvironmental risks. The pollution problems addressed in this chapter are principally pointsource; the threat of the diffuse pollution of ground and surface waters by N and P from organicwastes has already been discussed in Chapters 2 and 3. Gaseous emissions and odour nuisance areaddressed in Chapter 6.
Organic wastes cannot only cause pollution within the wider environment, but may also poseproblems for crops and livestock on the farm if care is not taken to utilise or dispose of themproperly (Table 5.3). Crop smothering and scorch are commonly associated with the application oforganic manures and slurries (notably to grassland), and can lead to significant yield reductionsdue to physical crop damage and reductions in nutrient uptake (Smith and Chambers, 1993).Nutrient imbalances following organic amendments to soils may also cause temporarymacronutrient deficiencies, reducing seedling emergence and restricting plant growth (Tisdale etal., 1993; Glendinning, 1999; Van Kessel et al., 2000). Sewage sludge application can also causeproblems on the farm due to its content of potentially toxic elements such as heavy metals, organicmicropollutants and microbial pathogenic organisms (Smith, 1996). These problems areconsidered in more detail later in this chapter.
Table 5.2 Potential value in millions of pounds, of organic manures produced in the UK compared with thecost (shown in parentheses) of equivalent nutrients supplied as inorganic fertiliser (Dampney, 1995).
Table 5.3 Typical problems caused through organic waste application for crops and livestock.
ORGANIC WASTES 91

5.2FARM WASTES
Four main classes of farm waste can be identified:
Slurries The Control of Pollution (Silage, Slurry and Agricultural Fuel Oil)Regulations (HMSO, 1991) define slurries as ‘excreta produced by livestockwhilst in a yard or building, or…a mixture consisting wholly or mainly of suchexcreta, bedding, rainwater and washings from a building or yard used bylivestock or any combination of these; of a consistency that allows it to bepumped or discharged by gravity at any stage in the handling process’. Oralternatively, a slurry could be considered as being a mixture faeces, urineand water, but has less than 10% dry matter (Shepherd and Gibbs, 2001);
Solid Manure This includes waste materials with a high solids content, such as straw fromdeep litter or traditional covered yards, which is usually present in sufficientquantity to allow the manure to be stacked. Solid manure is usually handledas a solid, usually >10% dm, but when fresh or recently stacked can be verystrawy and bulky with a low density (<0.5 tm−3). Old manure, which has beenstacked for a period of months, will have been subject to microbiologicaldecomposition (composting if aerobic) and gradually becomes darker andmore friable when compared with fresh manure;
Dirty Water This includes water used to wash down yards, milk parlours, farm buildings,contaminated rainwater, etc. and is defined by MAFF as ‘a waste, generallyless than 3% DM made up of water contaminated by manure, crop seepage,milk or other dairy products or cleaning materials’;
Silage Effluent This includes the effluent from a range of forage crops, principally grass,when enclosed in a pit, silo or big bale during the process of making silage.
Changes in farming systems
Livestock farming has changed considerably since the late 1940s with the advent of morespecialised and intensive production systems. With this intensification have come a number ofmanure and slurry management problems for farmers. For example, there has been a steadyincrease in the number of dairy cows kept in the UK with the result that the average herd sizeincreased from 18 cows in 1955 to 63 cows in 1991 (HMSO, 1993). Herds can range in size fromless than 30 to greater than 400, although the larger herds tend to be subdivided into groups of100–150. Furthermore, between 1930 and 1990, livestock density increased in the UK from 0.83head ha−1 to 1.77 head ha−1 (Edwards and Withers, 1998). With the trend towards larger, moreintensively-managed herds, comes the problem of much greater volumes of waste to manage. Thisis caused not only by the increase in herd size, but also by changes in management, such as theindoor housing of livestock for a greater proportion of the year. A few herds are kept indoors allyear round (so-called ‘zero grazing’).
The type of wastes produced depends largely upon how the animals are housed. Dairy cows, forinstance, can be housed in one of two ways:
92 CHAPTER 5

Deep litter In this system, the housed cows have access to a covered area of ‘deep litter’bedding material (usually straw) where they can lie and sleep. As more clean litteris regularly added to the area, the waste bedding accumulates to the point that itis necessary to clear it out. The resultant solid waste (‘farm yard manure’ or FYM)is a mixture of straw, urine and faeces (Figure 5.1 ).
Cubicles The cows are housed indoors in large specialist buildings. Individuals are usuallyhoused in cubicles with a minimum of bedding material, such as sawdust or choppedstraw, and a mechanised cleaning system (e.g. a tractor and yard scraper) to collectslurry from a central gutter (Culpin, 1992).
Similar distinctions in housing type exist for other forms of livestock, but the general rule is thatdeep litter systems tend to produce solid waste, whilst specialist livestock ‘houses’ produce slurries(almost 45% of the 10.3 million tonnes of manure from pig production in the UK is as slurry)(Smith et al., 2000). An exception to this would be the poultry sector in which the 70% of manurefrom broiler and egg production is litter-based with sawdust and wood shavings as beddingmaterial (Smith et al., 2001).
Livestock that are housed require a source of food, and for over-wintering cattle (beef and dairy)this is usually provided in the form of grass conserved as hay or silage. Hay-making was traditionallythe most popular method of conservation, but has now been largely replaced by silage. Thiseffectively involves the ‘pickling’ of grass (and other forage crops) in the lactic acid which isproduced naturally by the fermentation of water-soluble sugars in a crop when it is cut, choppedand heaped into an airtight silo or sealed into a big bale.
An undesirable product of silage-making is silage effluent, a mixture of water, soluble sugarsand organic acids which begins to flow from the silo within a day or so of filling, and can continuefor several weeks. This is one of the most environmentally degrading organic waste materials on
Figure 5.1 Deep litter housing system.
ORGANIC WASTES 93

the farm, since it is both corrosive and extremely polluting (Lennox et al., 1998; Richardson et al.,1999). Selected silage effluent characteristics are given in Table 5.4 and highlight the potentiallycorrosive and damaging effect it may have on and off the farm (O’Donnell et al., 1995).
Pollution risks from farm wastes
Dissolved oxygen is continually consumed by the aquatic organisms found in watercourses, but isusually replenished by a number of natural processes. These include: re-aeration due to thephysical reaction of air and water (e.g. turbulence); photosynthesis by water-borne plants andalgae; decreases in temperature which lead to a reduction in micro-organism activity and anincrease in the oxygen saturation potential of the water; dilution by more highly oxygenated waterfrom other sources (Nemerow, 1991). However, this balance can be upset if an organic pollutantenters a watercourse. Characteristically, this acts as a substrate or food for a number of aquaticmicro-organisms (notably bacteria and protozoa) and macro-invertebrates stimulating a hugeincrease in their population and consequent consumption of dissolved oxygen (Figure 3.7). If thelevels of organic substrate are sufficiently high, populations of micro-organisms (often evident as apale carpet of sewage fungus a host of micro-organisms dominated by Sphaerotilus natans on thewatercourse-bed) may build-up to the point at which they consume oxygen more rapidly than itcan be replenished, thus leading to a net depletion of oxygen (Mason, 1996). This can have aserious impact upon the population of a number of ‘clean water’ organisms. Fish have a relativelylow tolerance to oxygen depletion (Table 5.5) and can suffer significant losses for large distancesdownstream of a serious pollution incident.
Table 5.4 Selected characteristics of silage effluent, collected from unwilted grass silage (O’Donnellet al., 1995).
A commonly used measure of the ‘relative pollution potential’ of an organic contaminant is theamount (mg l−1) of oxygen needed by micro-organisms to break down the material. This is calledthe Biochemical Oxygen Demand (BOD). It is calculated by a standard test involving theincubation of a sample of organic material in the dark over a fixed period (5 days) and at a constanttemperature (20 °C). Levels of oxygen (mg l−1) in the sample are measured before and afterincubation, and the difference is recorded as the BOD. High levels of BOD indicate the presence ofa potentially serious pollutant that should not be released into a watercourse. All organic farmwastes fall into this category (Table 5.6), with many serious pollution incidents occurring due tothe poor containment or disposal of slurry and silage effluent. Silage effluent has a very high BODand so it is important to avoid the release of even very small quantities into watercourses(Table 5.6).
The pollution problems associated with silage effluent are exacerbated by two further factors,firstly, the effluent is highly corrosive (Table 5.4) and can easily escape through silo floors,
94 CHAPTER 5

collection channels or storage tanks which are damaged, corroded, cracked or porous (Richardsonet al., 1999). Secondly, depending upon the moisture content of the forage being conserved, thevolume of effluent produced during silage making can be very large.
Effluent production from grass silage in a horizontal clamp is only insignificant when the grasshas been wilted to less than 65% moisture content. Lennox et al. (1998) attributed the 51% declinein agricultural pollution incidents in Northern Ireland between 1987 and 1995, in part to a 78%decline in silage effluent pollution due to an observed increase in grass wilting and favourableweather in the summer months. At the recommended moisture content of 75%, up to 1101 ofeffluent per tonne of silage can be expected (i.e. 55,0001 from a 500 tonne clamp). While fresh,unwilted grass at about 85% moisture content may yield up to 330 1 of effluent tonne−1 of silage(i.e. 165,0001 from a 500 tonne clamp) (MAFF, 1993).
The specific effects arising from an organic waste entering a watercourse can be difficult topredict since they depend upon many factors, including temperature, dilution rates and the typeof watercourse (Box 5.1). Additionally, time of year is important—silage effluent production inearly summer is often more of a problem than winter produced materials (O’Donnell et al., 1997).However, in time, watercourses are also able to recover from organic pollution by a process of self-purification, whereby the organic material is broken down and oxygen levels are replenished bynatural processes (Mason, 1996).
Ammonia in watercourses
The relatively high levels of ammonia found in some organic wastes may pose an additionalpollution threat to fish and to some freshwater invertebrates from livestock wastes enteringaquatic systems (Hickey et al., 1999). Importantly, the threat is not only to surface waters but alsogroundwater resources (Stone et al., 1998; Arnold and Meister, 1999; DETR, 2001). In a study ofthe impact of dairy farming on river quality in south-west Wales Schofield et al. (1993) observed
Table 5.5 Relative tolerance to oxygen depletion by some river organisms.
Table 5.6 The Biochemical Oxygen Demand (BOD, mg l−1) of farm wastes in comparison with other organicmaterials (NRA, 1992).
ORGANIC WASTES 95

the expected water quality problems associated with high BOD, but also noted high ammonialevels as a significant aquatic pollutant. In one stream, background levels of ammonia of between3 and 5 mg N l−1 were found with peak levels as high as 20 mg N l−1; levels which were sufficientlytoxic to prevent the maintenance of a sustainable fishery (Tables 5.7 and 5.8). The study concludedthat tributaries in the catchment which had high ammoniacal-N and BOD were those whichdrained the areas of land used for dairy farming. Furthermore, it was the production of manuresand slurries, and washing of yards and milking parlours that was causing a measurabledeterioration in the quality of watercourses. Reductions in water quality during the study werealso related to rainfall. Periods of heavy rainfall caused the increased run-off of slurry from yardsas well as from fields that had recently received slurry applications.
An increase in free ammonia in watercourses may also inhibit the process of nitrification insediments and so cause the potentially toxic build up of nitrite in the water body (Chapter 2)(Smith et al., 1997).
BOX 5.1UK CASE STUDIES OF POLLUTION INCIDENTS CAUSED BY FARM WASTE
The Environment Agency is responsible for monitoring the water quality of all rivers, lakesand streams. In addition to routine monitoring, surveys are conducted when pollutionincidents occur and this information may be used in prosecutions. The incidents describedbelow all occurred in the north-west of England.
Silage effluentA small river was contaminated with silage effluent from a nearby farm and caused severe
pollution. The pollution source was traced to a drain; downstream of the drain, the riverbed wascoated with growths of the aquatic fungus Leptomitis lacteus whilst upstream the riverbed was clear.A survey of the biology of the stream showed that there were 16 families of freshwater invertebrates(insects, snails, shrimps, etc.) above the drain whilst there were only three downstream for a distanceof at least 500m.
On-farm food processing wasteThis incident was caused by organic wastes from a farm dairy specialising in yoghurt making. The
effluent entered a stream via a tributary; upstream of the confluence the stream was clean and 11families of invertebrates were recorded. Downstream of the confluence no invertebrates were found,whilst the stream-bed was coated with sulphur bacteria which are indicative of anoxic (oxygen-free)conditions. Further downstream, thick growths of ‘sewage fungus’ occurred (predominantlySphaerotilus natans). Samples taken during the investigation showed the effect on the chemistry ofthe stream:
Slurry
96 CHAPTER 5

This incident was reported by the farmer who had lost a quantity of slurry into a stream after astorage tank had leaked. Downstream of the point where slurry entered the stream, the onlyinvertebrates living were red chironomids and tubificid worms—both are very tolerant of pollution. Allthe invertebrates indicative of clean water were dead. It was concluded that the stream had beenpolluted previously and that this incident caused a worsening of an already chronic problem.Chemical sampling also showed the effect of this organic pollution:
Pathogens from farm wastes
Farm livestock are potential carriers of a number of pathogenic bacteria, viruses and parasites.These can be transferred to humans if the application of animal waste to land contaminates cropsor watercourses (DoE/DH, 1990). In Germany, the bacterial contamination of a crop of parsleywith Citrobacter freundii following the application of pig slurry to a private garden caused anoutbreak of severe gastroenteritis and associated syndromes amongst children at a nursery school(Tschäpe et al., 1995). Nine children were hospitalised, including one who later died. Subsequentanalysis of the fresh parsley involved found it to be also highly contaminated with many otherbacterial species, including Proteus mirablis Pseudomonas spp. and Escherichia coli.
Cattle are the primary reservoir of the virulent human pathogen E. coli serotype O157, whichcauses in excess of 1000 cases of food poisoning in the UK each year. Whilst cattle show littleobservable effects from E. coli O157 (up to 15% of UK cattle herds may be infected) humaninfection may be very serious with a mortality rate of about 5%. Exposure to humans may occurthrough the contamination of food by faeces, manure, slurry and even through the inadvertentconsumption of contaminated soil. E. coli may remain viable in non-aerated manures for almost12 months, but in aerated manure piles and soils this is often reduced to between 2 and 4 monthsand just 10 days in cattle slurries (Jones, 1999).
A further specific problem identified in the UK by MAFF (1998a) is the protozoan parasite,Cryptosporidium, found in many animal wastes. This can contaminate water courses via leaching/run-off and lead to the risk of human infection if water is subsequently extracted for drinkingsupplies (Cryptosporidium is resistant to many of the procedures used to treat drinking water). Inthe UK, the incidences of cryptosporidiosis rose nearly 10-fold in cattle and 5-fold in sheepbetween 1983 and 1994 and it has been postulated that Cryptosporidium is now ubiquitousamongst mammals in the UK (Nicholson et al., 2000).
Veterinary products in farm wastes
According to the RCEP, the contamination of livestock wastes with certain veterinary products, ortheir metabolites, can have unwelcome environmental effects (RCEP, 1996). One example is theanti-parasitic drug, ivermectin. This is an effective and popular alternative to the OPs (Chapter 7)commonly used in modern livestock husbandry, but it is exceptionally persistent and residues in
ORGANIC WASTES 97

the manure of treated animals can significantly reduce the number of variety of insects found inand around manure. There is concern that this might in turn affect insect-eating birds andmammals (particularly bats).
Table 5.7 Analysis of chemical composition of farmyard slurry at four farms (at 4 dates) in theEastern Cleddau catchment, Dyfed, Wales (Schofield et al., 1993).
Water pollution incidents
The intensification of livestock production in the UK has greatly increased the risk and occurrenceof water pollution by organic wastes. Organic pollutants account for almost 90% of all farmpollution incidents recorded, with dairy farming causing more incidents than all other agriculturalsources combined. Indeed, 45% of Category 1 incidents were attributed to dairying in 1999(Environment Agency, 2001a). The category of pollution incident ranges from 1 to 3, with 1 beingthe most severe in regard to ecological and environmental damage (Chapter 7). Not surprisinglyincidents are concentrated in areas of high livestock production, and so in the UK primarily occurin the south west, midlands and north west of the country (Figure 5.2) (DETR, 2001). A significantnumber of incidents involving pig slurry and poultry manure also occur in East Anglia whereintensive units complement arable farming enterprises. Problems most commonly arise fromacute point source pollution due to:
• the poor containment of manures, slurries and silage effluent e.g. run-off from dirty yards,leaking drains or the structural collapse of slurry stores;
• the discharge of dairy washings. As well as the high BOD of milk, dairy washings also pose ahazard because of the hypochlorite-based solutions used to sterilise milking equipment which ifdischarged to a watercourse can significantly increase its chlorine content (Conway and Pretty,1991);
• Surface run-off of slurry following application to land. This mainly occurs during periods ofheavy rainfall when the soil is waterlogged or frozen, and is especially pronounced when theland is sloping (NRA, 1992; MAFF, 1998a).
Foy and Kirk (1995) carried out a regional study of water quality and the influence of agriculture inNorthern Ireland by monitoring 21 streams in two river catchments. Water quality was measuredon a fisheries ecosystem scale (Table 5.8) of FE1 (good, salmonoid water) to FE6 (bad, fishabsent). The study concluded that water quality measured on this scale was inversely correlated
98 CHAPTER 5
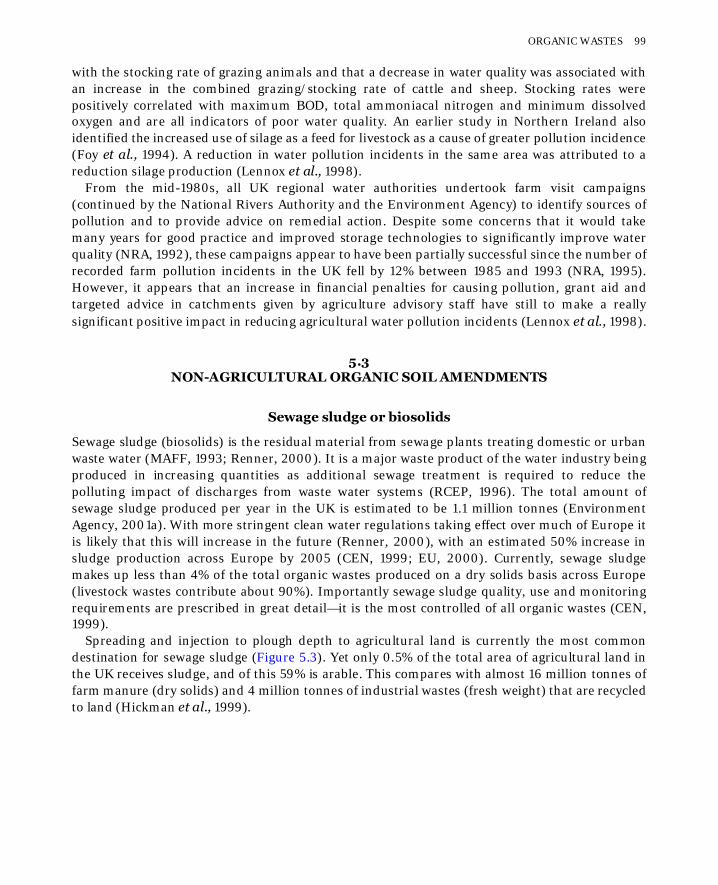
with the stocking rate of grazing animals and that a decrease in water quality was associated withan increase in the combined grazing/stocking rate of cattle and sheep. Stocking rates werepositively correlated with maximum BOD, total ammoniacal nitrogen and minimum dissolvedoxygen and are all indicators of poor water quality. An earlier study in Northern Ireland alsoidentified the increased use of silage as a feed for livestock as a cause of greater pollution incidence(Foy et al., 1994). A reduction in water pollution incidents in the same area was attributed to areduction silage production (Lennox et al., 1998).
From the mid-1980s, all UK regional water authorities undertook farm visit campaigns(continued by the National Rivers Authority and the Environment Agency) to identify sources ofpollution and to provide advice on remedial action. Despite some concerns that it would takemany years for good practice and improved storage technologies to significantly improve waterquality (NRA, 1992), these campaigns appear to have been partially successful since the number ofrecorded farm pollution incidents in the UK fell by 12% between 1985 and 1993 (NRA, 1995).However, it appears that an increase in financial penalties for causing pollution, grant aid andtargeted advice in catchments given by agriculture advisory staff have still to make a reallysignificant positive impact in reducing agricultural water pollution incidents (Lennox et al., 1998).
5.3NON-AGRICULTURAL ORGANIC SOIL AMENDMENTS
Sewage sludge or biosolids
Sewage sludge (biosolids) is the residual material from sewage plants treating domestic or urbanwaste water (MAFF, 1993; Renner, 2000). It is a major waste product of the water industry beingproduced in increasing quantities as additional sewage treatment is required to reduce thepolluting impact of discharges from waste water systems (RCEP, 1996). The total amount ofsewage sludge produced per year in the UK is estimated to be 1.1 million tonnes (EnvironmentAgency, 2001a). With more stringent clean water regulations taking effect over much of Europe itis likely that this will increase in the future (Renner, 2000), with an estimated 50% increase insludge production across Europe by 2005 (CEN, 1999; EU, 2000). Currently, sewage sludgemakes up less than 4% of the total organic wastes produced on a dry solids basis across Europe(livestock wastes contribute about 90%). Importantly sewage sludge quality, use and monitoringrequirements are prescribed in great detail—it is the most controlled of all organic wastes (CEN,1999).
Spreading and injection to plough depth to agricultural land is currently the most commondestination for sewage sludge (Figure 5.3). Yet only 0.5% of the total area of agricultural land inthe UK receives sludge, and of this 59% is arable. This compares with almost 16 million tonnes offarm manure (dry solids) and 4 million tonnes of industrial wastes (fresh weight) that are recycledto land (Hickman et al., 1999).
ORGANIC WASTES 99

Figure 5.2 Distribution of total pollution incidents from organic waste in 1999, not includingsewage sludge (DETR, 2001).
Sewage sludge is a complex organic material derived mainly from human wastes. It may besupplied free to farmers by water companies and can have a number of potentially beneficialeffects when applied to agricultural land:
• All sludges contain significant quantities of N, P (Table 5.9), and micronutrients such asessential trace metals and it is useful to recycle as much of this back to agricultural land aspossible. The potential savings in fertiliser applications by farmers who use sewage sludge havebeen estimated to be over £15 million per year (Hall, 1992).
• Sewage sludge can also act as a soil improver by adding considerable amounts of organicmatter, thus enhancing the structure and water retention capacity of some soils, especiallywhen added as a drier processed sewage sludge product called cake (White, 1997).
• Sludge can also be treated to increase its agricultural value and disposal potential, for exampleby adding cement kiln dust to impove its liming properties or composting with green wastes(Rund, 1995; Barry et al., 1998; CEN, 1999; Chaney et al., 2000).
The full value of sewage sludge as a nutrient source and soil improver is, however, constrained byits contamination with a number of potentially harmful substances, notably heavy metals andorganic micropollutants, as well as pathogenic micro-organisms such as Salmonella spp., Taeniasaginata, Asaris and E. coli O157: H7 (Carrington et al., 1998).
100 CHAPTER 5
Table 5.8 Classification of water quality based on suitability as fishery for salmonoids or cyprinids(DoE, 1993).
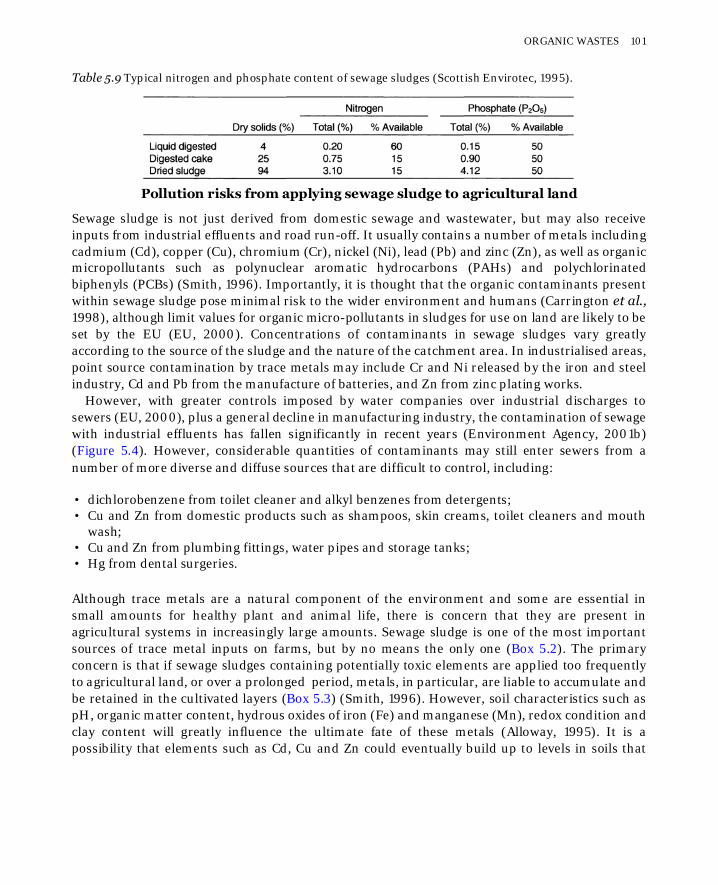
Pollution risks from applying sewage sludge to agricultural land
Sewage sludge is not just derived from domestic sewage and wastewater, but may also receiveinputs from industrial effluents and road run-off. It usually contains a number of metals includingcadmium (Cd), copper (Cu), chromium (Cr), nickel (Ni), lead (Pb) and zinc (Zn), as well as organicmicropollutants such as polynuclear aromatic hydrocarbons (PAHs) and polychlorinatedbiphenyls (PCBs) (Smith, 1996). Importantly, it is thought that the organic contaminants presentwithin sewage sludge pose minimal risk to the wider environment and humans (Carrington et al.,1998), although limit values for organic micro-pollutants in sludges for use on land are likely to beset by the EU (EU, 2000). Concentrations of contaminants in sewage sludges vary greatlyaccording to the source of the sludge and the nature of the catchment area. In industrialised areas,point source contamination by trace metals may include Cr and Ni released by the iron and steelindustry, Cd and Pb from the manufacture of batteries, and Zn from zinc plating works.
However, with greater controls imposed by water companies over industrial discharges tosewers (EU, 2000), plus a general decline in manufacturing industry, the contamination of sewagewith industrial effluents has fallen significantly in recent years (Environment Agency, 2001b)(Figure 5.4). However, considerable quantities of contaminants may still enter sewers from anumber of more diverse and diffuse sources that are difficult to control, including:
• dichlorobenzene from toilet cleaner and alkyl benzenes from detergents;• Cu and Zn from domestic products such as shampoos, skin creams, toilet cleaners and mouth
wash;• Cu and Zn from plumbing fittings, water pipes and storage tanks;• Hg from dental surgeries.
Although trace metals are a natural component of the environment and some are essential insmall amounts for healthy plant and animal life, there is concern that they are present inagricultural systems in increasingly large amounts. Sewage sludge is one of the most importantsources of trace metal inputs on farms, but by no means the only one (Box 5.2). The primaryconcern is that if sewage sludges containing potentially toxic elements are applied too frequentlyto agricultural land, or over a prolonged period, metals, in particular, are liable to accumulate andbe retained in the cultivated layers (Box 5.3) (Smith, 1996). However, soil characteristics such aspH, organic matter content, hydrous oxides of iron (Fe) and manganese (Mn), redox condition andclay content will greatly influence the ultimate fate of these metals (Alloway, 1995). It is apossibility that elements such as Cd, Cu and Zn could eventually build up to levels in soils that
Table 5.9 Typical nitrogen and phosphate content of sewage sludges (Scottish Envirotec, 1995).
ORGANIC WASTES 101
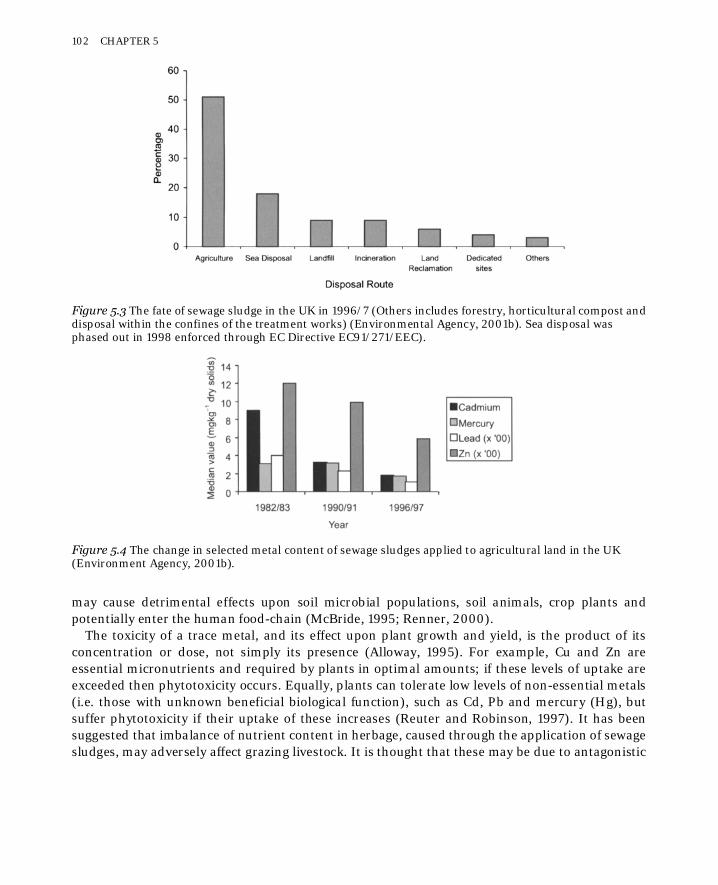
may cause detrimental effects upon soil microbial populations, soil animals, crop plants andpotentially enter the human food-chain (McBride, 1995; Renner, 2000).
The toxicity of a trace metal, and its effect upon plant growth and yield, is the product of itsconcentration or dose, not simply its presence (Alloway, 1995). For example, Cu and Zn areessential micronutrients and required by plants in optimal amounts; if these levels of uptake areexceeded then phytotoxicity occurs. Equally, plants can tolerate low levels of non-essential metals(i.e. those with unknown beneficial biological function), such as Cd, Pb and mercury (Hg), butsuffer phytotoxicity if their uptake of these increases (Reuter and Robinson, 1997). It has beensuggested that imbalance of nutrient content in herbage, caused through the application of sewagesludges, may adversely affect grazing livestock. It is thought that these may be due to antagonistic
Figure 5.3 The fate of sewage sludge in the UK in 1996/7 (Others includes forestry, horticultural compost anddisposal within the confines of the treatment works) (Environmental Agency, 2001b). Sea disposal wasphased out in 1998 enforced through EC Directive EC91/271/EEC).
Figure 5.4 The change in selected metal content of sewage sludges applied to agricultural land in the UK(Environment Agency, 2001b).
102 CHAPTER 5

effects of a particular trace element in high concentrations in the sludge (e.g. Fe) reducing theuptake of another trace element (e.g. Cu) (Carrington et al., 1998).
BOX 5.2OTHER SOURCES OF TRACE METALS TO AGROECOSYSTEMS
Potentially toxic elements are added to agricultural land in Europe from a range of sources.The relative importance of these sources, in regard to quantities and the particularelements of importance for each source, in comparison to sewage sludges can be seen inthe following table. Potentially toxic element additions to agricultural holdings in Englandand Wales are given in tonnes per year (Carrington et al., 1998; CEN, 1999).
Livestock wastesSoil contamination may occur due to the repeated application of livestock wastes that contain metals
from additives put in feed to improve conversion efficiency and accelerate growth rates. It occursprimarily with pigs and poultry manures that may contain elevated concentrations of Cu and Zn.Since the animal absorbs only a small fraction of the metal additives, the remainder is excreted as aresidue in the pig slurry or poultry manure. The concentration of metals in these manures is highlyvariable depending upon differences in the composition of feed and pest control practices.Concentrations of Cu and Zn in pig and poultry slurries have been observed to be in the range of 300–2000 mg Cu kg−1 and 200–1500 mg Zn kg−1 (Alloway and Ayres, 1993).
The effects of elevated Cu and Zn levels in the soil remain unclear. While Cu concentrations in soilsthat have been regularly used for slurry disposal have increased, little uptake and translocation of Cuby crop plants is observed (Huysman et al., 1994). However, it is highly likely that soil microbialpopulations and the essential cycling of elements, fundamental for the maintenance of soil fertility, inwhich microbes play a major role, may be adversely effected (Giller et al., 1998).
Fertilisers, pesticides and limesA widespread source of Cd in agricultural soils is from phosphatic fertiliser, either in the form of
superphosphates (in straight P-fertilisers) or ammonium phosphate (in compound N, P, K fertilisers)(McLaughlin et al., 1996). This represents 29% of the annual Cd addition to agricultural soils in theUK (Carrington et al., 1998). The raw material for phosphatic fertilisers is rock phosphate and this isdissolved in sulphuric, nitric or phosphoric acid according to fertiliser material being produced. Rockphosphate (depending upon its source) may contain 5–55 mg Cd kg−1 (34–380 mg Cd kg−1P), some60–95% becomes incorporated into the final product depending upon the manufacturing process.Fertilisers in the Netherlands and Sweden have been found to typically contain 2–30 mg Cd kg−1 anda survey of 66 fertiliser samples in the UK found a mean Cd content of 37 mg kg−1 (Alloway, 1995).One of the most serious concerns about the steady rise of Cd levels in soils is that it is relativelymobile and readily taken up by crops (the concentration in plants may be an order of magnitude
ORGANIC WASTES 103

greater than in the soil in which the plant is growing), leading to the risk of increased levels in thehuman diet (Alloway, 1995; McLaughlin et al., 2000). Cadmium may accumulate in the human bodyand is implicated in the causation of kidney disorders, skeletal abnormalities and also some cancers.
Agricultural limestones and pesticides may also contain metal contaminants as unwantedimpurities. In a study on the metal contributions to soils of four inorganic fertilisers, two herbicidesand one fungicide it was shown that all contained significant concentrations of metals, but it wasprimarily Zn, Co and Pb that were added (Gimeno-García et al., 1996). Limes used in normalagricultural practice may also contain significant quantities of Cd (2.8–17.0 mg kg−1), Cr (6.5–50 mgkg−1) and Pb (15–550 mg kg−1) (McLaughlin et al., 2000). It is estimated that 45% of the total annualCu and Zn additions to agricultural soils in the UK are from animal manures, 24% and 35%respectively from aerial deposition and 17% and 10% from sewage sludge (Carrington et al., 1998).
Aerial depositionThe deposition of a range of metals to agricultural land from point sources has lead to localised
increases in soils (MAFF, 2000). Aerial deposition is more important for some metals than othersand it may account for as much as 70% of the Pb and 50% of the Cd added to agricultural soils in theUK annually (Carrington et al., 1998). However, the effects tend to be very localised, depending uponlocal and regional industry, prevailing weather conditions and topography.
N and P pollution from sewage sludge
As with all organic wastes, poorly managed winter applications may result in leaching of nutrientsinto watercourses (Chapters 2 and 3). However, with sewage sludge the treatment process has aconsiderable influence upon nutrient content (Table 5.9) (Environment Agency, 2001b).Generally, it is liquid sludges that can cause the greatest problems, as a larger proportion of theirtotal N is in the available ammonium form, which may subsequently be leached rapidly followingnitrification (Scottish Envirotec, 1995). Injection of sludge to a depth of 10–15 cm can reducesurface run-off and place the nutrients in the most biologically active portion of the soil(Figure 5.5).
A considerable issue with the disposal or recycling of sewage sludges to agricultural land inregard to N and P pollution is the significant variability in available nutrient content of sludgesfrom the same treatment stream over time. This can make fertiliser plans worthless in thatvariations of available N applied may be up to 100% greater than thought, if data from previousbatches are used as reference (Stehouwer et al., 2000).
BOX 5.3WOBURN MARKET GARDEN EXPERIMENT
The Woburn Market Garden Experiment was set up in 1942 in order to assess the fertiliservalue of various organic manures, including sewage sludge. Manures were applied annuallyto plots at the site from 1942 until 1961, after which no further applications were made. Atotal of 25 applications of sewage sludge were made to the plots at two rates approximatelyequivalent to 8.2 and 16.4t−1 ha−1 year−1. Soil samples were taken from the plots at irregularintervals (1942, 1951, 1960, 1967, 1972, 1980 and 1983) from the start of the experiment,
104 CHAPTER 5

dried and archived (McGrath and Cegarra, 1992). By the end of the sludge trial relativelylarge amounts of metals, particularly Zn, Cu and Ni, had accumulated in the soils and cropsgrown on the plots when compared to untreated control plots (LeRiche, 1968). Thefollowing table shows the range of total concentrations (mg kg−1) of selected heavy metalsin the treated soils in 1961 and the concentrations of metals in the same plots over 25 yearslater (McGrath, 1984; MAFF, 1993).
The data shows the long-term residence time of heavy metals applied to soils in sewagesludge. Over 25 years after the final application of sewage sludge to the plots there appearsto be only a relatively small loss of metals, which may be attributed to the movement of soilout of the plots during cultivation.
Furthermore, 25 years after the cessation of applications of sewage sludge at this site, measurementsof the soil biomass (soil microbial populations) within the treated plots revealed that it was only halfthat of the untreated controls (Brookes and McGrath, 1984). This was thought to be attributable tothe Zn concentrations, which although below the current UK limits, may still have had a deleteriousaffect upon the biomass (Giller et al., 1998). However, Cd concentrations in the plots are 2–3 timesgreater than UK limits (MAFF, 1993) and may also have contributed to the reduced microbialbiomass observed on the treated plots.
This example demonstrates the long-term impact of heavy metals applied to soils in sewage sludgeupon the agroecosystem. It also highlights the difficulty in developing a protective regulatoryframework for the safe management of metals in sewage sludges applied to agricultural soils (Renner,2000).
Odours
Odour nuisance can be a serious environmental problem (Chapter 6) and depends on the type ofsludge treatment, method of application and prevailing weather conditions. Anaerobic or aerobicdigestion of sludge often removes much of the odour nuisance, as does rapid incorporation ofsludge by injection directly into the soil. However, conventional spreaders (Figure 5.6) and non-incorporation of sludge can lead to odours, as well as presenting an increased risk of surface run-off.
Pathogens
As with livestock wastes, there is a risk of pathogen contamination whenever sewage sludges areapplied to agricultural land. Potentially, serious pathogens include bacteria such as Salmonella(especially Salmonella typhimurium DT104), human viruses such as Hepatitis A, parasiticnematodes and worms, and parasitic protozoa such as Cryptosporidium. Although the accidentalcontamination of soft fruit and vegetables with human faeces has been recorded as causing
ORGANIC WASTES 105
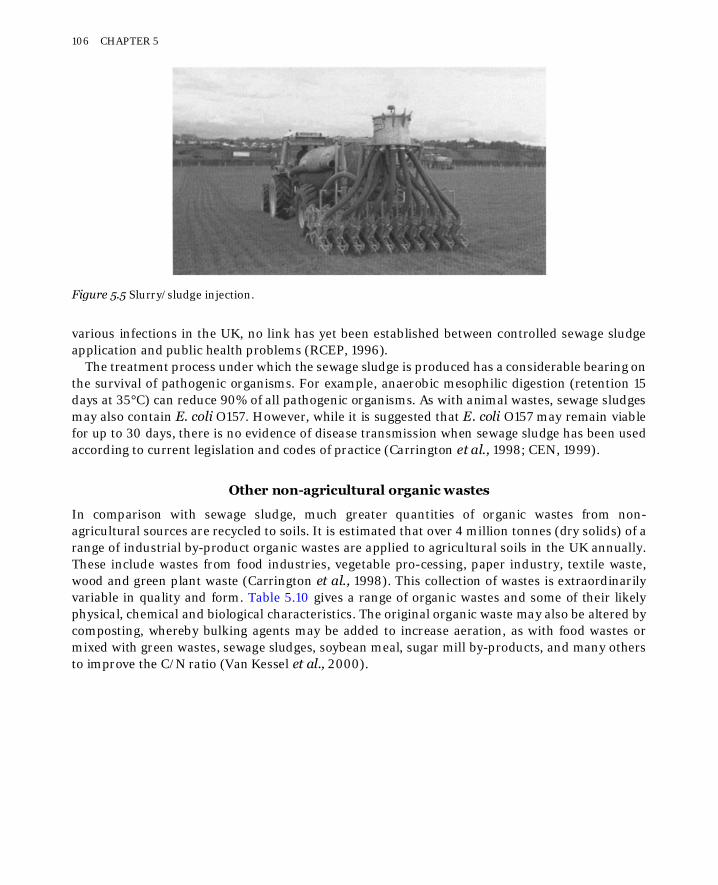
various infections in the UK, no link has yet been established between controlled sewage sludgeapplication and public health problems (RCEP, 1996).
The treatment process under which the sewage sludge is produced has a considerable bearing onthe survival of pathogenic organisms. For example, anaerobic mesophilic digestion (retention 15days at 35°C) can reduce 90% of all pathogenic organisms. As with animal wastes, sewage sludgesmay also contain E. coli O157. However, while it is suggested that E. coli O157 may remain viablefor up to 30 days, there is no evidence of disease transmission when sewage sludge has been usedaccording to current legislation and codes of practice (Carrington et al., 1998; CEN, 1999).
Other non-agricultural organic wastes
In comparison with sewage sludge, much greater quantities of organic wastes from non-agricultural sources are recycled to soils. It is estimated that over 4 million tonnes (dry solids) of arange of industrial by-product organic wastes are applied to agricultural soils in the UK annually.These include wastes from food industries, vegetable pro-cessing, paper industry, textile waste,wood and green plant waste (Carrington et al., 1998). This collection of wastes is extraordinarilyvariable in quality and form. Table 5.10 gives a range of organic wastes and some of their likelyphysical, chemical and biological characteristics. The original organic waste may also be altered bycomposting, whereby bulking agents may be added to increase aeration, as with food wastes ormixed with green wastes, sewage sludges, soybean meal, sugar mill by-products, and many othersto improve the C/N ratio (Van Kessel et al., 2000).
Figure 5.5 Slurry/sludge injection.
106 CHAPTER 5

Figure 5.6 Manure spreading.
The benefits of land application of non-agricultural organic wastes include increased plantnutrient content and improvements in soil physical and chemical properties, as well as biologicaland pest and disease control properties (Dissanayake and Hoy, 1999; Zibilske et al., 2000). It isoften considered that land application represents an economically and environmentallysustainable alternative to more common methods of disposal of these wastes, such as landfill andincineration. However, potentially detrimental effects of recycling some of these organic wastes toagricultural land may include the presence of pathogenic organisms, potentially toxic elements(metals and organic micropollutants) and salinity (Mullins and Mitchell, 1995).
Detrimental effects of applying non-agricultural wastes to land
Like all organic manures, poorly managed land applications of non-agricultural organic wastes canlead to detrimental effects upon ground and surface water bodies which may have considerableoff-site impacts (Chapters 2 and 3) (Box 5.1).
Detrimental in-situ effects upon soil processes by some organic wastes may also occur.Generalisations in this regard are difficult (Table 5.10) as there is considerable physical/chemicaland biological variability between wastes. This is further hampered with the use of composts thatlack quality assurance from producers as to the presence of metals, pathogens and foreign bodies(such as plastics). Information in this regard is currently missing in many parts of the EU(Moolenaar et al., 1997; Centemero and Corti, 2000).
ORGANIC WASTES 107

Applications of cheese whey (the liquid by-product of cheese production) to agricultural soilshas been shown through repeated applications to increase root zone salinity, decrease waterinfiltration rates (by up to 67%) and when surface applied without incorporation cause aconsiderable odour problem (Lehrsch and Robbins, 1996). Developing soil salinity and theconsiderable effects this may have on crop growth is also thought to be a major concern with therepeated application of distillery wastes (Pathak et al., 1999).
One of the most commonly encountered problems associated with the application of organicwastes to agricultural land is the transient imbalance in macronutrients, especially N, in thereceiving soil. This may occur with the application of wet olive husks (a by-product resulting duringolive oil extraction) (Bedini et al., 1998), corrugated cardboard, wood chips and papermill sludge(PS). An estimated 1 million tonnes PS is produced in the UK per annum, of which just under halfis recycled to agricultural land (Aitken et al., 1995). One of the greatest restrictions to the disposalof PS to agricultural soils is the relatively high carbon to nitrogen (C/N) ratio (e.g. 60–225:1),which can result in significant decreases in crop yield, due to nitrogen deficiency (Edwards, 1994;Elvira et al., 1995; Evanylo and Daniels, 1999). The carbon to nitrogen ratio is a characteristic ofall organic wastes applied to soils that is often considered to be an integral to the rate ofdecomposition and release of ammonium and nitrate. When residues having high C/N ratios areadded to soils intense competition occurs among microbes for available N, so much so in somecases that higher plants will suffer N deficiency (Figure 5.7) (Brady and Weil, 1999). Furthermore,if there is not sufficient N, the degradation of the added organic substrate will be hindered andpotential beneficial breakdown products not released. A C/N ratio in the added organic waste of20 is thought to be the approximate cut-off value, above which microbial action will not releaseavailable N due the decomposition process (Hill and James, 1995).
A common solution to the issue of non-agricultural organic wastes with C/N ratios greater than20 is to delay planting after amendment or by applying inorganic nitrogenous fertiliser (Logan andEsmaeilzadeh, 1985; Bellamy et al., 1995).
Many of the non-agricultural wastes applied to soils are relatively low in trace metals, certainlywhen compared to some of the other sources of metals to land (Box 5.2). While it is thought that20% of all of the Zn recycled to soils through non-agricultural organic wastes is contained in 75,000 t of deinked PS (Carrington et al., 1998), Zn concentrations in PS are often below 40 mg kg−1
(Merrington and Madden, 2000). Papermill effluents, produced during the paper productionprocess may also be recycled to land and contain a range of organic micropollutants such aschlorophenols and possibly dioxins. However, while limited research has been undertaken on the
108 CHAPTER 5
Table 5.10 General characteristics of a range industrial wastes applied to agricultural land (CEN,1999).
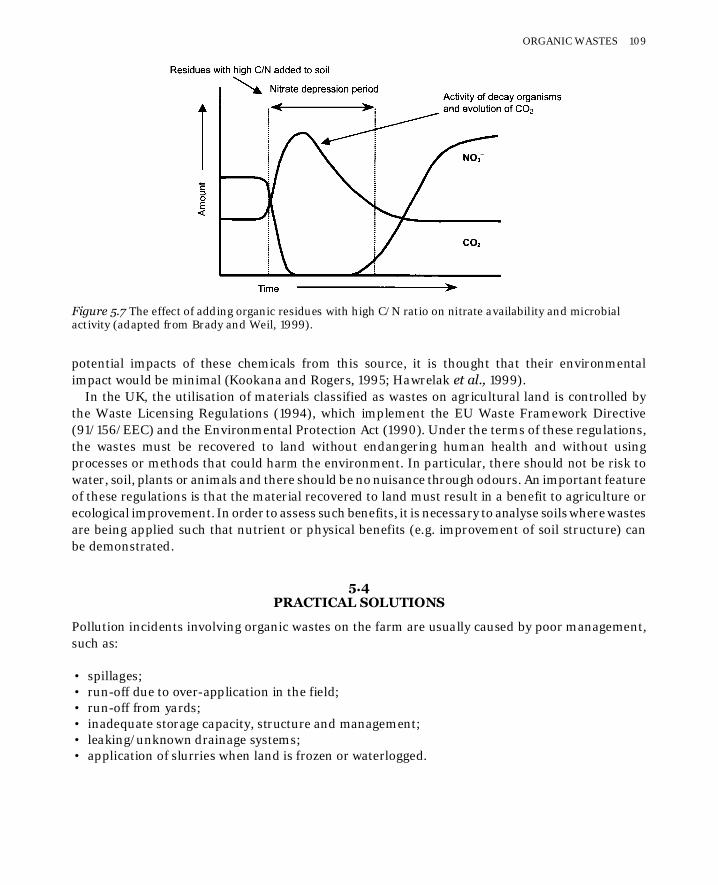
potential impacts of these chemicals from this source, it is thought that their environmentalimpact would be minimal (Kookana and Rogers, 1995; Hawrelak et al., 1999).
In the UK, the utilisation of materials classified as wastes on agricultural land is controlled bythe Waste Licensing Regulations (1994), which implement the EU Waste Framework Directive(91/156/EEC) and the Environmental Protection Act (1990). Under the terms of these regulations,the wastes must be recovered to land without endangering human health and without usingprocesses or methods that could harm the environment. In particular, there should not be risk towater, soil, plants or animals and there should be no nuisance through odours. An important featureof these regulations is that the material recovered to land must result in a benefit to agriculture orecological improvement. In order to assess such benefits, it is necessary to analyse soils where wastesare being applied such that nutrient or physical benefits (e.g. improvement of soil structure) canbe demonstrated.
5.4PRACTICAL SOLUTIONS
Pollution incidents involving organic wastes on the farm are usually caused by poor management,such as:
• spillages;• run-off due to over-application in the field;• run-off from yards;• inadequate storage capacity, structure and management;• leaking/unknown drainage systems;• application of slurries when land is frozen or waterlogged.
Figure 5.7 The effect of adding organic residues with high C/N ratio on nitrate availability and microbialactivity (adapted from Brady and Weil, 1999).
ORGANIC WASTES 109

Various Codes of Good Agricultural Practice (MAFF, 1998a,b,c) have been published by the UKgovernment with the intention of encouraging farmers to manage farm resources effectively,whilst minimising the risk of pollution and keeping within the law. The Code of Good AgriculturalPractice for the Protection of Water (MAFF, 1998a) addresses most of the problems associatedwith organic waste, notably in relation to their threat to watercourses. The Code includesrecommendations on the appropriate design and structure of storage and handling facilities. Forexample, in accordance with the Control of Pollution (Silage, Slurries and Agricultural Fuel Oils)Regulation 1991, silage must be contained within a properly designed and constructed clamp atleast 10m away from a watercourse or field drain. The Code also recommends how waste shouldbe handled and disposed of safely; guidelines which have now also been incorporated into apractical farm waste management plan for farmers (ADAS, 1994).
Farm waste handling, storage and disposal
Because of their potential to cause pollution, it is important that all farm wastes are handled andstored safely. The ultimate fate of wastes is usually disposal to land, but prior to this there is oftena storage period. Nicholson (1994) identified the objectives of storage as:
• avoidance of water pollution hazards;• avoidance of damage or contamination to growing crops;• to optimise use of plant nutrients contained in the waste;• avoidance of damage to soils by machinery;• avoidance of requirement for daily spreading.
The way in which the waste is stored and handled depends upon its type. The Code of GoodPractice includes the following recommendations for the storage and disposal of different types offarm waste (MAFF, 1998a).
Solid manures
Solid manures (e.g. farmyard manure from traditional covered yards and poultry litter frombattery and broiler systems) are less likely to cause pollution than slurries because they arerelatively easy to store and handle. However, even with solid wastes there is a liquid fraction, oftenwith high BOD, so they should still be considered a threat. Farmyard manure and other deep litteris typically removed from a farm building using a tractor-mounted fork (Culpin, 1992) and shouldideally be stored in a concrete-based structure with up to three walls (2–3 m high), 10 to 15 mwide (MAFF, 1998a) and a below ground tank to store liquid waste. Provided that there is no riskof contaminating adjacent watercourses, an alternative is to put the manure into temporary fieldheaps.
Several important changes occur during the storage of manures. Aerobic breakdown of organicmaterial leads to a natural composting process, generating carbon dioxide, ammonia and methane.Turning manure heaps during storage will accelerate this process, resulting in less manure tospread, but with elevated nutrient concentrations. In organic farming systems, the storage ofmanure for at least 3 months prior to application on land is advised (Soil Association, 1999). This
110 CHAPTER 5

storage period, together with turning on two or three occasions will result in manure volumereduction of 50%, leaving in less material to be spread. Nutrients tend to be converted to organic,stable forms, and the manure is more friable, making it easier to spread (Gibbs et al., 2000). Up to10% of the total N in the manure at the start of the composting/storage phase can be lost byammonia volatilisation. In addition, manure heaps that are exposed to the elements will losenutrients in leachate, particularly nitrates and potassium. The speed of incorporation of manuresinto soil can have a significant effect on the conservation of readily available N in the manures.With slurries often needing to be incorporated within 6 hours of application if 50% of the availableN is to be conserved and not lost (Shepherd and Gibbs, 2001). Following storage, the manure canbe applied to the land when appropriate by using a spreader such as a rotary flail side-spreader,whilst any accumulated liquid can be spread by tanker or a low-rate irrigation system.
Silage
Silage has traditionally been stored in a clamp or silo, baled silage has become increasingly popularsince the late 1970s. The design of a silo must intercept any effluent produced and MAFFrecommend that silos have concrete floors which are sealed to prevent liquid escaping and slopefrom back to front (with a fall of 1 in 75) towards a drain across the front of the silo (Figure 5.8).Effluent should be stored in an appropriate below ground tank and disposed of by tanker.
Patterson and Steen (1994) have shown that an alternative to disposal is to use the effluent as afoodstuff. The study showed that with pigs and cattle silage effluent could make a protein andenergy contribution towards production. Big-bale silage is an alternative production method andis claimed to reduce the risk of pollution from effluent by:
• carrying out baling at crop DMs of greater than 30%, thus reducing effluent production;• containing any effluent produced within the wrapping of individual bales.
Slurry
Slurry is usually transferred from housing to store via a reception pit or tank, and is then stored inone of a number of ways: above-ground circular stores, weeping wall stores or earth-bankedlagoon stores (MAFF, 1998a).
Above ground circular stores are usually made from coated steel panels, with a depth of up to6m. A typical system has a reception pit next to the main store (Figure 5.9) with a pump whichmoves slurry from the pit to the store. Slurry within the store is usually mixed to prevent gases andodour problems, and to keep the slurry fluid. Slurry is then disposed of from the store by slurrytanker or irrigation system.
Weeping wall stores are above ground structures, typically 2–3 m high built on a concrete base(Figure 5.10). Liquid weeps through gaps in the walls and is collected via channels to a storagetank. As the liquid fraction is allowed to drain away, the solids dry out and have a consistencysimilar to solid manure. The solid material can be disposed of by spreader, and the liquid bytanker or irrigation.
ORGANIC WASTES 111

Earth-banked stores (Figure 5.11) are useful in storing solid, liquid or semi-liquid wastes. Theymay be built below, above, or partly below ground, and are typically 3–4 m deep. The store can beemptied by tanker or loader and manure spreader depending upon the type of waste. Slurry canalso be treated in a number of ways (MAFF, 1998a), including:
• mechanical separation, to give a liquid fraction that can easily be pumped and a solid fractionfor spreading as a solid manure;
• anaerobic digestion (treatment without oxygen);• aerobic digestion (treatment with oxygen).
Dirty water
Dirty water is produced on the farm by cleaning work, including yard and parlour washing, andthe run-off from open areas (e.g. stock yards and outdoor silos). It can therefore be contaminatedwith a range of materials, including livestock faeces and urine, silage effluent, milk and parlourcleaning chemicals, with a broad range of BODs and other polluting effects.
Dirty water is usually stored in either an earth-banked lagoon or below ground store. A simpleway of separating any solids from this liquid waste is to have a series of settlement tanks orbarrier ditches separated by H-section overflow pipes. Disposal of liquids is usually by tanker orlow-rate irrigation systems. Low-rate irrigation systems pump the dirty water from the settlement
Figure 5.8 A typical walled silo (MAFF, 1998a).
112 CHAPTER 5

tank or lagoon directly to the land via an electric pump, small bore pipes and sprinkler (ortravelling irrigator) in the field.
Good agricultural practice
The ADAS Farm Waste Management Plan
The ADAS Farm Waste Management Plan (ADAS, 1994 comprises five steps for farmers to take(Box 5.4)):
STEP 1 Identifies how much land is available for spreading manures and where manureshould not be spread. A map is drawn of the farm which shows fields, watercoursesand boreholes, springs or wells. Areas are identified where manures and slurriesshould never be spread. These include:
• areas within 10m either side of ditches and watercourses;• areas within 50 m of any spring, well, borehole or reservoir; • very steep slopes where run-off is a high risk throughout the year;• any areas where spreading is not permissible, such as a Site of Special Scientific
Interest (SSSI) or ESA.
Figure 5.9 An above-ground circular slurry store (MAFF, 1998a).
ORGANIC WASTES 113
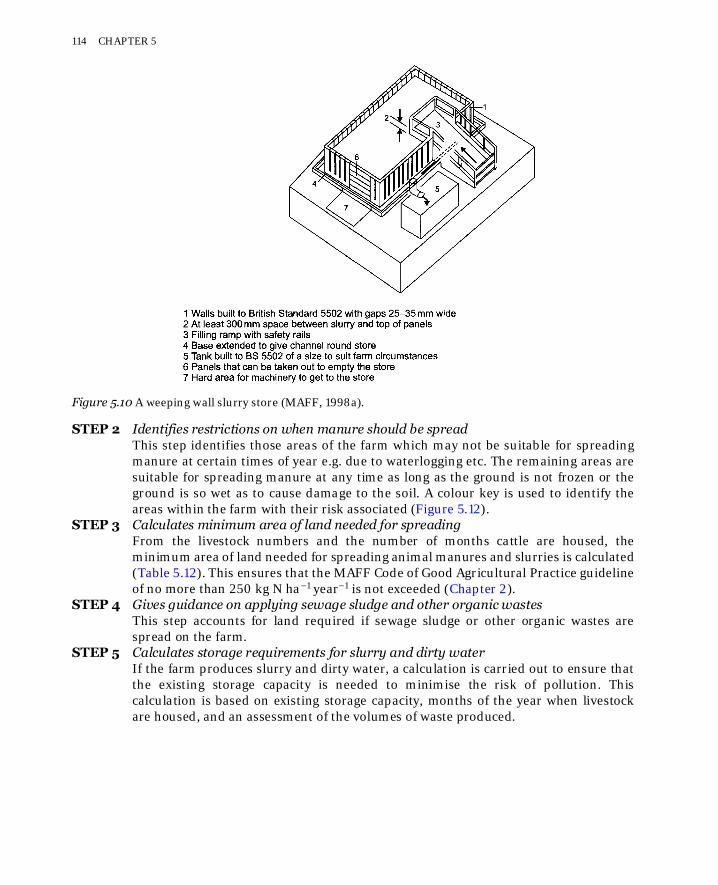
STEP 2 Identifies restrictions on when manure should be spreadThis step identifies those areas of the farm which may not be suitable for spreadingmanure at certain times of year e.g. due to waterlogging etc. The remaining areas aresuitable for spreading manure at any time as long as the ground is not frozen or theground is so wet as to cause damage to the soil. A colour key is used to identify theareas within the farm with their risk associated (Figure 5.12).
STEP 3 Calculates minimum area of land needed for spreadingFrom the livestock numbers and the number of months cattle are housed, theminimum area of land needed for spreading animal manures and slurries is calculated(Table 5.12). This ensures that the MAFF Code of Good Agricultural Practice guidelineof no more than 250 kg N ha−1 year−1 is not exceeded (Chapter 2).
STEP 4 Gives guidance on applying sewage sludge and other organic wastesThis step accounts for land required if sewage sludge or other organic wastes arespread on the farm.
STEP 5 Calculates storage requirements for slurry and dirty waterIf the farm produces slurry and dirty water, a calculation is carried out to ensure thatthe existing storage capacity is needed to minimise the risk of pollution. Thiscalculation is based on existing storage capacity, months of the year when livestockare housed, and an assessment of the volumes of waste produced.
Figure 5.10 A weeping wall slurry store (MAFF, 1998a).
114 CHAPTER 5

Figure 5.11 An earth-banked store suitable for solid, liquid or semi-liquid wastes (MAFF, 1998a).
Table 5.11 ADAS Farm Waste Management Plan areas of high risk for slurry or manure spreading (ADAS,1994).
ORGANIC WASTES 115

Figure 5.12 Cut out colour key to aid in the identification of areas of high risk in the ADAS FarmWaste Management Plan (ADAS, 1994, MAFF/WOAD, 1998).
BOX 5.4FARM WASTE MANAGEMENT PLAN CASE STUDY
BackgroundLaurel Farm is a medium-sized holding of 144 ha located in Dorset (average rainfall of 450mm). It
is a traditional mixed dairy farm with approximately 40 ha of arable land producing forage maize andspring/winter barley in rotation with 60ha of temporary grassland. The remaining land is permanentpasture.
The herd comprises 120 Friesians with 30 followers. During the winter (approximately 6 months)all livestock are housed in deep litter barns with access to outdoor yards for feeding (2000 m2).Slurry from the yards is scraped daily by tractor into a weeping-wall store from which dirty water(plus run-off from the yard and dairy washings) drains into a below-ground tank connected to a lowrate irrigation system.
When the stock are housed during the winter, the slurry store often needs emptying every 2–3weeks. The slurry is scooped by tractor-mounted bucket into a manure spreader and, dependingupon weather conditions, spread onto suitable land. The deep litter barns are cleaned out twice—
116 CHAPTER 5
Table 5.12 Extract of table from ADAS Farm Waste Management Plan to calculate the areasneeded to spread slurry during months when all livestock are housed (ADAS, 1994; MAFF/WOAD,1998).

once in mid-winter and then again when the livestock return to pasture. The manure may be heapedand stored, or spread immediately depending upon prevailing conditions.
It is planned to increase the herd size during 1996/97 to 200 cows with 50 followers. While theavailable buildings and yard are adequate for a larger herd size, the existing waste managementsystem is old and may not be adequate to cope with the increased herd size. The farmer has somecapital funds available, but wishes to minimise costs by retaining as much of the existing system aspossible. In order to assess the viability of the proposal a consultant was asked to produce anappropriate report, including a farm waste management plan.
The assessmentThe first stage in assessing the proposal was to conduct a thorough audit of existing facilities and
farming practice.Using the ADAS Farm Waste Management Plan (ADAS, 1994), a map was produced to identify
those areas on the farm suitable for spreading organic waste. In summary, this revealed:
It was concluded that there is sufficient land available to dispose safely of the extra waste produced,subject to the following GENERAL conditions:
• continue to avoid applying wastes to the SSSI;• do not apply wastes in winter time to those fields identified as susceptible to flooding or
those that have active field drains;• never apply wastes within at least 10m of either side of any watercourse on the farm,
including ditches;• never apply wastes when the ground is frozen, or the fields are so wet that tractor-drawn
machinery will damage the soil.
ORGANIC WASTES 117

There are currently three types of organic waste produced on the farm: slurry from yardscrapings, dirty water, and farm yard manure from the deep litter housing.
These wastes differ in their pollution potential. The solid manure produced by the deep littersystem is potentially the least polluting and at Laurel Farm is often spread in the late winter/earlyspring prior to the sowing of spring cereals. If the manure must be stored at all it is stacked intemporary field heaps well away from field drains and other watercourses.
This was considered to be an acceptable practice that can be continued subject to the followingspecific conditions:
• Do not exceed an application of 40 tha−1 of fresh farm yard manure (equivalent to 250kgNha−1) on any area within a 12 month period. This includes land used for growingmaize.
• In order to maximise their fertiliser value and reduce the risk of nitrate leaching,manures should be applied as a complement to inorganic fertiliser applications andaccording to crop need.
Special attention was given to the management of slurry and dirty water (including silageeffluent) on the farm since these are potentially the most polluting wastes.
Dirty water storage had been identified as a problem by the farmer because it was reported that theunderground store had been over-flowing during heavy rainfall. Inspection of the farm buildings,however, revealed that drainpipes from the farm building roofs were broken, resulting in virtually allclean water run-off from the roofing (some 1200m2) entering the below-ground store.
It was recommended that this clean rain water is separated from dirty water by repairing thedrainage systems of the farm buildings. It is anticipated that once this work is carried out, theexisting below-ground store should have enough capacity for the amount of dirty water produced.
Using the equations from the ADAS Farm Waste Management Plan (ADAS, 1994), the minimumarea needed for spreading the increased volume of dirty water in winter was also calculated asfollows:
118 CHAPTER 5

Again it was concluded that there is sufficient land available to dispose safely of the dirtywater produced during the winter months, subject to the following specific conditions:
• apply no more than 5 mm (5 l m−2) per hour of dirty water through low volumesprinklers;
• move sprinklers regularly to suit conditions.
According to the MAFF Code of Good Practice for the Protection of Water (MAFF, 1998a),weeping-wall stores are considered suitable for cattle slurry with a lot of straw bedding in itand thus appropriate to retain at Laurel Farm.
However, it was concluded that the current store would not be large enough for the increased herdsize and that it should be enlarged and improved to ensure 4 months storage capacity at BS5502standards. The application of slurry should also be subject to the following specific condition:
• do not exceed an annual application of 50 m3 ha−1 of undiluted cattle slurry (equivalentto 250 kg N ha−1) on any area within a 12 month period. This includes land used forgrowing maize.
With the improvements outlined, plus strict adherence by all farm staff to the preparedfarm waste management plan and regular inspection of the storage facilities (i.e. to ensurethat they are not deteriorating and that any repairs are carried out immediately), theconsultant considered that the herd size could be safely expanded at Laurel Farm.
5.5NON-AGRICULTURAL ORGANIC WASTES
Whilst it is estimated that some 60% of agricultural land in England and Wales is suitable foraccepting sewage sludge, the actual area available for agricultural disposal of sewage sludge isconstrained by factors such as:
• public acceptability, and perceived risks;• risk of surface water pollution;• cropping patterns;• the willingness of farmers to accept sludge (RCEP, 1996; Renner, 2000);• the adjacency of land to sewage works, only 10% of farmland is within acceptable transport
distance of sewage treatment works.
Taking account of all these constraints only 0.5% of agricultural land in England and Wales iscurrently used for sludge disposal (RCEP, 1996). Although the application of sewage sludge toagricultural land may be potentially beneficial, care must be taken to avoid the risk of potentiallytoxic elements, such as trace metals, increasing to unacceptable levels in the soil. However, this isonly likely to occur where repeated applications are made to relatively small areas of land and the
ORGANIC WASTES 119

potential impacts of such disposal practice in the long-term are not yet fully understood (Chaneyet al., 2000; Martinez et al., 2001). It is more likely that, given the current levels of potentiallytoxic elements in sewage sludges in the UK, the greatest factor limiting application of sewagesludge will often be the N limit of 250 kg ha−1 year−1 (MAFF, 1998a). Nevertheless, the applicationof sewage sludge is subject to a range of controls and guidelines. In the UK, these measures haveeffectively led to; legal restrictions on the amount of Zn, Cu, Ni, Cd, Pb, Hg and Cr applied insludge and accumulating in soil, and recommended limits (not legally set) on Mo, Se, As and F insludge and soils.
Within all EU Member States, concentrations of heavy metal contaminants in sewage sludgeapplied to agricultural land are strictly controlled under EC Directive 86/278 on the Protection ofthe Environment and in Particular of the Soil, when Sewage Sludge is used in Agriculture (EC,1986). The EC Directive adopts a two-pronged approach by specifying ranges of concentrations ofmetals which Member States are required to use as the basis for:
• setting limits for metal levels in soils (of pH 6–7) which must not be exceeded as the result ofusing sewage sludge; and
• controlling the amounts of metals added to land in sewage sludge.
The EC Directive is implemented in the UK by the Sludge (Use in Agriculture) Regulations 1989(HMSO, 1989) (this document was to be revised in 2000, but is yet to be published) which makesit an offence to knowingly allow sludge to be applied to farmland when it does not meet legalrequirements. Further guidance is available in the Code of practice for agricultural use of sewagesludge (DoE, 1996) which amongst other things identifies the maximum permissibleconcentrations (MPCs) in soil of different metals in relation to soil pH (Table 5.13). Importantly,these values are currently being revised, but have yet to be published (EU, 2000; Renner, 2000).
Avoiding pollution problems by potentially toxic elements in sewagesludge
A comparison of the MPCs of metals in soil at pH 6–7 set by the UK with some other EU MemberStates and the United States is shown in Table 5.13. Although UK MPCs are some of the leaststringent in the EU (a number of Member States chose to adopt lower limits than required by theEC Directive), it is important to note that UK regulations do take account of the fact that theavailability of metals for crop uptake varies with soil pH (Alloway, 1995). Since most metals (withexceptions such as selenium and molybdenum) become more available for uptake in acid soilsdifferent MPCs are set for different pH values (Table 5.13) and sewage sludge application isprohibited on soils with a pH below 5.0 (DoE, 1996). The maintenance of soil pH in fieldsregularly receiving sludge is therefore very important, especially where trace metal levels arealready at, or close to, the MPC for a particular pH range.
A comparison with the values set in the United States reveals a differing philosophy to that ofthe EU member states in regard to the setting of metals limit values (US EPA, 1993; Renner,2000). The European approach is precautionary in the light of what is thought to be a lack of clearscientific evidence as to what levels potentially toxic elements from sludges applied to soils maybecome toxic. Indeed, it is expected that the revised EU sludge directive will continue this
120 CHAPTER 5

precautionary approach and attempt to balance the addition of metals in sewage sludges with off-takes, such as crop removal, and therefore prevent the accumulation and build up of metals withinthe plough layer. In the United States, scientist believe that there is enough evidence available toindicate there would be negligible detrimental threat from metals in sewage sludge if appliedwithin the suggested metal limits (Renner, 2000). Importantly, there are detractors to each ofthese approaches and only time will tell who has been over cautious or far too permissive(McBride, 1995; Schmidt, 1997; Chaney et al., 1999).
It must also be remembered that many other materials contain one or more of the contaminantspresent in sewage sludge and so are also subject to the MPCs in Table 5.13. For example, the maincontaminants in animal manures are Cu and Zn that derive from feed additives, and it is advisablefor farmers to monitor their levels in soils receiving repeated applications of pig or poultrymanure. The mixing of sludge with other wastes or products should still conform to the MPCsabove, both before and after, i.e. the mixing of sludges with other wastes for the purpose ofdiluting pollutants is prohibited (EU, 2000).
The UK MPCs for potentially toxic elements listed in Table 5.13 were set on the basis of thepotential direct toxic effects on crops with due consideration to aspects of human and animalhealth. Although the potentially toxic effects of metals on soil organisms and associatedmicrobiological processes have previously caused the revision and lowering of the guide value forZn, from 300 to 200 mg kg−1 (MAFF, 1993). It is stated that the use of sludge is to be carried out toin a way that minimises detrimental effects on; human plant and animal health, the quality ofsurface and groundwaters, the long-term quality of soil including the soil microbial population(EU, 2000).
Avoiding crop contamination by pathogens
Good management practices can also help to avoid the risk of crop contamination by pathogens,such as E. coli, Salmonella and Cryptospiridium, commonly found in farm wastes and sewagesludge. Pre-treatment (fermenting, aerating or composting) of farm wastes prior to application cangreatly reduce the risk of pathogen contamination (Jones, 1999). Schechtner (1992) conductedtrials on the effects of aeration on the physical and chemical properties of slurries anddemonstrated that the heat generated by aeration was effective in killing some pathogens.
Table 5.13 A comparison of maximum permissible total selected metal concentrations (mgkg−1) in sludgeamended soil set in EC Directive 86/278/EEC and those administered by individual EC Member states andalso the United States (MAFF, 1993; Renner, 2000).
* Values are for soil pH 6–7, other values apply at pH 5–6 and >7.** Calculated from maximum cumulative pollutant loading limits mixed into the soil plough layer.
ORGANIC WASTES 121

The Code of Good Practice for the Agricultural Use of Sewage Sludge (DoE, 1996) and CEN(1999) also provide guidance and recommendations on:
• Effective sewage treatment processes, such as high temperature treatment and anaerobicdigestion, which can significantly reduce the risk of health hazards when the resultant sludge isapplied to agricultural land.
• Sludge spread on the soil surface not only dries more quickly, thus shortening the survivaltimes of pathogens, but is also exposed to oxygen and ultra-violet radiation in sunlight. Thesurface spreading of treated sludge on grazed grassland was banned at the end of 1998, ifapplied it must now be deep injected.
• Acceptable uses (subject to conditions) for sewage sludge. Organic wastes should not, forexample, be applied directly to crops, especially if they are to be eaten raw. This is intended toreduce the immediate risk of micro-organisms being transmitted directly to animals orhumans, but may allow some pathogens to survive for longer in the soil (Carrington et al.,1998). Treated sludge can only be applied to land used to grow vegetables at least 12 monthsprior harvest of the crop. For salad vegetables this increases to 30 months (Hickman et al.,1999).
It is expected that the revised Sludge (Use in Agriculture) Regulations will bring in the ‘SafeSludge Matrix’ concept. The Matrix is an agreement between major stakeholders, such as ADAS,the water companies and the British Retail Consortium and introduces a number of major changesin the way in which sludge is used on agricultural land. It was brought about to ensure a minimumstandard of sustainable sewage sludge recycling to land and comprises of a table of crops andlevels of sewage sludge treatment, with guidance for suitable levels of sludge treatment forapplications soils growing certain crops (Table 5.14).
A number of other countries have adopted a more cautious approach to the risk of pathogencontamination from sewage sludge spread on land (RCEP, 1996). In Germany and the USA onlytreated sewage can be applied, which will also be the case from 2002 onwards in the UK (SEPA,1998). While in New South Wales (Australia) and the USA the public are excluded for over 6months from land to which sludge has been applied.
Table 5.14 The ‘safe sludge matrix’ (Hickman et al., 1999).
=Application not allowed.=Applications must comply with Code of Practice and crop and harvest restrictions.
* Including heat treated and other methods.
122 CHAPTER 5

5.6ALTERNATIVE TECHNOLOGIES FOR FARM WASTE TREATMENT
In an examination of the problems of pollution caused by livestock production systems, twofurther practical solutions to the potential problems of dealing with organic farm wastes may beidentified—biogas production and reed bed treatment (RBT).
Biogas production
An alternative to applying slurry and manure to land is to anaerobically digest the organicmaterials with micro-organisms to produce biogas; a mixture of methane (55–65%) and carbondioxide (35–45%). Wase and Thayanithy (1994) concluded that with advances in technologyavailable ‘…the currently advocated process is stable, well researched, and economically viablewhen operated under suitable conditions’.
However, there are currently relatively few ( 25) anaerobic digesters operating on UK farms(RCEP, 1996). The main obstacle to greater uptake remains the economics of digestion. Onesolution might be the installation of centralised digestors serving a number of local farms. Thesealready operate in Denmark and are currently being investigated in the UK. A preliminary studyhas shown that an anaerobic digestor receiving slurry from farmers within a range of about 8miles and linked to a combined heat and power station would cost £4–5 million and could yield1MW of electricity for sale to the national grid or local consumers; similar quantities of hot waterfor local householders or businesses; a liquid manure for return to local farmers; and a compostmaterial for sale (RCEP, 1996). Although a plant of this nature is unlikely, at least for theforeseeable future, to be profitable without public subsidy, it would bring significantenvironmental benefits, especially in those areas where there is increasing risk of seriousenvironmental pollution from farm wastes.
Reed bed treatment
An alternative way of treating dirty water, such as dairy washings and yard run-off, is to use a RBTsystem. This is an artificially constructed wetland usually planted with Common Reed(Phragmites australis) through which the dirty water slowly trickles. The reeds not only absorbnutrients such as nitrogen and phosphorus, but also have the ability to transfer oxygen downthrough their stems and out via their root system into the surrounding rhizosphere. This increasesthe capacity of the system for the aerobic bacterial decomposition of organic pollutants (e.g. milk,urine and faeces), as well as encouraging the proliferation of a wide range of aquatic organisms,some of which directly utilise additional pollutants. Biddlestone et al. (1994) discuss a compostingand reed bed system on a dairy farm with 140 cattle which treats parlour washings and yard wastewater, and results in substantial reductions in BOD and suspended solids.
There are numerous designs of RBT system for treating sewage, industrial effluents andhighways run-off, as well as agricultural wastes (WRc, 1996). Their main benefits, compared to theconventional treatment of dirty water in tanks and lagoons, are claimed to be low capital cost, veryeffective water treatment, minimal (if not enhanced) visual impact, and little smell.
ORGANIC WASTES 123

It is clear from the above discussion that agricultural and non-agricultural wastes may bevaluable sources of plant nutrients and soil conditioner/improver. Yet, potential problemsassociated with their handling, storage and disposal may have broad implications for theenvironment beyond the farm. Effective organic waste management and good agricultural practicemay entail:
• knowing and valuing the organic waste nutrient content;• using this information to balance nutrient inputs and removals, such as crop offtake;• reduce losses of organic wastes from storage and anima housing;• apply the wastes evenly and incorporate into soil rapidly;• timely applications of organic wastes have a significant influence on nutrient loss, i.e. avoid late
summer or early autumn applications (Shepherd and Gibbs, 2001).
REFERENCES
ADAS (1994) Farm Waste Management Plan: the ADAS Step-By-Step Guide for Farmers. Ministry ofAgriculture, Fisheries and Food, London.
Aitken, M.N., Lewis, J.G. and Evans, B. (1995) Effects on soil fertility from applying paper mill sludge toagricultural land. Soil Use and Management 11, 152–153.
Alloway, B.J. (1995) Heavy Metals in Soils. 2nd Edition. Blackie Academic and Professional, London.Alloway, B.J. and Ayres, D.C. (1993) Chemical Principles of Environmental Pollution. Blackie Academic and
Professional, Glasgow.Arnold, S.D. and Meister, E.A. (1999) Dairy feedlot contribution to groundwater contamination: a
preliminary study in New Mexico. Journal of Environmental Health 62, 16–19.Barry, G.A., Gardner, E.A. and Bloesch, P. (1998) Studies on reuse of biosolids on Queensland agricultural
lands. In: Watertech, Proceedings Of The Australia Water And Wastewater Association Conference,Brisbane, Qld. (CD ROM).
Bellamy, K.L., Chong, C. and Cline, R.A. (1995) Paper sludge utilization in agriculture and container nurseryculture. Journal of Environmental Quality 24, 1074–1082.
Bedini, S., Privitera, I., Filippi, C. and Nuti, M.P. (1998) Microbiota in soil treated with non-fermented wetolive husks. Rivista-di-Agronomia 4, 264–270.
Biddlestone, A.J., Gray, K.R. and Thayanithy, K. (1994) Composting and reed beds for aerobic treatment oflivestock wastes. In: Pollution in Livestock Production Systems (Eds I.Ap Dewi, R.F.E., Axford I., Marai,M. Fayez, and H.Omed). CAB International, Wallingford, pp. 345–360.
Brady, N.C. and Weil, R.R. (1999) The Nature and Properties of Soil. 12th Edition. Prentice Hall, NewJersey.
Brookes, P.C. and McGrath, S.P. (1984) The effects of metal toxicity on the size of soil microbial biomass.Journal of Soil Science 35, 341–346.
Carrington, E.G., Davies, R.D., Hall, J.E., Pike, E.B., Smith, S.R. and Unwin, R.J. (1998) Review of theScientific Evidence Relating to the Controls on the Agricultural Use of Sewage Sludge. Part 2—EvidenceSince 1989 Relevant to Controls on the Agricultural Use of Sewage Sludge . WRc report No. DETR 4454/4. WRc Medmenham.
CEN (1999) Recommendations To Preserve And Extend Sludge Utilisation And Disposal Routes. ComiteEuropeen de Co-ordination des Normes (European Committee for Co-ordination of Standards). CEN TC308.
Centemero, M. and Corti, C. (2000) Technical characteristics of compost for sustainable agriculture.Informatore-Agrario 6, 33–39.
124 CHAPTER 5
Chaney, R.L., Ryan., J.A. and Brown, S.L. (1999) Environmentally acceptable endpoints for soil metals. In:Environmental Availability of Chlorinated Organics, Explosives, and Metals in Soils (Eds W.C.Anderson, R.C., Loehr and D.Reible). Am. Acad. Environ. Eng., Annapolis, MD, pp. 111–155.
Chaney, R.L., Brown, S.L., Angle, J.S., Stuczynski, T.I., Daniels, W.L., Henry, C.L., Siebielec, G., Li, Y.M.,Malik, M., Ryan, J.A. and Compton, H. (2000) In situ remediation/reclamation/restoration of metalscontaminated soils using tailor-made biosolids mixtures. In: Symposium on Mining, Forest and LandRestoration: The Successful Use of Residuals/Biosolids/Organic Matter for Reclamation Activities.Rocky Mountain Water Environment Association, Denver, Co, July 17–20th.
Conway, G.R. and Pretty, J.N. (1991) Unwelcome Harvest: Agriculture and Pollution. Earthscan, London.Culpin, C. (1992) Farm Machinery. Blackwell Scientific Publications, Oxford.Dampney, P. (1995) Good timing helps bank balances. Farmers Weekly (Forage and Grassland
Supplement), 17th February 1995, 20–25.DoE (1993) River Quality Draft Regulation: The Surface Waters (Fisheries Ecosystem) (Classification)
Regulations. Department of the Environment, London.DoE/DH (1990) Crytosporidium in Water Supplies. Report of the Group of Experts, Department of the
Environment and Department of Health. HMSO, London.DoE (1996) Code Of Practice For Agricultural Use Of Sewage Sludge. HMSO, London.DETR (2001) Chapter 3 Inland Water Quality and Use. In: Digest of Environmental Statistics. Department
of the Environment, Transport and the Regions, London.Dissanayake, N. and Hoy, J.W. (1999) Organic material soil amendment effects on root rot and sugarcane
growth and characterization of the materials. Plant-Disease 11, 1039–1046.EC (1986) EC Directive 86/278/EEC on the Protection of the Environment and in Particular of the Soil, when
Sewage Sludge is used in Agriculture. Official Journal of the European Communities No. L181/8 (4/7/86) .Edwards, J.H. (1994) Direct land application of waste paper. Biocycle, April, 69–72.Edwards, A.C. and Withers, P.J.A. (1998) Soil phosphorus management and water quality: A UK perspective.
Soil Use and Management 14, 124–130.Elvira, C., Mato, S. and Nogales, R. (1995) Changes in metal extractability and organic matter fractions after
vermicomposting of sludges from a paper mill industry and wastewater treatment plant. FreseniusEnvironmental Bulletin 4, 503–507.
Environment Agency (2001a) Water Quality. URL: http://www.environment-agency.gov.uk/ subjects/waterquality/134499/?version=1
Environment Agency (2001b) Sewage Sludge. URL: http://www.environment-agency.gov.uk.sewage sludgeEU (2000) Working document of sludge, 3rd Draft. European Union, Brussels. EnV.E.3/LM.Evanylo, G.K. and Daniels, W.L. (1999) Paper mill sludge composting and compost utilization. Compost-
Science and Utilization 7, 30–39.Foy, R.H. and Kirk, M. (1995) Agriculture and water quality: A Regional Study. Journal of the Chartered
Institute of Water and Environmental Management 9, 247–256.Foy, R.H., Smith, R.V., Smyth, D., Lennox, S.D. and Unsworth, E.F. (1994) The impact of climatic and
agricultural variables on the frequency of silage pollution incidents. Journal of EnvironmentalManagement 41, 105–121.
Gibbs, P.A., Parkinson, R.J., Fuller, M.P. and Misselbrook, T. (2000) Enhancing the effective utilisation ofanimal manures on-farm through compost technology. In: Agriculture and Wastes. Management for aSustainable Future (Eds T.Petchey and B.D’Arcy). SAC, Edinburgh, pp. 63–72.
Gimeno-García, E., Andreu, V. and Boluda, R. (1996) Heavy metals incidence in the application of inorganicfertilizers and pesticides to rice farming soils. Environmental Pollution 92, 19–25.
Giller, K.E., Witter, E. and McGrath, S.P. (1998) Toxicity of heavy metals to microorganisms and microbialprocess in agricultural soils: a review. Soil Biology and Biochemistry 30, 1389–1414.
Glendinning, J.S. (1999) Australian Soil Fertility Manual. CSIRO Publishing, Collingwood, Australia.
ORGANIC WASTES 125

Haigh, P.M. (1997) Silage dry matter content and predicted effluent production in England and Wales 1984–1994. Journal of Agricultural Engineering Research 66, 63–77.
Hall, J.E. (1992) Treatment and use of sewage sludge. In: The Treatment And Handling Of Wastes (EdsA.Bradshaw, D.Southwood and R.Warner). Chapman and Hall, London, pp. 63–82.
Hawrelak, M., Bennett, E. and Metcalfe, C. (1999) The environmental fate of the primary degradationproducts of alkylphenol ethoxylate surfactants in recycled paper sludge. Chemosphere 39, 745–752.
Hickey, C.W., Golding, L.A., Martin, M.L. and Crocker, G.F. (1999) Chronic toxicity of ammonia to NewZealand freshwater invertebrates: a mesocosm study. Archives of Environmental Contamination andToxicology 37, 338–351.
Hickman, G.A.W., Chambers, B.J. and Pierrepont, P.J. (1999) Addressing customer concerns—developmentof the ADAS matrix for sustainable application of sewage sludge to agricultural land. In: Agriculture andWastes Management for a Sustainable Future (Eds A.M.Petchey, B.J.D’Arcy and C.A.Frost). SACEdinburgh, pp. 4–10.
Hill, R.L. and James, B.R. (1995) The influence of waste amendments on soil properties. In: SoilAmendments and Environmental Quality (Ed. J.E.Rechcigl). CRC Pres, Inc, Boca Raton, Fla, pp. 311–325.
HMSO (1989) Sludge (Use In Agriculture) Regulations 1989, S.I. 1989 No. 1263 As Amended by the Sludge(Use in Agriculture) Regulations 1990, S.I. 1990 No. 880. Her Majesty’s Stationery Office, London.
HMSO (1991) Control of pollution (Silage, Slurry and Agricultural Fuel Oil) Regulations 1991, S.I. 1991 No.324. Her Majesty’s Stationery Office, London.
HMSO (1993) Agriculture in the United Kingdom 1993. MAFF, SOAFD, DANI, WO, Her Majesty’s StationeryOffice, London.
Huysman, F., Verstraete, W. and Brookes, P.C. (1994) Effect of manuring practices and increased copperconcentrations on soil microbial populations. Soil Biology and Biochemistry 26, 103–110.
Jackson, D.R. and Smith, K.A. (1997) Animal manure slurries as a source of nitrogen for cereals: effect ofapplication time on efficiency. Soil Use and Management 13, 75–81.
Johnes, P.J., Moss, B. and Phillips, G. (1996) The determination of total nitrogen and total phosphorusconcentrations in freshwaters from land use, stock headage and population data: testing a model for usein conservation and water quality management. Freshwater Biology 36, 451–473.
Jones, D.L. (1999) Escherichia coli O157 in the environment. Soil Use and Management 15, 76–83.Kookana, R.S. and Rogers, S.L. (1995) Effects of paper mill effluent disposal on soil. Reviews of
Environmental Contamination and Toxicology 42, 13–64.Lehrsch, G.A. and Robbins, C.W. (1996) Cheese whey effects on surface soil hydraulic properties. Soil Use
and Management 12, 205–208.Lennox, S.D., Foy, R.H., Smith, R.V., Unsworth, E.F. and Smyth, D.R. (1998) A comparison of agricultural
water pollution incidents in Northern Ireland with those in England and Wales. Water Research 32,649–656.
LeRiche, H.H. (1968) Metal contamination of soil in the Woburn Market Garden experiment resulting fromthe application of sewage sludge. Journal of Agricultural Science (Camb.) 71, 205–208.
Logan, T.J. and Esmaeilzadeh, H. (1985) PS evaluated for use on cropland. Ohio Report, March-April, 22–25 .MAFF (1993) Review of the Rules for Sewage Sludge Application to Agricultural Land: Soil Fertility
Aspects of Potentially Toxic Elements. Ministry of Agriculture, Fisheries and Food, London.MAFF (1998a) Code of Good Agricultural Practice for the Protection of Water. Revised 1998. Ministry of
Agriculture, Fisheries and Food, London.MAFF (1998b) Code of Good Agricultural Practice for the Protection of Air. Revised 1998. Ministry of
Agriculture, Fisheries and Foods, London.MAFF (1998c) Code of Good Agricultural Practice for the Protection of Soil. Revised 1998. Ministry of
Agriculture, Fisheries and Food, London.
126 CHAPTER 5

MAFF/WOAD (1998) Farm Waste Management Plan. A Step by Step Guide to Farmers. Ministry ofAgriculture, Fisheries and Food, London.
MAFF (2000) Towards Sustainable Agriculture: Pilot Set of Indicators. Ministry of Agriculture, Fisheriesand Food, London, p. 30.
Martinez, C.E., Jacobson, A. and McBride, M.B. (2001) Thermally indiced changes in metal solubility ofcontaminated soils is linked to mineral recrystallization and organic matter transformations.Environmental Science and Technology 35, 908–916.
Mason, C.F. (1996) Water pollution biology. In: Pollution, Causes, Effects And Control. (Ed. R.M. Harrison).3rd Edition. The Royal Society of Chemistry, Cambridge, pp. 66–92.
McBride, M.B. (1995) Toxic metal accumulation from agricultural use of sludge: are US EPA regulationprotective, Journal of Environmental Quality 24, 5–18.
McGrath, S.P. (1984) Metal concentrations in sludges and soil from a long-term field trial. Journal ofAgricultural Science (Camb.) 103, 25–35.
McGrath, S.P. and Cegarra, J. (1992) Chemical extractability of heavy metals during and after long-termsludge applications of sewage sludge to soil. Journal of Soil Science 43, 313–321.
McLaughlin, M.J., Tiller, K.G, Naidu, R. and Stevens, D.P. (1996) Review: the behaviour and environmentalimpact of contaminants in fertilizers. Australian Journal of Soil Research 34, 1–54.
McLaughlin, M.J., Hamon, R.E., McLaren, R.G., Speir, T.W. and Rogers, S.L. (2000) Review: Abioavailability-based rationale for controlling metal and metalloid contamination of agricultural land inAustralia and New Zealand. Australian Journal of Soil Research 38, 1037–1086.
Merrington, G. and Madden, C. (2000) Changes in Cd and Zn Phytoavailability in an agricultural soil afteramendment with papermill sludge and biosolids . Communications in Soil Science and Plant Analysis31, 759–776.
Moolenaar, S.W., Lexmond, T.M. and Van-der-Zee, S.E.A.T.M. (1997) Calculating heavy metal accumulationin soil: a comparison of methods illustrated by a case-study on compost application. Agriculture,Ecosystems and Environment 1, 71–82.
Mullins, G.L. and Mitchell, C.C. (1995) Crops. In: Soil Amendments; Impacts on Biotic Systems (Ed.I.E.Rechcigl). CRC Pres, Inc, Boca Raton, Fla, pp. 1–40.
Nemerow, N.L. (1991) Stream, Lake, Estuary and Ocean Pollution. Environmental Engineering Series, VanNostrand Reinhold, New York.
Nicholson, R.J. (1994) Systems of Storage and Disposal of Livestock Wastes. In: Pollution in LivestockProduction (Eds I.Ap Dewi, R.F.E., Axford, I., Marai, M.Fayez and H.Omed), CAB International,Wallingford, pp. 385–402.
Nicholson, F.A., Hutchinson, M.L., Smith, K.A., Keevil, C.W., Chamber, B.J. and Moore, A. (2000) A Studyon Farm Manure Applications to Agricultural Land and an Assessment of the Risks of PathogenTransfer into the Food Chain. Ministry of Agriculture, Food and Fisheries, London.
NRA (1992) The Influence of Agriculture on the Quality of Natural Waters in England And Wales. WaterQuality Series No. 6, National Rivers Authority, Bristol.
NRA (1995) Water Pollution Incidents in England and Wales. Water Quality Series No. 25, National RiversAuthority, Bristol.
O’Donnell, C., Dodd, V.A., Kiely, P.O. and Richardson, M. (1995) A study on the effects of silage effluent onconcrete: Part 1, significance of concrete characteristics. Journal of Agricultural Engineering Research60, 83–92.
O’Donnell, C., Williams, A.G. and Biddlestone, A.J. (1997) The effects of temperature on the effluentproduction potential of grass silage. Grass and Forage Science 52, 343–349.
Owen, L. (1998) Use of Organic Manure; Storage of Liquid Fertilizers. The British Survey of FertilizerPractice, 1994, Edinburgh University Data Library, pp. 18.
Pathak, H., Joshi, H.C., Chaudhary, A., Chaudhary, R., Kalra, N. and Dwiwedi, M.K. (1999) Soil amendmentwith distillery effluent for wheat and rice cultivation. Water, Air, and Soil Pollution 113, 133–140.
ORGANIC WASTES 127

Patterson, D.C. and Steen, R.W.J. (1994) The Use of Silage Effluent as an Animal Food. In: Pollution inLivestock Production Systems (Eds I.Ap Dewi, R.F.E.Axford, I.Marai, M.Fayez and H.Omed). CABInternational, Wallingford, pp. 275–307.
RCEP (1996) Sustainable Use of Soil. Royal Commission On Environmental Pollution 19th Report (Cm3165). Her Majesty’s Stationery Office, London.
Renner, R. (2000) Sewage sludge: pros and cons. Environmental Science and Technology October 1,430A-435A.
Reuter, D.J. and Robinson, J.B. (1997) Plant Analysis, An Interpretation Manual. 2nd Edition. CSIROPublishing, Collingwood, Australia.
Richardson, M., Dodd, V.A., Lenehan, J.J., Conaty, S. and O’Kiely, P. (1999) The influence of cement contentand water/cement ratio on the durability of Portland cement concretes exposed to silage effluent.Journal of Agricultural Engineering Research 72, 137–143.
Rund, T. (1995) Heavy metals—finding the status quo, Arable Farming (May issue), 30–34.Schechtner, G. (1992) Prospects of success for aeration of slurry in pasture land. Veroffentlichungen
Bundesanstalt fur Alpenlandische Landwirstschaft Gumpenstein 16, 1–82.Schmidt, J.P. (1997) Understanding phytotoxicity thresholds for trace elements in land-applied sewage
sludge. Journal of Environmental Quality 26, 4–10.Schofield, K., Seager, J. and Merriman, R.P. (1993) The impact of intensive dairy farming activities on river
quality: the Eastern Cleddau catchment study. In: Agriculture and the Environment (Ed. J.G.Jones).Ellis Horwood Series in Environmental Management, Science and Technology, London, pp.75–90.
Scottish Envirotec (1995) Producing a suitable sludge product for agriculture, Scottish Envirotec (Juneissue), 24–36.
SEPA (1998) Strategic Review of Organic Waste Spread on Land. Scottish Environment Protection Agency,Stirling.
Shepherd, M. and Gibbs, P. (2001) Managing Manure On Organic Farms. ADAS and Elm Farm ResearchCentre, Department of Environment, Food and Rural Affairs, London.
Smith, S.R. (1996) Agricultural Recycling of Sewage Sludge and the Environment. CAB International,Wallingford.
Smith, K.A. and Chambers, B.J. (1993) Utilizing the nitrogen content of organic manures on farms—problems and practical solutions. Soil Use and Management 9, 105–112.
Smith, K.A. and Chambers, B.J. (1995) Muck: from waste to resource. Utilisation: the inputs andimplications. Agricultural Engineer 50, 33–38.
Smith, R.V., Burns, L.C., Doyle, R.M., Lennox, S.D., Kelso, B.H.L., Foy, R.H. and Stevens, R.J. (1997) Freeammonia inhibition of nitrification in river sediments leading to nitrite accumulation. Journal ofEnvironmental Quality 26, 1049–1055.
Smith, K.A., Brewer, A.J., Dauven, A. and Wilson, D.W. (2000) A survey of the production and use of animalmanures in England and Wales. I. Pig Manure. Soil Use and Management 16, 124–132.
Smith, K.A., Brewer, A.J., Crabb, J. and Dauven, A. (2001) A survey of the production and use of animalmanures in England and Wales. II. Poultry manure. Soil Use and Management 17, 48–56.
Soil Association (1999). Standards for Organic Food and Farming. Soil Association, Bristol, p. 113.Stehouwer, R.C., Wolf, A.M. and Doty, W.T. (2000) Chemical monitoring of sewage sludge in Pennsylvania:
variability and application uncertainty. Journal of Environmental Quality 29, 1686–1695.Stone, K.C., Hunt, P.G., Humenik, F.J. and Johnson, M.H. (1998) Impact of swine waste application on
ground and stream water quality in an Eastern Coastal Plain watershed. Transactions of the ASAE 41,1665–1670.
Tisdale, S.L, Nelson, W.L., Beaton, J.D. and Halvin, J.L. (1993) Soil Fertility and Fertilizers. 5th Edition.Prentice Hall, New Jersey.
128 CHAPTER 5

Tschäpe, H., Prager, R., Streckel, W., Fruth, A., Tietze, E. and Böhme, G. (1995) Verotoxinogenic Citrobacterfreundii associated with severe gastroenteritis and cases of haemolytic uraemic syndrome in a nurseryschool: green butter as the infection source. Epidemiology and Infection 114, 441–450.
US EPA (1993) Part 503—Standards for the use and disposal of sewage sludge. United States EnvironmentalProtection Agency. Federal Register, 58, 9387–9401.
Van Kessel, J.S., Reeves III, J.B. and Meisinger, J.J. (2000) Nitrogen and carbon mineralization of potentialmanure components. Journal of Environmental Quality 29, 1669–1677.
Wase, D.A.J. and Thayanithy K. (1994) Biogas production. In: Pollution in Livestock Production Systems(Eds I.Ap Dewi, R.F.E.Axford, I.Marai, M.Fayez and H.Omed). CAB International, Wallingford, pp. 333–343.
White, R.E. (1997) Principles and Practice of Soil Science, the Soil as a Natural Resource. 3rd Edition.Blackwell Science Ltd, Oxford.
WRc (1996) Reed Beds and Constructed Wetland for Wastewater Treatment. WRc, Marlow.Zibilske, L.M., Clapham, W.M. and Rourke, R.V. (2000) Multiple applications of paper mill sludge in an
agricultural system: soil effects. Journal of Environmental Quality 29, 1975–1981.
ORGANIC WASTES 129

130
6Gaseous Emissions
6.1INTRODUCTION
Agriculture is both a source and a sink of atmospheric pollution. The effects of agriculturalemissions range from the short-term local nuisance of excessive odour, to their contribution to thelong-term impact of global warming. This chapter considers the four major polluting gases fromagriculture: ammonia, methane, nitrous oxide and carbon dioxide before finally addressing farmodours. Because of their differing behaviour in the atmosphere (Box 6.1), odours and to a certainextent ammonia emissions are seen as local pollution issues, whilst methane, nitrous oxide andcarbon dioxide emissions have implications for the global environment. This chapter will address:
• the production and form of the major gaseous emissions from agriculture;• the potential pollution problems these gases may cause;• practical solutions to minimising their loss.
Agriculture and gaseous emissions
Natural processes generate gaseous emissions from agriculture. Ammonia, methane, nitrous oxideand carbon dioxide are all components of the natural biogeochemical cycles that circulate carbonand nitrogen between the soil, plants and animals, and the atmosphere. Their significance asagricultural pollutants has only arisen because of the expansion (e.g. increased areas of arablecrops), specialisation (e.g. concentration of dairy cows into large herds) and intensification (e.g.increased use of fertiliser nitrogen) of crop and livestock production.
As well as contributing to atmospheric pollution, agriculture is also affected by pollutantsemitted from other sources. Nitrogen oxide (NOx) emissions originating from industrial andtransport combustion processes can have a detrimental effect on crop establishment and growthdue to their acidifying effect on soils (RCEP, 1996). Full consideration of the detrimental impact ofair pollution upon agriculture is beyond the scope of this chapter, but Conway and Pretty (1991)and RCEP (1996) include useful reviews with UK and international examples.
Ironically, one of the main effects of measures to improve air quality and reduce the impact ofacid deposition in the UK has been an increase in the incidence of sulphur deficient arable crops,notably oilseed rape and wheat (Rund, 1994). In the 1970s and early 1980s, sulphur dioxide

deposition was estimated to account for roughly two-thirds of acid deposition in the UK (RCEP,1996). While excessive sulphur deposition can damage crops, it is also essential in moderatequantities for crop growth and development. Levels of sulphur deposition have now been reducedto levels of less than a quarter of those in 1980. This is often well below arable crop requirementsand farmers are advised to apply 10–30 kg sulphur ha−1 year−1 to avoid the risk of yield loss(Rund, 1994). This chapter does not consider smoke pollution (MAFF, 1998) or acuteoccupational exposure to gaseous pollutants, such as ammonia, hydrogen sulphide and nitrogendioxide, in and around farm buildings.
BOX 6.1THE FATE OF GASES IN THE ATMOSPHERE
The earth’s atmosphere has never been free of change, but the current rate of alteration isunprecedented and the effects of this are well documented (e.g. acid rain, stratosphericozone depletion and potential global warming). These phenomena do not stem fromchanges in the major constituents of the atmosphere (nitrogen and oxygen), but mainlyfrom increases in the levels of several minor or trace gases (MAFF, 2000a).
Change in concentrations of selected atmospheric trace gases
(Bunce, 1993).
1850 1985
Carbon dioxide—CO2 280 ppmv 345 ppmvMethane—CH4 0.6–1.0 ppmv 1.7 ppmvNitrous oxide—N2O 280 ppbv 305 ppbvCFC-11+CFC-12 0 0.6 ppbvTropospheric ozone—O3 10–50 ppbv 10–50 ppbv
The fate of these gases in the atmosphere varies greatly depending upon their chemicalcharacteristics (Graedel and Crutzen, 1989). Gases which are relatively unreactive andinsoluble in water (e.g. methane and nitrous oxide) will rapidly spread through thetroposphere (the lower 10–15 km of the atmosphere) and may move into the stratosphere(the next 30–40 km of the atmosphere). Gases which are soluble (e.g. ammonia) are morelikely to dissolve in moisture, either on particulate material or in water droplets, and thusbe directly and relatively rapidly returned to the earth’s surface. They are less likely to diffusevery far through, and above, the troposphere.
A concept used to describe the atmospheric lifetime of gaseous emissions is their residence time.This is calculated as the total amount of gas in the atmosphere divided by its annual rate of removal(Box 6.2).
132 CHAPTER 6

6.2AMMONIA EMISSIONS
Pollution problems
Ammonia (NH3) is a major atmospheric pollutant, but it only has a very short residence time as agas in the troposphere and consequently plays little role in atmospheric chemistry. It mayhowever, neutralise some of the acidity (H2SO4 and HNO3) (Elsom, 1992) and can also absorbinfrared radiation, and its contribution to global warming is considered insignificant (Bouwman,1990).
Most NH3 emissions are rapidly returned to the earth’s surface via wet (e.g. in mist or rain) ordry deposition, often close to their point of origin. It is estimated that two-thirds of the UK’sammonia emissions are re-deposited within the UK (Fowler et al., 1996; INDITE, 1994). Ammoniaemissions have three potential consequences:
• Although NH3 is alkaline, it contributes to soil and freshwater acidification by the release of H+
ions during the microbial oxidation (nitrification) of NH4+ to NO3
−. Since sulphur emissionshave declined, nitrogen compounds (including NH3) now make the greatest contribution to soiland freshwater acidification in the UK and are considered likely to dominate acid deposition inmuch of Europe in future (RCEP, 1996).
• It raises local levels of soil N, enhancing soil fertility and possibly increasing the risk of losses byleaching an NO3
−.• It may have direct toxic effects upon plants causing leaf yellowing and secondary effects such as
nutrient imbalance (Van der Erden et al., 1998).
Ammonia re-deposition is a mixed blessing for farmers as it may present a useful supplementarysource of N (Chapter 2). However, high levels of localised N input and soil acidification canadversely affect crop yield and quality as was demonstrated by Speirs and Frost (1987) in fieldcrops adjacent to an intensive poultry unit.
Increased NH3 inputs in sensitive natural and semi-natural ecosystems are a cause of concernbecause the combination of acidification and N enrichment can significantly change thecharacteristic composition of flora, reducing both species abundance and biodiversity (Pearsonand Stewart, 1993; INDITE, 1994). In freshwater ecosystems, the acidifying effect of NH3
deposition is likely to be more important than nutrient enrichment (i.e. eutrophication) because Nis not generally limiting (INDITE, 1994) (Chapter 3). The sensitivity of natural and semi-naturalecosystems to the impact of atmospheric pollution is variable and is commonly expressed via theconcept of critical loads. Critical load is the maximum atmospheric pollutant load that sensitiveecological systems can tolerate without incurring long-term harmful effects (RCEP, 1996). Theconcept has mainly been applied to acid pollutants to indicate the capacity of soils in sensitiveenvironmental areas to buffer atmospheric acid inputs (CLAG, 1994).
Critical loads for N inputs are less easy to determine, but have been estimated at 5–35 kg N ha−1
year−1 for a range of ecosystems from heathland to commercial forestry; the poorer the soil and thesparser the vegetation, the smaller the critical load. For acidic coniferous forests the critical loadfor N may be 7 kg ha−1 year−1, whereas for calcareous grasslands it may be as high as 35 kg ha−1
GASEOUS EMISSIONS 133
year−1. It is estimated that NH3 deposition may be responsible for 43% of the area over whichcritical N loads have been predicted to be exceeded in the UK (Hill, 2000).
Sources of ammonia pollution
The largest source of ammonia emissions in Europe is volatilisation from agriculture (Fowler etal., 1996). In the UK, this may account for more than 80% of the total ammonia emissions (MAFF,2000a). Other sources include sewage works, industrial combustion, biomass burning andlandfill. There are three main circumstances under which NH3 volatilisation from agricultureoccurs:
• From the decomposition of livestock wastes containing urea (cattle, sheep and pigs) or uric acid(poultry): Hydrolysis of the urea or uric acid by the enyzme urease produces NH3 and CO2.Since NH3 is an alkali its production results in a localised increase in pH which shifts thenatural equilibrium between NH3 and NH4
+ ions in liquid solution towards NH3. Gaseousammonia emission then occurs due to the rapid volatilisation of this NH3 from solution.
• Following applications of ammonium or urea-based fertilisers. The process of emission issimilar to that for livestock wastes, with the greatest potential for fertiliser N losses (10–20%)due to NH3 volatilisation occurring when urea is applied to alkaline soils.
• From the foliage of fertilised crops. Ammonia volatilisation may occur via the stomata of plantsthroughout the life cycle of a growing crop. The likelihood of this occurring is closely tied to Nmetabolism during the different phases of crop development, with peaks in emission occurringwhen plants have excess nitrogen in the form of NH4
+ in the intercellular solution of theirleaves. This is likely both in the periods following fertiliser application, and after anthesis(flowering) when the crop is remobilising N for transfer to the grain by breaking down proteinsin the leaves. Other sources of NH3 emission from fertilised crops include the decomposition offallen foliage, such as from oilseed rape or where grass has been cut and left in the field.
Nevertheless, it is generally accepted that NH3 volatilisation is greatest from livestock systems(Jarvis and Pain, 1990) and that emissions have increased significantly with:
• the expansion of the livestock industry (i.e. number of animals);• the intensification of livestock production, including increased rates of fertiliser N application
to grassland and the use of high protein diets for enhanced productivity (only about 20–40% ofN fed to livestock as protein in forage or feed is actually retained in the animal or animalproducts, the remainder is excreted as non-absorbed N in faeces and urea in urine).
Estimates of NH3 emissions from agriculture remain variable, and are complicated by thedifferent sources of NH3 and the wide range of factors affecting the rate of emission, includingtemperature, seasonality, soil pH and farm management practices (e.g. grazing systems, choice oflivestock housing system, waste management etc.). Fowler et al. (1996) prepared an inventory ofNH3 emissions for the UK which suggested total emissions in the region of 450,000 t NH3 year−1,of which 406,000 t year−1 (over 90%) were from agriculture. These estimates have been furthermodified, as emission inventories become more refined, Pain et al. (1999) suggested 230,000 t
134 CHAPTER 6

year−1 and Misselbrook et al. (2000) 226,000 t year−1, with 80% coming from agriculture. Themajority of losses (40%) come from animal housing where manures often accumulate, followed byspreading manure and slurry to land (30%), livestock grazing (12%), manure and slurry storage(9%) and the use of nitrogenous fertilisers (9%) (MAFF, 1998; Pain et al., 1999).
Practical solutions
Both the European Union and the UN Economic Commission for Europe are concerned withstrategies and protocols to combat the effects of nitrogen and acid deposition upon sensitiveecosystems (RCEP, 1996). At present these strategies are concerned mainly with industrialpollution and do not yet address NH3 emissions, although it is feasible that controls to reduce NH3
loss will be imposed upon farmers in the future.In the meantime, efforts to reduce NH3 pollution remain at the discretion of individual farmers,
although there is clearly an economic incentive to reduce losses in order to retain and profitablyutilise as much N within the farm system as possible. Jarvis (1993) estimated that NH3
volatilisation from grazed pasture, animal housing, manure storage and spreading accounted forlosses of 3.5 t N year−1 on a 76 ha model dairy farm i.e. an average of 46 kg N ha−1 year−1.Assuming that the majority of this NH3 was derived from purchased fertiliser N (at approximately£0.30 kg−1), this was equivalent to a direct financial loss of over £1000 year−1.
Minimising ammonia emissions by good practice
The main source of advice on minimising ammonia emissions for farmers in the UK is the revisedMAFF Code of Good Agricultural Practice for the Protection of Air (MAFF, 1998) which dedicatesa complete chapter to NH3 and reducing NH3 loss.
The most important strategy for minimising NH3 emission is to limit the opportunity forvolatilisation to occur by reducing the contact of manure and slurry with the air during livestockhousing, waste storage and spreading of organic wastes. Methods for controlling odour are alsouseful for reducing NH3 losses (see below). For example, alternative slurry application methods suchas band spreading and injection can reduce emissions by 40–50% under UK conditions (MAFF,1997a, 2001a,b). Further specific points of good practice are:
• Where practicable match protein levels in feed more closely with livestock requirements (e.g.according to growth stage and/or the target level of production) in order to reduce residual N inwastes. In feeding trials, pigs fed a modified low crude protein diet excreted 44% less total N inslurry, while NH3 concentrations in their pig houses were reduced by around 50% (MAFF,1997b). Growth rates and finished weights were the same as pigs fed a normal commercial diet.Similar techniques have been developed for poultry, but increasing the efficiency of dietary Nuse by cattle and sheep is more difficult.
• As with odours, the key to low ammonia emissions from livestock housing is cleanliness andkeeping the floors and walls clear of urine and faeces. This is greatly aided by maintenance andupkeep of flushing systems and scrapers.
• Slurry storage may only represent about 2% of the total annual NH3 loss, but recent researchsuggests that a cheap and relatively straight-forward way of mitigating losses is to float a cover
GASEOUS EMISSIONS 135

material over the top. Plastic films have been found to be particularly effective on slurry tanks,reducing emissions by as much as 80%. For lagoons, stabilised welded plastic film is able toreduce NH3 loss by 95%, although venting to remove biogas and prevent the build-up pressureis needed (MAFF, 2001c).
6.3METHANE EMISSIONS
Pollution problems
Methane (CH4) is a natural gaseous component of the atmosphere and along with carbon dioxide,nitrous oxide and water vapour is particularly important in regard to the greenhouse effect. Unlikeammonia, the residence time of CH4 may be considerable, and may absorb 21 times more infraredradiation than CO2 (Box 6.2). The major polluting action of CH4 associated with its role inincreased rates of global warming. Importantly CH4 is odourless, although often wrongly blamedas the cause of malodour. However, as pointed out in the revised air code (MAFF, 1998) in regardto the potential build up of CH4 in confined spaces such as tanks or storage facilities, it is highlyflammable.
Sources
Methane emission from agriculture accounts for almost 37% of the UK total, and is producedprimarily by the natural digestive processes of ruminants (MAFF, 2000b). Cattle account for 75%of the CH4 produced by livestock (1 mature dairy cow may produce 100 kg of CH4 in a year),followed in order of decreasing importance by sheep, pigs and poultry. Poultry do not directlyproduce methane, although under certain conditions their manure may do so (MAFF, 1998).Indeed, the action of bacteria on most slurries and manures may produce CH4, although incomparison to the rate of production by livestock it is much slower and promoted by conditions ofanaerobic soil respiration (MAFF, 1998).
Of considerable global importance is the production of CH4 from flooded rice paddies. Indeed,globally, rice production may be responsible for 30% of all CH4 emissions. The primary cause isdue the anaerobic fermentation of organic matter in flooded soils, two of the end products beingCO2 and CH4 (Neue, 1997; White, 1997). This same process is responsible for the natural emissionof methane from native wetlands, bogs and marshes (Kasimir-Klemedtsson et al., 1997). With apredicted increase in rice production of 65% in the next 25 years, it is clear this source is likely tobecome much more important and the search for mitigating management strategies more earnest.However, some workers suggest technologies already exist which if implemented, could seedecreases in CH4 emissions from flooded paddy soils of 40% (Minami et al., 1998; Bodeller et al.,2000).
A major non-agricultural source of biogenic CH4 is refuse landfills, although the output isenormously variable, spanning 7 orders of magnitude (<0.0004–>4000 gm−2). Nevertheless, thecontribution of CH4 from this source is still currently greater than from agriculture. However, thisis likely to be reduced as stricter legislative controls on landfills begin to take affect.
136 CHAPTER 6

Practical solutions
There is limited advice given by MAFF for the reduction of CH4 emissions from livestock.Reductions in the numbers and intensity of operations would have a significant effect onemissions as would increasing the productivity per animal. Currently, the research focus is upon:
• dietary modifications and attempts to change the protozoan content of the rumen, which playsa major role in the generation of CH4;
• improved health and welfare of livestock;• maximising genetic potential.
However, it is thought that in the short-term these will make little difference to CH4 emissionsfrom agriculture (MAFF, 1998, 2000a).
In terms of CH4 emissions from manures, reductions have been observed during composting ofdeep litter from pig production based on the density of the heap (Sommer and Moller, 2000).Furthermore, alternative slurry and manure handling and storage facilities along with thepromotion of the use of the generated CH4 (as biogas) as an alternative energy source may also beemission mitigating possibilities (MAFF, 2000a).
BOX 6.2GREENHOUSE GASES AND GLOBAL WARMING
The greenhouse effect is an essential and natural feature of the earth’s atmosphere. If therewere no greenhouse effect the surface of the earth would be cooler by almost 30 °C. Theabsorption of outgoing long-wave radiation reflected from the earth’s surface by certainatmospheric gases reduces the amount of heat energy that would otherwise be lost to space,so behaving akin to a thermal blanket (Bunce, 1993; MAFF, 2000a). An increase in theconcentration of these atmospheric gases responsible for this greenhouse effect mayfurther increase the amount of heat energy trapped. Therefore, the anthropogenicinfluence upon the greenhouse effect is thought to be primarily associated with increasedglobal warming due to elevated emissions of greenhouse gases. The past decade in the UKhas been the warmest in over 300 years (MAFF, 2000a). This evidence, coupled withmeasures of increases in greenhouse gases (Box 6.1) and the results of predictive climatemodels have been cited by the Intergovernmental Panel on Climate Change as evidence ofhuman induced changes to our climate (Young, 2000).
Agriculture is responsible for around 8% of the greenhouse gas emissions in the UK (MAFF,2000a) although globally it is thought that 20% of the CO2, 35% of the CH4 and 65% of the N2O comefrom soil processes or as a result of land-use change (Smith, 1997).
The establishment of a national inventory of greenhouse gases is the first step in being able toestablish and target reductions in gas emissions from agriculture and other sources and is requiredby the United Nations Framework Convention on Climate Change (DETR, 1998; MAFF, 2001 c).Even if a reduction in emissions occurs immediately, as can be seen from the table, the likelybeneficial effects are unlikely to be seen in the short to medium term.
GASEOUS EMISSIONS 137

Estimates from global climate models suggest that by 2050 the UK will be 1–2 °C warmer than the1961–1990 average, with winters warmer and hot spells during summers increasing, althoughchanges in rainfall are difficult to predict (MAFF, 2000a).
Potential impacts of atmospheric gases upon global warming (MAFF, 2000a)
Residence time(years)
Relative impact Contribution (%)
CO2 2–230 1 60CH4 10 25 15N2O 150 200 5
The likely impacts upon agriculture include:
• change in the location of agricultural activities (the range of current crops may movefurther north);
• new crop varieties previously unsuitable for climatic conditions in the UK will need tobe used;
• water availability limitations with a large impact on high value horticultural crops;• yields of some crops and grasses may increase, and so may weeds, with implications
for herbicide resistance;• changes in the types of pests and diseases currently affecting crops and livestock, with
implications for the transmission of vector borne diseases.
The adaptability of UK agriculture stands it in good stead to assimilate and accommodatepotential changes forecast by the current predicted climatic models (MAFF, 2000a).However, some commentators suggest that the evidence currently presented to supportincreased global warming due to anthropogenic induced climate change is flawed, or atleast not as irrevocable as some scientists are suggesting (Young, 2000). In particular,there is the concern that not all evidence supports global warming. While surfacetemperatures have risen in the northern-hemisphere they have fallen in the southernhemisphere. Furthermore, it is difficult to differentiate between natural climatic variationand human induced change. Temperatures have risen and fallen dramatically in the past byat least 2 °C, allowing; the Vikings to settle Greenland between the ninth and twelfthcenturies, and producing the Little Ice Age in the late seventeenth century. It is also wellknown that many of the climatic models currently being relied upon to produce scenarios ofchange are rarely able to adequately consider dust emissions or natural changes in CO2
levels (Young, 2000). Nevertheless, increased global warming would have such anextensive effect upon so many facets of our lives that a precautionary approach in regard toemission controls of greenhouse gases seems the wisest option.
138 CHAPTER 6

6.4NITROUS OXIDE EMISSIONS
Pollution problems
The importance of nitrous oxide (N2O) as a potential gaseous pollutant was identified inChapter 2. The impacts of N2O are two-fold behaving as a greenhouse gas (Box 6.2) andstratospheric ozone depleter, further degrading climatic conditions with potential influences uponagriculture (Colbeck and Mackenzie, 1996). The global warming potential of N2O, is 200–300times greater relative to CO2 (Box 6.2) (Schlesinger, 1997).
Sources of pollution
The release of N2O resulting from agricultural activities including the stimulation of soil bacteria,manures and slurries accounts for over 50% of all emissions in the UK (MAFF, 2000b). Soil isthought to be responsible for one quarter of all global N2O emissions (Mosier et al., 1998). Othersignificant sources of N2O—N include emissions from animals as well as housing and wastestorage (17%), from leached N (21%) and from NH3 (3%) (MAFF, 2001d). Indirect emissions ofN2O can come from atmospheric N deposition, leached nitrate and sewage treatment plants,although their magnitude is yet to be satisfactorily gauged. The primary mechanism thought to beresponsible for the loss of N2O and N2 from soil is denitrification under anaerobic conditions inwhich the nitrate and nitrite are reduced (Rowell, 1994):
A small amount of NH4-N is converted to N2O and NO during nitrification. These mechanisms arenatural and it is their enhancement through anthropogenic actions that is of environmentalimportance. The production of N2 is thought to be of little concern environmentally, althoughclearly economically undesirable. As much as 30%, although more commonly between 0.5 and 2.0% of applied fertiliser N is lost as N2O (Tisdale et al., 1993; Smith et al., 1997; Baggs et al.,2000). Not surprisingly the more N that is cycled through the agroecosystem, through theincreased use of inorganic N fertiliser and intensification of arable and livestock productionsystems, the greater the enhancement and the larger the quantity converted to gaseous nitrogenforms, including N2O (Smith et al., 1997).
The exact proportion of N2O or N2 produced during denitrification is difficult to ascertain, but ithas been suggested that N2O emissions may be more important under less anaerobic conditions.While only a few facultative aerobic bacteria (species belonging to the genera Pseudomonas,Bacillus and Paracoccus) and several autotrophs (Thiobacillus denitrificans, T. thioparus) areresponsible for denitrification there tends to be large populations of these organisms in arablesoils (Tisdale et al., 1993). There are a range of interrelated factors that may promote the gaseousloss of N from soils and depletion of oxygen through the creation of anaerobism including:
• soil moisture content;• the amount and nature of organic matter present (readily decomposable C substrates can
stimulate significant denitrification);
GASEOUS EMISSIONS 139

• aeration (which can be influenced greatly by farm traffic and livestock);• soil pH;• soil temperature (denitrification tends to be limited at a pH<6 and temperature <0ºC);• the form and timing of fertiliser N application (Tisdale et al., 1993).
In a study on the effects of irrigation, crop management and N fertilisation on N2O loss it wasobserved that the greatest emissions occurred in treatments which received irrigation water,fertiliser N and remained fallow (Simojoki and Jaakkola, 2000). When water filled 60–90% of soilpore space N2O emissions doubled compared with unirrigated controls. If predicted climatechanges do occur (Box 6.3) and fertiliser use and irrigation also increase as predicted, then it islikely that emissions of N2O are set to rise dramatically (Smith et al., 1997). It is also suggestedthat there is a strong correlation between N2O emission and soil mineral N content which may begreatly influenced by the quantity of applied N fertiliser (Smith et al., 1997; MAFF, 2000a).
There appears to be less conclusive evidence of a relationship between the form of N fertiliseraddition and N2O emissions. Although Clayton et al. (1997) noted that there were significantdifferences in gaseous losses from grassland cut for silage having been fertilised with 3 applicationsof different N sources at a rate of 120 kg N ha−1 (Figure 6.1). Nevertheless, the effect of inorganic Nfertiliser type is thought to be small in comparison with other environmental effects (Barton et al.,2000).
The influence of the incorporation of plant residues and manures on the emission of N2O maybe considerable. With the magnitude depending largely upon the residue composition and theamount incorporated, as well as factors listed above including soil type and land management. InNew Zealand, over 50% of the anthropogenic N2O emissions are from livestock excrement (DeKlein et al., 2001). Generally, emissions are greatest when residues having low C:N ratios areincorporated into soil (Chapters 2 and 5), and in some circumstances may also be elevatedfollowing deep ploughing, possibly due to increased microbial access to labile C in the form ofdegrading root material. However, Baggs et al. (2000) noted that a return to background N2Oemissions occurred after approximately two weeks, possibly due to the decrease in easily degradableC substrate. Scott et al. (2000) also observed peaks in N2O production following the incorporationof sewage sludge into grassland soils and noted further peaks in emissions after rainfall events (asis often observed after irrigation, De Klein et al., 1999). This work suggested that the losses of N2Ofrom grasslands amended with sewage sludge might be as significant as those receiving inorganicN fertiliser.
Intensively managed grassland systems may be considerable sources of N2O emission in manyparts of the UK and Europe, primarily due to the large N input and the possibility of wet soilconditions (Velthof and Oenema, 1995). This is exacerbated by the concentration of herbage N inurine and manure and by the compaction of the soil due to trampling. The amount of N2Oreleased expressed as a percentage of N excreted by livestock is between 0.2 and 9.9% (Chapter 2)(Oenema et al., 1997). This considerable variability is a reflection of the complexity of makingmeasures of N2O and stresses the multifaceted nature of this problem.
140 CHAPTER 6

Figure 6.1 The cumulative N2O emissions from grassland cut for silage fertilised with differentsources of N (Clayton et al., 1997).
Practical solutions
The complex relationship that exist between the environment and land management factorsinfluencing N2O release would suggest that practical, mitigating solutions may be few and farbetween. However, strategies outlined in Chapter 2 to minimise N loss and also in Chapter 3 toreduce P loss are likely to be beneficial in reducing gaseous emissions (MAFF, 1998, 2000a).Strategies include (Cole et al., 1996; MAFF, 2000a):
• matching N supply with crop demand through use of N testing of plants and split applications;• reducing farm N inputs and increasing N efficiency, utilising crop residues and accounting for N
inputs from manures;• utilising better fertiliser techniques—placement, nitrification inhibitors, foliar sprays and slow
release sources;• taking account of soil water content and drainage. Water-filled pore space should be <60% and
their should be reduced traffic and tillage operations as the creation of zones of reduce air andwater permeability may produce localised zones of anaerobism (Smith et al., 1997).
Management options to lower the loss of N2O from grazed grasslands include reducing stockingdensity, reducing N content of urine and decreasing the number of manure and dung patches.Suggested methodologies to achieve this may involve increasing the productivity per cow, the useof low N feeds, less inorganic N applications and delayed and restricted grazing (Oenema et al.,1997).
In conclusion, the following of good agricultural practice in regard to fertiliser management andthe use modern techniques of application coupled with optimisation of irrigation and tillage arelikely to be effective in reducing N2O release. However, these reductions are thought to be
GASEOUS EMISSIONS 141

insignificant in comparison to the likely increases brought about by the predicted increase inworldwide N fertiliser use (Smith et al., 1997).
6.5CARBON DIOXIDE EMISSIONS
Pollution problems
The global C cycle and the relevance of carbon dioxide (CO2) and CH4 to this cycle are shown inFigure 6.2. The carbon cycle is highly dynamic and it is often stated that rather than one cycle, anumber of separate cycles operate on different time scales (Kasting, 2001).
Figure 6.2 The carbon cycle (White, 1997).
Carbon dioxide is the most important of the greenhouse gases, but due to its solubility in waterconsiderable exchange occurs with the worlds oceans which limits its atmospheric lifetime toapproximately 2 years (Schlesinger, 1997). The change in atmospheric concentrations of CO2 areattributed to an increase in source strengths, such as the combustion of fossil fuels, and decreasedsink strengths resulting from deforestation and a reduced global rate of photosynthesis (Bunce,1993). Soils play a particularly important role as a sink for CO2 acting as a transient store orrepository for carbon. Agricultural practices that reduce soil carbon levels, by degrading organicmatter therefore reduce the capacity of this sink for C (Table 6.1).
142 CHAPTER 6
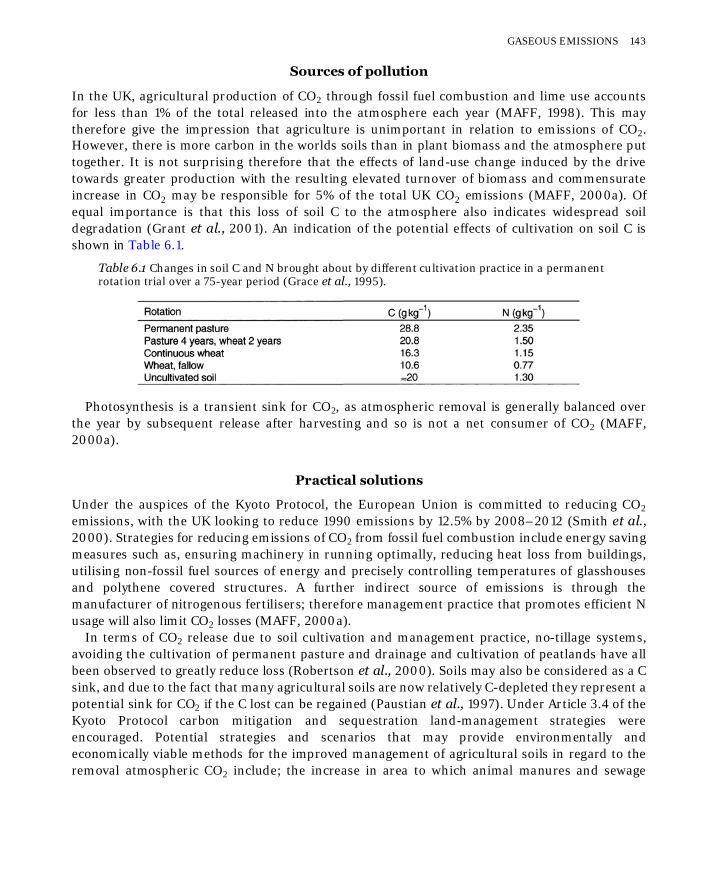
Sources of pollution
In the UK, agricultural production of CO2 through fossil fuel combustion and lime use accountsfor less than 1% of the total released into the atmosphere each year (MAFF, 1998). This maytherefore give the impression that agriculture is unimportant in relation to emissions of CO2.However, there is more carbon in the worlds soils than in plant biomass and the atmosphere puttogether. It is not surprising therefore that the effects of land-use change induced by the drivetowards greater production with the resulting elevated turnover of biomass and commensurateincrease in CO2 may be responsible for 5% of the total UK CO2 emissions (MAFF, 2000a). Ofequal importance is that this loss of soil C to the atmosphere also indicates widespread soildegradation (Grant et al., 2001). An indication of the potential effects of cultivation on soil C isshown in Table 6.1.
Table 6.1 Changes in soil C and N brought about by different cultivation practice in a permanentrotation trial over a 75-year period (Grace et al., 1995).
Photosynthesis is a transient sink for CO2, as atmospheric removal is generally balanced overthe year by subsequent release after harvesting and so is not a net consumer of CO2 (MAFF,2000a).
Practical solutions
Under the auspices of the Kyoto Protocol, the European Union is committed to reducing CO2
emissions, with the UK looking to reduce 1990 emissions by 12.5% by 2008–2012 (Smith et al.,2000). Strategies for reducing emissions of CO2 from fossil fuel combustion include energy savingmeasures such as, ensuring machinery in running optimally, reducing heat loss from buildings,utilising non-fossil fuel sources of energy and precisely controlling temperatures of glasshousesand polythene covered structures. A further indirect source of emissions is through themanufacturer of nitrogenous fertilisers; therefore management practice that promotes efficient Nusage will also limit CO2 losses (MAFF, 2000a).
In terms of CO2 release due to soil cultivation and management practice, no-tillage systems,avoiding the cultivation of permanent pasture and drainage and cultivation of peatlands have allbeen observed to greatly reduce loss (Robertson et al., 2000). Soils may also be considered as a Csink, and due to the fact that many agricultural soils are now relatively C-depleted they represent apotential sink for CO2 if the C lost can be regained (Paustian et al., 1997). Under Article 3.4 of theKyoto Protocol carbon mitigation and sequestration land-management strategies wereencouraged. Potential strategies and scenarios that may provide environmentally andeconomically viable methods for the improved management of agricultural soils in regard to theremoval atmospheric CO2 include; the increase in area to which animal manures and sewage
GASEOUS EMISSIONS 143

sludge are applied, straw incorporation, no tillage systems (due less consumption of fossil fuels),agricultural extensification, natural woodland regeneration, bioenergy crop production (such aswillows). The combination of these management options offer greater potential for the reductionof agricultural CO2 emissions and also greater sequestration of CO2 from other sources (Robertsonet al., 2000; Smith et al., 2000: Grant et al., 2001). Even so, the C sequestration strategies would,if carried out extensively across the UK, still only sequester between 6 and 7% of the total CO2
emissions from all sources (Smith et al., 2000).
6.6FARM ODOURS
Sources of pollution
Odours are a very complex comprising a number of important properties. While some odours maybe considered as pleasant, they are generally regarded as an unhealthy annoyance that should beavoided. As a pollutant, odours cause harm by affecting the well-being of people by elicitingunpleasant sensations and possibly triggering harmful reactions, such as nausea, vomiting andheadaches (Elsom, 1992). Some salient properties of odours include:
• intensity—the strength of the odour sensation caused by the concentration of odour substancespresent;
• odour character—properties which enable substances to be detected;• hedonic tone—scale of pleasantness or unpleasantness;• frequency/duration of odour releases.
In the UK, local authority Environmental Health Departments are responsible for enforcinglegislation on odour nuisance (MAFF, 1998). Under Part III, Section 79, of the EnvironmentalProtection Act 1990, local authorities are required both to detect statutory nuisances and toconduct investigations. These statutory nuisances include any smell arising on trade or businessespremises, or any animal kept in such a place or manner as to be prejudicial to health or anuisance.
Agricultural odours are principally associated with livestock farming and are mainly due to theanaerobic breakdown of plant fibre and protein in faeces and urine. They are a form of pointsource pollution (i.e. with an easily identifiable origin) and are caused complex mixtures of a largenumber of chemical compounds (e.g. over 77 in pig slurry), including volatile fatty acids, organicacids, phenols, amines and organosulphides. The most unpleasant odours tend to be from thosesubstances containing sulphur and nitrogen (Elsom, 1992). The most common sources of farmodour are:
• farm buildings housing animals, such as intensive poultry units;• slurry or manure stores;• spreading of slurry or manure;• silage clamps and other types of animal feed.
144 CHAPTER 6

A number of factors influence the risk of odour problems occurring from livestock enterprises.These include:
• the distance from neighbouring properties and the local topography;• the number and type of livestock;• the prevailing wind direction in relation to neighbouring properties;• the management of the livestock and housing system used;• the type and size of slurry store and the way in which it is managed;• the type of feed used.
Between 1990 and 1996 there were 9000 complaints reported by local authorities and recorded byenvironmental health officers, involving over 3500 farm premises (MAFF, 1998). Of thesecomplaints the majority were in regard to the spreading of manure and slurry. Pigs were the mostcommon livestock enterprise complained about (50%), then poultry units (30%) and cattle farms(20%), respectively (MAFF, 1998).
Generally, the highest odour emissions occur while the spreading of waste is actually takingplace, although it is possible for emissions over the next 8–12 hours to be enough to cause anuisance (MAFF, 1998). The main reason for high odour levels during spreading is the design ofthe conventional slurry spreader. This forces a jet of slurry under pressure against a ‘splash-plate’causing it to shatter into small droplets which are distributed behind the tanker as a ‘spray’(Figure 6.3). Depending upon the trajectory of the ‘spray’ and the size of the droplets, this greatlyincreases the release of volatile compounds into the air (especially if the spreader produces a high‘spray’ trajectory and small droplets) causing localised odour concentrations up to 15 times greaterduring spreading than immediately afterwards. Other factors affecting the amount of odouremitted during or after spreading include:
• the rate of application;• the type of livestock waste, with pig slurry often the most malodorous;• whether the waste contains milk or silage effluent since these tend to increase the amount of
odour released;• the method and length of storage.
The weather also plays a key role in determining if odour will be a nuisance. The least suitableatmospheric conditions for spreading are high humidities and very light winds since this preventsodours from dispersing. The proximity of spreading operations to houses and the direction of thewind will also affect the likelihood of causing nuisance.
Practical solutions
Comprehensive practical guidance on avoiding air pollution from odours is provided to UKfarmers in the MAFF publication, Code of Good Agricultural Practice for the Protection of Air(1998) and much of the material below is derived from this. It is not a statutory code and followingit will not provide a defence against a legal charge of causing air pollution. Furthermore,
GASEOUS EMISSIONS 145

awareness of farmers of this code is very limited, with just over 20% aware (and <10% owning anactual copy), despite its re-launch in 1998 (MAFF, 2000b).
Whilst it is not possible to avoid all odours from agriculture, the risk of nuisance can beminimised. The first line of defence is to ensure, as far as possible, that all potential sources are areasonable distance from potential complainants to allow for maximum dispersal and dilution ofthe odour. This has implications especially for the location of new livestock units and the selectionof fields for spreading waste. However, reliance upon the dispersal and dilution of odours to avoidcomplaints is not always sufficient and attempts should be made to address the causes of emissionat source by applying good design and management practices. These include:
• housing and feeding of cattle, pigs and poultry;• storage and handling of livestock wastes, and;• spreading of slurry and manure.
In extreme cases, such as the particularly close proximity of existing livestock units to housing, thefarmer may need to go beyond good practice and use special equipment and techniques for morerigorous odour control.
Livestock dietary modification and manipulation to reduce the production of odorouscompounds in manure have focussed firstly on increased nutrient utilisation (Chapter 3), secondly,efforts to enhance microbial metabolism in the lower digestive tract to reduce excretion of odourcausing compounds and finally on changing the physical and chemical characteristics of urine andfaeces. Through the use of synthetic amino acids with reduced protein levels significant reductionsin odour production (and N) have been observed in pig manures (Sutton et al., 1999).
Figure 6.3 Spreading slurry using a vacuum tanker fitted with conventional ‘splash-plate’ spreadingmechanism.
146 CHAPTER 6

Importantly, it is also thought that such dietary modifications are unlikely to present any majoreconomic burden to the farmer and therefore could be readily adopted.
The location and design of new livestock units
Complaints about farm odour are most frequent when livestock units are located close to housingor other centres of public activity. Local planning authorities therefore have a role to play inavoiding odour nuisance from new livestock units. In the UK, this involves three regulatorymeasures:
• Under the Town and Country Planning (General Permitted Development) Order 1995, planningpermission is required for new facilities, such as livestock buildings and slurry stores, which aresituated within 400 m of a residential development. This rule was specifically introduced toreduce the risk of odour nuisance from new or expanding livestock units.
• For new livestock facilities which do not require planning permission, a prior notificationsystem is in place which means that the local planning authority must be informed of thedevelopment. The planning authority will then decide within 28 days whether it wishes toapprove details of any aspect of the proposed development.
• The Town and Country Planning (Assessment of Environmental Effects) Regulations 1988require an environmental assessment to be carried out for certain types of development projectlikely to have significant effects on the environment. In the case of agriculture, this is likely toinclude new pig units with more than 400 sows or 5000 fattening pigs, and new poultry units withmore than 100,000 broilers or 50,000 layers (MAFF, 1998).
The relatively recent EU Integrated Pollution Prevention and Control (IPPC) Directive affects theagricultural industry by introducing controls over emissions to the atmosphere from agriculturalactivities (Robinson, 1999). For example, IPPC emphasises best available technology andminimising environmental emissions, applying to livestock production units with more than 40,000 birds, 750 sows or 2000 weaners. New livestock housing (e.g. broiler houses) should also bedesigned with odour control in mind. This includes:
• ensuring adequate ventilation to avoid the development of humid conditions which give rise tounpleasant odours, high levels of ammonia and poor animal health;
• positioning ventilation outlets as high as possible for good odour dispersal and to avoid thestrong odours that occur at floor level;
• providing adequate space allowances for livestock, well-designed floors (e.g. self-cleaning slats)and effective waste collection systems to ensure that animals do not get excessively dirty;
• piping or channelling wastes and waste water to storage facilities;• ensuring drinkers are designed and located to minimise spillage and thus help keep bedding as
dry as possible.
GASEOUS EMISSIONS 147

Minimising odour nuisance by good management practice
The general points of good practice for the day-to-day management of livestock housing and wastedisposal to minimise the risk of causing odour nuisance are summarised in Table 6.2. For fulldetails refer to the Code of Good Agricultural Practice for the Protection of Air (MAFF, 1998).
Table 6.2 General points of good practice for reducing odour emissions and the risk of nuisancefrom livestock production systems (summarised from MAFF, 1998).
Technologies for reducing odour nuisance
In sensitive situations there are various technological options for odour control that go beyond thereductions achievable with good management practice. For example (Culpin, 1992; MAFF, 1998):
• Odours from livestock buildings can be treated by passing the air expelled from ventilatorsthrough an air cleaning device or biofilter system. This is a very expensive option restricted toextreme cases of nuisance.
• Odorous emissions during storage and spreading of slurry can be reduced by up to 90% bymechanical separation followed by aerobic treatment to encourage bacterial activity. There are
148 CHAPTER 6
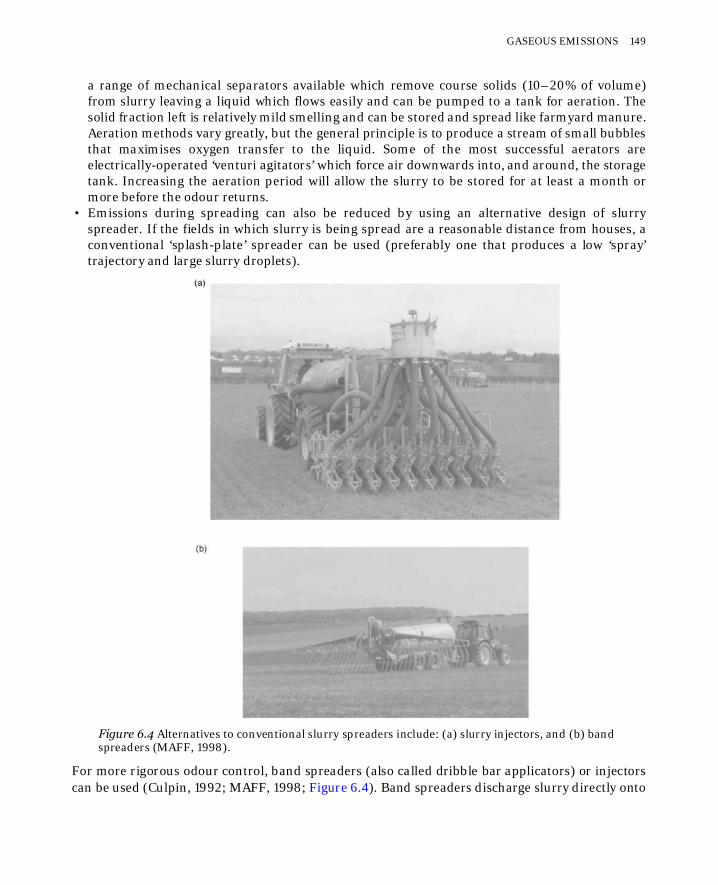
solid fraction left is relatively mild smelling and can be stored and spread like farmyard manure.Aeration methods vary greatly, but the general principle is to produce a stream of small bubblesthat maximises oxygen transfer to the liquid. Some of the most successful aerators areelectrically-operated ‘venturi agitators’ which force air downwards into, and around, the storagetank. Increasing the aeration period will allow the slurry to be stored for at least a month ormore before the odour returns.
• Emissions during spreading can also be reduced by using an alternative design of slurryspreader. If the fields in which slurry is being spread are a reasonable distance from houses, aconventional ‘splash-plate’ spreader can be used (preferably one that produces a low ‘spray’trajectory and large slurry droplets).
Figure 6.4 Alternatives to conventional slurry spreaders include: (a) slurry injectors, and (b) bandspreaders (MAFF, 1998).
For more rigorous odour control, band spreaders (also called dribble bar applicators) or injectorscan be used (Culpin, 1992; MAFF, 1998; Figure 6.4). Band spreaders discharge slurry directly onto
GASEOUS EMISSIONS 149
a range of mechanical separators available which remove course solids (10–20% of volume)from slurry leaving a liquid which flows easily and can be pumped to a tank for aeration. The

surface and then closes the grooves with press wheels or discs. Deep injection uses winged injectortines to apply slurry at a depth of 120–300 mm and ensure thorough mixing with the soil.Although more expensive to purchase and to run (e.g. deep injection requires a significantly morepowerful tractor), these alternative spreader designs can reduce odour emissions significantly.According to MAFF (1998) when compared to ‘splash-plate’ spreaders, band spreading can reduceodour by 55–60% and injection by about 85%.
REFERENCES
Baggs, E.M., Rees, R.M., Smith, K.A. and Vinten, A.J.A. (2000) Nitrous oxide emission from soils afterincorporating crop residues. Soil Use and Management 16, 82–87.
Barton, L., Roberts, A.C., Vojvodi -Vukovi , M. and Rh. Lloyd-Jones, A. (2000) Nitrous oxide emissions fromsoils irrigated with dairy farm effluent. In: Soil 2000: New Horizons For A New Century. AustralianAndNew Zealand Second Joint Soils Conference Volume 2: Oral Papers (Eds J.A.Adams and A.K.Metherell). 3–8 December 2000, Lincoln University, New Zealand Society of Soil Science, pp. 15–16.
Bodeller, P.L.E., Roslev, P., Henckel, T. and Frenzel, P. (2000) Stimulation by ammonium-based fertilisers ofmethane oxidation in soil around rice roots. Nature 403, 421–424.
Bouwman, A.F. (1990) Exchange of Greenhouse Gases between Terrestrial Ecosystems and the Atmosphere.In: Soils And The Greenhouse Effect (Ed. A.F.Bouwman). John Wiley & Sons, Chichester, pp. 61–127.
Bunce, N.J. (1993) Introduction to Environmental Chemistry. Wuerz Publishing Ltd, Winnipeg, Canada.CLAG (1994) Critical Loads for Acidity in the United Kingdom. Critical Loads Advisory Group Summary
Report. Institute of Terrestrial Ecology, Edinburgh.Clayton, H., McTaggart, I.P., Parker, J., Swan, L. and Smith, K.A. (1997) Nitrous oxide emissions from
fertilized grassland: a two-year study of the effects of N fertilizer form and environmental conditions.Biology and Fertility of Soils 25, 252–260.
Colbeck, I. and Mackenzie, A.R. (1996) Chemistry and pollution of the stratosphere. In: Pollution, Causes,Effects and Control (Ed. R.M.Harrison). 3rd Edition. The Royal Society of Chemistry, Cambridge, pp.194–220.
Cole, V., Cerri, C., Minami, K., Mosier, A. and Rosenberg, N. (1996) Agricultural options for mitigation ofgreenhouse gas emissions. In: Climate Change In 1995. Impacts, Adaptations and Mitigation of ClimateChange: Scientific-Technical Analyses (Eds R.T.Watson, M.C.Zinyowera, R.H.Moss and D.J.Dokken).Cambridge Univ. Press, Cambridge, pp. 745–771.
Conway, G.R. and Pretty, J.N. (1991) Unwelcome Harvest: Agriculture and Pollution. Earthscan, London.Culpin, C. (1992) Farm Machinery. 12th Edition. Blackwell Scientific Publications, Oxford.De Klein, C.A.M., McTaggart, I.P., Smith, K.A., Stevens, R.J., Harrison, R. and Laughlin, R.J. (1999)
Measurement of nitrous oxide emissions from grassland soil using photo-acoustic infra-redspectroscopy, long-path infra-red spectroscopy, gas chromatography, and continuous flow isotoperatiomass spectrometry. Communications in Soil Science and Plant Analysis 30, 1463–1477.
De Klein, C.A.M., Sherlock, R.R., Cameron, K.C. and Van der Weerden, T.J. (2001) Nitrous oxide emissionsfrom agricultural soils in New Zealand—a review of current knowledge and directions for future research.Journal of The Royal Society of New Zealand (in press).
DETR (1998) UK Climate Change Programme—Department Of The Environment Transport and theRegions Consultation Paper. Department of the Environment Transport and the Regions, HMSO,London.
Elsom, D. (1992) Atmospheric Pollution: A Global Problem. 2nd Edition. Blackwell, Oxford.Fowler, D., Sutton, M.A., Skiba, U. and Hargreaves, K.J. (1996) Agricultural Nitrogen and Emissions to the
Atmosphere. In: Issues In Environmental Science and Technology 5: Agricultural Chemicals and the
150 CHAPTER 6
the soil surface through a series of trailing pipes, while injectors apply the slurry below the soilsurface. Shallow injection discharges slurry into a series of grooves cut 50–80 mm deep in the soil

Environment (Eds R.E.Hester and R.M.Harrison). The Royal Society of Chemistry, Letchworth, pp. 57–84.
Grace, P.R., Oades, J.M., Keith, H. and Hancock, T.W. (1995) Trends in wheat yields and soil organic carbonin the permanent rotation trial at the Waite Agricultural Research Institute, South Australia. AustralianJournal of Experimental Agriculture 35, 857–864.
Graedel, T.E. and Crutzen, P.J. (1989) The changing atmosphere. Scientific American (September), 28–36.Grant, R.F., Juma, N.G., Robertson, J.A., Izaurralde, R.C. and McGill, W.B. (2001) Long-term changes in soil
carbon under different fertilizer, manure and rotation: testing the mathematical model ecosys with datafrom the Breton plots. Soil Science Society of America Journal 56, 205–214.
Hill, R.A. (2000) Emission, Dispersion and Local Deposition of Ammonia Volatilised From Farm Buildingsand Following the Application of Cattle Slurry to Grassland. Unpublished Thesis, University ofPlymouth.
INDITE (1994) Impacts of Nitrogen Deposition In Terrestrial Ecosystems. Department of the Environment,London.
Jarvis, S.C. (1993) Nitrogen cycling and losses from dairy farms. Soil Use and Management 9, 99–105.Jarvis, S.C. and Pain, B.F. (1990) Ammonia volatilisation from agricultural land. Proceedings of the Fertilizer
Society 298, 1–35.Kasimir-Klemedtsson, Å., Klemedtsson, L., Berglund, K., Maritikainen, P., Silvola, J. and Oenema, O. (1997)
Greenhouse gas emissions from farmed organic soils: a review. Soil Use and Management 13, 245–250.Kasting, J.F. (2001) The carbon cycle, climate, and the long-term effects of fossil fuel burning. In:
Consequences. The Nature and Implications of Environmental Change. URL: http://www.gcrio.org/CONSEQUENCES/vo14no1/carbcycle.html
MAFF (1997a) Careful slurry spreading can cut ammonia emissions. Environmental Protection. R&DNewsletter. Ministry of Agriculture, Fisheries and Foods, London, No. 2, P. 6.
MAFF (1997b) This little piggy had low crude protein. Environmental Protection R&D Newsletter. Ministryof Agriculture, Fisheries and Foods, London, No. 1, p 8.
MAFF (1998) Code of Good Agricultural Practice for the Protection of Air. Ministry of Agriculture, Fisheriesand Foods, London.
MAFF (2000a) Climate Change and Agriculture In The United Kingdom. Ministry of Agriculture, Fisheriesand Foods , London.
MAFF (2000b) Towards Sustainable Agriculture: Pilot Set of indicators. Ministry of Agriculture, Fisheriesand Food, p. 30.
MAFF (2001a) Reducing ammonia emissions—is it practical. Environmental R&D Newsletter. Ministry ofAgriculture, Fisheries and Foods, London, No. 6, p. 5.
MAFF (2001b) Floating success in reducing ammonia. Environmental R&D Newsletter. Ministry ofAgriculture, Fisheries and Foods, London, No. 7, p. 5.
MAFF (2001c) An inventory of nitrous oxide emissions from UK agriculture. Environmental R&DNewsletter. Ministry of Agriculture, Fisheries and Foods, London, No. 7, p. 6.
Minami, K., Horiuchi, H. and Tsubota, K. (1998) Global warming and sustainable agriculture. The 4th JIRCASInternational Symposium. Sustainable Agriculture Development Compatible with EnvironmentalConservation In Asia. JIRCAS-International-Symposium-Series, No. 6, pp. 83–98.
Misselbrook, T.H., Van Der Weerden, T.J., Pain, B.F., Jarvis, S.C., Chambers, B.J., Smith, K.A., Phillips, V.R.and Demmers, T.G.M. (2000) Ammonia emissions factors for UK agriculture. Atmospheric Environment34, 871–880.
Mosier, A.R., Duxbury, J.M., Freney, J.R., Heinemeyer, O. and Minami, K. (1998) Assessing and mitigatingN2O emissions from agricultural soils. Climatic Change 40, 7–38.
Neue, H.U. (1997) Fluxes of methane from rice fields and potential for mitigation. Soil Use and Management13, 258–267.
GASEOUS EMISSIONS 151

Oenema, O., Velthof, G.L., Yamulki, S. and Jarvis, S.C. (1997) Nitrous oxide emissions from grazedgrassland. Soil Use and Management 13, 288–295.
Pain, B.F., Misselbrook, T.H. and Chadwick, D.R. (1999) Controlling losses of nitrogen as ammonia frommanures. In: Accounting for Nutrients, A Challenge for Grassland Farmers in ihe 21st Century (Ed.A.J.Corrall). BGS Occasional Symposium No. 33. British Grassland Symposium, Oxford, pp. 93 98.
Paustian, K., Andrén, O., Janzen, H.H., Lal, R., Smith, P., Tian, G., Tiessen, H. and Van Noordwijk (1997)Agricultural soils as a sink to mitigate CO2 emissions. Soil Use and Management 13, 230–244.
Pearson, J. and Stewart, G.R. (1993) The deposition of atmospheric ammonia and its effects on plants. NewPhytologist 125, 283–305.
RCEP (1996) Sustainable Use Of Soil. Nineteenth Report of the Royal Commission on EnvironmentalPollution (Cm 3165). HMSO, London.
Robertson, G.P., Paul, E.A. and Harwood, R.R. (2000) Greenhouse gases in intensive agriculture:contributions of individual gases to the radiative forcing of the atmosphere. Science 289, 1922–1925.
Robinson, R. (1999) The environment protection viewpoint. In: Accounting for Nutrients, A Challenge forGrassland Farmers in the 21st Century (Ed. A.J.Corrall). BGS Occasional Symposium No. 33. BritishGrassland Symposium, Oxford, pp. 127–136.
Rowell, D.L. (1994) Soil Science, Methods and Applications. Longman Scientific and Technical, Harlow.Rund, T. (1994) Cleaner air putting more crops at risk from sulphur deficiency. Arable Farming (December),
22–25.Schlesinger, W.H. (1997) Biogeochemistry, an Analysis of Global Change. 2nd Edition. Academic Press, San
Diego, pp. 393–396.Scott, A., Ball, B.C., Crighton, L.J. and Aitken, M.N. (2000) Nitrous oxide and carbon dioxide emissions from
grasslands amended with sewage sludge. Soil Use and Management 16, 36–41.Simojoki, A. and Jaakkola, A. (2000) Effect of nitrogen fertilization, cropping and irrigation on soil air
composition and nitrous oxide emission in a loamy clay. European Journal of Soil Science 51, 413–424.Smith, K.A. (1997) Soils and the greenhouse effect. Soil Use and Management 13, 229.Smith, K.A., McTaggart, I.P. and Tsuruta, H. (1997) Emissions of N2O and NO associated with nitrogen
fertilization in intensive agriculture, and the potential for mitigation. Soil Use and Management 13, 296–304.
Smith, P., Powlson, D.S., Smith, J.U., Falloon, P. and Coleman, K. (2000) Meeting the UK’s climate changecommitments: options for carbon mitigation on agricultural land. Soil Use and Management 16, 1–11.
Sommer, S.G. and Moller, H.B. (2000) Emission of greenhouse gases during composting of deep litter from pigproduction-effect of straw content. Journal Agricultural Science 134, 327–335.
Speirs, R.B. and Frost, C.A. (1987) The enhanced acidification of a field soil by very low concentrations ofatmospheric ammonia. Research and Development in Agriculture 4, 83–86.
Sutton, A.L., Kephart, K.B., Verstegen, M.W.A., Canh, T.T. and Hobbs, P.J. (1999) Potential for reduction ofodorous compounds in swine manure through diet modification. Journal of Animal Science 77, 430–439.
Tisdale, S.L, Nelson, W.L., Beaton, J.D. and Halvin, J.L. (1993) Soil Fertility and Fertilizers. 5th Edition.Prentice Hall, New Jersey.
Van der Erden, L, De Vries, W. and Van Dobben (1998) Effects of ammonia deposition on forests in theNetherlands. Atmospheric Environment 32, 525–532.
Velthof, G.L. and Oenema, O. (1995) Nitrous oxide fluxes from grassland in the Netherlands: II. Effects ofsoil type, nitrogen fertilizer application and grazing. European of Journal of Soil Science 46, 541–549.
White, R.E. (1997) Principles and Practice of Soil Science, The Soil as a Natural Resource. 3rd Edition.Blackwell Science Ltd, Oxford.
Young, A. (2000) Environmental Change in Australia Since 1788. 2nd Edition, Oxford University Press,Oxford.
152 CHAPTER 6

7Pesticides
7.1INTRODUCTION
Pesticides have become an integral part of modern farming, with most crops receiving at least oneand usually many more applications. In the UK, cereals are sprayed on average over 6 timesduring the year (CPA, 2000a). As the value of a crop increases, so does the amount of pesticideused with 10–15 applications per year being normal for some vegetables and fruit. Many of thesespray applications include more than one ‘active ingredient’. Each active ingredient is, by design, abiocide whose value lies in its ability to kill organisms (specifically those pests, diseases and weedsthat are noxious or unwanted in agricultural production).
Pests and diseases cause a 20–40% loss of world-wide crop production. These losses may occurat all stages of the food chain; during harvesting, drying, storage, processing and retailing. Theaverage world grain loss is estimated to be in the region of 20%, although in the UK it is muchlower at 10% (Mazaud, 1997). Pesticides reduce attack by pests, diseases and weeds and contributeto higher yields, increased quality and higher economic returns. The use of pesticides is one of themost important contributors to increased agricultural production since the 1940s.
Pesticide history
Pesticide usage dates back to Roman and Greek times, but it was not until the mid- to late-nineteenth century that their use became widespread. Up to the Second World War, the chemicalcontrol of pests and diseases involved relatively few substances, confined mainly to high valueproduce such as fruit, hops and glasshouse vegetables (RCEP, 1979). These early pesticides weremainly inorganic compounds, including elemental sulphur used as a fungicide and simple salts ofarsenic, copper, mercury and iron used as fungicides and insecticides. Organic compoundsincluded industrial by-products, like tar distillates, and insecticidal plant extracts such as derris,nicotine and pyrethrum. Few of these pesticides were targeted at particular pests and most werehighly toxic and dangerous to use.
It was during the late 1930s and 1940s that the number and complexity of chemicals developedfor crop protection began to increase. The insecticides DDT and HCH, and the hormone-typeherbicides 2,4-D and MCPA, were first introduced in the late 1940s, followed by the insecticidesdieldrin and aldrin in the 1950s (Hassall, 1990). Some pesticides developed at this time were not
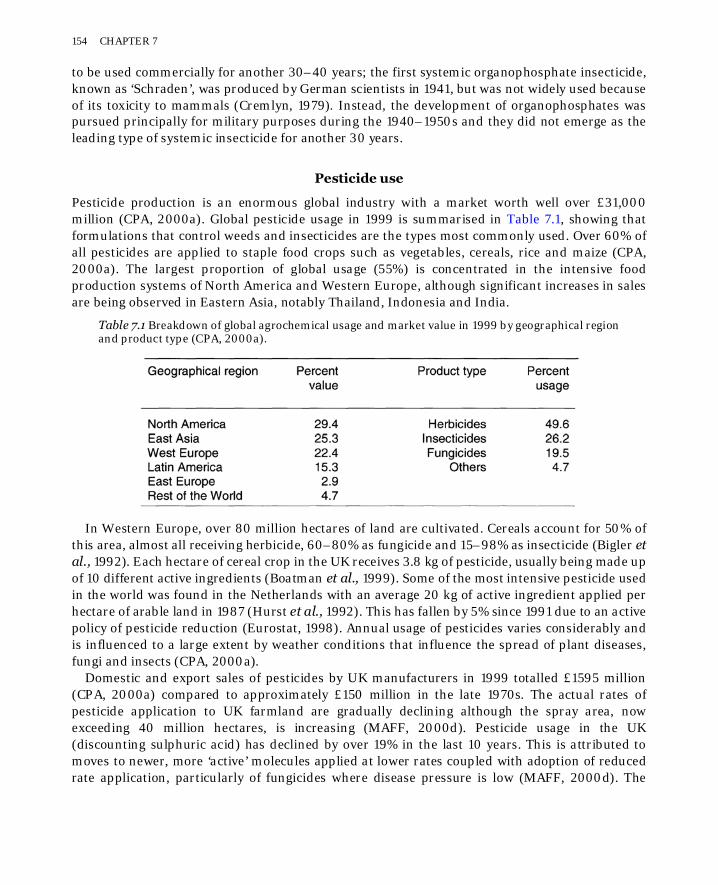
to be used commercially for another 30–40 years; the first systemic organophosphate insecticide,known as ‘Schraden’, was produced by German scientists in 1941, but was not widely used becauseof its toxicity to mammals (Cremlyn, 1979). Instead, the development of organophosphates waspursued principally for military purposes during the 1940–1950s and they did not emerge as theleading type of systemic insecticide for another 30 years.
Pesticide use
Pesticide production is an enormous global industry with a market worth well over £31,000million (CPA, 2000a). Global pesticide usage in 1999 is summarised in Table 7.1, showing thatformulations that control weeds and insecticides are the types most commonly used. Over 60% ofall pesticides are applied to staple food crops such as vegetables, cereals, rice and maize (CPA,2000a). The largest proportion of global usage (55%) is concentrated in the intensive foodproduction systems of North America and Western Europe, although significant increases in salesare being observed in Eastern Asia, notably Thailand, Indonesia and India.
Table 7.1 Breakdown of global agrochemical usage and market value in 1999 by geographical regionand product type (CPA, 2000a).
In Western Europe, over 80 million hectares of land are cultivated. Cereals account for 50% ofthis area, almost all receiving herbicide, 60–80% as fungicide and 15–98% as insecticide (Bigler etal., 1992). Each hectare of cereal crop in the UK receives 3.8 kg of pesticide, usually being made upof 10 different active ingredients (Boatman et al., 1999). Some of the most intensive pesticide usedin the world was found in the Netherlands with an average 20 kg of active ingredient applied perhectare of arable land in 1987 (Hurst et al., 1992). This has fallen by 5% since 1991 due to an activepolicy of pesticide reduction (Eurostat, 1998). Annual usage of pesticides varies considerably andis influenced to a large extent by weather conditions that influence the spread of plant diseases,fungi and insects (CPA, 2000a).
Domestic and export sales of pesticides by UK manufacturers in 1999 totalled £1595 million(CPA, 2000a) compared to approximately £150 million in the late 1970s. The actual rates ofpesticide application to UK farmland are gradually declining although the spray area, nowexceeding 40 million hectares, is increasing (MAFF, 2000d). Pesticide usage in the UK(discounting sulphuric acid) has declined by over 19% in the last 10 years. This is attributed tomoves to newer, more ‘active’ molecules applied at lower rates coupled with adoption of reducedrate application, particularly of fungicides where disease pressure is low (MAFF, 2000d). The
154 CHAPTER 7

trend in the decline in usage looks to continue with the stated UK government policy of limitingpesticide use ‘…to the minimum necessary for the effective control of pests compatible with theprotection of human health and the environment’ (DoE/MAFF, 1995).
This chapter describes the different types of pesticides and their modes of action, identifies thepollution problems that they may cause, and discusses practical options for minimising theirenvironmental impact.
7.2PESTICIDES AND THEIR APPLICATION
Pesticides are used to control a wide range of agricultural pests, diseases and weeds (Table 7.2).They are also present in a number of veterinary products to control some of the ecto- and endo-parasites encountered in livestock farming. Pesticide products contain a number of constituents,including the active ingredient that kills or controls the target organism as well as a number ofadditives. These additives include solvents, surfactants, liquid or solid carriers, safeners (to reducethe potential of a pesticide harming the crop itself), and adjuvants (added to a pesticide to increaseits efficiency).
Table 7.2 Common pesticides and their target organisms.
Pesticides are usually sold in either a liquid or solid formulation, including:
Aqueous Concentrate A concentrated solution of the active ingredient, or ingredients,in water.
Emulsifiable Concentrate A homogenous liquid formulation that forms an emulsion onmixing with water.
Suspension Concentrate A stable suspension of finely ground active ingredient in waterintended for dilution before use.
Water Soluble Powder A powder formulation which forms a true solution of the activeingredient, or ingredients, when dissolved in water.
Wettable Powder A powder formulation that is dispersible in water to form asuspension.
Water Dispersible Powder Similar to wettable powder, but involving a more advancedformulation.
Granules Granules or pellets which contain, or are coated with, the activeingredient or ingredients.
PESTICIDES 155

Dusts A fine powder formulation used for specific applications.
Active ingredients may be known by their chemical name, but usually have a more straightforward‘common’ name. A single active ingredient can also occur in many different brand-namedproducts. For example, tetramethylthiuram disulphide is a fungicide used for controlling dampingoff in seedlings, is commonly known as thiram, and is marketed by several companies in the UK indifferent brand-named products.
Pesticides are usually applied by spray (as a solution, emulsion or particles), spread (as granulesor dust) or dispersed as a fumigant (Hassall, 1990; Culpin, 1992). Herbicides are generally (thoughnot exclusively) applied once during the growing season with timing of application dependingupon the weed problem, whilst fungicides and insecticides are more likely to be applied severaltimes during the crop production cycle (including seed treatment and post-harvest storage).Pesticides are usually applied by dilution with water and application as a fine spray with a tractor-mounted or trailed sprayer. The spray is usually applied downwards directly onto the crop, exceptin orchards where the spray is directed upwards under high pressure to reach fruit at the top ofthe trees. Aerial crop spraying plays an important role in many countries (notably the US andAustralia), but is relatively limited in the UK, accounting for only 0.02% of the total treated area(MAFF, 1998a). Solid formulations of fungicide and insecticide may also be applied both at thestart (as a seed dressing) and end (as a dusting on stored grain) of the production cycle and grainstores may be fumigated with insecticide prior to harvest. Granular herbicides, fungicides andinsecticides are also available for direct-to-soil application.
7.3MODE OF ACTION
The way in which a pesticide acts varies and is often highly complex, but toxicity usually takeseffect by interfering with the biochemical processes of the pest or ‘target’ organism (Baird, 1995).Chemical substances may produce one of two types of toxic effect:
• acute effects that have a rapid onset over a short period of time with pronounced symptoms;• chronic effects that persist over a long time period, generally occurring when an organism is
exposed to repeated sub-lethal doses.
A widely used measure of comparative acute toxicity is the LD50. This is the median lethal dose ofa given substance at which 50% of the subjects (commonly male rats) die (Wentz, 1989). Someexamples of LD50 values are given in Tables 7.3 to 7.5, and are expressed as mg of substance per kgbody weight of the subject. The lower the LD50 value, the more toxic the substance is to the testorganism. This information may be adapted to give an indication of toxicity to humans or livestock(Hassall, 1990). The toxic effect produced by a pesticide is largely determined by its biologicalactivity and the magnitude of dose received by the target organism. When using pesticides, thebiologically active ingredient is therefore formulated, prepared and applied to ensure that itsavailability to the target organism is maximised (Graham-Bryce, 1987).
156 CHAPTER 7

The modes of action of most pesticides fall into the following basic categories (Hassall, 1990;van Emden, 1992):
Poison Ingested by the pest organism before releasing toxins into its stomach.Contact Applied directly to the pest organism, penetrating its surface and producing a
localised toxic effect. Usually they remain active for a few days at most. Residual Act in the same way as contact pesticides, but do not need to be applied
directly to the pest organism since they remain active for long periods.Translocated Active ingredient is mobilised within the pest organism and has a more
effective toxic effect upon it.Systemic Active ingredient is mobilised within the crop or animal being protected and is
then transferred to the target pest.
Most pesticides used in agriculture today are synthetic organic chemicals that act by interferingwith a vital metabolic process in the organisms to which they are targeted. Commonly affectedmetabolic processes are photosynthesis (herbicides), energy release and transfer (herbicides,fungicides), nerve cell impulses (insecticides), cell division and growth (herbicides, fungicides)and biosynthesis (fungicides). We now look at the three main classes of pesticides, namelyinsecticides, herbicides and fungicides in more detail.
7.4INSECTICIDES
There are hundreds of different compounds commercially available as insecticides, but these fallinto three general chemical groups (organophosphates, carbamates and synthetic pyrethroids)which account for over 75% of the market (Conway and Pretty, 1991). Most insecticides work bydamaging the nervous system of the target insect, either by affecting neurons or by interferingwith the transfer of nerve impulses between neurons.
The first synthetic insecticides to be widely used in agriculture were the organochlorines, thebest known being DDT. They were heralded as a major breakthrough and revolutionised pestcontrol, particularly for vectors of diseases such as malaria. The compounds involved were cheap,effective, non-toxic to humans and their persistence and long-lasting effectiveness were initiallyconsidered as beneficial. It is now evident that their broad-spectrum insecticidal activity,persistence in the environment and tendency to bioaccumulate along food chains causedsignificant environmental problems and as a result their use has been drastically reduced.Organochlorine pesticides are generally banned in most western countries although they are stillused in developing countries, particularly in the tropics.
One organochlorine compound, lindane, remains of concern in the UK, despite being banned orseverely restricted in 37 countries, and being phased out throughout the EU. Lindane (or gamma-HCH as it is also known) is currently approved for use in the UK for non-agricultural uses, such asin wood preservation. Exposure to lindane has been linked with a number of human health issues,including blood disorders, multiple congenital abnormalities and breast cancer.
PESTICIDES 157

Organophosphates (OPs)
Organophosphate insecticides are widely used in agriculture and have largely replaced thepersistent organochlorine insecticides (Baird, 1995). Organophosphate affect insects by inhibitingthe enzyme acetylcholinesterase, which is responsible for hydrolysing acetylcholine, a substanceinvolved in the transmission of nerve impulses.
In common with other animals, insects have a nervous system to transmit impulses around thebody. This system is made up of a series of neurons that interconnect via gaps called synapses toform a complex neural network. Nerve impulses are conducted through this network by bothelectrical (along the neurons) and chemical (across the synapses) processes. The chemical processat a synapse involves acetylcholine. This is produced by each neuron in turn as it is electricallystimulated, diffusing across its adjacent synapse to induce an electrical impulse in the next neuron.In order to avoid hyper-activity, levels of acetylcholine must be precisely controlled by the insect(and indeed all other animals). This is achieved by the enzyme acetylcholinesterase, whichhydrolyses acetylcholine as soon as it has completed its task of transferring an impulse across asynapse.
Organophosphate insecticides (and carbamates) work by inhibiting the activity ofacetylcholinesterase that leads to an accumulation of acetylcholine within the neural network. Aslevels of acetylcholine increase the insect becomes continually and increasingly stimulated bynerve impulses leading to hyperactivity, disruption of its behaviour and eventual death.
One of the potential problems with OPs is that although they generally break down in theenvironment relatively quickly, they are extremely toxic to mammals whilst they remainchemically active. In particular, increasing concern is being voiced about the adverse effects of OPpesticides upon human health.
Table 7.3 General properties of some common insecticides.
Carbamates
These insecticides are commonly used to control insects that do not readily respond to the lessexpensive organophosphates (whiteflies, mealy bugs, cockroaches etc.). Carbamates tend to have arelatively broad-spectrum of activity and also function by inhibiting the enzymeacetylcholinesterase. Like organophosphates, carbamates show little tendency for environmentalpersistence, but may be acutely toxic to mammals (Table 7.3).
158 CHAPTER 7

Pyrethroids
These may be either natural or synthetic. Natural pyrethrum is extracted from the flowers ofChrysanthemum cinerariaefolium and is still in current use. Due to the inconsistent supply of theflowers the cost of natural pyrethroids tends to be high. This stimulated a search for syntheticpyrethroids and they were first formulated at Rothamsted Experimental Station in the 1970s.Pyrethroids are characterised by having a rapid ‘knock down’ effect on most insects and act byattacking the central and peripheral nervous system. Pyrethroids have very low mammaliantoxicity and limited environmental persistence, due to the fact that the active ingredients (esters ofasymmetric acids and alcohols) are rapidly hydrolysed in water and degraded by light.
7.5HERBICIDES
More is spent globally on herbicides than any other type of pesticide (Table 7.1). Some herbicidesare non-selective (e.g. glyphosate) and are used specifically to clear the soil of vegetation. Of theherbicides, the three most widely used groups are the triazines, phenoxyacetic acids andcarbamates (Table 7.4). Herbicides are applied directly to soil, just prior, or sometimes duringcrop growth in order to destroy weeds. Left unchecked, weeds compete with the crop for light,moisture and nutrients thereby reducing growth and yield. Most herbicides need to be selective;their application should only kill the weeds competing with a crop and they should not affect thegrowth of the crop itself (Hassall, 1990). Selectivity can be achieved in a number of ways,including:
• the herbicides chemical activity;• its rate of application;• differences and variations in growth stage between the crop and weed;• timing of the application.
Table 7.4 General properties of some common herbicides.
Triazines
This group of herbicides includes atrazine, simazine and cyanazine. Triazines are applied as pre-emergent sprays directly to the soil and function by blocking one of the main biochemicaltransport systems in the operation of photosynthesis and reducing the effectiveness of the
PESTICIDES 159

chloroplastic membranes. Typical symptoms of triazine use are chlorosis and desiccation of leavesof the emerging weed seedlings. Atrazine is one of the few herbicides that may pose a potentialhealth risk to mammals, but only when it is transformed in the stomach to a more carcinogenicform (Conway and Pretty, 1991).
Phenoxyacetic acids
Unlike the triazines, phenoxy acid herbicides are applied as post-emergent sprays directly to thegrowing crop. They are used for the control of dicotyledonous (broad leaf) weeds and function bybeing absorbed by lipids in the leaf and disturbing the normal growth pattern of the plant byinterfering with its genetic make up. The application of 2,4-D causes deformation of growingshoots and leaves and epinasty (twisted, spindly growth) of the stems (Hassall, 1990).
Phenoxy acid herbicides, such as 2,4-D degrade rapidly on contact with soil and generally showlimited toxicity to humans. Some commercial formulations of phenoxy acids have, however, beensusceptible to contamination with dioxin in the past. In the 1970s considerable amounts of dioxinwere found in 2,4,5-T (no longer used in the UK) and are known to have caused birth defects, skindisease and neurological disorders in human populations exposed to the herbicide (Conway andPretty, 1991).
Carbamates
This group of herbicides is often used to control grassy weeds in cereal crops. Barban, a commonlyused carbamate herbicide, both controls wild oats (Avena fatua and A. ludoviciana) and acts as agrowth retardant. It has limited persistence of 2–4 weeks (being broken down by micro-florapresent in the soil) and the timing of application is vitally important to ensure weed removal. Theaction of this herbicide is thought to be via interference with protein synthesis and formation(Hassall, 1990).
7.6FUNGICIDES
The use of fungicides to control crop diseases involves a different approach from that used for thecontrol of insects and weeds. There are three major types of fungicide currently in use: traditionalinorganics, phenylamides and carboxamides (Table 7.5). Relatively little is known about theirdetailed mode of action.
Table 7.5 General properties of some common fungicides.
160 CHAPTER 7

Fungi have a considerable ability to regenerate and spread rapidly from a relatively smallpopulation base. The application of fungicide to a crop already well infected with a disease istherefore futile, as considerable damage to the crop will already have occurred. The most effectiveapproach to disease control is to treat the crop either before the arrival of the infection, or in theearly stages of its development. This may be done by the use of contact or systemic fungicidesapplied as soil drenches, seed and root dressings or foliar sprays.
Traditional inorganics
Inorganic fungicides, notably transition metal complexes such as copper based Bordeaux mixture,mercurous chloride and triphenyltin have long been used to control fungal diseases on crops likegrape vines, fruit trees, hops, potatoes, brassicas and onions. Bordeaux mixture is a combination ofcopper sulphate (CuSO4) and slaked lime (Ca(OH)2) forming a gelatinous precipitate that can beused against a relatively wide variety of fungal diseases, either in powder/dust form, or mixed withwater and applied through a sprayer. On contact with fungi, the copper in the precipitate issolubilised and complexed by exudates released by the fungal spores. These complexes are thentransported to the fungal spores where they exert a toxic effect.
Phenylamides
These fungicides include metalaxyl, ofurace and oxadixyl. They are used extensively in the controlof a certain group of fungi known as oomycetes, which are systemic within the host plant.Oomycetes produce motile spores that require water for their transfer to the host organism at theinfective stage. Metalaxyl is a fungicide that has a specific action against oomycetes, particularlylate blight in potatoes (Phytophthora infestans) and downy mildews. It functions by interferingwith enzymes that control regeneration and spore formation, initially stopping growth, thenkilling the organism.
Carboxamides or oxathins
These are used extensively against rusts and smuts in cereal crops. Like many other fungicides andherbicides, carboxamides display relatively limited mammalian toxicity. Carboxin, one of the mostcommon types of carboxamides, inhibits enzymes involved in the metabolism and respiration offungi such as loose smut (Utstilago nuda).
7.7THE CAUSES OF PESTICIDE POLLUTION
Pesticides as pollutants
The environmental impact of different pesticides is linked to the method, form and timing of theirapplication (Miller, 1991) and their effect on the natural environment varies greatly. Theenvironmental consequences of pesticide use first became the object of widespread public interest
PESTICIDES 161

in the 1960s, notably through the publication of Rachel Carson’s famous book, Silent Spring(Carson, 1985; first published in 1962). The use of pesticides in agricultural systems has expandedprimarily due to:
• relatively low cost and high returns, commonly combined with external financial incentives inthe form of subsidy;
• the intensification of agriculture, including the introduction of high yielding varieties requiringgreater pesticide application;
• bad practice due to a lack of understanding regarding the consequences of pesticide use;• a tendency to try and achieve total protection from pests (‘cosmetic control’) in high value
crops, such as fruit and vegetables.
An ‘ideal’ pesticide would only affect its target organism, be non-persistent and have no harmfulenvironmental effects (Conway and Pretty, 1991). However, most pesticides do not have thesetraits and consequently they may be directly toxic to non-target organisms, accumulate inecosystems or cause ecosystem disruption. Pesticides may cause point source or diffuse pollutionvia the following pathways:
• by direct contamination of ground and surface waters;• by soil contamination and subsequent leaching into ground and surface waters, surface run-off
and/or soil erosion;• by direct contamination of non-target organisms;• by contamination of non-target organisms by residues or persistent compounds.
Point source pollution is often caused by poor agricultural practice and includes leaking storagefacilities, spillages whilst filling equipment, run-off from wash-down areas during cleaning, and theinappropriate disposal of unused pesticides (Miller, 1991; MAFF, 1999). Diffuse pollution mayoccur even when good agricultural practices are adopted because a significant proportion of thepesticide applied inevitably does not reach its target organism (Helweg, 1994; Brown et al., 1995).In a review of published work on arthropod pests, crop pathogens and weeds, Pimentel (1995)concluded that less than 0.1% of pesticides applied reach their target organism.
Resistance and resurgence
When regularly and widely exposed to a particular pesticide, pest organisms often build-upresistance by a process of selection. Insects may develop resistance by developing less permeablecuticles, retaining toxins in fatty tissue more effectively or by better enzyme systems metabolisingthe toxin (van Emden, 1992). Resistant individuals are usually rare in a pest population, and soinitially pesticides are often very effective. Continued use, however, favours the resistant individualsand the efficacy of the pesticide may be reduced (Figure 7.1). Although the short life cycles andlarge numbers of insects make them particularly adept at developing resistance, it is also evidentin many other organisms including plants, mammals and fungi (Box 7.1).
162 CHAPTER 7

As individual pesticides become ineffective, many farmers are inevitably forced onto a ‘pesticidetreadmill’; applying more and more pesticides to try and maintain yields as the resistance of thetarget pest increases.
Another consequence of pesticide usage is the resurgence of pest populations, particularly thosewith resistance. This phenomenon is caused by application of broad-spectrum pesticides thatcontrol pests, but which also destroy their natural enemies at the same time. In the absence ofnatural enemies, populations of pests can increase rapidly, causing a bigger problem than wouldoccur if the pesticide had not actually been applied.
BOX 7.1PESTICIDE RESISTANCE
Fungicides—powdery mildew and Botrytis cinereaSvec et al. (1995) detected resistance of Wheat Powdery Mildew (Erysiphe graminis) to the
fungicides triadimenol, tebuconazole, propiconazole, flutriafol and fenpropimorph sampled from theCzech Republic, Austria, Hungary and Slovakia. Resistance to triadimenol was the highest, having anMRF (mean resistance factor) 29 times higher than non-resistant standards. Stehmann and deWaard (1995) showed that the fungal plant pathogen Botrytis cinerea has developed 100% resistanceto the commonly used benzimidazoles and dicarboximides fungicides.
Insecticides—the houseflyThe housefly, Musca domestica, is a serious pest in intensive livestock units and has shown
increased resistance to a range of commonly used insecticides. Pap and Farkas (1994) conducted astudy to assess the resistance of different populations of houseflies to a range of insecticides.Resistance was identified by calculating resistance ratios, a relative measure comparing the effect ofinsecticides. The percentage of populations exhibiting evidence of resistance were:
Active Ingredient Percentage
DDT 60methoxychlor 50lindane 13malathion 83
Figure 7.1 Development of resistance, (a) Distribution of tolerances before selection; (b) Distribution oftolerances after selection compared with distribution before selection (reproduced with kind permission vanEmden, Pest Control, 1992. Cambridge University Press).
PESTICIDES 163

permethrin 63deltamethrin 79diflubenzuron 0
Herbicides—wild oatsA survey funded by the Herbicide Resistance Action Committee and conducted by ADAS and IACR-
Rothamsted detected evidence of resistance in winter wild oats (Avena ludoviciana) on farms inEssex (Rush, 1994). Samples were tested with a range of herbicides under controlled conditions andresistance was found to a number of herbicides commonly used to control the weed, includingfenoxaprop-ethyl, diclofop-methyl and fluazifop-P-butyl.
7.8BEHAVIOUR AND FATE OF PESTICIDES IN THE ENVIRONMENT
Before discussing the key problems associated with the use of pesticides in modern agriculture, itis useful to consider those factors that determine their behaviour in the environment. Thesefactors have an important influence upon the fate and impact of pesticides as pollutants.
Persistence
After application, a pesticide is subject to varying degrees of biological and chemical breakdown(Alloway and Ayres, 1993; Harrad, 1996) and its persistence depends upon its ability to resist thisdegradation. Generally, naturally derived pesticides, such as pyrethrum have relatively lowenvironmental persistence, breaking down rapidly when exposed to sunlight (photo-instability). Incontrast, many synthetic pesticides can be highly persistent (Warner, 1995). Persistence can bedefined as a measure of the time necessary to degrade the pesticide into harmless products (Younget al., 1992) and does not necessarily imply that environmental problems will occur. Somepesticides may persist for long periods without causing environmental harm as a pollutionpathway to a sensitive site or target may not exist.
Other pesticides may breakdown very rapidly, but create intermediate metabolites that presenta greater environmental hazard than the original compound. Some of the most notoriousmetabolites are DDD and DDE from the chemical/microbial dechlorination and photochemicalreactions of DDT. In particular, DDE is thought to be a strong androgen receptor (with thepotential to cause male sterility), with persistence exceeding that of DDT (Aislabie et al., 1997).Further examples of potentially hazardous metabolites include 1,2,4-triazol, a metabolite of severalfungicides, and chlorallyl alcohol, a metabolite of the nematicide 1,3-dichloropropene which havebeen found in drinking water in the Netherlands (Loch, 1991).
Useful indicators for the behaviour of pesticides in the environment are aqueous solubility andthe partition coefficient (Tables 7.3 to 7.5). The partition coefficient (Kow), usually expressed as a
164 CHAPTER 7
log value, is a measure of the distribution of the pesticide between liquid layers of water and analcohol, 1-octanol:
Both the solubility in water and partition coefficient of pesticides vary considerably and arebelieved to have a considerable bearing on environmental persistence (Munz and Bachmann,1993). For example, DDT has a solubility in water of only 0.0034 µg ml−1 and a log Kow of 3.9–6.2.Consequently, its residence time in soil, in some situations is estimated to be greater than 20 years(Van Zwieten et al., 2001). In contrast another organochlorine, aldicarb, has a solubility of over6000 µg ml−1, a log Kow of 1.6 and a residence time in soil of only several weeks.
As the value of log Kow, increases a pesticide tends to become more hydrophobic and it is morelikely to bind to organic molecules. Pesticides with partition coefficient values of greater than 7 donot generally move far in the agroecosystem. Instead, they tend to bind strongly to the organicmatter in soils and sediments. However, log Kow values of between 4 and 7 indicate that thechemical is lipophilic in nature and consequently has the tendency to dissolve and accumulate infatty tissues. If bioaccumulation occurs then this effect may be amplified through food chains,putting organisms at higher trophic levels (usually carnivores) at risk (Baird, 1995; Turnbull,1996).
In some cases, the inherent lipophilicity of pesticides means that they may be adsorbed toplastics, rubber and certain polythenes. Such a phenomena was blamed for the delay in cleaning aplastic drinking water supply system after an incident in Denmark, where it took over one monthof flushing to reduce concentrations of the OP, parathion, to safe levels (Helweg, 1994).
Some of the inorganic compounds traditionally used as pesticides are particularly recalcitrantand may persist in the environment for long periods (Young et al., 1992). Although they do notbioaccumulate, repeated use can lead to accumulation in soil. An example of this is the traditionalcopper-based fungicide Bordeaux Mixture. Since inorganic compounds are usually applied in thevery early stages of infection they require a reasonable degree of persistence in order to besuccessful. Copper-based fungicides have extraordinarily long persistence times and residues fromtreatment may be present in soils for over 100 years (Merry et al., 1986). There is concern,therefore, that repeated applications can lead to copper accumulation in the soil, crop toxicity, adecline in beneficial soil organisms, and eventual yield loss (Filser et al., 1995; Helling et al., 2000).
The fate of pesticides in soil
Pesticides may enter soil profiles by being applied directly as drenches, granules or sprays, as run-off from plant canopies, or via seed dressings. The subsequent fate of these pesticides is theninfluenced by the interaction of its persistence and degradation with a number of processes,including biochemical degradation, volatilisation, adsorption, leaching and plant uptake.
The major mode of pesticide degradation in soil is biochemical due to the action of soilmicrobes. The susceptibility of a synthetic pesticide to microbiological breakdown is largelyrelated to its structure, notably its similarity to the micro-organisms usual organic substrate.Large ring structures (e.g. DDT and parathion) and complex long chain organic molecules are
PESTICIDES 165
broken down less rapidly than linear chain structures. Furthermore, the presence of chlorinesubstituents on some molecules may increase environmental persistence. For example, DDT isconsidered to be one of the most persistent pesticides, but its non-chlorinated analoguediphenylmethane, is readily biodegradable (Aislabie et al., 1997). In some cases exposure topesticides over a relatively long time period may induce certain soil bacteria to develop the abilityto break down some of the more complex chemical structures (Herrling et al., 1993; Megharaj etal., 2000). This can lead to a reduction in their efficacy to such an extent that alternativepesticides or other control practices are required (RCEP, 1996). Once a pesticide has penetratedbelow the biologically-active upper soil horizons and into the underlying parent material its rate ofdegradation declines significantly. Pesticide persistence in subsoils may be between 5 and 20times greater than in surface horizons (Helweg, 1994).
Another factor that influences the activity and biodegradability of pesticides is their affinity foradsorption by soil organic matter. Soil organic matter possesses an array of chemical functionalgroups (e.g. hydroxyls, carboxyls, phenolics and amines) which can interact with pesticides(Young et al., 1992). As many pesticide molecules are non-ionic, non-polar and generallyhydrophobic, organic matter provides important sites for their adsorption (Harrad, 1996).Adsorption is the process whereby a chemical moves from the liquid or solution phase to the solidphase. The adsorption characteristics of a pesticide for organic matter may be estimated by usinglog Kow. Adsorption of a pesticide onto organic matter may affect its behaviour and fate in the soilin a number of ways:
• it may make the pesticide physiologically inactive or more susceptible to degradation bymicrobial action;
• by reduced mobility in the soil making the pesticide less prone to leaching (Pedersen et al.,1995);
• by enhanced mobility of the pesticide. Dissolved organic matter or colloidal particulate matter(colloids are particles of <1 µm in diameter) can form complexes with pesticides, greatlyincreasing their susceptibility to leaching loss (Gerstler, 1991);
• pesticides associated with organic matter are susceptible to soil erosion and the movement towatercourses as suspended load (Brown et al., 1995). It is thought that soil erosion isresponsible for the continued reappearance of many banned pesticides (e.g. aldrin and dieldrin)in surface waters in the UK even though they are no longer applied (Environment Agency,2000).
The clay content of soils may also greatly influence the fate of agricultural pesticides. Clay-sizedparticles (<2µm), in particular alumino-silicate minerals, have important properties which explaintheir fundamental importance in soil chemistry. They characteristically have very large surfaceareas (700–800 m2 g−1 for montmorillonite an expanding lattice clay) and can carry a permanentnegative electrical charge. This means they are of considerable importance in the adsorption of ionicand ionizable pesticides. Many of the triazine herbicides, for example, are weak bases in acidmedia and one of the amino groups may become protonated, therefore enhancing its adsorptionby clays at low soil pH.
166 CHAPTER 7
Loss of pesticides from soil
Leaching losses of pesticides from soil typically occur when the prevailing rainfall (or irrigation)exceeds evapotranspiration losses and the soil water content rises above field capacity (White,1997; Marshall et al., 1999). At this point, drainage water starts to move down the soil profilecarrying chemicals, such as pesticides with it. The susceptibility of a pesticide to leaching in thismanner depends upon the interaction of the chemical properties of the pesticide (i.e. how easily itis degraded, adsorbed or volatilised) with the chemical and physical properties of the soil.
Any factor that reduces soil microbiological activity (e.g. low organic matter, oxygen,temperature or soil moisture) will decrease the potential rate of pesticide degradation andmaintain the availability and susceptibility of pesticides to leaching (Young et al., 1992; Harrad,1996). An example of how a reduction in soil microbial activity may affect degradation of appliedpesticides was observed in regions of Denmark (Helweg, 1994). In the winter months, a meanprecipitation surplus of only 320 mm coupled with a mean soil temperature of 3°C slowed themicrobial degradation of pesticides significantly and increased the risk of leaching and thepollution of ground and surface waters.
Theoretically, a pesticide applied to a clay soil with a high organic matter content will be lesssusceptible to leaching than if applied to a sandy soil with a low organic matter content. Inpractice, however, the movement of pesticides through heavy soils is influenced greatly by theoccurrence of ‘by-pass flow’. This may be defined as accelerated movement of water and dissolvedchemicals down the soil profile through cracks, macro-pores, animal burrows and old rootchannels in the upper soil horizons (Funari et al., 1991; Marshall et al., 1999). Williams et al.(1995) applied seven commonly used pesticides at recommended rates to crops growing on aheavy clay soil and monitored the resultant pesticide concentrations in soil and drainage waters.Although the proportion of the applied pesticide recovered in drainage water was generally verysmall (Table 7.6), the concentrations of pesticide found during rainfall events were well in excess ofthe EU limit of 0.1 µg l−1. These researchers concluded that pesticide leaching to streams wasconsiderably more pronounced than expected on the basis of ‘classical leaching theory’ and that thiswas due to by-pass flow. Under certain circumstances, therefore, processes such as adsorption anddegradation within the soil can be of relatively limited effectiveness in reducing leaching losses(Oliver et al., 2000).
Plant uptake is another pathway that may determine the fate of pesticide residues and its extentis determined by its bioavailability. This is dependent upon many soil and plant factors, as well asthe type of pesticide involved (Alloway, 1995; Barber, 1995). Uptake via root systems is achieved ifthe pesticide has certain water solubility and lipophilicity characteristics (White, 1997). A partitioncoefficient of log Kow=4 has been observed to be the upper limit for root uptake (Graham-Bryce,1987).
A final mechanism for the movement of pesticides from soil (and leaf surfaces) is volatilisation,i.e. the flux of organic chemicals into the ambient air above treated surfaces (Pestemer and Krasel,1992). The rate and extent of volatilisation depends upon the incident environmental conditions,the method of application, and the volatility of the pesticides involved. The volatilisation ofpersistent pesticides and their long-range atmospheric re-deposition in precipitation has causedpesticide pollution in many remote lakes and other surface waters (Conway and Pretty, 1991;
PESTICIDES 167

Siebers et al., 1994) whilst lindane has even been found in arctic air and snow (Cleemann et al.,1995).
7.9ENVIRONMENTAL PROBLEMS CAUSED BY PESTICIDE RESIDUES
Once pesticides enter the environment they have the potential to cause pollution problems. In thissection we consider some of the effects of pesticide contamination.
Pesticides in surface and ground waters
Ground and surface waters are vulnerable to pollution by pesticides and a large number ofdifferent active ingredients have been detected during regular surveys of water quality in the UK(MAFF, 2000d; Environment Agency, 2000). Surveys indicate that incidents recorded annuallyhave increased by 35% from the middle to late 90s (Figure 7.2), mainly due to an increase inCategory 1 (the most severe) and Category 2 pollution incidents (Environment Agency, 2000).
Acute pollution occurs when pesticides enter surface waters directly due to accidents or badpractice during storage, application or disposal. A common cause of acute pollution are sheep dipchemicals, cypermethrin and diazinon, which are especially toxic to aquatic organisms (Box 7.2).Other common pesticides found in UK surface waters include mecoprop which is an agriculturalherbicide (and significantly also used in domestic gardens), and isoproturon, MCPA, 2,4-D, diuronand dichlorprop which are also all relatively environmentally labile herbicides (MAFF, 2000d).
Table 7.6 Proportions (%) of pesticide applied found in drainage water and maximum concentrations (µg l−1)of pesticide recorded (Williams et al., 1995).
168 CHAPTER 7

Figure 7.2 Distribution of substantial aquatic pollution incidents from ‘other pesticides’ and sheepdips between 1992 and 1998 (adapted from Environment Agency, 2000).
Chronic effects are usually from diffuse sources due to pesticides or secondary compoundsleaching from soils. Groundwaters are particularly susceptible to chronic pollution and pesticideresidues are regularly detected (Table 7.7).
BOX 7.2UK CASE STUDY OF SHEEP DIP POLLUTION
The Environment Agency is responsible for monitoring the water quality of all rivers, lakesand streams in the UK. In addition to routine monitoring, surveys are conducted whenpollution incidents occur and this information may be used in prosecutions. The incidentdescribed below occurred in the north-west of England during the 1990s.
A pollution inspector was requested to investigate a problem in a small stream in Lancashire. Thewater quality of the stream had deteriorated due to a spillage of OP sheep dip entering via a surfacewater drain. A biological survey was conducted to assess the effects of the incident conducted bycollecting macro-invertebrates (insects, snails, shrimps, etc.) both upstream and downstream of thepoint source. The number of invertebrate families living in the stream is an indicator of the waterquality of each site. The results of the survey were:
Invertebrate familiesPresence in sample
Upstream Downstream
StonefliesPerlodidaeChloroperlidaeMayfliesHeptagenidaeLeptophlebidaeCaddisfliesRhyacophilidaeLimnephilidaeBeetles
PESTICIDES 169
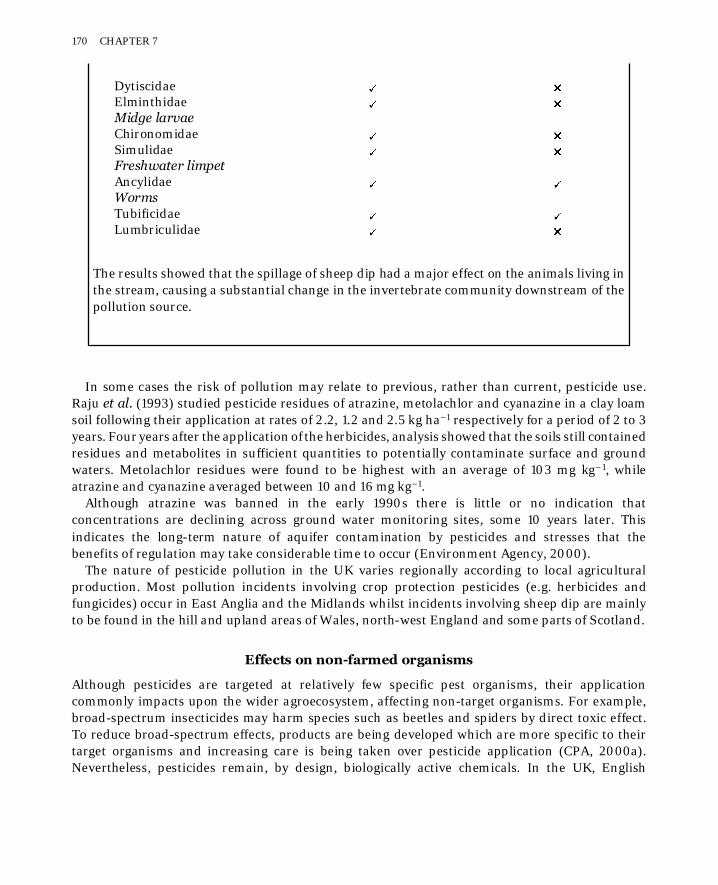
DytiscidaeElminthidaeMidge larvaeChironomidaeSimulidaeFreshwater limpetAncylidaeWormsTubificidaeLumbriculidae
The results showed that the spillage of sheep dip had a major effect on the animals living inthe stream, causing a substantial change in the invertebrate community downstream of thepollution source.
In some cases the risk of pollution may relate to previous, rather than current, pesticide use.Raju et al. (1993) studied pesticide residues of atrazine, metolachlor and cyanazine in a clay loamsoil following their application at rates of 2.2, 1.2 and 2.5 kg ha−1 respectively for a period of 2 to 3years. Four years after the application of the herbicides, analysis showed that the soils still containedresidues and metabolites in sufficient quantities to potentially contaminate surface and groundwaters. Metolachlor residues were found to be highest with an average of 103 mg kg−1, whileatrazine and cyanazine averaged between 10 and 16 mg kg−1.
Although atrazine was banned in the early 1990s there is little or no indication thatconcentrations are declining across ground water monitoring sites, some 10 years later. Thisindicates the long-term nature of aquifer contamination by pesticides and stresses that thebenefits of regulation may take considerable time to occur (Environment Agency, 2000).
The nature of pesticide pollution in the UK varies regionally according to local agriculturalproduction. Most pollution incidents involving crop protection pesticides (e.g. herbicides andfungicides) occur in East Anglia and the Midlands whilst incidents involving sheep dip are mainlyto be found in the hill and upland areas of Wales, north-west England and some parts of Scotland.
Effects on non-farmed organisms
Although pesticides are targeted at relatively few specific pest organisms, their applicationcommonly impacts upon the wider agroecosystem, affecting non-target organisms. For example,broad-spectrum insecticides may harm species such as beetles and spiders by direct toxic effect.To reduce broad-spectrum effects, products are being developed which are more specific to theirtarget organisms and increasing care is being taken over pesticide application (CPA, 2000a).Nevertheless, pesticides remain, by design, biologically active chemicals. In the UK, English
170 CHAPTER 7

Nature expressed particular concern about the possible effects on wildlife of long-term exposure topesticides and concluded that any reduction in pesticide use would benefit nature conservation(NCC, 1990).
Humans are also a category of non-target organism with occupational or accidental poisoning(e.g. pesticide drift) and food residues being possible causes of exposure. We do not consider thehuman health aspects of pesticides here although in Box 7.3 but provide the reader with evidencethat pesticide residues are present within the food chain.
BOX 7.3PESTICIDE RESIDUES
Organochlorine pesticide residues in cheeseOrganochlorines can enter the human food chain in a number of ways. One of the more unusual is
via grazing livestock; cattle may involuntarily ingest up to 18% of their DM intake as soil. If grazingland has been treated with organochlorines, bioaccumulation may occur. Fat rich products from thelivestock, particularly cheese, butter and milk may subsequently contain the pesticide (Wong and Lee,1997). A study of the accumulation of organochlorine pesticides in commonly consumed cheeses inSpain observed that of the 146 samples collected, 94.5% were observed to contain chlordane althoughits use had been banned since 1977 (Bentabol and Jodral, 1995). DDT was also observed and occurredin many of the samples with a mean concentration of 55µg kg−1 and a maximum of 406 µg kg−1. Thehuman health risk was evaluated based on the average per capita consumption of cheese and the resultsshowed that in all cases intakes were well below acceptable daily intakes.
Organophosphorus residues in carrotsOPs, notably chlorfenvinphos, phorate, triazophos, quinalphos and primiphos-methyl, have been
increasingly used in the UK over the last 25 years to control carrot fly (Psila rosae). By themid-1990s, virtually the entire UK carrot crop was routinely sprayed up to a maximum of nine timesper year.
At this time, pesticide residues were monitored by a standard procedure involving the analysis ofcomposite (blended) samples of carrots from commercial sources and were generally found to
Table 7.7 Pesticides detected in ground waters in the UK (of the 130 sampled for) at 8546 locations(Environment Agency, 2000).
PESTICIDES 171

comply with the statutory maximum residue levels (MRLs) set for the UK under the Pesticides(Maximum Residue Levels in Food) Regulations, 1988 (Beaumont, 1992).
In 1995, MAFF announced that researchers reporting to the independent Advisory Committee onPesticides (ACP) had modified the standard monitoring procedure and analysed carrots individuallyand found unexpectedly high residues of OP insecticides with 1–2% of carrots tested containingresidues up to 25 times higher than the MRL (PSD, 1995). With no explanation for these high levels,the ACP concluded that ‘…margins of safety have been eroded to a level where action is required torestore them’. As a consequence the recommendation was made that the number of OP applicationsto carrot crops should be limited to a maximum of three per year and alternatives to OP use sought.
Consumers meanwhile were reassured that peeling and ‘topping’ (removing the top 2–3 mm)carrots during preparation removed about 80% of residues. Relatively recent evidence suggests thatthere has been a rise in the percentage of samples exceeding MRLs in the UK, although the issue iscomplicated by the sampling and analysis of imported food products in combination with UK-produced food (CPA, 2000a; MAFF, 2000b).
Whilst residues in food are an important issue, it is the direct effect of pesticide use insagroecosystems which causes environmental disruption. There are many important groups ofbeneficial and non-target organisms at risk from pesticide use and a single insecticide applicationcan reduce total numbers in a cereal crop by up to 80%. Beneficial organisms affected include:
Pollinators Honey (Apis mellifera) and bumble bees are particularly important for thepollination of many fruits and vegetables, but are at risk when sprayingoccurs on or near to flowers where they are feeding (Williams, 1982; 1986).All of the reported and investigated incidents involving the poisoning of‘beneficial insects’ by agricultural chemicals in 1999 in the UK involvedhoneybees. The majority of colonies were adversely affected by theorganophosphate compound dimethoate (78%) whilst carbamate accountedfor a further 12% (MAFF, 2000c).
Soil organisms May be adversely affected by fungicides, molluscicides and nematicides(RCEP, 1996; Indeherberg et al., 1998). Applications of the fungicidesmetalaxyl and mancozeb can reduce populations of the beneficialmycoparasite Pythium oligandrum which acts as a natural control agent ofmany soil-borne pathogens. The carbendazim fungicides, includingbenomyl, are also particularly toxic to earthworm numbers. Herbicides arenot believed to have a significant impact upon soil flora and fauna unlessapplied at very high rates (Conway and Pretty, 1991).
Beneficials The grain aphid (Sitobion avenae), a serious cereal crop pest in Europe has ahuge variety of natural enemies that help control its populations. Thesenatural enemies include linyphiid (money) spiders, carabid and staphylinidbeetles, parasitoids, syrphids (hoverflies) and coccinellids (ladybirds) all ofwhich are highly susceptible to the action of broad-spectrum insecticides.The loss of these natural predators can lead to the resurgence of pests whichin turn incurs extra costs for the farmer through increased pesticide use andreduced yields.
172 CHAPTER 7
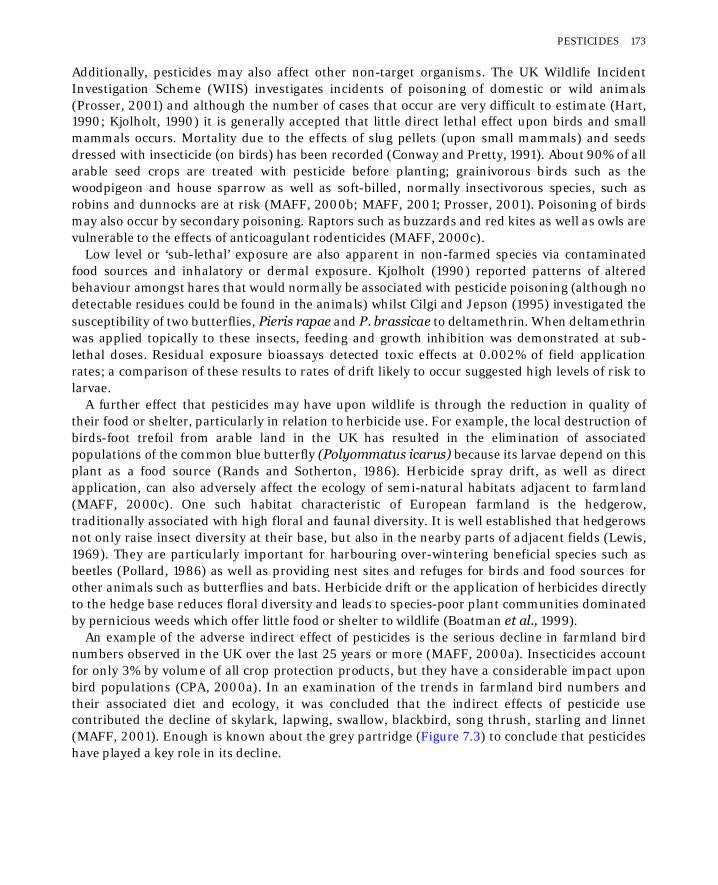
Additionally, pesticides may also affect other non-target organisms. The UK Wildlife IncidentInvestigation Scheme (WIIS) investigates incidents of poisoning of domestic or wild animals(Prosser, 2001) and although the number of cases that occur are very difficult to estimate (Hart,1990; Kjolholt, 1990) it is generally accepted that little direct lethal effect upon birds and smallmammals occurs. Mortality due to the effects of slug pellets (upon small mammals) and seedsdressed with insecticide (on birds) has been recorded (Conway and Pretty, 1991). About 90% of allarable seed crops are treated with pesticide before planting; grainivorous birds such as thewoodpigeon and house sparrow as well as soft-billed, normally insectivorous species, such asrobins and dunnocks are at risk (MAFF, 2000b; MAFF, 2001; Prosser, 2001). Poisoning of birdsmay also occur by secondary poisoning. Raptors such as buzzards and red kites as well as owls arevulnerable to the effects of anticoagulant rodenticides (MAFF, 2000c).
Low level or ‘sub-lethal’ exposure are also apparent in non-farmed species via contaminatedfood sources and inhalatory or dermal exposure. Kjolholt (1990) reported patterns of alteredbehaviour amongst hares that would normally be associated with pesticide poisoning (although nodetectable residues could be found in the animals) whilst Cilgi and Jepson (1995) investigated thesusceptibility of two butterflies, Pieris rapae and P. brassicae to deltamethrin. When deltamethrinwas applied topically to these insects, feeding and growth inhibition was demonstrated at sub-lethal doses. Residual exposure bioassays detected toxic effects at 0.002% of field applicationrates; a comparison of these results to rates of drift likely to occur suggested high levels of risk tolarvae.
A further effect that pesticides may have upon wildlife is through the reduction in quality oftheir food or shelter, particularly in relation to herbicide use. For example, the local destruction ofbirds-foot trefoil from arable land in the UK has resulted in the elimination of associatedpopulations of the common blue butterfly (Polyommatus icarus) because its larvae depend on thisplant as a food source (Rands and Sotherton, 1986). Herbicide spray drift, as well as directapplication, can also adversely affect the ecology of semi-natural habitats adjacent to farmland(MAFF, 2000c). One such habitat characteristic of European farmland is the hedgerow,traditionally associated with high floral and faunal diversity. It is well established that hedgerowsnot only raise insect diversity at their base, but also in the nearby parts of adjacent fields (Lewis,1969). They are particularly important for harbouring over-wintering beneficial species such asbeetles (Pollard, 1986) as well as providing nest sites and refuges for birds and food sources forother animals such as butterflies and bats. Herbicide drift or the application of herbicides directlyto the hedge base reduces floral diversity and leads to species-poor plant communities dominatedby pernicious weeds which offer little food or shelter to wildlife (Boatman et al., 1999).
An example of the adverse indirect effect of pesticides is the serious decline in farmland birdnumbers observed in the UK over the last 25 years or more (MAFF, 2000a). Insecticides accountfor only 3% by volume of all crop protection products, but they have a considerable impact uponbird populations (CPA, 2000a). In an examination of the trends in farmland bird numbers andtheir associated diet and ecology, it was concluded that the indirect effects of pesticide usecontributed the decline of skylark, lapwing, swallow, blackbird, song thrush, starling and linnet(MAFF, 2001). Enough is known about the grey partridge (Figure 7.3) to conclude that pesticideshave played a key role in its decline.
PESTICIDES 173
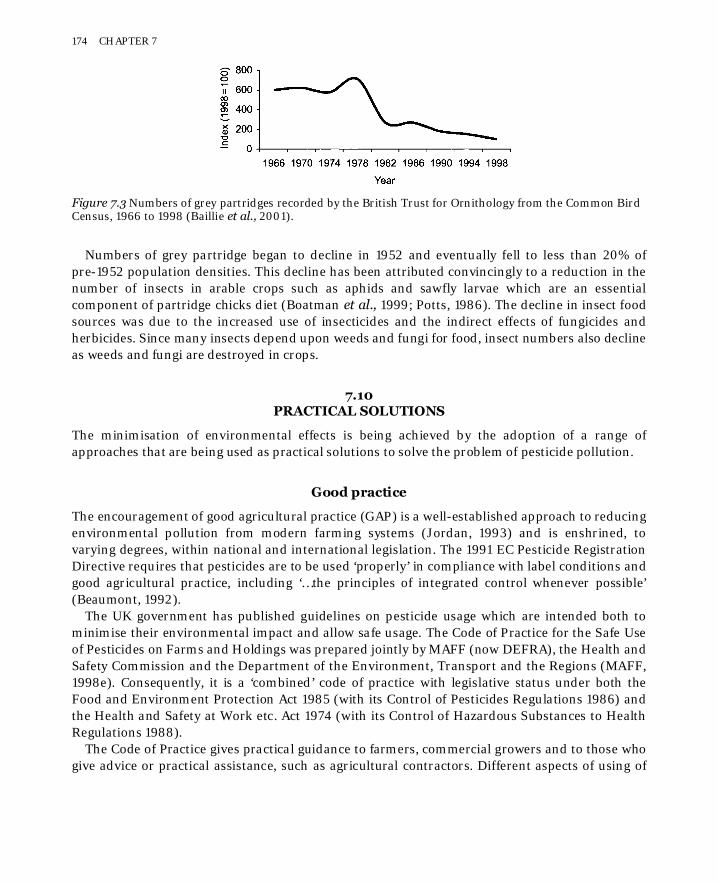
Numbers of grey partridge began to decline in 1952 and eventually fell to less than 20% ofpre-1952 population densities. This decline has been attributed convincingly to a reduction in thenumber of insects in arable crops such as aphids and sawfly larvae which are an essentialcomponent of partridge chicks diet (Boatman et al., 1999; Potts, 1986). The decline in insect foodsources was due to the increased use of insecticides and the indirect effects of fungicides andherbicides. Since many insects depend upon weeds and fungi for food, insect numbers also declineas weeds and fungi are destroyed in crops.
7.10PRACTICAL SOLUTIONS
The minimisation of environmental effects is being achieved by the adoption of a range ofapproaches that are being used as practical solutions to solve the problem of pesticide pollution.
Good practice
The encouragement of good agricultural practice (GAP) is a well-established approach to reducingenvironmental pollution from modern farming systems (Jordan, 1993) and is enshrined, tovarying degrees, within national and international legislation. The 1991 EC Pesticide RegistrationDirective requires that pesticides are to be used ‘properly’ in compliance with label conditions andgood agricultural practice, including ‘…the principles of integrated control whenever possible’(Beaumont, 1992).
The UK government has published guidelines on pesticide usage which are intended both tominimise their environmental impact and allow safe usage. The Code of Practice for the Safe Useof Pesticides on Farms and Holdings was prepared jointly by MAFF (now DEFRA), the Health andSafety Commission and the Department of the Environment, Transport and the Regions (MAFF,1998e). Consequently, it is a ‘combined’ code of practice with legislative status under both theFood and Environment Protection Act 1985 (with its Control of Pesticides Regulations 1986) andthe Health and Safety at Work etc. Act 1974 (with its Control of Hazardous Substances to HealthRegulations 1988).
The Code of Practice gives practical guidance to farmers, commercial growers and to those whogive advice or practical assistance, such as agricultural contractors. Different aspects of using of
Figure 7.3 Numbers of grey partridges recorded by the British Trust for Ornithology from the Common BirdCensus, 1966 to 1998 (Baillie et al., 2001).
174 CHAPTER 7

pesticides are dealt with according to the particular perspective of each user group in order toenable them to fulfil their legal obligations fully. Some of the main aspects of pesticide use relatingto farmers are outlined below.
User training
It is a legal requirement in the UK that anyone who uses pesticides on a farm must have ‘adequateinstruction, training and guidance in the safe, efficient and humane use of pesticides and becompetent for the duties, which they are called upon to perform’. Training is required for theproper use of equipment and safe working practices and this is widely seen as a key to limiting thepotentially adverse effects of pesticide residues on non-target organisms and environments (CPA,2000b). The training is specific to the type of equipment being used and also includes otheraspects including the preparation of the pesticide prior to application, the hazards and risksinvolved. Employers have responsibility for ensuring that operators are given ‘information,instruction, training and guidance…and know the risks to health created by exposure topesticides, and the precautions which should be taken’.
Planning and preparation
The Code of Practice emphasises that farmers should firstly be certain that a pesticide applicationis required. More than 90% of all crop protection treatments applied in the UK, such as pesticides,are now applied following advice from qualified agronomists (CPA, 2000b). Prior to application,other control measures should be considered such as biological control or integrated pestmanagement. Informed decision-making must be based on correctly identifying the pest, previousexperience of the problem, selection of an appropriate pesticide and ensuring effectiveapplication.
The product chosen must be appropriate, and the code states that:
• it should be approved for the intended use and situation;• it can be safely prepared and applied by the operators;• it can be applied in time to leave any required interval before harvest;• it presents the least risks to health while still achieving effective pest control;• it does not present undue risk to livestock and the environment, for example to bees and fish,
creatures that are susceptible to certain pesticides.
Pesticides may be applied in a number of ways and each method requires special precautions(Table 7.8). Prior to application, a series of checks must be conducted to ensure that: theapplication equipment is functioning correctly, the pesticide being used is correct; theenvironment is protected, emergency provision has been planned and that disposal of containers,etc. has been considered.
PESTICIDES 175
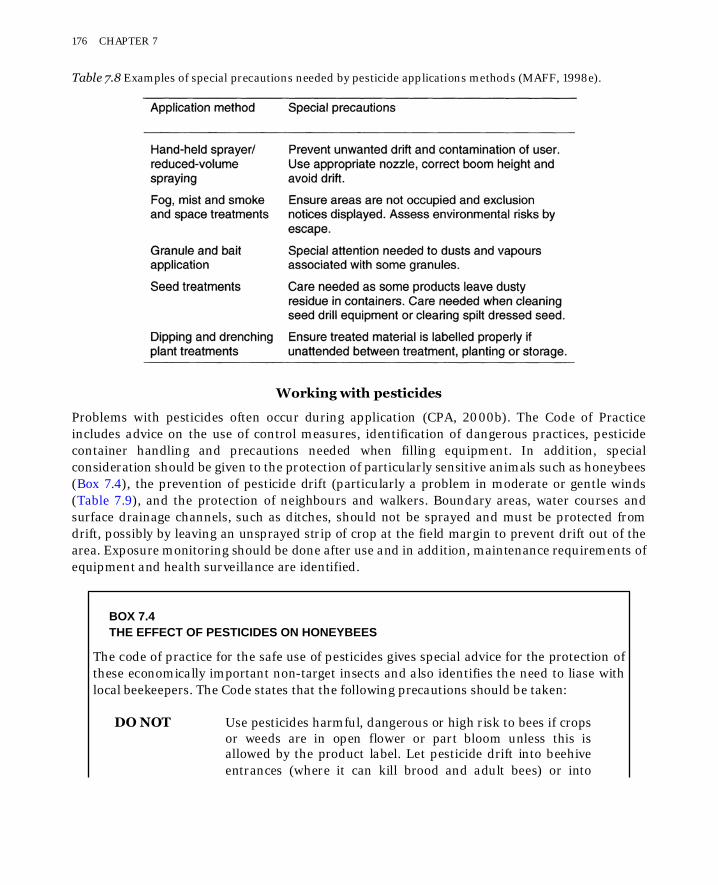
Working with pesticides
Problems with pesticides often occur during application (CPA, 2000b). The Code of Practiceincludes advice on the use of control measures, identification of dangerous practices, pesticidecontainer handling and precautions needed when filling equipment. In addition, specialconsideration should be given to the protection of particularly sensitive animals such as honeybees(Box 7.4), the prevention of pesticide drift (particularly a problem in moderate or gentle winds(Table 7.9), and the protection of neighbours and walkers. Boundary areas, water courses andsurface drainage channels, such as ditches, should not be sprayed and must be protected fromdrift, possibly by leaving an unsprayed strip of crop at the field margin to prevent drift out of thearea. Exposure monitoring should be done after use and in addition, maintenance requirements ofequipment and health surveillance are identified.
BOX 7.4THE EFFECT OF PESTICIDES ON HONEYBEES
The code of practice for the safe use of pesticides gives special advice for the protection ofthese economically important non-target insects and also identifies the need to liase withlocal beekeepers. The Code states that the following precautions should be taken:
DO NOT Use pesticides harmful, dangerous or high risk to bees if cropsor weeds are in open flower or part bloom unless this isallowed by the product label. Let pesticide drift into beehiveentrances (where it can kill brood and adult bees) or into
Table 7.8 Examples of special precautions needed by pesticide applications methods (MAFF, 1998e).
176 CHAPTER 7

hedgerows or fields where bees may be foraging. Spray unlessyou have to.
DO Follow closely the environmental protection instructions onthe product label, and the guidance in the Code. Use a productthat presents the least hazards to bees. Check for bees foragingor visiting plants. Spray in the evening when bees have stoppedflying, as this allows several hours for the pesticide to drybefore bees become active. If you must spray during the day,choose a cool cloudy one, or the early morning.
Table 7.9 Wind speed conditions and the suitability of pesticide spraying (MAFF, 1998e). Hightemperatures combined with low humidity reduce the size of spray droplets by evaporation, soincreasing the risk of spray drift.
Disposal of waste
The Code provides guidance on handling and disposal of waste pesticides and gives advice onwaste minimisation, tank washing, disposal of dilute and concentrate wastes, disposal ofcontainers, waste packaging and contaminated material. Waste minimisation is identified as a keyto reducing disposal problems.
Keeping records
The Code states that good records should be kept involving the storage, application and disposalof pesticides. The code identifies the importance of recording ‘accidental contamination of people,honey bees, other creatures, land, water or non-target crops’.
Other considerations
In addition to the Pesticide Code of Practice, the Codes of Good Agricultural Practice for theProtection of Soil, Water and Air (MAFF, 1998a,b,c,d) make the following recommendations:
PESTICIDES 177

Water This code gives advice on pesticide storage and specifies that stores should not be builtwhere there is a risk of polluting watercourses or groundwater. The guide refers thereader to Health and Safety Executive guidance note CS19 ‘Storage of ApprovedPesticides: Guidance for Farmers and other Professional Users’ (British StandardBS5502: Part 81) for advice on the construction of stores. If spillages occur, the codestates that quick action is required, including notification of the appropriate statutoryagency. Pesticides should never be applied when there could be drift onto watersunless specific approval is given. The code also gives guidance on disposal of wastepesticides (concentrated and dilute), disposal of containers and contaminatedmaterial.
Soil This code states that most pesticides are organic in nature and are broken down sothey have little long-term effect on soils. By law, these compounds must only beapplied at a rate and in the way specified in their authorisation. Some pesticides basedon inorganic materials, such as copper, may also cause contamination of land andspecial care is needed.
Air This code states that although burning of containers contaminated by pesticides may be permitted under certain circumstances, that ‘there are few circumstances where other practicable methods of disposal cannot be found’ and that these disposal methods are
recommended.
Other ad hoc initiatives have also been developed in the UK to encourage good practice tominimise the risk of pesticide pollution. For example, the Crop Protection Association runstraining programs on environmental/product information for those advising on pesticide usage(CPA, 2000b).
7.11NEW TECHNOLOGY
Reductions in pesticide usage and increases in cost effectiveness can be achieved throughrelatively simple changes in application technology. The basic components of a pesticide sprayerare a tank, pump, boom and nozzles. The pesticide in solution is pumped under pressure from thetank to the nozzles where it is commonly discharged as a fine atomised spray. The main problem withthe use of conventional ‘hydraulic’ nozzles is that they produce a wide range of droplet sizes (10–700µm); those droplets that are very small are particularly susceptible to drift, whereas those thatare very large are prone to bounce, or run off the crop surface.
Alternative designs of nozzle can overcome this problem by producing a narrower, moreoptimal, range of droplet sizes that increase the efficiency of application (Culpin, 1992; CPA,2000b). This reduces both the volume of pesticide required and the risk of pollution. Alternativetypes of nozzle which have been developed include:
Vibrated Jet Distribution Liquid is delivered at low pressure through holesin an oscillating cylinder operated by a tinyelectric motor. This produces a band of spray that
178 CHAPTER 7

is free of fine droplets and therefore notsusceptible to drift;
Controlled Droplet Application (CDA) Liquid drops onto a spinning disc and is forced tothe edge of the disc where it is atomised by aserrated surface. This produces a very consistentdroplet size that can be precisely controlled toreduce drift by varying flow rate and/or the speedof the spinning disc;
Electrostatic Nozzles Very low volumes of liquid are atomised to formtiny droplets that are electrostatically-charged andtherefore attracted directly to the crop surfacewithout risk of drift.
Inefficiency of nozzles caused through blockages or the usage of sub-standard equipment can alsocause environmental problems. This is being tackled by a range of agricultural contractor andmachinery associations promoting testing, validation and certification of equipment in order thatat least 30% of all eligible users have been checked by 2003 (CPA, 2000b).
The majority of modern tractor-mounted, trailed or self-propelled sprayers are also fitted withautomatic application rate control systems. These are based upon a computer that uses forwardspeed and fluid flow information from sensors to correct the rate of spray application andeliminate errors as the sprayer varies in forward speed. For example, over-application of pesticidedue to the sprayer losing forward speed on a slope can be avoided. Stafford and Miller (1993)describe attempts to use similar technology to ensure that herbicide is only applied to detectedweed patches in arable crops—a ‘precision agriculture’ approach. Precision farming aims toaccurately record and ‘map’ the variability of individual fields (Terry, 1995; Glendinning, 1999)thus facilitating the controlled application of agrochemicals.
Adjuvants
Another approach to improving the efficiency of application, and therefore environmental safety,of pesticide use is to add adjuvants, inert chemical substances that affect the physical properties ofa pesticide spray (Makepeace, 1996). There are many different types of adjuvant; some aresynthetic chemicals (e.g. non-ionic wetters), others are naturally-derived (e.g. emulsified rape oil).They may improve the environmental and agronomic behaviour of pesticides in a number ofdifferent ways:
• protecting against poor weather, especially cold damp conditions;• reducing losses due to rain washing the pesticide off its target;• reducing drift by increasing spray droplet size;• increasing retention of the pesticide on the plant;• assisting plant uptake of pesticides;• increasing chemical activity of the pesticide.
PESTICIDES 179

Codacide oil, for example, is an emulsified vegetable oil product that improves spray droplet sizeand therefore greatly reduces wastage due to drift. Consequently, significant financial savings(particularly with some herbicides) can be made whilst reducing environmental impact andwithout compromising effective weed control. Since codacide oil is vegetable-based, it is alsobiodegradable.
New formulations
One way of reducing the environmental impact of compounds used as pesticides is to make them‘safer’ by using those that are specific to their target pest and less persistent. Examples of specificpesticides include the systemic carbamate insecticide pirimicarb, which has relatively lowmammalian toxicity and high biochemical selectivity for aphids.
The approval process for the use of new pesticides is gained in the UK through the Control ofPesticides Regulations 1986 or the Plant Protection Products Regulations 1995 (which implementsDirective 91/414/EEC). The full evaluation of a new product an extensive and costly process whichall new products must be subjected to (CPA, 2000a).
7.12ALTERNATIVES TO SYNTHETIC PESTICIDES
Naturally derived pesticides
The use of natural plant-based pesticides is an alternative to those that are synthetically derived.Although compounds such as derris and pyrethrum display relatively low environmentalpersistence, they are broad-spectrum in action and may pose a risk to a number of organisms.Derris and pyrethrum are, for example, highly toxic to fish (Worthing, 1991). Conway and Pretty(1991) identify antifeedants that render plants unattractive and unpalatable to pests as promisingplant-based compounds. For example, chemical derivatives of neem (Azadirachta indica),fenugreek (Trigonella) and turmeric (Curcuma longa) are all strong repellents to herbivorousinsects.
Microbial pesticides
Equally promising in terms of selectivity and minimal environmental pollution are the microbialpesticides. Micro-organisms that might be used include bacteria, fungi, viruses and protozoa(Lisansky et al., 1991). With the development of new processing and formulation methods, plusthe use of genetic engineering techniques to enhance the pesticidal potency of individual micro-organisms, it seems likely that the availability and use of microbial pesticides will becomeincreasingly widespread. One of the most successful microbial pesticides to-date is Bacillusthuringiensis (Bt). This was discovered around 1901 and was first available commercially in the1930s for use against caterpillars (Lisansky et al., 1991). Other strains of Bt are also now availablefor use against flies and beetles. Bt is commonly formulated as a wettable powder for mixing withwater and application as a spray. To work effectively, bacteria from the formulated product must
180 CHAPTER 7

be ingested by the pest. Once inside the gut the bacteria produce a crystalline compoundcontaining a variety of toxic proteins called ‘ -endotoxins’ which cause paralysis and disruption offeeding.
Certain fungi are adapted to live on insects and hence show potential as microbial pesticides. Agood example is Verticillium lecanii, a pathogenic fungus that naturally infects aphids and scaleinsects in the tropics and sub-tropics (Lisansky et al., 1991). V. lecanii has been commercially-available in the UK since the early 1980s for the control of the glasshouse whitefly (Trialeurodesvaporariorum), a common and troublesome pest in protected crops.
V. lecanii spores are normally applied by the grower as a conventional high volume spray. Thespores germinate on the whitefly pests and infection occurs by the penetration of fungal growththrough the cuticle of the insect. Successful parasitism is observed as white ‘fluffy’ insect bodiessome 6–12 days after application of the spores. Under favourable conditions, more spores can beproduced and spread from these infected insects leading to the suppression of the pest populationfor several weeks (Helyer and Richardson, 1991). The main disadvantage of V. lecanii is the highdegree of skill and environmental control required ensuring its use is fully effective. In particular,the fungus requires a sustained period of high relative humidity after spore application to ensuresuccessful germination, infection and further spore spread. Until fungi have been developed whichhave greater tolerance to adverse environmental conditions and display more rapid infectioncycles, it is likely that their full potential as microbial pesticides, at least in temperate agriculturalsystems, will remain limited (Lisansky et al., 1991).
Non-chemical weed control
Prior to the widespread availability and use of herbicides, an important strategy for controllingweed populations was the use of crop rotations to produce a diverse agronomic environment. Theadoption of different sowing dates, crop growth periods and cultivation operations reduced thelikelihood of weeds such as wild oats and blackgrass from establishing and becoming anagronomic problem (Lampkin, 1990). Furthermore, timing of cultivation can have a considerablebearing on diseases such as barley yellow dwarf virus, which can be eliminated if drilling isdelayed until early October (MAFF, 1999). Whilst the reintroduction of a traditional rotationalcropping system may not be viable on all farms, other non-chemical weed control techniques maybe adopted. Alternative husbandry practices include cultivation, increased sowing rates and directthermal and mechanical intervention.
Appropriate cultivation Prior to the establishment of a crop can play a useful preventativerole in weed control (MAFF, 1999). Crop sequences that alternatecereals with broad-leaved crops allow grass weeds to be targeted inthe broad-leaved crops and broad-leaved weeds in the cereals(MAFF, 1999). This can be undertaken in combination with thepreparation of a series of ‘stale’ or ‘false’ seedbeds before cropestablishment is due. Weed seeds brought to the surface duringcultivation are encouraged to germinate and grow in the seedbedfor about 10 days before being destroyed by further cultivation.
PESTICIDES 181

Sufficient time between cultivations to allow weed germination isrequired for this approach to be effective.
Night-time cultivation May be adopted to reduce weed germination. The techniqueexploits the fact that many weed seeds are photoblastic, requiringexposure to daylight to induce germination. It is possible tominimise the daylight exposure of those dormant seeds burieddeeply below the soil surface by performing cultivation operationsin darkness or at sufficiently low light levels. On-farm trials inGermany showed a marked reduction in weed coverage from 80%to 2% when crops were sown at night rather than at mid-day(Hartmann and Nezadal, 1990). Those weeds showing dramaticreduction in population when switching from daytime to night-timecultivation included wild chamomile (Matricaria chamomilla),small toadflax (Chaenarrhinum minus), cleavers (Galiumaparine), chickweed (Stellaria media) and fat hen (Chenopodiumalbum). Despite attracting considerable interest, the use of night-time cultivations for weed control have not been successfullyapplied in the UK (Samuel, 1992).
Thermal intervention There have been many advances in non-chemical weed controlover the last 15–20 years, both Parish (1990) and Lampkin(1990) provide useful reviews of the range of equipment nowavailable for controlling weeds by direct thermal (andmechanical) intervention in cereals and row crops. Most thermalweeders are tractor-mounted and use liquefied petroleum gas(LPG) as fuel. The weeders available are becoming increasinglysophisticated and can be used for pre-or post-emergence weedcontrol. The principle of thermal weed control is not to burn offthe weeds, but to apply sufficient heat to severely damage theplant cells so that the weed will wither and die. This generallyinvolves raising the plant tissue to a temperature of 100°C for 0.1seconds. Two basic designs of flame weeder are available: the‘flame contact’ type and the ‘infra-red type’ involving a radiantsurface. The ‘flame contact’ type is cheaper to buy and can bemore effective than the ‘infra-red’ type, but is less economical onfuel. Crops such as carrots, which have a long germination periodduring which weed seedlings emerge before the crop can be veryeffectively treated by pre-emergence thermal weeding althoughthe timing of the thermal treatment is crucial for maximum weedcontrol and minimum crop damage. Other crops will, at specificgrowth stages, tolerate post-emergence thermal treatmentalthough crop protectors and shields may be needed.
Mechanical intervention Inter-row cultivation is a common form of mechanical weedcontrol in row crops and there are a number of designs of tractor-mounted cultivators available. These vary from traditional spring-
182 CHAPTER 7

tine cultivators to novel PTO-powered brush-type machines.Mechanical weed control using a comb-type harrow can also bevery effective in (non-row) cereal crops provided that the crop issufficiently well-established to avoid damage whilst onlyharbouring immature weeds which can be easily disturbed.
Non-chemical pest control
Crop management practices, such as the use of resistant varieties or varietal mixes are well-established for the cultural control of insects and diseases. Many of these techniques haveremained integrated within modern pest control strategies, although their significance declined asthe cost-effectiveness of pesticides encouraged farmers to rely upon chemical control. Interest inthese strategies is now increasing as balanced approaches to pest and disease controlencompassing a broad range of control measures are sought.
An example of a move to integrate these methods is in carrot crops in the UK. The production ofhigh quality, marketable carrots in the UK is dependent upon the effective control of the carrot fly(Psila rosae), the larvae of which frequently cause serious damage to carrot crops by burrowinginto the developing roots. The use of OP insecticides to control carrot fly has increasedsignificantly (Box 7.3). A number of cultural control methods to facilitate the production of highquality carrots with minimal use of insecticides are therefore under development. These include(PSD, 1995):
Resistant varieties Varieties with some resistance to carrot fly have been developed andcan reduce the level of damage by up to 50%, but will not prevent theoccurrence of significant and commercially unacceptable damage.
Crop covers Floating film crop covers can be used to exclude a number of aerialpests, including carrot fly. However, using such covers is costly, theirdurability can be questionable, they may reduce yield and are difficultto integrate with other chemical controls.
Spatial separation The carrot fly is not a strong flier and so the risk and intensity ofdamage can be reduced by minimising their ‘carry-over’ from one fieldto another. Main crop carrots especially (because they remain in thefield for longer) should be sited at least 2 km from both previouslyinfested fields and early carrot crops grown in the same season,although this may not always be practicable.
Harvesting strategy With the demand for very high quality carrots in the UK, currentharvesting practice is to leave main crop carrots in the ground duringwinter in order to avoid the risk of blemishes and skin ‘silvering’ thatoccurs when lifted early and put into cold store. However, since themajority of late generation carrot fly damage occurs after October, thispractice of ‘field storage’ contributes to the need for high levels ofchemical control to reduce damage to commercially acceptable levels.
PESTICIDES 183

Lifting carrots in mid to late October can significantly reduce the risk of carrot fly damage andtherefore enable a reduction in pesticide use. However, storage costs are greatly increased andthere remains opposition to the practice from the supermarkets. A further option being explored isthe development of an integrated crop management strategy for carrots which aims to balancemodifications in harvesting practice with continued pesticide application. A leading example ofthis is the NFU-Retailer Integrated Crop Management Protocol for Fresh Carrots developed jointlyin the UK by the National Farmers Union, representative supermarkets and members of theCarrot Marketing Board.
Agricultural crop pests are attacked by a wide range of naturally-occurring enemies, includingparasitic wasps and flies, ladybirds, spiders and hoverflies, all of which have potential forexploitation as alternatives to pesticide use (Box 7.5). The aim of pest control using naturalenemies is not to eradicate the pest population, but to reduce it to an acceptable and economicallyviable level and maintain it there. By comparison with pesticide use, the pest population may belarger and it may fluctuate more, but control tends to be cheaper and more durable (Conway andPretty, 1991).
BOX 7.5COMMON PESTS IN HORTICULTURE AND THEIR BIOLOGICAL CONTROL AGENTS
WhiteflyWhitefly (Trialeurodes vaporariorum) is a familiar pest attacking a wide range of protected crops.
The adult is 1–2 mm long, winged and white/creamy yellow in colour (resembling a small whitemoth). The adult whitefly are usually found at rest under leaves, where the females lay their eggs. Theeggs hatch to produce mobile ‘crawlers’, which attach themselves to the leaf for feeding beforedeveloping into static, white, waxy ‘scales’ (the main feeding and growing stage). The ‘scales’ pupateand the emerging adults move towards to the top of the plant to feed on the younger, soft foliage andto lay eggs. Low levels of infestation may not produce any visible signs of damage. At high levelsleaves and stems will be covered with ‘scales’. These draw sap from the plant, reducing crop vigourand distorting young growing tips. They also secrete minute droplets of sugary ‘honeydew’, whichencourages the growth of sooty moulds leading to reduced photosynthetic ability and disfiguredproduce. Additionally, both the adults and the ‘scales’ are potential virus carriers. Whitefly can beeffectively controlled by Encarsia formosa, the most widely used biological control agent inhorticulture. Encarsia is a parasitic wasp introduced to the crop in the form of parasitised whitefly‘scales’ which are commonly supplied loose with a dispenser, on fresh leaf material or on cards.
Red spider miteThe red spider mite (Tetranychus urticae) is one of the most damaging pests that attack protected
crops. Only the over-wintering adult female is actually red, the summer form is green or yellow-brown. The mites hibernate in cracks and crevices of the greenhouse or crop debris, and usuallyemerge in spring as the temperature and day length increase. Eggs are laid under the leaf and hatchto reveal white, 6-legged larvae. Feeding spider mites cause a fine, yellowish speckling on upper leafsurfaces (initially at the base of the plant) and, if left unchecked, will cause leaves to shrivel and mayeventually kill the plant. The mites also spin silken webs and at high levels of mite infestation these maycover much of the plant, stunting new growth. Red spider mite can be controlled with a predatorymite, Phytoseiulus persimilis, which has been successfully used in the greenhouse industry since theearly 1960s.
184 CHAPTER 7

The use of natural enemies for pest control is usually referred to as biological control. There isan important distinction between ‘classical’ biological control involving the direct release of newor exotic natural enemies into the crop, and the encouragement of existing natural enemypopulations by enhancing the environment in which they live.
Stimulated principally by problems of pesticide resistance among a number of major pests,classical biological control methods have been used very successfully in UK glasshouse crops, suchas tomatoes and cucumbers, for some 70 years. Consequently, there are now a large number ofnatural pest predators commercially available for use in protected cropping. The best knownexamples (Box 7.5) are the whitefly parasite (Encarsia formosa) and the spider mite predator(Phytoseiulus persimilis) which are used on up to 50% of protected tomato crops and up to 80%of protected cucumber crops in the UK (Helyer and Richardson, 1991).
Many other natural enemies for controlling pests of protected crops have now been evaluatedand are in commercial mass production, including an aphid predator (Aphidoletes aphidimyza),mealybug predator (Cryptolaemus montrouzieri) and a voracious polyphagous predator, thegreen lacewing (Chrysoperla earned). Helyer and Richardson (1991) summarised the advantagesof biological control in the glasshouse, compared to purely chemical control, as environmental,increased yield and quality and minimisation of resistance. The advantage of releasing naturalenemies into a glasshouse is that they are contained in a favourable environment which can easilybe controlled to ensure that the introduced organisms survive and thrive to have the desired effectupon the pest population.
Applying classical biological control methods to outdoor field-scale crops is not so easy,although there have been some notable successes. Trichogramma, for example, has been used tocontrol outbreaks of the European corn borer, Ostrinia nubilalis on maize and has been usedsuccessfully in France, Switzerland and Germany. The parasitoids are usually reared on the eggsof the flour moth (Ephestia spp.) and released in high numbers; up to 600,000 parasites ha−1
three to four times during the egg-laying period of the corn borer. Release is determined frompheromone catches of adult moths and from surveys to monitor the appearance of corn borer eggsin the field (Burn, 1987).
An alternative approach to exploiting natural enemies for pest control in field-scale agriculturalcrops is to enhance the environment in which they live. In particular, populations of naturalenemies of a given agroecosystem can be encouraged by removing adverse factors (e.g. broad-spectrum insecticides) as much as possible and increasing the diversity of the agroecosystem andits neighbouring semi-natural environment by fostering crops and wild plants that favour naturalenemies.
There are many examples of the practical application of these principles to field crops and twoare given below which relate specifically to the control of aphids. Aphids are important pests on awide variety of agricultural and horticultural crops, causing both direct damage through theirfeeding and indirect damage by spreading virus diseases. However, although aphids reproduce ata very high rate their numbers are often checked by an array of natural enemies. These fall intotwo main groups, general (polyphagous) predators and aphid specific predators, both of whichhave an important role to play in aphid control. Each group also has its own requirements interms of a suitable environment and an understanding of these requirements can be used toenhance predator numbers via the use of specific management practices and strategies.
PESTICIDES 185

Polyphagous predators, including ground and rove beetles (e.g. Agonum dorsale, Tachyporushypnorum and Demetrias atricapillus) and linyphiid spiders, are of particular importance for aphidcontrol early in the season as they are already in the crop living on other sources of food when theaphids arrive. They therefore have the potential to check an invading aphid population before itbecomes excessive. A number of the polyphagous predators overwinter in field boundaries and inspring migrate from the hedges and field margins into the crop to begin searching for food. Althoughsome have wings, most polyphagous predators do not and may take several weeks to penetrateinto the centre of large fields. During this time, aphid levels in the crop may be increasing to thelevel of an outbreak. Researchers in the UK have investigated providing suitable overwinteringsites in the centre of fields through the use of mid-field ridges or ‘beetle banks’ (Box 7.6), in anattempt to encourage beetles and spiders to remain and be ready for rapid dispersal in the spring(Harwood et al., 1992).
BOX 7.6ESTABLISHING AND LOOKING AFTER MID-FIELD RIDGES
Mid-field ridges, or ‘beetle banks’ are a simple way of encouraging predatory insects toassist aphid control and the rationalisation of insecticide use. Advice on their creation andmaintenance is provided by The Game Conservancy Trust (1992). Each ridge is a bank ofearth approximately 0.4m high and 1.5–2.0 m wide. It is created during normalcultivations by the careful two-directional ploughing of opposing furrows. The number ofridges formed depends upon the size of the field and the quality of its existing boundaries.A 20-hectare field which has established boundaries with raised underbanks and anabundance of dense tussocky grasses, such as cocksfoot (Dactylis glomerata) andYorkshire fog (Holcus lanatus), will probably only need one ridge across its centre. Asimilar sized field with poor boundaries, no underbank and few tussocky grasses mayrequire two ridges dividing the field into three equal parts. Once established, the ridgeshould be drilled in the spring with a 50:50 mix of Yorkshire fog and cocksfoot at a rate of3–4 gm−2. As the grasses grow they should exclude most weeds, but may themselves besusceptible to herbicides sprayed on the adjacent crop. A 1-m wide strip between the ridgeand the crop should minimise this problem. During the summer the ridges can be mown or‘topped’ to prevent excessive growth and encourage the formation of tussocks. After 2 or 3years, the ridges should harbour sufficient spiders and beetles to have significant effectupon crop pests. If farming practices change, the ridges can be removed and re-createdelsewhere.
Aphid specific predators, such as hoverflies, ladybirds and lacewings, will not enter the cropuntil there is food for them. However, once in the crop they are more efficient than polyphagouspredators at controlling aphid numbers. Some of the most important aphid specific predators aresmall parasitic wasps (Powell, 1996). There are around 5500 species of parasitic wasp in the UK,of which approximately 75 are aphid specific. These can have a big impact upon aphid populations,but their activity must again be synchronised with the increase in aphid numbes early in thegrowing season. Unfortunately, this early season synchronisation does not always happen as the
186 CHAPTER 7

wasps are dispersed to a range of semi-natural habitats for over-wintering and may not return tothe crop in sufficient time to curb an aphid attack. This delay between aphid infestation and wasparrival can be reduced by encouraging the wasps to overwinter adjacent to the crop and byensuring conditions are favourable for their activity in the spring (Box 7.7).
BOX 7.7ENCOURAGING PARASITIC WASPS FOR APHID CONTROL
Powell (1996) suggests the following guidelines for encouraging parasitic wasps:Leave some areas of natural vegetation uncutParasitic wasps rely upon areas of natural and semi-natural as over-wintering sites and these
should be maintained on the farm as much as possible (e.g. areas of permanent grassland, either inpastures or field margins).
Maintain a diversity of habitatsWhen the aphids disappear from crop fields in late summer, parasitic wasps need to find
alternative aphid hosts. A range of aphids can be maintained on the farm in order to support thewasps ‘out-of-season’ (especially early spring and autumn) by creating and/or encouraging a varietyof crop and semi-natural habitats.
Avoid insecticide sprays whenever possible, especially early in the springParasitic wasps are both killed and repelled by insecticides. Even the use of a selective aphicide will
also have a detrimental effect upon wasp populations because of: (a) the loss of potential hosts; and(b) the destruction of parasite larvae already developing inside aphids.
REFERENCES
Aislabie, J.M., Richards, N.K. and Boul, H. (1997) Microbial degradation of DDT and its residues—a review.New Zealand Journal of Agricultural Research 40, 269–282.
Alloway, B.J. (1995) Heavy Metals in Soils. 2nd Edition. Blackie Academic and Professional, London.Alloway, B.J. and Ayres, D. (1993) Chemical Principles of Environmental Pollution. Blackie Academic and
Professional, London.Baillie, S.R., Crick, H.Q.P., Balmer, D.E., Bashford, R.I., Beaven, L.P., Freeman, S.N., Marchant, J.H., Noble,
D.G., Raven, M.J., Siriwardena, G.M., Thewlis, R. and Wernham, C.V. (2001) Breeding Birds in theWider Countryside: their conservation status 2000. BTO Research Report No. 252. BTO, Thetford. URL:http://www.bto.org/birdtrends
Baird, C. (1995) Environmental Chemistry. W.H.Freeman, New York.Barber, S.A. (1995) Soil Nutrient Bioavailability: a Mechanistic Approach. 2nd Edition. Wiley, New York.Bentabol, A. and Jodral, M. (1995) Occurrence of organochlorine agrochemical residues in Spanish cheeses.
Pesticide Science 44, 177–182.Beaumont, P. (1992) Pesticides, Europe and the environment: a review. Pesticide News 16, 12–15.Bigler, F., Forrer, H.R. and Fried, P.M. (1992) Integrated crop protection and biological controls in cereals in
Western Europe. In: Biological Control and Integrated Crop Protection: Towards Environmentally-Safer Agriculture (Eds J.C.van Lanteren, A.K.Minks and O.M.B.de Ponti), Pudoc Scientific Publishers,Wageningen, pp. 95–116.
Boatman, N., Stoate, C., Gooch, R., Rio Carvalho, C., Borralha, R., de Snoo, G. and Eden, P. (1999) Theenvironmental impact of arable crop production in the European Union: Practical options for
PESTICIDES 187

improvement. Allerton Research and Education Trust, UK, Study Contract B4– 3040/98/000703/MAR/D1.
Brown, C.D., Hodgkinson, R.A., Rose, D.A., Syers, J.K. and Wilcockson, S.J. (1995) Movement of pesticidesto surface waters from a heavy clay soil. Pesticide Science 43, 131–140.
Burn, A.J. (1987) Cereal Crops. In: Integrated Pest Management (Eds A.J.Burn, T.H.Coaker and P.J.Jepson). Academic Press, London, pp. 89–112.
Carson, R. (1985) Silent Spring. Penguin, Harmondsworth (first published in 1962 by Houghton Mifflin).Cilgi, T. and Jepson, P.C. (1995) The risks posed by deltamethrin drift to hedgerow butterflies.
Environmental Pollution 87, 1–9.Cleemann, M., Poulsen, M.E. and Hilbert, G. (1995) Deposition of lindane in Denmark. Chemosphere 30,
2039–2049.Conway, G.R. and Pretty, J.N. (1991) Unwelcome Harvest: Agriculture and Pollution. Earthscan, London.CPA (2000a) Crop Protection Association Handbook 2000. Crop Protection Association, Peterborough.CPA (2000b) Minimising the environmental impacts of crop protection chemicals. Revised proposals. Crop
Protection Association, Peterborough.Cremlyn, R. (1979) Pesticides: Preparation and Mode of Action. John Wiley and Sons, Chichester.Culpin, C. (1992) Farm Machinery. Blackwell Scientific Publications, Oxford.DoE/MAFF (1995) Rural England: A nation committed to a living countryside (Cm 3016). HMSO, London.Environment Agency (2000) Pesticides 1998. A summary of monitoring of the aquatic environment in
England and Wales. Environment Agency, Bristol.Eurostat (1998) Derived from data in crop protection: Half yearly statistics. European Union, Brussels.Filser, J., Fromm, H., Nagel, R.F. and Winter, K. (1995) Effects of previous intensive agricultural
management on micro-organisms and the biodiversity of soil fauna . Plant and Soil 170, 123–129.Funari, E., Bottoni, P. and Giuliano, G. (1991) Groundwater contamination by herbicides—processes and
evaluation criteria. In: Chemistry, Agriculture and the Environment (Ed. M.L.Richardson). RoyalSociety of Chemistry, Cambridge, pp. 235–254.
Game Conservancy (1992) Helping nature to control pests (information leaflet sponsored by Rhône-Poulenc). The Game Conservancy, Fordingbridge.
Gerstler, Z. (1991) Behaviour of organic agrochemicals in irrigated soils. In: Chemistry, Agriculture and theEnvironment (Ed. M.L.Richardson). Royal Society of Chemistry, Cambridge, pp. 332–369.
Glendinning, J.S. (1999) Australian Soil Fertility Manual. CSIRO Publishing, Collingwood, Australia.Graham-Bryce, I.J. (1987) Chemical Methods. In: Integrated Pest Management (Eds A.J.Burn, T.H. Coaker,
P.J.Jepson). Academic Press, London, pp. 113–160.Harrad, S.J. (1996) The environmental behaviour of toxic organic chemicals. In: Pollution, Causes, Effects
and Control (Ed. R.M.Harrison, 3rd Edition). The Royal Society of Chemistry, Cambridge, pp. 367–392.Hart, A.D.M. (1990) The assessment of pesticide hazards to birds: the problem of variable effects. Ibis 132,
pp. 192–204.Hartmann, K.M. and Nezadal, W. (1990) Photocontrol of weeds without herbicides. Naturwissenschaften
77, 158–163.Harwood, R., Hickman, J., MacLeod, A. and Rothery, F. (1992) Biological control in the field: a new
approach. New Farmer & Grower 35, 17–19.Hassall, K.A. (1990) The Biochemistry and Uses of Pesticides. (2nd Edition). Macmillan Press, London.Helling, B., Reinecke, S.A. and Reinecke, A.J. (2000) Effects of the fungicide copper oxychloride on the
growth and reproduction of Eisena fetida (Oligochaeta). Ecotoxocology and Environmental Safety 46,108–116.
Helweg, A. (1994) Threats to water quality from pesticides—case histories from Denmark. Pesticide OutlookOctober, 12–18.
Helyer, N. and Richardson, P. (1991) Biological control—protected crops. Grower Digest 11, GrowerPublications, London.
188 CHAPTER 7

Herrling, B., Alesi, E.J., Bott-Breuning, G. and Diekmann (1993) In-situ aquifer remediation from volatile orbiodegradable organic compounds, pesticides, and nitrate using UVB technique. In: Contaminated Soil’93 (Eds F.Arendt, G.J.Annokkee, R.Bosman, R. and W.J.van den Brink). Kluwer Academic Publishers,Netherlands, pp. 1083–1092.
Hurst, P., Beaumont, P., Jorgensen, C.E. and Winther, S. (1992) Pesticide Reduction Programmes inDenmark the Netherlands and Sweden. World Wide Fund for Nature International, Gland, Switzerland.
Indeherberg, M.B.M., De Vocht, A.J.P. and Van Gestel, C.A.M. (1998) Biological interactions: Effects on andthe use of soil invertebrates in relation to soil contamination and in situ soil reclamation. In: Metal-Contaminated Soils: In situ Inactivation and Phytorestoration (Eds J.Vangronsveld and S.D.Cunningham). Springer-Verlag and R.G.Landes Company, Berlin, pp. 93–119.
Jordan, V.W.L. (1993) Scientific basis for codes of good agricultural practice. Report No. EUR 14957,Commission of the European Communities, Luxembourg.
Kjolholt, J. (1990) Distribution of pesticides and potential exposure of non-target organism followingapplication . In: Pesticide Effects on Terrestrial Wildlife (Eds L.Somerville and C.Walker). Taylor &Francis, London, pp. 33–64.
Lampkin, N. (1990) Organic Farming. Farming Press, Ipswich.Lewis, T. (1969) The diversity of the insect fauna in a hedgerow and neighbouring fields. Journal of Applied
Ecology 6, 453–458.Lisansky, S., Robinson, A. and Coombs, J. (1991) The UK Green Growers’ Guide. CPL Scientific Press,
Newbury.Loch, J.P.G. (1991) Effect of soil type on pesticide threat to soil/groundwater environment. In: Chemistry,
Agriculture and the Environment (Ed. M.L.Richardson). Royal Society of Chemistry, Cambridge, pp.291–307.
MAFF (1998a) Aerial Applications. Pesticide usage survey report No 148, Ministry of Agriculture, Fisheriesand Food, London.
MAFF (1998b) Code of Good Agricultural Practice for the Protection of Air. Revised 1998. Ministry ofAgriculture, Fisheries and Foods, London.
MAFF (1998c) Code of Good Agricultural Practice for the Protection of Soil. Revised 1998. Ministry ofAgriculture, Fisheries and Food, London.
MAFF (1998d) Code of Good Agricultural Practice for the Protection of Water. Revised 1998. Ministry ofAgriculture, Fisheries and Food, London.
MAFF (1998e) Code of Practice for the Safe use of Pesticides on Farms and Holdings. Ministry ofAgriculture, Fisheries and Food, London, PB 3528.
MAFF (1999) Integrated crop management. Environmental R+D Newsletter, Ministry of Agriculture,Fisheries and Foods, London, No. 5, p. 10–11.
MAFF (2000a) Farmland bird populations in decline? Environmental R+D Newsletter, Ministry ofAgriculture, Fisheries and Foods, London, No. 6, p. 3.
MAFF (2000b) Pesticides—how big a risk? Environmental R+D Newsletter, Ministry of Agriculture,Fisheries and Foods, London, No. 6, p. 11.
MAFF (2000c) Pesticide poisoning of animals 1999: Investigations of suspected incidents in the UnitedKingdom. Ministry of Agriculture, Fisheries and Foods, London, PB 5333.
MAFF (2000d) Towards Sustainable Agriculture: pilot set of indicators. Ministry of Agriculture, Fisheriesand Food, London, PB 4583.
MAFF (2001) Birds potentially at risk from seed-pesticides. Environmental R+D Newsletter, Ministry ofAgriculture, Fisheries and Foods, London, No. 7, p. 3.
Makepeace, R. (1996) Sticking up for adjuvants, Farming and Conservation April issue, pp. 26–27.Marshall, T., Holmes, J. and Rose, C. (1999) Soil Physics. 3rd Edition, Cambridge University Press, New
York.
PESTICIDES 189
Mazaud, F. (1997) Producing enough food is only half the battle. Group for Assistance on Systems Relatingto Grain Harvest. Newsletter No. 20, pp. 4–7.
Megharaj, M., Kookana, R.S. and Naidu, R. (2000) The effect of long-term pesticide contamination on soilbiota and their activities. In: Soil 2000: New Horizons for a New Century. Australian and New ZealandSecond Joint Soils Conference Volume 2: Oral Papers (Eds J.A.Adams and A.K.Metherell). 3–8 December2000, Lincoln University, New Zealand Society of Soil Science, pp. 205–206.
Merry, R.H., Tiller, K.G. and Alston, A.M. (1986) The effects of soil contamination with copper, lead andarsenic on the growth and composition of plants. Plant and Soil 95, 255–269.
Miller, P.C.H. (1991) Agricultural sprayer design to minimize environmental contamination. In: Chemistry,Agriculture and the Environment (Ed. M.L.Richardson). Royal Society of Chemistry, Cambridge, pp.308–331.
Munz, C. and Bachmann, A. (1993) Documentation of an environmentally-sound soil remediation. In:Contaminated Soil ‘93 (Eds F.Arendt, G.J.Annokkee, R.Bosman and W.J.van den Brink). KluwerAcademic Publishers, Netherlands, pp. 1119–1126.
NCC (1990) Nature Conservation and Agricultural Change. Report No. 25, Nature Conservancy Council,Peterborough.
Oliver, D.P., Kookana, R.S. and Salama, R. (2000) Effect of land use on sorption behaviour of fenamphos andits metabolites in soils. In: Soil 2000: New Horizons for a New Century. Australian and New ZealandSecond Joint Soils Conference Volume 2: Oral Papers (Eds J.A.Adams and A.K.Metherell). 3–8 December2000, Lincoln University, New Zealand Society of Soil Science, pp. 221–222.
Pap, L. and Farkas, R. (1994) Monitoring resistance of insecticides in housefly (Musca domestica)populations in Hungary . Pesticide Science 40, 245–258.
Parish, S. (1990) A review of non-chemical weed control techniques. Biological Agriculture and Horticulture7, 117–137.
Pedersen, H.J., Kudsk, P. and Helweg, A. (1995) Adsorption and ED50 values of five soil—applied herbicides.Pesticide Science 44, 131–136.
Pestemer, W. and Krasel, G. (1992) Loss of precipitation from plant and soil by volatilization. In: Pests andDiseases, Proceedings of the Brighton Crop Protection Conference, pp. 459–468.
Pimentel, D. (1995) Amounts of pesticides reaching target pests: environmental impacts and ethics. Journalof Agricultural and Environmental Ethics 8, 17–29.
Pollard, E. (1986) Hedges III—The effect of the removal of the bottom flora of a hawthorn hedge on theCarabidae of the hedge bottom, Journal of Applied Ecology 5, 125–139.
Potts, G.R. (1986) The Partridge: Pesticides, Predation and Conservation. Collins, London.Powell, W. (1996) Aphid attack—working on the insides. Farming and Conservation April issue, 12–14.Prosser, P. (2001) Potential exposure of birds to treated seed. Final Milestone Report, Project No. PN0907.
Central Science Laboratory, York.PSD (1995) Consumer Risk Assessment of Insecticide Residues in Carrots. Pesticides Safety Directorate,
York.Raju, G.S., Khan, S.U. and Millette, J.A. (1993) Pollution potential of selected pesticides in soils.
Chemosphere 26, 1429–1442.Rands, M.R.W. and Sotherton, N.W. (1986) Pesticide use on cereal crops and in the abundance of butterflies
on arable farmland in England. Biology of Conservation 36, 71–82.RCEP (1979) Agriculture and Pollution. Seventh Report of the Royal Commission on Environmental
Pollution (Cmnd 7644). HMSO, London.RCEP (1996) Sustainable Use of Soil. Nineteenth Report of the Royal Commission on Environmental
Pollution (Cm 3165). HMSO, London.Rush, T. (1994) Herbicide-resistant wild oats discovered. Arable Farming September issue, 34–38.Samuel, A. (1992) UK experiences of ‘weed control in the dark’. New Farmer and Grower 36, Autumn issue,
20–21.
190 CHAPTER 7

Siebers, J., Gottschild, D. and Nolting, H.G. (1994) Pesticides in precipitation in northern Germany.Chemosphere 28, 1559–1570.
Stafford, J.V. and Miller, P.C.H. (1993) Spatially-selective application of herbicide to cereal crops. Computersand Electronics in Agriculture 9, 217–229.
Stehmann, C. and de Waard, M.A. (1995) Relationships between chemical structure and biological activity oftriazole fungicides against Botrytis cinerea. Pesticide Science 44, 183–195.
Svec, M., Miklovicova, M., Sykora, M. and Krippel, E. (1995) Fungicide sensitivity of populations of wheatpowdery mildew (Erysiphe graminis f.sp. tritici) in Central Europe in 1993. Pesticide Science 43, 47–52.
Terry, J. (1995) Precision farming—explaining the environmental benefits. Farming and Conservation Aprilissue, 8–9.
Turnbull, A. (1996) Chlorinated Pesticides. In: Issues in Environmental Science and Technology 6:Chlorinated Organic Micropollutants (Eds R.E.Hester and R.M.Harrison). The Royal Society ofChemistry, Letchworth, pp. 113–135.
van Emden, H.F. (1992) Pest Control. Cambridge University Press, Cambridge.Van Zwieten, L., Ahmad, N., Marolt, R., Ayres, M. and Morris, S. (2001) Determination of DDT and its
metabolites in cattle dip soil available in aqueous phase after remediation. Journal of EnvironmentalScience and Health B36, 501–516.
Warner, M.E. (1995) An Environmental Risk Index to Evaluate Pesticide Programs in Crop Budgets.Cornell University, New York.
Wentz, C.A. (1989) Hazardous Waste Management. McGraw-Hill, New York.White, R.E. (1997) Principles and Practice of Soil Science, the Soil as a Natural Resource. 3rd Edition.
Blackwell Science Ltd, Oxford.Williams, I.H. (1982) The distribution and decline of British bumble bees. Journal of Agricultural Research
21, 236–245.Williams, I.H. (1986) Environmental change and the distribution of British bumble bees. Bee World 67, 50–
61.Williams, R.J., Brooke, D.N., Matthiessen, P., Mills, M., Turnbull, A. and Harrison, R.M. (1995) Pesticide
transport to surface waters within an agricultural catchment, Journal of the Institution of Water andEnvironmental Management 9, 72–81.
Wong, S. and Lee, W. (1997) Survey of organochlorine pesticide residues in milk in Hong Kong (1993–1995).Journal of AOAC International 80, 1332–1335.
Worthing, C.R. (1991) The Pesticide Manual. 9th Edition. The British Crop Protection Council, UnwinBrothers, London.
Young, R.N., Mohamed, A.M.O. and Warkentin, B.P. (1992) Principles of Contaminant Transport in Soils.Elsevier, Amsterdam.
PESTICIDES 191

192

8Genetic Modification
8.1INTRODUCTION
The use of biotechnology to genetically modify crops is proving to be highly controversial.Unfortunately, debate has become polarised by ‘pro-’ and ‘anti-’ groups (led largely by the biotechindustry and environmental campaigners respectively). Ellstrand (2001) states that opinionrelating to this argument ranges between ‘smug optimism’ and ‘self-righteous panic’.Environmental campaign groups have adopted emotive phrases such as ‘genetic pollution’ and‘Frankenfoods’ to describe the technology, whilst industry have fought a somewhat unsuccessfulcampaign to convince the UK public that genetically modified (GM) crops are safe to eat andenvironmentally benign. In this chapter, we provide some of the evidence on the environmentaleffects of GM crops. We concentrate on those currently commercially grown and direct the readerto Rissler and Mellon (1996) for discussion of environmental risks associated with GM cropsunder development but not commercially available (such as those with resistance to viruses).Whether GM crops emerge as ‘pollutants’ in the same sense as those discussed in Chapters 2–7 ofthis book remains to be seen.
The use of GM crops world-wide (RAFI, 2000) has increased rapidly, with 1.7 million hacultivated in 1996, rising to 43 million ha in 2000 (Figure 8.1), grown predominantly in the USA(70%), Argentina (21%), Canada (7%) and China (1%). Four crops currently dominate this market,namely soybeans (58%), maize (12%), cotton (12%) and oilseed rape (7%). GM products alreadyaccount for 10% of total world seed sales.
The development of crops that are beneficial either in terms of their food value (Box 8.1) or theirimpact on the environment is clearly of great value. However, opponents of this technologyconsider that risks to both food safety and the environment outweigh such potential benefits. Wedo not discuss further the ethical, political and food safety aspects of GM crops, which are beyondthe scope of this book. Further information may be obtained from Perry (2001), Reiss andStraughan (1996), Anderson (1999) and The Royal Society’s 1998 and 2000 publications asintroductions to these topics.
BOX 8.1GOLDEN RICE
Vitamin A deficiency (VAD) is the cause of at least 1 million childhood deaths each year andis considered the single most serious cause of blindness amongst children in the developing
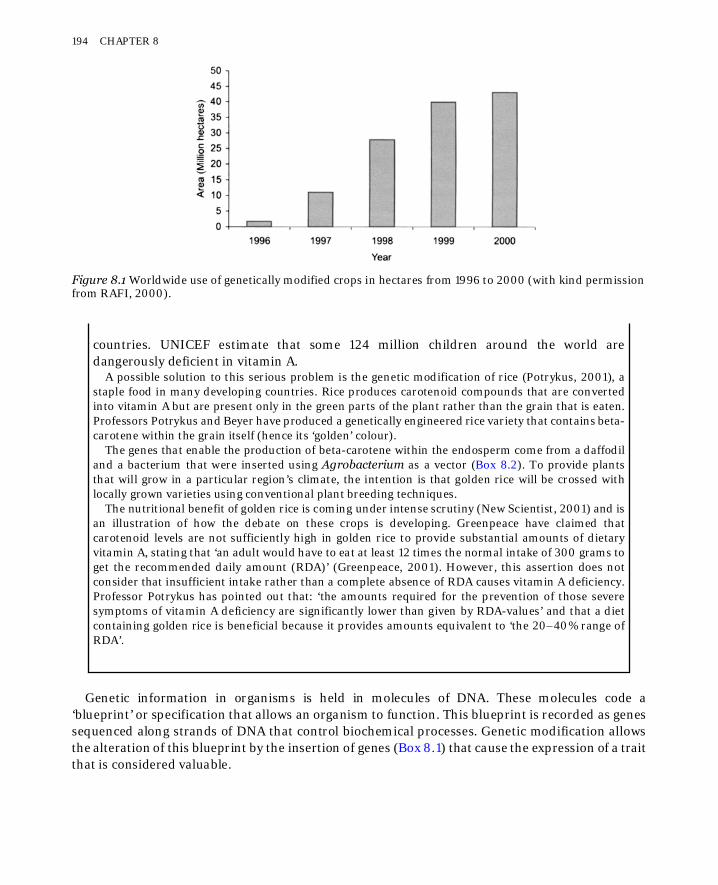
countries. UNICEF estimate that some 124 million children around the world aredangerously deficient in vitamin A.
A possible solution to this serious problem is the genetic modification of rice (Potrykus, 2001), astaple food in many developing countries. Rice produces carotenoid compounds that are convertedinto vitamin A but are present only in the green parts of the plant rather than the grain that is eaten.Professors Potrykus and Beyer have produced a genetically engineered rice variety that contains beta-carotene within the grain itself (hence its ‘golden’ colour).
The genes that enable the production of beta-carotene within the endosperm come from a daffodiland a bacterium that were inserted using Agrobacterium as a vector (Box 8.2). To provide plantsthat will grow in a particular region’s climate, the intention is that golden rice will be crossed withlocally grown varieties using conventional plant breeding techniques.
The nutritional benefit of golden rice is coming under intense scrutiny (New Scientist, 2001) and isan illustration of how the debate on these crops is developing. Greenpeace have claimed thatcarotenoid levels are not sufficiently high in golden rice to provide substantial amounts of dietaryvitamin A, stating that ‘an adult would have to eat at least 12 times the normal intake of 300 grams toget the recommended daily amount (RDA)’ (Greenpeace, 2001). However, this assertion does notconsider that insufficient intake rather than a complete absence of RDA causes vitamin A deficiency.Professor Potrykus has pointed out that: ‘the amounts required for the prevention of those severesymptoms of vitamin A deficiency are significantly lower than given by RDA-values’ and that a dietcontaining golden rice is beneficial because it provides amounts equivalent to ‘the 20–40% range ofRDA’.
Genetic information in organisms is held in molecules of DNA. These molecules code a‘blueprint’ or specification that allows an organism to function. This blueprint is recorded as genessequenced along strands of DNA that control biochemical processes. Genetic modification allowsthe alteration of this blueprint by the insertion of genes (Box 8.1) that cause the expression of a traitthat is considered valuable.
Figure 8.1 Worldwide use of genetically modified crops in hectares from 1996 to 2000 (with kind permissionfrom RAFI, 2000).
194 CHAPTER 8

Genetic modification is not new; conventional plant breeders have introduced desirablecharacteristics into our crops for hundreds of years. This is normally done by crossing differentvarieties of the same species followed by selection, in order to alter the genetic make-up of crops to
BOX 8.2GENE INSERTION
This process involves two quite distinct stages. The first is to identify a gene that confers atrait that is considered beneficial, isolate and clone it. The second stage is to transfer thisgene from the donor to the target species. Gene insertion may be achieved by a variety ofmeans (Walden and Wingender, 1995
Vectorless gene-transfer
Biolistics DNA is mixed with small particles oftungsten or gold which are bombardedinto plant cells.
Electroporation A suspension of plant cells is placed ina container with a solution of DNAcontaining the gene of interest. Astrong electric pulse is then appliedwhich temporarily disrupts cellmembranes and allows the DNA tocross into the cells.
Membrane Permeabilisation Plants cells, a solution of DNA andsilicon carbide fibres carbide fibres arecombined and mixed. The siliconcarbide acts to make cell wallspermeable, allowing foreign DNA tocross into target cells.
Other vectorless methods include the use of ultrasound or microinjection.
Vector-mediated gene-transferVectors are organisms that are used to transfer a gene from the donor to the target species. Vectors
include:
Plasmids Non-chromosomal DNA found in bacterialike Agrobacterium.
Viruses e.g. cauliflower mosaic virus.Transposable Elements Special segments of DNA.
Vector-mediated transfer relies on the use of special enzymes that ‘open’ specific sectionsof DNA with a recognised sequence. This process creates sites along the strands of DNAwhere gene insertion is possible.
GENETIC MODIFICATION 195

confer beneficial characteristics. More recently, random DNA mutation has also been used byapplying mutagenic chemicals and x-rays followed by selection to improve agronomic characters.
Furthermore, the technique of introgression has been extensively used in cereal and grassbreeding programmes and involves hybridising two distantly related species and thenbackcrossing to the parent until only the desired genes remain in the crop parent.
It should be recognised that introgression occurs naturally between closely related species andis sometimes referred to as ‘natural gene flow’.
Genetic modification using biotechnology allows essentially the same process to be achieved;characteristics are conferred on an organism by the selection of a chosen trait. However,characters may be selected from either the same or completely unrelated species or genera and itis this ability which has proven to be so controversial.
The Risk Assessment for Release and Marketing of genetically modified organisms (GMOs) inthe European Union includes the assessment of a range of possible impacts (Table 8.1). Theenvironmental safety of GM crops is covered by Directive 90/220/EEC which forms the basis forthe regulatory framework adopted in the UK. In the UK, currently no commercial GM crops may begrown, apart from those for assessing environmental impacts. The Advisory Committee onReleases into the Environment (ACRE) regulates the growing of GM crops and is responsibledirectly to government (http://www.defra.gov.uk/environment/acre/index.htm for moreinformation). Crops are assessed on biosafety grounds, taking into account the gene donororganism and the effects on the modified organism (Section 8.3).
8.2RISKS AND BENEFITS
In this section, some of the arguments regarding the risks and benefits of commercially grown GMcrops are reviewed. It is argued that the potential benefits of these crops are both environmentaland agronomic and much discussion of these issues has already occurred (e.g. Barton and Dracup,2000; Beringer, 2000; Wolfenbarger and Phifer, 2000). Issues relating to two types of GM crop;those that have either herbicide- or insect-resistant properties will be the focus of this section.Both of these crop types potentially offer the opportunity to reduce pesticide use; it has been along-held goal to develop ‘integrated’ methods of crop management, minimising the application ofagrochemicals and thus reducing the consequent environmental effects.
Herbicide-resistant crops
Crops that are not affected by the application of broad-spectrum herbicides have considerableagronomic advantages because the control of weeds in some crops is both inefficient andexpensive. Genetic modification provides a means to confer resistance to broad-spectrum herbicidesinto crops where current weed control is considered difficult.
Owen (2000) identified the following benefits in this approach as:
• greater flexibility in timing of herbicide application;• improved weed management;• use as part of management strategy for herbicide resistant weeds;
196 CHAPTER 8

• increased opportunities for reduced tillage systems.
Herbicide tolerant crops are not new in themselves; most weed control programmes exploitnatural crop resistance to selective herbicides that kill only certain types of plant without harmingthe crop. Plants may be herbicide-tolerant because they produce (Devine et al., 1993):
• an enzyme which detoxifies the herbicide;• an altered target enzyme not affected by the herbicide or the plant;• physical/physiological barriers to uptake of the herbicide.
These characteristics have been identified and through genetic engineering included into GM cropvarieties, such as the range of ‘Roundup Ready’ crops developed by Monsanto (Box 8.2).
Table 8.1 Potential hazards associated with GM crops to be considered in Risk Assessment before approval ofGMOs (ACRE, 2001).
GENETIC MODIFICATION 197
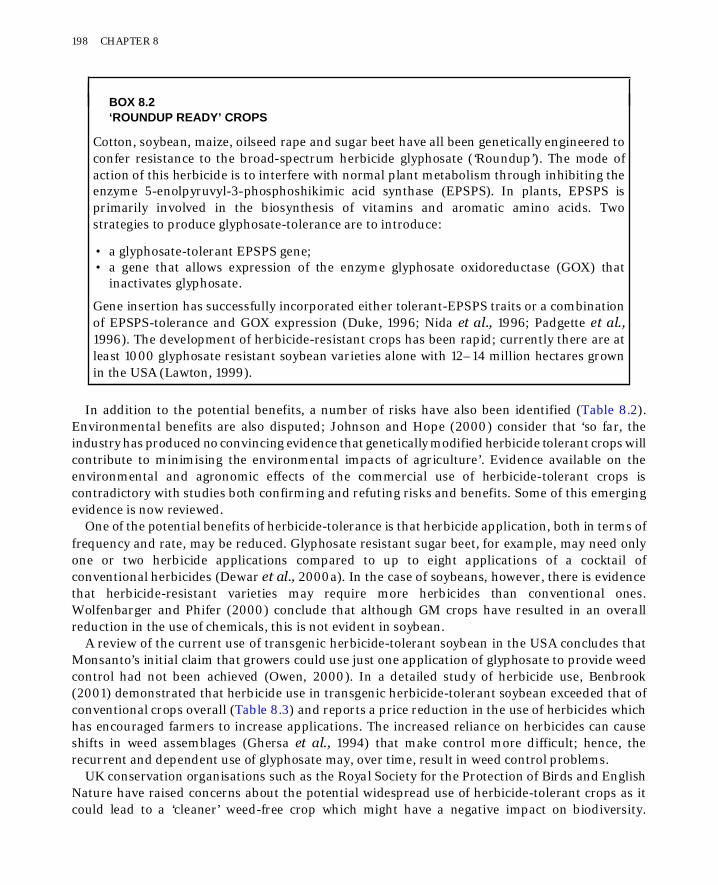
‘ROUNDUP READY’ CROPS
Cotton, soybean, maize, oilseed rape and sugar beet have all been genetically engineered toconfer resistance to the broad-spectrum herbicide glyphosate (‘Roundup’). The mode ofaction of this herbicide is to interfere with normal plant metabolism through inhibiting theenzyme 5-enolpyruvyl-3-phosphoshikimic acid synthase (EPSPS). In plants, EPSPS isprimarily involved in the biosynthesis of vitamins and aromatic amino acids. Twostrategies to produce glyphosate-tolerance are to introduce:
• a glyphosate-tolerant EPSPS gene;• a gene that allows expression of the enzyme glyphosate oxidoreductase (GOX) that
inactivates glyphosate.
Gene insertion has successfully incorporated either tolerant-EPSPS traits or a combinationof EPSPS-tolerance and GOX expression (Duke, 1996; Nida et al., 1996; Padgette et al.,1996). The development of herbicide-resistant crops has been rapid; currently there are atleast 1000 glyphosate resistant soybean varieties alone with 12–14 million hectares grownin the USA (Lawton, 1999).
In addition to the potential benefits, a number of risks have also been identified (Table 8.2).Environmental benefits are also disputed; Johnson and Hope (2000) consider that ‘so far, theindustry has produced no convincing evidence that genetically modified herbicide tolerant crops willcontribute to minimising the environmental impacts of agriculture’. Evidence available on theenvironmental and agronomic effects of the commercial use of herbicide-tolerant crops iscontradictory with studies both confirming and refuting risks and benefits. Some of this emergingevidence is now reviewed.
One of the potential benefits of herbicide-tolerance is that herbicide application, both in terms offrequency and rate, may be reduced. Glyphosate resistant sugar beet, for example, may need onlyone or two herbicide applications compared to up to eight applications of a cocktail ofconventional herbicides (Dewar et al., 2000a). In the case of soybeans, however, there is evidencethat herbicide-resistant varieties may require more herbicides than conventional ones.Wolfenbarger and Phifer (2000) conclude that although GM crops have resulted in an overallreduction in the use of chemicals, this is not evident in soybean.
A review of the current use of transgenic herbicide-tolerant soybean in the USA concludes thatMonsanto’s initial claim that growers could use just one application of glyphosate to provide weedcontrol had not been achieved (Owen, 2000). In a detailed study of herbicide use, Benbrook(2001) demonstrated that herbicide use in transgenic herbicide-tolerant soybean exceeded that ofconventional crops overall (Table 8.3) and reports a price reduction in the use of herbicides whichhas encouraged farmers to increase applications. The increased reliance on herbicides can causeshifts in weed assemblages (Ghersa et al., 1994) that make control more difficult; hence, therecurrent and dependent use of glyphosate may, over time, result in weed control problems.
UK conservation organisations such as the Royal Society for the Protection of Birds and EnglishNature have raised concerns about the potential widespread use of herbicide-tolerant crops as itcould lead to a ‘cleaner’ weed-free crop which might have a negative impact on biodiversity.
198 CHAPTER 8
BOX 8.2

Conversely, herbicide tolerant crops may allow a shift towards minimum tillage techniques thatwould benefit the environment (Wolfenbarger and Phifer, 2000) because they:
• may decrease soil erosion;• can reduce water loss;• may increase soil organic matter;• allow herbicide usage to be reduced.
The transfer of genes to weedy relatives, resistant volunteers acting as weeds and transfer oftolerance between varieties resulting in multiple-resistance have all been identified as potentialenvironmental risks (Hall et al., 2000). The risk of genes conferring herbicide resistance to weed
Table 8.2 Potential benefits and risks of transgenic herbicide-resistant crops (Kuiper et al., 2000). Withpermission from Elsevier Science.
Table 8.3 Herbicide applied per hectare in Roundup Ready and conventional soybean varieties for allsurveyed states and five example states surveyed by USDA in 1998 (Benbrook, 2001). With permission fromAgBioTechlnfoNet.
GENETIC MODIFICATION 199

species due to out-crossing (Box 8.3) and the consequent emergence of ‘superweeds’ is one of thekey environmental arguments against the use of genetic engineering.
BOX 8.3OUTCROSSING
The risk of out-crossing of resistant genes varies according to the way in which a crop ispollinated. A crop may be self-or cross-pollinated (or both) by insect or wind. Crops suchas oilseed rape are insect pollinated and partially cross-breeding plants.
Outcrossing may occur:
• between varieties of the same species. For example, B. napus has an interplantOutcrossing rate of 21.8% (Rakow and Woods, 1987);
• by the transfer of genetic information from crop weed in systems such as cultivatedradish-wild radish (Klinger et al., 1991) and sorghum-johnsongrass (Arriola andEllstrand, 1996; Ellstrand et al., 1999).
The likelihood of Outcrossing reduces with distance (Stringham and Downey, 1978); infield trials, Downey (1999) showed that B. napus pollen transfer results in under 1% out-crossing within 100m from source although rape pollen can travel 1.5 to 2.5 km fromcommercial fields (Timmons et al., 1996). In trials of transgenic cotton, outcrossingaveraged from 0.15% of progeny at 1 m to below 0.08% at 4m from the test plots (Llewellynand Fitt, 1996). This risk of outcrossing has led to the use of buffer zones in field trials oftransgenic crops during assessments of their environmental effects (e.g. Staniland et al.,2000).
It should be noted that crop-to-weed or variety-to-variety gene flow (introgression) is not foundsolely in transgenic plants; this process has occurred in conventional agricultural systems and hascaused ‘superweed’ problems such as those faced in Europe with the sea beet-sugar beet hybrid(van Dijk and Desplanque, 1999). It is the risk of genetically engineered traits such as herbicide-tolerance escaping into wild populations that is specific to transgenic plants. Consequently, somecrops such as sorghum that hybridise fairly easily may be too risky to genetically engineer becauseof likely hybridisation with wild relatives like johnsongrass, a pernicious weed (Kuiper et al., 2000).The risk of crop-to-weed gene flow may be assessed using a stepwise approach. Figure 8.2 showssteps identified by Rissler and Mellon (1996) that are necessary when assessing the potential oftransgene flow.
200 CHAPTER 8

Figure 8.2 Experimental assessment of the potential for transgene flow to produce weeds in non-crop populations. Three tiers provide a structured pathway to analyse the potential risk of gene flow(Rissler and Mellon, 1996).
One example of gene flow was reported by Hall et al. (2000). In 1997, a grower in Alberta,Canada planted glufosinate- and imidazolinone-resistant B. napus in two sections of the same
GENETIC MODIFICATION 201

field (Field 1). A glyphosate-resistant variety was planted in an adjacent field (Field 2) separatedby a 22m road. In 1998, part of Field 2 was planted with imidazolinone-resistant B. napus whilstField 1 was fallowed and glyphosate treatments applied for weed control. B. napus volunteerplants, unaffected by glyphosate, were reported in Field 1 without the resistant variety being sown.A detailed study concluded that pollen flow was responsible for the occurrence of multiple-resistance; triple-resistant mutations did occur and a single triple-resistant individual was locatedover 550m from the pollen source after about 18 months. It is important to consider whether thepresence of this effect is of any major environmental concern; the workers in this study concludethat integrated management, such as using crop and herbicide rotations could be used to reducethe incidence of volunteers with multiple resistance characteristics.
In fact, the use of transgenic varieties may make it easier to control volunteers; Dewar et al.(2000b) showed that glyphosate applied early, late, or twice to genetically modified herbicide-tolerant sugar beet gave excellent control of potato volunteers. A significant reduction in thenumber and size of daughter tubers produced helped to prevent volunteers in the next croprotation. The approach had the environmental benefit of reducing the number of chemicalapplications from between two-five down to one-two, in addition to suppression of potato cystnematode populations. The long-term effects of using herbicide-tolerant transgenic plants remainlargely unknown; there is evidence of agronomic and environmental benefit as well as potentialrisk, and increased complexity in crop management.
The potential increase in yield of the world’s crops has often been cited as one of the keybenefits of transgenics. With an increasing world population it is coherently argued thattechnology which increases yield has enormous value, firstly to ensure that global food productionneeds are met and secondly that it is done without the need to cultivate an increasingly large landarea which in itself would cause environmental degradation. The effect that herbicide-tolerantcrops have on yield vary between crops; the USDA (United States Department of Agriculture)report increase in both yield and profits for herbicide-tolerant cotton and a small increase in yieldfor soybean for data collected in 1997 (ERS/USDA, 2001). Some studies indicate that yield lossesmay be occurring in certain crops which may be caused by two phenomena (IANR, 2000):
Drag Lower yields resulting directly from gene insertion.Lag Loss in yield due to the crop variety used for inclusion of trait.
In the case of commercially grown crops such as soybean, the yield benefits are often ambiguous.In a detailed study, Benbrook (2001) concluded that Roundup Ready soybean yields were 5 to 10%less than conventional crops grown under identical conditions (Table 8.4). This yield drag wasattributed to the impairment of root development, nodulation and nitrogen fixation due to thebacterial symbiont (Bradyrhizobium japonicum) responsible for nitrogen fixation being sensitiveto Roundup.
Insect-resistant crops
The genetic modification of crops to confer resistance against insect attack is well advanced andvarieties for a number of crops are commercially available, primarily in the USA. The expression
202 CHAPTER 8

of an insect toxin from Bacillus thuringiensis (Box 8.4) has provided the first insect-resistanttransgenic crops. These varieties are not intended to increase yield, rather they prevent yield losswhen pest species are sufficiently abundant. If resistance can be conferred to crops then there arepotential benefits in the reduced use of insecticides in the environment. The use of insect-resistantBt crops has rapidly increased, particularly in the USA (Table 8.5); maize, cotton and potatoescovered about 16 million acres in 1998 (Gianessi and Carpenter, 1999).
BOX 8.4BACILLUS THURINGIENSIS
Bacillus thuringiensis (Bt) is a soil-living organism that may be used conventionally tocontrol a range of insect pests (Chapter 7). Bt needs to be ingested by the target insect; itcontains a crystalline toxin (encoded by Cry genes) that paralyses the insect’s digestivetract, causing death.
Crops have been genetically engineered to contain the toxic component of Bt. Because the geneticcode of plants and bacteria are dissimilar, genes are synthesised that make the bacterial amino acidsequence and the target plant DNA compatible. The Bt toxin is not soluble in plant cells because of theirrelatively low pH. This is overcome by using a shortened gene sequence that produces toxin moleculesthat are soluble in plant cells; hence the toxin is present in the green plant tissues itself.
From 1996 crops including maize, potato, cotton and soybean have been engineered to incorporatethe Bt toxin and are available commercially in the US and elsewhere. All express part of the Cry toxinin their tissues. The gene for this toxin has been introduced in an effort to confer protection againstinsect attack without the need for conventional insecticides.
The environmental impact of conventional insecticide use, particularly those with broad-spectrum activity, is well documented and covered in detail in Chapter 7. Genetic engineering,such as the inclusion of the Bt toxin, provides an opportunity to confer insect-resistant propertiesin the plants themselves, which could lead to a reduction in conventional pesticide use. Whethercurrent commercially available transgenic crops have delivered this environmental benefit is
Table 8.4 Yields (bushels per acre) and yield drag (as percentage, negative values indicating relatively lower,and positive relatively higher yields respectively in Roundup Ready crops) for conventional and RoundupReady soybean in variety trials tested at 9 locations in Illinois (Benbrook, 2001). With permission fromAgBioTechlnfoNet.
GENETIC MODIFICATION 203

unclear with much contradictory evidence available. These contradictory conclusions areillustrated well in cotton and corn.
The US Environmental Protection Agency (EPA and USDA, 1999) state that ‘Bt toxins expressedin transgenic plants can and have reduced the use of more hazardous insecticides such asorganophosphates and synthetic pyrethroids’. They further claim that ‘since the commercialisationof Bt cotton in 1996, industry information has shown that cotton insecticide use has been reducedby approximately 1 million gallons of formulated product per year’. However, in a report compiledfor the WWF (2000) authors claim that ‘From 1996 to 1998 the acreage of Bt-cotton steadilyincreased reaching 17% of the total cotton acreage in the U.S. in 1998, while insecticide use peracre remained more or less at the same level’.
Obrycki and Losey (2001) questions the widespread use of Bt corn, stating that it has notreduced pesticide use or increased yields. Burkness et al. (2001), however, concluded that Btsweet corn hybrids without the use of conventional insecticides could provide excellent controlagainst two lepidopteran pests Ostrinia nubilalis and Helicoverpa zea.
A major concern regarding the use of these transgenic crops is that the technology may promoteresistance in the pest species themselves, ultimately making control more difficult leading toincreased use of conventional insecticides. The process by which resistance emerges in insectpopulations is well understood and described in Chapter 7. Additionally, biopesticides such as Btare used in organic farming systems; there is concern that this control method may be lost to suchgrowers if insecticide-resistance results from the inclusion of Bt toxin expression in transgeniccrops.
Tabashnik (1994) has demonstrated that resistant traits to Bt in insect populations may emergeand consequently there is concern that the wide use of transgenic Bt crops may accelerate theexpression of resistance. The management of insect resistance is not a problem exclusive totransgenic crops and it is possible that their use may increase our ability to reduce the emergenceof resistance by integrated management methods. The possible emergence of insect-resistance hasbeen taken very seriously because it would mean that the transgenic crops would becomeineffective. Consequently, strategies adopting the use of refuges to manage resistance have beendevised. Refuges are non-transgenic crop areas where insect populations without resistant traitsmay survive. This provides an insect population which suppresses the expression of resistant traits within the pest population as a whole. An example of resistance management using refuges is thatagreed by the US EPA and developed by members of the Agricultural Biotechnology StewardshipTechnical Committee (ABSTC, 2001). The plan incorporates a 20% refuge requirement in themajor corn-growing regions and a 50% refuge requirement in areas of overlapping corn and cottonproduction.
Table 8.5 US crop acreage planted with Bt crops in 1998 (Gianessi and Carpenter, 1999).
204 CHAPTER 8

Another technique to manage this problem is ‘stacking’ or ‘pyramiding’, where two contrastinginsecticidal characteristics are included in the genetically engineered plant (Roush, 1998). Thisreduces the likelihood of resistance emerging within a pest population, thus ensuring the long-term efficacy of the transgenic plant.
The use of genetically engineered crops has been criticised because they potentially threatennon-target organisms (Butler and Reichhardt, 1999) which may either be beneficial to agriculture(e.g. natural enemies) or simply of conservation interest (e.g. butterflies). Much work has beendone in the laboratory and at the field scale to investigate these potential effects on a wide range ofnon-target species (Hilbeck et al., 2000; Schuler, 2000), but it is work on the monarch butterflythat has stimulated so much media interest (Box 8.5).
BOX 8.5THE MONARCH BUTTERFLY
Monarch butterflies (Danaus plexippus) migrate each year from Mexico to the USA andCanada (navigating a flight of 2000 miles), laying its eggs on the underside of leaves of themilkweed plant. Studies have been carried out to investigate the potential impacts of Btcorn on these insects (e.g. Palevitz, 1999; Losey et al., 1999; Jesse and Obrycki, 2000).These studies were done due to the potential exposure of monarch butterflies to cornpollen expressing Bt toxin in areas where milkweed plants are common.
The study by Jesse and Obrycki (2000) investigated Bt modified corn, which was engineered tocontrol a pest called the European corn borer. They investigated whether Bt corn pollen landing onthe larval host plant of milkweed might pose a risk. The experiment was conducted by removing leafdisks from milkweed plants that had been grown adjacent to Bt and non-Bt corn and then allowingnewly hatched larvae to feed on them in the laboratory. The workers showed that larvae exposed for48 hours to Bt corn that had accumulated on milkweed in the field showed 20% mortality comparedto 0% mortality for control (not-Bt corn) plants. Overall, the study concluded that significantmortality of monarch larvae occurred from natural pollen deposition from Bt modified crops andfurther study was needed to assess such effects in the field.
However, the interpretation of these data has been questioned by some workers. In a critique ofthis study Sears and Shelton (2000), conclude that the study ‘does little to help understand potentialrisks of deploying Bt plants in the field’. The findings from the study were questioned primarilybecause:
• toxicity results were not consistent with other studies;• small sample size (35 larvae were exposed to Bt corn) making results difficult to
interpret; • concentrations of pollen grains that cause high mortality were unlikely to be evident
under field conditions;• larvae were ‘forced’ to eat contaminated leaf tissue and had no choice of diet.
In a series of papers published in the Proceedings of the National Academy of Sciences ofthe USA, Hellmich et al. (2001), Sears et al. (2001) and Stanley-Horn et al. (2001) assessedthe risk of Bt to monarchs in the field. The overall conclusion of the study indicated that
GENETIC MODIFICATION 205

the impact of Bt corn pollen from commercially available hybrids was negligible. The keyreasons for this were:
• low Bt expression corn pollen in most commercial GM corn resulting in no acute toxiceffects observable in laboratory or field trials;
• limited overlap in time between pollen shed and larval activity;• only a proportion of the monarch population utilising milkweed near corn fields;• 19% adoption of Bt corn in North America.
These studies illustrate the need for work which determine the likelihood and risk ofexposure of non-target species to such toxins. Whilst the study by Jesse and Obrycki (2000)demonstrates a potential mortality pathway, it is the translation of such an effect intoobservable field mortalities that must be established before risks can be established. Studieson another butterfly, the black swallowtail Papilio poyxenes indicated that mortality didnot occur in laboratory trials even when insects were exposed to very high Bt corn pollendoses (Wraight et al., 2000).
A study on generalist predator populations present in transgenic Bt potatoes compared toconventional varieties concluded that there were no deleterious effects (Riddick et al., 2000).There is a concern that the insecticidal effects of Bt crops may cause problems by theirpersistence, although studies have shown rapid degradation of Bt toxin activity in neutral soils(Sims and Holden, 1996). Studies also suggest that Bt toxin may enter the soil ecosystem byexuding from Bt corn roots (Saxena et al., 1999) and that Bt toxin uptake from soil by plants ispossible (Saxena and Stotzky, 2001) although the implications of these observations in the fieldremain to be quantified fully.
8.3ASSESSING ENVIRONMENTAL RISK
The examples above illustrate the range of concerns raised regarding the use of transgenic crops.In order to minimise potential problems when they are released into the environment, a process ofrisk assessment is undertaken. This process should provide an opportunity to determineenvironmental effects in order to determine their suitability for commercial use. The process iscomplex and an illustration of factors that need to be considered is given in Figure 8.2.
Studies to assess risk include a combination of:
• bioassays—small scale studies conducted in a laboratory usually conducted under ‘worst case’scenarios;
• laboratory experiments that mimic field conditions and ecosystems;• small scale field trials;• large scale field trials.
No genetically engineered crops have completed all the UK regulatory requirements allowing themto be grown for commercial purposes. Herbicide tolerant maize, oilseed rape and fodder beet are
206 CHAPTER 8

those closest to commercialisation. These crops are now being assessed in large-scale experimentsto determine their overall effect on biodiversity. Biodiversity may be defined as ‘the genetic,taxonomic and ecosystem variety in living organisms of a given area, environment, ecosystem orthe whole planet’ (McAllister, 1991). One of the key concerns of environmental groups is thattransgenic crops may disrupt agricultural ecosystems thus causing detrimental effects onbiodiversity.
As part of the registration of such crops, the EU requires that an assessment of all direct,indirect, immediate and delayed effects of the GM crop to the environment is carried out beforecommercial growing. The UK government have adopted a ‘precautionary approach’ to GMtechnology and have commissioned a number of studies to gauge the environmental risks of usingthis technology (Firbank et al., 1999). During 2001, genetically modified rape, maize and beet willbe grown across the UK as part of the FSEs (current information regarding these trials may befound at http://www.defra.gov.uk/environment/fse/index.htm). These FSEs were agreed betweenthe farming and biotechnology industry body, SCIMAC (the Supply Chain Initiative on ModifiedAgricultural Crops) and trials will continue until the end of 2003. The farm-scale evaluations areconcerned with determining the effects of transgenic crops on biodiversity. The FSE programme isdesigned to ‘examine whether there are any differences in the diversity and abundance offarmland wildlife associated with the management of GM herbicide tolerant crops as comparedwith equivalent non-GM crops’. It is imperative that field-scale trials are done because small-scaleevaluation in the laboratory or semi-field scale does not incorporate the complexity of ‘real’ecosystems. The study started in 1999 and field trials are being conducted on the ecological effectsand a wide range of factors are being measured (Table 8.6) as environmental indicators of change.
The FSE is designed to detect differences in biodiversity between GM and conventional crops.Positive, negative, or no effect may be detected. The trials are made up of about 25 fields per crop(fodder maize, spring and winter oilseed rape, and sugar beet) using a ‘split field’ design with onehalf of the field having a GM crop and the other half a conventional variety. It is intended that thefindings from these studies will be published rapidly so informed decision-making regarding therisks of growing transgenic crops in the UK may be carried out.
Table 8.6 Environmental indicators measured during UK Farm Scale Evaluations (DEFRA, 2001).
GENETIC MODIFICATION 207
8.4THE FUTURE FOR GMOs
This chapter has been included in order to highlight how advances in technology create newenvironmental challenges and potential pollution problems. Transgenic crops are of potentiallyenormous value agronomically, but there is uncertainty regarding the environmentalconsequences of their use. The assessment of risk is incomplete and much more evidence isneeded before the impact of genetically modified crops is fully understood. This is complicatedfurther by the need for a comparison with conventional practices that may themselves lead toenvironmental harm. It is only as studies are completed and published that an informedassessment of the possible environmental implications can be made.
It is also clear that the GM crops currently under scrutiny are just the first wave of modifiedvarieties. Already, efficiency of GM technology has advanced and greater attention been paid to boththe expression of the modified character and its potential for ‘escape’ into the environment.Clearly ecological and environmental evaluation of impacts of GM crops needs to be accelerated tokeep pace with these biotechnological advances.
REFERENCES
ABSTC (2001) Bt Corn Insect Resistance Management Survey—2000 growing season. AgriculturalBiotechnology Stewardship Technical Committee. URL:http://www.biotech-info.net/bt_corn_survey_2000.pdf.
ACRE (2001) Risk Assessment for Release and Marketing of GMOs in the European Union. URL: http://www.defra.gov.uk/environment/acre/background/risk/index.htm
Anderson, L. (1999) Genetic Engineering, Food and our Environment. Green Books, Dartington.Arriola, P.E. and Ellstrand, N.C. (1996) Crop-to-weed gene flow in the genus Sorghum (Poaceae):
spontaneous interspecific hybridization between johnsongrass. Sorghum halapense, and crop sorghum,S. bicolor. American Journal of Botany 83, 1153–1160.
Barton, J.E. and Dracup, M. (2000) Genetically modified crops and the environment. Agronomy Journal92, 797–803.
Benbrook, C.M. (2001) Troubled times amid commercial success for Roundup Ready Soybeans.AgBioTechlnfoNet Technical Paper Number 4. URL: http://www.biotech-info.net/troubledtimes.html
Beringer, J.E. (2000) Releasing genetically modified organisms: will any harm outweigh any advantage?Journal of Applied Ecology 37, 207–214.
Burkness, E.G., Hutchison, W.D., Bolin, P.C., Bartels, D.W., Warnock, D.F. and Davis, D.W. (2001) Fieldefficacy of sweet corn hybrids expressing a Bacillus thuringiensis toxin for management of Ostrinianubilalis (Lepidoptera: Crambidae) and Helicoverpa zea (Lepidoptera: Noctuidae) . Journal ofEconomic Entomology 94, 197–203.
Butler, D. and Reichardt, T. (1999) Assessing the threat to biodiversity on the farm. Nature 398, 654–656.DEFRA (2001) Genetically modified crop Farm-Scale Evaluations: Some questions answered about GM
crops and the Farm Scale Evaluations. Department of Environment, Food and Rural Affairs. URL:http://www.defra.gov.uk/environment/fse/raq/index.htm
Devine, M., Duke, S.O. and Fedtke, C. (1993) Physiology of Herbicide Action. Prentice Hall, Englewood Cliffs,NJ, pp. 251–294.
Dewar, A.M., Haycock, L.A., May, M.J., Beane, J. and Perry, R.N. (2000b) Glyphosate applied to geneticallymodified herbicide-tolerant sugar beet and ‘volunteer’ potatoes reduces populations of potato cystnematodes and the number and size of daughter tubers. Annals of Applied Biology 136, 179–187.
208 CHAPTER 8

Dewar, A.M., May, M.J. and Pidgeon, J.D. (2000a) GM sugar beet—the present situation. British Sugar BeetReview 68, 22–27.
Downey, R.K. (1999) Risk assessment of out-crossing of transgenic Brassica, with focus on B. rapa and B.napus. Proceedings of the 10th International Rapeseed Congress, Canberra, Australia.
Duke, S.O. (1996) Herbicide Resistant Crops. CRC Press, New York.Ellstrand, N.C. (2001) When transgenes wander, should we worry? Plant Physiology 125, 1543–1545.Ellstrand, N.C., Prentice, H.C. and Hancock, J.F. (1999) Gene flow and introgression from domesticated
plants into their wild relatives. Annual Review of Ecological Systems 24, 217–242.EPA and USDA (1999) Position Paper on Insect Resistance Management in Bt Crops 5/27/99 (minor
revisions 7/12/99) URL: http://www.epa.gov/oppbppd1/biopesticides/otherdocs/bt_position_paper_618.htm
ERS and USDA (2001) Emphasis—Harmony between agriculture and the environment: genetically modifiedcrops. URL: http://www.ers.usda.gov/Emphases/Harmony/issues/genengcrops/terms.htm
Firbank, L.G., Dewar, A.M., Hill, M.O., May, M.J., Perry, J.N., Rothery, P., Squire, G.R. and Woiwod, I.P.(1999) Farm-scale evaluation of GM crops explained. Nature 399, 727–728.
Ghersa, C.M., Roush, M.L., Radosevich, S.R. and Cordray, S.M. (1994) Coevolution of agroecosystems andweed management. Bioscience 44, 85–94.
Gianessi, L.P. and Carpenter, J.E. (1999) Agricultural Biotechnology: Insect Control Benefits, NCFAP Report,July 12, 1999 URL: http://www.bio.org/foodandag/ncfap/ag_bio.htm.
Greenpeace (2001) Genetically engineered ‘golden rice’ is fool’s gold. URL: http://www.greenpeace.org/pressreleases/geneng/2001feb9.html
Hall, L., Topinka, K., Huffman, J., Davis, L. and Good, A. (2000) Pollen flow between herbicide-resistantBrassica napus is the cause of multiple-resistant B. napus volunteers. Weed Science 48, 688–694.
Hellmich, R.L. Siegfried, B.D. Sears, M.K., Stanley-Horn, D.E., Daniels, S, M.J., Mattila, H.R., Spencer, T.,Bidne, K.G. and Lewis, L.C. (2001) Monarch larvae sensitivity to Bacillus thuringiensis-purified proteinsand pollen. Proceedings of the National Academy of Sciences of the USA 98, 11925–11930.
Hilbeck, A., Meier, M.S. and Raps, A. (2000) Review on non-target organisms and Bt plants. Report toGreenpeace International by Ecological Technology Assessment and Environment Consulting. URL:http://www.greenpeace.org/~geneng/reports/gmo/ecostratbt.pdf
IANR (2000) Research shows Roundup Ready Soybeans Yield Less. University of Nebraska, Institute ofAgriculture and Natural Resources publication, July 2000. URL: http://www.biotech-info.net/Roundup_soybeans_yield_less.html
Jesse, L.C.H. and Obrycki, J.J. (2000) Field deposition of Bt transgenic corn pollen: lethal effects on themonarch butterfly. Oecologia 125, 241–248.
Johnson, B. and Hope, A. (2000) GM crops and equivocal environmental benefits. Nature Biotechnology 18,242.
Klinger, T., Elam, D.R. and Ellstrand, N.C. (1991) Radish as a model system for the study of engineered geneescape rates via crop-weed mating. Conservation Biology 5, 531–535.
Kuiper, H.A., Kleter, G.A. and Noordam, M.Y. (2000) Risks of the release of transgenic herbicide-resistantplants with respect to humans, animals, and the environment. Crop Protection 19, 773–778.
Lawton, K. (1999) Roundup of a market. Farm Industry News, February, 4–8.Llewellyn, D. and Fitt, G. (1996) Pollen dispersal from two field trials of transgenic cotton in the Namoi
Valley, Australia. Molecular Breeding 2, 157–166.Losey, J.E., Rayor, L.S. and Carter, M.E. (1999) Transgenic pollen harms monarch larvae. Nature 399, 214.McAllister, D.E. (1991) What is biodiversity? Canadian Biodiversity 1, 4–6.New Scientist (2001) Protests take the shine off golden rice. New Scientist 169 Issue 2284, 15.Nida, D.L., Kolacz, K.H., Buehler, R.E., Deaton, W.R., Schuler, W.R., Armstrong, T.A., Taylor, M.L., Ebert,
C.C. and Rogan, G.J. (1996) Glyphosate-tolerant cotton: Genetic characterization and protein expression.Journal of Agricultural and Food Chemistry 44, 1960–1966.
GENETIC MODIFICATION 209
Obrycki, J.J., Losey, J.E., Taylor, O.R. and Jesse, L.C.H. (2001) Transgenic Insecticidal Corn: BeyondInsecticidal Toxicity to Ecological Complexity Bioscience 51, 353–362.
Owen, M.D.K. (2000) Current use of transgenic herbicide-resistant soybean and corn in the USA. CropProtection 19, 765–771.
Padgette, S.R., Re, D.B., Barry, G.F., Eichholtz, D.E., Delannay, X., Fuchs, R.L., Kishore, G.M. and Fraley,R.T. (1996) New weed control opportunities: Development of soybeans with a Roundup Ready gene. In:Herbicide-Resistant Crops: Agricultural, Environmental, Economic, Regulatory, and TechnicalAspects (Ed. S.O.Duke). CRC Press Inc., Boca Raton, Florida, and London, England, pp. 53–84.
Palevitz, B.A. (1999) Bt or not Bt… Transgenic corn vs. monarch butterflies. Scientist 13, 1.Perry, J.N. (2001) Genetically Modified Crops. In: Genetic Engineering, Volume XV in the ‘Christ and the
Cosmos’ series (Ed. B.Beamond). Proceedings of the 15th Christ and the Cosmos Conference, LondonColney, Herts.
Potyrkus, I. (2001) Golden rice and beyond. Plant Physiology 125, 1157–1161.RAFI (2000) Speed Bump or Blow-Out for GM seeds? URL: http://www. rafi.org/web/docus/pdfs/
Gmseed2000.pdfRakow, G. and Woods, D. (1987) Out-crossing in rape and mustard under Saskatchewan prairie conditions.
Canadian Journal of Plant Science 67, 147–151.Reiss, M.J. and Straughan, R. (1996) Improving Nature? The Science and Ethics of Genetic Engineering.
Cambridge University Press.Riddick, E.W., Dively, G. and Barbosa, P. (2000) Season-long abundance of generalist predators in
transgenic versus non-transgenic potato fields. Journal of Entomological Science 35, 349–359.Rissler, J. and Mellon, M. (1996) The Ecological Risks of Engineered Crops. The MIT Press, Cambridge,
Massachusetts.Roush, R.T. (1998) Two-toxin strategies for management of insecticidal transgenic crops: Can pyramiding
succeed where pesticide mixtures have not? Philosophical Transactions of the Royal Society of LondonB 353, 1777–1786.
Royal Society (1998) Genetically Modified Plants for Food Use. Documents 1/98 and 2/98. Royal Society(2000) Transgenic Plants and World Agriculture. Document 08/00.
Saxena, D., Flores, S. and Stotzky, G. (1999) Transgenic plants—Insecticidal toxin in root exudates from Btcorn. Nature 402, 480.
Saxena, D. and Stotzky, G. (2001) Bt toxin uptake from soil by plants. Nature Biotechnology 19, 199.Schuler, T.H. (2000) The impact of insect resistant GM crops on populations of natural enemies. Antenna
24, 59–65.Sears, M. and Shelton, A. (2000) Questionable conclusions from the latest monarch study. URL: http://
www.biotech-info.net/questionable_conclusions.htmlSears, M.K., Hellmich, R.L., Stanley-Horn, D.E., Oberhauser, K.S., Pleasants, J.M., Matilla, H.R., Siegfried,
B.D. and Dively, G.P. (2001) Impact of Bt corn pollen on monarch butterfly populations: A riskassessment. Proceedings of the National Academy of Sciences of the USA 98, 11937–11942.
Sims, S.R. and Holden, L.R. (1996) Insect bioassay for determining soil degradation of Bacillus thuringiensissubsp kurstaki CryIA(b) protein in corn tissue. Environmental Entomology 25, 659–664.
Staniland, B.K., McVetty, P.B.E., Friesen, L.F., Yarrow, S., Freyssinet, G. and Freyssinet, M. (2000)Effectiveness of border areas in confining the spread of transgenic Brassica napus pollen. CanadianJournal of Plant Science 80, 521–526.
Stanley-Horn, D.E., Dively, G.P.Hellmich, R.LMatilla, H.R., Sears, M.K., Rose, R., Jesse, L.C.H., Losey, J.E.,Obrycki, J.J. and Lewis, L. (2001) Assessing the impact of Cry 1 Ab-expressing corn pollen on monarchbutterfly larvae in field studies. Proceedings of the National Academy of Sciences of the USA 98, 11931–11936.
Stringham, G.R. and Downey, R.K. (1978) Effectiveness of isolation distance in turnip rape. CanadianJournal of Plant Science 58, 427–434.
210 CHAPTER 8

Tabashnik, B.E. (1994) Evolution of resistance to Bacillus thuringiensis. Annual Review of Entomology 39,47–79.
Timmons, A.M., Charters, Y.M., Crawford, J.W., Burn, D., Scott, S.E., Dubbels, S.J., Wilson, N.J., Robertson,A., O’Brien, E.T., Squire, G.R. and Wilkinson, M.J. (1996) Risks from transgenic crops. Nature 380, 487.
vanDijk, H. and Desplanque, B. (1999) European Beta: crops and their wild and weedy relatives. 7thInternational Symposium of the International-Organization-of-Plant-Biosystematics, August 10–15,1998. Plant Evolution in Man-Made Habitats, 257–270.
Walden, R. and Wingender, R. (1995) Gene-transfer and plant-regeneration techniques. Trends inBiotechnology 13, 324–331.
Wolfenbarger, L.L. and Phifer, P.R. (2000) The ecological risks and benefits of genetically engineered plants.Science 290, 2088–2093.
Wraight, C.L., Zangerl, A.R., Carroll, M.J. and Berenbaum, M.R. (2000) Absence of toxicity of Bacillusthuringiensis pollen to black swallowtails under field conditions. Proceedings of the National Academyof Sciences of America 97, 7700–7703.
WWF (2000) Transgenic Cotton: Are there benefits for conservation? URL: http://www.panda.Org/livingwaters
GENETIC MODIFICATION 211

212

9Policy Strategies for Reducing Pollution
9.1INTRODUCTION
Chapter 1 identified that there are two basic options for addressing the problem of agriculturalpollution. We can ‘cure’ the problem by acting against the chemical pollutants themselves (e.g. bywater treatment), or ‘prevent’ the problem by addressing the underlying causes of pollution (e.g.by encouraging the adoption of alternative agricultural practices that are less polluting). Since it isgenerally assumed that ‘prevention is better than cure’, the central concern of this book has beenthe encouragement and pursuit of practical farm-based solutions to the avoidance of agriculturalpollution. The preceding chapters have explored a number of environmental problems associatedwith contemporary agricultural systems. Each chapter considered the way in which agriculturalmanagement practices can be modified in order to address these pollution issues via specificmeasures such as:
• the application of new technologies e.g. non-chemical weed control methods (Chapter 7);• the provision of information and advice to encourage good agricultural practice by farmers e.g.
MAFF Code of Good Agricultural Practice for the Protection of Water (Chapters 2 and 3);• statutory controls and regulations to avoid undesirable practices e.g. planning restrictions under
the Town and Country Planning (General Permitted Development) Order 1995 on the locationof new livestock units to reduce the risk of odour nuisance to local residents (Chapter 5).
This final chapter assesses the role of governmental policy and legislation in reducing agriculturalpollution.
9.2THE EMERGENCE OF CONTEMPORARY AGRI-ENVIRONMENTAL
POLICY
Modern agricultural practice has been remarkably successful at increasing food production overthe last 50 years. Rapid advances in science and technology, combined with the favourableeconomic climate created by post-war agricultural policies encouraged farmers to abandontraditional husbandry methods and mixed farming systems in favour of more specialist and

intensive enterprises, with a greater reliance upon purchased inputs such as pesticides andfertilisers.
It is widely acknowledged that the production-orientated objectives of post-war agriculturalpolicy are less appropriate now since, amongst other things, they have brought significant costs tobear upon the natural environment. Reform of agricultural policy and practice is continuing, withone objective being the reduction of environmental damage associated with intensive productionmethods. The policy agenda of most developed countries is therefore now shifting towards theintegration of agricultural and environmental policy, including the encouragement of moresustainable agricultural practices (OECD, 1993, 1995, 1997; MAFF, 2000). This policy position hastaken some time to develop. In the UK, for example, the environmental impacts of pesticide usewere first identified in the early 1960s, but it was not until the 1980s that it became an issue ofwidespread public and political concern (Ward, 1996). The apparent lack of concern for so manyyears has been attributed to the paucity of available data on pesticide pollution. In consequence,there was no adverse public response to pesticide use and therefore no pressure upon policymakers to act.
Increasing emphasis is now being placed upon the replacement of those agricultural policies,such as price support, which encourage agricultural practices with an adverse impact upon theenvironment with other policies which encourage farmers to recognise that it is in their, andsociety’s interests to maintain and enhance the environmental resources influenced by theiractivities (Runge, 1994). The European Commission, under Agenda 2000, has stated its aim tocreate a stronger agricultural industry that has as a clear focus the maintenance of theenvironment and the preservation of Europe’s rural heritage (Brassley and Lobley, 2002). Thistrend effectively takes us full circle; completing the Pressure-State-Response loop (Box 9.1)suggested by OECD (1997) by returning to modify one of the most important underlying causes ofagricultural pollution, namely the policies that were originally responsible for the rapid expansion,specialisation and intensification of agriculture. The emergence of environmental considerationsin UK agricultural policy is also relatively recent, but developed rapidly during the 1990s. In 1979,the official UK Government view was that ‘a sustained increase in agricultural net production is inthe national interest and can be achieved without undue impact upon the environment’ (Farmingand the Nation, 1979 Government White Paper cited in Jenkins, 1990). By 1991, however, a majorwatershed in national policy had occurred as indicated by the strategy document, Our FarmingFuture, which set out Government thinking on the nature of agricultural change (MAFF, 1991;Waters, 1994). This foreshadowed the 1992 CAP reforms and outlined how the UK Governmentintended ‘to encourage the reconciliation of agricultural and environmental objectives through anappropriate combination of advice, clear regulation and financial incentive’.
Agri-Environment Regulation 2078/92
The stated objective of the 1992 reforms, contained within the Agri-Environment regulation(2078/92) was to ‘.encourage farmers to use less intensive production methods, thereby reducingtheir impact on the environment and the creation of surpluses.’ The 1992 CAP reformsrepresented a major shift in agricultural policy (especially in the arable, beef and sheep regimes)away from the established mechanisms of market/price support for stabilising farm incomes
214 CHAPTER 9

towards direct payments on the basis of crop area and the number of livestock. It also madefunding available for the first time on a large-scale pan-European basis for an accompanying set ofenvironmental measures under EEC Regulation No. 2078/92 which are commonly referred to asthe Agri-environment Programme (EC, 1992). The Agri-environment Programme was the onlyspecifically environmental element in the 1992 regulations, and was entirely separate from themain body of reforms. During negotiations, the UK had proposed that environmental conditionsbe attached to all income support payments made directly to farmers. This is known as ‘cross-compliance’ and was first advocated in the United States in the 1980s. However, this conceptattracted little support from the European Commission and the only environmental conditionswithin the main body of the 1992 CAP reforms were stocking density restrictions on livestockheadage payments (Baldock and Beaufoy, 1992).
BOX 9.1PRESSURE-STATE-RESPONSE (PSR) FRAMEWORK
The Pressure-State-Response (PSR) framework may be employed for investigation of thelinkages and feedback between economic activity and the environment (OECD, 1997). Thisframework considers that the relationship between contemporary economic activity andthe environment functions as a simple ‘loop’ within which: pressure from human andeconomic activities leads to changes in the state or condition of resources which provokeresponses by society to change the pressures on, and state of, the environment.
The PSR framework is very flexible with numerous variants for specific economic sectors.It is well suited to the investigation of agriculture and pollution since it offers the basis foran integrated analysis within which scientific understanding of the causes, effects andcontrol of agricultural pollution is seen to be inextricably interwoven with the broadereconomic, social and political context in which agriculture operates. In particular, the PSRframework implies the fundamental importance of understanding the linkages betweenagricultural policy, production and pollution as the basis of developing sustainableagricultural systems.
POLICY STRATEGIES 215

The Agri-environment Programme made provision for EU funding of schemes proposed byMember States which encouraged farmers to adopt environmentally-sound production methods,including significant reductions in potentially polluting inputs such as fertilisers and pesticides.The total cost (payments, running costs and monitoring) of all UK agri-environment schemes,including the Environmentally Sensitive Areas (ESA) Scheme, the Countryside StewardshipScheme and the NSA Scheme in the late 1990s was estimated to be approximately £87 million(HoC, 1997). This amount was less than 5% of the total public expenditure planned for CAPsupport schemes in the UK during the same period.
Rural Development Regulation 1297/1999
The Rural Development Regulation (1297/1999) has superceded previous European legislation,and aims to meet three objectives: to create a stronger agricultural and forestry sector, to improvethe competitiveness of rural areas, and to maintain the environment and preserve Europe’s ruralheritage (Brassley and Lobley, 2002). Agri-environment measures are the only compulsoryelement of the Rural Development Regulation. The England Rural Development Programme(ERDP) underpins the UK Government’s New Direction for Agriculture by helping farmers andforesters to respond better to consumer requirements and become more competitive, diverse,flexible and environmentally responsible (DEFRA, 2001). The scheme is regarded as highlydiscretionary, and promotes flexibility in the approach of individual Member States to the supportof rural development activities. In Britain, the Rural Development Regulation is implementedthrough a series of Rural Development Plans that are specific to each country. The ERDP is basedon Agri-Environment regulation 2078/92 schemes expanding or continuing, under the land-basedelement of the scheme, which include:
• Countryside Stewardship Scheme• Environmentally Sensitive Areas• Farm Woodland Premium Scheme• Organic Farming Scheme• Woodland Grant Scheme
It is estimated that these schemes will absorb over 70% of the spending under the EDRP between2000 and 2007 (Brassley and Lobley, 2002). Within the ERDP it is planned that a number of theschemes introduced under the Agri-Environment regulation 2078/92 will continue the pattern ofagricultural de-intensification, thus leading to a reduced risk of pollution. Evaluation of theeffectiveness of these environmental schemes has begun (EC, 1998), but the impact over a longertime period remains to be tested.
9.3POLICY INSTRUMENTS, STRATEGIES AND IMPLEMENTATION
Ultimately it is the farmers responsible for managing land at a local level who will, or will not,translate agri-environmental policy into real action with tangible results. Eckerberg and Forsberg(1996) suggested that to understand better the way in which policies influence farmers’ behaviour
216 CHAPTER 9

(including the adoption of less polluting practices), it is necessary to consider some basic conceptsabout policy and policy making. Governmental agreements at a national and/or international levelestablish broad ‘policy frameworks’. In order to be effective, these policy frameworks encompassthree key components—a strategy (or number of strategies), instruments and implementation.
Policy strategies
Policy strategies expand upon a general policy framework by specifying first, more detailed andquantifiable policy objectives, and secondly, how these objectives will be pursued. Since it is rarefor one policy instrument to achieve all policy objectives simultaneously, strategies must select themost appropriate combination of instruments to achieve optimal pollution abatement. The OECD(1991) for example, suggested that environmental policy instruments should be chosen accordingto five sets of criteria:
• environmental effectiveness;• economic efficiency;• equity;• administrative feasibility and cost;• acceptability.
As with most areas of policy-making, environmental policy strategies are often formulated andintroduced on the basis of imperfect and incomplete information in response to perceived/unsubstantiated threats to the environment and/or public health (OECD, 1997). Rather than waituntil full scientific certainty is reached about the nature and extent of this risk, prudent policy-making demands that the precautionary principle is applied and action is taken against anenvironmental threat on the assumption that it is ‘guilty until proven innocent’.
Policy instruments
These are the means or mechanisms by which specific policy objectives are pursued. As variousauthors have identified (e.g. Conway and Pretty, 1991; MAFF, 1991; Eckerberg and Forsberg,1996), the encouragement of environmentally-friendly farming methods depends upon using anappropriate ‘mix’ of three types of policy instrument, communicative, regulatory and economic.
Communicative instruments include the provision of information and advice as well as theopportunity for dialogue and negotiation. These instruments are used extensively in many areas ofenvironmental policy and according to OECD (1996) their goal is to achieve the delivery of policyobjectives via the simple process of ‘enlightened self-interest’. For example, farmers are oftenadvised that the use of an alternative practice is not only better for the environment, but can alsosave on inputs and improve business profitability. Communicative instruments are particularlyimportant for controlling agricultural pollution because of the need for farmers to use information,management ability and ecological understanding to replace or rationalise the use of agrochemicalinputs and/or other management practices (Lockeretz, 1991).
Regulatory instruments involve the ‘traditional’ policy mechanisms, such as statutoryprohibitions and legal sanctions, that form the basis of state intervention and control in most
POLICY STRATEGIES 217

industrialised countries. One of the principal roles of regulation in pollution control is to establishmaximum ceilings or standards for acceptable levels of pollution (Conway and Pretty, 1991). Thisis commonly done by setting environmental quality standards for the environmental resourcereceiving the pollutant (e.g. drinking water standards for nitrates and pesticides). Certainagricultural practices may similarly be regulated via the market-place with the imposition of strictquality control standards and procedures upon farmers by key players, notably the multipleretailers, in the agri-food industry (Taylor and Welford, 1994).
According to Lowe and Ward (1997) the statutory regulation of agricultural pollution in the UKis not simply a technical and legislative issue, but has involved the re-orientation of traditionalattitudes within the farming community to accept the sanctions and controls imposed upon theirbusinesses. This re-orientation is necessary since until the 1980s agricultural pollution was largelya ‘non-problem’ with the principal agricultural imperative being production rather thanenvironmental protection. The Control of Pollution Act 1974, for example, exempted UK farmersfrom prosecution for pollution if they were following ‘good agricultural practice’. Once agriculturalpollution was recognised as a problem, legislative action quickly followed which removedagriculture’s exemption from pollution control and subjected farmers (especially livestockfarmers) to much more detailed and stringent regulation and inspection, notably from theNational Rivers Authority (NRA) established in 1989 as the independent regulatory bodyresponsible for water pollution control in England and Wales. This function became theresponsibility of the Environment Agency at its inception in 1996.
Section 92 of the Water Resources Act 1991 and the resulting Control of Pollution (Silage, Slurryand Agricultural Fuel Oil) Regulations aim to prevent pollution by silage effluent, dirty water,slurry and fuel oil by setting standards for keeping and handling these substances. Practicalrecommendations emanating from these regulations are contained within the Code of GoodAgricultural Practice for the Protection of Water, which as a statutory code under Section 97 of theWater Resources Act 1997 provides advice to the agricultural community. Not adhering to theCode is not in itself an offence, but could be taken into account in any legal action (MAFF, 1998)
Economic instruments involve the use of financial incentives and disincentives to encourage ordiscourage the adoption or continuation of specific agricultural practices. Financial incentives arepotentially very powerful instruments for modifying the behaviour of farmers—they are flexible,easily-targeted and can be linked to the implementation of both regulatory and communicativepolicy instruments to help achieve specific objectives (OECD, 1996). Furthermore, they areunlikely to require any re-orientation of farmers’ attitudes. Examples of financial incentivesinclude the governmental provision of subsidies, capital grants, credit or low-interest loans(Conway and Pretty, 1991), as well as the market advantage and/or premium prices obtained forcertified and labelled products from environmentally-friendly farming systems (OECD, 1995).
The use of subsidies and capital grants to sproduce environmental benefits is a common form offinancial incentive within agri-environmental policies. Subsidies (i.e. financial support payments)to farmers can be harnessed to environmentally-friendly practices either through cross-compliance or via voluntary management agreements (Box 6.2) which involve regular paymentsfor specified periods of time usually on an area basis. In contrast, capital grants normally involveone-off payments for investment in specific tasks (e.g. tree-planting) or facilities (e.g. wastehandling and storage) that have environmental benefits. However, unless grant rates are 100%
218 CHAPTER 9
(i.e. none of the cost is shared by the farmers) their uptake can be limited by the reluctance offarmers to meet the additional costs over and above the grant, especially where these are perceivedas producing little personal benefit (Crabtree and Chalmers, 1994).
Obviously, the success of the financial incentives outlined above at modifying the behaviour offarmers depends upon the ability and willingness of taxpayers to pay for the environmentalbenefits which are accrued. However, other incentives can be pursued more directly by the generalpublic as consumers. Environmentally-friendly practices can be encouraged through the adoptionof production methods according to prescribed environmental standards or codes of practicewhich have a strong ‘market-linkage’ (OECD, 1995). Accredited products with recognisable labelsoften have a market advantage and in some cases (e.g. organic food) may attract premium priceswhich significant numbers of consumers are willing to pay.
Financial disincentives are, according to Scheele (1997), the basic stimulus behindenvironmental protection strategy is ‘…to confront the user (or polluter) of the environment withthe full economic consequences of his/her actions’. This is usually translated into the so-called‘Polluter-Pays Principle’ whereby those responsible for causing the negative externalitiesgenerated by the harmful effects of economic activity upon the environment (mainly, but notexclusively, by pollution) are forced to bear the cost of this damage and/or the costs incurred incontrolling the damage. In other words the external costs of economic activity are ‘internalised’ tobecome part of the normal business costs, thereby theoretically encouraging the adoption of lessharmful practices/technologies.
The ‘Polluter-Pays Principle’ is very well-established in environmental policy (OECD, 1975) andis most commonly applied in agriculture via the government imposition of taxes on fertilisers andpesticides (Conway and Pretty, 1991). However, studies suggest that if significant reductions in theuse of these inputs are to be made then very high taxes (e.g. well in excess of 200% of the marketprice) are required (OECD, 1989). No policy-makers have yet attempted to introduce such drastic‘supply control’ taxes, preferring instead to impose relatively small revenue-raising‘environmental’ taxes which generate funds for investment in research or extension services.Although, as Clunies-Ross (1993) points out, this approach does risk enshrining the right to carryon polluting by encouraging farmers to pay the tax as an acceptable additional cost rather than toalter their practices. A further criticism of taxing agrochemical inputs as a means of pollutioncontrol is that the incidence of pollution on individual farms is influenced by many otherenvironmental factors and husbandry practices. Equally there is no incentive for farmers to adopt‘good agricultural practice’ if they will continue to be penalised on the same basis as other farmerswho ignore good practice.
A better approach (assuming an appropriate mechanism can be found) may be to impose a tax orlevy payment upon pollution itself. The Dutch government implemented legislation in 1987–1988that included the introduction of a levy system that charges farmers for producing surplus manureon their farms (Tamminga and Wijnands, 1991). Although innovative, the success of a system suchas this depends upon first, the participating farmers being sufficiently competent in the collection,management and processing of relevant data and secondly, farmers having sufficient income/motivation to afford the extra time and expense involved in monitoring manure production ontheir farms; and thirdly the government having the means to monitor farmers’ activities and to
POLICY STRATEGIES 219

detect violations (OECD, 1995). The range of financial disincentives available to control pollutionare discussed in more detail by various authors in Romstad et al. (1997).
Implementation and dissemination
This is the organisational arrangements within which policy strategies are implemented. Thestakeholders within this structure may include farmers and their representatives, governmentalagencies, sector authorities, private interest groups and even the general public, while theirsuccess at implementing policy will depend upon:
• the way in which they organise themselves to solve problems of policy implementation;• their degree of power and authority;• the level of resources the stakeholders are allocated.
The implementation structure will obviously vary depending upon the policy strategies andinstruments adopted. For example, according to Eckerberg and Forsberg (1996) regulatoryinstruments tend to be associated with centralised decision-making and ‘top-down’ policyimplementation. Communicative instruments on the other hand aim to encourage decentraliseddecision-making and ‘bottom-up’ policy implementation by developing common knowledge andunderstanding between the policy makers and individual farmers, and leaving the final decisionson specific management practices and actions to the individual farmer.
As a general principle, environmental policy strategies and their implementation structuresshould be developed with a view towards minimising as much as possible the public costs ofadministration, monitoring and enforcement (OECD, 1996). One low-cost approach toimplementing environmental policy which is increasingly favoured in some countries is thegovernment funding of voluntary and community assistance programmes to build the ‘capacity’ oflocal people to address local environmental problems with locally-developed solutions.
Australia, Canada and New Zealand in particular have placed great emphasis upon thedevelopment of self-reliant, community-based approaches to agricultural resource management(OECD, 1995). For example, about 25% of Australian farmers in some states belong to Landcaregroups, a range of publicly and privately funded programmes developed in response to local agri-environmental problems. According to Alexander (1993), ‘Landcare is a grass-roots movement ofgroups of farmers working together with government and the wider community to solve rural landuse problems…it is the epitome of the education and persuasion rather than legislation andcoercion approach to environmental protection’.
Although other countries have yet to move as far as Australia in devolving responsibilities forenvironmental protection to local groups, many are finding that agri-environmental policydevelopment and implementation is much more effective when the farmers themselves areinvolved in the process. Since the introduction of the EC Agri-environment Programme and theencouragement of locally-distinct ‘zonal programmes’, many EU Member States have recognisedthat the long-term success of agri-environmental schemes does not just depend upon technicalknowledge and expertise, but also issues of greater accountability and sensitivity to farmers andtheir local communities (Baldock and Mitchell, 1995).
220 CHAPTER 9

Research conducted for MAFF in England and Wales in relation to the Nitrate programme hasshown that farmers view one-to-one interaction, written text and farm demonstrations as themost effective means of communicating technical information related to nitrate losses fromfarmland. Peer group example and pressure were also reported as being effective (Dampney et al.,2000). Some elements of the dissemination process in relation to agricultural pollution has beenregarded as particularly successful. For example, Robinson (1999) argued that the reduction ofpoint source pollution incidents in England and Wales in the 1990s was due to the implementationof the Control of Pollution (Silage, Slurry and Agricultural Fuel Oil) Regulations as part of apackage which included publicity (underpinned by a clear prosecution policy by the former NRA),development of technical solutions (particularly relating to silage effluent and slurry storage),introduction of regulations including technical specifications and provision of grants to assistfarmers to improve manure and silage storage infrastructure on farm. It is suggested that thisapproach might provide a model for successfully promoting change in other areas within theagricultural sector.
In contrast, the Code of Good Agricultural Practice for the Protection of Water when firstintroduced in 1991 received less attention from the farming industry than was intended. Certainlyit has been pointed out by Dampney et al. (2000) that advice targeted at a range of issues, many ofthem diffuse in origin, such as nitrates, is less well received by farmers. Recent revisions of all theCodes of Good Agricultural Practice have focussed on a clearer presentation of the issues. That,and a progressive realisation within the industry that environmental quality issues are ‘here tostay’ has led to a more widespread adoption of advice contained within the Codes. However, thereis still a long way to go before the majority of the farming community not only accept the Codes,but put the guidance into practice on-farm.
9.4LEARNING FROM EXPERIENCE
The remainder of this chapter looks at two examples of the policy strategies already in place forreducing agricultural pollution. It does not aim to provide detailed prescriptions, but rather toillustrate key developments in policy-making (including both successes and intractable problems)as a source of ideas and insight into the control of agricultural pollution. The areas examined arethose specific policies for the control of pollution associated with nitrates in water and pesticidecontamination of soil and water.
Policies for reducing nitrate pollution
Nitrate pollution of ground, surface and marine waters is a major environmental issue in manycountries (with potential implications for human health) which has attracted considerable publicand political attention. In contrast to pesticides, however, the control of nitrate pollution is notsimply a question of rationalising and reducing an agrochemical input. According to Watson et al.(1996), ‘…the nitrate problem is characterised by complexity, uncertainty and conflict’. AsChapter 2 explained:
POLICY STRATEGIES 221

• Nitrate leaching is an example of diffuse pollution which arises from a variety of sources and isinfluenced by a number of factors, including interactions between the physical, chemical andbiological components of the agro-ecosystem and the wider agricultural economy. For example,while the steady increase in the use of nitrogen (N) fertilisers is undoubtedly significant, theprecise relationship between the rate of N applied and the incidence of nitrate leaching is notalways clear and direct.
• The public health hazards and ecological disruption associated with nitrate pollution are stillsubject to debate. For example, the link between infantile methaemo-globinaemia (blue babysyndrome) and very high levels of nitrate intake in bottle-fed babies is well documented, butvery rare, while there is little consensus amongst experts on the potential link between nitratesand gastric cancer. There is also considerable uncertainty about the relative importance ofnitrate and phosphate in causing eutrophication in surface and marine waters.
Due to the complexity and uncertainty of the nitrate issue, conflicts have inevitably arisen amongagricultural, environmental, governmental and industrial interests regarding the severity ofnitrate pollution and the nature of, and responsibility for, the actions that need to be taken. Theseconflicts have arisen at national, European and international level and many authors havesuggested that nitrate pollution is a political issue as much as an environmental problem. AsElworthy (1994) noted on the situation in the UK, ‘the dearth of scientific knowledge about nitrateleaching has, arguably, left a vacuum in which a furious political battle has raged between, on theone side, the agrochemical industry, farmers, the water industry and the government and on theother environmental groups and a number of individual scientists’.
Nonetheless, it is widely acknowledged that a major factor contributing to the increasedpollution of the aquatic environment by nitrates has been the specialisation and intensification ofagricultural enterprises; notably the decline in traditional mixed farming systems (i.e. crops andlivestock on the same farm) and the increase in specialist arable and livestock farms. Thesespecialist production enterprises are more susceptible to nitrate leaching due to:
• the accumulation of N surpluses within the farming system. These surpluses increase with theintensity of agricultural production, although their occurrence and extent differs considerablybetween farming types and different countries (Brouwer and Hellegers, 1997);
• changes in land management practice which increase the risk of surplus nitrate ‘leaking’ fromthe agro-ecosystem into the aquatic environment (Addiscott et al., 1991).
In contrast to the control of point source pollution (e.g. laws prohibiting the direct discharge oflivestock wastes into surface waters), the favoured policy on nitrate pollution for many years wasto place maximum allowable limits on drinking water and thereby oblige the water industry toremove/dilute the nitrate before delivery to the consumer (Conway and Pretty, 1991). Mostdeveloped countries have now introduced specific policies to control nitrate pollution byencouraging farmers to reduce the N inputs on their farms and/or modify other managementpractices which affect nitrate leaching. However, it should be noted that while most nationalnitrate policies involve some form of direct regulation of nitrogen inputs (fertiliser and manure),in some cases these were originally intended to reduce surplus production rather than protectwater resources. For example, there has been a levy on fertiliser use in Austria since 1986 which
222 CHAPTER 9

was introduced originally to curb surplus production. However, since a 1991 amendment to theAustrian Federal Act on Water this levy is now part of a policy strategy which aims to controlnitrate leaching through ‘orderly agricultural practice’ (OECD, 1993). This new legislation, whichworks on a province-by-province basis, also imposes limits upon stocking rates.
Nitrate pollution control policies in the UK and Europe
The quality of drinking water is one of the most important environmental issues in Europe andnitrate pollution control policies have been in place for many years. For example, EC legislationsetting controls on the level of nitrates in drinking water was first introduced in 1975, but at thistime only extended to cover abstraction from surface water. More comprehensive legislationinvolving a total of 62 water quality standards (including nitrates) was introduced in the 1980 ECDrinking Water Directive (EC, 1980). This was intended to protect human health at the point ofsupply to the consumer and full compliance with the Directive was required amongst all EUMember States by mid-1985.
National nitrate pollution control policies and schemes have varied across the EU according tothe dominant issues in individual countries. For example, while Germany placed particularimportance upon localised water protection zones to reduce the nitrate contamination ofboreholes and wells (Conway and Pretty, 1991), Denmark and the Netherlands focused uponnational controls over the production and use of manures (PARCOM, 1993). According toFrederiksen (1995), most national nitrate pollution control policies introduced in EU MemberStates prior to 1993 involved voluntary restrictions and codes of good agricultural practice;regulations concerning the application and management of manure and fertiliser N on the farms,and economic incentives directed towards subsidising farmers introducing environmentally-friendly practices (levies on excess manure production were also applied in Belgium and theNetherlands). The broad categories of regulatory instrument used in national policies to control Napplication and management were:
• rules relating to the amount of N which can legally be applied per hectare per year, either as atotal amount of manure (i.e. leaving the possibility open for application of additional fertiliserN) or as a total of both manure and fertiliser;
• regulations concerning when, how and where manure can be applied;• requirements for minimum storage capacity for manure and slurry.
The development of more rigorous nitrate control policies within EU Member States has largelybeen in response to the legislative framework imposed by the European Commission since 1980,including:
• Drinking Water Directive (EC, 1980);• Nitrates Directive (EC, 1991);• Agri-environment Programme (EC, 1992);• Rural Development Regulation (EC, 1999).
POLICY STRATEGIES 223

Recent policy in the UK has been dominated by UK government interpretation andimplementation of the EC Nitrate Directive 91/676, which required Member States to introduce aCode of Good Agricultural Practice to control nitrate loss which all farmers should apply on avoluntary basis. The objective of this Directive was to reduce water pollution by nitrates fromagricultural sources, and to prevent further such pollution. In addition, NVZ were designatedunder the Directive. Within these zones, 68 of which had been designated by 1999, an Action Planfor the reduction of pollution by nitrates is implemented. Only catchments where nitrateconcentration in sources of drinking water already exceeds the EC standard, or is likely to by2010, have been designated, although the Directive allows for the designation of NVZs incatchments where eutrophication is a major risk. Details of the practical steps included in theAction Plan for the reduction of pollution by nitrates have been discussed in Chapter 2. In outline,the regulations limit applications of fertilisers to crop requirements, impose limits on the timingof fertiliser application, and impose limits on the rates and timing of application of organicmanures. In addition there is a requirement to have sufficient storage for farm wastes to coverclosed periods for spreading and to keep relevant records, including numbers of livestock grazingspecific areas of land. Evaluation of the effectiveness of these measures will only be possible afterthe NVZ scheme has been running for a number of years.
In addition to the NVZ scheme, the NSA scheme has been running since 1990 to help protectkey groundwater sources. This scheme, implemented under the Water Act 1989, is voluntary, andprovides for compensated measures to encourage farmers to convert arable land to extensivegrassland, as well as other practices going well beyond the Code of Good Agricultural Practice forthe Protection of Water. The scheme, which was closed to new applications in 1998 is due to rununtil 2005. A review of the initial impacts of the scheme by Lord et al. (1999) was discussed indetail in Chapter 2.
In Denmark, the eutrophication and pollution of groundwater due to leaching of nitrates hasbeen a major concern since the 1980s (Dubgaard, 1991; Daugbjerg, 1998), as nitrate concentrationsin Danish watercourses have been observed to be at least seven times higher in agricultural areasthan in uncultivated, semi-natural zones. As a consequence, one of the main targets of the Agri-Environment measures introduced under Regulation 2078 has been the reduction in the use ofnitrates. To obtain payments through this measure, farmers must reduce N inputs to 60% of thatrecommended by the Danish Ministry of Agriculture (Andersen et al., 2000). The whole farmmust be covered by the agreement. While only 6400 ha was entered directly under this scheme in1996, a number of other schemes, such as the maintenance of extensive grassland showed muchwider take-up (48,700 ha), and will also offer benefits in terms of reduced nitrate losses fromfarmland. Many other EU Member States have broadly similar schemes directed at changingfarming practices, for example conversion to organic farming and extensification of arable land.Most of these schemes will contribute to the goal of reduce nitrate losses from agricultural land. Inmany cases, more time needs to elapse before the full impact of land management changes can beassessed (Buller et al., 2000).
224 CHAPTER 9

Policies for reducing pesticide pollution
Early government policies towards pesticides were mainly concerned with protecting farmers andfarmworkers from the misuse of hazardous chemicals. It was not until the late 1960s and early1970s that a range of regulatory instruments were implemented in most countries (OECD, 1993),including:
• registration schemes for the marketing and use of individual products;• controls and recommendations over the use of pesticides;• safety and environmental standards for the manufacture, distribution and application of
pesticides;• standards for permitted levels of residues in food;• controls over the disposal of waste pesticides.
These instruments were not initially intended to reduce the application of pesticides and totalpesticide use continued to rise as a result. It was not until the 1980s that public concern over thepossible effects of pesticides upon human health and the environment (plus improved scientificmethods for detecting pesticide concentrations in the environment) led to the introduction ofmore specific government policies on:
• withdrawing approval for the use of those pesticides that pose the greatest threats to publichealth and the environment;
• reducing the use of, and pollution from, those pesticides that remained approved for use (OECD,1995).
Although some countries, such as Greece and Portugal, are still principally concerned withimproving the application and storage of pesticides on farms (OECD, 1993), others are pursuinggreater integration of environmental and public health concerns into pesticide policy. Animportant step in many countries has been the tightening of pesticide registration standardscombined with legislation requiring the periodic review and/or re-registration of pesticides. If apesticide is deemed not to satisfy contemporary health and environmental standards, it must bewithdrawn from sale upon termination of the prevailing certificates of approval.
Sweden completed a 5-year re-registration programme in 1995 during which 21 active ingredientswere banned (e.g. aldicarb, carbaryl, dinocap, thiram and trifluralin), 18 had additionalrestrictions imposed upon their use and 18 were voluntarily withdrawn (e.g. bromoxynil and 2,4-D). In all, 250 formulated products were withdrawn from use out of a total of 600 previouslyregistered (Matteson, 1995).
A further example of regulation of pesticide use is related to their presence in water. The 1976EC Dangerous Substances in Water Directive and 1980 EC Groundwater Directive together set aframework for the reduction or elimination of pollution by particularly dangerous substances insurface (inland, coastal and territorial marine) and ground waters (Beaumont, 1992). Thedangerous substances listed in the Directives include some pesticides, principally the persistentorganochlorines such as aldrin, dieldrin, DDT, lindane and chlordane. In addition to this Europe-
POLICY STRATEGIES 225

wide legislation, most EU Member States have their own national legislation for addressing pointsource pollution.
Maximum Admissible Concentrations (MACs) for pesticides in drinking water were set in the1980 EC Directive on Drinking Water Quality (Beaumont, 1992). This came into force in 1985 andspecifies that the MAC for any one pesticide is 0.1µg l−1 (0.1 parts per billion) and 0.5 µg l−1 (0.5parts per billion) for total pesticides, irrespective of their individual toxicity. Several EU MemberStates have been forced to take action to reduce pesticide levels in drinking water, both throughwater treatment and programmes aimed at reducing pesticide use by farmers.
In the UK during 1999 it was reported that 15 types of pesticides had reached concentrationsabove the 0.1 µg l−1 drinking water limit. However, long-term trends indicate improvement; 3% ofall drinking water samples contravened the limit in 1992 which has now decreased to 0.01%(DWI, 2000).
The focus of current water quality legislation and monitoring is upon the protection of drinkingwater supplies and human health and it has been demonstrated that quality standards can beinsufficient to protect aquatic wildlife (HMSO, 1995). The implementation of EnvironmentalQuality Standards (EQSs) is an attempt to set limits for substances that can cause environmentalharm. For aquatic environments, a given EQS should not be exceeded in order to protect thatwater bodies (Environment Agency, 2000). Values are set for each substance based ontoxicological information; there are currently 66 EQSs for pesticides.
Pesticide reduction programmes in Europe
Sweden, Denmark, and the Netherlands adopted pesticide reduction programmes in the late1980s in response to two key issues. First, increasing public concerns about agrochemicalpollution supported by environmental monitoring showed that the concentration of pesticides inthe upper layer of ground water beneath 65% of agricultural land in the EU exceeded drinkingwater standards (Reus et al., 1994). A large number of pesticides also exceed or are expected toexceed existing standards for surface water. Secondly, there was a perceived need to keep theagricultural sectors as competitive as possible. In particular because the viability of domesticagriculture and the export of agricultural products (especially vital to agricultural viability inDenmark and the Netherlands) were felt to be increasingly threatened by:
• the overuse of expensive agrochemicals;• pesticide resistance problems;• the implementation of Maximum Acceptable Concentrations for pesticide residue levels, as well
as other pesticide-related export restrictions.
The general aim of the pesticide reduction programmes in all three countries has been to maintainagricultural productivity while meeting national commitments to reduce the total quantity of allpesticides used in agriculture by at least 50% before the year 2000 (Table 9.1). Sweden initiated itsPesticide Risk Reduction Program in 1986 with the aim of reducing the quantity of pesticide activeingredients used by 1990 to 50% of average use during the base period 1981–1985. Similar targetswere set in Denmark under the Action Plan to Reduce Pesticide Application (50% reduction by
226 CHAPTER 9

1990) and in the Netherlands under the Multi-Year Crop Protection Plan (50% reduction by2000).
These latter programmes also included targets to reduce the frequency of pesticide application.In Denmark, regulations restrict the number of pesticide applications per growing season, while inthe Netherlands growers have been forbidden since 1993 to apply soil fumigants more than onceevery four years (OECD, 1995). Soil fumigants were extensively used in potato, onion and flowerbulb production and accounted for over 50% of all pesticides used in the Netherlands in 1990. It isintended that these additional restrictions on the frequency of application will force farmers toincrease their reliance on alternative pest management methods, including the use of morebalanced crop rotations. The Dutch government also adopted a third target that called for anelimination of most pesticide emissions to air, ‘non-target’ soil and water by the year 2000. This wasin recognition of the very high pesticide use characteristic of agriculture in the Netherlands, andthe shallow water table and numerous lakes and watercourses which make the Dutch nationalwater supply particularly vulnerable to pollution.
The policy instruments used to pursue the reduction targets within these national programmeshave included a combination of:
• further tightening of pesticide registration standards to eliminate or restrict the use ofparticularly hazardous chemicals;
• mandatory buffer zones (i.e. areas where pesticides may not be applied) to reduce theenvironmental impact and total volumes of pesticides used;
Table 9.1 National Pesticide Reduction Targets in Sweden, Denmark and the Netherlands (Hurst et al., 1992;OECD, 1995, 1997).
POLICY STRATEGIES 227

• mandatory training of pesticide users and the testing/certification of spraying equipment toensure that safety standards are met, necessary records are kept and only the most efficientmethods of application are used;
• greater collaboration in policy making and implementation between the government agenciesthat administer the programmes and farmers’ organisations and trade associations. These linkshave also been used to increase the flow of information about the fate of pesticides in theenvironment and to identify and promote more sustainable agricultural technologies andpractices;
• the availability of grants to help farmers cover the expense of adopting environmentally-friendly practices, such as organic farming or the establishment pesticide-free buffer zonesadjacent to ecologically sensitive areas (Hurst et al., 1992; OECD, 1995).
The Swedish and Danish programmes are paid for by pesticide taxes, while the cost of theprogramme in the Netherlands is shared by the government and agricultural industry under acovenant signed in 1993. Matteson (1995) noted that there have been successes with the pesticidereduction programmes in all three countries. In 1990, following the successful reduction ofpesticide use by 47% (without any decline in average crop yields) the Swedish parliamentintroduced more restrictions to reduce pesticide use by a further 50% to 25% of the average use inthe period 1981–1985. Similar successes in progress towards the 50% reduction target have beenreported in Denmark and the Netherlands, but achieving reductions in the frequency ofapplication (notably in Denmark) has been more difficult. This seeming paradox is apparentlyexplained because reductions in pesticide use have mainly been achieved by improving theefficiency of application (i.e. using less active ingredient per application), rather than substitutingpesticide application with non-chemical pest control methods (Matteson, 1995). In response tothis, the Danish government has implemented greater restrictions on pesticide applications,mandatory record keeping and more attractive subsidies for low input farming systems. Nationalpesticide taxes have also been increased to provide more funds for environmental schemes and toincrease research on organic farming.
These examples from northern Europe are evidence of the potential to apply pesticide reductionprogrammes without compromising the well-being of a country’s agricultural sector. According toMattesson (1995), some of the key lessons to be learnt are:
• The importance of setting measurable targets with strict deadlines in order firstly to stimulateaction amongst farmers, researchers and advisors, and secondly to preserve momentum in agoal-orientated pesticide reduction process.
• The need to be cautious and choose realistic initial programme targets that have a high chanceof being achieved so that the programme is perceived as a success and thereby worthy of furtherpublic and political support. For instance, both Sweden and Denmark have greatly reduced thequantity of pesticides used in agriculture, but have yet to reduce the frequency of application.However, whilst Sweden’s ‘Pesticide Risk Reduction Program’ is a great success according tothe targets it set for itself, Denmark’s ‘Action Plan to Reduce Pesticide Application’ appears notto be.
228 CHAPTER 9

• The need to monitor the progress being made towards programme targets in order that policymakers can identify weaknesses and gaps in the reduction programme and take appropriatemeasures to improve its performance (e.g. allocate resources to new policy instruments).
• The importance of fully integrating the principles of pesticide reduction into all agriculturalpolicy. In some instances in northern Europe, for example, seemingly unrelated policies andregulations which are valuable in another context have inadvertently promoted, continued, oreven increased, pesticide use.
Policies that have conflicted with pesticide reduction include first, the privatisation of agriculturalextension in Denmark and the Netherlands, making access to advice and services which werepreviously free more difficult and expensive. This discouraged farmers from seeking technicalassistance and had a negative impact on pesticide use reduction because alternative pestmanagement practices are information and knowledge ‘intensive’. Secondly, the discontinuationof funding in Denmark for a management economics programme developing techniques forfarmers’ evaluation of new pest management technology. Thirdly, environmental protectionmeasures in Denmark promoting an expansion of winter cropping to reduce nitrate leachingcaused an increase in pesticide use because winter wheat crops require more pesticides thanspring barley (Hurst et al., 1992).
9.5FUTURE DIRECTIONS
Adoption of sustainable farming practices
During the last 10 years it has become apparent that there is a powerful case to be made for linkingproduction practices in agriculture with protection of the rural environment. Scientific evidence,much of it reviewed in this book, now clearly demonstrates the link between inputs, managementpractices and outputs from agricultural systems and their consequent environmental impact. Thewidespread debate stimulated by governmental and non-governmental organisations regardingthe appropriate use of resources and land management practices is also driving the development ofenvironmentally sensitive farming practice. For example, LEAF (Linking Environment andFarming) is one of a number of non-governmental organisations throughout Europe that activelyencourages the adoption of practical, integrated crop and farm management (ICM and IFM).DEFRA now encourages discussion and adoption of target indicators for a more sustainableagriculture (MAFF, 2000) which include conventional measures of environmental quality such asnutrient and pesticide concentrations in rivers, as well as more general indicators of system health,such as soil organic matter content. This process is being enhanced by the major retailers who,through their quality protocols, encourage farmers to adopt more environmentally friendly, lesspolluting farming practices.
To this end, the concept of increased sustainability within agriculture has emerged as animportant guiding principle that is shaping the outlook of governmental and non-governmentalorganisations around the world. There is now a widespread consensus that food production
POLICY STRATEGIES 229

systems are needed which are not only capable of feeding a growing population and generatingsufficient returns to maintain agricultural communities, but can also sustain these objectives by:
• avoiding heavy reliance upon any external inputs, notably those utilising non-renewableresources, such as fossil fuels;
• maintaining and improving the means of production;• producing minimal negative impact upon the natural environment.
The widespread adoption of agri-environment schemes throughout Europe following theintroduction of Regulation 2078/92 has made a significant step towards sustainability (EC, 1998).By 1998 agri-environment contracts that deliver environmental services applied to over 20% ofEuropean farmland. There is much evidence, summarised by the EC (1998) that shows thesubstantial benefits that have accrued from these agri-environmental programmes. Many of thesedirectly or indirectly lead to reduced pollution potential, for example:
• many of the broad programmes to limit inputs use significantly less N-fertiliser and betterapplication techniques, resulting in a lower N surplus;
• strong evidence of positive activities for nature protection is available. This results from thesymbiotic link between European biodiversity and farming on which it depends;
• application of programmes has had some effects on changing attitudes, both of farmers and thegeneral public. Farming is increasingly seen as an activity consistent with environmental care.
Further monitoring and assessment is underway across Europe to evaluate the longer termenvironmental benefits of the Agri-Environment and the Rural Development Regulation.
Legislative changes
The implementation of the Rural Development Regulation will continue the shift from productionsubsidies to support for farming practices conducted in sympathy with the wider environment. Itis clear that scientific research has identified a number of solutions to pollution problems that arecaused by ‘inappropriate’ land management practices. Furthermore, the farming industry nowlargely accepts that it has a responsibility to manage land in a more environmentally benignmanner. However, the process of technology transfer still remains frustratingly slow in somecases. In addition, as was noted by EC (1998) there has been less progress in regions whereintensive farming produces high value crops. In these cases, yield reductions are often toosubstantial for price support mechanisms to be able to fully compensate for lost profit associatedwith reduced inputs. In such cases a stronger regulatory framework is more likely to achieveeffective pollutant reduction targets.
Several key articles of national government legislation have had a direct impact on pollutionissues discussed in this book. For example, the Water Act 1989 included the legislation that led tothe establishment of the NSA scheme. Similarly, statutes in the Environmental Protection Act1990 led to the ban on straw burning in 1993. The Environment Agency, the government agencythat takes the lead in monitoring pollution in the rural environment, was set up following theenactment of the Environment Act 1995. Further legislation will follow recent European
230 CHAPTER 9

directives. The introduction of the IPPC Directive (96/91/EC) represents a positive step to controlall potential emissions from industry. The main purpose of the IPPC Directive is to achieveintegrated prevention and control of pollution from listed activities. This is to be done bypreventing, or where that is not practicable, reducing emissions to the air, water and land bypotentially polluting industrial and other installations ‘so as to achieve a high level of protection ofthe environment taken as a whole’ (NSCA, 2001). Within the directive, emphasis is placed inidentifying ‘best available technology’ and encouraging industry to adopt production technologiesthat provide an acceptable balance between minimising environmental emissions and othercriteria including cost (Robinson, 1999). In the case of the agriculture industry, the directiveaffects intensive pig units with more than 750 sows or 2000 weaners, and poultry units with morethan 40,000 birds. The Pollution Prevention Control Act 1999 enables regulations to be madeimplementing the IPPC Directive. The Pollution Prevention and Control Regulations 2000(Statutory Instrument No. 1973) fulfils the requirement of the IPPC Directive, and is significant inthat for the first time controls have been introduced over emissions to the atmosphere fromagricultural activities.
Further EU legislation is included within the Water Framework Directive (2000/60/EC), agreedin October 2000, and will be progressively implemented in Member States over the next 5 to 10years. The Directive sets the overall goal for surface waters as good ecological status, i.e. it is anecosystem-based approach, not one based on individual chemical parameters. It also requiresintegrated management of waters and full inclusion of stakeholders in the process. The Directivealso requires that abstraction of surface and ground waters be managed to a sustainable level. Thedirective does not include any specific pollution control powers, but will be an important vehiclefor the control of eutrophication. The directive will provide a framework for a coordinatedapproach to sustainable water management on a catchment basis. Thus it will focus attention onthe issue of how to control diffuse pollution from agricultural sources, and may lead toconsideration of more specific legislation at national level to address diffuse pollution (Robinson,1999).
While legislation will continue to push forward developments and speed up the adoption of lesspolluting farming practices, effective steps can only be made with the full cooperation of thefarming community. As Webb et al. (2001) commented, in a review of the impact of farmingpractices on soil fertility, ‘reduction in pollution is, for the most part, more likely to be achieved bychanging practices to conserve potential pollutants in the soil, rather than across-the-board inputreductions which may have little effect on losses but cause significant reductions in crop yields’.Effective control of pollution from agricultural sources will depend on demonstrating both theenvironmental and economic benefits to land managers. Only then will there be a widespreadadoption of more resource efficient farming practices.
REFERENCES
Addiscott, T.M., Whitmore, A.P. and Powlson, D.S. (1991) Farming, Fertilizers and the Nitrate Problem. CABInternational, Wallingford.
Alexander, H. (1993) Lessons in Landcare: Australia’s Model for a Better Farming Future. The SAFEAlliance, London.
POLICY STRATEGIES 231
Andersen, E., Henningsen, A. and Primdahl, J. (2000) Denmark: implementation of new agri-environmentalpolicy based on Regulation 2078. In: Agri-environmental Policy in the European Union (Eds H.Buller,G.A.Wilson and A.Holl). Ashgate, Aldershot, pp. 31–50.
Baldock, D. and Beaufoy, G. (1992) Plough On! An Environmental Appraisal of the Reformed CAP. World WideFund for Nature (UK), Goldalming.
Baldock, D. and Mitchell, K. (1995) Local Influence: Increasing Local Involvement in the Development ofGreen Farming Schemes. Council for the Protection of Rural England, London.
Beaumont, P. (1992) Pesticides, Europe and The Environment: A Review. Pesticide News 16, 12–15.Brassley, P. and Lobley, M. (2002) The Common Agricultural Policy of the European Union. In: The
Agricultural Notebook (Ed. R.J.Soffe). 20th Edition. (In press).Brouwer, F. and Hellegers, P. (1997) Nitrogen Flows at Farm Level across European Union Agriculture. In:
Controlling Mineral Emissions in European Agriculture (Eds E.Romstad, J.Simonsen and A.Vatn). CABInternational, Wallingford, pp. 11–26.
Buller, H., Wilson, G.A. and Holl, A. (2000) Agri-Environmental Policy in the European Union. Ashgate,Aldershot.
Clunies-Ross, T. (1993) Taxing nitrogen fertilisers. The Ecologist 23, 13–17.Conway, G. and Pretty, J. (1991) Unwelcome Harvest: Agriculture and Pollution. Earthscan Publications,
London.Crabtree, J.R. and Chalmers, N.A. (1994) Economic evaluation of policy instruments for conservation:
standard payments and capital grants. Land Use Policy 11, 94–106.Dampney, P.M.R., Lord, E.I. and Chambers, B.J. (2000) Development of improved advice for farmers and
advisers. Soil Use and Management 16, 162–166.Daugbjerg, C. (1998) Linking policy networks and environmental policies: nitrate policy making in Denmark
and Sweden 1970–1995. Public Administration 76, 275–294.DEFRA (2001) England Rural Development Programme, http://www.defra.gov.uk/erdp/schemes/
schemesindex.htmDubgaard, A. (1991) The Danish Nitrate Policy in the 1980s. Statens Jordbrugsokonomiske Institut Report No.
9, Copenhagen.DWI (2000) Overview of Water Quality in England and Wales, Drinking Water 1999. Drinking Water
Inspectorate, Department of the Environment, Transport and the Regions, London.EC (1980) Council Directive (EEC) No. 778/80 relating to the quality of water intended for human
consumption, Official Journal of the European Communities No. L229 (30/8/80), 1–8.EC (1991) Council Directive (EEC) No. 676/91 concerning the protection of waters against pollution caused
by nitrates from agricultural sources, Official Journal of the European Communities No. L375 (31/12/91) , 1–7.
EC (1992) Council Regulation (EEC) No. 2078/92 on agricultural production methods compatible with therequirements of the protection of the environment and the maintenance of the countryside. OfficialJournal of the European Communities No. L215 (30/7/92), 85–90.
EC (1998) State of application of Regulation (EEC) No. 2078/92: Evaluation of Agri-EnvironmentProgrammes. DGVI Commission Working document VI/7655/98. European Commission, Brussels.
EC (1999) Council Regulation (EEC) No. 1257/1999 on support for rural development from the EuropeanAgricultural Guidance and Guarantee Fund (EAGGF) and amending and repealing certain Regulations,Official Journal of the European Communities No. L160 (26/06/99), 80–101.
Eckerberg, K. and Forsberg, B. (1996) Policy Strategies to Reduce Nutrient Leaching from Agriculture andForestry and their Local Implementation: A Case Study of the Laholm Bay, Sweden. Journal ofEnvironmental Planning and Management 39, 223–242.
Elworthy, S. (1994) Farming for Drinking Water-Nitrate Pollution of Water: An Assessment of aRegulatory Regime. Avebury Studies in Green Research, Aldershot.
232 CHAPTER 9

Environment Agency (2000) Pesticides 1998. A summary of monitoring of the aquatic environment inEngland and Wales. Environment Agency, Bristol.
Frederiksen, B.S. (1995) National Responses to the EC Nitrate Policy. Journal of Environmental Planningand Management 38, 253–263.
HMSO (1995) Pesticides in Surface Waters. HMSO, London.HoC (1997) Environmentally Sensitive Areas and other Schemes under the Agri-environment Regulation.
Second Report from the House of Commons Select Committee on Agriculture Inquiry: Volume I-Report.House of Commons Paper 45. HMSO, London.
Hurst, P., Beaumont, P. Jorgensen, C.E. and Winther, S. (1992) Pesticide Reduction Programs in Denmark,the Netherlands, and Sweden. World Wide Fund for Nature International, Gland.
Jenkins, T.N. (1990) Future Harvests—The Economics of Farming and the Environment: Proposals forAction. A report to CPRE and WWF(UK), Council for the Protection of Rural England, London.
Lockeretz, W. (1991) Information requirements of reduced-chemical production methods, American Journalof Alternative Agriculture 6, 97–103.
Lord, E.I., Johnson, P.A. and Archer, J.R. (1999) Nitrate sensitive areas: a study of large scale control of nitrateloss in England. Soil Use and Management 15, 201–207.
Lowe, P. and Ward, N. (1997) The Moral Authority of Regulation: The Case of Agricultural Pollution. In:Controlling Mineral Emissions in European Agriculture (Eds E.Romstad, J.Simonsen, and A.Vatn) CABInternational, Wallingford, pp. 59–71.
MAFF (1991) Our Farming Future. MAFF Publication No. 0703. Ministry of Agriculture, Fisheries and FoodPublications, London.
MAFF (1998) Code of Good Agricultural Practice for the Protection of Water. Ministry of Agriculture,Fisheries and Food, London.
MAFF (2000) Towards sustainable agriculture. Ministry of Agriculture, Fisheries and Food, London.Matteson, P.C. (1995) The ‘50% Pesticide Cuts’ in Europe: A Glimpse of Our Future? American Entomologist
41, 210–220.NSCA (2001) Pollution Handbook 2001. National Society for Clean Air and Environmental Protection,
Brighton.OECD (1975) The Polluter-Pays Principle: Definition, Analysis and Implementation. Organisation for
Economic Co-operation and Development, Paris.OECD (1989) Agricultural and Environmental Policies—Opportunities for Integration. Organisation for
Economic Co-operation and Development, Paris.OECD (1991) Environmental Policy: How to Apply Economic Instruments. Organisation for Economic Co-
operation and Development, Paris.OECD (1993) Agricultural and Environmental Policy Development: Recent Progress and New Directions.
Organisation for Economic Co-operation and Development, Paris.OECD (1995) Sustainable Agriculture: Concepts, Issues and Policies in OECD Countries. Organisation for
Economic Co-operation and Development, Paris.OECD (1996) Saving Biological Diversity: Economic Incentives. Organisation for Economic Co-operation
and Development, Paris.OECD (1997) Environmental Indicators for Agriculture. Organisation for Economic Co-operation and
Development, Paris.PARCOM (1993) Report on Nutrients from Agriculture. Oslo and Paris Conventions for the Prevention of
Marine Pollution—Fifteenth Meeting of the Oslo and Paris Commissions, Berlin (14–19 June).Reus, J.A., Weckseler, H.J. and Pak, G.A. (1994) Towards a Future EC Pesticide Policy: An Inventory of
Risks of Pesticide Use, Possible Solutions and Policy Instruments. Centre for Agriculture andEnvironment, Utrecht.
POLICY STRATEGIES 233

Robinson, R. (1999) The Environment Protection Viewpoint. In Accounting for Nutrients: a Challenge forGrassland Farmers in the 21st century (Ed. A.J.Corrall). Occasional Symposium No. 33. BritishGrassland Society, pp. 127–136.
Romstad, E., Simonsen, J. and Vatn, A. (Eds) (1997) Controlling Mineral Emissions in EuropeanAgriculture. CAB International, Wallingford.
Runge, C.F. (1994) The environmental effects of trade in the agricultural sector. In: The EnvironmentalEffects of Trade. Organisation for Economic Co-operation and Development, Paris, pp. 19–54.
Scheele, M. (1997) The Decomposition Approach: Spatially Differentiated Analysis and Implementation ofEnvironmental Strategies. In: Controlling Mineral Emissions in European Agriculture (Eds. E.Romstad, J.Simonsen, and A.Vatn). CAB International, Wallingford, pp. 41–58.
Tamminga, G. and Wijnands, J. (1991) Animal Waste Problems in the Netherlands. In: Farming and theCountryside: An Economic Analysis of External Costs and Benefits (Ed. N.Hanley). CAB International,Wallingford, pp. 117–136.
Taylor, G. and Welford, R. (1994) Environmental strategies of leading UK supermarket chains. In: Cases inEnvironmental Management and Business Strategies (Ed. R.Welford). Pitman, London, pp. 125– 135.
Ward, N. (1996) Pesticides, Pollution and Sustainability. In: The Rural Economy and the British Countryside(Eds P.Allanson and M.Whitby). Earthscan, London, pp. 40–61.
Waters, G.R. (1994) Government policies for the countryside. Land Use Policy 11, 88–93.Watson, N., Mitchell, B. and Mulamootil, G. (1996) Integrated resource management: institutional
arrangements regarding nitrate pollution in England. Journal of Environmental Planning &Management 39, 45–64.
Webb, J., Loveland, P.J., Chambers, B.J., Mitchell, R. and Garwood, T. (2001) The impact of modern farmingpractices on soil fertility and quality in England and Wales. Journal of Agricultural Science(Cambridge) 137, 127–138.
234 CHAPTER 9

Author Index
Alexander, H. 219
Baggs, E.M. 139Benbrook, C.M. 197, 201Biddlestone, A.J. 123Boardman, J. 80
Carson, R. 161Catt, J.A. 79Chambers, B.J. 75Cilgi, T. 173Clayton, H. 139Clunies-Ross, T. 218Conway, G.R. 129, 180Cook, S. 74
De Klein, C.A.M. 139Dewar, A.M. 201Downey, R.K. 199
Eckberg, K. 216, 219Edwards, A.C. 44, 52Ellstrand, N.C. 191Evans, R. 74, 75, 80
Farkas, R. 162Forsberg, B. 216, 219Fowler, D. 134Foy, R.H. 97Frederiksen, B.S. 222
Goulding, K.W.T. 20
Hall, L. 201Harrod, T. 79Heaney, S.I. 78Heckrath, G. 54
Hellmich, R.L. 205Hope, A. 197Hudson, N. 81
Jenkinson, D.S. 10Jepson, P.C. 173Jesse, L.C.H. 204, 205Johnson, B. 197
Kirk, M. 97Kjolholt, J. 173
Lampkin, N. 182Losey, J.E. 203Lowe, P. 217
Matteson, P.C. 227, 228Matthiessen, P. 79Mellon, M. 199Miller, P.C.H. 179Misselbrook, T.H. 134Morgan, R.P.C. 80, 81, 84
Obrycki, J.J. 203, 204, 205Osborn, C.T. 78
Pain, B.F. 134Pap, L. 162Parish, S. 182Patterson, D.C. 111Perry, J.N. 193Pretty, J.N. 129, 180
Raju, G.S. 170Reganold, J.P. 75Reiss, M.J. 193Rissler, J. 199
235

Robinson, R. 220Romstad, E. 219
Scheele, M. 218Schofield, K. 95Scott, A. 139Sears, M.K. 205Skinner, R.J. 75Stafford, J.V. 179Stanley-Horn, D.E. 205Steen, R.W.J. 111Straughan, R. 193Svec, M. 162
Tabashnik, B.E. 203Thayanithy, K. 122
Ward, N. 217Wase, D.A.J. 122Watson, N. 221Webb, J. 231Wild, A. 22Withers, P.J.A. 44
Young, C.E. 78
236 AUTHOR INDEX

Subject Index
Action Plan to Reduce Pesticide Application(Denmark) 226, 227, 228
ADAS Farm Waste Management Plan (1994) 112Advisory Committee on Pesticides (ACP) 171Advisory Committee on Releases into the
Environment (ACRE) 196AGCO/ADAS 36, 162Agenda 2000 214agricultural pollution, background xvi;
cost of 6;defined 3;monitoring impacts of 4;solving the problem 4, 8
Agricultural Research Service (USA) 68Agriculture Act (1947) xviagriculture, effect of government policy on xvi;
and EU 2;key characteristics xvi;land management 74
Agri-Environment Programme 220, 223Agri-Environmental Regulation (1992) 214, 229ammonia 21;
minimising emissions by good practice 135;pollution problems 132;practical solutions 134;sources of pollution 133;in watercourses 95
animal feeds 61aphids 185aquatic environment, ammonia in 95;
chemical pollutants 78;impacts of sediment on 76;organic pollution incidents 96, 97;organic pollution of 94;pesticides in surface/ground waters 168, 169, 177,see also water
Aquatic Eutrophication in England and WalesAcknowledgement Strategy 59
Austrian Federal Act on Water 222
Bacillus thuringiensis 202beetle banks 185, 186Biochemical Oxygen Demand (BOD) 94biogas production 122biological control of pests 184biosolids see sewage sludgebiotechnology see genetic modification (GM)Broadbalk Continuous Wheat Experiment (1995) 54buffer zones 64
carbamates 158, 160carbon dioxide, pollution problems 141;
practical solutions 142;sources of pollution 142
carboxamides 161Carrot Marketing Board 183Codes of Good Agricultural Practice 30, 59, 109, 110,
120, 121, 135, 145, 147, 173, 175, 217, 220, 223Common Agricultural Policy (CAP) 2, 214Conservation Reserve Program (CRP) 78, 83contaminants 3, 4Control of Pesticides Regulations (1986) 179Control of Pollution (Silage, Slurry and Agricultural
Fuel Oil) Regulation (1991) 109, 220Control of Pollution Act (1974) 217corn borers 185Countryside Stewardship Scheme 215critical load, nitrogen 20crop management 32;
avoiding contamination by pathogens 121;crop covers 34, 183;forage maize 79;and gaseous emissions 139;
237

harvesting strategy 183;herbicide-resistant 196;horticultural 79;insect-resistant 202;pest control 182;resistant varieties 183;rotation 14, 75;and soil erosion strategies 81;spatial separation 183;weed control 181
dairy cows, cubicles 93;deep litter housing 92
Danish Ministry of Agriculture 223DDT 17, 165, 225Department for the Environment, Food and Rural
Affairs (DEFRA) 31, 36, 173
EC/EU Directives 35, 56, 119, 147, 173, 179, 196, 222,225, 230
England Rural Development Programme (ERDP)216
environment, assessment of GM risk 205;behaviour/fate of pesticides in 164;enhancement of 185;eutrophication 59;impact of insecticides on 203;implications of P pollution 55;N and P balance in natural waters 55;P in ground/surface waters 57;problems caused by P 57
Environmental Protection Act (1990) 109, 143, 230Environmental Protection Agency (EPA) 68, 79, 96,
169, 203, 204Environmental Quality Standards (EQS) 225Environmentally Sensitive Areas (ESA) 64, 215European Fertiliser Manufacturers Association
(EFMA) 31European Union (EU) 134;
and agricultural intensification 2;nitrate pollution control policies in 222;pesticide reduction programmes in 225
externalities 6
farm scale evaluation (FSE) 81, 206farm waste, biogas production 122;
case studies 96, 114;dirty water 92;handling, storage, disposal 109;
Management Plan 112;on-farm food processing 96;pathogens from 96;pollution risks 94;reed bed treatment 123;silage effluent 92, 96;slurries 91, 96;solid manure 92;veterinary products 96;water pollution incidents 97
farming, and adoption of sustainable practices 228;changes in 92
fertiliser 14;cover crops 34;cultivation/crop management 32;and gaseous emissions 139;limiting N loss 33;livestock feed 61;optimisation of N use 31;optimisation of P use 60;replacement values of manures 32;trace metals in 103;use of 21
food 28, 171Food and Agriculture Organisation (FAO) 68Food and Environment Protection Act (1985) 173fossil fuels 142fungicides, background 160;
resistance to 162;traditional inorganics 160;types of 160
gaseous emissions 7;and agriculture 129;ammonia 132;atmospheric fate of 132;background 129;carbon dioxide 141;farm odours 143;greenhouse 137;methane 136;nitrous oxide 138
genetic modification (GM), assessing environmentalrisk 205;
background 191;future for 207;gene flow 200;gene insertion process 195;outcrossing 199;
238 SUBJECT INDEX
risks/benefits 196genetically modified organisms (GMOs) 196, 207global warming 137golden rice 193government policy/legislation, emergence of agri-
environmental 210;future directions 228;implementation/dissemination 219;instruments 217;learning from experience 220;strategies 217
greenhouse gases 137, 142
Herbicide Resistance Action Committee 162herbicides 5;
background 159;crop resistance 196;effect on wildlife 173;impact on soil erosion 79;resistance to 162;types of 159
honeybees 175housefly 162
insecticides, background 157;resistance to 162;types of 157
Kyoto Protocol 142, 143
Laurel Farm (Dorset) 114legislation see government policy/legislationlimestones 103Linking Environment and Farming (LEAF) 229livestock, location/design of new units 145;
management of housing/feeding 92, 147;odours associated with 144, 148
manure 15, 26, 45, 92;drug residues in 97;and gaseous emissions 139;precautions when spreading 148;problems of 91;solid 110;storing/handling 148;value of organic 90, 91
Manure Nitrogen Evaluation Routine (MANNER)program 32
Maximum Admissible Concentrations in water(MACs) 225
methane, pollution problems 136;practical solutions 136;sources of 136
mid-field ridges 185, 186Ministry of Agriculture, Farming and Fisheries
(MAFF) 82, 83, 92, 96, 111, 135, 136, 145, 149, 173monarch butterfly 204Monsanto 196, 197Multi-Year Crop Protection Plan (Netherlands) 226,
227, 228
National Farmers Union (NFU) 183National Rivers Authority (NRA) 98, 217National Soil Resources Institute in England and
Wales 74Nitrate Sensitive Areas (NSA) 29, 30, 36, 215, 223Nitrate Vulnerable Zones (NVZ) 29, 32, 36, 223nitrates 7;
causes of pollution 23;and drinking water 27;and eutrophication 28;in food 28;leaching 18;policies for reducing pollution 220;problems caused by 27;reducing losses 28
nitric oxide 20nitrogen, adsorption/fixation 17;
animal manures 15;atmospheric deposition 13;biological fixation 14;cycle 13;described 10;fertiliser 14, 21;immobilisation 16;mineralisation 16;nitrification 17;in sewage sludge 104;transformations 15;uptake/losses 17
nitrous oxide 20, 129;pollution problems 138;practical solutions 140;sources of pollution 138
non-agricultural wastes, and avoidance of cropcontamination 121;
benefits of 106;
SUBJECT INDEX 239
detrimental effects of 107;sewage sludge 98, 119;types of 106
non-governmental organisations (NGOs) 229
odours, location/design of new livestock units 145;minimising nuisance by good managementpractice 147;practical solutions 145;sewage sludge 105;sources of pollution 143;technologies for reducing 148
OECD 217organic wastes 7;
and agriculture 88;alternative technologies for farm waste treatment122;background 88;farm 91;non-agricultural 119;non-agricultural organic soil amendments 98;practical solutions 109
organophosphates (OPs) 157OSPAR Convention 59Our Farming Future (1991) 214oxathins 161
parasitic wasps 186pathogens 105, 121pest control, enhancement of environment 185;
natural enemies/ biological 184;non-chemical 182
Pesticide Risk Reduction Program (Sweden) 226,227, 228
Pesticides (Maximum Residue Levels in Food)Regulations (1988) 171
pesticides 5, 8;active ingredients 155;adjuvants 179;in air 178;alternatives to synthetic 180;application of 154, 156;background 152;behaviour/fate of in environment 164;disposal of waste 177;effect on honeybees 175;effects on non-farmed organisms 170;environmental problems caused by residues 167;good practice 173;
history of 152;impact on soil erosion 79;keeping records 177;liquid/solid formulations 155;microbial 180;mode of action 156;naturally derived 180;new formulations 179;new technology 178;persistence of 164;planning/preparation 175;policies for reducing pollution 224;as pollutants 161;practical solutions 173;residues in food chain 171;resistance/resurgence 162;in soil 177;target organisms 155;trace metals in 103;use of 152;user training in 175;in water 177;working with 175
phenoxyacetic acids 159phenylamides 161phosphates 7phosphorus, and agriculture 40;
animal manures 45;atmospheric inputs 44;background 40;cycle 42;distribution in soil 46;drain flow 54;environmental implications of 55;environmental problems caused by 57;fertiliser 44;impact on aquatic environment 78;inputs/outputs 43;losses 51;plant content 42;practical solutions for 59;in sewage sludge 104;sorption 49;surface run-off 52;transfer management by soil conservation 62;transformations in soil 46;utilising indigenous soil 50
Plant Protection Products Regulations (1995) 179policies see government policy/legislation
240 SUBJECT INDEX

Polluter-Pays Principle 218Pollution Prevention Control Act (1999) 230pollution, defined 3;
diffusion 162;management of 5;point source 162
polyphagous predators 185Pressure-State-Response (PSR) framework 215pyrethoids 158
RCEP 96, 129red spider mite 184reed bed treatment (RBT) 123rock phosphate 44Roundup Ready crops 196, 197, 201Royal Commission on Environmental Pollution
(RCEP) 70Royal Society for the Protection of Birds (RSPB) 198Rural Development Regulations (1999) 216, 229,
230
sediment 76sewage sludge (biosolids) 98;
avoiding pollution problems 120;disposal 119;and gaseous emissions 139;N and P pollution from 104;odours 105;pathogens 105;pollution risk 100;trace metals in 101
sheep dip 169silage 92, 96, 111Silent Spring (Carson) 161Sludge (Use in Agriculture) Regulations (1989) 119,
121slurry 91, 96, 111;
precautions when spreading 148;storing/handling 148
soil erosion, accelerated 74;assessment of risk 81;background 68;chemical impacts 78;environmental impacts of 76;extent of 68;farm/catchment based strategies 83;field/crop based strategies 81;impacts of sediments on land 80;physical impacts 76;
practical solutions to 80;processes/products of 70;vulnerability of 68
soil, conservation 62;distribution of P in 46;fate of pesticides in 165;loss of pesticides from 166;pesticides in 177
sulphur 129Supply Chain Initiative on Modified Agricultural
Crops (SCIMAC) 206‘Sustainable Use of Soil, The’ (1996) 70
Town and Country Planning (Assessment ofEnvironmental Effects) Regulations (1988) 147
Town and Country Planning (General PermittedDevelopment) Order (1995) 145
trace metals, in aerial deposition 103;country comparisons 120;in fertilisers, pesticides, limes 103;in livestock wastes 101;in sewage sludge 101
triazines 159
UN Economic Commission for Europe 134
Water Act (1989) 230Water Resources Act (1991) 217water, dirty 92, 112;
drinking 27, 222, 225;erosion 71, 81;farm pollution incidents 97;impacts of sediment on 76;quality of 79,see also aquatic environment
weather 19weed control, appropriate cultivation 181;
mechanical intervention 182;night-time cultivation 181;non-chemical 181;thermal intervention 182
wetlands, constructed 64Wheat Powdery Mildew 162whitefly 184wildlife 170, 175Wildlife Incident Investigation Scheme (WIIS) 172wind erosion 74, 82Woburn Market Garden Experiment (1942) 104World Wildlife Fund (WWF) 203
SUBJECT INDEX 241