Merrill Lynch - Swiss Re
13
ab Merrill Lynch Banking & Insurance CEO Conference Jacques Aigrain Chief Executive Officer London, 4 October 2007 Slide 2 ab Merrill Lynch CEO Conference 4 October 2007 Today’s agenda “Delivering Growth in a Riskier World” Generate economic profit growth Reduce earnings volatility Enlarge market scope ILS - reduce risk and provide growth Summary and outlook
Transcript of Merrill Lynch - Swiss Re
abMerrill LynchBanking & Insurance CEO Conference
Jacques AigrainChief Executive Officer
London, 4 October 2007
Slide 2
ab
Merrill LynchCEO Conference4 October 2007
Today’s agenda
“Delivering Growth in a Riskier World”Generate economic profit growth Reduce earnings volatilityEnlarge market scope ILS - reduce risk and provide growth
Summary and outlook
Slide 3
ab
Merrill LynchCEO Conference4 October 2007
Strategic direction
Our aspiration
To be the leading force in the risk transfer industry, combining professional resources and skills with customer focus to deliver economic profit growth
Generate economic profit growth
Higher sustainable shareholder
returns
Best-in-classcustomer service
Reduce earnings volatility
Enlarge market scope
Our capital markets expertise, scale and diversification
Organic and transaction-related activities to address the needs of our clients
Efficient processes, innovative skills and professional expertise
Talent, culture and organisational efficiency
Intelligent cycle management and efficient capital allocation
through
through
through
through
Slide 4
ab
Merrill LynchCEO Conference4 October 2007
ProportionalAchieved price as % of technical reference price 2006 2007 Total
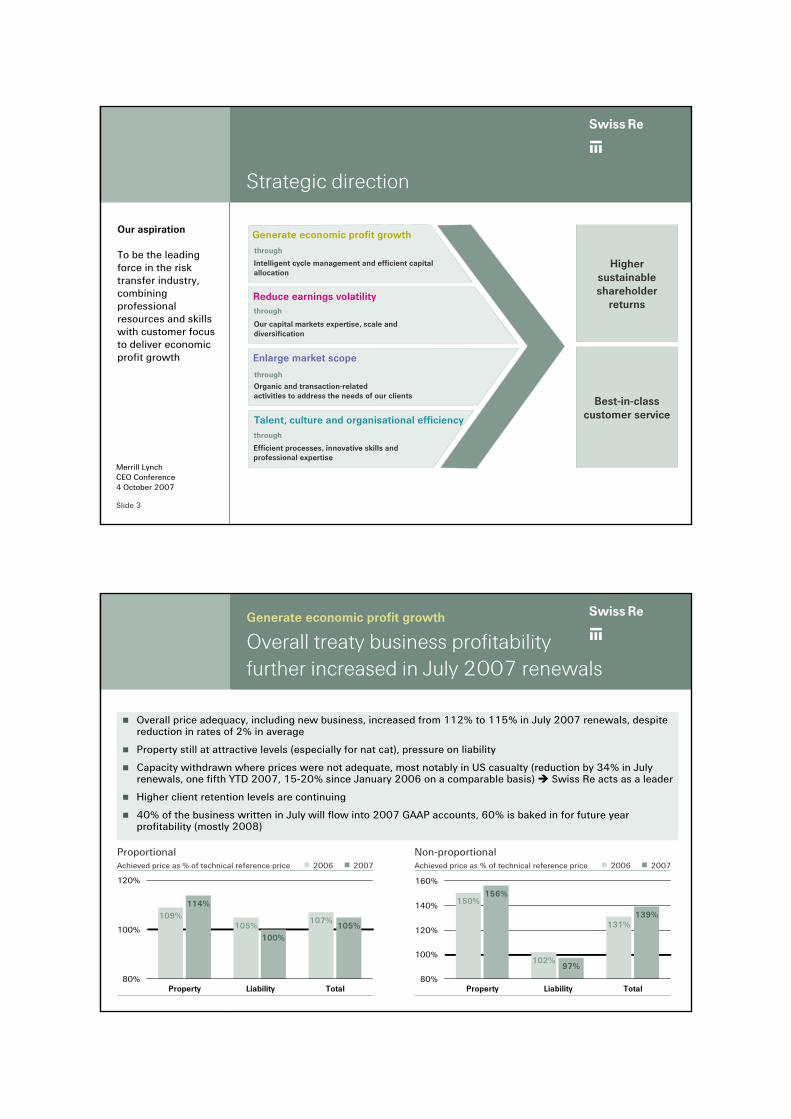
Overall treaty business profitability further increased in July 2007 renewals
Generate economic profit growth
Overall price adequacy, including new business, increased from 112% to 115% in July 2007 renewals, despite reduction in rates of 2% in average
Property still at attractive levels (especially for nat cat), pressure on liability
Capacity withdrawn where prices were not adequate, most notably in US casualty (reduction by 34% in July renewals, one fifth YTD 2007, 15-20% since January 2006 on a comparable basis) Swiss Re acts as a leader
Higher client retention levels are continuing
40% of the business written in July will flow into 2007 GAAP accounts, 60% is baked in for future year profitability (mostly 2008)
109%105%
107%
114%
100%105%
80%
100%
120%
Property Liability Total
Non-proportionalAchieved price as % of technical reference price 2006 2007
150%
102%
131%
156%
97%
139%
80%
100%
120%
140%
160%
Property Liability Total
Slide 5
ab
Merrill LynchCEO Conference4 October 2007
52 week renewals traditional portfolio
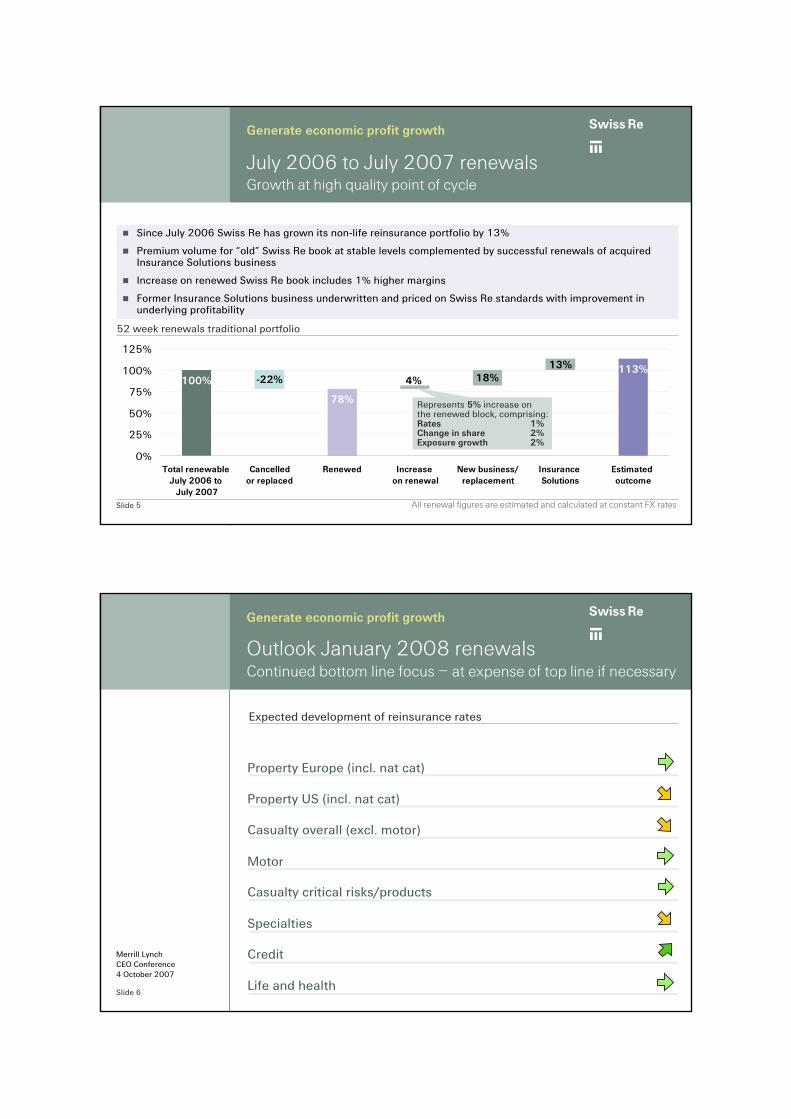
July 2006 to July 2007 renewalsGrowth at high quality point of cycle
All renewal figures are estimated and calculated at constant FX rates
Since July 2006 Swiss Re has grown its non-life reinsurance portfolio by 13%
Premium volume for “old” Swiss Re book at stable levels complemented by successful renewals of acquired Insurance Solutions business
Increase on renewed Swiss Re book includes 1% higher margins
Former Insurance Solutions business underwritten and priced on Swiss Re standards with improvement in underlying profitability
100%
78%
13% 113%-22% 4% 18%
0%
25%
50%
75%
100%
125%
Total renewable July 2006 to
July 2007
Cancelledor replaced
Renewed Increase on renewal
New business/replacement
Insurance Solutions
Estimated outcome
Represents 5% increase on the renewed block, comprising:Rates 1%Change in share 2%Exposure growth 2%
Generate economic profit growth
Slide 6
ab
Merrill LynchCEO Conference4 October 2007
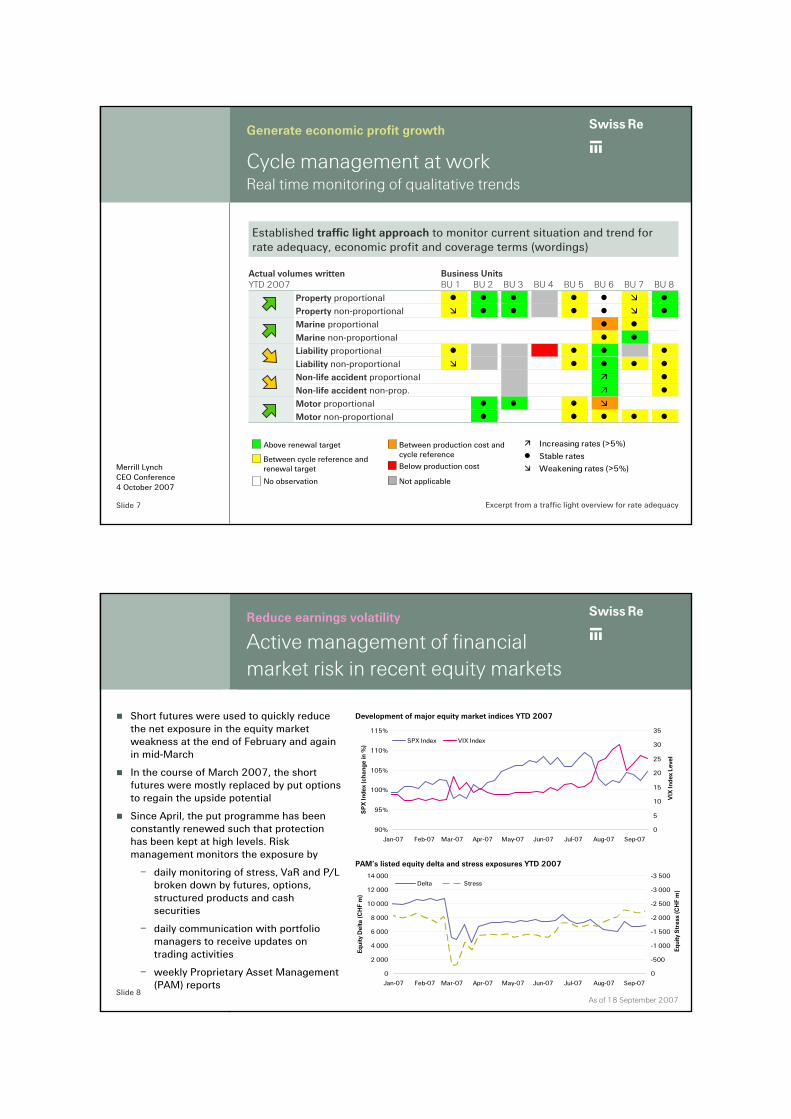
Outlook January 2008 renewalsContinued bottom line focus – at expense of top line if necessary
Property Europe (incl. nat cat)
Casualty overall (excl. motor)
Casualty critical risks/products
Specialties
Property US (incl. nat cat)
Generate economic profit growth
Credit
Life and health
Motor
Expected development of reinsurance rates
Slide 7
ab
Merrill LynchCEO Conference4 October 2007
Cycle management at workReal time monitoring of qualitative trends
Established traffic light approach to monitor current situation and trend for rate adequacy, economic profit and coverage terms (wordings)
Excerpt from a traffic light overview for rate adequacy
Above renewal target
Between cycle reference and renewal target
Between production cost and cycle referenceBelow production cost
Increasing rates (>5%)Stable ratesWeakening rates (>5%)
Generate economic profit growth
BU 8BU 7BU 6BU 5BU 4BU 3BU 2BU 1YTD 2007Actual volumes written
Motor non-proportionalMotor proportionalNon-life accident non-prop.Non-life accident proportionalLiability non-proportionalLiability proportionalMarine non-proportionalMarine proportionalProperty non-proportionalProperty proportional
Business Units
No observation Not applicable
Slide 8
ab
Merrill LynchCEO Conference4 October 2007
Active management of financial market risk in recent equity markets
Short futures were used to quickly reduce the net exposure in the equity market weakness at the end of February and again in mid-March
In the course of March 2007, the short futures were mostly replaced by put options to regain the upside potential
Since April, the put programme has been constantly renewed such that protection has been kept at high levels. Risk management monitors the exposure by
– daily monitoring of stress, VaR and P/L broken down by futures, options, structured products and cash securities
– daily communication with portfolio managers to receive updates on trading activities
– weekly Proprietary Asset Management (PAM) reports
PAM’s listed equity delta and stress exposures YTD 2007
0
2 000
4 000
6 000
8 000
10 000
12 000
14 000
Jan-07 Feb-07 Mar-07 Apr-07 May-07 Jun-07 Jul-07 Aug-07 Sep-07
Equi
ty D
elta
(CH
F m
)
-3 500
-3 000
-2 500
-2 000
-1 500
-1 000
-500
0
Equi
ty S
tres
s (C
HF
m)
Delta Stress
90%
95%
100%
105%
110%
115%
Jan-07 Feb-07 Mar-07 Apr-07 May-07 Jun-07 Jul-07 Aug-07 Sep-07
SP
X In
dex
(cha
nge
in %
)
0
5
10
15
20
25
30
35
VIX
Inde
x Le
vel
SPX Index VIX Index
Development of major equity market indices YTD 2007
As of 18 September 2007
Reduce earnings volatility
Slide 9
ab
Merrill LynchCEO Conference4 October 2007 0
500
1000
1500
2000
2500
Q2 06 Q3 06 Q4 06 Q1 07 Q2 07
Cre
dit S
prea
d S
tres
s Ex
posu
re(C
HF
m)
Gross Net
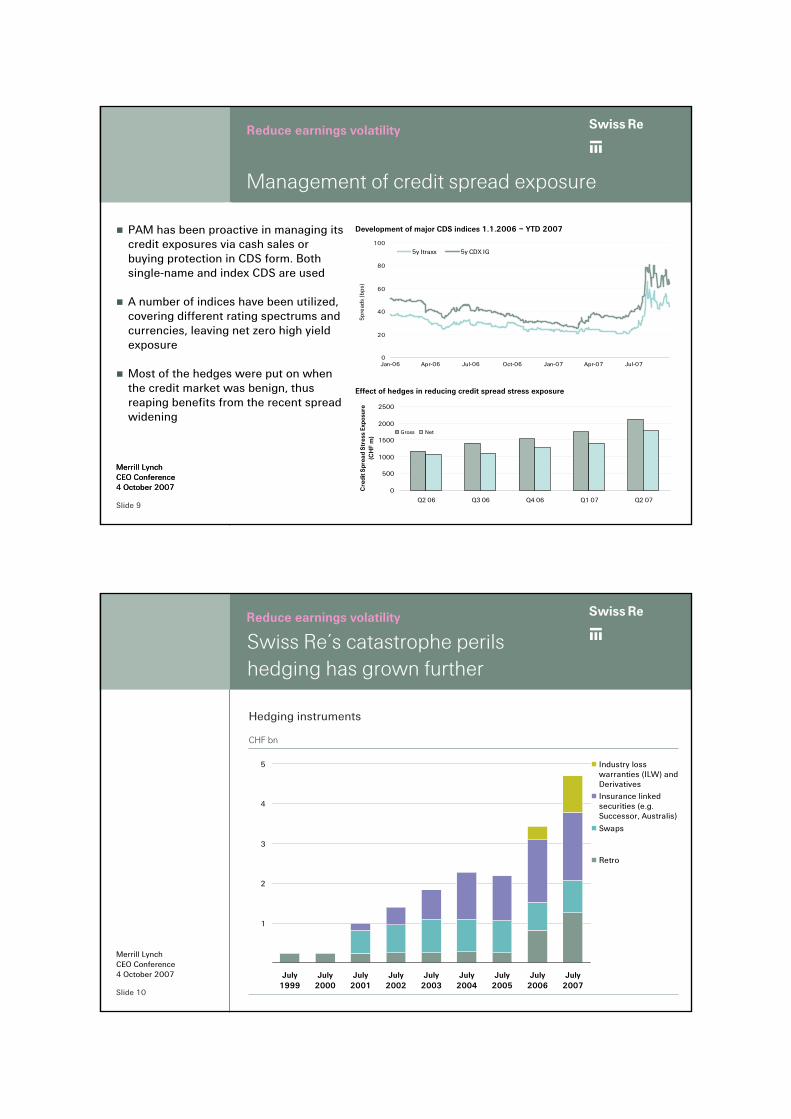
Management of credit spread exposure
PAM has been proactive in managing its credit exposures via cash sales or buying protection in CDS form. Both single-name and index CDS are used
A number of indices have been utilized, covering different rating spectrums and currencies, leaving net zero high yield exposure
Most of the hedges were put on when the credit market was benign, thus reaping benefits from the recent spread widening
0
20
40
60
80
100
Jan-06 Apr-06 Jul-06 Oct-06 Jan-07 Apr-07 Jul-07Sp
read
s (b
ps)
5y Itraxx 5y CDX IG
Development of major CDS indices 1.1.2006 – YTD 2007
Effect of hedges in reducing credit spread stress exposure
Merrill LynchCEO Conference4 October 2007
Reduce earnings volatility
Slide 10
ab
Merrill LynchCEO Conference4 October 2007
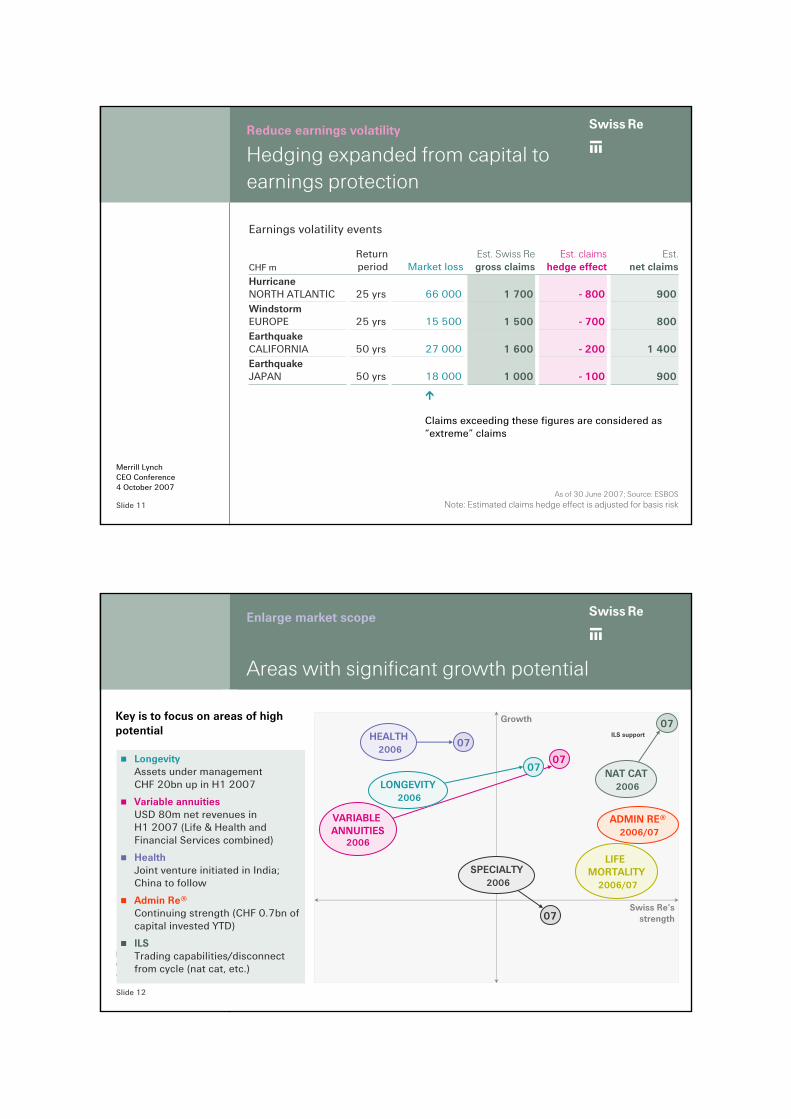
Swiss Re’s catastrophe perils hedging has grown further
1
2
3
4
5
July1999
July2000
July2001
July2002
July2003
July2004
July2005
July2006
July2007
Industry losswarranties (ILW) andDerivativesInsurance linkedsecurities (e.g.Successor, Australis)
Swaps
Retro
CHF bn
Hedging instruments
Reduce earnings volatility
Slide 11
ab
Merrill LynchCEO Conference4 October 2007
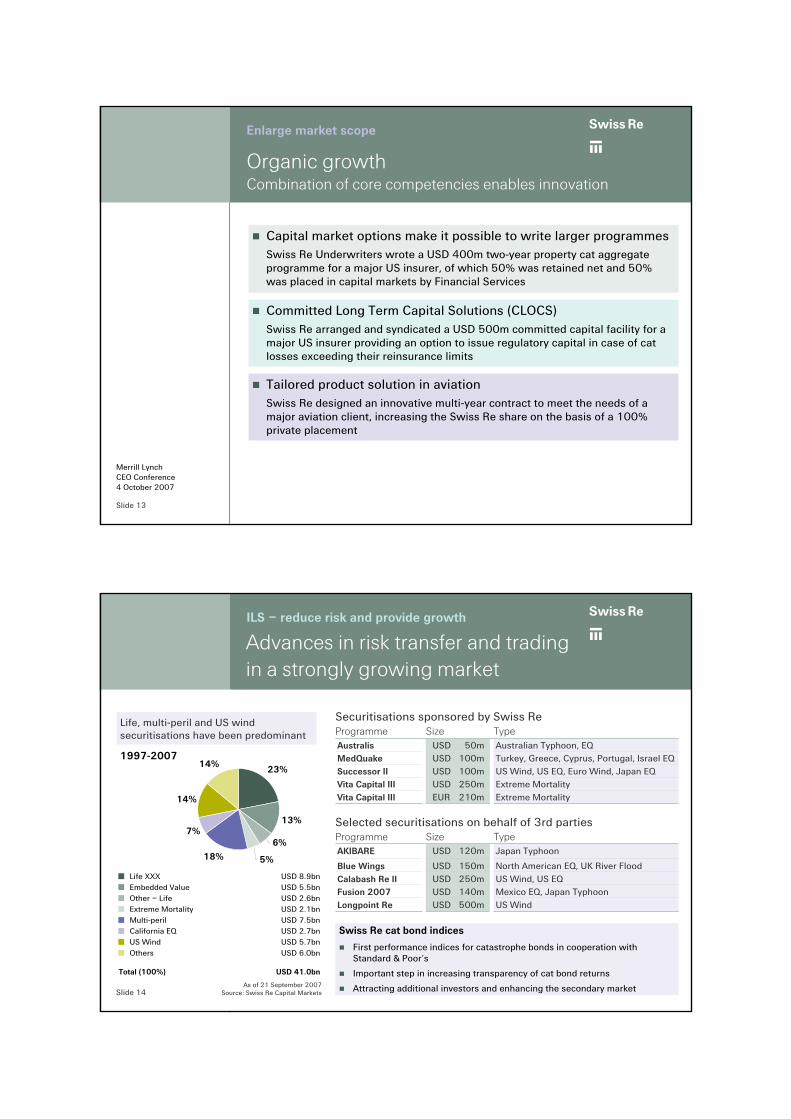
Hedging expanded from capital to earnings protection
Claims exceeding these figures are considered as “extreme” claims
CHF m
50 yrs
50 yrs
25 yrs
25 yrs
Return period
Earnings volatility events
18 000
27 000
15 500
66 000
Market loss
1 000
1 600
1 500
1 700
Est. Swiss Regross claims
- 100
- 200
- 700
- 800
Est. claimshedge effect
900
1 400
800
900
Est.net claims
EarthquakeJAPAN
EarthquakeCALIFORNIA
WindstormEUROPE
HurricaneNORTH ATLANTIC
As of 30 June 2007; Source: ESBOSNote: Estimated claims hedge effect is adjusted for basis risk
Reduce earnings volatility
Slide 12
ab
Merrill LynchCEO Conference4 October 2007
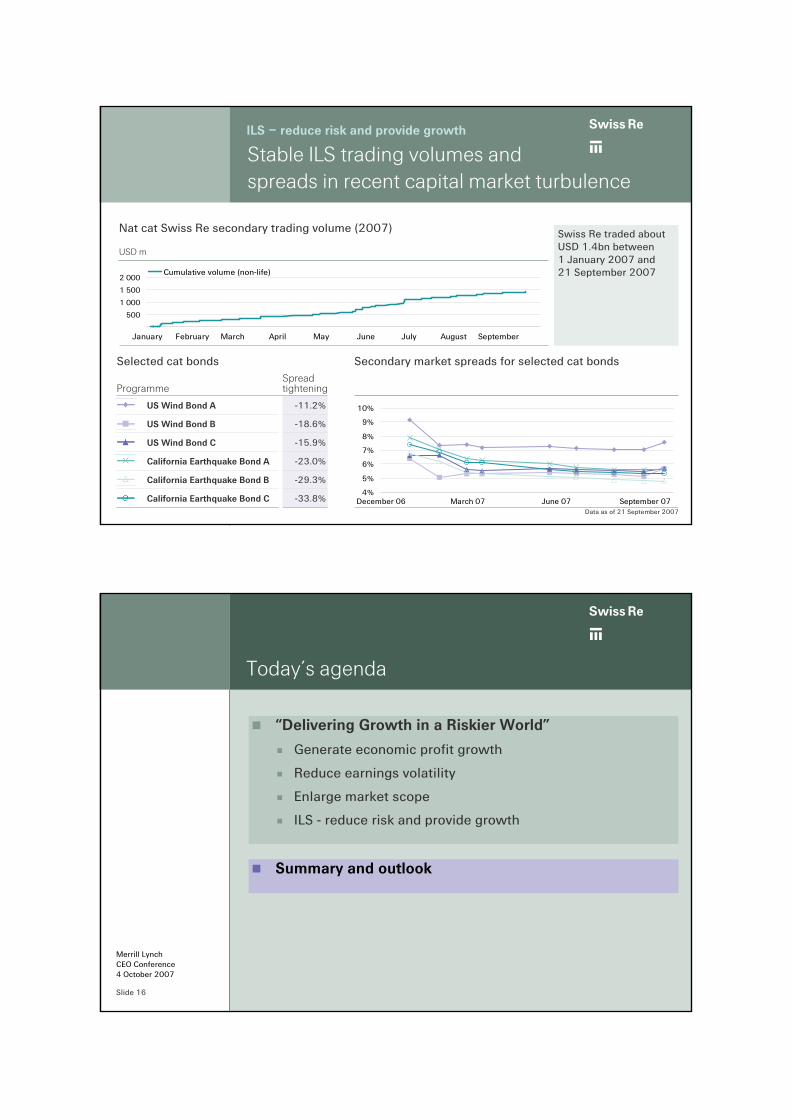
Key is to focus on areas of high potential
Growth
Swiss Re’s strength
07
07
07
07
07
ILS support
LIFE MORTALITY
2006/07
ADMIN RE®2006/07
LongevityAssets under management CHF 20bn up in H1 2007
Variable annuitiesUSD 80m net revenues in H1 2007 (Life & Health and Financial Services combined)
HealthJoint venture initiated in India; China to follow
Admin Re®Continuing strength (CHF 0.7bn of capital invested YTD)
ILSTrading capabilities/disconnect from cycle (nat cat, etc.)
Areas with significant growth potential
Enlarge market scope
SPECIALTY2006
NAT CAT2006
VARIABLE ANNUITIES
2006
LONGEVITY2006
HEALTH2006
Slide 13
ab
Merrill LynchCEO Conference4 October 2007
Committed Long Term Capital Solutions (CLOCS)Swiss Re arranged and syndicated a USD 500m committed capital facility for a major US insurer providing an option to issue regulatory capital in case of cat losses exceeding their reinsurance limits
Organic growth Combination of core competencies enables innovation
Capital market options make it possible to write larger programmesSwiss Re Underwriters wrote a USD 400m two-year property cat aggregate programme for a major US insurer, of which 50% was retained net and 50% was placed in capital markets by Financial Services
Enlarge market scope
Tailored product solution in aviationSwiss Re designed an innovative multi-year contract to meet the needs of a major aviation client, increasing the Swiss Re share on the basis of a 100% private placement
Slide 14
ab
Merrill LynchCEO Conference4 October 2007
23%
13%
6%
5%18%
7%
14%
14%
Advances in risk transfer and trading in a strongly growing market
As of 21 September 2007Source: Swiss Re Capital Markets
Life XXX
Multi-peril
US Wind
Other – Life
California EQ
Others
Embedded Value
Extreme Mortality
Life, multi-peril and US wind securitisations have been predominant
ILS – reduce risk and provide growth
Extreme MortalityUSD 250mVita Capital IIIExtreme MortalityEUR 210mVita Capital III
US Wind, US EQ, Euro Wind, Japan EQUSD 100mSuccessor II
Securitisations sponsored by Swiss Re
USD 100mUSD 50m
SizeAustralian Typhoon, EQAustralisTurkey, Greece, Cyprus, Portugal, Israel EQMedQuake
TypeProgramme
Mexico EQ, Japan TyphoonUSD 140mFusion 2007US WindUSD 500mLongpoint Re
US Wind, US EQUSD 250mCalabash Re II
Selected securitisations on behalf of 3rd parties
USD 150m
USD 120m
SizeJapan TyphoonAKIBARE
North American EQ, UK River FloodBlue Wings
TypeProgramme
USD 8.9bn
USD 7.5bn
USD 5.7bn
USD 2.6bn
USD 2.7bn
USD 6.0bn
USD 5.5bn
USD 2.1bn
Total (100%) USD 41.0bn
Swiss Re cat bond indices
First performance indices for catastrophe bonds in cooperation with Standard & Poor’s
Important step in increasing transparency of cat bond returns
Attracting additional investors and enhancing the secondary market
1997-2007
Slide 15
ab
Merrill LynchCEO Conference4 October 2007
Stable ILS trading volumes and spreads in recent capital market turbulence
-33.8%
-29.3%
-23.0%
-15.9%
-18.6%
-11.2%
Spread tightening
California Earthquake Bond B
California Earthquake Bond A
California Earthquake Bond C
US Wind Bond C
Selected cat bonds
US Wind Bond A
US Wind Bond B
Programme
Data as of 21 September 2007
4%
5%
6%
7%
8%
9%
10%
December 06 March 07 June 07 September 07
Secondary market spreads for selected cat bonds
ILS – reduce risk and provide growth
Swiss Re traded about USD 1.4bn between 1 January 2007 and 21 September 2007
USD m
Nat cat Swiss Re secondary trading volume (2007)
500
1 000
1 500
2 000
January February March April May June July August September
Cumulative volume (non-life)
Slide 16
ab
Merrill LynchCEO Conference4 October 2007
Today’s agenda
“Delivering Growth in a Riskier World”
Generate economic profit growth
Reduce earnings volatility
Enlarge market scope
ILS - reduce risk and provide growth
Summary and outlook
Slide 17
ab
Merrill LynchCEO Conference4 October 2007
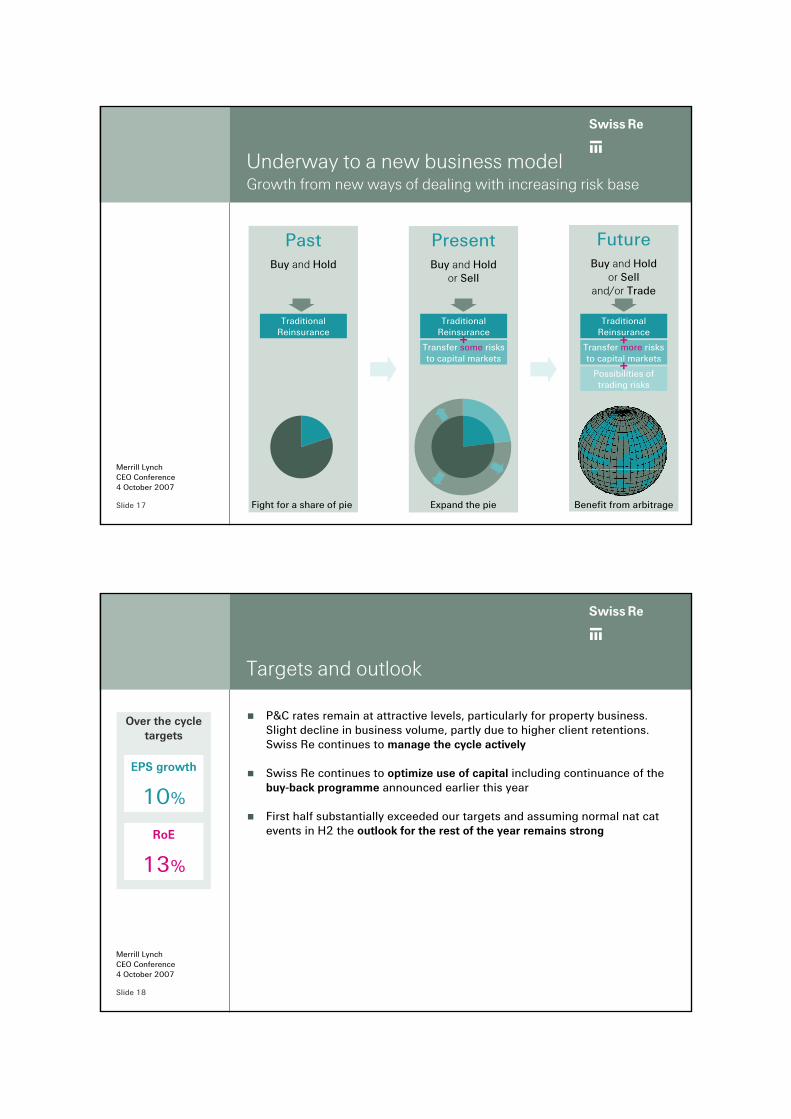
PresentBuy and Hold
or Sell
PastBuy and Hold
Underway to a new business model Growth from new ways of dealing with increasing risk base
FutureBuy and Hold
or Sell and/or Trade
Fight for a share of pie
Traditional Reinsurance
Transfer more risks to capital markets
Possibilities of trading risks
+
+
Traditional Reinsurance
Transfer some risks to capital markets
Traditional Reinsurance
+
Expand the pie Benefit from arbitrage
Slide 18
ab
Merrill LynchCEO Conference4 October 2007
Targets and outlook
P&C rates remain at attractive levels, particularly for property business. Slight decline in business volume, partly due to higher client retentions. Swiss Re continues to manage the cycle actively
Swiss Re continues to optimize use of capital including continuance of the buy-back programme announced earlier this year
First half substantially exceeded our targets and assuming normal nat cat events in H2 the outlook for the rest of the year remains strong
Over the cycle targets
EPS growth
10%
RoE
13%
Slide 19
ab
Merrill LynchCEO Conference4 October 2007
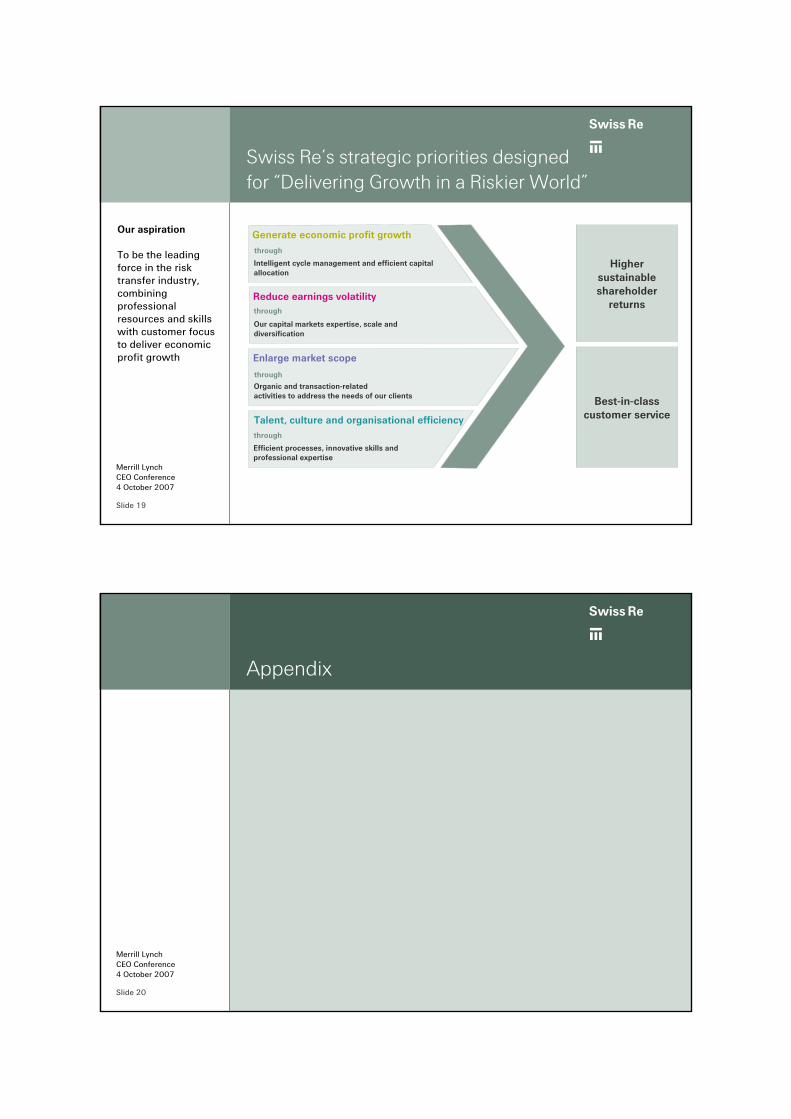
Swiss Re’s strategic priorities designed for “Delivering Growth in a Riskier World”
Our aspiration
To be the leading force in the risk transfer industry, combining professional resources and skills with customer focus to deliver economic profit growth
Generate economic profit growth
Higher sustainable shareholder
returns
Best-in-classcustomer service
Reduce earnings volatility
Enlarge market scope
Our capital markets expertise, scale and diversification
Organic and transaction-related activities to address the needs of our clients
Efficient processes, innovative skills and professional expertise
Talent, culture and organisational efficiency
Intelligent cycle management and efficient capital allocation
through
through
through
through
Slide 20
ab
Merrill LynchCEO Conference4 October 2007
Appendix
Slide 21
ab
Merrill LynchCEO Conference4 October 2007
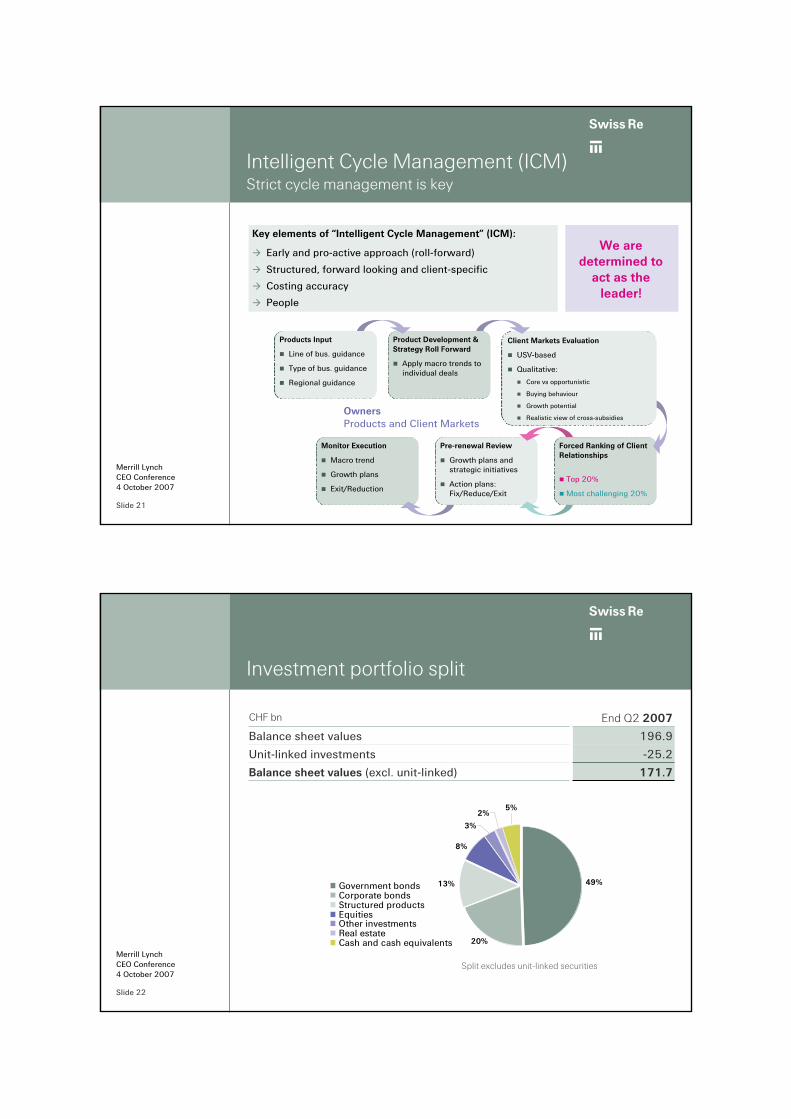
OwnersProducts and Client Markets
Intelligent Cycle Management (ICM)Strict cycle management is key
Monitor Execution
Macro trend
Growth plans
Exit/Reduction
Monitor Execution
Macro trend
Growth plans
Exit/Reduction
Key elements of “Intelligent Cycle Management” (ICM):
Early and pro-active approach (roll-forward)
Structured, forward looking and client-specific
Costing accuracy
People
We are determined to
act as the leader!
Pre-renewal Review
Growth plans and strategic initiatives
Action plans:Fix/Reduce/Exit
Pre-renewal Review
Growth plans and strategic initiatives
Action plans:Fix/Reduce/Exit
Forced Ranking of Client Relationships
Top 20%
Most challenging 20%
Forced Ranking of Client Relationships
Top 20%
Most challenging 20%
Client Markets Evaluation
USV-based
Qualitative:
Core vs opportunistic
Buying behaviour
Growth potential
Realistic view of cross-subsidies
Client Markets Evaluation
USV-based
Qualitative:
Core vs opportunistic
Buying behaviour
Growth potential
Realistic view of cross-subsidies
Product Development & Strategy Roll Forward
Apply macro trends to individual deals
Product Development & Strategy Roll Forward
Apply macro trends to individual deals
Products Input
Line of bus. guidance
Type of bus. guidance
Regional guidance
Products Input
Line of bus. guidance
Type of bus. guidance
Regional guidance
Slide 22
ab
Merrill LynchCEO Conference4 October 2007
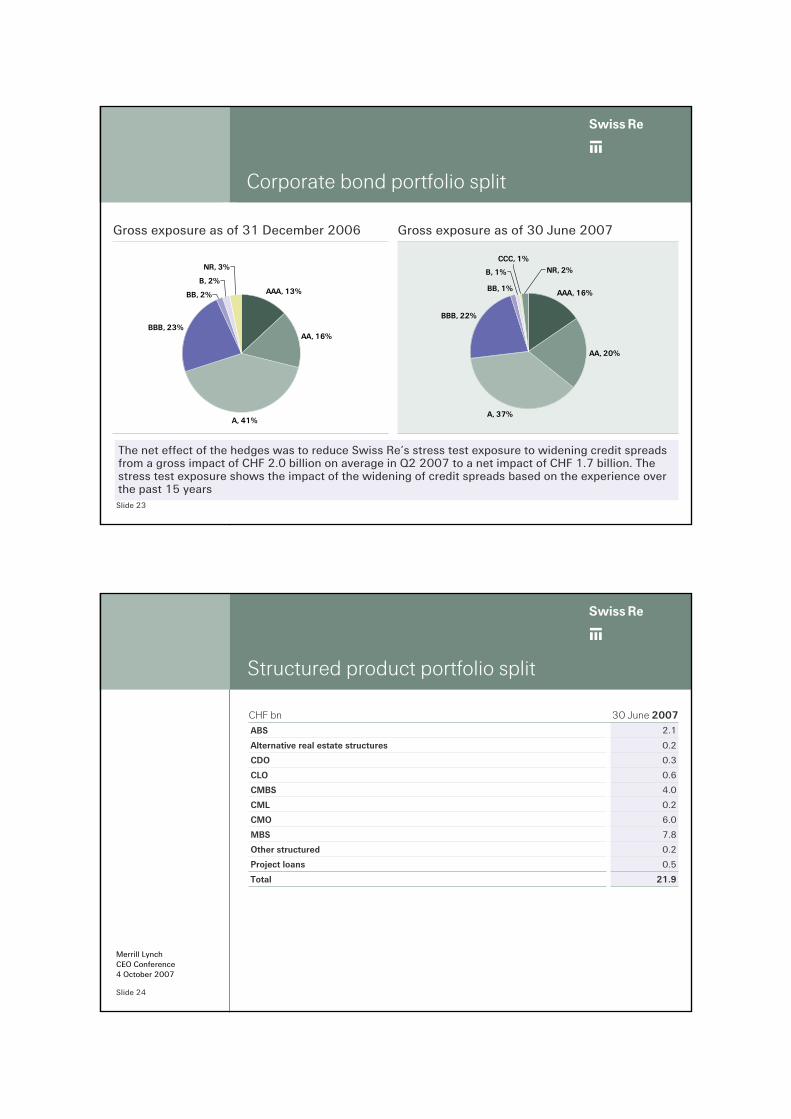
Investment portfolio split
5%2%
8%
13% 49%
20%
3%
Government bondsCorporate bondsStructured productsEquitiesOther investmentsReal estateCash and cash equivalents
196.9Balance sheet values
-25.2Unit-linked investments
171.7Balance sheet values (excl. unit-linked)
End Q2 2007CHF bn
Split excludes unit-linked securities
Slide 23
ab
Merrill LynchCEO Conference4 October 2007
Gross exposure as of 30 June 2007
Corporate bond portfolio split
The net effect of the hedges was to reduce Swiss Re’s stress test exposure to widening credit spreads from a gross impact of CHF 2.0 billion on average in Q2 2007 to a net impact of CHF 1.7 billion. The stress test exposure shows the impact of the widening of credit spreads based on the experience over the past 15 years
Gross exposure as of 31 December 2006
AAA, 16%
AA, 20%
A, 37%
BBB, 22%
BB, 1%
B, 1%
CCC, 1%NR, 2%
AAA, 13%
AA, 16%
A, 41%
BBB, 23%
BB, 2%
B, 2%
NR, 3%
Slide 24
ab
Merrill LynchCEO Conference4 October 2007
Structured product portfolio split
0.6CLO
4.0CMBS
0.2CML
6.0CMO
7.8MBS
0.2Other structured
0.5Project loans
21.9
0.3
0.2
2.1
30 June 2007
Total
CDO
ABS
Alternative real estate structures
CHF bn
Slide 25
ab
Merrill LynchCEO Conference4 October 2007
Corporate calendar & contacts
Corporate calendar
3Q 2007 results (Conference Call) 06 November 2007
Investors’ day (London) 11 December 2007
Investor Relations contact
Hotline +41 43 285 4444
Susan Holliday +44 20 7933 3890Andreas Leu +41 43 285 5603Rolf Winter +41 43 285 9673Marc Habermacher +41 43 285 2637
E-mail [email protected]
Slide 26
ab
Merrill LynchCEO Conference4 October 2007
Cautionary note on forward-looking statements
Certain statements and illustrations contained herein are forward-looking. These statements and illustrations provide current expectations of future eventsbased on certain assumptions and include any statement that does not directly relate to a historical fact or current fact. Forward-looking statements typicallyare identified by words or phrases such as "anticipate", "assume", "believe", "continue", "estimate", "expect", "foresee", "intend", "may increase" and "mayfluctuate" and similar expressions or by future or conditional verbs such as "will", "should", "would" and "could". These forward-looking statements involveknown and unknown risks, uncertainties and other factors, which may cause Swiss Re's actual results, performance, achievements or prospects to bematerially different from any future results, performance, achievements or prospects expressed or implied by such statements. Such factors include, amongothers:
the impact of significant investments, acquisitions or dispositions, and any delays, unexpected costs or other issues experienced in connection with any such transactions, including, in the case ofacquisitions, issues arising in connection with integrating acquired operations; cyclicality of the reinsurance industry;changes in general economic conditions, particularly in our coremarkets;uncertainties in estimating reserves;the performance of financial markets;expected changes in our investment results as a result of the changed composition of our invested assets or changes in our investment policy;the frequency, severity and development of insured claim events;acts of terrorism and acts of war;
These factors are not exhaustive. We operate in a continually changing environment and new risks emerge continually. Readers are cautioned not to placeundue reliance on forward-looking statements. We undertake no obligation to publicly revise or update any forward-looking statements, whether as a resultof new information, future events or otherwise.
mortality and morbidity experience;policy renewal and lapse rates;changes in rating agency policies or practices;the lowering or withdrawal of one or more of the financial strength or credit ratings of one or more of our subsidiaries;changes in levels of interest rates;political risks in the countries in which we operate or in which we insure risks;extraordinary events affecting our clients, such as bankruptciesand liquidations;risks associated with implementing our business strategies;changes in currency exchange rates;changes in laws and regulations, including changes in accountingstandards and taxation requirements; andchanges in competitive pressures.


![[Merrill Lynch] Credit Derivatives Handbook](https://static.fdocuments.in/doc/165x107/55cf97e9550346d03394646c/merrill-lynch-credit-derivatives-handbook.jpg)