Merrill Lynch Investment Solutions - TeleTrader.com
248
No subscription can be received on the basis of these financial statements. Subscriptions may only be accepted on the basis of the current prospectus accompanied by an application form, the latest available annual report of the fund and the latest semi-annual report if published thereaer. Merrill Lynch Investment Solutions Audited annual report as at March 31, 2013 Société d’Investissement à Capital Variable R.C.S. Luxembourg B 133.445
Transcript of Merrill Lynch Investment Solutions - TeleTrader.com
No subscription can be received on the basis of these fi nancial statements. Subscriptions may only be accepted on the basis of the current prospectus accompanied by an application form, the latest available annual report of the fund and the latest semi-annual report if published therea� er.
Merrill Lynch Investment Solutions
Audited annual report as at March 31, 2013
Société d’Investissement à Capital Variable
R.C.S. Luxembourg B 133.445

Audited annual report
1Merrill Lynch Investment Solutions
Table of contents Page
Management and Administration 2
Information to the Shareholders 6
Additional Information for Investors in the Federal Republic of Germany 11
Investment Managers’ Report 12
Audit Report 27
Statements of Net Assets as at March 31, 2013 29
Statements of Operations and Changes in Net Assets for the year ended March 31, 2013 31
Statistical information 33
Schedule of Investments as at March 31, 2013 46
Merrill Lynch Investment Solutions – Marshall Wace TOPS UCITS Fund (Market Neutral) 46
Merrill Lynch Investment Solutions – York Event-Driven UCITS Fund 92
Merrill Lynch Investment Solutions – CCI Healthcare Long-Short UCITS Fund 102
Merrill Lynch Investment Solutions – Zweig-DiMenna US Long-Short Equity UCITS Fund 106
Merrill Lynch Investment Solutions – Theorema European Equity Long-Short UCITS Fund 115
Merrill Lynch Investment Solutions – York Asian Event-Driven UCITS Fund 119
Merrill Lynch Investment Solutions – Graham Capital Systematic Macro UCITS Fund 128
Merrill Lynch Investment Solutions – AQR Global Relative Value UCITS Fund 132
Merrill Lynch Investment Solutions – Och-Ziff European Multi-Strategy UCITS Fund 184
Merrill Lynch Investment Solutions – Westchester Merger Arbitrage UCITS Fund 200
Merrill Lynch Investment Solutions – QFS Currency UCITS Fund 209
Merrill Lynch Investment Solutions – TRG Emerging Markets Opportunity UCITS Fund 211
Merrill Lynch Investment Solutions – Fulcrum Alpha Macro UCITS Fund 219
Merrill Lynch Investment Solutions – Van Eck Commodities Long-Short Equity UCITS Fund 224
Merrill Lynch Investment Solutions – Beach Point Diversifi ed Credit UCITS Fund 227
Notes to the fi nancial statements as at March 31, 2013 228
Global Risk Management (Unaudited Information) 240
2 Merrill Lynch Investment Solutions
Audited annual report
Management and AdministrationBoard of Directors
Chairman of the Board of Directors:Mrs Miriam Muller,Director,Merrill Lynch International,2 King Edward StreetLondon EC1A 1HQ, United KingdomFrom November 21, 2012
Mr Eric Personne,Managing Director,Merrill Lynch International,2 King Edward Street,London EC1A 1HQ, United KingdomUntil October 31, 2012
Directors:Mr Raymond Blokland,Managing Director,Merrill Lynch Equity S.à r.l.,4 rue Albert Borchette,L-1246 Luxembourg,Grand Duchy of Luxembourg
Mr Jocelyn Kiefe,Vice President,Merrill Lynch Capital Markets (France) S.A.S.,112 avenue Kléber,75116 Paris,France
Mr Paul Guillaume,Managing Partner,Altra Partners S.A.,370 route de Longwy,L-1940 Luxembourg,Grand Duchy of Luxembourg
Mr Jean-Claude Wolter,Avocat Honoraire,11 B boulevard Joseph II,L-1840 Luxembourg,Grand Duchy of Luxembourg
Directors: (cont.)Mr Paul Holmes,Director,Merrill Lynch International,2 King Edward Street,London EC1A 1HQ,United KingdomFrom November 21, 2012
Dirigeants:Mr James Munce,Director,Merrill Lynch International,2 King Edward Street,London EC1A 1HQ,United Kingdom
Mr Dauphou Edi,Director,Merrill Lynch International,2 King Edward Street,London EC1A 1HQ,United Kingdom
Registered Offi ce49 avenue J. F. Kennedy,L-1855 Luxembourg,Grand Duchy of Luxembourg
Custodian and Paying AgentState Street Bank Luxembourg S.A.,49 avenue J. F. Kennedy,L-1855 Luxembourg,Grand Duchy of LuxembourgFrom November 1, 2012
Société Générale Bank & Trust,11, avenue Emile Reuter,L-2420 Luxembourg,Grand Duchy of LuxembourgUntil October 31, 2012
Mrs Miriam Muller Mr Raymond Blokland Mr Jocelyn Kiefe Mr Paul Guillaume
Management and Administration (cont.)
3Merrill Lynch Investment Solutions
Audited annual report
Registrar Agent and Transfer AgentState Street Bank Luxembourg S.A.,49 avenue J. F. Kennedy,L-1855 Luxembourg,Grand Duchy of LuxembourgFrom November 1, 2012
European Fund Services S.A.,18, boulevard Royal,L-2449 Luxembourg,Grand Duchy of LuxembourgUntil October 31, 2012
Investment ManagersFor the Sub-Fund Merrill Lynch Investment Solutions –Marshall Wace TOPS UCITS Fund (Market Neutral):Marshall Wace LLPThe Adelphi, 13th Floor,1/11 John Adam Street,London WC2N 6HTUnited Kingdom
For the Sub-Funds Merrill Lynch Investment Solutions –York Event-Driven UCITS Fund and Merrill Lynch Investment Solutions – York Asian Event-Driven UCITS Fund:York UCITS Holdings, LLC767 Fi� h Avenue, 17th FloorNew York 10153USA
For the Sub-Fund Merrill Lynch Investment Solutions –GLG European Opportunity UCITS Fund:GLG Partners LP,One Curzon Street,London, W1J 5 HB,United KingdomUntil May 21, 2012
For the Sub-Fund Merrill Lynch Investment Solutions –CCI Healthcare Long-Short UCITS Fund:Columbus Circle Investors GP, Metro Center, One Station Place, 8th fl oor,Stamford, CT 06902USA
Investment Managers (cont.)For the Sub-Fund Merrill Lynch Investment Solutions –Zweig-DiMenna US Long-Short Equity UCITS Fund:Zweig-DiMenna International Managers Inc.,900 Third Avenue,New York 10022,USA
For the Sub-Fund Merrill Lynch Investment Solutions –Theorema European Equity Long-Short UCITS Fund:Theorema Asset Management Limited,20 Balderton Street,London W1K 6TL,United Kingdom
For the Sub-Fund Merrill Lynch Investment Solutions –Graham Capital Systematic Macro UCITS Fund:Graham Capital Management LP,Rock Ledge Financial Center,40 Highland Avenue,Rowayton CT 06853 USA
For the Sub-Fund Merrill Lynch Investment Solutions –AQR Global Relative Value UCITS Fund:AQR Capital Management LLC,Two Greenwich Plaza, 3rd Floor,Greenwich, CT 06830 USA
For the Sub-Fund Merrill Lynch Investment Solutions –Och-Ziff European Multi-Strategy UCITS Fund:OZ Management LP, c/o Corporation Trust Center,1209 Orange Street,Wilmington, Delaware 19801,USA
For the Sub-Fund Merrill Lynch Investment Solutions – TT Financials UCITS Fund:TT International,Level 13, Moor House,120 London Wall, London EC2Y 5ET,United KingdomUntil July 31, 2012
Mr Jean-Claude Wolter Mr Paul Holmes Mr James Munce Mr Dauphou Edi
Management and Administration (cont.)
4 Merrill Lynch Investment Solutions
Audited annual report
Investment Managers (cont.)For the Sub-Fund Merrill Lynch Investment Solutions –Westchester Merger Arbitrage UCITS Fund:Westchester Capital Management LLC,100 Summit Lake Drive,Valhalla, New York 10595,USA
For the Sub-Fund Merrill Lynch Investment Solutions –QFS Currency UCITS Fund:QFS Asset Management L.P.,10 Glenville Street,Greenwich, CT 06831USA
For the Sub-Fund Merrill Lynch Investment Solutions –TRG Emerging Markets Opportunity UCITS Fund:TRG Management LP, c/o The Corporation Trust Company,Corporation Trust Center, 1209 Orange Street,Wilmington, Delaware 19801
For the Sub-Fund Merrill Lynch Investment Solutions – Fulcrum Alpha Macro UCITS Fund:Fulcrum Asset Management LLP,6 Chesterfi eld Gardens,London W1J 5BQUnited KingdomFrom June 15, 2012
For the Sub-Fund Merrill Lynch Investment Solutions – Van Eck Commodities Long-Short Equity UCITS Fund:Van Eck Absolute Return Advisers Corporation,335 Madison Avenue, 19th Floor,New York, NY 10017USAFrom December 13, 2012
For the Sub-Fund Merrill Lynch Investment Solutions – Beach Point Diversifi ed Credit UCITS Fund:Beach Point UCITS Management LLC,489 5th Avenue,New York, NY 10017 USAFrom February 28, 2013
Investment AdvisorsOnly for the Sub-Fund Merrill Lynch Investment Solutions – Marshall Wace TOPS UCITS Fund(Market Neutral):
Marshall Wace Asia Limited28/F One IFC One Harbour View RoadHong Kong
Marshall Wace North America L.P.,55 Railroad Avenue, GreenwichConnecticutUSA
Administrative, Corporate and Domiciliary AgentState Street Bank Luxembourg S.A.,49 avenue J. F. Kennedy,L-1855 Luxembourg,Grand Duchy of LuxembourgFrom November 1, 2012
Société Générale Securities Services,Luxembourg16 boulevard Royal,L-2449 Luxembourg,Grand Duchy of LuxembourgUntil October 31, 2012
SponsorMerrill Lynch International,2 King Edward Street,London EC1A 1HQUnited Kingdom
DistributorMerrill Lynch International,2 King Edward Street,London EC1A 1HQUnited Kingdom
Legal AdviserLinklaters LLP,35 avenue J. F. Kennedy,L-1855 Luxembourg,Grand Duchy of Luxembourg
Management and Administration (cont.)
5Merrill Lynch Investment Solutions
Audited annual report
Listing AgentState Street Bank Luxembourg S.A.,49 avenue J. F. Kennedy,L-1855 Luxembourg,Grand Duchy of LuxembourgFrom November 1, 2012
Société Générale Bank & Trust,11 avenue Emile Reuter,L-2420 Luxembourg,Grand Duchy of LuxembourgUntil October 31, 2012
AuditorPricewaterhouseCoopers, Société coopérative,400 route d’Esch,L-1471 Luxembourg,Grand Duchy of Luxembourg
Audited annual report
6 Merrill Lynch Investment Solutions
Information to the ShareholdersThe annual general meeting of Shareholders is held, each year, at the registered offi ce of the SICAV or at the place specifi ed in the convening notice on the last Monday of July (at 12 noon Luxembourg time) or the next following Luxembourg Business Day.
The meetings of Shareholders of Shares of a particular Sub-Fund may decide on matters which are relevant only for the Sub-Fund concerned.
Notices to Shareholders will be published in the Luxemburger Wort and / or in any other newspaper(s) in those countries where the Shares are sold, as determined by the Board of Directors.
Audited annual reports are made available on the SICAV website and for shareholders’ inspection at each of the registered offi ces of the SICAV and of the Custodian Bank. They will be published within four months following the relevant accounting period, and the latest annual report is made available at least eight days before the annual general meeting. Moreover, unaudited semi-annual reports are made available for shareholders’ inspection at each of the registered offi ces of the SICAV and of the Custodian Bank and will be published within two months following the relevant accounting period.
The fi nancial year ends on March 31 of each year.
The list of changes in the portfolio, for the year ended March 31, 2013, is available at the registered offi ce of the SICAV.
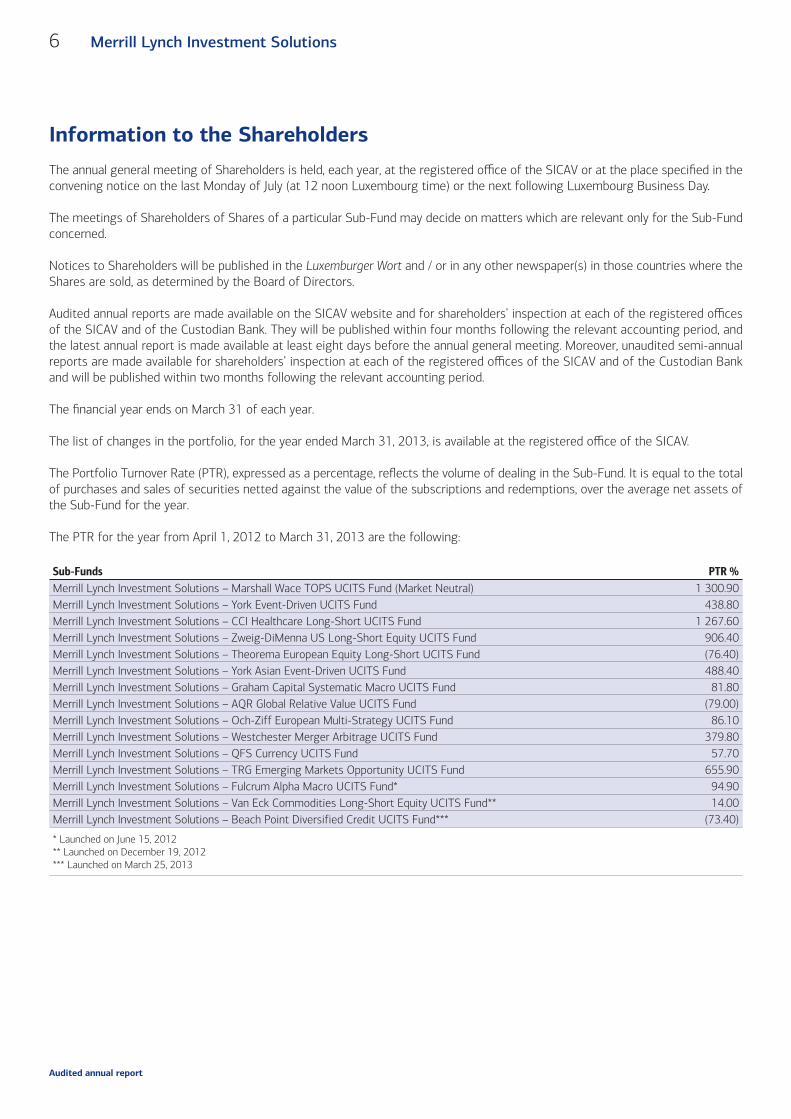
The Portfolio Turnover Rate (PTR), expressed as a percentage, refl ects the volume of dealing in the Sub-Fund. It is equal to the total of purchases and sales of securities netted against the value of the subscriptions and redemptions, over the average net assets of the Sub-Fund for the year.
The PTR for the year from April 1, 2012 to March 31, 2013 are the following:
Sub-Funds PTR %Merrill Lynch Investment Solutions – Marshall Wace TOPS UCITS Fund (Market Neutral) 1 300.90Merrill Lynch Investment Solutions – York Event-Driven UCITS Fund 438.80Merrill Lynch Investment Solutions – CCI Healthcare Long-Short UCITS Fund 1 267.60Merrill Lynch Investment Solutions – Zweig-DiMenna US Long-Short Equity UCITS Fund 906.40Merrill Lynch Investment Solutions – Theorema European Equity Long-Short UCITS Fund (76.40)Merrill Lynch Investment Solutions – York Asian Event-Driven UCITS Fund 488.40Merrill Lynch Investment Solutions – Graham Capital Systematic Macro UCITS Fund 81.80Merrill Lynch Investment Solutions – AQR Global Relative Value UCITS Fund (79.00)Merrill Lynch Investment Solutions – Och-Ziff European Multi-Strategy UCITS Fund 86.10Merrill Lynch Investment Solutions – Westchester Merger Arbitrage UCITS Fund 379.80Merrill Lynch Investment Solutions – QFS Currency UCITS Fund 57.70Merrill Lynch Investment Solutions – TRG Emerging Markets Opportunity UCITS Fund 655.90Merrill Lynch Investment Solutions – Fulcrum Alpha Macro UCITS Fund* 94.90Merrill Lynch Investment Solutions – Van Eck Commodities Long-Short Equity UCITS Fund** 14.00Merrill Lynch Investment Solutions – Beach Point Diversified Credit UCITS Fund*** (73.40)
* Launched on June 15, 2012** Launched on December 19, 2012*** Launched on March 25, 2013
Audited annual report
7Merrill Lynch Investment Solutions
Information to the Shareholders (cont.)
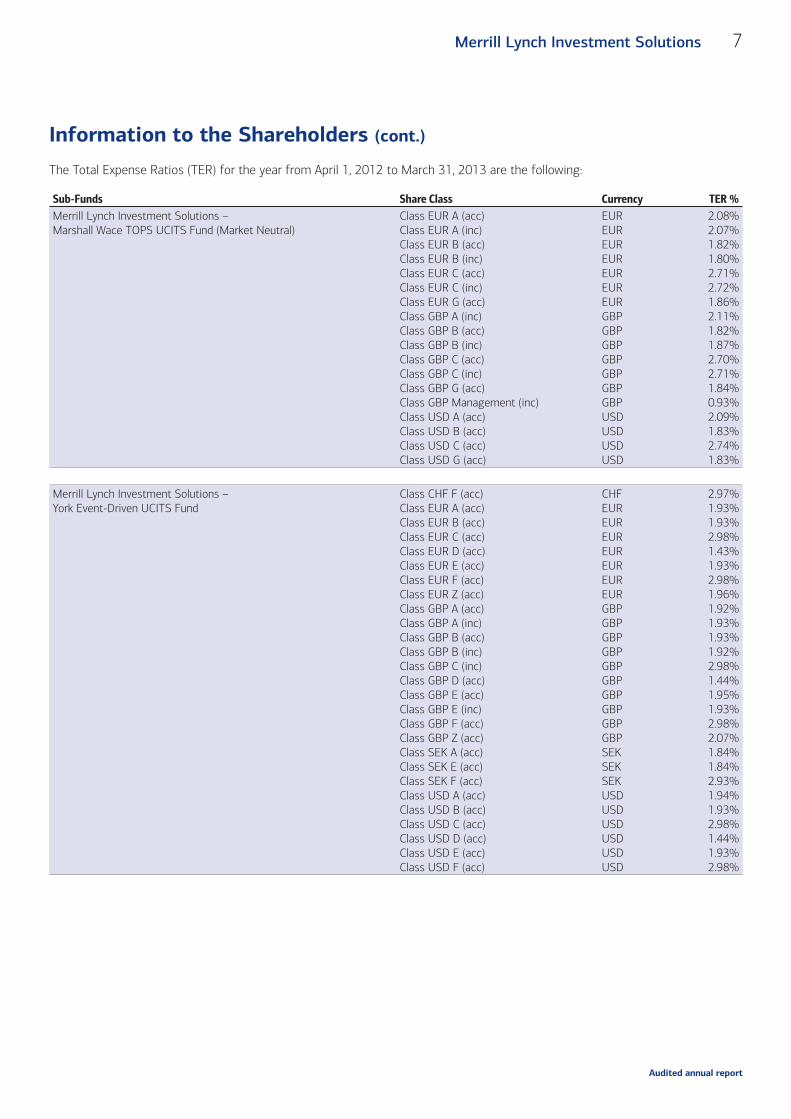
The Total Expense Ratios (TER) for the year from April 1, 2012 to March 31, 2013 are the following:
Sub-Funds Share Class Currency TER %Merrill Lynch Investment Solutions – Marshall Wace TOPS UCITS Fund (Market Neutral)
Class EUR A (acc)Class EUR A (inc)Class EUR B (acc)Class EUR B (inc)Class EUR C (acc)Class EUR C (inc)Class EUR G (acc)Class GBP A (inc)Class GBP B (acc)Class GBP B (inc)Class GBP C (acc)Class GBP C (inc)Class GBP G (acc)Class GBP Management (inc)Class USD A (acc)Class USD B (acc)Class USD C (acc)Class USD G (acc)
EUREUREUREUREUREUREURGBPGBPGBPGBPGBPGBPGBPUSDUSDUSDUSD
2.08%2.07%1.82%1.80%2.71%2.72%1.86%2.11%1.82%1.87%2.70%2.71%1.84%0.93%2.09%1.83%2.74%1.83%
Merrill Lynch Investment Solutions – York Event-Driven UCITS Fund
Class CHF F (acc)Class EUR A (acc)Class EUR B (acc)Class EUR C (acc)Class EUR D (acc)Class EUR E (acc)Class EUR F (acc)Class EUR Z (acc)Class GBP A (acc)Class GBP A (inc)Class GBP B (acc)Class GBP B (inc)Class GBP C (inc)Class GBP D (acc)Class GBP E (acc)Class GBP E (inc)Class GBP F (acc)Class GBP Z (acc)Class SEK A (acc)Class SEK E (acc)Class SEK F (acc)Class USD A (acc)Class USD B (acc)Class USD C (acc)Class USD D (acc)Class USD E (acc)Class USD F (acc)
CHFEUREUREUREUREUREUREURGBPGBPGBPGBPGBPGBPGBPGBPGBPGBPSEKSEKSEKUSDUSDUSDUSDUSDUSD
2.97%1.93%1.93%2.98%1.43%1.93%2.98%1.96%1.92%1.93%1.93%1.92%2.98%1.44%1.95%1.93%2.98%2.07%1.84%1.84%2.93%1.94%1.93%2.98%1.44%1.93%2.98%
Audited annual report
8 Merrill Lynch Investment Solutions
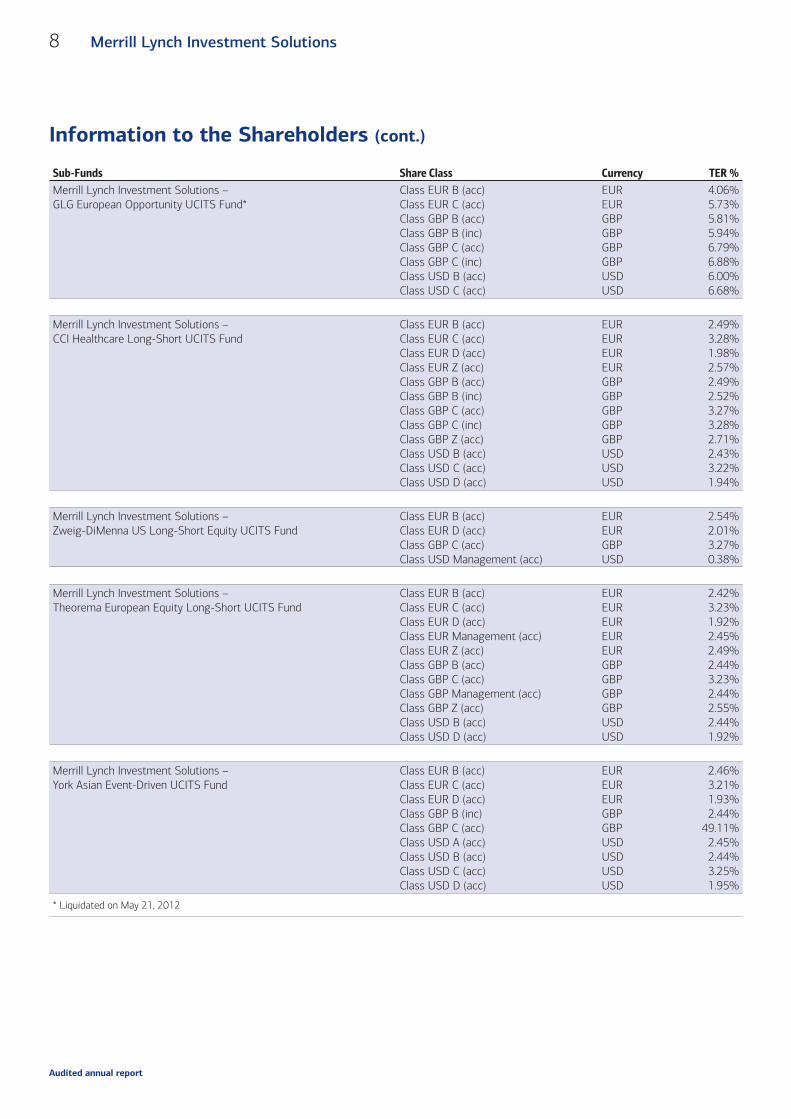
Information to the Shareholders (cont.)
Sub-Funds Share Class Currency TER %Merrill Lynch Investment Solutions – GLG European Opportunity UCITS Fund*
Class EUR B (acc)Class EUR C (acc)Class GBP B (acc)Class GBP B (inc)Class GBP C (acc)Class GBP C (inc)Class USD B (acc)Class USD C (acc)
EUREURGBPGBPGBPGBPUSDUSD
4.06%5.73%5.81%5.94%6.79%6.88%6.00%6.68%
Merrill Lynch Investment Solutions – CCI Healthcare Long-Short UCITS Fund
Class EUR B (acc)Class EUR C (acc)Class EUR D (acc)Class EUR Z (acc)Class GBP B (acc)Class GBP B (inc)Class GBP C (acc)Class GBP C (inc)Class GBP Z (acc)Class USD B (acc)Class USD C (acc)Class USD D (acc)
EUREUREUREURGBPGBPGBPGBPGBPUSDUSDUSD
2.49%3.28%1.98%2.57%2.49%2.52%3.27%3.28%2.71%2.43%3.22%1.94%
Merrill Lynch Investment Solutions – Zweig-DiMenna US Long-Short Equity UCITS Fund
Class EUR B (acc)Class EUR D (acc)Class GBP C (acc)Class USD Management (acc)
EUREURGBPUSD
2.54%2.01%3.27%0.38%
Merrill Lynch Investment Solutions – Theorema European Equity Long-Short UCITS Fund
Class EUR B (acc)Class EUR C (acc)Class EUR D (acc)Class EUR Management (acc)Class EUR Z (acc)Class GBP B (acc)Class GBP C (acc)Class GBP Management (acc)Class GBP Z (acc)Class USD B (acc)Class USD D (acc)
EUREUREUREUREURGBPGBPGBPGBPUSDUSD
2.42%3.23%1.92%2.45%2.49%2.44%3.23%2.44%2.55%2.44%1.92%
Merrill Lynch Investment Solutions – York Asian Event-Driven UCITS Fund
Class EUR B (acc)Class EUR C (acc)Class EUR D (acc)Class GBP B (inc)Class GBP C (acc)Class USD A (acc)Class USD B (acc)Class USD C (acc)Class USD D (acc)
EUREUREURGBPGBPUSDUSDUSDUSD
2.46%3.21%1.93%2.44%
49.11%2.45%2.44%3.25%1.95%
* Liquidated on May 21, 2012
Audited annual report
9Merrill Lynch Investment Solutions
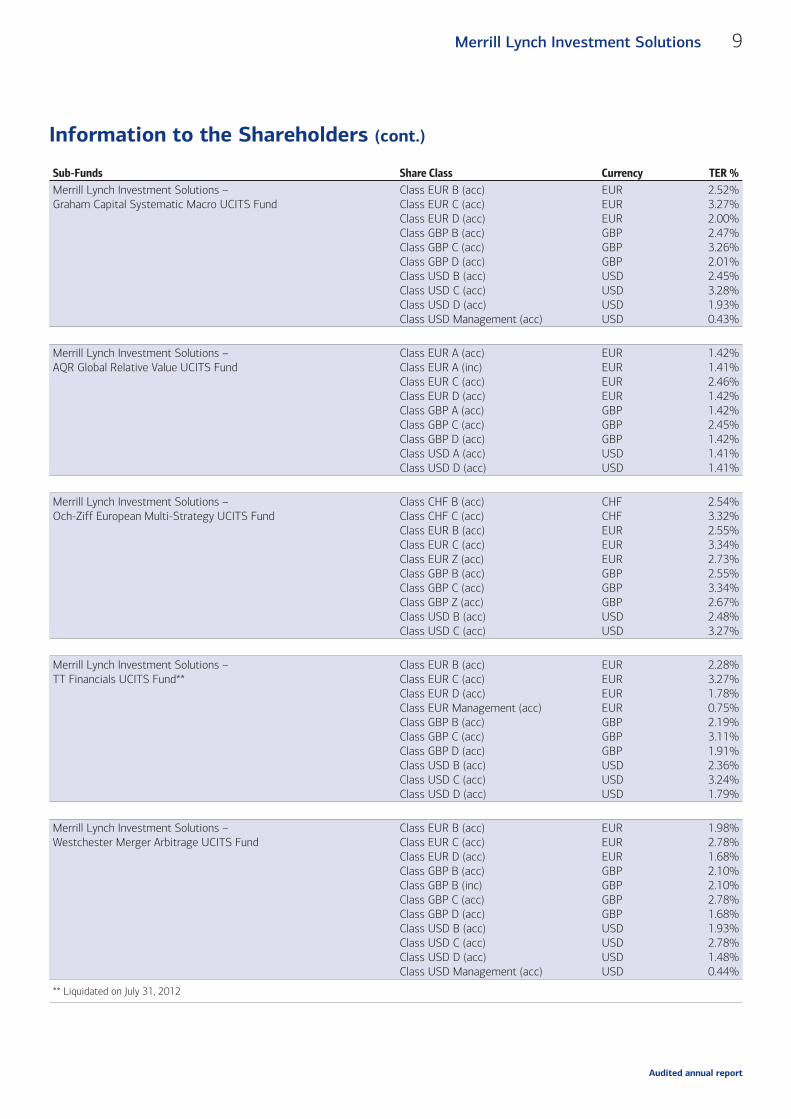
Information to the Shareholders (cont.)
Sub-Funds Share Class Currency TER %Merrill Lynch Investment Solutions – Graham Capital Systematic Macro UCITS Fund
Class EUR B (acc)Class EUR C (acc)Class EUR D (acc)Class GBP B (acc)Class GBP C (acc)Class GBP D (acc)Class USD B (acc)Class USD C (acc)Class USD D (acc)Class USD Management (acc)
EUREUREURGBPGBPGBPUSDUSDUSDUSD
2.52%3.27%2.00%2.47%3.26%2.01%2.45%3.28%1.93%0.43%
Merrill Lynch Investment Solutions – AQR Global Relative Value UCITS Fund
Class EUR A (acc)Class EUR A (inc)Class EUR C (acc)Class EUR D (acc)Class GBP A (acc)Class GBP C (acc)Class GBP D (acc)Class USD A (acc)Class USD D (acc)
EUREUREUREURGBPGBPGBPUSDUSD
1.42%1.41%2.46%1.42%1.42%2.45%1.42%1.41%1.41%
Merrill Lynch Investment Solutions – Och-Ziff European Multi-Strategy UCITS Fund
Class CHF B (acc)Class CHF C (acc)Class EUR B (acc)Class EUR C (acc)Class EUR Z (acc)Class GBP B (acc)Class GBP C (acc)Class GBP Z (acc)Class USD B (acc)Class USD C (acc)
CHFCHFEUREUREURGBPGBPGBPUSDUSD
2.54%3.32%2.55%3.34%2.73%2.55%3.34%2.67%2.48%3.27%
Merrill Lynch Investment Solutions – TT Financials UCITS Fund**
Class EUR B (acc)Class EUR C (acc)Class EUR D (acc)Class EUR Management (acc)Class GBP B (acc)Class GBP C (acc)Class GBP D (acc)Class USD B (acc)Class USD C (acc)Class USD D (acc)
EUREUREUREURGBPGBPGBPUSDUSDUSD
2.28%3.27%1.78%0.75%2.19%3.11%1.91%2.36%3.24%1.79%
Merrill Lynch Investment Solutions – Westchester Merger Arbitrage UCITS Fund
Class EUR B (acc)Class EUR C (acc)Class EUR D (acc)Class GBP B (acc)Class GBP B (inc)Class GBP C (acc)Class GBP D (acc)Class USD B (acc)Class USD C (acc)Class USD D (acc)Class USD Management (acc)
EUREUREURGBPGBPGBPGBPUSDUSDUSDUSD
1.98%2.78%1.68%2.10%2.10%2.78%1.68%1.93%2.78%1.48%0.44%
** Liquidated on July 31, 2012
Audited annual report
10 Merrill Lynch Investment Solutions
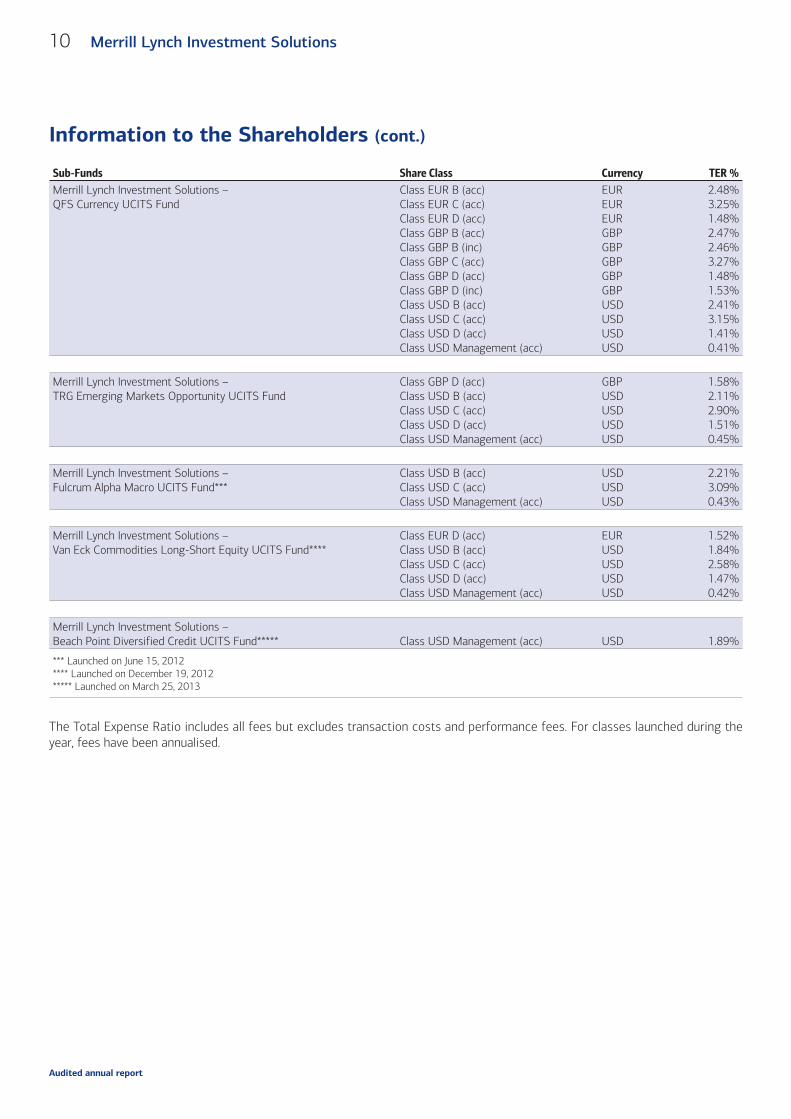
Information to the Shareholders (cont.)
Sub-Funds Share Class Currency TER %Merrill Lynch Investment Solutions – QFS Currency UCITS Fund
Class EUR B (acc)Class EUR C (acc)Class EUR D (acc)Class GBP B (acc)Class GBP B (inc)Class GBP C (acc)Class GBP D (acc)Class GBP D (inc)Class USD B (acc)Class USD C (acc)Class USD D (acc)Class USD Management (acc)
EUREUREURGBPGBPGBPGBPGBPUSDUSDUSDUSD
2.48%3.25%1.48%2.47%2.46%3.27%1.48%1.53%2.41%3.15%1.41%0.41%
Merrill Lynch Investment Solutions – TRG Emerging Markets Opportunity UCITS Fund
Class GBP D (acc)Class USD B (acc)Class USD C (acc)Class USD D (acc)Class USD Management (acc)
GBPUSDUSDUSDUSD
1.58%2.11%2.90%1.51%0.45%
Merrill Lynch Investment Solutions – Fulcrum Alpha Macro UCITS Fund***
Class USD B (acc)Class USD C (acc)Class USD Management (acc)
USDUSDUSD
2.21%3.09%0.43%
Merrill Lynch Investment Solutions – Van Eck Commodities Long-Short Equity UCITS Fund****
Class EUR D (acc)Class USD B (acc)Class USD C (acc)Class USD D (acc)Class USD Management (acc)
EURUSDUSDUSDUSD
1.52%1.84%2.58%1.47%0.42%
Merrill Lynch Investment Solutions – Beach Point Diversified Credit UCITS Fund***** Class USD Management (acc) USD 1.89%
*** Launched on June 15, 2012**** Launched on December 19, 2012***** Launched on March 25, 2013
The Total Expense Ratio includes all fees but excludes transaction costs and performance fees. For classes launched during the year, fees have been annualised.
Audited annual report
11Merrill Lynch Investment Solutions
Additional Information for Investors in the Federal Republic of Germany Marcard, Stein & Co AG, Ballindamm 36, D-20095 Hamburg, has undertaken the function of Paying and Information Agent for the Federal Republic of Germany (the “German Paying and Information Agent”).
Applications for the redemption and conversion of shares may be sent to the German Paying and Information Agent.
All payments to investors, including redemption proceeds and potential distributions, may, upon request, be paid through the German Paying and Information Agent.
The prospectus, the key investor information documents, the articles of incorporation and the annual and semi-annual reports may be obtained, free of charge, in hardcopy form at the office of the German Paying and Information Agent during normal opening hours. The statement of changes in the composition of the investment portfolio is also free of charge upon request at the office of the German Paying and Information Agent available.
Issue, redemption and conversion prices of shares and any other information to the shareholders are also available, free of charge, from the German Paying and Information Agent.
The issue, redemption and conversion prices of shares and the notices to the shareholders will be published on the following website www.invest.baml.com/funds.
Audited annual report
12 Merrill Lynch Investment Solutions
Merrill Lynch Investment Solutions – Marshall Wace TOPS UCITS Fund (Market Neutral)
Investment Management Review: April 1, 2012 to March 31, 2013Over the 12 months under review the European equity market1 returned +14.43%, sharply drawing down -8.98% across April and May 2012 and then rallying steadily by +25.72% from
June to the end of March 2013. The average monthly volatility of the market1 across the 12 month period was 13.68% (based on daily data).
The performance of the strategy over the period was good and broadly in line with that targeted. The 12 month return generated by the Sub-Fund2 was +7.91% net, with a Sharpe ratio of 2.79 over the period (based on daily data). The strategy maintained its targeted low volatility at just 2.78% over the year (compared to 14.64% for the equity market*). The correlation of the Sub-Fund’s2 daily returns to those of the market* was also minimal over the 12 months at just 0.008.
Having oscillated between level 2 and 3 (on a scale of 1 to 5) for the majority of 2012, Marshall Wace’s proprietary composite Alpha Regime Indicator (“ARI”), which seeks to assess the external risk regime in which the MW TOPS strategies operate, ranged between level 1 (not seen since April 2011) and 3 during Q1 2013, indicating a market environment which MW TOPS contributors are likely to fi nd favourable for alpha generation. As a result, GME increased to 320.47% by the end of January 2013, in contrast to a level of 305.44% at the end of 2012.
2012 was particularly busy for the MW TOPS research team, with strong progress being made in several areas. Within the contributor stream, Marshall Wace released an improvement to the model which estimates contributor skill. The Investment Manager uses this to determine contributor weights, resulting in a ‘weighted consensus’ on each stock. Within the alpha domain, the incorporation of additional information (such as price, volume and newsfl ow) alongside contributor input has continued to deliver strong benefi ts. The Investment Manager has added several new data sources and blended these into the fi rm’s existing contributor forecasts, resulting in signifi cant improvements to both their simulations and realised performance. Within their risk and environment research, the team has also made some changes to the Alpha Regime Indicator.
The fall in pairwise correlation seen across 2012 remained at these lower levels into the fi rst quarter of 2013, an observation that is not just limited to daily observations but also present in intraday returns. This microstructure eff ect is important as low intraday correlation increases the number of opportunities for identifying and trading on mispriced stocks and therefore is helpful both to alpha extraction and trading cost reduction. Given this strength in the structural alpha generation capacity of MW TOPS, the Investment Manager remains positive about the return environment for the coming year.
Merrill Lynch Investment Solutions – York Event-Driven UCITS Fund
The second quarter of 2012 was dominated by macroeconomic concerns that overshadowed relatively strong earnings and dampened investor and CEO confi dence as the pace of corporate and economic activity declined. Ongoing European sovereign issues, China’s economic slowdown and concerns over the sustainability of the U.S recovery triggered significant de-risking by
market participants. However, during the third quarter, particularly in August and September, global markets rallied as the ECB strengthened its offi cial policy response to the Eurozone crisis signaling that it would act as “the lender of last resort” by committing to unlimited purchases of sovereign bonds. Further, anticipation of the Federal Reserve’s announcement of QE3 provided additional tailwinds for the markets. During the quarter, volatility declined signifi cantly and more importantly, the high levels of correlations amongst stocks decreased. Global markets were mixed during the fourth quarter with the U.S. declining over uncertainties around the “fi scal cliff ” and Europe continuing to rebound a� er the ECB’s offi cial policy response to the Eurozone crisis. Despite the mixed backdrop, and importantly for our event-driven strategy, investors re-engaged, market volatility remained range-bound, and correlation among asset classes decreased as a Eurozone crisis scenario became less likely. These dynamics resulted in a more rational market, and thus the opportunity to add return through fundamental analysis and catalyst-driven security selection. During the fi rst quarter of 2013, despite ongoing concerns around the stability of the Eurozone and continued budget debates in Washington, global markets rallied amid strong corporate earnings, positive economic data, and a recovering
Investment Managers’ Report
1 As measured by the MSCI AC Daily TR Net Europe Local Index
2 Class EUR A (acc)
Audited annual report
13Merrill Lynch Investment Solutions
Investment Managers’ Report (cont.)
U.S. housing market. Further, indications from central bankers that global interest rates will remain low provided a positive technical backdrop for the markets. During the quarter, we saw an increase in corporate activity and a steady pipeline of European distressed credit situations.
Top contributors to performance during the prior twelve months for the Merrill Lynch Investment Solutions – York Event-Driven UCITS Fund were Lehman Brothers, Realogy and Yahoo. Our Lehman Brothers bonds and claims performed well in anticipation of cash distributions, a� er agreeing to sell its property unit Archstone, and in response to a favorable intercompany settlement. Our shares in Realogy contributed to gains as the company benefi ted from the continued recovery in the U.S. housing market. Yahoo was also a top performer as the company completed the sale of half of its stake in Chinese e-commerce fi rm Alibaba and used the proceeds for share buybacks. The largest detractors from performance over the past year were equity market hedges. Another top detractor during the period was United Rentals, which fell during the 2nd quarter due to fears over a slowdown in global growth and its eff ect on the U.S. economy.
Merrill Lynch Investment Solutions – GLG European Opportunity UCITS Fund
This Sub-Fund was liquidated on May 21, 2012; therefore, there is no Investment Manager Report.
Merrill Lynch Investment Solutions – CCI Healthcare Long-Short UCITS Fund
Year Review and OutlookFor 2012, Biotech longs and Pharmaceuticals/Specialty Pharma longs were the strongest performers while biotech shorts and hedges/options detracted from performance.
As we witnessed for much of 2012 and in fact much of the past 3 years, major political decisions held fragile global economies and stock markets hostage to unpredictable and o� en non-committal actions. In fact, for all of 2012, many binary and unpredictable macro outcomes made it diffi cult to invest aggressively fundamentally, protect the portfolio, and participate on the upside. Many of the market’s biggest moves occurred in short order a� er decisions that, had they gone the other way (i.e. Draghi not intervening as aggressively when Spanish 10 year yields approached 8% or Congress not passing a Fiscal Cliff bill), would have resulted in material downside. As a result, taking on volatility was not desirable and resulted in more use of ETF and option hedging which cost performance about 3% for the year. For 2013, we see an improved macro environment given the policy progress achieved in Europe, better economic data out of China and expansive monetary and fi scal policies in Japan. Though the U.S. budget debate (and all the ancillary issues such as the debt ceiling, sequestration and continuing resolution) will create another overhang for the markets, we are focused on the key leading indicators such as U.S. housing and employment which are showing solid improvement.
For healthcare specifi cally, we are excited about the prospects for the sector. The re-election of President Obama, along with the SCOTUS (Supreme Court of the United States) decision in June, means that for the fi rst time in four years, investors, especially generalists, do not have to consider the uncertainties of changing healthcare policy and instead can make investments based on the fundamentals of the sector. We believe the implementation of the Aff ordable Care Act (ACA) in October 2013 (though delays may occur) will help insure an estimated 15 million new individuals growing to ≈20 million in 2015. Therefore, despite healthcare’s strong performance in 2012, we see multiple expansions in many of the healthcare sub-sectors as investors and the sell side begin to discount the positive impact from increased utilization beginning in 2014. We anticipate volatility for the group as a result of U.S. balanced budget discussions but our analysis of potential entitlement changes suggests limited material economic impact. In fact, the resolution could allow many companies in healthcare to have better visibility on their cash fl ows and therefore deploy cash accordingly, including M&A. Of course, many aspects of the ACA will put pressure on pricing and margins and help to lower the growth of healthcare spending in the U.S.; however, most of these issues will likely begin in earnest in the back half of this decade.
Merrill Lynch Investment Solutions – York Event-Driven UCITS Fund (cont.)
Audited annual report
14 Merrill Lynch Investment Solutions
Investment Managers’ Report (cont.)
SubgroupsBiotech – Many stocks that had performed well throughout the year were down in the latter half, likely due to rotation out of 2012 winners due to changes in the capital gains tax and general risk aversion from Fiscal Cliff concerns. For 2013, we believe biotech will continue to perform well. The regulatory environment remains favorable (i.e., 2012 was a record year for drug approvals). We are excited about many of our core mid cap biotechs but expect that more trading and selected exposure will be needed, especially in those names that performed well in 2012. We look to generate returns from a new crop of stocks with evolving new pipeline stories such as BioMarin and Celgene and Ariad on a rebound from overblown safety and launch fears.
Pharmaceuticals – This group was mostly down in back end of 2012, possibly due to dividend tax changes that began in 2013. Since the beginning of 2013, however, they have rebounded, as the tax change was modest and several of these companies still off er pipeline optionality at low valuations.
Healthcare Services – The hospital group was volatile. On a fundamental basis, volumes have remained lackluster and pricing continues to be relatively stable. Our view of hospitals/providers in 2013 is more constructive than our prior view due to the coming benefi ts from healthcare reform beginning 2014, improving key leading indicators such as U.S. employment which could create a modest utilization uptick during 2013, and less risk from binary events such as the Supreme Court decision and Presidential election. Valuations, though off their lows, are still within historical ranges and do not factor in reform upside scenarios, in our view. For Managed Care Organizations, our outlook remains biased negative (though still constructive on Medicaid focused MCOs). Our view of PBMs is neutral with tailwinds such as continued increases in mail and generic utilization, low exposure to Medicare budget cuts, and modest 2014 utilization benefi ts, off set by headwinds such increasing competition and moderating generic benefi ts.
Medical Technology – Medical technology and supply stocks declined in later in the year mostly due to indiscriminate selling into the fi nal days of the Fiscal Cliff negotiations. We are more constructive on the medical technology group heading into 2013 due primarily to a moderately improving U.S. macroeconomic backdrop, a bottoming process forming in Europe, continued strong emerging markets, and the Medical Technology tax headwind now incorporated into investor expectations. Further, company management’s bias toward shareholder-friendly actions such as dividend increases, restructurings, share buybacks and M&A should help drive additional earnings growth opportunities. Lastly, we anticipate a utilization benefi t due to increased insurance coverage starting in 2014, which we do not view as being fully discounted by investors. As we look into 2013 for healthcare information technology companies, our view has changed from biased negatively to neutral. The slowdown in HCIT spending that we have discussed is occurring and we continue to believe multiple expansion is not likely.
Focus/ThemesMuch as we have discussed in the past, we will focus on those companies that off er true innovation (can demand and justify higher and stable reimbursement and is a necessity), products or services that help reduce costs (increase profi ts) and those that are willing to utilize their cash balances to increase shareholder value, acquire strategic assets and grow in emerging markets (large cap, cash rich, saturated markets, low valuations, high Free Cash Flow). With tail risk and U.S. healthcare policy uncertainty reduced, we are willing to take on more volatility resulting in higher net exposures, less hedging, and increased exposure to global economies and cyclical sectors.
Merrill Lynch Investment Solutions – Zweig-DiMenna US Long-Short Equity UCITS Fund
Politics in the U.S. and macroeconomic events globally played a decisive role in determining the direction of the market during 2012. The fi rst quarter was a robust environment for equities, as
fewer macroeconomic concerns allowed fundamentals to drive stock prices. However, this proved to be short lived, as concerns over Europe’s continuing debt crisis created a volatile environment, only to be buoyed in third quarter by a stop gap resolution by the European authorities. The fourth quarter proved to be just as challenging as the fi scal cliff debate created an uncertain environment, hurting both economic growth and stock performance.
Recent economic data shows clear evidence of early stage recoveries in the two largest economies in the world. Highly accommodative monetary policy and stability in several crisis situations should be a prop to the market and economies. The
Merrill Lynch Investment Solutions – CCI Healthcare Long-Short UCITS Fund (cont.)
Audited annual report
15Merrill Lynch Investment Solutions
Investment Managers’ Report (cont.)
political and economic climate across the globe continues to pose risks to the stability of the market in the coming months. We will monitor all of this and adjust as needed. The more stable economic climate has driven stock correlations to a level closer to its long-term average, which creates a more favourable backdrop for stock selection. We continue to search for investment opportunities that can do well in any type of economic landscape, and our current exposures suggest that we are fi nding many compelling ideas to put to work.
Merrill Lynch Investment Solutions – Theorema European Equity Long-Short UCITS Fund
In the period April 1, 2012 to March 31, 2013, the Dow Jones EURO STOXX 600 had 15.87% performance, whilst the Merrill Lynch Investment Solutions – Theorema European Equity Long-
Short UCITS Fund appreciated by 7.65%. This period has been characterized by extreme volatility combined with European stock prices showing an unprecedented high correlation. This resulted in a diffi cult environment for stock-pickers like us.
Global markets have been trending upwards, supported by vanishing fears with regards to Chinese growth sustainability and the postponement of the so� landing/hard landing debate in that area of the world, whilst the US had started to show some timid, but substantial improvement all across the spectrum of the economy.
Europe, however, remained the Ugly Duck and an exacerbated Greek crisis which by the summer resulted in the country’s debt restructuring, put the European establishment shoulders’ against the wall for clear and fi rm plans with regards to guaranteeing the survival of the banking sector in the area.
In August, just when things were precipitating, a last minute intervention of the ECB tackled the liquidity issue and reinstated confi dence in the viability of the European Financial Sector, spurring investors’ hopes that at some point the establishment would have agreed on more structural interventions such as Eurobonds and possibly a full Banking Union.
Somehow, our portfolio mirrored these developments in Europe, with our longs and shorts not realizing the alpha, but trading all as market proxies until August.
As a lot of the tail risk was perceived by investors to be removed by the ECB intervention, reason came into play, liquidity conditions improved and our portfolio started delivering returns in line with what we expected, rallying 13.50% from September 1 to March 31, 2013 versus 10.5% by the Eurostoxx.
Despite macro factors infl uencing the price action, our portfolio reacted quite well to the increased volatility of the 2012 summer months. In October and November some of our core positions, that we chose for being, according to our analysis, less correlated with the business cycle, released most of the value identifi ed, and some underwent corporate actions, our expected blue sky scenario.
Cables and Media were strong contributors to our performance, with Kabel Deutschland, Telenet and Sky Deutschland among our core longs. Consumers, in spite of a patchy 1st half, delivered some good performance in the 2nd part of the year. We managed to extract alpha also in Oil and Telecoms, while stock picking in the Luxury and Utilities sector have not added much despite some positions delivering well.
Merrill Lynch Investment Solutions – York Asian Event-Driven UCITS Fund
During the second quarter of 2012, our portfolio retreated as weaker than expected growth in China and the U.S. combined with ongoing concerns in Europe to create a diffi cult investing environment. With an uncertain macro outlook and struggling equity markets, we ran a conservatively positioned portfolio with low net exposures throughout the quarter. During the
third quarter, however, our portfolio rebounded despite persistent volatility in the Asian equity markets. Opposing forces impacted the investing environment as concerns regarding Eurozone stability and the Chinese economy were met by central bank support. In this environment, the portfolio generated gains while taking modest directional exposure. Asian markets fi nished 2012 higher
Merrill Lynch Investment Solutions – Zweig-DiMenna US Long-Short Equity UCITS Fund (cont.)
Audited annual report
16 Merrill Lynch Investment Solutions
Investment Managers’ Report (cont.)
with a strong rally in December as new leadership in China and Japan positively impacted market sentiment. Chinese markets gained on increasing signs of economic stabilization and reform, quelling concerns of a hard landing for China, while Japanese markets surged on optimism around refl ation and currency weakening under Shinzo Abe’s new government. Entering the fourth quarter fully invested, our portfolio benefi ted from renewed confi dence in Asian equities and the realization of several catalysts within our special situations holdings. While market sentiment was positively impacted by new leadership in China and Japan at the start of 2013, divergent policies resulted in Asia’s two largest markets fi nishing the fi rst quarter in opposite territory. Japanese markets were strong as Prime Minister Shinzo Abe continued to call for growth, refl ation and currency weakening and Haruhiko Kuroda, an advocate of monetary easing, was confi rmed as the Bank of Japan governor. In contrast, local and overseas Chinese markets pulled back during the quarter on concerns over monetary and credit tightening. Opposing market performance notwithstanding, our portfolio advanced during the quarter as gains from our arbitrage and special situations strategies were only partially off set by market hedges in Japan and modest losses within special situations equities.
For the Merrill Lynch Investment Solutions – York Asian Event-Driven UCITS Fund, top contributors to performance during the period included Jupiter Telecommunications and Aozora Bank. Jupiter Telecommunications saw a 12% bump a� er KDDI and Sumitomo raised their tender off er price a� er pushback from minority shareholders for increased valuation on the deal. Aozora Bank also contributed to gains as we successfully managed the position on both the long and short side. A� er our short position declined in share price ahead of Cerberus’ sale of its stake in the company, we covered and established a long position, which advanced a� er the removal of the stock overhang. Top detractors during the period included Atlas Iron, driven in part by weak market sentiment, and Echo Entertainment, which detracted from performance on news of a board reshuffl e which raised uncertainty around corporate activity.
Merrill Lynch Investment Solutions – Graham Capital Systematic Macro UCITS Fund
The Merrill Lynch Investment Solutions – Graham Capital Systematic Macro UCITS Fund recorded a net loss during the time period of April 1, 2012 through March 31, 2013. The majority of the losses were driven by trading in the energy and metals sectors amidst abrupt price reversals during the period. Smaller losses resulted from trading European currencies. The Sub-Fund
recorded gains from positions in global equity indices and global fi xed income markets as directional moves in these markets benefi tted the Sub-Fund’s performance and off set a portion of the overall losses for the period.
Merrill Lynch Investment Solutions – AQR Global Relative Value UCITS Fund
Twelve-Month Review
Performance Summary1
– The Merrill Lynch Investment Solutions – AQR Global Relative Value UCITS Fund (“GRVU”) returned +4.4% for the twelve months ending March 31, 2013.
– Six of the Sub-Fund’s nine strategies had positive returns during the twelve months.– Since its January 27, 2011 inception, the Sub-Fund has returned +0.4% annualized with realized daily volatility of 6.4%, and
a 0.25 weekly correlation to equities.
Market and Hedge Fund Performance2 The past twelve months have seen a number of changes in market sentiment as market participants struggled to interpret developments in the European Debt Crisis, U.S. budget wrangling and the global demand impact of China as well as other emerging economies. During this period, the MSCI World index appreciated +12.6% in U.S. dollar terms. In the fi rst three months of the period, credit downgrades and poor economic news out of Europe along with weak U.S. employment data sent global markets down about -5% coupled with a signifi cant increase in market volatility. In the next three months, there was aggressive
Merrill Lynch Investment Solutions – York Asian Event-Driven UCITS Fund (cont.)
1 Please read important performance disclosures at the end of this Investment Manager Report. Performance information contained herein is supplemental to the Global Investment Performance Standards (GIPS®) presentations compliant for these strategies. Please inquire at AQR for a copy of the presentations. Performance numbers in this letter are estimates as at March 31, 2013, and refer to the AQR Global Relative Value UCITS Fund, which targets comparable volatility to a multi-strategy hedge fund.
2 Equity index returns are quoted in local market terms unless otherwise stated.
Audited annual report
17Merrill Lynch Investment Solutions
Investment Managers’ Report (cont.)
monetary action from central banks around the globe and equity markets erased gains from the previous quarter. In the fi rst quarter of 2013, global markets advanced soundly and the S&P 500 index closed the quarter at an all-time high, surpassing the previous high set in October of 2007. Volatility, as measured by the VIX, which had been as high as 27% in June 2012, hit a six-year low of 11.3% in March. Ten-year Treasury yields, which had not been above 2% since April 2012, moved above 2% again in the fi rst quarter of 2013. The BAML High Yield index, which appreciated +13.1% in the past twelve months, traded to a historically low yield-to-maturity of 6.4% at the end of the period.
In Japan, the anticipated and subsequent Liberal Democratic Party’s election victory in December and their declared aggressive monetary policy helped to devalue the yen nearly 20% over the last six months, which in turn helped spur the TOPIX equity index up more than 40% in that period. The signifi cant outperformance of the Japanese market (+21%) in the last quarter was just one example of diverging market performance, as the S&P 500 and FTSE 100 each appreciated about 10%, the Euro Stoxx 50 was fl at and the MSCI Emerging Markets index declined -1%. The magnitude of this past quarter’s underperformance (relative to developed markets) by emerging markets has only been exceeded once in the past 25 years, which was in June 1998 during the heart of the Asian Financial Crisis and a couple of months before the Russian default.
Hedge funds, as represented by the HFRI Fund Weighted Index (“HFRI”) and the Dow Jones Credit Suisse Hedge Fund Index (“DJCS”), were +5.5% and +7.2%, respectively, for the trailing twelve months ending March 31, 2013. The beta estimates of the HFRI and DJCS to the MSCI World (US$) for the trailing year were 0.3 and 0.2, respectively. Given the +12.6% return of the MSCI World during the period, beta explains 73% of the HFRI return, and 33% of the DJCS return. The HFRI’s returns were driven by asset-backed, credit and distressed sub-strategies. Relative Value, which includes credit and fi xed income strategies, Multi-Strategy and Event Driven were the best performing broad HFRI strategies. Similarly, DJCS performance was led by Fixed Income Relative Value, Multi-Strategy and Event Driven strategies. Nine of ten DJCS strategy indices, which are classifi ed more closely to GRVU’s strategies, were positive during the twelve-month period, with Dedicated Short Bias being the only exception. The performance of the HFRI Equity Hedge (+5.8%) and the DJCS Long/Short Equity (+6.1%) during the period was not very surprising given that each has historically had about a 0.5 beta to the MSCI World.
GRVU Strategy Contributions – Twelve Months Six of GRVU’s nine strategies had positive results for the trailing twelve months. Stock selection strategies, led by Equity Market Neutral and Long/Short Equity, were the primary source of gains. Arbitrage strategies were a consistent source of gains for the fi rst nine months of the period. The relatively small loss by Arbitrage strategies in the most recent quarter was the fi rst quarterly loss these combined strategies have experienced since GRVU’s inception. Macro strategies were fl at for the full period a� er strong performance in October through December kept these strategies from contributing signifi cant losses over the full period.
Largest Contributors and Detractors – Twelve Months Equity Market Neutral (+2.8%)All of the strategy gains for the period were generated in the most recent quarter, as the previous nine months amounted to a small loss. In fact, the gain in the past three months was the largest quarterly contribution of any of the nine strategies over the past two years.
Gains in Equity Market Neutral during the past twelve months occurred across all four regional portfolios but profi ts in the U.S. and European portfolios, which were +1.2% and 1.0%, respectively, were of greater magnitude than those of the Japanese and U.K. portfolios, which contributed about 0.3% each. Value themes performed well in each region except Japan and were the primary driver of the strong U.S. contribution. Profi ts from U.S. and European value themes were concentrated in the last three months of the period. Growth and accounting-oriented earnings-quality themes performed well across all regions. Defensive themes performed poorly in the U.S., U.K. and Japan. European profi ts were generated across all thematic components and were particularly notable given that the strategic risk-weight allocated to the European portfolio is less than half of the U.S. allocation.
Long/Short Equity (+1.8%)Over the past twelve months, GRVU’s Long/Short Equity strategy generated profi ts from directional positions, industry selection and growth-oriented stock selection strategies. World equity markets generated meaningful positive results in the trailing year and the dynamic, variable net exposure sub-strategy captured this movement, contributing roughly 0.8%. Industry and stock selection strategies are traded within four regional portfolios, of which, European, U.K. and Japanese portfolios generated profi ts
Merrill Lynch Investment Solutions – AQR Global Relative Value UCITS Fund (cont.)
Audited annual report
18 Merrill Lynch Investment Solutions
Investment Managers’ Report (cont.)
of between +0.4% and +0.9% each and the U.S. portfolio lost -0.8%. Growth themes generally performed well within both stock selection and industry selection. Accounting-focused themes also contributed well in the U.K., Europe and Japan. Portfolio losses in the U.S. were a result of weak performance of growth, defensive and accounting-based themes. Defensive themes detracted across all regions.
Convertible Arbitrage (+1.0%)Virtually all of the gains in Convertible Arbitrage were generated in the fi rst six months of the past twelve months. GRVU’s portfolio of convertible securities was estimated to be, on average, 2.3% cheap relative to fair-market-value at the beginning of the period. By the end of June, weighted-average cheapness was estimated to be just 1.3% and during the following quarter the portfolio richened to trade at a 0.3% weighted-average premium to fair-market-value. GRVU’s Convertible Arbitrage strategy benefi ted from this contraction in cheapness and gained +1.0%. During the latter half of the past twelve months, there was very little change in the strategy’s profi t and loss contribution as the portfolio remained at a modest premium. In fact, over the past six months, strategy contribution to fund performance stayed within a narrow range of ± 0.1% each month. As at the end of March, the weighted average premium of the convertible portfolio was 0.2%.
One of the most signifi cant factors driving this change in convertible security valuation was lackluster convertible issuance during 2012. For the full year of 2012, there was roughly $22 billion in new issuance of U.S. equity-linked securities, a paltry amount compared to the period before the fi nancial crisis, when high-yield and lesser investment-grade credit yields were high enough to induce companies to consider the lower yields of convertible securities. As the universe of convertible securities has declined in size, due to this lack of issuance, the bonds that make up that universe have become fully valued. In contrast to 2012, in the fi rst quarter of 2013, there was a surge in issuance, but even the $11 billion in new convertible securities was not enough to materially change the discount/premium profi le of convertible bonds.
As at March 31, 2013, there were 66 convertible positions in GRVU’s Convertible Arbitrage portfolio and just 50 of those issues represented 98% of market value.
Event Driven (+0.7%)GRVU’s Event Driven strategy, which is focused on merger arbitrage, benefi ted from a benign environment over the past twelve months, in which there was moderate deal fl ow, a contraction of deal spreads and a low level of deal failure. The diminished occurrence of deal failures may have had the most positive eff ect on strategy returns. Roughly 60% of profi ts for the trailing period were generated in the quarter-ended December 2012, when median deal spreads narrowed from 3% to 2%. Over the past year spreads have contracted from nearly 4% in March of 2012 to a low of less than 2% and back up to roughly 3% in March of 2013. The portfolio held 51 mergers as at March 31, 2013.
Dedicated Short Bias (-0.3%)Dedicated Short Bias was the only strategy to generate losses of any material nature during this twelve-month period. This strategy trades four regional, sentiment-focused stock selection strategies that are market-neutral in nature and one strategy that is passively short the market. The directional strategy only contributes a modest amount of short equity-beta at the Sub-Fund level and represents roughly 20% of the strategy’s aggregate risk allocation but given the strong market movement during the period it managed to generate -0.7% in loss contribution. The stock selection strategies combined for a +0.4% gain, driven by strong performance of the U.S. portfolio (+0.9%), off set by relatively weak performance of the U.K. portfolio (-0.5%). The European and Japanese portfolios had modest and off setting profi t and loss contributions. Investor sentiment themes performed well in each region except the U.K. and both management-signaling themes and accounting-oriented, earnings-quality themes sustained losses in each region traded.
Tactical PositioningFor much of the past year, the Sub-Fund has been tactically operating near 90% of its forecasted strategic volatility target. Aggregate tactical positioning is a function of individual strategy tactical decisions rather than any aggregate view. As at March 31, 2013, six of GRVU’s nine strategies are tactically underweight relative to strategic allocation compared to just fi ve strategies one year ago. There was only one strategy, Long/Short Equity, which was tactically overweight at the end of the period, which was also true one year ago.
Merrill Lynch Investment Solutions – AQR Global Relative Value UCITS Fund (cont.)
Audited annual report
19Merrill Lynch Investment Solutions
Investment Managers’ Report (cont.)
All three of GRVU’s Arbitrage strategies remain meaningfully underweight from a tactical perspective. Convertible Arbitrage has seen the greatest tactical reduction in risk exposure over the past year of any of the nine GRVU strategies, in light of the fully-valued convertible debt market and the low level of issuance that occurred for much of the past year. Event Driven also fi nished the period tactically positioned below strategic risk, with a roughly 15% reduction over the past year. This reduction and low risk-level refl ects the low merger spreads being off ered by the market and relatively low levels of deal fl ow, limiting portfolio diversifi cation opportunities. The Fixed Income Relative Value strategy has not meaningfully changed its tactical positioning from twelve months ago and remains signifi cantly underweight.
GRVU’s Global Macro strategy’s tactical allocation was reduced by roughly 15% in the past year from roughly 90% at the beginning of the period. Tactical risk allocation to Emerging Markets strategies were reduced by nearly 10% and Managed Futures experienced a slight reduction in allocation during the year. Global Macro has faced decreasing alignment across its various trading themes.
There have been no changes to tactical allocation in Equity Market Neutral or Dedicated Short Bias strategies. The Long/Short Equity strategy is currently 15% overweight, which is a 5% increase from one year prior. The Long/Short Equity tactical positioning has increased along with equity market momentum during the period.
ConclusionThe Merrill Lynch Investment Solutions – AQR Global Relative Value UCITS Fund was up +4.4% net of fees for the twelve months ending March 31, 2013. Strong performance from Equity Market Neutral and Long/Short Equity strategies and reasonable contributions from Convertible Arbitrage and Event Driven strategies characterized Sub-Fund performance for the trailing year. Dedicated Short Bias was the only strategy that experienced losses that were material in nature.
During this period equity market performance was strong and hedge funds indices, which exhibit signifi cant beta relationships to equities, benefi ted from that relationship, to varying degree. Asset-backed, credit and distressed strategies were signifi cant drivers behind hedge fund index returns. Although GRVU does not participate in these strategies for liquidity reasons, the Sub-Fund was still able to generate positive results without meaningful infl uence from equity-market direction.
Disclosures This information is supplemental to the Global Investment Performance Standards (GIPS®) compliant presentation for this strategy.
The information set forth herein has been obtained or derived from sources believed by AQR Capital Management, LLC (“AQR”) to be reliable. However, AQR does not make any representation or warranty, express or implied, as to the information’s accuracy or completeness, nor does AQR recommend that the attached information serve as the basis of any investment decision. This document has been provided to you in response to an unsolicited specifi c request and does not constitute an off er or solicitation of an off er, or any advice or recommendation, to purchase any securities or other fi nancial instruments, and may not be construed as such. This document is intended exclusively for the use of the person to whom it has been delivered by AQR Capital Management, LLC, and it is not to be reproduced or redistributed to any other person. This document is subject to further review and revision. Please refer to the Sub-Fund’s PPM for more information on general terms, risks and fees. For one-on-one presentation use only.
All performance fi gures contained herein refl ect the reinvestment of dividends and all other earnings and represent unaudited estimates of realized and unrealized gains and losses prepared by AQR Capital Management, LLC. There is no guarantee as to the above information’s accuracy or completeness.
PAST PERFORMANCE IS NOT AN INDICATION OF FUTURE PERFORMANCE.
There is no guarantee, express or implied, that long-term return and/or volatility targets will be achieved. Realized returns and/or volatility may come in higher or lower than expected. Diversifi cation does not eliminate the risk of experiencing investment losses.
The net returns of the Merrill Lynch Investment Solutions – AQR Global Relative Value UCITS Fund were calculated using a 1% fi xed annual management fee and 15% performance fee. Please note, as we have several diff erent share classes available, with
Merrill Lynch Investment Solutions – AQR Global Relative Value UCITS Fund (cont.)
Audited annual report
20 Merrill Lynch Investment Solutions
Investment Managers’ Report (cont.)
varying fee arrangements and diff ering base currencies, the performance numbers above are not representative of all investors or achievable by all investors. Please note that the net returns presented here (both MTD and YTD) are based on the assumption that an investor contributed money to the Sub-Fund at the start of the year (or at inception if returns start in a month other than January in the given year) and had no subsequent contributions and redemptions therea� er. Interim contributions and redemptions can aff ect the net return of an investment in the Sub-Fund based on the timing and may vary signifi cantly from the returns above (depending on the amount of incentive fee that has been accrued to date). Please inquire at AQR for more specifi c net returns.
Gross performance results do not refl ect the deduction of investment advisory fees, which would reduce an investor’s actual return. For example, assume that $1 million is invested in an account with the Firm, and this account achieves a 10% compounded annualized return, gross of fees, for fi ve years. At the end of fi ve years that account would grow to $1,610,510 before the deduction of management fees. Assuming management fees of 1.00% per year are deducted monthly from the account, the value of the account at the end of fi ve years would be $1,532,886 and the annualized rate of return would be 8.92%. For a ten-year period, the ending dollar values before and a� er fees would be $2,593,742 and $2,349,739, respectively. AQR’s asset based fees may range up to 2.85% of assets under management, and are generally billed monthly or quarterly at the commencement of the calendar month or quarter during which AQR will perform the services to which the fees relate. Performance fees are generally equal to 20% of net realized and unrealized profi ts each year, a� er restoration of any losses carried forward from prior years. In addition, AQR funds incur expenses (including start-up, legal, accounting, audit, administrative and regulatory expenses) and may have redemption or withdrawal charges up to 2% based on gross redemption or withdrawal proceeds. Please refer to the Sub-Fund’s Private Off ering Memoranda and AQR’s ADV Part 2A for more information on fees. Consultants supplied with gross results are to use this data in accordance with SEC, CFTC, NFA or the applicable jurisdiction’s guidelines.
Convertible bond securities may be considered illiquid securities, which cannot be sold or disposed of in the ordinary course of business at approximately the prices at which they are valued. Diffi culty in selling securities may also result in a loss or may be costly to an investment portfolio.
There is a risk of substantial loss associated with trading commodities, futures, options, derivatives and other financial instruments. Before trading, investors should carefully consider their fi nancial position and risk tolerance to determine if the proposed trading style is appropriate. Investors should realize that when trading futures, commodities, options, derivatives and other fi nancial instruments one could lose the full balance of their account. It is also possible to lose more than the initial deposit when trading derivatives or using leverage. All funds committed to such a trading strategy should be purely risk capital.
Merrill Lynch Investment Solutions – Och-Ziff European Multi-Strategy UCITS Fund
Merrill Lynch Investment Solutions – Och-Ziff European Multi-Strategy UCITS Fund recorded a net gain of approximately 9.85% (USD – Retail share class) over the twelve months ending March 28, 2013. During this period, global markets experienced signifi cant losses and volatility. Within Europe, the EURO STOXX 50 was up approximately 11.33%. Market volatility, as measured by the VIX, ranged moderately over the period.
As market conditions changed throughout the year and the investment landscape shi� ed, we dynamically allocated capital across our four investment strategies in an eff ort to capitalize on opportunities. We continue to employ the Sub-Fund’s cash balance during periods of high volatility and market stress as a tactical risk management tool.
The long/short equity special situations strategy remained a dominant allocation within the Sub-Fund over the course of the twelve months. Throughout much of 2012, market moves and performance of stocks were dominated by global macro events. This trend continued into 2013, while heightened concerns over the potential for economic contagion in Europe were observed at the end of the fi rst quarter of 2013. Market volatility created a particularly diffi cult environment in which to trade, and our portfolio was not immune to dramatic swings as we rotated in and out of positions during the period. During the early summer months, we sought to be positioned with low net exposure, particularly to economically exposed companies, while remaining fl exible in our approach in order to pursue attractive investment opportunities. Later in the summer, due to a marked decrease in volatility, we selectively added to our equities exposure as our perception of corporate events and valuations improved. However,
Merrill Lynch Investment Solutions – AQR Global Relative Value UCITS Fund (cont.)
Audited annual report
21Merrill Lynch Investment Solutions
Investment Managers’ Report (cont.)
towards the end of 2012, uncertainty surrounding fi scal policy in the U.S. and austerity measures in Europe caused us to pare back our exposure to this strategy and engage a more conservative approach heading into 2013. With sentiment in Europe muted at the end of the fi rst quarter of 2013, we have maintained a relatively cautious view on European equities. The focus of our investment strategy continues to be on selecting positions with defi ned events and catalysts, while also seeking investment opportunities with strong fundamentals.
The allocation to the Merger Arbitrage strategy in the Sub-Fund remained relatively low over the period. Due to sustained levels of high volatility and macro uncertainty, deal activity remained muted throughout much of 2012 and into the fi rst quarter of 2013. We continue to focus on selective events and strategic opportunities that present what we believe have attractive risk/reward profi les. We remain optimistic about the potential for increased corporate activity in 2013 as the macro environment becomes more certain.
European convertible valuations were generally mixed over the year with investment grade names continuing to perform well, while we saw pressure on weaker credits. Though it began the period weak, the volume of primary issuance increased at the end of 2012 and into the beginning of 2013.
Over the course of the last twelve months, European credit markets were mostly dominated by sovereign funding concerns and the central banks’ actions related to addressing those issues as well as weak economic indicators. Despite these deterrents, European credit began 2013 on a strong note with signifi cant issuance out of peripheral markets, although this rally faded toward the end of the fi rst quarter. We continued to identify new opportunities in the hybrid capital space, specifi cally in second-tier, well-capitalised fi nancial institutions in core Europe. The economic deterioration across Europe has led to a pick-up in our pipeline of corporate distressed opportunities and though we believe we are in the early stages of the corporate distressed opportunity, we intend to gradually increase our exposure as pricing improves and stability returns to markets.
Merrill Lynch Investment Solutions – TT Financials UCITS Fund
This Sub-Fund was liquidated on July 31, 2012; therefore, there is no Investment Manager Report.
Merrill Lynch Investment Solutions – Westchester Merger Arbitrage UCITS Fund
In the fourth quarter ending December 31, 2012 Merrill Lynch Investment Solutions – Westchester Merger Arbitrage UCITS Fund gained 0.88% during the period, bringing our full-year performance to 2.87%.
Amid continued worldwide economic, political and fi scal uncertainty, equity markets stalled, but in general did not reverse their gains accrued during the fi rst three quarters of the year. The S&P 500 lost 0.38% for the quarter, bringing its year-to-date performance down to a still-extraordinary 16.00% (of which Apple alone contributed almost 1.5%), and the MSCI World Index tacked on 2.63%, bringing its yearly tally to 16.54%. Hedge funds did not fare as well; the HFRX Merger Arbitrage Index gained 0.27% for the quarter for a 0.95% yearly gain, with a standard deviation of 3.11%.
As far as M&A activity is concerned, 2012 was a year of ambiguities. While the environment for corporate transactions continued to appear promising, persistent sovereign debt issues in Europe, fi scal cliff concerns in the United States, and lingering unemployment contributed to nervousness amongst corporations to sign deals. In addition, the presidential election in the United States contributed to fi nancial markets’ uncertainty. In the end, these realities triumphed over the strengthening economic fundamentals which we have observed in previous letters – low interest rates, strong reserves of corporate and private equity cash, a wealth of targets at attractive prices, and the need for companies to fi nd new strategic paths to growth a� er a protracted period of worldwide economic weakness. Throughout the year, investors seemed content to preserve cash, refl ecting a “wait and see” attitude toward potential acquisitions due to macroeconomic uncertainty; as a result, transactions fell to their lowest level
Merrill Lynch Investment Solutions – Och-Ziff European Multi-Strategy UCITS Fund (cont.)
Audited annual report
22 Merrill Lynch Investment Solutions
Investment Managers’ Report (cont.)
since 2009. Despite these headwinds, the Sub-Fund was not only able to generate positive performance but did so exhibiting roughly one-fi � h the “risk” (volatility) of global equity markets.
Political and macroeconomic events may continue to impact activity in 2013. Neither European debt problems nor U.S. fi scal issues have been resolved, and therefore economic visibility remains obscured. Despite this, we expect deal activity to tick-up, as the typical precursors of a merger wave remain in place. Interest rates remain at historic lows, and appear to remain low for the foreseeable future. In addition, corporate balance sheets are still carrying record amounts of cash, and executives continue to search externally for growth. Ultimately, we believe that confi dence, arising from economic and corporate visibility, will be the key to an uptick in activity. The Merrill Lynch Investment Solutions – Westchester Merger Arbitrage UCITS Fund’s is poised to take advantage of this upturn and should continue to generate attractive risk-adjusted returns, despite macroeconomic factors aff ecting the overall market.
Merrill Lynch Investment Solutions – QFS Currency UCITS Fund
Market Summary Despite having zero rate policies in common, the G4 central banks confront distinct environments and are pursuing significantly different policies. In the US, the Fed has pursued monetary accommodation most aggressively among the G4 central banks. Despite having pushed the limits of quantitative easing farthest, the US still has the second worst structural defi cit in the
developed world and unemployment of almost 8%, and confronts near-term demand contraction from fi scal adjustment. The F.O.M.C. is committed to pushing further into monetary terra incognita. Our expected returns refl ect the unprecedented degree of monetary ease and weak growth outlook, rating the US dollar among the two weakest forecasts.
In Europe monetary policy remains inappropriately tight in the periphery, despite the best eff orts of the Draghi ECB. As is o� en the case with economies in liquidity traps, zero rates are associated with positive real interest rates and collapsing bank credit and monetary aggregates – eff ectively tight monetary conditions. Given continuing negative growth in the Eurozone, political tensions in Italy and Spain, and Draghi’s explicit intent to ease monetary conditions in the periphery, our expected returns rate the euro as weakly as the US dollar.
In Japan Abe’s administration is overseeing three aggressive policy initiatives: pressuring the BoJ to ease more aggressively through asset purchases and a higher infl ation target, currency intervention, and renewed fi scal stimulus. While all three policies have been tried over the past decade and a half, this is the fi rst time all three have been tried at once with such abandon. By doing more of everything all at once, the new administration may meet with success in its objectives. Beyond the currency and equity markets taking Abe at his word, these policies miss a number of key issues (the exploding debt and demographics), and face obstacles that markets have yet to digest. We are wary of participating in the USDJPY move, since its move is so far based on sentiment and in anticipation of policy. Equity markets are pricing the eff ects of a weaker yen for exporters and of fi scal stimulus for near term profi ts, yet fi xed income markets are pricing only muted risks of rising infl ation, if any at all. Low structural growth and unsound fi scal dynamics lead us to rate the yen as our third weakest currency by expected return; however, we will be keying on the pricing of greater infl ation risk with the implementation of proposed policies to more aggressively price depreciation.
We have a diversifi ed portfolio of longs against our core EUR and USD shorts: Asia Pacifi c (Australia, China, India and New Zealand), Canada and Swiss Franc. Positions in JPY and GBP are near fl at and portfolio risk is relatively high though below maximum.
Risk assets saw mixed performance globally in Q1. The S&P 500, FTSE, Nikkei and Australian ASX futures rose, the EuroStoxx 50, Hang Seng and KOSPI fell, and mainland Chinese indices were mixed. Rates broadly fell across the G10, and broad commodity indices were down, a� er rising earlier in the quarter. A� er rising through January, the euro fell in February and March, losing -2.83% over the quarter as a whole. Versus other developed economies, the US dollar rose sharply the fi rst two months. Key events included:
• The US Congress managed a partial compromise on the “fi scal cliff ” package of pre-programmed tax hikes and expenditure cuts in early January and failed to fi nd compromise to avoid the so-called “sequestration” package of across-the-board expenditure cuts in early March.
Merrill Lynch Investment Solutions – Westchester Merger Arbitrage UCITS Fund (cont.)
Audited annual report
23Merrill Lynch Investment Solutions
Investment Managers’ Report (cont.)
• Despite restrictive fi scal policy, private sector growth in the US surprised on the upside and is expected to contribute suffi cient activity to maintain overall growth above 2% on the year, according to private sector economists.1
• Early in quarter, the ECB le� its target rate unchanged and expressed optimism that Eurozone growth would resume in the second half of 2013. Coupled with European banks’ early repayment of 3-year LTRO and moderate take-up of the subsequent shorter LTRO auctions, market optimism anticipated the recovery of inter-bank lending within the Eurozone and both the euro and European equities rose the fi rst month of the year.
• In Italian parliamentary elections the center-right, led by Berlusconi, and the populist Five Star movement, led by Beppe Grillo, performed well enough to deny likely centrist coalitions majorities in both chambers. The task of forming a coalition government continued unresolved past the end of the quarter.
• On March 17th the ECB, EU and IMF announced a rescue package for Cyprus that initially would have imposed losses on insured deposits at Cyprus banks. Markets were unsettled by a precedent that could potentially destabilize the European banking system. Subsequently the “troika” and Cyprus negotiated an alternative agreement that “bailed-in” bank equity holders, creditors and unsecured depositors but honored insured deposits.
• Despite optimism early in the year, the tone of European data worsened on the whole, confi rming that the ongoing recession would likely persist well into this year or next.
• Japanese parliament approved Kuroda’s appointment as BoJ governor and Iwata’s and Nakaso’s appointments as Deputy Governors.
• Japanese data were mixed – machine tool orders, industrial production and vehicle sales continued to contract sharply on an annual basis, underperforming expectations. CPI and GDP defl ation continued to fall. Net exports, retail trade, manufacturing indices and housing improved, on the other hand. Upgrades in Japanese growth expectations forecasted by many economists since last year have yet to be corroborated in the data, in our view.
• Australian data, though somewhat mixed, were balanced around expectations and consistent with 2.5%-3% growth. In its announcement the RBA stated it is maintaining policy rates at 3%, waiting to assess the lagged impact of easing from earlier cuts.
Merrill Lynch Investment Solutions – TRG Emerging Markets Opportunity UCITS Fund
Headlines out of Europe, the US and China dominated investor focus in 2012 and made correctly calling the swings in market sentiment a key determinant of performance. Investors generally remained skeptical about the prospects for global growth and exhibited a strong preference for fi xed income as a growth hedge and a source of yield, driving rates lower. Policy makers globally, including those in emerging markets, shared these growth concerns and adopted easy monetary and stimulative fi scal policies, providing support for most risky assets.
These market dynamics were clearly refl ected in Merrill Lynch Investment Solutions – TRG Emerging Markets Opportunity UCITS Fund’s performance, which should be viewed as two distinct time periods. From April through October 2012, the Sub-Fund invested across global emerging market asset classes. Beginning in November 2012, the Sub-Fund narrowed its focus to currencies, interest rates, and, secondarily, credit, while maintaining a global macro investment approach.
Through October, the Sub-Fund experienced losses, most of which were attributable to positioning in equities and currencies in the second quarter. In May, market risk aversion increased dramatically following the outcome of the May 6th elections in Greece. Deterioration in the credit condition of the Spanish banking system, punctuated by the bail-out of Bankia, further compounded investor risk aversion. While the turmoil in Europe and the prevailing risk-averse market sentiment weighed heavily on emerging markets, they faced the additional pressure of persistent doubt over the ability of Chinese policy makers to stimulate growth in light of the weaker than expected economic performance data for April. Several of the portfolio’s equity strategies were predicated on our belief that the market was overestimating the degree of the slowdown in Chinese economic growth. The disappointing
Merrill Lynch Investment Solutions – QFS Currency UCITS Fund (cont.)
Audited annual report
24 Merrill Lynch Investment Solutions
Investment Managers’ Report (cont.)
economic data releases for China in May compounded the negative impact of the already weak market sentiment. Due to the broad-based nature of the market sell-off , the portfolio experienced losses across both diversifi ed exposures expressed through the MSCI EM, as well as in targeted country positions and single stock investments in the greater China region, Russia and Thailand. Currency losses were likewise broad-based, with the higher beta crosses such as USD/Brazilian real and USD/Korea detracting the most. The Sub-Fund recouped a portion of the negative performance in the third quarter. The largest contributors to profi ts were positions in the Malaysian ringgit, Indian rupee and Mexican peso as well as Russian and Venezuelan sovereign and quasi-sovereign bonds.
Since November 2012, the Sub-Fund has generated profi ts and experienced its strongest returns over the year end period. Over the course of December and January, the investment team was able to capitalize on a number of idiosyncratic views as the combination of easy monetary conditions and generally positive economic data releases, particularly out of China, provided an environment conducive to a rally in emerging market assets, despite the event risk surrounding a resolution to the fi scal cliff in the US. Equity option hedges and interest rate receiver positions provided the necessary protection in the portfolio to allow us to run a higher level of risk into the seasonally illiquid year-end markets, based on a desire to preposition for a rally that we expected to unfold as currency markets priced in a resolution to the US fi scal cliff , while also managing the potential downside associated with the occurrence of a worst-case outcome. The turn of the year ushered in an optimistic outlook from global investors as the perception grew that the disruptive tail-risks of the past year are now well-contained. As investors considered longer-term allocations of capital, underlying economic factors were clearer drivers of fl ows and performance in emerging markets. Emerging market local currency bonds were the benefi ciary of steady capital infl ows, with a positive follow-on impact on EM currencies. Over this time period, Japanese yen funding of a number of positions was a strong component of gains. Other key sources of profi ts were the Thai baht, the Mexican peso and interest rates, and positions in a Russian quasi-sovereign bond.
Looking ahead, the decrease in tail risks should continue to support carry trades throughout 2013. Reduced tails risks also mean that domestic business cycles and individual policy decisions will have a bigger impact on asset performance than in 2012, allowing for more relative value trades between countries. The biggest risk we see on the horizon is market anxiety over potential changes in Fed policy. Although we don’t expect the Fed to move this year, there is still a risk that markets prematurely position to a potential change. Even though a Fed exit in an environment of sustained growth in the US is ultimately a positive shock for EM countries, risk trades could potentially come under pressure initially.
Merrill Lynch Investment Solutions – Fulcrum Alpha Macro UCITS Fund
Over the whole period, global equities (+22%) generated significant positive returns while commodities (7.6%) were also positive. Bonds were fl at as the decrease in appetite for risk-
haven assets was off set by the continued purchase of fi xed income securities by central banks. The gains in pro-risk assets were driven mainly by a reduction in the likelihood of tail events in the global economy and particularly in the Euro area thanks to the actions of Fed and ECB. One of the biggest changes over the period was the adoption of a 2% infl ation target in Japan through aggressive monetary policy. This caused the Japanese Yen to fall by approximately 25% from the peak and the Nikkei to hit multi-year highs.
Being absolute return, the Sub-Fund performed reasonably well over this period, generating 7% without any significant drawdowns. The most profi table strategy type over this period was trend-following (+6%), while the fundamental quant macro models also added 4%. Furthermore, short-term trading benefi ted from opportunistic mean-reversion trades, adding 1.5%, while hedging lost 1.4% but helped control drawdowns.
Across asset classes, gains were divided between equities and currencies with fi xed income and commodities roughly fl at. The volatility of the Sub-Fund has been lower than target because of the confl icting signals across the models.
Over the next period, we expect the decreased correlations within and across asset classes to provide ample opportunities for the Sub-Fund to generate alpha which is uncorrelated with the market return.
Merrill Lynch Investment Solutions – TRG Emerging Markets Opportunity UCITS Fund (cont.)

Audited annual report
25Merrill Lynch Investment Solutions
Investment Managers’ Report (cont.)
Merrill Lynch Investment Solutions – Van Eck Commodities Long-Short Equity UCITS Fund
Market ReviewThere was wide divergence during the fi rst quarter between the performance of commodity equities and underlying commodity prices overall. There was also wide divergence during the fi rst quarter
among the various sub-sectors’ performance. Gasoline and natural gas experienced double-digit gains. Crude oil also advanced, albeit more modestly. Palladium, platinum and cotton were the only other commodities to see price increases. Most other commodities experienced price declines during the quarter, with wheat declining most.
This weakness was driven, in our opinion, by disappointing European economic growth, as well as China’s economic growth moderating. Also, toward the end of the fi rst quarter, questions about the solvency of certain banks were raised, as the European Union agreed on a bailout for the Cyprus banking system, which for the fi rst time included losses for large depositors.
On the equity side, most, albeit not all, commodity-related indices posted gains, as aggressive U.S. Federal Reserve balance sheet expansion resumed in January 2013, supporting both the U.S. economy and broad equity market performance. The so-called resolution of the U.S. “fi scal cliff ” also helped drive the equity rally and investors’ focus on bullish U.S. economic data. Metals and mining related indices were the exception and were down on the quarter.
Fund AttributionGiven the recent launch of the Sub-Fund we are disappointed with the slow start through quarter end. The primary drivers of the negative return at quarter-end were trades in the steel and iron ore space. Within equity shorts, positions in energy were the largest detractor.
On the other hand, there were some sectors in which we were able to generate some alpha. Those include exposures in agriculture, energy and forest products. Within energy, the refi ners, an ethanol play, and exploration and production companies drove performance.
Regarding exposures, we began 2013 with net equity exposure in the Sub-Fund at about 17% and this increased until reaching a high near 28% towards the end of March.
Positioning and Outlook
MacroGoing forward, we believe that if the European economy stabilizes, the outlook for global economic growth should improve, as monetary policy remains very accommodative in developed economies. The historic quantitative easing policies currently in place should, in our view, ultimately lead to stronger economic growth and, in turn, potentially improve demand for commodities.
EnergyIn our view, there is some uncertainty regarding crude oil prices and related equities due primarily to supply/demand outlook factors. Domestically, we expect increased U.S. energy production, especially from the Bakken and Eagleford basins. Internationally, we believe that Chinese demand, Middle East production and non-OPEC production will likely be key infl uences on the global balance. Natural gas prices will, in our view, continue to be dependent on weather conditions and rig counts. Overall, we believe the energy sector will likely focus on capital spending discipline and strategic allocations in the months ahead. This may continue to allow for diff erentiation across shale plays and may well be a key to performance going forward.
AgricultureWe continue to expect agricultural markets to normalize as the year progresses. While planting progress is behind last years’ torrid pace (due in part to colder spring weather), we are confi dent that with even a small window farmers can get crops in the ground. At the same time, the increased precipitation has markedly improved drought conditions in the Midwest farm belt. While we view the USDA’s 160+ estimated corn crop yield as overly optimistic, we do see a high likelihood of a yield above 150 on dramatically increased crop size. The USDA also increased the size of the old-crop carry-in for corn and soy. This creates a more tenable short-term supply situation and ultimately should result in lower grain prices and more readily available supply for consumers. Certainly, weather can change this forecast, but at this point we feel it should hold.
Audited annual report
26 Merrill Lynch Investment Solutions
Investment Managers’ Report (cont.)
Base Metals & MiningAlthough some miners continued to miss production and cost guidance, we feel the broader industry will potentially off er compelling opportunities going forward. In recent months, we have seen a sea change of top-level executive in the mining industry, with more than 30 companies announcing new executives at the C-level (CEO, CFO, etc.). With new management has come a refreshing change in capital allocation –generally, away from capital expansion and towards a more conservative approach focused on increasing return-on-capital and improving cash fl ow. We believe margins in the mining companies, that, in our view are attractive investments, will increase in the future based on the confl uence of three factors: 1) reducing capital allocations to greenfi eld projects; 2) addressing cyclical costs; and 3) asset sales to increase free cash fl ow generation.
Precious MetalsGold equities have been underperforming gold for some time to the dismay of many investors, ourselves included. We continue to see an environment that, we believe, fundamentally favors gold long-term.
Merrill Lynch Investment Solutions – Beach Point Diversifi ed Credit UCITS Fund
This Sub-Fund was launched on March 25, 2013; therefore, there is no Investment Manager Report.
Luxembourg, March 28, 2013
Note: The fi gures stated in this report are historical and not necessarily indicative of future performance.
Merrill Lynch Investment Solutions – Van Eck Commodities Long-Short Equity UCITS Fund (cont.)
27 Merrill Lynch Investment Solutions
Audit Report
To the Shareholders ofMerrill Lynch Investment Solutions
PricewaterhouseCoopers, Société coopérative, 400 Route d’Esch, B.P. 1443, L-1014 LuxembourgT: +352 494848 1, F:+352 494848 2900, www.pwc.lu
Cabinet de révision agréé. Expert-comptable (autorisation gouvernementale n°10028256)R.C.S. Luxembourg B 65 477 - TVA LU25482518
We have audited the accompanying fi nancial statements of Merrill Lynch Investment Solutions (the “SICAV”) and of each of its Sub-Funds, which comprise the Statement of Net Assets and the Schedule of Investments as of 31 March 2013 and the Statement of Operations and Changes in Net Assets for the year then ended, and a summary of signifi cant accounting policies and other explanatory notes to the fi nancial statements.
Responsibility of the Board of Directors of the SICAV for the fi nancial statements
The Board of Directors of the SICAV is responsible for the preparation and fair presentation of these fi nancial statements in accordance with Luxembourg legal and regulatory requirements relating to the preparation of the fi nancial statements and for such internal control as the Board of Directors of the SICAV determines is necessary to enable the preparation of fi nancial statements that are free from material misstatement, whether due to fraud or error.
Responsibility of the “Réviseur d’entreprises agréé”
Our responsibility is to express an opinion on these fi nancial statements based on our audit. We conducted our audit in accordance with International Standards on Auditing as adopted for Luxembourg by the “Commission de Surveillance du Secteur Financier”. Those standards require that we comply with ethical requirements and plan and perform the audit to obtain reasonable assurance about whether the fi nancial statements are free from material misstatement.
An audit involves performing procedures to obtain audit evidence about the amounts and disclosures in the fi nancial statements. The procedures selected depend on the judgment of the “Réviseur d’entreprises agréé”, including the assessment of the risks of material misstatement of the fi nancial statements, whether due to fraud or error. In making those risk assessments, the “Réviseur d’entreprises agréé” considers internal control relevant to the entity’s preparation and fair presentation of the fi nancial statements in order to design audit procedures that are appropriate in the circumstances, but not for the purpose of expressing an opinion on the eff ectiveness of the entity’s internal control. An audit also includes evaluating the appropriateness of accounting policies used and the reasonableness of accounting estimates made by the Board of Directors of the SICAV, as well as evaluating the overall presentation of the fi nancial statements.
We believe that the audit evidence we have obtained is suffi cient and appropriate to provide a basis for our audit opinion.
Merrill Lynch Investment Solutions 2B
pwe
Opinion
In our opinion, the financial statements give a true and fair view of the financial position of Merrill Lynch InvestmentSolutionsandof eachof itsSub-Fundsasof 3l March2Ol3,andof theresultsof theiroperationsandchangesintheir net assets for the year then ended in accordance with Luxembourg legal and regulatory requirements relatingto the preparation of the financial statements.
Other matters
Supplementary information included in the annual report has been reviewed in the context of our mandate buthas not been subject to specific audit procedures carried out in accordance with the standards described above.
Consequently, we express no opinion on such information. However, we have no observation to make concerningsuch information in the context of the financial statements taken as a whole.
Luxembourg, 15 July 2013PricewaterhouseCoopers, Socidt6 coop6rative
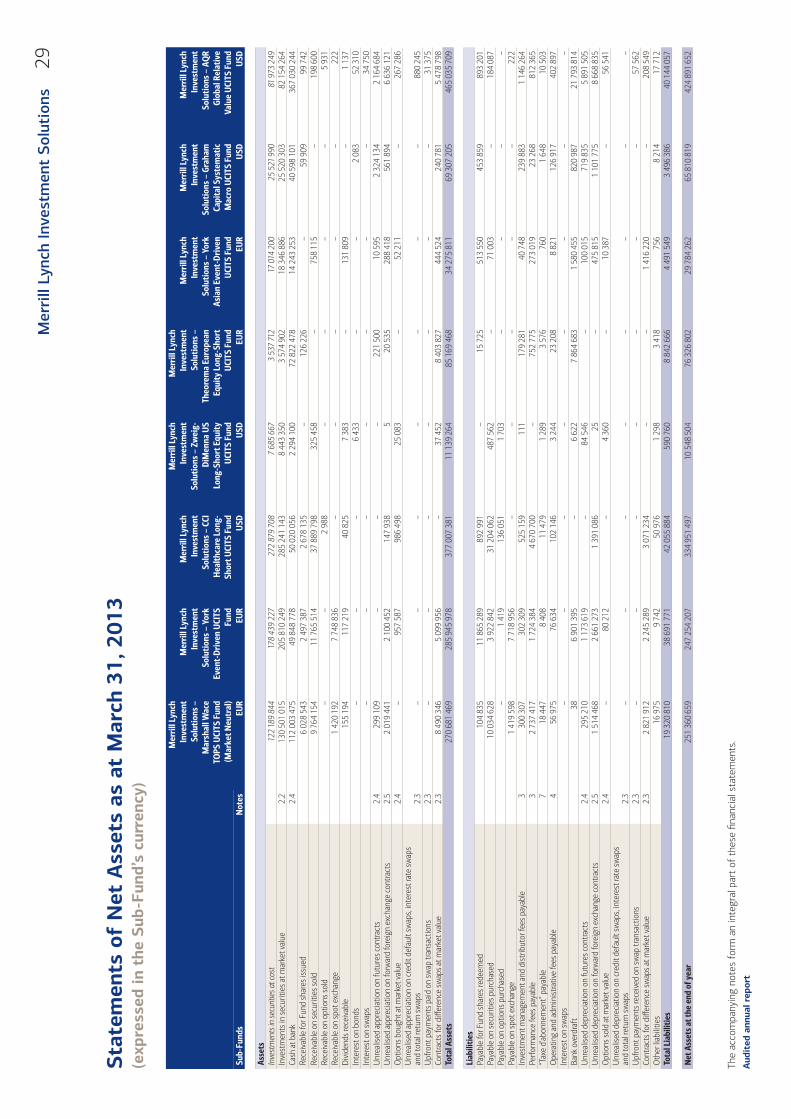
Aud
ited
ann
ual r
epor
t
The
acco
mpa
nyin
g no
tes
form
an
inte
gral
par
t of
the
se fi
nanc
ial s
tate
men
ts.
29M
erri
ll Ly
nch
Inve
stm
ent
Solu
tion
s
Sta
tem
ents
of
Net
Ass
ets
as a
t M
arch
31,
201
3(e
xpre
ssed
in t
he S
ub-F
und’
s cu
rren
cy)
Mer
rill
Lync
h In
vest
men
t So
lutio
ns –
M
arsh
all W
ace
TOPS
UCI
TS F
und
(Mar
ket N
eutr
al)
Mer
rill
Lync
h In
vest
men
t So
lutio
ns –
Yor
k Ev
ent-
Driv
en U
CITS
Fu
nd
Mer
rill
Lync
h In
vest
men
t So
lutio
ns –
CCI
H
ealth
care
Lon
g-Sh
ort U
CITS
Fun
d
Mer
rill
Lync
h In
vest
men
t So
lutio
ns –
Zw
eig-
DiM
enna
US
Lon
g-Sh
ort E
quity
U
CITS
Fun
d
Mer
rill
Lync
h In
vest
men
t So
lutio
ns –
Th
eore
ma
Euro
pean
Eq
uity
Lon
g-Sh
ort
UCI
TS F
und
Mer
rill
Lync
h In
vest
men
t So
lutio
ns –
Yor
k As
ian
Even
t-Dr
iven
U
CITS
Fun
d
Mer
rill
Lync
h In
vest
men
t So
lutio
ns –
Gra
ham
Ca
pita
l Sys
tem
atic
M
acro
UCI
TS F
und
Mer
rill
Lync
h In
vest
men
t So
lutio
ns –
AQ
R Gl
obal
Rel
ativ
e Va
lue
UCI
TS F
und
Sub-
Fund
sN
otes
EUR
EUR
USD
USD
EUR
EUR
USD
USD
Asse
tsIn
vest
men
ts in
secu
ritie
s at c
ost
122
189
844
178
439
227
272
879
708
7 68
5 66
73
537
712
17 0
14 2
0025
521
990
81 9
73 2
49In
vest
men
ts in
sec
uriti
es a
t mar
ket v
alue
2.2
130
501
015
205
810
249
285
241
143
8 44
3 35
03
574
902
18 3
46 8
8625
520
303
82 1
54 2
64Ca
sh a
t ban
k2.
4 1
12 0
03 4
75
49
848
778
50
020
056
2 2
94 1
00
72
822
478
14
243
253
40
598
101
367
030
244
Re
ceiv
able
for F
und
shar
es is
sued
6 02
8 54
32
497
387
2 67
8 13
5–
126
226
–59
909
99 7
42Re
ceiv
able
on
secu
ritie
s so
ld9
764
154
11 7
65 5
1437
889
798
325
458
–75
8 11
5–
198
600
Rece
ivab
le o
n op
tions
sol
d–
–2
988
––
––
5 93
1Re
ceiv
able
on
spot
exc
hang
e1
420
192
7 74
8 83
6–
––
––
222
Divi
dend
s re
ceiv
able
155
194
117
219
40 8
257
383
–13
1 80
9–
1 13
7In
tere
st o
n bo
nds
––
–6
433
––
2 08
352
310
Inte
rest
on
swap
s–
––
––
––
34 7
50U
nrea
lised
app
reci
atio
n on
futu
res
cont
ract
s2.
429
9 10
9–
––
221
500
10 5
952
324
134
2 16
4 68
4U
nrea
lised
app
reci
atio
n on
forw
ard
fore
ign
exch
ange
con
trac
ts2.
52
019
441
2 10
0 45
214
7 93
85
20 5
3528
8 41
856
1 89
46
636
121
Opt
ions
bou
ght a
t mar
ket v
alue
2.4
–95
7 58
798
6 49
825
083
–52
211
–26
7 28
6U
nrea
lised
app
reci
atio
n on
cre
dit d
efau
lt sw
aps,
inte
rest
rate
sw
aps
and
tota
l ret
urn
swap
s2.
3–
––
––
––
880
245
Upf
ront
pay
men
ts p
aid
on s
wap
tran
sact
ions
2.3
––
––
––
–31
375
Cont
ract
s fo
r diff
eren
ce s
wap
s at
mar
ket v
alue
2.3
8 49
0 34
65
099
956
–37
452
8 40
3 82
7 4
44 5
24
240
781
5 47
8 79
8To
tal A
sset
s 2
70 6
81 4
69
285
945
978
3
77 0
07 3
81
11
139
264
85
169
468
34
275
811
69
307
205
465
035
709
Liab
ilitie
sPa
yabl
e fo
r Fun
d sh
ares
rede
emed
104
835
11 8
65 2
8989
2 99
1–
15 7
2551
3 55
045
3 85
989
3 20
1Pa
yabl
e on
sec
uriti
es p
urch
ased
10 0
34 6
283
922
842
31 2
04 0
6248
7 56
2–
71 0
03–
184
087
Paya
ble
on o
ptio
ns p
urch
ased
–1
419
136
051
1 70
3–
––
–Pa
yabl
e on
spo
t exc
hang
e1
419
598
7 71
8 95
6–
––
––
222
Inve
stm
ent m
anag
emen
t and
dis
trib
utor
fees
pay
able
3 3
00 3
07
302
309
5
25 1
59
111
1
79 2
81
40
748
239
883
1
146
264
Pe
rform
ance
fees
pay
able
32
737
417
1 72
4 38
44
670
700
–75
2 77
527
3 01
923
268
812
365
“Tax
e d’
abon
nem
ent”
pay
able
718
447
8 40
811
479
1 28
93
576
760
1 64
810
503
Ope
ratin
g an
d ad
min
istr
ativ
e fe
es p
ayab
le4
56
975
76
634
102
146
3
244
2
3 20
8 8
821
1
26 9
17
402
897
In
tere
st o
n sw
aps
––
––
––
––
Bank
ove
rdra
ft 3
8 6
901
395
–
6 6
22
7 8
64 6
83
1 5
80 4
55
820
987
2
1 79
3 81
4 U
nrea
lised
dep
reci
atio
n on
futu
res
cont
ract
s2.
429
5 21
01
173
619
–84
546
–10
0 01
571
9 83
55
891
505
Unr
ealis
ed d
epre
ciat
ion
on fo
rwar
d fo
reig
n ex
chan
ge c
ontr
acts
2.5
1 51
4 46
82
661
273
1 39
1 08
625
–47
5 81
51
101
775
8 66
8 83
5O
ptio
ns s
old
at m
arke
t val
ue2.
4–
80 2
12–
4 36
0–
10 3
87–
56 5
41U
nrea
lised
dep
reci
atio
n on
cre
dit d
efau
lt sw
aps,
inte
rest
rate
sw
aps
and
tota
l ret
urn
swap
s2.
3–
––
––
––
–U
pfro
nt p
aym
ents
rece
ived
on
swap
tran
sact
ions
2.3
––
––
––
–57
562
Cont
ract
s fo
r diff
eren
ce s
wap
s at
mar
ket v
alue
2.3
2 82
1 91
22
245
289
3 07
1 23
4–
– 1
416
220
–
208
549
Oth
er li
abili
ties
16 9
759
742
50 9
761
298
3 41
875
68
214
17
712
Tota
l Lia
bilit
ies
19
320
810
38
691
771
42
055
884
590
760
8
842
666
4
491
549
3
496
386
4
0 14
4 05
7
Net
Ass
ets
at th
e en
d of
yea
r25
1 36
0 65
924
7 25
4 20
733
4 95
1 49
710
548
504
76 3
26 8
0229
784
262
65 8
10 8
1942
4 89
1 65
2
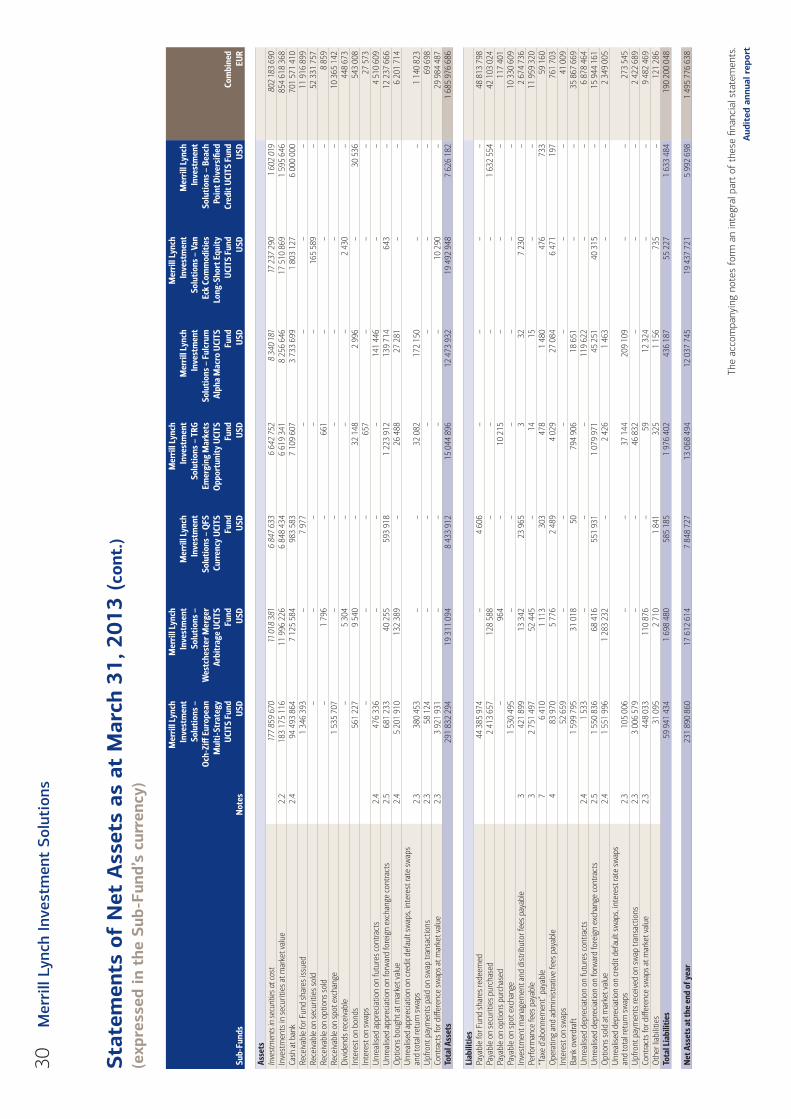
Aud
ited
ann
ual r
epor
t
The
acco
mpa
nyin
g no
tes
form
an
inte
gral
par
t of
the
se fi
nanc
ial s
tate
men
ts.
30M
erri
ll Ly
nch
Inve
stm
ent
Solu
tion
s
Sta
tem
ents
of
Net
Ass
ets
as a
t M
arch
31,
201
3 (c
ont.
)(e
xpre
ssed
in t
he S
ub-F
und’
s cu
rren
cy)
Mer
rill
Lync
h In
vest
men
t So
lutio
ns –
O
ch-Z
iff E
urop
ean
Mul
ti-St
rate
gyU
CITS
Fun
d
Mer
rill
Lync
h In
vest
men
t So
lutio
ns –
W
estc
hest
er M
erge
r Ar
bitr
age
UCI
TS
Fund
Mer
rill
Lync
h In
vest
men
t So
lutio
ns –
QFS
Cu
rren
cy U
CITS
Fu
nd
Mer
rill
Lync
h In
vest
men
t So
lutio
ns –
TRG
Em
ergi
ng M
arke
ts
Opp
ortu
nity
UCI
TS
Fund
Mer
rill
Lync
h In
vest
men
t So
lutio
ns –
Ful
crum
Al
pha
Mac
ro U
CITS
Fu
nd
Mer
rill
Lync
h In
vest
men
t So
lutio
ns –
Van
Ec
k Co
mm
oditi
es
Long
-Sho
rt E
quity
U
CITS
Fun
d
Mer
rill
Lync
h In
vest
men
t So
lutio
ns –
Bea
ch
Poin
t Div
ersi
fi ed
Cred
it U
CITS
Fun
dCo
mbi
ned
Sub-
Fund
sN
otes
USD
USD
USD
USD
USD
USD
USD
EUR
Asse
tsIn
vest
men
ts in
secu
ritie
s at c
ost
177
859
670
11 0
18 3
816
847
633
6 64
2 75
28
340
181
17 2
37 2
901
602
019
802
183
690
Inve
stm
ents
in s
ecur
ities
at m
arke
t val
ue2.
218
3 17
5 11
611
996
226
6 84
8 43
46
619
341
8 25
6 64
617
510
869
1 59
5 64
685
4 61
8 36
8Ca
sh a
t ban
k2.
4 9
4 49
3 86
4 7
125
584
98
3 58
3 7
109
607
3
733
699
1
803
127
6
000
000
701
571
410
Re
ceiv
able
for F
und
shar
es is
sued
1 34
6 39
3–
7 97
7–
––
–11
916
899
Rece
ivab
le o
n se
curit
ies
sold
––
––
–16
5 58
9–
52 3
31 7
57Re
ceiv
able
on
optio
ns s
old
–1
796
– 6
61
––
– 8
859
Re
ceiv
able
on
spot
exc
hang
e1
535
707
––
––
––
10 3
65 1
42Di
vide
nds
rece
ivab
le–
5 30
4–
––
2 43
0–
448
673
Inte
rest
on
bond
s56
1 22
79
540
–32
148
2 99
6–
30 5
3654
3 00
8In
tere
st o
n sw
aps
––
– 6
57
––
– 2
7 57
3 U
nrea
lised
app
reci
atio
n on
futu
res
cont
ract
s2.
447
6 33
6–
––
141
446
––
4 51
0 60
9U
nrea
lised
app
reci
atio
n on
forw
ard
fore
ign
exch
ange
con
trac
ts2.
568
1 23
340
255
593
918
1 22
3 91
213
9 71
464
3–
12 2
37 6
66O
ptio
ns b
ough
t at m
arke
t val
ue2.
45
201
910
132
389
–26
488
27 2
81–
–6
201
714
Unr
ealis
ed a
ppre
ciat
ion
on c
redi
t def
ault
swap
s, in
tere
st ra
te s
wap
s an
d to
tal r
etur
n sw
aps
2.3
380
453
––
32 0
8217
2 15
0–
–1
140
823
Upf
ront
pay
men
ts p
aid
on s
wap
tran
sact
ions
2.3
58 1
24–
––
––
–69
698
Cont
ract
s fo
r diff
eren
ce s
wap
s at
mar
ket v
alue
2.3
3 92
1 93
1–
––
–10
290
– 2
9 98
4 48
7 To
tal A
sset
s 2
91 8
32 2
94
19
311
094
8 43
3 91
2 1
5 04
4 89
6 1
2 47
3 93
2 1
9 49
2 94
8 7
626
182
1 6
85 9
76 6
86
Liab
ilitie
sPa
yabl
e fo
r Fun
d sh
ares
rede
emed
44 3
85 9
74–
4 60
6–
––
–48
813
798
Paya
ble
on s
ecur
ities
pur
chas
ed2
413
657
128
588
––
––
1 63
2 55
442
103
024
Paya
ble
on o
ptio
ns p
urch
ased
–96
4–
10
215
––
– 1
17 4
01
Paya
ble
on s
pot e
xcha
nge
1 53
0 49
5–
––
––
–10
330
609
Inve
stm
ent m
anag
emen
t and
dis
trib
utor
fees
pay
able
3 4
21 8
99
13
342
23
965
3
32
7 2
30
– 2
674
736
Pe
rform
ance
fees
pay
able
32
751
497
52 4
45–
1415
––
11 9
59 3
20“T
axe
d’ab
onne
men
t” p
ayab
le7
6 41
01
113
303
478
1 48
047
673
359
160
Ope
ratin
g an
d ad
min
istr
ativ
e fe
es p
ayab
le4
83
970
5 7
76
2 4
89
4 0
29
27
084
6 4
71
197
761
703
In
tere
st o
n sw
aps
52 6
59–
––
––
– 4
1 00
9 Ba
nk o
verd
raft
1 5
99 7
95
31
018
50 7
94 9
06
18
651
––
35
867
669
Unr
ealis
ed d
epre
ciat
ion
on fu
ture
s co
ntra
cts
2.4
1 53
3–
––
119
622
––
6 87
8 46
4U
nrea
lised
dep
reci
atio
n on
forw
ard
fore
ign
exch
ange
con
trac
ts2.
51
550
836
68 4
1655
1 93
11
079
971
45 2
5140
315
–15
944
161
Opt
ions
sol
d at
mar
ket v
alue
2.4
1 55
1 99
61
283
232
–2
426
1 46
3–
–2
349
005
Unr
ealis
ed d
epre
ciat
ion
on c
redi
t def
ault
swap
s, in
tere
st ra
te s
wap
s an
d to
tal r
etur
n sw
aps
2.3
105
006
––
37 1
4420
9 10
9–
–27
3 54
5U
pfro
nt p
aym
ents
rece
ived
on
swap
tran
sact
ions
2.3
3 00
6 57
9–
–46
832
––
–2
422
689
Cont
ract
s fo
r diff
eren
ce s
wap
s at
mar
ket v
alue
2.3
448
033
110
876
– 5
9 12
324
––
9 4
82 4
69
Oth
er li
abili
ties
31 0
952
710
1 8
41
325
1 15
673
5–
121
286
To
tal L
iabi
litie
s 5
9 94
1 43
4 1
698
480
58
5 18
5 1
976
402
4
36 1
87
55
227
1 63
3 48
4 1
90 2
00 0
48
Net
Ass
ets
at th
e en
d of
yea
r23
1 89
0 86
017
612
614
7 84
8 72
713
068
494
12 0
37 7
4519
437
721
5 99
2 69
81
495
776
638
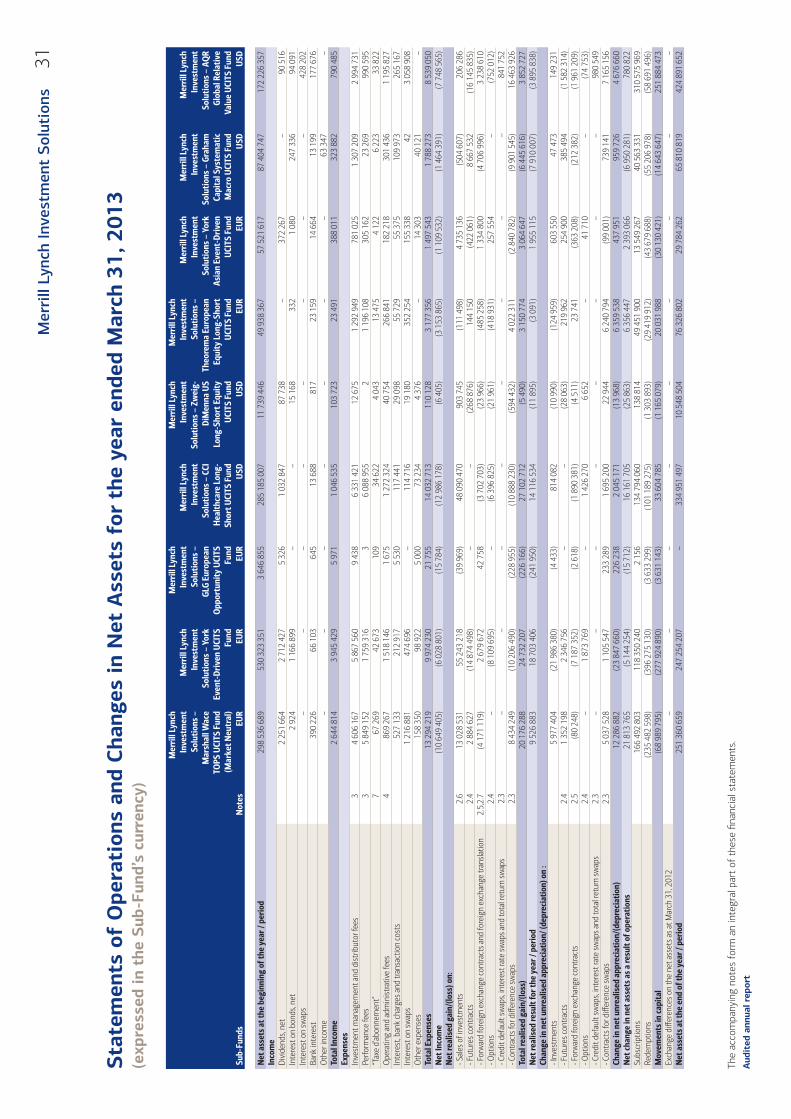
Aud
ited
ann
ual r
epor
t
The
acco
mpa
nyin
g no
tes
form
an
inte
gral
par
t of
the
se fi
nanc
ial s
tate
men
ts.
31M
erri
ll Ly
nch
Inve
stm
ent
Solu
tion
s
Sta
tem
ents
of
Ope
rati
ons
and
Cha
nges
in N
et A
sset
s fo
r th
e ye
ar e
nded
Mar
ch 3
1, 2
013
(exp
ress
ed in
the
Sub
-Fun
d’s
curr
ency
)
Mer
rill
Lync
h In
vest
men
t So
lutio
ns –
M
arsh
all W
ace
TOPS
UCI
TS F
und
(Mar
ket N
eutr
al)
Mer
rill
Lync
h In
vest
men
t So
lutio
ns –
Yor
k Ev
ent-
Driv
en U
CITS
Fu
nd
Mer
rill
Lync
h In
vest
men
t So
lutio
ns –
GL
G Eu
rope
an
Opp
ortu
nity
UCI
TS
Fund
Mer
rill
Lync
h In
vest
men
t So
lutio
ns –
CCI
H
ealth
care
Lon
g-Sh
ort U
CITS
Fun
d
Mer
rill
Lync
h In
vest
men
t So
lutio
ns –
Zw
eig-
DiM
enna
US
Long
-Sho
rt E
quity
U
CITS
Fun
d
Mer
rill
Lync
h In
vest
men
t So
lutio
ns –
Th
eore
ma
Euro
pean
Eq
uity
Lon
g-Sh
ort
UCI
TS F
und
Mer
rill
Lync
h In
vest
men
t So
lutio
ns –
Yor
k As
ian
Even
t-Dr
iven
U
CITS
Fun
d
Mer
rill
Lync
h In
vest
men
t So
lutio
ns –
Gra
ham
Ca
pita
l Sys
tem
atic
M
acro
UCI
TS F
und
Mer
rill
Lync
h In
vest
men
t So
lutio
ns –
AQ
R Gl
obal
Rel
ativ
e Va
lue
UCI
TS F
und
Sub-
Fund
sN
otes
EUR
EUR
EUR
USD
USD
EUR
EUR
USD
USD
Net
ass
ets
at th
e be
ginn
ing
of th
e ye
ar /
peri
od29
8 53
6 68
953
0 32
3 35
13
646
855
285
185
007
11 7
39 4
4649
938
367
57 5
21 6
1787
404
747
172
226
357
Inco
me
Divi
dend
s, ne
t2
251
664
2 71
2 42
75
326
1 03
2 84
787
738
–37
2 26
7–
90 5
16In
tere
st o
n bo
nds,
net
2 92
41
166
899
––
15 1
6833
21
080
247
336
94 0
91In
tere
st o
n sw
aps
––
––
––
––
428
202
Bank
inte
rest
390
226
66 1
0364
513
688
817
23 1
5914
664
13 1
9917
7 67
6O
ther
inco
me
––
––
––
–63
347
–To
tal I
ncom
e2
644
814
3 94
5 42
95
971
1 04
6 53
510
3 72
323
491
388
011
323
882
790
485
Expe
nses
Inve
stm
ent m
anag
emen
t and
dis
trib
utor
fees
3 4
606
167
5
867
560
9
438
6
331
421
1
2 67
5 1
292
949
78
1 02
5 1
307
209
2
994
731
Pe
rform
ance
fees
35
849
152
1 75
9 31
63
6 08
8 95
52
1 19
6 10
830
5 16
223
269
990
595
“Tax
e d’
abon
nem
ent”
767
269
42 6
7310
934
622
4 04
313
475
4 12
26
223
33 8
22O
pera
ting
and
adm
inis
trat
ive
fees
4 8
69 2
67
1 5
18 1
46
1 6
75
1 2
72 3
24
40
754
266
841
1
82 2
18 3
01 4
36
1 1
95 8
27
Inte
rest
, ban
k ch
arge
s an
d tr
ansa
ctio
n co
sts
527
133
212
917
5 53
011
7 44
129
098
55 7
2955
375
109
973
265
167
Inte
rest
on
swap
s1
216
881
474
696
–11
4 71
619
180
352
254
155
338
423
058
908
Oth
er e
xpen
ses
158
350
98 9
225
000
73 2
344
376
–14
303
40 1
21–
Tota
l Exp
ense
s13
294
219
9 97
4 23
021
755
14 0
32 7
1311
0 12
83
177
356
1 49
7 54
31
788
273
8 53
9 05
0N
et In
com
e(1
0 64
9 40
5)(6
028
801
)(1
5 78
4)(1
2 98
6 17
8)(6
405
)(3
153
865
)(1
109
532
)(1
464
391
)(7
748
565
)N
et re
alis
ed g
ain/
(loss
) on:
- Sal
es o
f inv
estm
ents
2.6
13 0
28 5
3155
243
218
(39
969)
48 0
90 4
7090
3 74
5(1
11 4
98)
4 73
5 13
6(5
04 6
07)
206
286
- Fut
ures
con
trac
ts2.
42
884
627
(14
874
498)
––
(268
876
)14
4 15
0(4
22 0
61)
8 66
7 53
2(1
6 14
5 83
5)- F
orw
ard
fore
ign
exch
ange
con
trac
ts a
nd fo
reig
n ex
chan
ge tr
ansl
atio
n2.
5,2.
7(4
171
119
)2
679
672
42 7
58(3
702
703
)(2
3 96
6)(4
85 2
58)
1 33
4 80
0(4
706
996
)3
238
610
- Opt
ions
2.4
– (8
109
695
)–
(6 3
96 8
25)
(21
961)
(418
931
) 2
57 5
54
–(7
52 0
12)
- Cre
dit d
efau
lt sw
aps,
inte
rest
rate
sw
aps
and
tota
l ret
urn
swap
s2.
3–
––
––
––
– 8
41 7
52
- Con
trac
ts fo
r diff
eren
ce s
wap
s2.
3 8
434
249
(1
0 20
6 49
0)(2
28 9
55)
(10
888
230)
(594
432
) 4
022
311
(2
840
782
) (9
901
545
)16
463
926
To
tal r
ealis
ed g
ain/
(loss
) 2
0 17
6 28
8 2
4 73
2 20
7 (2
26 1
66)
27
102
712
(5 4
90)
3 1
50 7
74
3 0
64 6
47
(6 4
45 6
16)
3 85
2 72
7N
et re
alis
ed re
sult
for t
he y
ear /
per
iod
9 5
26 8
83
18
703
406
(241
950
) 1
4 11
6 53
4 (1
1 89
5) (3
091
) 1
955
115
(7
910
007
) (3
895
838
)Ch
ange
in n
et u
nrea
lised
app
reci
atio
n/ (d
epre
ciat
ion)
on
:- I
nves
tmen
ts5
977
404
(21
986
380)
(4 4
33)
814
082
(10
990)
(124
959
)60
3 55
047
473
149
231
- Fut
ures
con
trac
ts2.
41
352
198
2 34
6 75
6–
–(2
8 06
3)21
9 96
225
4 90
038
5 49
4(1
582
314
)- F
orw
ard
fore
ign
exch
ange
con
trac
ts2.
5(8
0 24
8)(7
187
352
)(2
618
)(1
890
381
)(4
511
)23
741
(363
208
)(2
12 3
82)
(1 9
61 2
09)
- Opt
ions
2.4
–1
873
769
–1
426
270
6 65
2–
41 7
10–
(74
753)
- Cre
dit d
efau
lt sw
aps,
inte
rest
rate
sw
aps
and
tota
l ret
urn
swap
s2.
3–
––
––
––
– 9
80 5
49
- Con
trac
ts fo
r diff
eren
ce s
wap
s2.
3 5
037
528
1
105
547
2
33 2
89
1 6
95 2
00
22
944
6 2
40 7
94
(99
001)
739
141
7
165
156
Ch
ange
in n
et u
nrea
lised
app
reci
atio
n/(d
epre
ciat
ion)
12
286
882
(23
847
660)
226
238
2 0
45 1
71
(13
968)
6 3
59 5
38
437
951
9
59 7
26
4 6
76 6
60
Net
cha
nge
in n
et a
sset
s as
a re
sult
of o
pera
tions
21
813
765
(5 1
44 2
54)
(15
712)
16
161
705
(25
863)
6 3
56 4
47
2 3
93 0
66
(6 9
50 2
81)
780
822
Su
bscr
iptio
ns16
6 49
2 80
311
8 35
0 24
02
156
134
794
060
138
814
49 4
51 9
0013
549
267
40 5
63 3
3131
0 57
5 96
9Re
dem
ptio
ns(2
35 4
82 5
98)
(396
275
130
)(3
633
299
)(1
01 1
89 2
75)
(1 3
03 8
93)
(29
419
912)
(43
679
688)
(55
206
978)
(58
691
496)
Mov
emen
ts in
cap
ital
(68
989
795)
(277
924
890
)(3
631
143
)33
604
785
(1 1
65 0
79)
20 0
31 9
88(3
0 13
0 42
1)(1
4 64
3 64
7)25
1 88
4 47
3Ex
chan
ge d
iff er
ence
s on
the
net a
sset
s as
at M
arch
31,
201
2–
––
––
––
––
Net
ass
ets
at th
e en
d of
the
year
/ pe
riod
251
360
659
247
254
207
–33
4 95
1 49
710
548
504
76 3
26 8
0229
784
262
65 8
10 8
1942
4 89
1 65
2
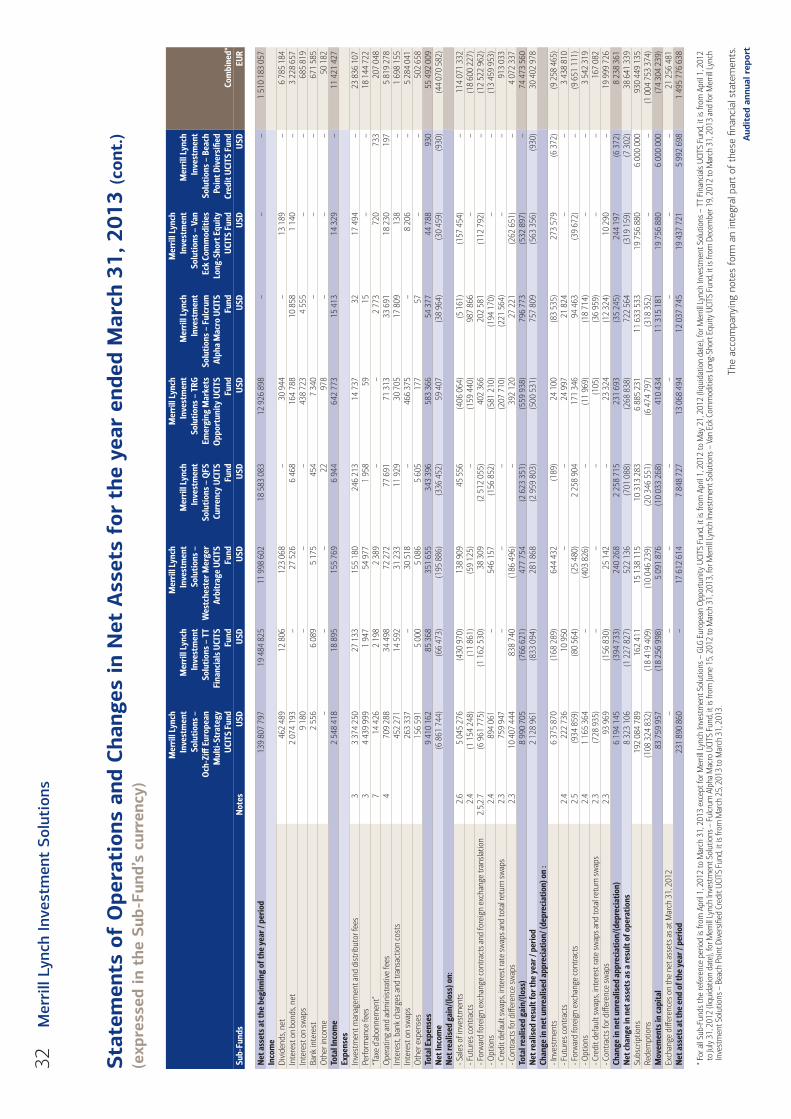
Sta
tem
ents
of
Ope
rati
ons
and
Cha
nges
in N
et A
sset
s fo
r th
e ye
ar e
nded
Mar
ch 3
1, 2
013
(con
t.)
(exp
ress
ed in
the
Sub
-Fun
d’s
curr
ency
)
Aud
ited
ann
ual r
epor
t
The
acco
mpa
nyin
g no
tes
form
an
inte
gral
par
t of
the
se fi
nanc
ial s
tate
men
ts.
32M
erri
ll Ly
nch
Inve
stm
ent
Solu
tion
s
Mer
rill
Lync
h In
vest
men
t So
lutio
ns –
O
ch-Z
iff E
urop
ean
Mul
ti-St
rate
gyU
CITS
Fun
d
Mer
rill
Lync
h In
vest
men
t So
lutio
ns –
TT
Fina
ncia
ls U
CITS
Fu
nd
Mer
rill
Lync
h In
vest
men
t So
lutio
ns –
W
estc
hest
er M
erge
r Ar
bitr
age
UCI
TS
Fund
Mer
rill
Lync
h In
vest
men
t So
lutio
ns –
QFS
Cu
rren
cy U
CITS
Fu
nd
Mer
rill
Lync
h In
vest
men
t So
lutio
ns –
TRG
Em
ergi
ng M
arke
ts
Opp
ortu
nity
UCI
TS
Fund
Mer
rill
Lync
h In
vest
men
t So
lutio
ns –
Ful
crum
Al
pha
Mac
ro U
CITS
Fu
nd
Mer
rill
Lync
h In
vest
men
t So
lutio
ns –
Van
Ec
k Co
mm
oditi
es
Long
-Sho
rt E
quity
U
CITS
Fun
d
Mer
rill
Lync
h In
vest
men
t So
lutio
ns –
Bea
ch
Poin
t Div
ersi
fi ed
Cred
it U
CITS
Fun
dCo
mbi
ned*
Sub-
Fund
sN
otes
USD
USD
USD
USD
USD
USD
USD
USD
EUR
Net
ass
ets
at th
e be
ginn
ing
of th
e ye
ar /
peri
od13
9 80
7 79
719
484
825
11 9
98 6
0218
583
083
12 9
26 8
98–
––
1 51
0 18
3 05
7In
com
eDi
vide
nds,
net
462
489
12 8
0612
3 06
8–
30 9
44–
13 1
89–
6 78
5 18
4In
tere
st o
n bo
nds,
net
2 07
4 19
3–
27 5
266
468
164
788
10 8
581
140
–3
228
657
Inte
rest
on
swap
s9
180
––
–43
8 72
34
555
––
685
819
Bank
inte
rest
2 55
66
089
5 17
545
47
340
––
–67
1 58
5O
ther
inco
me
––
–22
978
––
–50
182
Tota
l Inc
ome
2 54
8 41
818
895
155
769
6 94
464
2 77
315
413
14 3
29–
11 4
21 4
27Ex
pens
esIn
vest
men
t man
agem
ent a
nd d
istr
ibut
or fe
es3
3 3
74 2
50
27
133
155
180
2
46 2
13
14
737
32
17
494
–23
836
107
Perfo
rman
ce fe
es3
4 43
9 99
91
947
54 9
771
958
5915
––
18 1
44 7
22“T
axe
d’ab
onne
men
t”7
14 4
262
198
2 38
9–
–2
773
720
733
207
048
Ope
ratin
g an
d ad
min
istr
ativ
e fe
es4
709
288
3
4 49
8 7
2 27
2 7
7 69
1 7
1 31
3 3
3 69
1 1
8 23
0 19
75
819
278
Inte
rest
, ban
k ch
arge
s an
d tr
ansa
ctio
n co
sts
452
271
14 5
9231
233
11 9
2930
705
17 8
0913
8–
1 6
98 1
55In
tere
st o
n sw
aps
263
337
–30
518
–46
6 37
5–
8 20
6–
5 28
4 04
1O
ther
exp
ense
s15
6 59
15
000
5 08
65
605
177
57–
–50
2 65
8To
tal E
xpen
ses
9 41
0 16
285
368
351
655
343
396
583
366
54 3
7744
788
930
55 4
92 0
09N
et In
com
e(6
861
744
)(6
6 47
3)(1
95 8
86)
(336
452
)59
407
(38
964)
(30
459)
(930
)(4
4 07
0 58
2)N
et re
alis
ed g
ain/
(loss
) on:
- Sal
es o
f inv
estm
ents
2.6
5 04
5 27
6(4
30 9
70)
138
909
45 5
56(4
06 0
64)
(5 1
61)
(157
454
)–
114
071
332
- Fut
ures
con
trac
ts2.
4(1
154
248
)(1
1 86
1)(5
9 12
5)–
(159
440
)98
7 86
6–
–(1
8 60
0 22
7)- F
orw
ard
fore
ign
exch
ange
con
trac
ts a
nd fo
reig
n ex
chan
ge tr
ansl
atio
n2.
5,2.
7(6
961
775
)(1
162
530
)38
309
(2 5
12 0
55)
402
366
20
2 58
1(1
12 7
92)
– (1
2 52
2 96
2)- O
ptio
ns2.
4 8
94 0
61
– 5
46 1
57
(156
852
) (5
81 2
10)
(194
170
)–
–(1
3 45
9 95
3)- C
redi
t def
ault
swap
s, in
tere
st ra
te s
wap
s an
d to
tal r
etur
n sw
aps
2.3
759
947
–
––
(207
710
) (2
21 5
64)
––
913
033
- C
ontr
acts
for d
iff er
ence
sw
aps
2.3
10
407
444
838
740
(1
86 4
96)
– 3
92 1
20
27
221
(262
651
)–
4 07
2 33
7To
tal r
ealis
ed g
ain/
(loss
) 8
990
705
(7
66 6
21)
477
754
(2
623
351
) (5
59 9
38)
796
773
(5
32 8
97)
–74
473
560
N
et re
alis
ed re
sult
for t
he y
ear /
per
iod
2 1
28 9
61
(833
094
) 2
81 8
68
(2 9
59 8
03)
(500
531
) 7
57 8
09
(563
356
)(9
30)
30
402
978
Chan
ge in
net
unr
ealis
ed a
ppre
ciat
ion/
(dep
reci
atio
n) o
n :
- Inv
estm
ents
6 37
5 87
0(1
68 2
89)
644
432
(189
)24
100
(83
535)
273
579
(6 3
72)
(9 2
58 4
65)
- Fut
ures
con
trac
ts2.
422
2 73
610
950
––
24 9
9721
824
––
3 43
8 81
0- F
orw
ard
fore
ign
exch
ange
con
trac
ts2.
5(9
34 8
59)
(80
564)
(25
480)
2 25
8 90
4 1
71 3
46
94 4
63(3
9 67
2)–
(9 6
51 1
11)
- Opt
ions
2.4
1 16
5 36
4–
(403
826
)–
(11
969)
(18
714)
––
3 54
2 31
9- C
redi
t def
ault
swap
s, in
tere
st ra
te s
wap
s an
d to
tal r
etur
n sw
aps
2.3
(728
935
)–
––
(105
) (3
6 95
9)–
– 1
67 0
82
- Con
trac
ts fo
r diff
eren
ce s
wap
s2.
3 9
3 96
9 (1
56 8
30)
25
142
– 2
3 32
4 (1
2 32
4) 1
0 29
0 –
19
999
726
Chan
ge in
net
unr
ealis
ed a
ppre
ciat
ion/
(dep
reci
atio
n) 6
194
145
(3
94 7
33)
240
268
2
258
715
2
31 6
93
(35
245)
244
197
(6
372
) 8
238
361
N
et c
hang
e in
net
ass
ets
as a
resu
lt of
ope
ratio
ns 8
323
106
(1
227
827
) 5
22 1
36
(701
088
) (2
68 8
38)
722
564
(3
19 1
59)
(7 3
02)
38
641
339
Subs
crip
tions
192
084
789
162
411
15 1
38 1
1510
313
283
6 88
5 23
111
633
533
19 7
56 8
806
000
000
930
449
135
Rede
mpt
ions
(108
324
832
)(1
8 41
9 40
9)(1
0 04
6 23
9)(2
0 34
6 55
1)(6
474
797
)(3
18 3
52)
––
(1 0
04 7
53 3
74)
Mov
emen
ts in
cap
ital
83 7
59 9
57(1
8 25
6 99
8)5
091
876
(10
033
268)
410
434
11 3
15 1
8119
756
880
6 00
0 00
0(7
4 30
4 23
9)Ex
chan
ge d
iff er
ence
s on
the
net a
sset
s as
at M
arch
31,
201
2–
––
––
––
–21
256
481
Net
ass
ets
at th
e en
d of
the
year
/ pe
riod
231
890
860
–17
612
614
7 84
8 72
713
068
494
12 0
37 7
4519
437
721
5 99
2 69
81
495
776
638
* For
all
Sub-
Fund
s th
e re
fere
nce
perio
d is
from
Apr
il 1,
201
2 to
Mar
ch 3
1, 2
013
exce
pt fo
r Mer
rill L
ynch
Inve
stm
ent S
olut
ions
– G
LG E
urop
ean
Opp
ortu
nity
UCI
TS F
und,
it is
from
Apr
il 1,
201
2 to
May
21,
201
2 (li
quid
atio
n da
te),
for M
erril
l Lyn
ch In
vest
men
t Sol
utio
ns –
TT
Fina
ncia
ls U
CITS
Fun
d, it
is fr
om A
pril
1, 2
012
to Ju
ly 3
1, 2
012
(liqu
idat
ion
date
), fo
r Mer
rill L
ynch
Inve
stm
ent S
olut
ions
– F
ulcr
um A
lpha
Mac
ro U
CITS
Fun
d, it
is fr
om Ju
ne 1
5, 2
012
to M
arch
31,
201
3, fo
r Mer
rill L
ynch
Inve
stm
ent S
olut
ions
– V
an E
ck C
omm
oditi
es L
ong-
Shor
t Equ
ity U
CITS
Fun
d, it
is fr
om D
ecem
ber 1
9, 2
012
to M
arch
31,
201
3 an
d fo
r Mer
rill L
ynch
In
vest
men
t Sol
utio
ns –
Bea
ch P
oint
Div
ersi
fi ed
Cred
it U
CITS
Fun
d, it
is fr
om M
arch
25,
201
3 to
Mar
ch 3
1, 2
013.
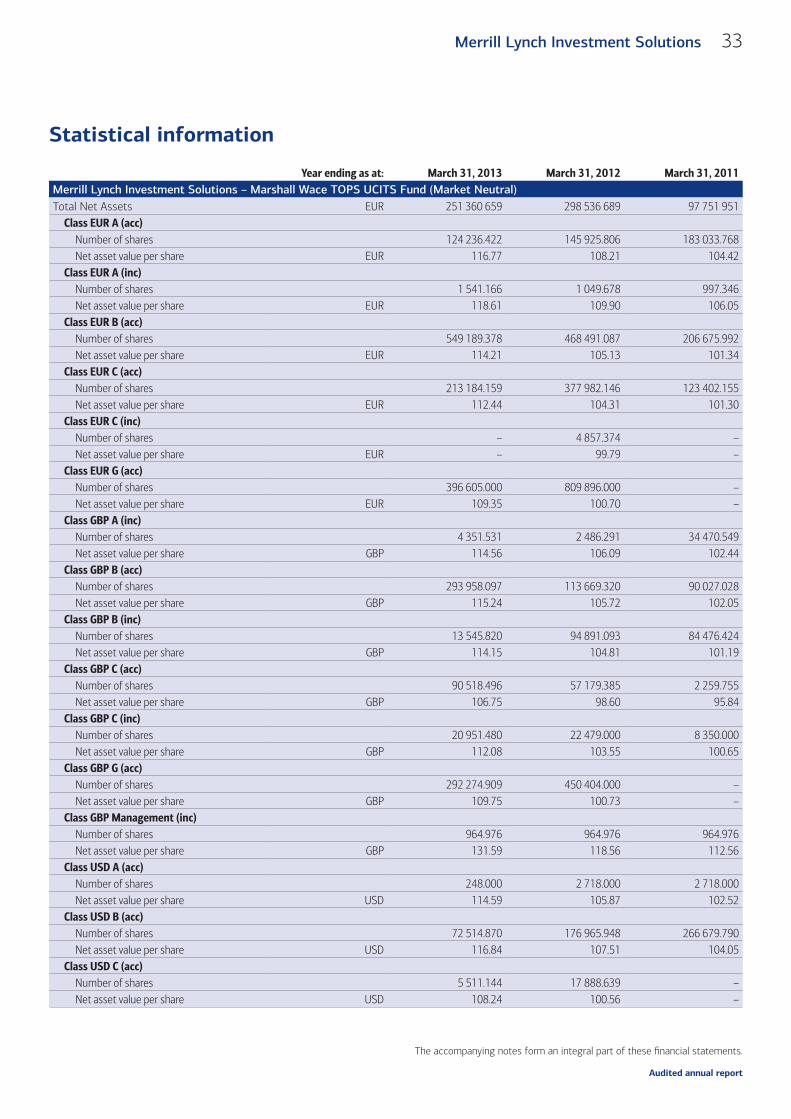
Audited annual report
33Merrill Lynch Investment Solutions
The accompanying notes form an integral part of these fi nancial statements.
Statistical information
Year ending as at: March 31, 2013 March 31, 2012 March 31, 2011Merrill Lynch Investment Solutions – Marshall Wace TOPS UCITS Fund (Market Neutral)Total Net Assets EUR 251 360 659 298 536 689 97 751 951
Class EUR A (acc)Number of shares 124 236.422 145 925.806 183 033.768Net asset value per share EUR 116.77 108.21 104.42
Class EUR A (inc)Number of shares 1 541.166 1 049.678 997.346Net asset value per share EUR 118.61 109.90 106.05
Class EUR B (acc)Number of shares 549 189.378 468 491.087 206 675.992Net asset value per share EUR 114.21 105.13 101.34
Class EUR C (acc)Number of shares 213 184.159 377 982.146 123 402.155Net asset value per share EUR 112.44 104.31 101.30
Class EUR C (inc)Number of shares – 4 857.374 –Net asset value per share EUR – 99.79 –
Class EUR G (acc)Number of shares 396 605.000 809 896.000 –Net asset value per share EUR 109.35 100.70 –
Class GBP A (inc)Number of shares 4 351.531 2 486.291 34 470.549Net asset value per share GBP 114.56 106.09 102.44
Class GBP B (acc)Number of shares 293 958.097 113 669.320 90 027.028Net asset value per share GBP 115.24 105.72 102.05
Class GBP B (inc)Number of shares 13 545.820 94 891.093 84 476.424Net asset value per share GBP 114.15 104.81 101.19
Class GBP C (acc)Number of shares 90 518.496 57 179.385 2 259.755Net asset value per share GBP 106.75 98.60 95.84
Class GBP C (inc)Number of shares 20 951.480 22 479.000 8 350.000Net asset value per share GBP 112.08 103.55 100.65
Class GBP G (acc)Number of shares 292 274.909 450 404.000 –Net asset value per share GBP 109.75 100.73 –
Class GBP Management (inc)Number of shares 964.976 964.976 964.976Net asset value per share GBP 131.59 118.56 112.56
Class USD A (acc)Number of shares 248.000 2 718.000 2 718.000Net asset value per share USD 114.59 105.87 102.52
Class USD B (acc)Number of shares 72 514.870 176 965.948 266 679.790Net asset value per share USD 116.84 107.51 104.05
Class USD C (acc)Number of shares 5 511.144 17 888.639 –Net asset value per share USD 108.24 100.56 –
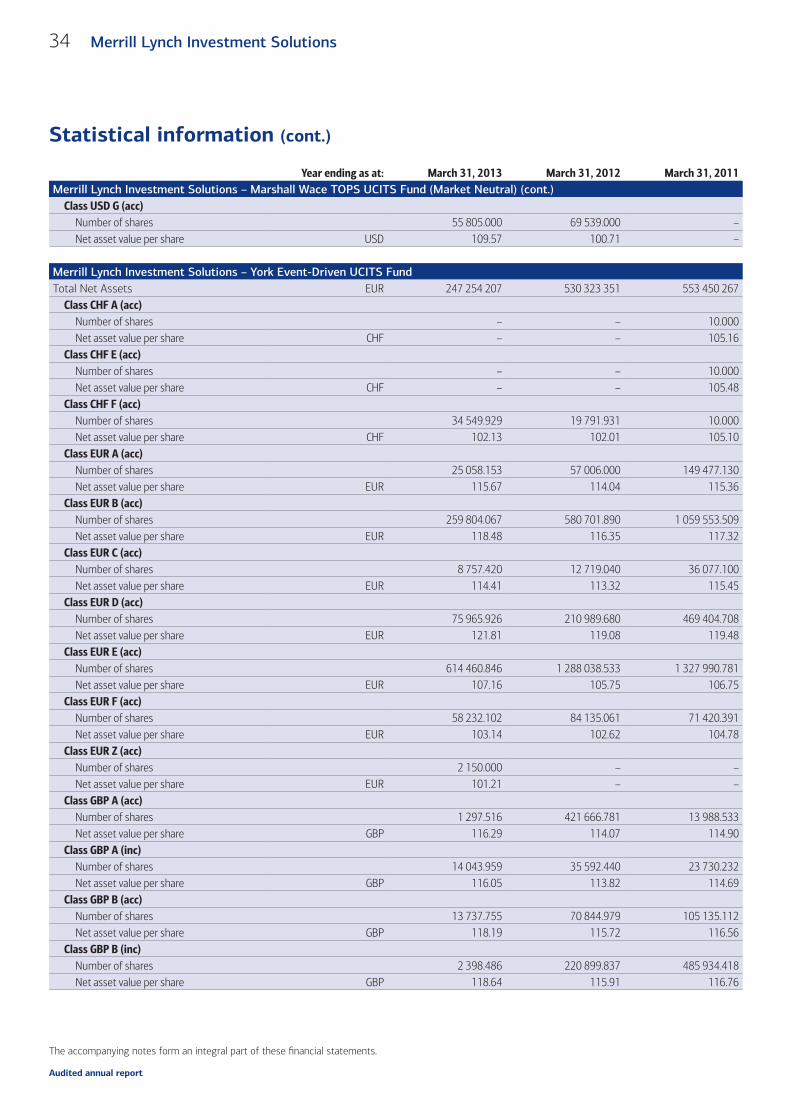
Audited annual report
34 Merrill Lynch Investment Solutions
The accompanying notes form an integral part of these fi nancial statements.
Statistical information (cont.)
Year ending as at: March 31, 2013 March 31, 2012 March 31, 2011Merrill Lynch Investment Solutions – Marshall Wace TOPS UCITS Fund (Market Neutral) (cont.)
Class USD G (acc)Number of shares 55 805.000 69 539.000 –Net asset value per share USD 109.57 100.71 –
Merrill Lynch Investment Solutions – York Event-Driven UCITS FundTotal Net Assets EUR 247 254 207 530 323 351 553 450 267
Class CHF A (acc)Number of shares – – 10.000Net asset value per share CHF – – 105.16
Class CHF E (acc)Number of shares – – 10.000Net asset value per share CHF – – 105.48
Class CHF F (acc)Number of shares 34 549.929 19 791.931 10.000Net asset value per share CHF 102.13 102.01 105.10
Class EUR A (acc)Number of shares 25 058.153 57 006.000 149 477.130Net asset value per share EUR 115.67 114.04 115.36
Class EUR B (acc)Number of shares 259 804.067 580 701.890 1 059 553.509Net asset value per share EUR 118.48 116.35 117.32
Class EUR C (acc)Number of shares 8 757.420 12 719.040 36 077.100Net asset value per share EUR 114.41 113.32 115.45
Class EUR D (acc)Number of shares 75 965.926 210 989.680 469 404.708Net asset value per share EUR 121.81 119.08 119.48
Class EUR E (acc)Number of shares 614 460.846 1 288 038.533 1 327 990.781Net asset value per share EUR 107.16 105.75 106.75
Class EUR F (acc)Number of shares 58 232.102 84 135.061 71 420.391Net asset value per share EUR 103.14 102.62 104.78
Class EUR Z (acc)Number of shares 2 150.000 – –Net asset value per share EUR 101.21 – –
Class GBP A (acc)Number of shares 1 297.516 421 666.781 13 988.533Net asset value per share GBP 116.29 114.07 114.90
Class GBP A (inc)Number of shares 14 043.959 35 592.440 23 730.232Net asset value per share GBP 116.05 113.82 114.69
Class GBP B (acc)Number of shares 13 737.755 70 844.979 105 135.112Net asset value per share GBP 118.19 115.72 116.56
Class GBP B (inc)Number of shares 2 398.486 220 899.837 485 934.418Net asset value per share GBP 118.64 115.91 116.76
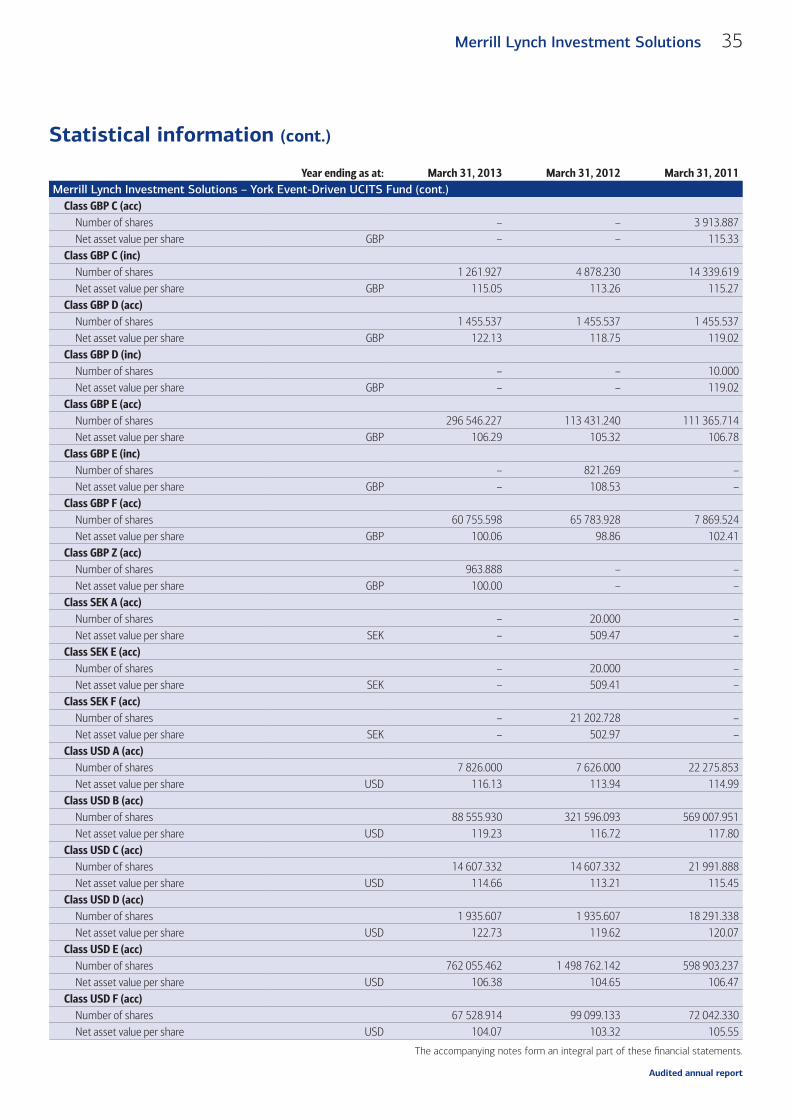
Audited annual report
35Merrill Lynch Investment Solutions
The accompanying notes form an integral part of these fi nancial statements.
Statistical information (cont.)
Year ending as at: March 31, 2013 March 31, 2012 March 31, 2011Merrill Lynch Investment Solutions – York Event-Driven UCITS Fund (cont.)
Class GBP C (acc)Number of shares – – 3 913.887Net asset value per share GBP – – 115.33
Class GBP C (inc)Number of shares 1 261.927 4 878.230 14 339.619Net asset value per share GBP 115.05 113.26 115.27
Class GBP D (acc)Number of shares 1 455.537 1 455.537 1 455.537Net asset value per share GBP 122.13 118.75 119.02
Class GBP D (inc)Number of shares – – 10.000Net asset value per share GBP – – 119.02
Class GBP E (acc)Number of shares 296 546.227 113 431.240 111 365.714Net asset value per share GBP 106.29 105.32 106.78
Class GBP E (inc)Number of shares – 821.269 –Net asset value per share GBP – 108.53 –
Class GBP F (acc)Number of shares 60 755.598 65 783.928 7 869.524Net asset value per share GBP 100.06 98.86 102.41
Class GBP Z (acc)Number of shares 963.888 – –Net asset value per share GBP 100.00 – –
Class SEK A (acc)Number of shares – 20.000 –Net asset value per share SEK – 509.47 –
Class SEK E (acc)Number of shares – 20.000 –Net asset value per share SEK – 509.41 –
Class SEK F (acc)Number of shares – 21 202.728 –Net asset value per share SEK – 502.97 –
Class USD A (acc)Number of shares 7 826.000 7 626.000 22 275.853Net asset value per share USD 116.13 113.94 114.99
Class USD B (acc)Number of shares 88 555.930 321 596.093 569 007.951Net asset value per share USD 119.23 116.72 117.80
Class USD C (acc)Number of shares 14 607.332 14 607.332 21 991.888Net asset value per share USD 114.66 113.21 115.45
Class USD D (acc)Number of shares 1 935.607 1 935.607 18 291.338Net asset value per share USD 122.73 119.62 120.07
Class USD E (acc)Number of shares 762 055.462 1 498 762.142 598 903.237Net asset value per share USD 106.38 104.65 106.47
Class USD F (acc)Number of shares 67 528.914 99 099.133 72 042.330Net asset value per share USD 104.07 103.32 105.55
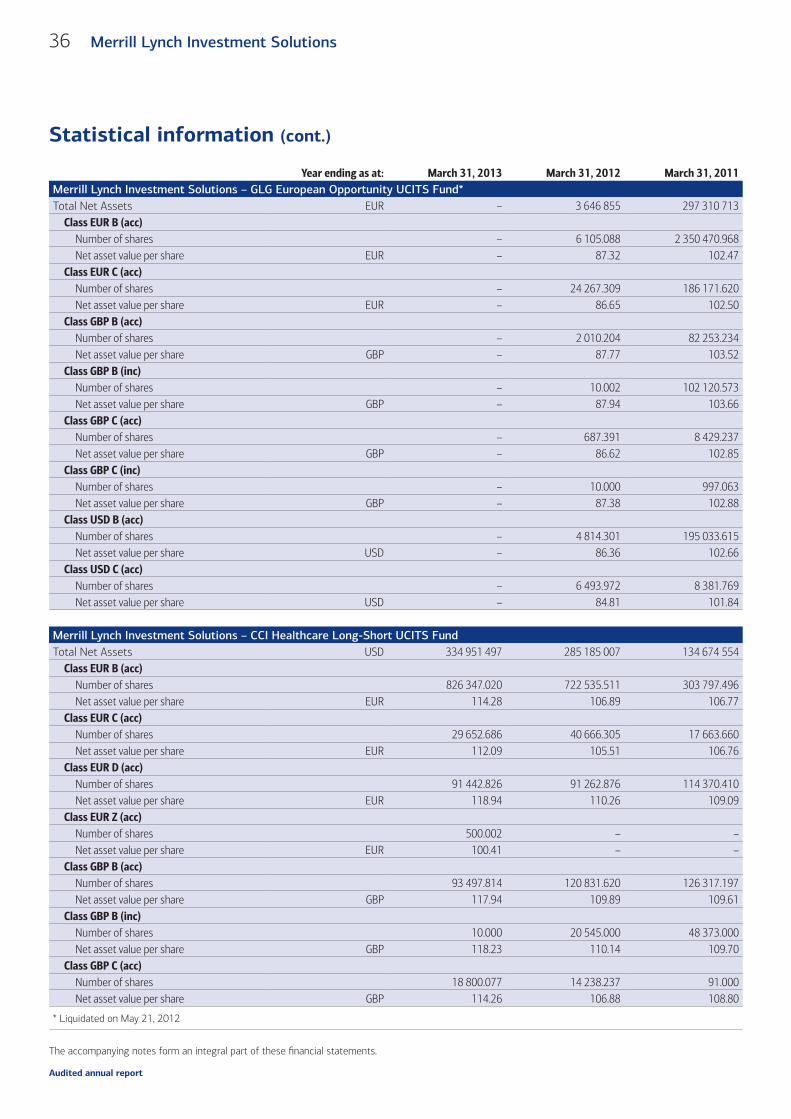
Audited annual report
36 Merrill Lynch Investment Solutions
The accompanying notes form an integral part of these fi nancial statements.
Statistical information (cont.)
Year ending as at: March 31, 2013 March 31, 2012 March 31, 2011Merrill Lynch Investment Solutions – GLG European Opportunity UCITS Fund*Total Net Assets EUR – 3 646 855 297 310 713
Class EUR B (acc)Number of shares – 6 105.088 2 350 470.968Net asset value per share EUR – 87.32 102.47
Class EUR C (acc)Number of shares – 24 267.309 186 171.620Net asset value per share EUR – 86.65 102.50
Class GBP B (acc)Number of shares – 2 010.204 82 253.234Net asset value per share GBP – 87.77 103.52
Class GBP B (inc)Number of shares – 10.002 102 120.573Net asset value per share GBP – 87.94 103.66
Class GBP C (acc)Number of shares – 687.391 8 429.237Net asset value per share GBP – 86.62 102.85
Class GBP C (inc)Number of shares – 10.000 997.063Net asset value per share GBP – 87.38 102.88
Class USD B (acc)Number of shares – 4 814.301 195 033.615Net asset value per share USD – 86.36 102.66
Class USD C (acc)Number of shares – 6 493.972 8 381.769Net asset value per share USD – 84.81 101.84
Merrill Lynch Investment Solutions – CCI Healthcare Long-Short UCITS FundTotal Net Assets USD 334 951 497 285 185 007 134 674 554
Class EUR B (acc)Number of shares 826 347.020 722 535.511 303 797.496Net asset value per share EUR 114.28 106.89 106.77
Class EUR C (acc)Number of shares 29 652.686 40 666.305 17 663.660Net asset value per share EUR 112.09 105.51 106.76
Class EUR D (acc)Number of shares 91 442.826 91 262.876 114 370.410Net asset value per share EUR 118.94 110.26 109.09
Class EUR Z (acc)Number of shares 500.002 – –Net asset value per share EUR 100.41 – –
Class GBP B (acc)Number of shares 93 497.814 120 831.620 126 317.197Net asset value per share GBP 117.94 109.89 109.61
Class GBP B (inc)Number of shares 10.000 20 545.000 48 373.000Net asset value per share GBP 118.23 110.14 109.70
Class GBP C (acc)Number of shares 18 800.077 14 238.237 91.000Net asset value per share GBP 114.26 106.88 108.80
* Liquidated on May 21, 2012
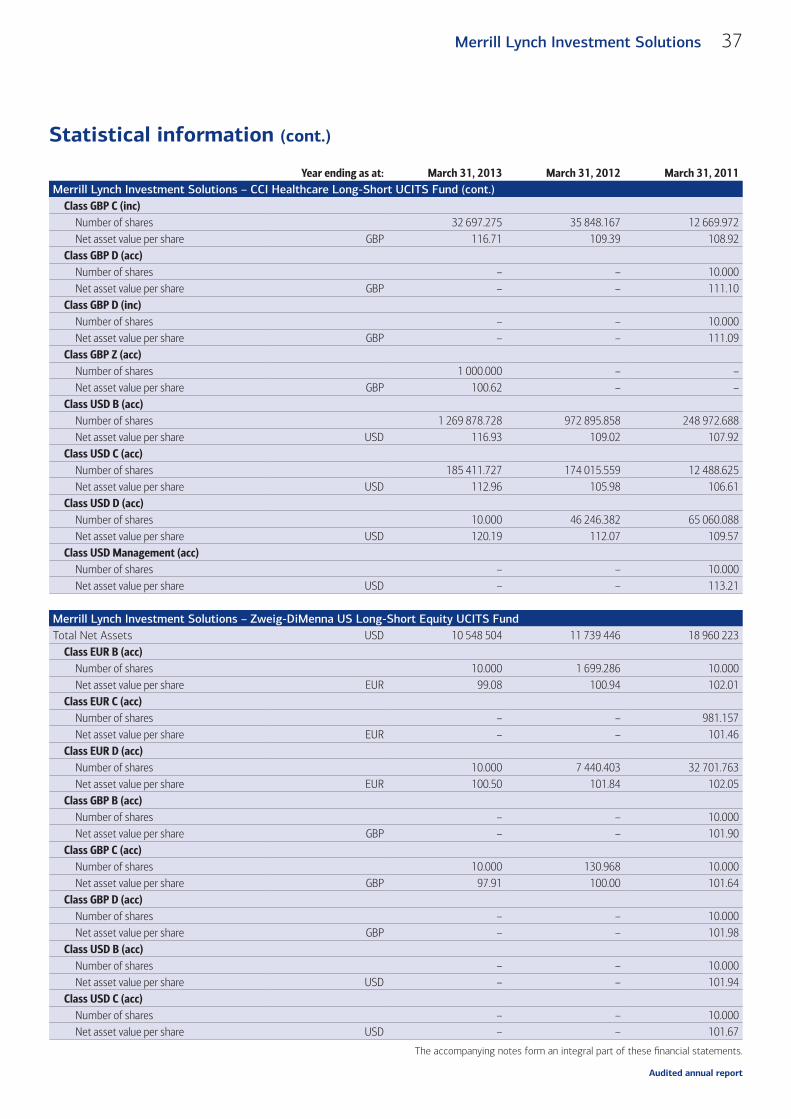
Audited annual report
37Merrill Lynch Investment Solutions
The accompanying notes form an integral part of these fi nancial statements.
Statistical information (cont.)
Year ending as at: March 31, 2013 March 31, 2012 March 31, 2011Merrill Lynch Investment Solutions – CCI Healthcare Long-Short UCITS Fund (cont.)
Class GBP C (inc)Number of shares 32 697.275 35 848.167 12 669.972Net asset value per share GBP 116.71 109.39 108.92
Class GBP D (acc)Number of shares – – 10.000Net asset value per share GBP – – 111.10
Class GBP D (inc)Number of shares – – 10.000Net asset value per share GBP – – 111.09
Class GBP Z (acc)Number of shares 1 000.000 – –Net asset value per share GBP 100.62 – –
Class USD B (acc)Number of shares 1 269 878.728 972 895.858 248 972.688Net asset value per share USD 116.93 109.02 107.92
Class USD C (acc)Number of shares 185 411.727 174 015.559 12 488.625Net asset value per share USD 112.96 105.98 106.61
Class USD D (acc)Number of shares 10.000 46 246.382 65 060.088Net asset value per share USD 120.19 112.07 109.57
Class USD Management (acc)Number of shares – – 10.000Net asset value per share USD – – 113.21
Merrill Lynch Investment Solutions – Zweig-DiMenna US Long-Short Equity UCITS FundTotal Net Assets USD 10 548 504 11 739 446 18 960 223
Class EUR B (acc)Number of shares 10.000 1 699.286 10.000Net asset value per share EUR 99.08 100.94 102.01
Class EUR C (acc)Number of shares – – 981.157Net asset value per share EUR – – 101.46
Class EUR D (acc)Number of shares 10.000 7 440.403 32 701.763Net asset value per share EUR 100.50 101.84 102.05
Class GBP B (acc)Number of shares – – 10.000Net asset value per share GBP – – 101.90
Class GBP C (acc)Number of shares 10.000 130.968 10.000Net asset value per share GBP 97.91 100.00 101.64
Class GBP D (acc)Number of shares – – 10.000Net asset value per share GBP – – 101.98
Class USD B (acc)Number of shares – – 10.000Net asset value per share USD – – 101.94
Class USD C (acc)Number of shares – – 10.000Net asset value per share USD – – 101.67
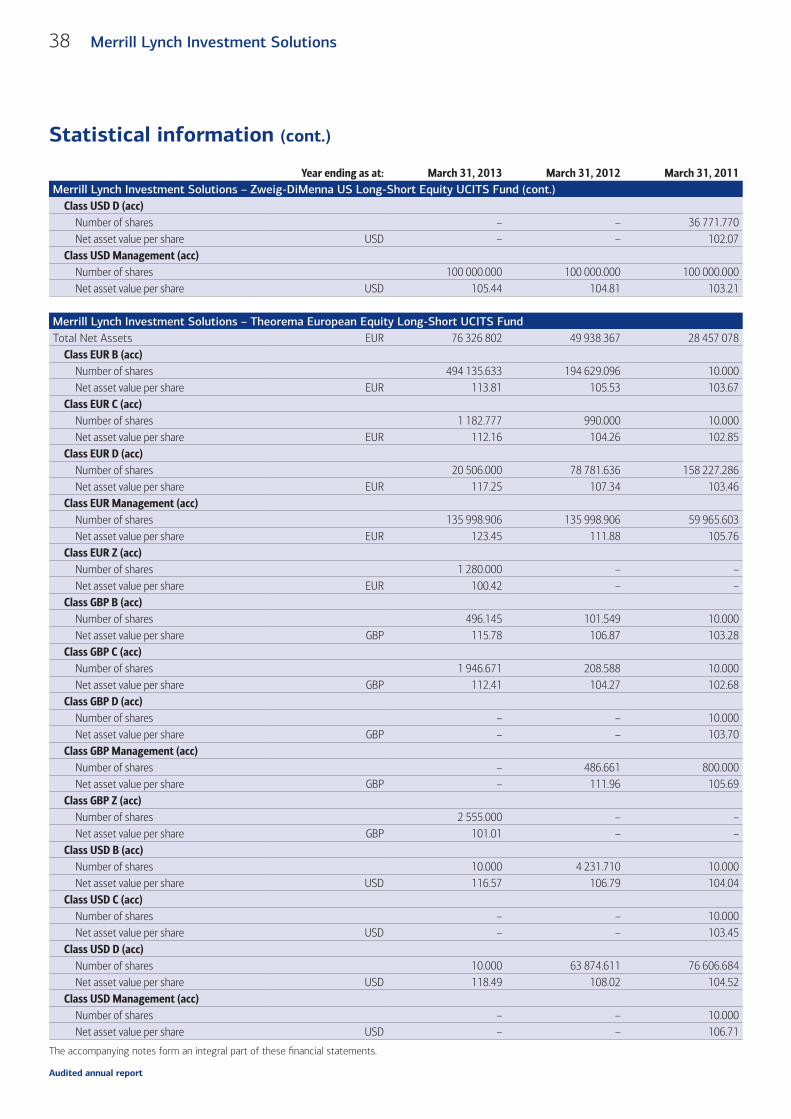
Audited annual report
38 Merrill Lynch Investment Solutions
The accompanying notes form an integral part of these fi nancial statements.
Statistical information (cont.)
Year ending as at: March 31, 2013 March 31, 2012 March 31, 2011Merrill Lynch Investment Solutions – Zweig-DiMenna US Long-Short Equity UCITS Fund (cont.)
Class USD D (acc)Number of shares – – 36 771.770Net asset value per share USD – – 102.07
Class USD Management (acc)Number of shares 100 000.000 100 000.000 100 000.000Net asset value per share USD 105.44 104.81 103.21
Merrill Lynch Investment Solutions – Theorema European Equity Long-Short UCITS FundTotal Net Assets EUR 76 326 802 49 938 367 28 457 078
Class EUR B (acc)Number of shares 494 135.633 194 629.096 10.000Net asset value per share EUR 113.81 105.53 103.67
Class EUR C (acc)Number of shares 1 182.777 990.000 10.000Net asset value per share EUR 112.16 104.26 102.85
Class EUR D (acc)Number of shares 20 506.000 78 781.636 158 227.286Net asset value per share EUR 117.25 107.34 103.46
Class EUR Management (acc)Number of shares 135 998.906 135 998.906 59 965.603Net asset value per share EUR 123.45 111.88 105.76
Class EUR Z (acc)Number of shares 1 280.000 – –Net asset value per share EUR 100.42 – –
Class GBP B (acc)Number of shares 496.145 101.549 10.000Net asset value per share GBP 115.78 106.87 103.28
Class GBP C (acc)Number of shares 1 946.671 208.588 10.000Net asset value per share GBP 112.41 104.27 102.68
Class GBP D (acc)Number of shares – – 10.000Net asset value per share GBP – – 103.70
Class GBP Management (acc)Number of shares – 486.661 800.000Net asset value per share GBP – 111.96 105.69
Class GBP Z (acc)Number of shares 2 555.000 – –Net asset value per share GBP 101.01 – –
Class USD B (acc)Number of shares 10.000 4 231.710 10.000Net asset value per share USD 116.57 106.79 104.04
Class USD C (acc)Number of shares – – 10.000Net asset value per share USD – – 103.45
Class USD D (acc)Number of shares 10.000 63 874.611 76 606.684Net asset value per share USD 118.49 108.02 104.52
Class USD Management (acc)Number of shares – – 10.000Net asset value per share USD – – 106.71
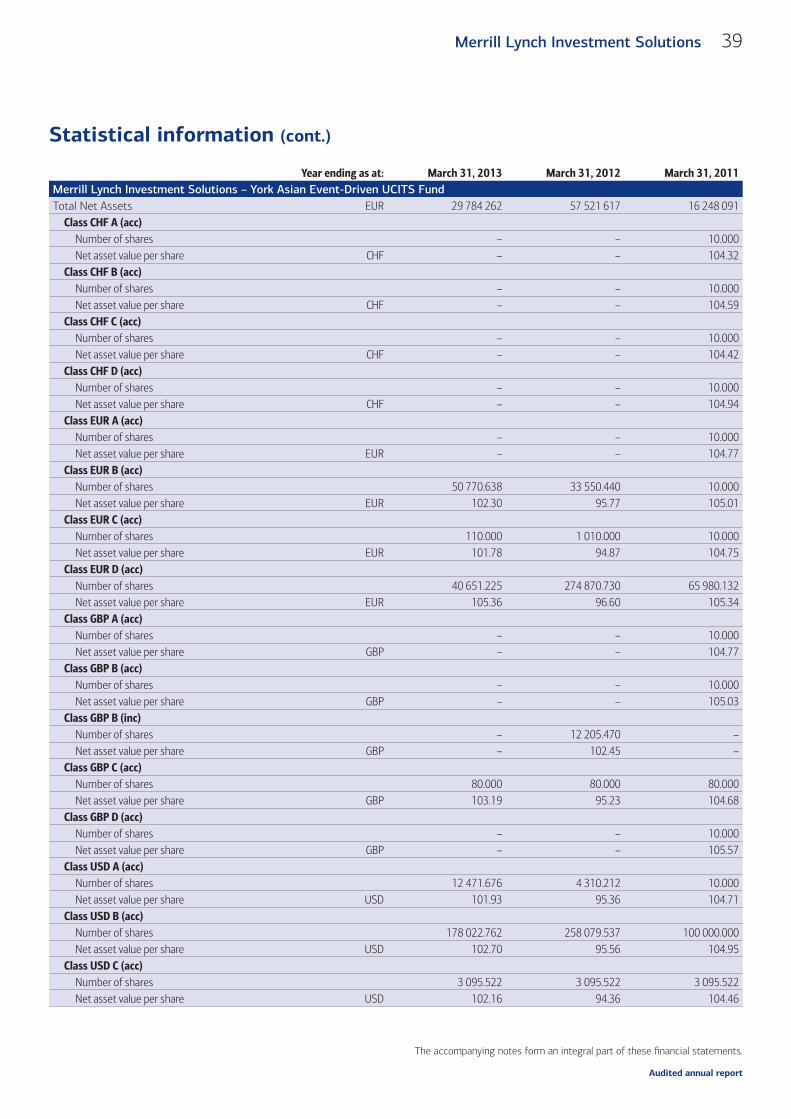
Audited annual report
39Merrill Lynch Investment Solutions
The accompanying notes form an integral part of these fi nancial statements.
Statistical information (cont.)
Year ending as at: March 31, 2013 March 31, 2012 March 31, 2011Merrill Lynch Investment Solutions – York Asian Event-Driven UCITS FundTotal Net Assets EUR 29 784 262 57 521 617 16 248 091
Class CHF A (acc)Number of shares – – 10.000Net asset value per share CHF – – 104.32
Class CHF B (acc)Number of shares – – 10.000Net asset value per share CHF – – 104.59
Class CHF C (acc)Number of shares – – 10.000Net asset value per share CHF – – 104.42
Class CHF D (acc)Number of shares – – 10.000Net asset value per share CHF – – 104.94
Class EUR A (acc)Number of shares – – 10.000Net asset value per share EUR – – 104.77
Class EUR B (acc)Number of shares 50 770.638 33 550.440 10.000Net asset value per share EUR 102.30 95.77 105.01
Class EUR C (acc)Number of shares 110.000 1 010.000 10.000Net asset value per share EUR 101.78 94.87 104.75
Class EUR D (acc)Number of shares 40 651.225 274 870.730 65 980.132Net asset value per share EUR 105.36 96.60 105.34
Class GBP A (acc)Number of shares – – 10.000Net asset value per share GBP – – 104.77
Class GBP B (acc)Number of shares – – 10.000Net asset value per share GBP – – 105.03
Class GBP B (inc)Number of shares – 12 205.470 –Net asset value per share GBP – 102.45 –
Class GBP C (acc)Number of shares 80.000 80.000 80.000Net asset value per share GBP 103.19 95.23 104.68
Class GBP D (acc)Number of shares – – 10.000Net asset value per share GBP – – 105.57
Class USD A (acc)Number of shares 12 471.676 4 310.212 10.000Net asset value per share USD 101.93 95.36 104.71
Class USD B (acc)Number of shares 178 022.762 258 079.537 100 000.000Net asset value per share USD 102.70 95.56 104.95
Class USD C (acc)Number of shares 3 095.522 3 095.522 3 095.522Net asset value per share USD 102.16 94.36 104.46
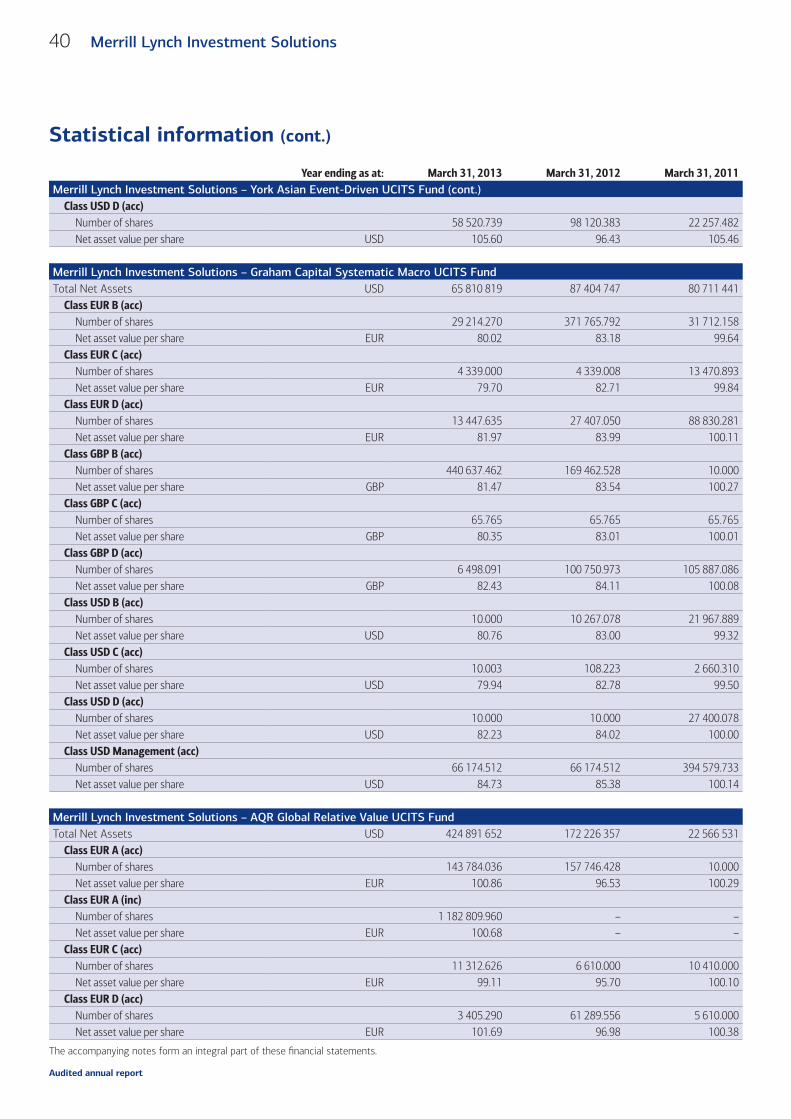
Audited annual report
40 Merrill Lynch Investment Solutions
The accompanying notes form an integral part of these fi nancial statements.
Statistical information (cont.)
Year ending as at: March 31, 2013 March 31, 2012 March 31, 2011Merrill Lynch Investment Solutions – York Asian Event-Driven UCITS Fund (cont.)
Class USD D (acc)Number of shares 58 520.739 98 120.383 22 257.482Net asset value per share USD 105.60 96.43 105.46
Merrill Lynch Investment Solutions – Graham Capital Systematic Macro UCITS FundTotal Net Assets USD 65 810 819 87 404 747 80 711 441
Class EUR B (acc)Number of shares 29 214.270 371 765.792 31 712.158Net asset value per share EUR 80.02 83.18 99.64
Class EUR C (acc)Number of shares 4 339.000 4 339.008 13 470.893Net asset value per share EUR 79.70 82.71 99.84
Class EUR D (acc)Number of shares 13 447.635 27 407.050 88 830.281Net asset value per share EUR 81.97 83.99 100.11
Class GBP B (acc)Number of shares 440 637.462 169 462.528 10.000Net asset value per share GBP 81.47 83.54 100.27
Class GBP C (acc)Number of shares 65.765 65.765 65.765Net asset value per share GBP 80.35 83.01 100.01
Class GBP D (acc)Number of shares 6 498.091 100 750.973 105 887.086Net asset value per share GBP 82.43 84.11 100.08
Class USD B (acc)Number of shares 10.000 10 267.078 21 967.889Net asset value per share USD 80.76 83.00 99.32
Class USD C (acc)Number of shares 10.003 108.223 2 660.310Net asset value per share USD 79.94 82.78 99.50
Class USD D (acc)Number of shares 10.000 10.000 27 400.078Net asset value per share USD 82.23 84.02 100.00
Class USD Management (acc)Number of shares 66 174.512 66 174.512 394 579.733Net asset value per share USD 84.73 85.38 100.14
Merrill Lynch Investment Solutions – AQR Global Relative Value UCITS FundTotal Net Assets USD 424 891 652 172 226 357 22 566 531
Class EUR A (acc)Number of shares 143 784.036 157 746.428 10.000Net asset value per share EUR 100.86 96.53 100.29
Class EUR A (inc)Number of shares 1 182 809.960 – –Net asset value per share EUR 100.68 – –
Class EUR C (acc)Number of shares 11 312.626 6 610.000 10 410.000Net asset value per share EUR 99.11 95.70 100.10
Class EUR D (acc)Number of shares 3 405.290 61 289.556 5 610.000Net asset value per share EUR 101.69 96.98 100.38
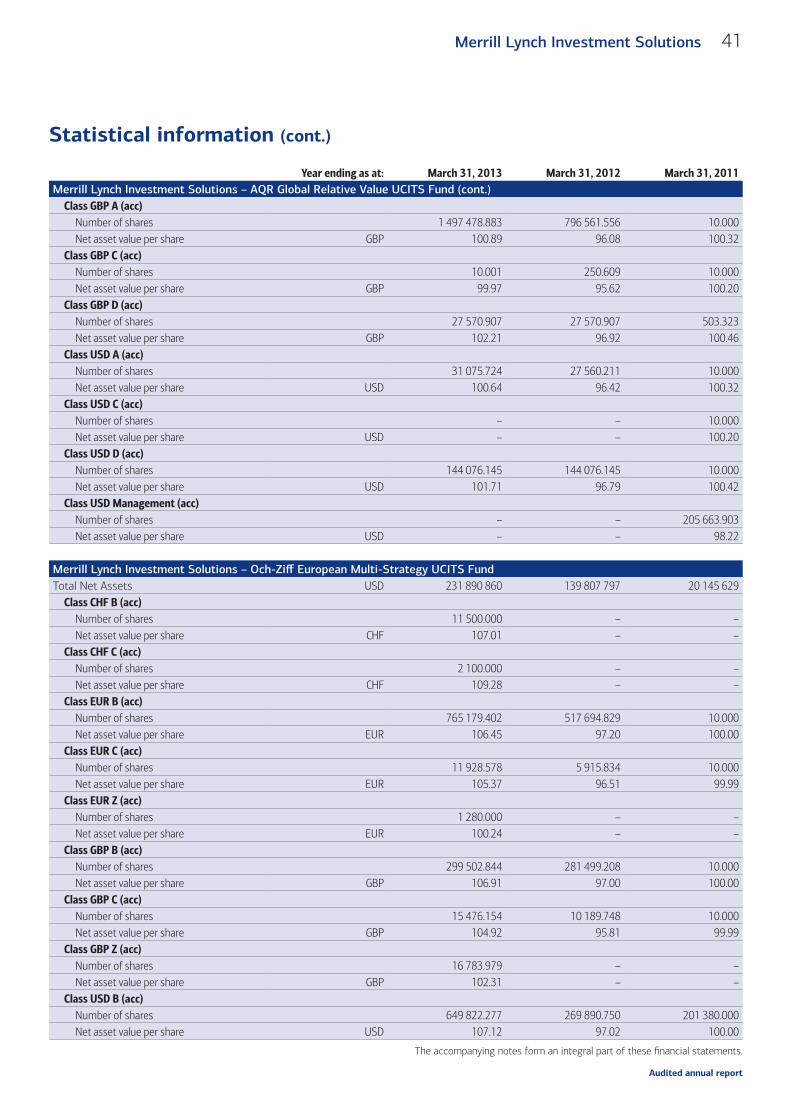
Audited annual report
41Merrill Lynch Investment Solutions
The accompanying notes form an integral part of these fi nancial statements.
Statistical information (cont.)
Year ending as at: March 31, 2013 March 31, 2012 March 31, 2011Merrill Lynch Investment Solutions – AQR Global Relative Value UCITS Fund (cont.)
Class GBP A (acc)Number of shares 1 497 478.883 796 561.556 10.000Net asset value per share GBP 100.89 96.08 100.32
Class GBP C (acc)Number of shares 10.001 250.609 10.000Net asset value per share GBP 99.97 95.62 100.20
Class GBP D (acc)Number of shares 27 570.907 27 570.907 503.323Net asset value per share GBP 102.21 96.92 100.46
Class USD A (acc)Number of shares 31 075.724 27 560.211 10.000Net asset value per share USD 100.64 96.42 100.32
Class USD C (acc)Number of shares – – 10.000Net asset value per share USD – – 100.20
Class USD D (acc)Number of shares 144 076.145 144 076.145 10.000Net asset value per share USD 101.71 96.79 100.42
Class USD Management (acc)Number of shares – – 205 663.903Net asset value per share USD – – 98.22
Merrill Lynch Investment Solutions – Och-Ziff European Multi-Strategy UCITS FundTotal Net Assets USD 231 890 860 139 807 797 20 145 629
Class CHF B (acc)Number of shares 11 500.000 – –Net asset value per share CHF 107.01 – –
Class CHF C (acc)Number of shares 2 100.000 – –Net asset value per share CHF 109.28 – –
Class EUR B (acc)Number of shares 765 179.402 517 694.829 10.000Net asset value per share EUR 106.45 97.20 100.00
Class EUR C (acc)Number of shares 11 928.578 5 915.834 10.000Net asset value per share EUR 105.37 96.51 99.99
Class EUR Z (acc)Number of shares 1 280.000 – –Net asset value per share EUR 100.24 – –
Class GBP B (acc)Number of shares 299 502.844 281 499.208 10.000Net asset value per share GBP 106.91 97.00 100.00
Class GBP C (acc)Number of shares 15 476.154 10 189.748 10.000Net asset value per share GBP 104.92 95.81 99.99
Class GBP Z (acc)Number of shares 16 783.979 – –Net asset value per share GBP 102.31 – –
Class USD B (acc)Number of shares 649 822.277 269 890.750 201 380.000Net asset value per share USD 107.12 97.02 100.00
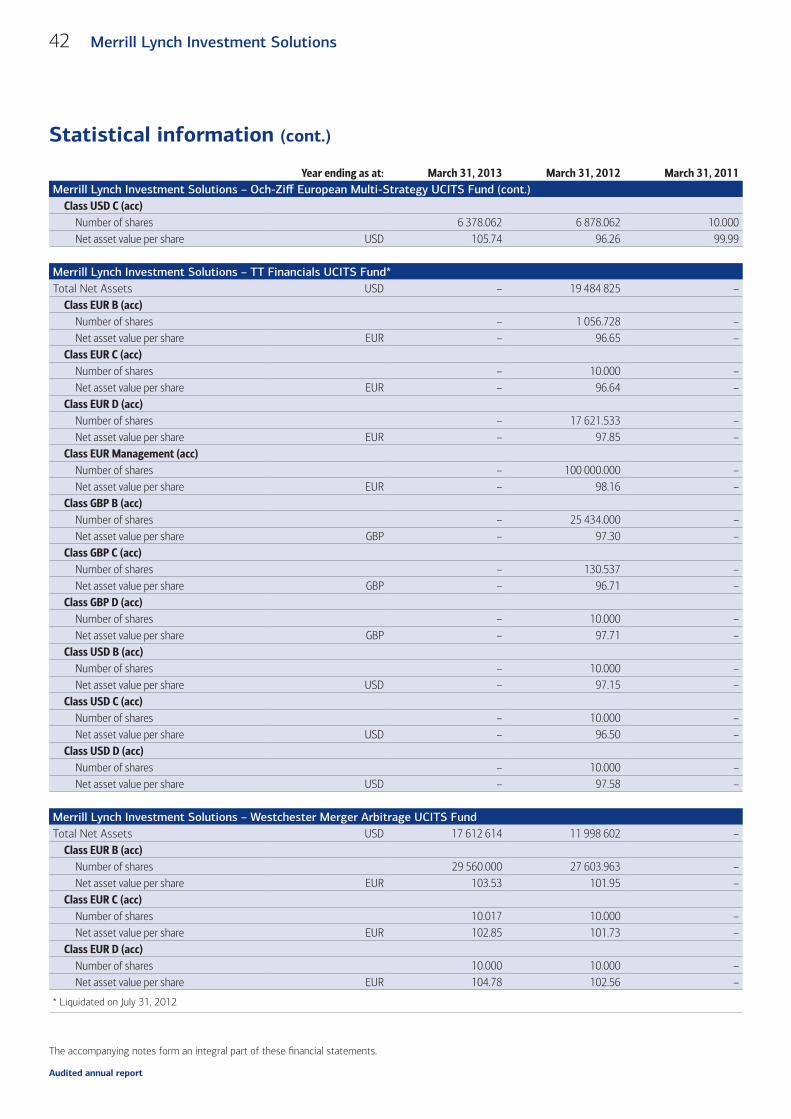
Audited annual report
42 Merrill Lynch Investment Solutions
The accompanying notes form an integral part of these fi nancial statements.
Statistical information (cont.)
Year ending as at: March 31, 2013 March 31, 2012 March 31, 2011Merrill Lynch Investment Solutions – Och-Ziff European Multi-Strategy UCITS Fund (cont.)
Class USD C (acc)Number of shares 6 378.062 6 878.062 10.000Net asset value per share USD 105.74 96.26 99.99
Merrill Lynch Investment Solutions – TT Financials UCITS Fund*Total Net Assets USD – 19 484 825 –
Class EUR B (acc)Number of shares – 1 056.728 –Net asset value per share EUR – 96.65 –
Class EUR C (acc)Number of shares – 10.000 –Net asset value per share EUR – 96.64 –
Class EUR D (acc)Number of shares – 17 621.533 –Net asset value per share EUR – 97.85 –
Class EUR Management (acc)Number of shares – 100 000.000 –Net asset value per share EUR – 98.16 –
Class GBP B (acc)Number of shares – 25 434.000 –Net asset value per share GBP – 97.30 –
Class GBP C (acc)Number of shares – 130.537 –Net asset value per share GBP – 96.71 –
Class GBP D (acc)Number of shares – 10.000 –Net asset value per share GBP – 97.71 –
Class USD B (acc)Number of shares – 10.000 –Net asset value per share USD – 97.15 –
Class USD C (acc)Number of shares – 10.000 –Net asset value per share USD – 96.50 –
Class USD D (acc)Number of shares – 10.000 –Net asset value per share USD – 97.58 –
Merrill Lynch Investment Solutions – Westchester Merger Arbitrage UCITS FundTotal Net Assets USD 17 612 614 11 998 602 –
Class EUR B (acc)Number of shares 29 560.000 27 603.963 –Net asset value per share EUR 103.53 101.95 –
Class EUR C (acc)Number of shares 10.017 10.000 –Net asset value per share EUR 102.85 101.73 –
Class EUR D (acc)Number of shares 10.000 10.000 –Net asset value per share EUR 104.78 102.56 –
* Liquidated on July 31, 2012
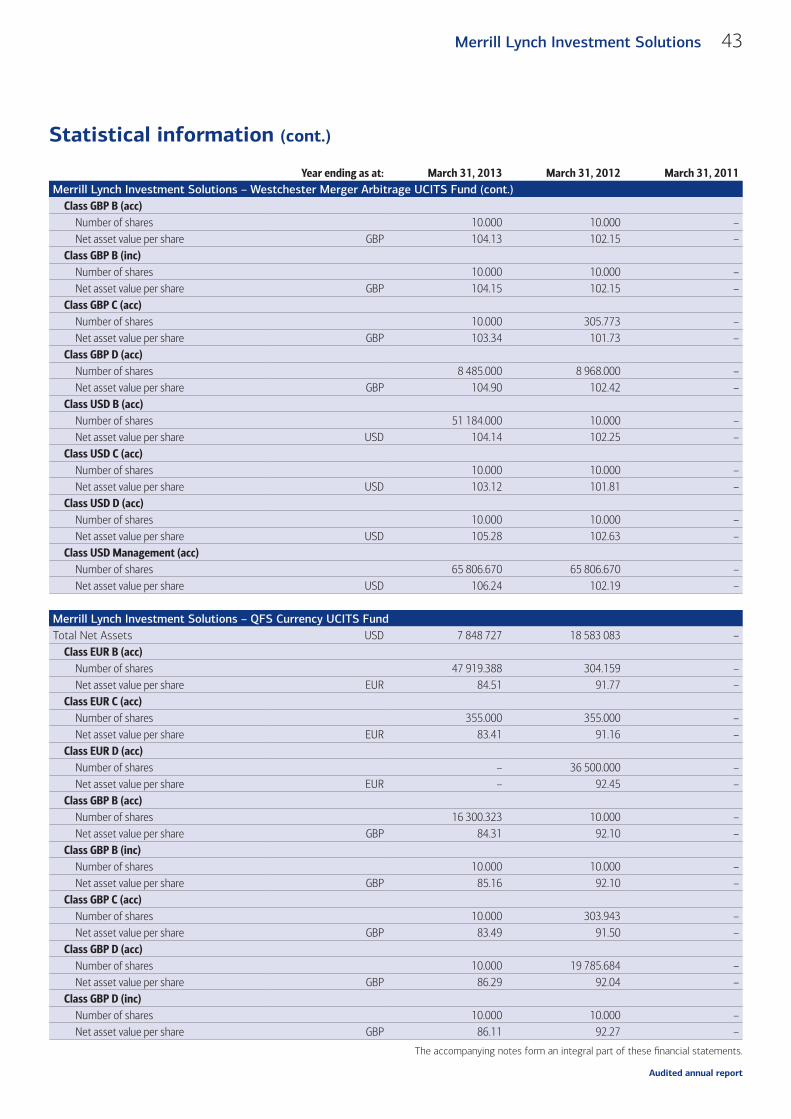
Audited annual report
43Merrill Lynch Investment Solutions
The accompanying notes form an integral part of these fi nancial statements.
Statistical information (cont.)
Year ending as at: March 31, 2013 March 31, 2012 March 31, 2011Merrill Lynch Investment Solutions – Westchester Merger Arbitrage UCITS Fund (cont.)
Class GBP B (acc)Number of shares 10.000 10.000 –Net asset value per share GBP 104.13 102.15 –
Class GBP B (inc)Number of shares 10.000 10.000 –Net asset value per share GBP 104.15 102.15 –
Class GBP C (acc)Number of shares 10.000 305.773 –Net asset value per share GBP 103.34 101.73 –
Class GBP D (acc)Number of shares 8 485.000 8 968.000 –Net asset value per share GBP 104.90 102.42 –
Class USD B (acc)Number of shares 51 184.000 10.000 –Net asset value per share USD 104.14 102.25 –
Class USD C (acc)Number of shares 10.000 10.000 –Net asset value per share USD 103.12 101.81 –
Class USD D (acc)Number of shares 10.000 10.000 –Net asset value per share USD 105.28 102.63 –
Class USD Management (acc)Number of shares 65 806.670 65 806.670 –Net asset value per share USD 106.24 102.19 –
Merrill Lynch Investment Solutions – QFS Currency UCITS FundTotal Net Assets USD 7 848 727 18 583 083 –
Class EUR B (acc)Number of shares 47 919.388 304.159 –Net asset value per share EUR 84.51 91.77 –
Class EUR C (acc)Number of shares 355.000 355.000 –Net asset value per share EUR 83.41 91.16 –
Class EUR D (acc)Number of shares – 36 500.000 –Net asset value per share EUR – 92.45 –
Class GBP B (acc)Number of shares 16 300.323 10.000 –Net asset value per share GBP 84.31 92.10 –
Class GBP B (inc)Number of shares 10.000 10.000 –Net asset value per share GBP 85.16 92.10 –
Class GBP C (acc)Number of shares 10.000 303.943 –Net asset value per share GBP 83.49 91.50 –
Class GBP D (acc)Number of shares 10.000 19 785.684 –Net asset value per share GBP 86.29 92.04 –
Class GBP D (inc)Number of shares 10.000 10.000 –Net asset value per share GBP 86.11 92.27 –
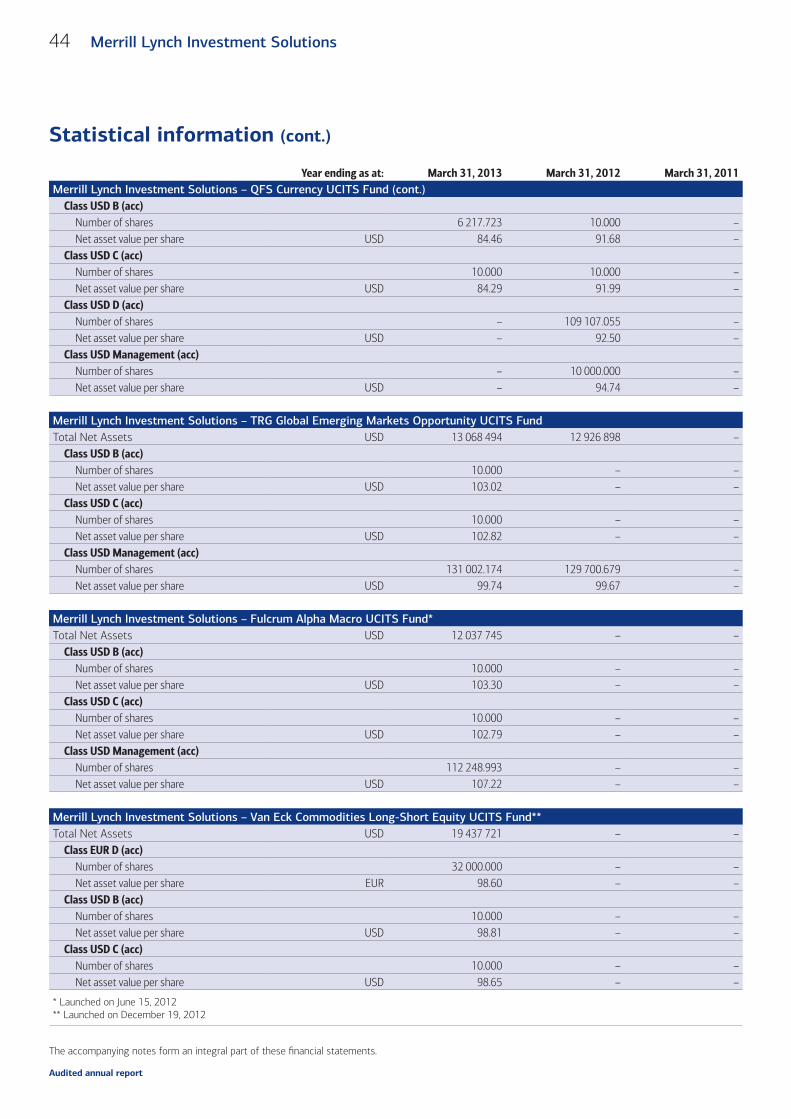
Audited annual report
44 Merrill Lynch Investment Solutions
The accompanying notes form an integral part of these fi nancial statements.
Statistical information (cont.)
Year ending as at: March 31, 2013 March 31, 2012 March 31, 2011Merrill Lynch Investment Solutions – QFS Currency UCITS Fund (cont.)
Class USD B (acc)Number of shares 6 217.723 10.000 –Net asset value per share USD 84.46 91.68 –
Class USD C (acc)Number of shares 10.000 10.000 –Net asset value per share USD 84.29 91.99 –
Class USD D (acc)Number of shares – 109 107.055 –Net asset value per share USD – 92.50 –
Class USD Management (acc)Number of shares – 10 000.000 –Net asset value per share USD – 94.74 –
Merrill Lynch Investment Solutions – TRG Global Emerging Markets Opportunity UCITS FundTotal Net Assets USD 13 068 494 12 926 898 –
Class USD B (acc)Number of shares 10.000 – –Net asset value per share USD 103.02 – –
Class USD C (acc)Number of shares 10.000 – –Net asset value per share USD 102.82 – –
Class USD Management (acc)Number of shares 131 002.174 129 700.679 –Net asset value per share USD 99.74 99.67 –
Merrill Lynch Investment Solutions – Fulcrum Alpha Macro UCITS Fund*Total Net Assets USD 12 037 745 – –
Class USD B (acc)Number of shares 10.000 – –Net asset value per share USD 103.30 – –
Class USD C (acc)Number of shares 10.000 – –Net asset value per share USD 102.79 – –
Class USD Management (acc)Number of shares 112 248.993 – –Net asset value per share USD 107.22 – –
Merrill Lynch Investment Solutions – Van Eck Commodities Long-Short Equity UCITS Fund**Total Net Assets USD 19 437 721 – –
Class EUR D (acc)Number of shares 32 000.000 – –Net asset value per share EUR 98.60 – –
Class USD B (acc)Number of shares 10.000 – –Net asset value per share USD 98.81 – –
Class USD C (acc)Number of shares 10.000 – –Net asset value per share USD 98.65 – –
* Launched on June 15, 2012** Launched on December 19, 2012
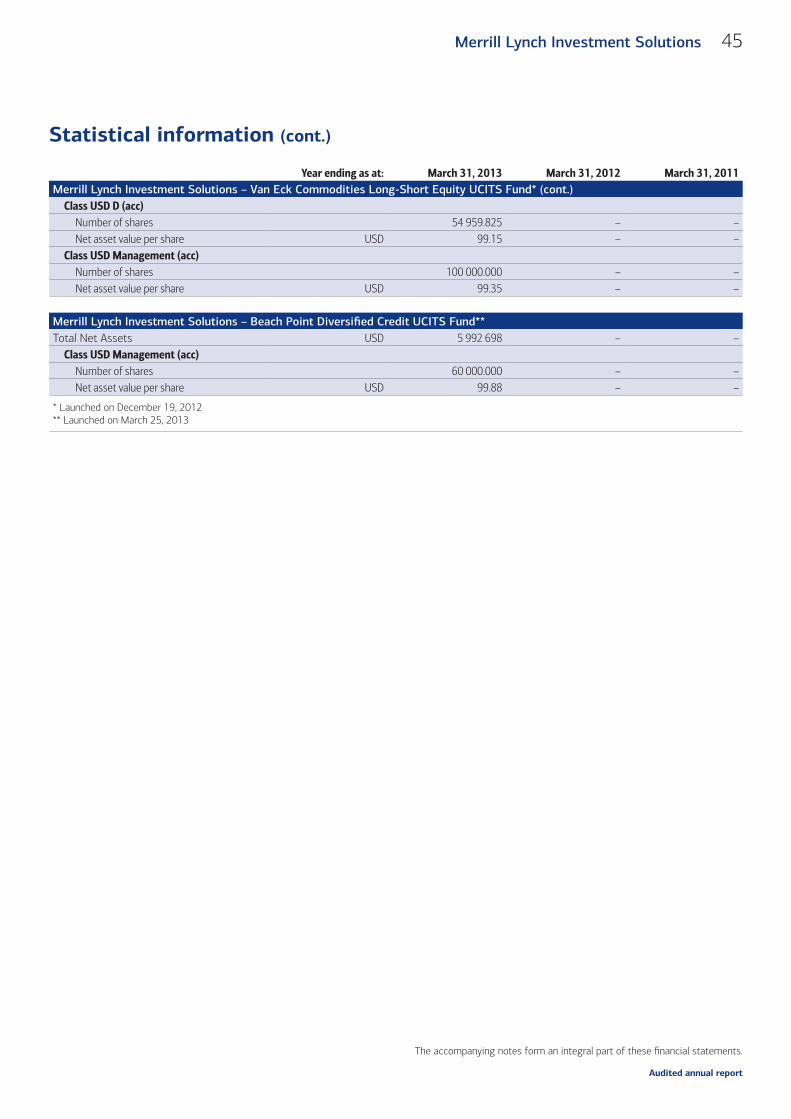
Audited annual report
45Merrill Lynch Investment Solutions
The accompanying notes form an integral part of these fi nancial statements.
Statistical information (cont.)
Year ending as at: March 31, 2013 March 31, 2012 March 31, 2011Merrill Lynch Investment Solutions – Van Eck Commodities Long-Short Equity UCITS Fund* (cont.)
Class USD D (acc)Number of shares 54 959.825 – –Net asset value per share USD 99.15 – –
Class USD Management (acc)Number of shares 100 000.000 – –Net asset value per share USD 99.35 – –
Merrill Lynch Investment Solutions – Beach Point Diversifi ed Credit UCITS Fund**Total Net Assets USD 5 992 698 – –
Class USD Management (acc)Number of shares 60 000.000 – –Net asset value per share USD 99.88 – –
* Launched on December 19, 2012** Launched on March 25, 2013
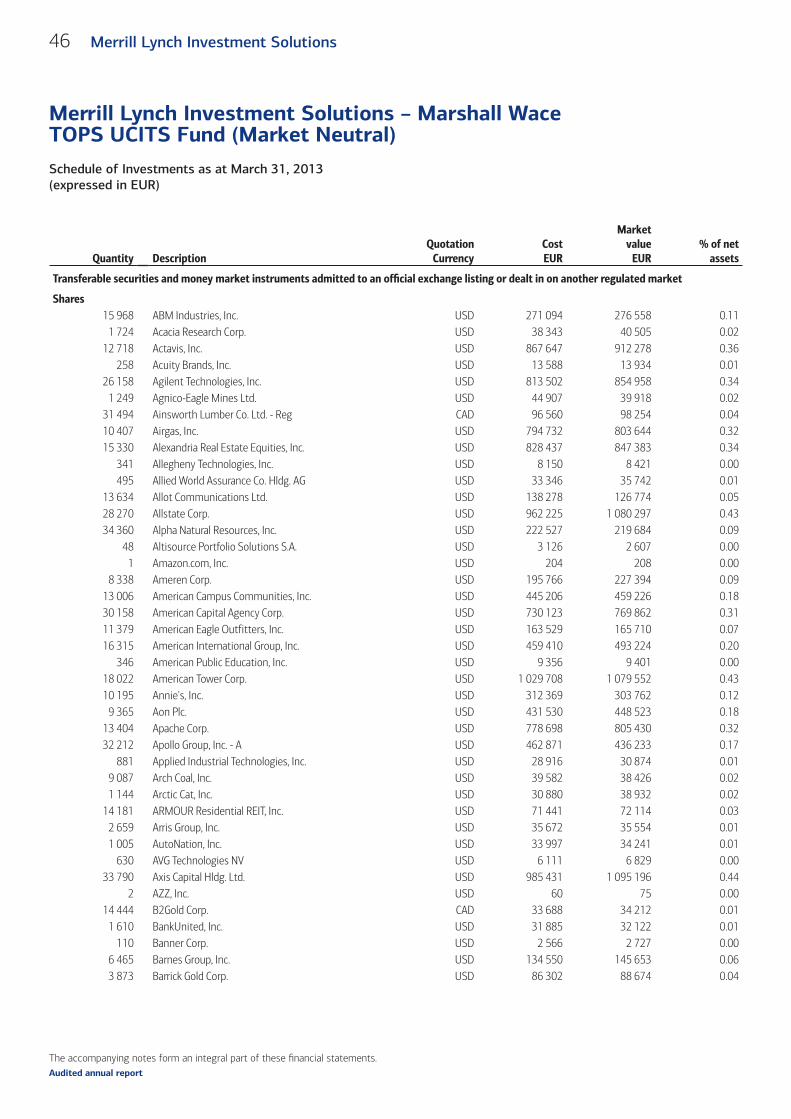
The accompanying notes form an integral part of these fi nancial statements.
Schedule of Investments as at March 31, 2013 (expressed in EUR)
Merrill Lynch Investment Solutions – Marshall Wace TOPS UCITS Fund (Market Neutral)
46 Merrill Lynch Investment Solutions
Audited annual report
Quantity DescriptionQuotation
CurrencyCostEUR
Marketvalue
EUR% of net
assets
Transferable securities and money market instruments admitted to an offi cial exchange listing or dealt in on another regulated market (cont.)
Shares (cont.)15 968 ABM Industries, Inc. USD 271 094 276 558 0.11
1 724 Acacia Research Corp. USD 38 343 40 505 0.0212 718 Actavis, Inc. USD 867 647 912 278 0.36
258 Acuity Brands, Inc. USD 13 588 13 934 0.0126 158 Agilent Technologies, Inc. USD 813 502 854 958 0.34
1 249 Agnico-Eagle Mines Ltd. USD 44 907 39 918 0.0231 494 Ainsworth Lumber Co. Ltd. - Reg CAD 96 560 98 254 0.0410 407 Airgas, Inc. USD 794 732 803 644 0.3215 330 Alexandria Real Estate Equities, Inc. USD 828 437 847 383 0.34
341 Allegheny Technologies, Inc. USD 8 150 8 421 0.00495 Allied World Assurance Co. Hldg. AG USD 33 346 35 742 0.01
13 634 Allot Communications Ltd. USD 138 278 126 774 0.0528 270 Allstate Corp. USD 962 225 1 080 297 0.4334 360 Alpha Natural Resources, Inc. USD 222 527 219 684 0.09
48 Altisource Portfolio Solutions S.A. USD 3 126 2 607 0.001 Amazon.com, Inc. USD 204 208 0.00
8 338 Ameren Corp. USD 195 766 227 394 0.0913 006 American Campus Communities, Inc. USD 445 206 459 226 0.1830 158 American Capital Agency Corp. USD 730 123 769 862 0.3111 379 American Eagle Outfitters, Inc. USD 163 529 165 710 0.0716 315 American International Group, Inc. USD 459 410 493 224 0.20
346 American Public Education, Inc. USD 9 356 9 401 0.0018 022 American Tower Corp. USD 1 029 708 1 079 552 0.4310 195 Annie's, Inc. USD 312 369 303 762 0.12
9 365 Aon Plc. USD 431 530 448 523 0.1813 404 Apache Corp. USD 778 698 805 430 0.3232 212 Apollo Group, Inc. - A USD 462 871 436 233 0.17
881 Applied Industrial Technologies, Inc. USD 28 916 30 874 0.019 087 Arch Coal, Inc. USD 39 582 38 426 0.021 144 Arctic Cat, Inc. USD 30 880 38 932 0.02
14 181 ARMOUR Residential REIT, Inc. USD 71 441 72 114 0.032 659 Arris Group, Inc. USD 35 672 35 554 0.011 005 AutoNation, Inc. USD 33 997 34 241 0.01
630 AVG Technologies NV USD 6 111 6 829 0.0033 790 Axis Capital Hldg. Ltd. USD 985 431 1 095 196 0.44
2 AZZ, Inc. USD 60 75 0.0014 444 B2Gold Corp. CAD 33 688 34 212 0.01
1 610 BankUnited, Inc. USD 31 885 32 122 0.01110 Banner Corp. USD 2 566 2 727 0.00
6 465 Barnes Group, Inc. USD 134 550 145 653 0.063 873 Barrick Gold Corp. USD 86 302 88 674 0.04
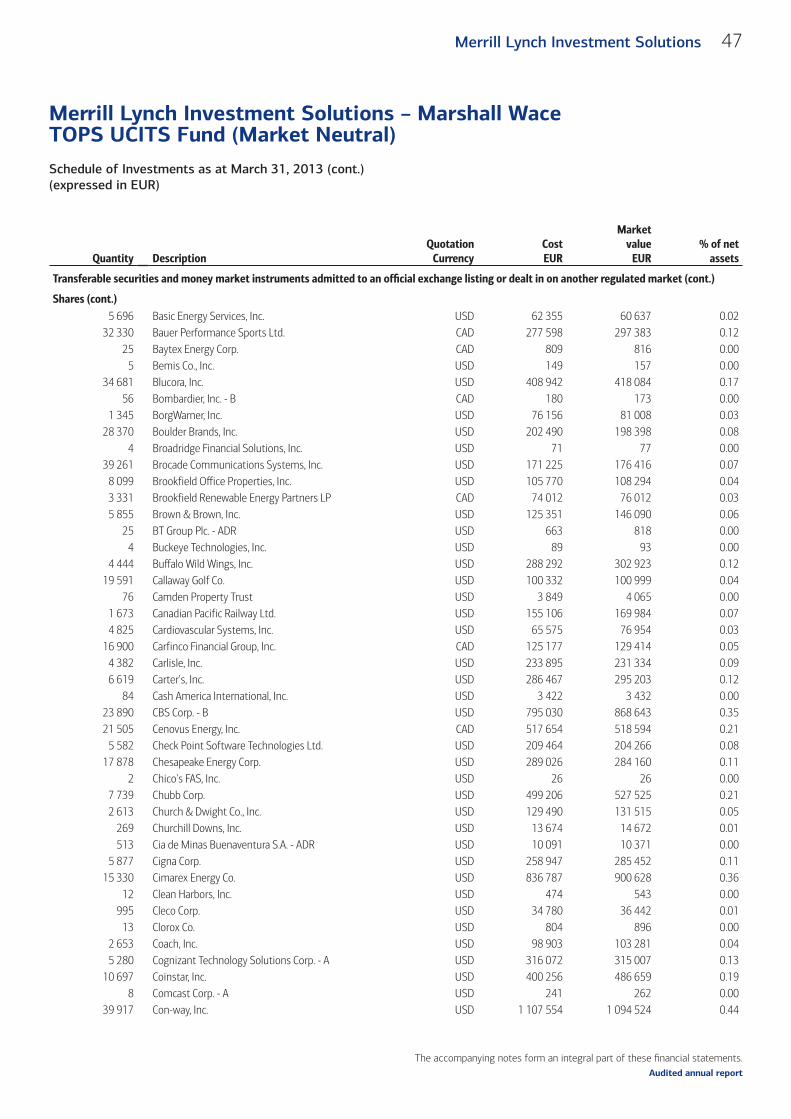
The accompanying notes form an integral part of these fi nancial statements.
Schedule of Investments as at March 31, 2013 (cont.)(expressed in EUR)
Merrill Lynch Investment Solutions – Marshall Wace TOPS UCITS Fund (Market Neutral)
47Merrill Lynch Investment Solutions
Audited annual report
Quantity DescriptionQuotation
CurrencyCostEUR
Marketvalue
EUR% of net
assets
Transferable securities and money market instruments admitted to an offi cial exchange listing or dealt in on another regulated market (cont.)
Shares (cont.)5 696 Basic Energy Services, Inc. USD 62 355 60 637 0.02
32 330 Bauer Performance Sports Ltd. CAD 277 598 297 383 0.1225 Baytex Energy Corp. CAD 809 816 0.00
5 Bemis Co., Inc. USD 149 157 0.0034 681 Blucora, Inc. USD 408 942 418 084 0.17
56 Bombardier, Inc. - B CAD 180 173 0.001 345 BorgWarner, Inc. USD 76 156 81 008 0.03
28 370 Boulder Brands, Inc. USD 202 490 198 398 0.084 Broadridge Financial Solutions, Inc. USD 71 77 0.00
39 261 Brocade Communications Systems, Inc. USD 171 225 176 416 0.078 099 Brookfield Office Properties, Inc. USD 105 770 108 294 0.043 331 Brookfield Renewable Energy Partners LP CAD 74 012 76 012 0.035 855 Brown & Brown, Inc. USD 125 351 146 090 0.06
25 BT Group Plc. - ADR USD 663 818 0.004 Buckeye Technologies, Inc. USD 89 93 0.00
4 444 Buffalo Wild Wings, Inc. USD 288 292 302 923 0.1219 591 Callaway Golf Co. USD 100 332 100 999 0.04
76 Camden Property Trust USD 3 849 4 065 0.001 673 Canadian Pacific Railway Ltd. USD 155 106 169 984 0.074 825 Cardiovascular Systems, Inc. USD 65 575 76 954 0.03
16 900 Carfinco Financial Group, Inc. CAD 125 177 129 414 0.054 382 Carlisle, Inc. USD 233 895 231 334 0.096 619 Carter's, Inc. USD 286 467 295 203 0.12
84 Cash America International, Inc. USD 3 422 3 432 0.0023 890 CBS Corp. - B USD 795 030 868 643 0.3521 505 Cenovus Energy, Inc. CAD 517 654 518 594 0.21
5 582 Check Point Software Technologies Ltd. USD 209 464 204 266 0.0817 878 Chesapeake Energy Corp. USD 289 026 284 160 0.11
2 Chico's FAS, Inc. USD 26 26 0.007 739 Chubb Corp. USD 499 206 527 525 0.212 613 Church & Dwight Co., Inc. USD 129 490 131 515 0.05
269 Churchill Downs, Inc. USD 13 674 14 672 0.01513 Cia de Minas Buenaventura S.A. - ADR USD 10 091 10 371 0.00
5 877 Cigna Corp. USD 258 947 285 452 0.1115 330 Cimarex Energy Co. USD 836 787 900 628 0.36
12 Clean Harbors, Inc. USD 474 543 0.00995 Cleco Corp. USD 34 780 36 442 0.01
13 Clorox Co. USD 804 896 0.002 653 Coach, Inc. USD 98 903 103 281 0.045 280 Cognizant Technology Solutions Corp. - A USD 316 072 315 007 0.13
10 697 Coinstar, Inc. USD 400 256 486 659 0.198 Comcast Corp. - A USD 241 262 0.00
39 917 Con-way, Inc. USD 1 107 554 1 094 524 0.44
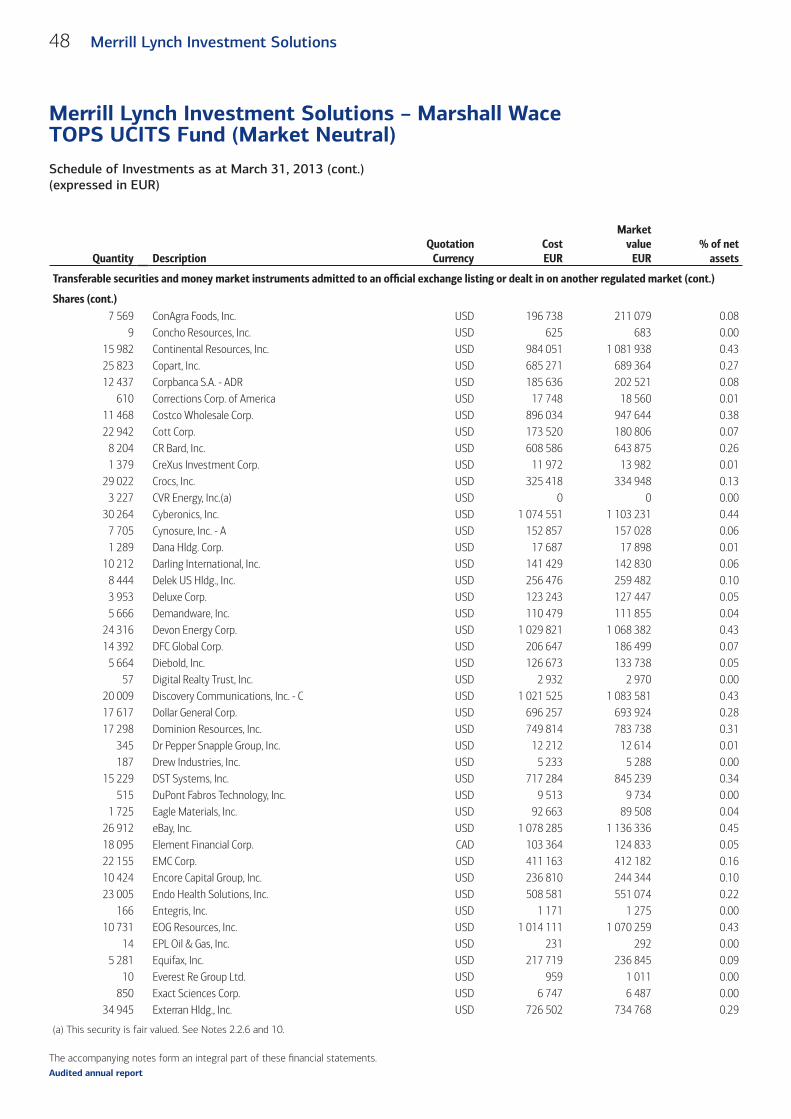
The accompanying notes form an integral part of these fi nancial statements.
Schedule of Investments as at March 31, 2013 (cont.)(expressed in EUR)
Merrill Lynch Investment Solutions – Marshall Wace TOPS UCITS Fund (Market Neutral)
48 Merrill Lynch Investment Solutions
Audited annual report
Quantity DescriptionQuotation
CurrencyCostEUR
Marketvalue
EUR% of net
assets
Transferable securities and money market instruments admitted to an offi cial exchange listing or dealt in on another regulated market (cont.)
Shares (cont.)7 569 ConAgra Foods, Inc. USD 196 738 211 079 0.08
9 Concho Resources, Inc. USD 625 683 0.0015 982 Continental Resources, Inc. USD 984 051 1 081 938 0.4325 823 Copart, Inc. USD 685 271 689 364 0.2712 437 Corpbanca S.A. - ADR USD 185 636 202 521 0.08
610 Corrections Corp. of America USD 17 748 18 560 0.0111 468 Costco Wholesale Corp. USD 896 034 947 644 0.3822 942 Cott Corp. USD 173 520 180 806 0.07
8 204 CR Bard, Inc. USD 608 586 643 875 0.261 379 CreXus Investment Corp. USD 11 972 13 982 0.01
29 022 Crocs, Inc. USD 325 418 334 948 0.133 227 CVR Energy, Inc.(a) USD 0 0 0.00
30 264 Cyberonics, Inc. USD 1 074 551 1 103 231 0.447 705 Cynosure, Inc. - A USD 152 857 157 028 0.061 289 Dana Hldg. Corp. USD 17 687 17 898 0.01
10 212 Darling International, Inc. USD 141 429 142 830 0.068 444 Delek US Hldg., Inc. USD 256 476 259 482 0.103 953 Deluxe Corp. USD 123 243 127 447 0.055 666 Demandware, Inc. USD 110 479 111 855 0.04
24 316 Devon Energy Corp. USD 1 029 821 1 068 382 0.4314 392 DFC Global Corp. USD 206 647 186 499 0.07
5 664 Diebold, Inc. USD 126 673 133 738 0.0557 Digital Realty Trust, Inc. USD 2 932 2 970 0.00
20 009 Discovery Communications, Inc. - C USD 1 021 525 1 083 581 0.4317 617 Dollar General Corp. USD 696 257 693 924 0.2817 298 Dominion Resources, Inc. USD 749 814 783 738 0.31
345 Dr Pepper Snapple Group, Inc. USD 12 212 12 614 0.01187 Drew Industries, Inc. USD 5 233 5 288 0.00
15 229 DST Systems, Inc. USD 717 284 845 239 0.34515 DuPont Fabros Technology, Inc. USD 9 513 9 734 0.00
1 725 Eagle Materials, Inc. USD 92 663 89 508 0.0426 912 eBay, Inc. USD 1 078 285 1 136 336 0.4518 095 Element Financial Corp. CAD 103 364 124 833 0.0522 155 EMC Corp. USD 411 163 412 182 0.1610 424 Encore Capital Group, Inc. USD 236 810 244 344 0.1023 005 Endo Health Solutions, Inc. USD 508 581 551 074 0.22
166 Entegris, Inc. USD 1 171 1 275 0.0010 731 EOG Resources, Inc. USD 1 014 111 1 070 259 0.43
14 EPL Oil & Gas, Inc. USD 231 292 0.005 281 Equifax, Inc. USD 217 719 236 845 0.09
10 Everest Re Group Ltd. USD 959 1 011 0.00850 Exact Sciences Corp. USD 6 747 6 487 0.00
34 945 Exterran Hldg., Inc. USD 726 502 734 768 0.29
(a) This security is fair valued. See Notes 2.2.6 and 10.
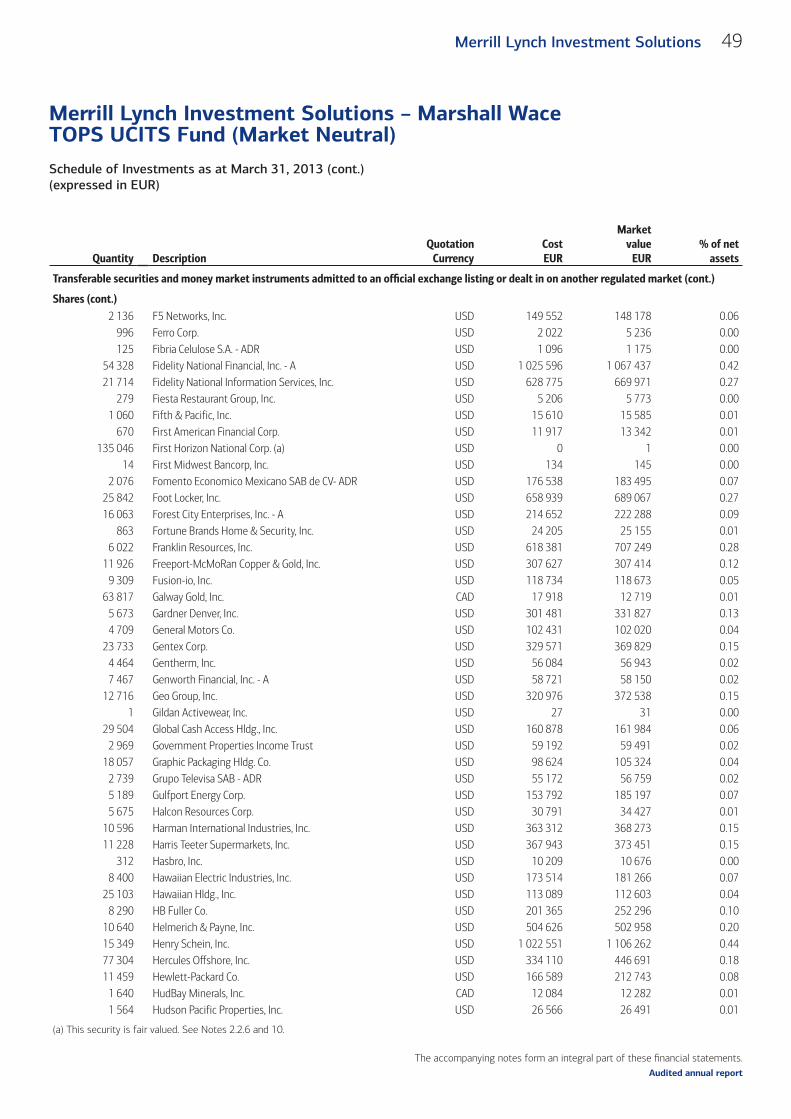
The accompanying notes form an integral part of these fi nancial statements.
Schedule of Investments as at March 31, 2013 (cont.)(expressed in EUR)
Merrill Lynch Investment Solutions – Marshall Wace TOPS UCITS Fund (Market Neutral)
49Merrill Lynch Investment Solutions
Audited annual report
Quantity DescriptionQuotation
CurrencyCostEUR
Marketvalue
EUR% of net
assets
Transferable securities and money market instruments admitted to an offi cial exchange listing or dealt in on another regulated market (cont.)
Shares (cont.)2 136 F5 Networks, Inc. USD 149 552 148 178 0.06
996 Ferro Corp. USD 2 022 5 236 0.00125 Fibria Celulose S.A. - ADR USD 1 096 1 175 0.00
54 328 Fidelity National Financial, Inc. - A USD 1 025 596 1 067 437 0.4221 714 Fidelity National Information Services, Inc. USD 628 775 669 971 0.27
279 Fiesta Restaurant Group, Inc. USD 5 206 5 773 0.001 060 Fifth & Pacific, Inc. USD 15 610 15 585 0.01
670 First American Financial Corp. USD 11 917 13 342 0.01135 046 First Horizon National Corp. (a) USD 0 1 0.00
14 First Midwest Bancorp, Inc. USD 134 145 0.002 076 Fomento Economico Mexicano SAB de CV- ADR USD 176 538 183 495 0.07
25 842 Foot Locker, Inc. USD 658 939 689 067 0.2716 063 Forest City Enterprises, Inc. - A USD 214 652 222 288 0.09
863 Fortune Brands Home & Security, Inc. USD 24 205 25 155 0.016 022 Franklin Resources, Inc. USD 618 381 707 249 0.28
11 926 Freeport-McMoRan Copper & Gold, Inc. USD 307 627 307 414 0.129 309 Fusion-io, Inc. USD 118 734 118 673 0.05
63 817 Galway Gold, Inc. CAD 17 918 12 719 0.015 673 Gardner Denver, Inc. USD 301 481 331 827 0.134 709 General Motors Co. USD 102 431 102 020 0.04
23 733 Gentex Corp. USD 329 571 369 829 0.154 464 Gentherm, Inc. USD 56 084 56 943 0.027 467 Genworth Financial, Inc. - A USD 58 721 58 150 0.02
12 716 Geo Group, Inc. USD 320 976 372 538 0.151 Gildan Activewear, Inc. USD 27 31 0.00
29 504 Global Cash Access Hldg., Inc. USD 160 878 161 984 0.062 969 Government Properties Income Trust USD 59 192 59 491 0.02
18 057 Graphic Packaging Hldg. Co. USD 98 624 105 324 0.042 739 Grupo Televisa SAB - ADR USD 55 172 56 759 0.025 189 Gulfport Energy Corp. USD 153 792 185 197 0.075 675 Halcon Resources Corp. USD 30 791 34 427 0.01
10 596 Harman International Industries, Inc. USD 363 312 368 273 0.1511 228 Harris Teeter Supermarkets, Inc. USD 367 943 373 451 0.15
312 Hasbro, Inc. USD 10 209 10 676 0.008 400 Hawaiian Electric Industries, Inc. USD 173 514 181 266 0.07
25 103 Hawaiian Hldg., Inc. USD 113 089 112 603 0.048 290 HB Fuller Co. USD 201 365 252 296 0.10
10 640 Helmerich & Payne, Inc. USD 504 626 502 958 0.2015 349 Henry Schein, Inc. USD 1 022 551 1 106 262 0.4477 304 Hercules Offshore, Inc. USD 334 110 446 691 0.1811 459 Hewlett-Packard Co. USD 166 589 212 743 0.08
1 640 HudBay Minerals, Inc. CAD 12 084 12 282 0.011 564 Hudson Pacific Properties, Inc. USD 26 566 26 491 0.01
(a) This security is fair valued. See Notes 2.2.6 and 10.
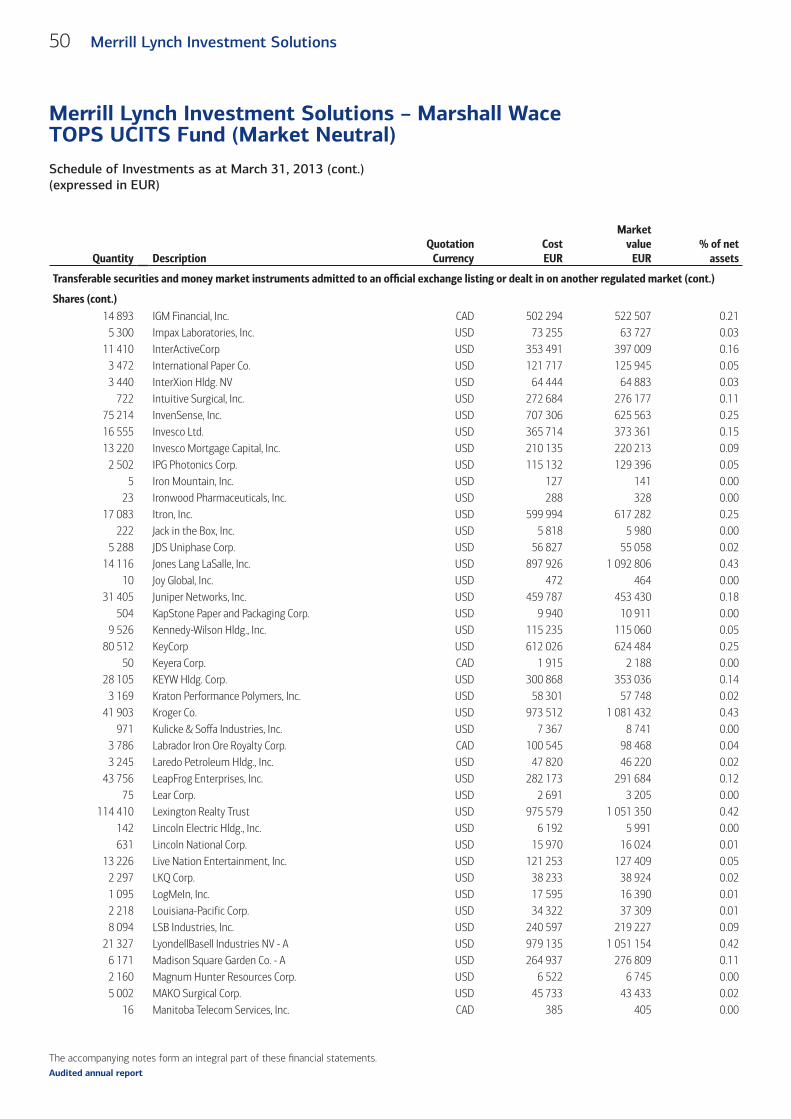
The accompanying notes form an integral part of these fi nancial statements.
Schedule of Investments as at March 31, 2013 (cont.)(expressed in EUR)
Merrill Lynch Investment Solutions – Marshall Wace TOPS UCITS Fund (Market Neutral)
50 Merrill Lynch Investment Solutions
Audited annual report
Quantity DescriptionQuotation
CurrencyCostEUR
Marketvalue
EUR% of net
assets
Transferable securities and money market instruments admitted to an offi cial exchange listing or dealt in on another regulated market (cont.)
Shares (cont.)14 893 IGM Financial, Inc. CAD 502 294 522 507 0.21
5 300 Impax Laboratories, Inc. USD 73 255 63 727 0.0311 410 InterActiveCorp USD 353 491 397 009 0.16
3 472 International Paper Co. USD 121 717 125 945 0.053 440 InterXion Hldg. NV USD 64 444 64 883 0.03
722 Intuitive Surgical, Inc. USD 272 684 276 177 0.1175 214 InvenSense, Inc. USD 707 306 625 563 0.2516 555 Invesco Ltd. USD 365 714 373 361 0.1513 220 Invesco Mortgage Capital, Inc. USD 210 135 220 213 0.09
2 502 IPG Photonics Corp. USD 115 132 129 396 0.055 Iron Mountain, Inc. USD 127 141 0.00
23 Ironwood Pharmaceuticals, Inc. USD 288 328 0.0017 083 Itron, Inc. USD 599 994 617 282 0.25
222 Jack in the Box, Inc. USD 5 818 5 980 0.005 288 JDS Uniphase Corp. USD 56 827 55 058 0.02
14 116 Jones Lang LaSalle, Inc. USD 897 926 1 092 806 0.4310 Joy Global, Inc. USD 472 464 0.00
31 405 Juniper Networks, Inc. USD 459 787 453 430 0.18504 KapStone Paper and Packaging Corp. USD 9 940 10 911 0.00
9 526 Kennedy-Wilson Hldg., Inc. USD 115 235 115 060 0.0580 512 KeyCorp USD 612 026 624 484 0.25
50 Keyera Corp. CAD 1 915 2 188 0.0028 105 KEYW Hldg. Corp. USD 300 868 353 036 0.14
3 169 Kraton Performance Polymers, Inc. USD 58 301 57 748 0.0241 903 Kroger Co. USD 973 512 1 081 432 0.43
971 Kulicke & Soffa Industries, Inc. USD 7 367 8 741 0.003 786 Labrador Iron Ore Royalty Corp. CAD 100 545 98 468 0.043 245 Laredo Petroleum Hldg., Inc. USD 47 820 46 220 0.02
43 756 LeapFrog Enterprises, Inc. USD 282 173 291 684 0.1275 Lear Corp. USD 2 691 3 205 0.00
114 410 Lexington Realty Trust USD 975 579 1 051 350 0.42142 Lincoln Electric Hldg., Inc. USD 6 192 5 991 0.00631 Lincoln National Corp. USD 15 970 16 024 0.01
13 226 Live Nation Entertainment, Inc. USD 121 253 127 409 0.052 297 LKQ Corp. USD 38 233 38 924 0.021 095 LogMeIn, Inc. USD 17 595 16 390 0.012 218 Louisiana-Pacific Corp. USD 34 322 37 309 0.018 094 LSB Industries, Inc. USD 240 597 219 227 0.09
21 327 LyondellBasell Industries NV - A USD 979 135 1 051 154 0.426 171 Madison Square Garden Co. - A USD 264 937 276 809 0.112 160 Magnum Hunter Resources Corp. USD 6 522 6 745 0.005 002 MAKO Surgical Corp. USD 45 733 43 433 0.02
16 Manitoba Telecom Services, Inc. CAD 385 405 0.00
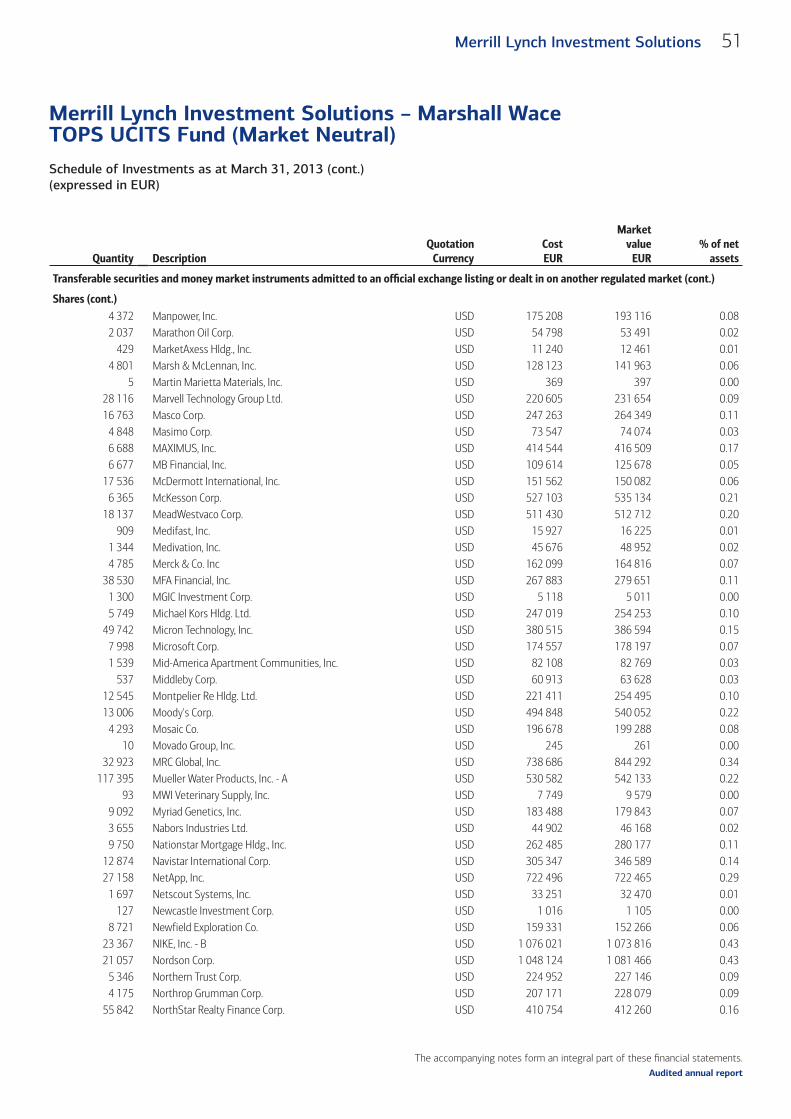
The accompanying notes form an integral part of these fi nancial statements.
Schedule of Investments as at March 31, 2013 (cont.)(expressed in EUR)
Merrill Lynch Investment Solutions – Marshall Wace TOPS UCITS Fund (Market Neutral)
51Merrill Lynch Investment Solutions
Audited annual report
Quantity DescriptionQuotation
CurrencyCostEUR
Marketvalue
EUR% of net
assets
Transferable securities and money market instruments admitted to an offi cial exchange listing or dealt in on another regulated market (cont.)
Shares (cont.)4 372 Manpower, Inc. USD 175 208 193 116 0.082 037 Marathon Oil Corp. USD 54 798 53 491 0.02
429 MarketAxess Hldg., Inc. USD 11 240 12 461 0.014 801 Marsh & McLennan, Inc. USD 128 123 141 963 0.06
5 Martin Marietta Materials, Inc. USD 369 397 0.0028 116 Marvell Technology Group Ltd. USD 220 605 231 654 0.0916 763 Masco Corp. USD 247 263 264 349 0.11
4 848 Masimo Corp. USD 73 547 74 074 0.036 688 MAXIMUS, Inc. USD 414 544 416 509 0.176 677 MB Financial, Inc. USD 109 614 125 678 0.05
17 536 McDermott International, Inc. USD 151 562 150 082 0.066 365 McKesson Corp. USD 527 103 535 134 0.21
18 137 MeadWestvaco Corp. USD 511 430 512 712 0.20909 Medifast, Inc. USD 15 927 16 225 0.01
1 344 Medivation, Inc. USD 45 676 48 952 0.024 785 Merck & Co. Inc USD 162 099 164 816 0.07
38 530 MFA Financial, Inc. USD 267 883 279 651 0.111 300 MGIC Investment Corp. USD 5 118 5 011 0.005 749 Michael Kors Hldg. Ltd. USD 247 019 254 253 0.10
49 742 Micron Technology, Inc. USD 380 515 386 594 0.157 998 Microsoft Corp. USD 174 557 178 197 0.071 539 Mid-America Apartment Communities, Inc. USD 82 108 82 769 0.03
537 Middleby Corp. USD 60 913 63 628 0.0312 545 Montpelier Re Hldg. Ltd. USD 221 411 254 495 0.1013 006 Moody's Corp. USD 494 848 540 052 0.22
4 293 Mosaic Co. USD 196 678 199 288 0.0810 Movado Group, Inc. USD 245 261 0.00
32 923 MRC Global, Inc. USD 738 686 844 292 0.34117 395 Mueller Water Products, Inc. - A USD 530 582 542 133 0.22
93 MWI Veterinary Supply, Inc. USD 7 749 9 579 0.009 092 Myriad Genetics, Inc. USD 183 488 179 843 0.073 655 Nabors Industries Ltd. USD 44 902 46 168 0.029 750 Nationstar Mortgage Hldg., Inc. USD 262 485 280 177 0.11
12 874 Navistar International Corp. USD 305 347 346 589 0.1427 158 NetApp, Inc. USD 722 496 722 465 0.29
1 697 Netscout Systems, Inc. USD 33 251 32 470 0.01127 Newcastle Investment Corp. USD 1 016 1 105 0.00
8 721 Newfield Exploration Co. USD 159 331 152 266 0.0623 367 NIKE, Inc. - B USD 1 076 021 1 073 816 0.4321 057 Nordson Corp. USD 1 048 124 1 081 466 0.43
5 346 Northern Trust Corp. USD 224 952 227 146 0.094 175 Northrop Grumman Corp. USD 207 171 228 079 0.09
55 842 NorthStar Realty Finance Corp. USD 410 754 412 260 0.16
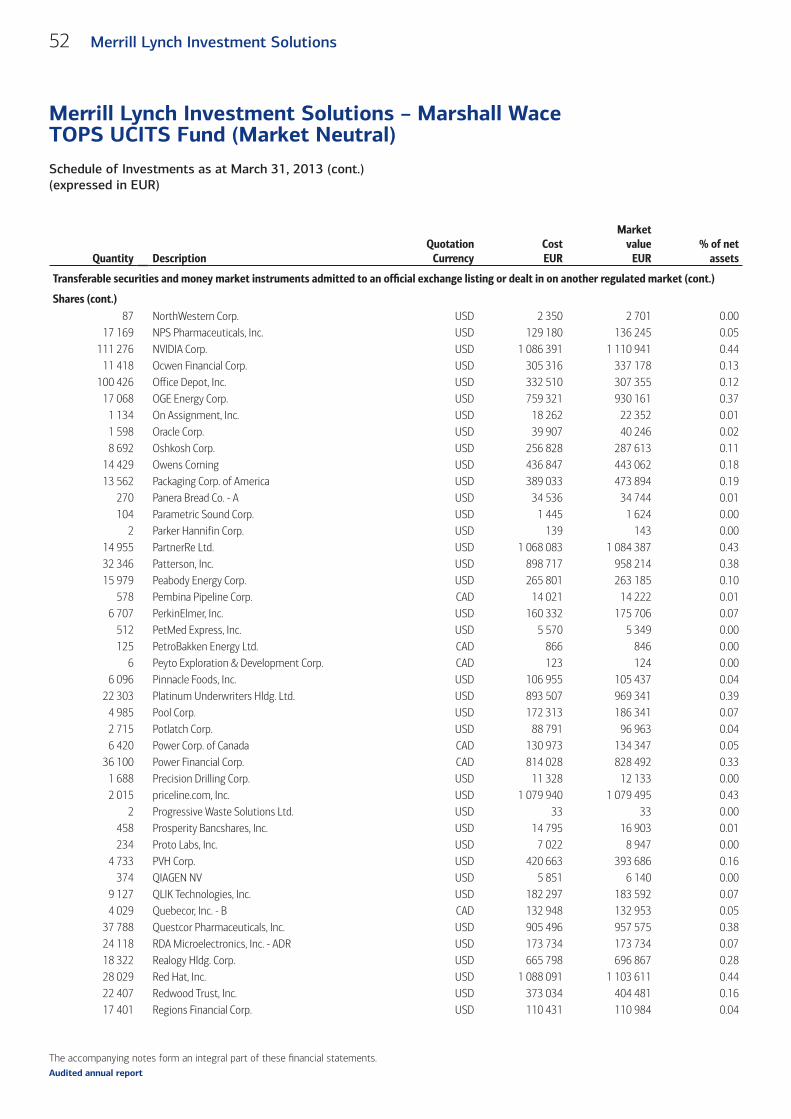
The accompanying notes form an integral part of these fi nancial statements.
Schedule of Investments as at March 31, 2013 (cont.)(expressed in EUR)
Merrill Lynch Investment Solutions – Marshall Wace TOPS UCITS Fund (Market Neutral)
52 Merrill Lynch Investment Solutions
Audited annual report
Quantity DescriptionQuotation
CurrencyCostEUR
Marketvalue
EUR% of net
assets
Transferable securities and money market instruments admitted to an offi cial exchange listing or dealt in on another regulated market (cont.)
Shares (cont.)87 NorthWestern Corp. USD 2 350 2 701 0.00
17 169 NPS Pharmaceuticals, Inc. USD 129 180 136 245 0.05111 276 NVIDIA Corp. USD 1 086 391 1 110 941 0.44
11 418 Ocwen Financial Corp. USD 305 316 337 178 0.13100 426 Office Depot, Inc. USD 332 510 307 355 0.12
17 068 OGE Energy Corp. USD 759 321 930 161 0.371 134 On Assignment, Inc. USD 18 262 22 352 0.011 598 Oracle Corp. USD 39 907 40 246 0.028 692 Oshkosh Corp. USD 256 828 287 613 0.11
14 429 Owens Corning USD 436 847 443 062 0.1813 562 Packaging Corp. of America USD 389 033 473 894 0.19
270 Panera Bread Co. - A USD 34 536 34 744 0.01104 Parametric Sound Corp. USD 1 445 1 624 0.00
2 Parker Hannifin Corp. USD 139 143 0.0014 955 PartnerRe Ltd. USD 1 068 083 1 084 387 0.4332 346 Patterson, Inc. USD 898 717 958 214 0.3815 979 Peabody Energy Corp. USD 265 801 263 185 0.10
578 Pembina Pipeline Corp. CAD 14 021 14 222 0.016 707 PerkinElmer, Inc. USD 160 332 175 706 0.07
512 PetMed Express, Inc. USD 5 570 5 349 0.00125 PetroBakken Energy Ltd. CAD 866 846 0.00
6 Peyto Exploration & Development Corp. CAD 123 124 0.006 096 Pinnacle Foods, Inc. USD 106 955 105 437 0.04
22 303 Platinum Underwriters Hldg. Ltd. USD 893 507 969 341 0.394 985 Pool Corp. USD 172 313 186 341 0.072 715 Potlatch Corp. USD 88 791 96 963 0.046 420 Power Corp. of Canada CAD 130 973 134 347 0.05
36 100 Power Financial Corp. CAD 814 028 828 492 0.331 688 Precision Drilling Corp. USD 11 328 12 133 0.002 015 priceline.com, Inc. USD 1 079 940 1 079 495 0.43
2 Progressive Waste Solutions Ltd. USD 33 33 0.00458 Prosperity Bancshares, Inc. USD 14 795 16 903 0.01234 Proto Labs, Inc. USD 7 022 8 947 0.00
4 733 PVH Corp. USD 420 663 393 686 0.16374 QIAGEN NV USD 5 851 6 140 0.00
9 127 QLIK Technologies, Inc. USD 182 297 183 592 0.074 029 Quebecor, Inc. - B CAD 132 948 132 953 0.05
37 788 Questcor Pharmaceuticals, Inc. USD 905 496 957 575 0.3824 118 RDA Microelectronics, Inc. - ADR USD 173 734 173 734 0.0718 322 Realogy Hldg. Corp. USD 665 798 696 867 0.2828 029 Red Hat, Inc. USD 1 088 091 1 103 611 0.4422 407 Redwood Trust, Inc. USD 373 034 404 481 0.1617 401 Regions Financial Corp. USD 110 431 110 984 0.04
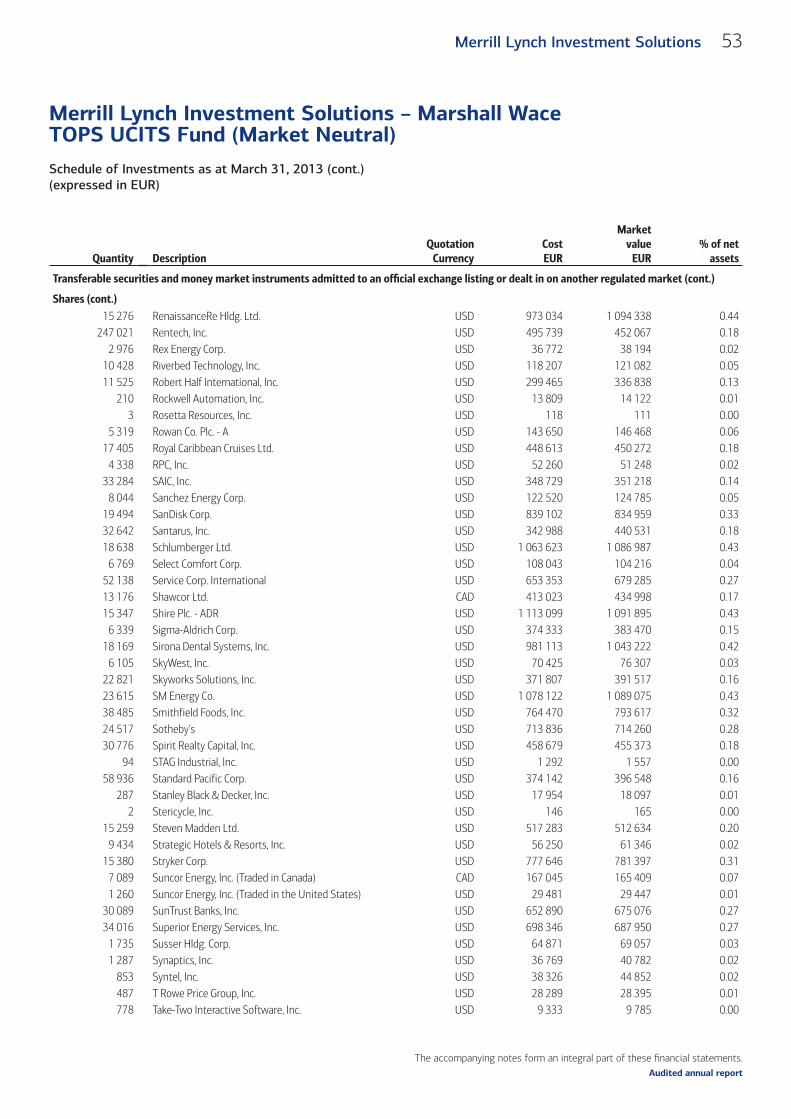
The accompanying notes form an integral part of these fi nancial statements.
Schedule of Investments as at March 31, 2013 (cont.)(expressed in EUR)
Merrill Lynch Investment Solutions – Marshall Wace TOPS UCITS Fund (Market Neutral)
53Merrill Lynch Investment Solutions
Audited annual report
Quantity DescriptionQuotation
CurrencyCostEUR
Marketvalue
EUR% of net
assets
Transferable securities and money market instruments admitted to an offi cial exchange listing or dealt in on another regulated market (cont.)
Shares (cont.)15 276 RenaissanceRe Hldg. Ltd. USD 973 034 1 094 338 0.44
247 021 Rentech, Inc. USD 495 739 452 067 0.182 976 Rex Energy Corp. USD 36 772 38 194 0.02
10 428 Riverbed Technology, Inc. USD 118 207 121 082 0.0511 525 Robert Half International, Inc. USD 299 465 336 838 0.13
210 Rockwell Automation, Inc. USD 13 809 14 122 0.013 Rosetta Resources, Inc. USD 118 111 0.00
5 319 Rowan Co. Plc. - A USD 143 650 146 468 0.0617 405 Royal Caribbean Cruises Ltd. USD 448 613 450 272 0.18
4 338 RPC, Inc. USD 52 260 51 248 0.0233 284 SAIC, Inc. USD 348 729 351 218 0.14
8 044 Sanchez Energy Corp. USD 122 520 124 785 0.0519 494 SanDisk Corp. USD 839 102 834 959 0.3332 642 Santarus, Inc. USD 342 988 440 531 0.1818 638 Schlumberger Ltd. USD 1 063 623 1 086 987 0.43
6 769 Select Comfort Corp. USD 108 043 104 216 0.0452 138 Service Corp. International USD 653 353 679 285 0.2713 176 Shawcor Ltd. CAD 413 023 434 998 0.1715 347 Shire Plc. - ADR USD 1 113 099 1 091 895 0.43
6 339 Sigma-Aldrich Corp. USD 374 333 383 470 0.1518 169 Sirona Dental Systems, Inc. USD 981 113 1 043 222 0.42
6 105 SkyWest, Inc. USD 70 425 76 307 0.0322 821 Skyworks Solutions, Inc. USD 371 807 391 517 0.1623 615 SM Energy Co. USD 1 078 122 1 089 075 0.4338 485 Smithfield Foods, Inc. USD 764 470 793 617 0.3224 517 Sotheby's USD 713 836 714 260 0.2830 776 Spirit Realty Capital, Inc. USD 458 679 455 373 0.18
94 STAG Industrial, Inc. USD 1 292 1 557 0.0058 936 Standard Pacific Corp. USD 374 142 396 548 0.16
287 Stanley Black & Decker, Inc. USD 17 954 18 097 0.012 Stericycle, Inc. USD 146 165 0.00
15 259 Steven Madden Ltd. USD 517 283 512 634 0.209 434 Strategic Hotels & Resorts, Inc. USD 56 250 61 346 0.02
15 380 Stryker Corp. USD 777 646 781 397 0.317 089 Suncor Energy, Inc. (Traded in Canada) CAD 167 045 165 409 0.071 260 Suncor Energy, Inc. (Traded in the United States) USD 29 481 29 447 0.01
30 089 SunTrust Banks, Inc. USD 652 890 675 076 0.2734 016 Superior Energy Services, Inc. USD 698 346 687 950 0.27
1 735 Susser Hldg. Corp. USD 64 871 69 057 0.031 287 Synaptics, Inc. USD 36 769 40 782 0.02
853 Syntel, Inc. USD 38 326 44 852 0.02487 T Rowe Price Group, Inc. USD 28 289 28 395 0.01778 Take-Two Interactive Software, Inc. USD 9 333 9 785 0.00

The accompanying notes form an integral part of these fi nancial statements.
Schedule of Investments as at March 31, 2013 (cont.)(expressed in EUR)
Merrill Lynch Investment Solutions – Marshall Wace TOPS UCITS Fund (Market Neutral)
54 Merrill Lynch Investment Solutions
Audited annual report
Quantity DescriptionQuotation
CurrencyCostEUR
Marketvalue
EUR% of net
assets
Transferable securities and money market instruments admitted to an offi cial exchange listing or dealt in on another regulated market (cont.)
Shares (cont.)3 936 Tangoe, Inc. USD 36 850 37 978 0.02
10 303 Taser International, Inc. USD 64 053 63 787 0.0332 273 TE Connectivity Ltd. USD 1 027 497 1 053 818 0.42
4 475 Teck Resources Ltd. - B CAD 97 476 98 104 0.0420 251 Terex Corp. USD 521 591 542 824 0.2211 899 Thor Industries, Inc. USD 342 712 340 912 0.1416 014 Thoratec Corp. USD 436 968 467 662 0.1912 077 TICC Capital Corp. USD 95 593 93 486 0.04
4 TJX, Inc. USD 134 146 0.0055 191 Total System Services, Inc. USD 1 032 475 1 065 052 0.4225 645 Transocean Ltd. USD 1 025 870 1 037 703 0.41
51 Triangle Capital Corp. USD 870 1 112 0.0012 550 Tronox Ltd. - A USD 202 516 193 611 0.08
45 Trustmark Corp. USD 756 876 0.0016 192 TRW Automotive Hldg. Corp. USD 704 165 693 529 0.28
1 732 Tumi Hldg., Inc. USD 29 486 28 244 0.0118 696 TW Telecom, Inc. USD 357 863 366 757 0.15
936 Ulta Salon Cosmetics & Fragrance, Inc. USD 57 281 59 166 0.0215 476 United Natural Foods, Inc. USD 586 224 592 960 0.24
4 United Therapeutics Corp. USD 168 190 0.002 608 Urban Outfitters, Inc. USD 82 337 78 681 0.039 807 USG Corp. USD 205 691 201 929 0.08
172 Valassis Communications, Inc. USD 3 514 4 001 0.001 Validus Hldg. Ltd. USD 27 29 0.00
7 897 Valmont Industries, Inc. USD 916 648 967 185 0.382 450 Valspar Corp. USD 118 200 118 770 0.05
26 299 Vantiv, Inc. - A USD 439 150 486 207 0.199 682 Vertex Pharmaceuticals, Inc. USD 344 230 414 545 0.17
13 926 VMware, Inc. - A USD 808 594 855 450 0.341 312 Vocera Communications, Inc. USD 23 024 23 500 0.01
24 598 Walt Disney Co. USD 1 073 751 1 088 052 0.431 660 Walter Investment Management Corp. USD 41 500 48 154 0.02
177 Warner Chilcott Plc. - A USD 1 855 1 868 0.0055 553 Weatherford International Ltd. USD 502 341 525 203 0.21
2 553 West Fraser Timber Co. Ltd. CAD 156 350 176 126 0.07674 Western Digital Corp. USD 26 300 26 391 0.01
44 714 Weyerhaeuser Co. USD 991 636 1 092 692 0.431 024 Whiting Petroleum Corp. USD 40 375 40 542 0.023 445 Williams-Sonoma, Inc. USD 131 943 138 219 0.06
12 415 Woodward, Inc. USD 336 381 384 410 0.151 783 WR Grace & Co USD 96 664 107 624 0.043 359 Xerox Corp. USD 22 378 22 496 0.01
5 Xilinx, Inc. USD 134 149 0.00
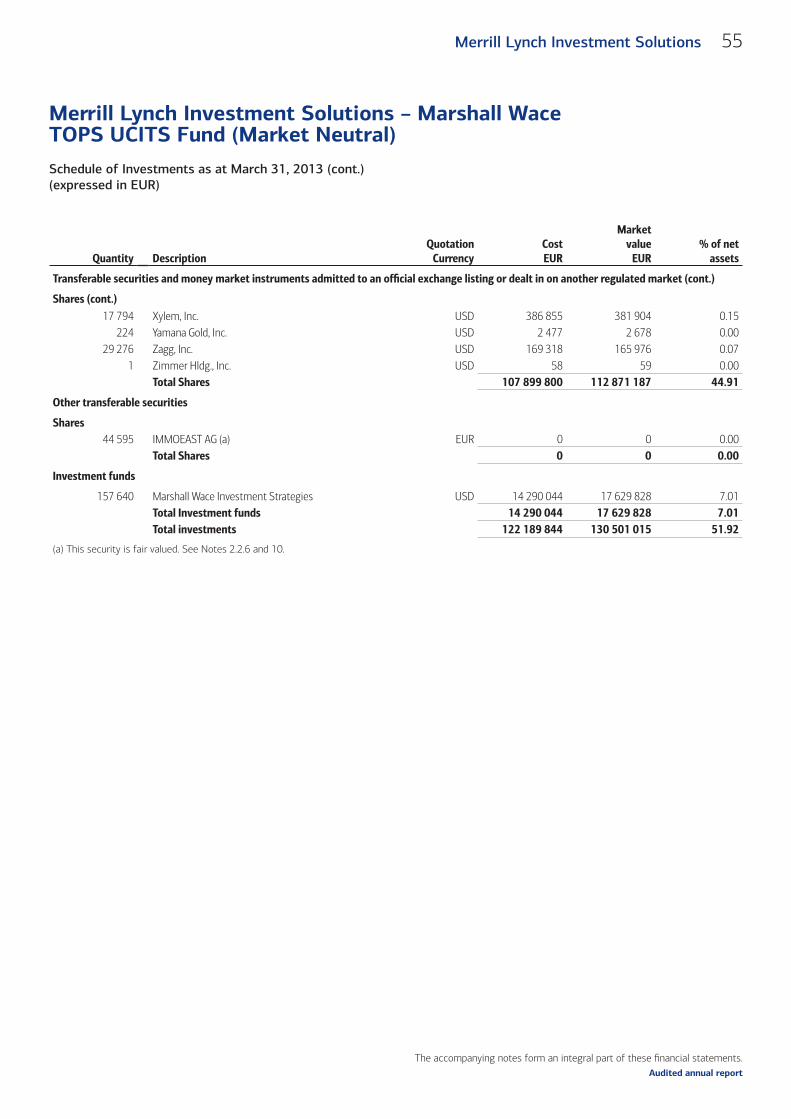
The accompanying notes form an integral part of these fi nancial statements.
Schedule of Investments as at March 31, 2013 (cont.)(expressed in EUR)
Merrill Lynch Investment Solutions – Marshall Wace TOPS UCITS Fund (Market Neutral)
55Merrill Lynch Investment Solutions
Audited annual report
Quantity DescriptionQuotation
CurrencyCostEUR
Marketvalue
EUR% of net
assets
Transferable securities and money market instruments admitted to an offi cial exchange listing or dealt in on another regulated market (cont.)
Shares (cont.)17 794 Xylem, Inc. USD 386 855 381 904 0.15
224 Yamana Gold, Inc. USD 2 477 2 678 0.0029 276 Zagg, Inc. USD 169 318 165 976 0.07
1 Zimmer Hldg., Inc. USD 58 59 0.00Total Shares 107 899 800 112 871 187 44.91
Other transferable securities
Shares44 595 IMMOEAST AG (a) EUR 0 0 0.00
Total Shares 0 0 0.00
Investment funds
157 640 Marshall Wace Investment Strategies USD 14 290 044 17 629 828 7.01Total Investment funds 14 290 044 17 629 828 7.01Total investments 122 189 844 130 501 015 51.92
(a) This security is fair valued. See Notes 2.2.6 and 10.
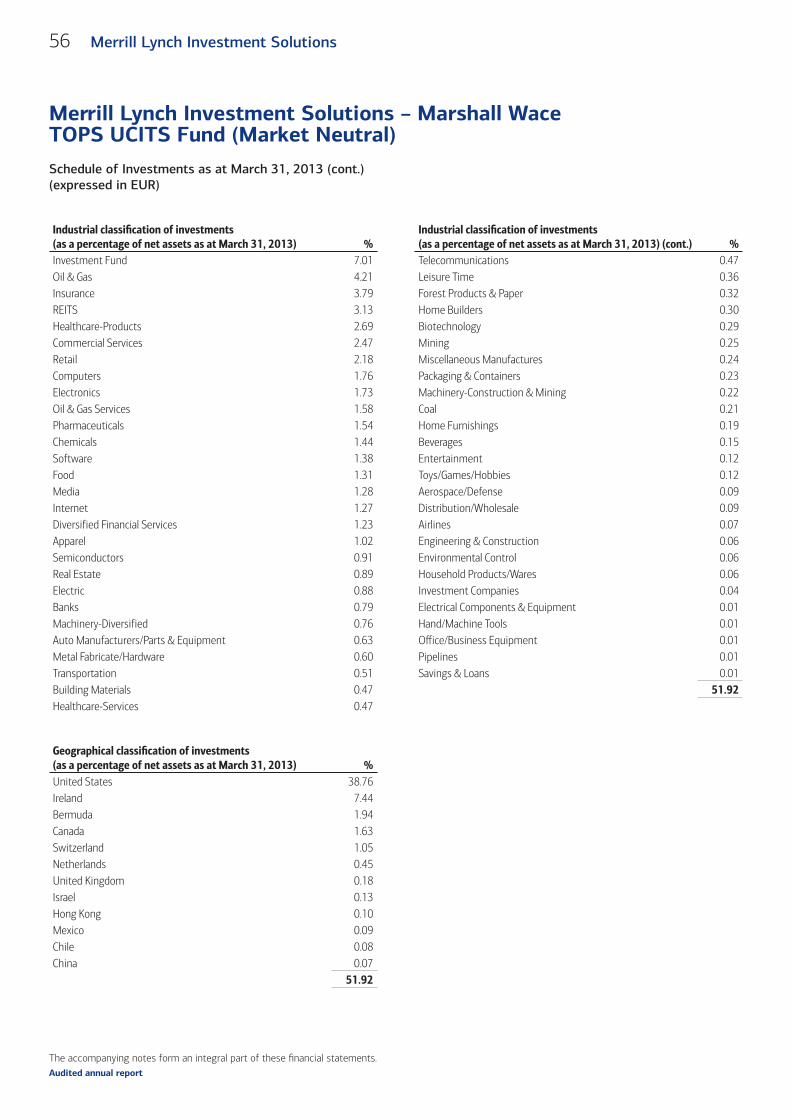
The accompanying notes form an integral part of these fi nancial statements.
Schedule of Investments as at March 31, 2013 (cont.)(expressed in EUR)
Merrill Lynch Investment Solutions – Marshall Wace TOPS UCITS Fund (Market Neutral)
56 Merrill Lynch Investment Solutions
Audited annual report
Industrial classifi cation of investments(as a percentage of net assets as at March 31, 2013) %
Industrial classifi cation of investments(as a percentage of net assets as at March 31, 2013) (cont.) %
Investment Fund 7.01 Telecommunications 0.47Oil & Gas 4.21 Leisure Time 0.36Insurance 3.79 Forest Products & Paper 0.32REITS 3.13 Home Builders 0.30Healthcare-Products 2.69 Biotechnology 0.29Commercial Services 2.47 Mining 0.25Retail 2.18 Miscellaneous Manufactures 0.24Computers 1.76 Packaging & Containers 0.23Electronics 1.73 Machinery-Construction & Mining 0.22Oil & Gas Services 1.58 Coal 0.21Pharmaceuticals 1.54 Home Furnishings 0.19Chemicals 1.44 Beverages 0.15Software 1.38 Entertainment 0.12Food 1.31 Toys/Games/Hobbies 0.12Media 1.28 Aerospace/Defense 0.09Internet 1.27 Distribution/Wholesale 0.09Diversified Financial Services 1.23 Airlines 0.07Apparel 1.02 Engineering & Construction 0.06Semiconductors 0.91 Environmental Control 0.06Real Estate 0.89 Household Products/Wares 0.06Electric 0.88 Investment Companies 0.04Banks 0.79 Electrical Components & Equipment 0.01Machinery-Diversified 0.76 Hand/Machine Tools 0.01Auto Manufacturers/Parts & Equipment 0.63 Office/Business Equipment 0.01Metal Fabricate/Hardware 0.60 Pipelines 0.01Transportation 0.51 Savings & Loans 0.01Building Materials 0.47 51.92Healthcare-Services 0.47
Geographical classifi cation of investments(as a percentage of net assets as at March 31, 2013) %United States 38.76Ireland 7.44Bermuda 1.94Canada 1.63Switzerland 1.05Netherlands 0.45United Kingdom 0.18Israel 0.13Hong Kong 0.10Mexico 0.09Chile 0.08China 0.07
51.92
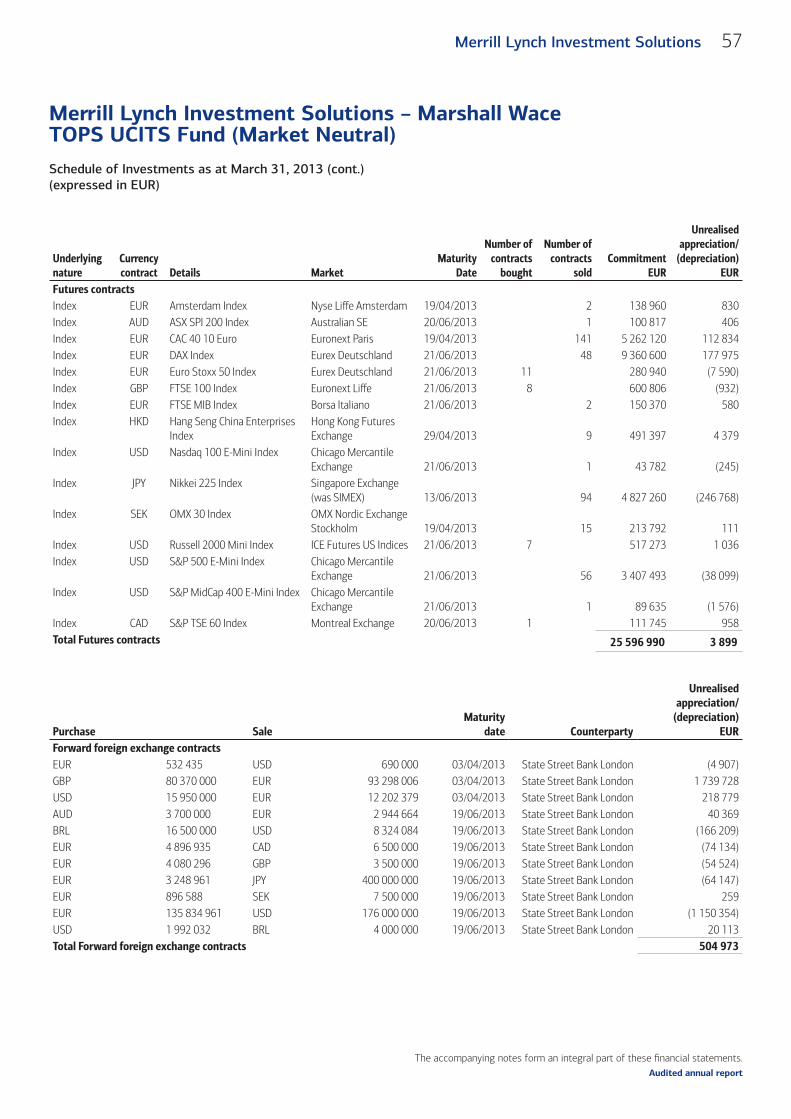
The accompanying notes form an integral part of these fi nancial statements.
Schedule of Investments as at March 31, 2013 (cont.)(expressed in EUR)
Merrill Lynch Investment Solutions – Marshall Wace TOPS UCITS Fund (Market Neutral)
57Merrill Lynch Investment Solutions
Audited annual report
Underlyingnature
Currencycontract Details Market
MaturityDate
Number ofcontracts
bought
Number ofcontracts
soldCommitment
EUR
Unrealisedappreciation/
(depreciation)EUR
Futures contractsIndex EUR Amsterdam Index Nyse Liffe Amsterdam 19/04/2013 2 138 960 830Index AUD ASX SPI 200 Index Australian SE 20/06/2013 1 100 817 406Index EUR CAC 40 10 Euro Euronext Paris 19/04/2013 141 5 262 120 112 834Index EUR DAX Index Eurex Deutschland 21/06/2013 48 9 360 600 177 975Index EUR Euro Stoxx 50 Index Eurex Deutschland 21/06/2013 11 280 940 (7 590)Index GBP FTSE 100 Index Euronext Liffe 21/06/2013 8 600 806 (932)Index EUR FTSE MIB Index Borsa Italiano 21/06/2013 2 150 370 580Index HKD Hang Seng China Enterprises
IndexHong Kong Futures Exchange 29/04/2013 9 491 397 4 379
Index USD Nasdaq 100 E-Mini Index Chicago Mercantile Exchange 21/06/2013 1 43 782 (245)
Index JPY Nikkei 225 Index Singapore Exchange (was SIMEX) 13/06/2013 94 4 827 260 (246 768)
Index SEK OMX 30 Index OMX Nordic Exchange Stockholm 19/04/2013 15 213 792 111
Index USD Russell 2000 Mini Index ICE Futures US Indices 21/06/2013 7 517 273 1 036Index USD S&P 500 E-Mini Index Chicago Mercantile
Exchange 21/06/2013 56 3 407 493 (38 099)Index USD S&P MidCap 400 E-Mini Index Chicago Mercantile
Exchange 21/06/2013 1 89 635 (1 576)Index CAD S&P TSE 60 Index Montreal Exchange 20/06/2013 1 111 745 958Total Futures contracts 25 596 990 3 899
Purchase SaleMaturity
date Counterparty
Unrealisedappreciation/
(depreciation)EUR
Forward foreign exchange contractsEUR 532 435 USD 690 000 03/04/2013 State Street Bank London (4 907)GBP 80 370 000 EUR 93 298 006 03/04/2013 State Street Bank London 1 739 728 USD 15 950 000 EUR 12 202 379 03/04/2013 State Street Bank London 218 779 AUD 3 700 000 EUR 2 944 664 19/06/2013 State Street Bank London 40 369 BRL 16 500 000 USD 8 324 084 19/06/2013 State Street Bank London (166 209)EUR 4 896 935 CAD 6 500 000 19/06/2013 State Street Bank London (74 134)EUR 4 080 296 GBP 3 500 000 19/06/2013 State Street Bank London (54 524)EUR 3 248 961 JPY 400 000 000 19/06/2013 State Street Bank London (64 147)EUR 896 588 SEK 7 500 000 19/06/2013 State Street Bank London 259 EUR 135 834 961 USD 176 000 000 19/06/2013 State Street Bank London (1 150 354)USD 1 992 032 BRL 4 000 000 19/06/2013 State Street Bank London 20 113 Total Forward foreign exchange contracts 504 973
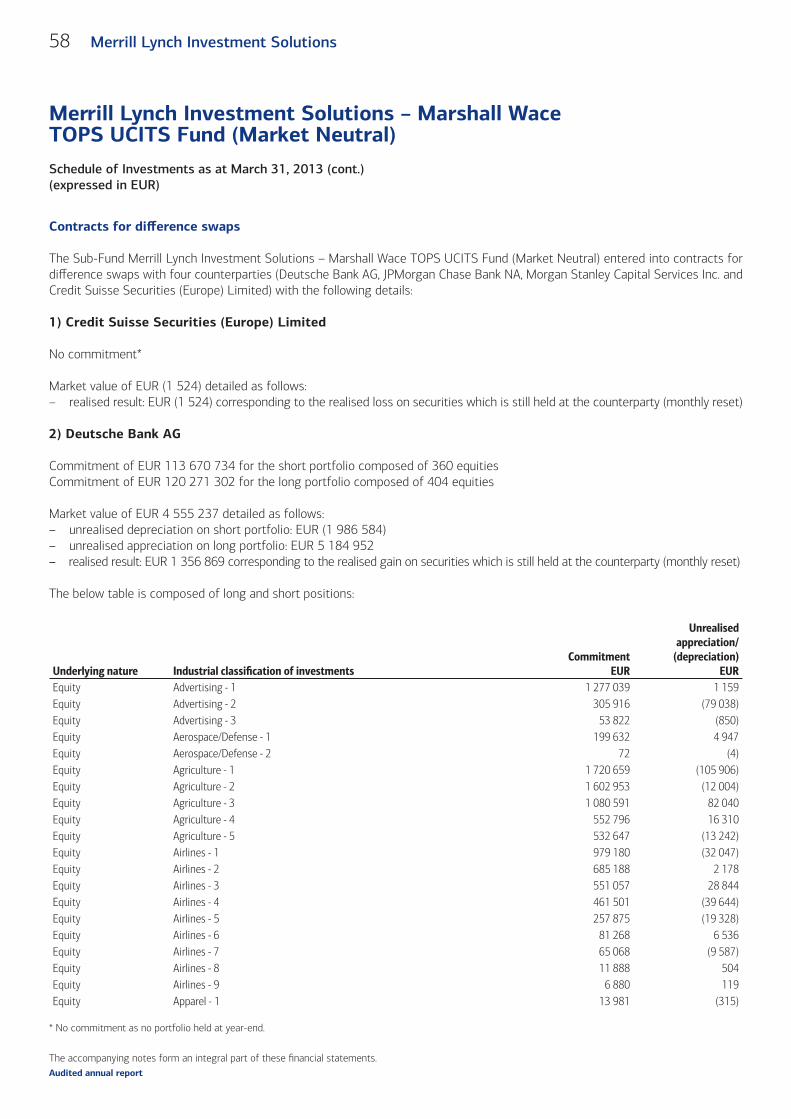
The accompanying notes form an integral part of these fi nancial statements.
Schedule of Investments as at March 31, 2013 (cont.)(expressed in EUR)
Merrill Lynch Investment Solutions – Marshall Wace TOPS UCITS Fund (Market Neutral)
58 Merrill Lynch Investment Solutions
Audited annual report
Contracts for diff erence swaps
The Sub-Fund Merrill Lynch Investment Solutions – Marshall Wace TOPS UCITS Fund (Market Neutral) entered into contracts for diff erence swaps with four counterparties (Deutsche Bank AG, JPMorgan Chase Bank NA, Morgan Stanley Capital Services Inc. and Credit Suisse Securities (Europe) Limited) with the following details:
1) Credit Suisse Securities (Europe) Limited
No commitment*
Market value of EUR (1 524) detailed as follows:– realised result: EUR (1 524) corresponding to the realised loss on securities which is still held at the counterparty (monthly reset)
2) Deutsche Bank AG
Commitment of EUR 113 670 734 for the short portfolio composed of 360 equitiesCommitment of EUR 120 271 302 for the long portfolio composed of 404 equities
Market value of EUR 4 555 237 detailed as follows:– unrealised depreciation on short portfolio: EUR (1 986 584)– unrealised appreciation on long portfolio: EUR 5 184 952– realised result: EUR 1 356 869 corresponding to the realised gain on securities which is still held at the counterparty (monthly reset)
The below table is composed of long and short positions:
Underlying nature Industrial classifi cation of investmentsCommitment
EUR
Unrealised appreciation/
(depreciation)EUR
Equity Advertising - 1 1 277 039 1 159 Equity Advertising - 2 305 916 (79 038)Equity Advertising - 3 53 822 (850)Equity Aerospace/Defense - 1 199 632 4 947 Equity Aerospace/Defense - 2 72 (4)Equity Agriculture - 1 1 720 659 (105 906)Equity Agriculture - 2 1 602 953 (12 004)Equity Agriculture - 3 1 080 591 82 040 Equity Agriculture - 4 552 796 16 310 Equity Agriculture - 5 532 647 (13 242)Equity Airlines - 1 979 180 (32 047)Equity Airlines - 2 685 188 2 178 Equity Airlines - 3 551 057 28 844 Equity Airlines - 4 461 501 (39 644)Equity Airlines - 5 257 875 (19 328)Equity Airlines - 6 81 268 6 536 Equity Airlines - 7 65 068 (9 587)Equity Airlines - 8 11 888 504 Equity Airlines - 9 6 880 119 Equity Apparel - 1 13 981 (315)
* No commitment as no portfolio held at year-end.
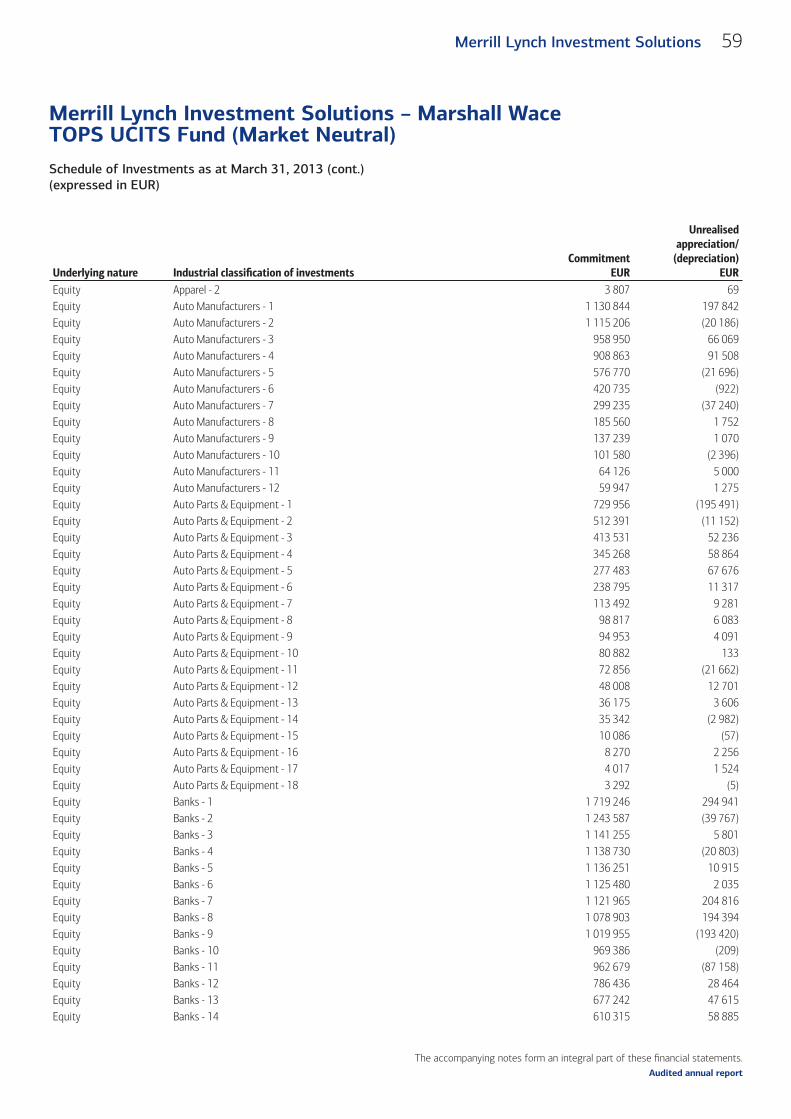
The accompanying notes form an integral part of these fi nancial statements.
Schedule of Investments as at March 31, 2013 (cont.)(expressed in EUR)
Merrill Lynch Investment Solutions – Marshall Wace TOPS UCITS Fund (Market Neutral)
59Merrill Lynch Investment Solutions
Audited annual report
Underlying nature Industrial classifi cation of investmentsCommitment
EUR
Unrealised appreciation/
(depreciation)EUR
Equity Apparel - 2 3 807 69 Equity Auto Manufacturers - 1 1 130 844 197 842 Equity Auto Manufacturers - 2 1 115 206 (20 186)Equity Auto Manufacturers - 3 958 950 66 069 Equity Auto Manufacturers - 4 908 863 91 508 Equity Auto Manufacturers - 5 576 770 (21 696)Equity Auto Manufacturers - 6 420 735 (922)Equity Auto Manufacturers - 7 299 235 (37 240)Equity Auto Manufacturers - 8 185 560 1 752 Equity Auto Manufacturers - 9 137 239 1 070 Equity Auto Manufacturers - 10 101 580 (2 396)Equity Auto Manufacturers - 11 64 126 5 000 Equity Auto Manufacturers - 12 59 947 1 275 Equity Auto Parts & Equipment - 1 729 956 (195 491)Equity Auto Parts & Equipment - 2 512 391 (11 152)Equity Auto Parts & Equipment - 3 413 531 52 236 Equity Auto Parts & Equipment - 4 345 268 58 864 Equity Auto Parts & Equipment - 5 277 483 67 676 Equity Auto Parts & Equipment - 6 238 795 11 317 Equity Auto Parts & Equipment - 7 113 492 9 281 Equity Auto Parts & Equipment - 8 98 817 6 083 Equity Auto Parts & Equipment - 9 94 953 4 091 Equity Auto Parts & Equipment - 10 80 882 133 Equity Auto Parts & Equipment - 11 72 856 (21 662)Equity Auto Parts & Equipment - 12 48 008 12 701 Equity Auto Parts & Equipment - 13 36 175 3 606 Equity Auto Parts & Equipment - 14 35 342 (2 982)Equity Auto Parts & Equipment - 15 10 086 (57)Equity Auto Parts & Equipment - 16 8 270 2 256 Equity Auto Parts & Equipment - 17 4 017 1 524 Equity Auto Parts & Equipment - 18 3 292 (5)Equity Banks - 1 1 719 246 294 941 Equity Banks - 2 1 243 587 (39 767)Equity Banks - 3 1 141 255 5 801 Equity Banks - 4 1 138 730 (20 803)Equity Banks - 5 1 136 251 10 915 Equity Banks - 6 1 125 480 2 035 Equity Banks - 7 1 121 965 204 816 Equity Banks - 8 1 078 903 194 394 Equity Banks - 9 1 019 955 (193 420)Equity Banks - 10 969 386 (209)Equity Banks - 11 962 679 (87 158)Equity Banks - 12 786 436 28 464 Equity Banks - 13 677 242 47 615 Equity Banks - 14 610 315 58 885
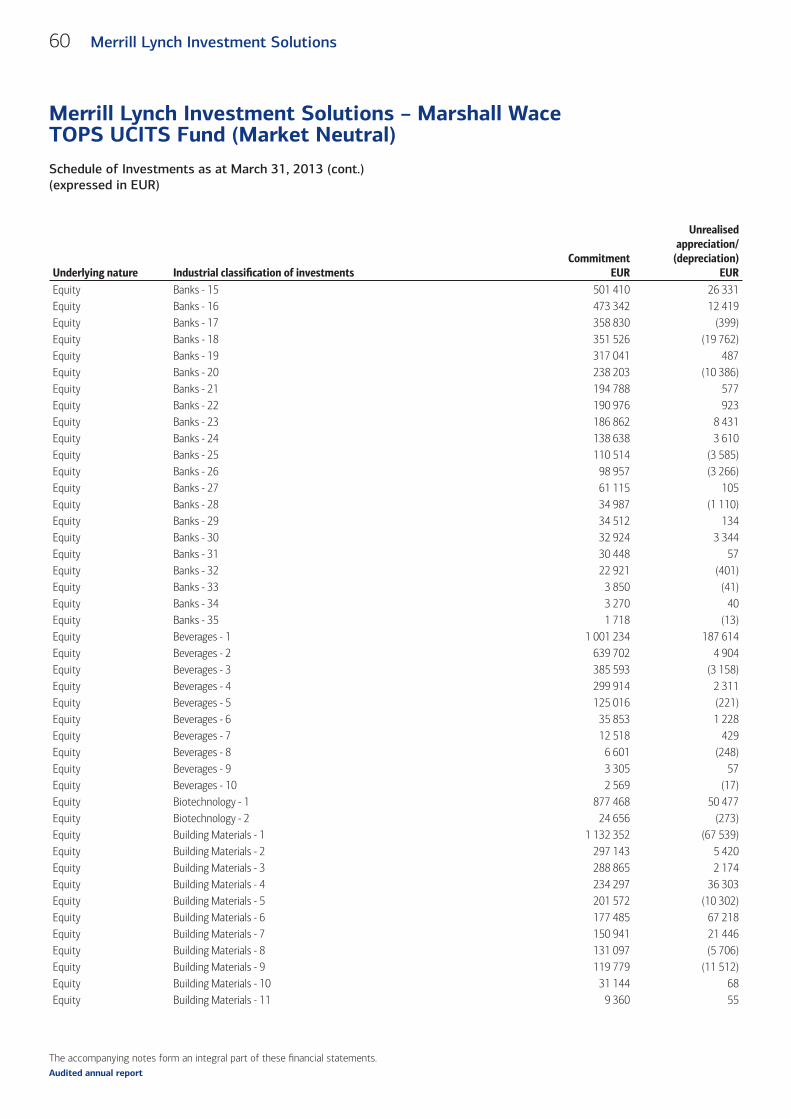
The accompanying notes form an integral part of these fi nancial statements.
Schedule of Investments as at March 31, 2013 (cont.)(expressed in EUR)
Merrill Lynch Investment Solutions – Marshall Wace TOPS UCITS Fund (Market Neutral)
60 Merrill Lynch Investment Solutions
Audited annual report
Underlying nature Industrial classifi cation of investmentsCommitment
EUR
Unrealised appreciation/
(depreciation)EUR
Equity Banks - 15 501 410 26 331 Equity Banks - 16 473 342 12 419 Equity Banks - 17 358 830 (399)Equity Banks - 18 351 526 (19 762)Equity Banks - 19 317 041 487 Equity Banks - 20 238 203 (10 386)Equity Banks - 21 194 788 577 Equity Banks - 22 190 976 923 Equity Banks - 23 186 862 8 431 Equity Banks - 24 138 638 3 610 Equity Banks - 25 110 514 (3 585)Equity Banks - 26 98 957 (3 266)Equity Banks - 27 61 115 105 Equity Banks - 28 34 987 (1 110)Equity Banks - 29 34 512 134 Equity Banks - 30 32 924 3 344 Equity Banks - 31 30 448 57 Equity Banks - 32 22 921 (401)Equity Banks - 33 3 850 (41)Equity Banks - 34 3 270 40 Equity Banks - 35 1 718 (13)Equity Beverages - 1 1 001 234 187 614 Equity Beverages - 2 639 702 4 904 Equity Beverages - 3 385 593 (3 158)Equity Beverages - 4 299 914 2 311 Equity Beverages - 5 125 016 (221)Equity Beverages - 6 35 853 1 228 Equity Beverages - 7 12 518 429 Equity Beverages - 8 6 601 (248)Equity Beverages - 9 3 305 57 Equity Beverages - 10 2 569 (17)Equity Biotechnology - 1 877 468 50 477 Equity Biotechnology - 2 24 656 (273)Equity Building Materials - 1 1 132 352 (67 539)Equity Building Materials - 2 297 143 5 420 Equity Building Materials - 3 288 865 2 174 Equity Building Materials - 4 234 297 36 303 Equity Building Materials - 5 201 572 (10 302)Equity Building Materials - 6 177 485 67 218 Equity Building Materials - 7 150 941 21 446 Equity Building Materials - 8 131 097 (5 706)Equity Building Materials - 9 119 779 (11 512)Equity Building Materials - 10 31 144 68 Equity Building Materials - 11 9 360 55
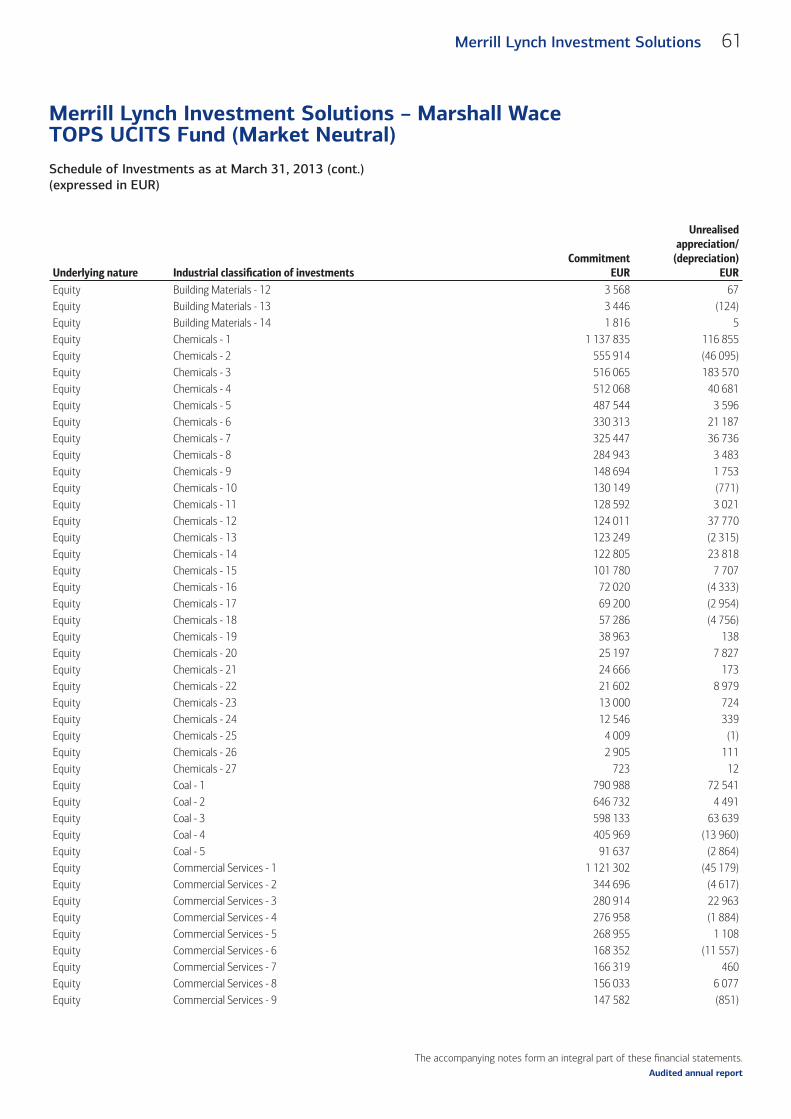
The accompanying notes form an integral part of these fi nancial statements.
Schedule of Investments as at March 31, 2013 (cont.)(expressed in EUR)
Merrill Lynch Investment Solutions – Marshall Wace TOPS UCITS Fund (Market Neutral)
61Merrill Lynch Investment Solutions
Audited annual report
Underlying nature Industrial classifi cation of investmentsCommitment
EUR
Unrealised appreciation/
(depreciation)EUR
Equity Building Materials - 12 3 568 67 Equity Building Materials - 13 3 446 (124)Equity Building Materials - 14 1 816 5 Equity Chemicals - 1 1 137 835 116 855 Equity Chemicals - 2 555 914 (46 095)Equity Chemicals - 3 516 065 183 570 Equity Chemicals - 4 512 068 40 681 Equity Chemicals - 5 487 544 3 596 Equity Chemicals - 6 330 313 21 187 Equity Chemicals - 7 325 447 36 736 Equity Chemicals - 8 284 943 3 483 Equity Chemicals - 9 148 694 1 753 Equity Chemicals - 10 130 149 (771)Equity Chemicals - 11 128 592 3 021 Equity Chemicals - 12 124 011 37 770 Equity Chemicals - 13 123 249 (2 315)Equity Chemicals - 14 122 805 23 818 Equity Chemicals - 15 101 780 7 707 Equity Chemicals - 16 72 020 (4 333)Equity Chemicals - 17 69 200 (2 954)Equity Chemicals - 18 57 286 (4 756)Equity Chemicals - 19 38 963 138 Equity Chemicals - 20 25 197 7 827 Equity Chemicals - 21 24 666 173 Equity Chemicals - 22 21 602 8 979 Equity Chemicals - 23 13 000 724 Equity Chemicals - 24 12 546 339 Equity Chemicals - 25 4 009 (1)Equity Chemicals - 26 2 905 111 Equity Chemicals - 27 723 12 Equity Coal - 1 790 988 72 541 Equity Coal - 2 646 732 4 491 Equity Coal - 3 598 133 63 639 Equity Coal - 4 405 969 (13 960)Equity Coal - 5 91 637 (2 864)Equity Commercial Services - 1 1 121 302 (45 179)Equity Commercial Services - 2 344 696 (4 617)Equity Commercial Services - 3 280 914 22 963 Equity Commercial Services - 4 276 958 (1 884)Equity Commercial Services - 5 268 955 1 108 Equity Commercial Services - 6 168 352 (11 557)Equity Commercial Services - 7 166 319 460 Equity Commercial Services - 8 156 033 6 077 Equity Commercial Services - 9 147 582 (851)
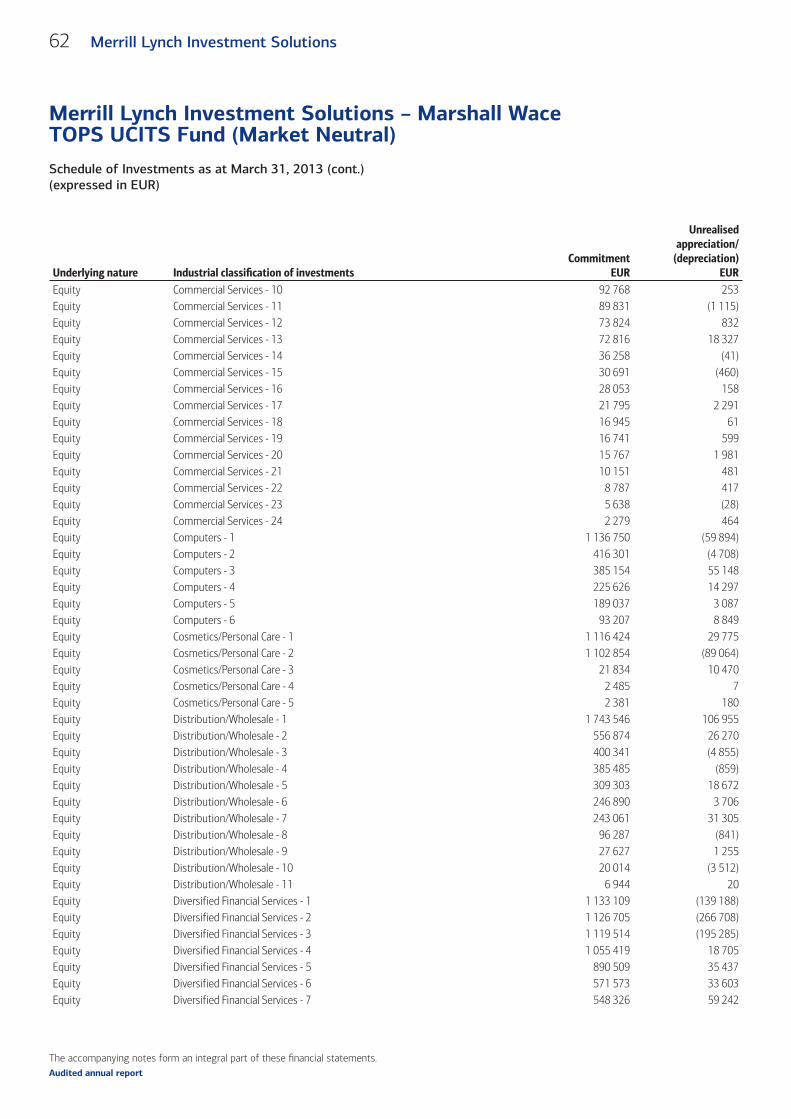
The accompanying notes form an integral part of these fi nancial statements.
Schedule of Investments as at March 31, 2013 (cont.)(expressed in EUR)
Merrill Lynch Investment Solutions – Marshall Wace TOPS UCITS Fund (Market Neutral)
62 Merrill Lynch Investment Solutions
Audited annual report
Underlying nature Industrial classifi cation of investmentsCommitment
EUR
Unrealised appreciation/
(depreciation)EUR
Equity Commercial Services - 10 92 768 253 Equity Commercial Services - 11 89 831 (1 115)Equity Commercial Services - 12 73 824 832 Equity Commercial Services - 13 72 816 18 327 Equity Commercial Services - 14 36 258 (41)Equity Commercial Services - 15 30 691 (460)Equity Commercial Services - 16 28 053 158 Equity Commercial Services - 17 21 795 2 291 Equity Commercial Services - 18 16 945 61 Equity Commercial Services - 19 16 741 599 Equity Commercial Services - 20 15 767 1 981 Equity Commercial Services - 21 10 151 481 Equity Commercial Services - 22 8 787 417 Equity Commercial Services - 23 5 638 (28)Equity Commercial Services - 24 2 279 464 Equity Computers - 1 1 136 750 (59 894)Equity Computers - 2 416 301 (4 708)Equity Computers - 3 385 154 55 148 Equity Computers - 4 225 626 14 297 Equity Computers - 5 189 037 3 087 Equity Computers - 6 93 207 8 849 Equity Cosmetics/Personal Care - 1 1 116 424 29 775 Equity Cosmetics/Personal Care - 2 1 102 854 (89 064)Equity Cosmetics/Personal Care - 3 21 834 10 470 Equity Cosmetics/Personal Care - 4 2 485 7 Equity Cosmetics/Personal Care - 5 2 381 180 Equity Distribution/Wholesale - 1 1 743 546 106 955 Equity Distribution/Wholesale - 2 556 874 26 270 Equity Distribution/Wholesale - 3 400 341 (4 855)Equity Distribution/Wholesale - 4 385 485 (859)Equity Distribution/Wholesale - 5 309 303 18 672 Equity Distribution/Wholesale - 6 246 890 3 706 Equity Distribution/Wholesale - 7 243 061 31 305 Equity Distribution/Wholesale - 8 96 287 (841)Equity Distribution/Wholesale - 9 27 627 1 255 Equity Distribution/Wholesale - 10 20 014 (3 512)Equity Distribution/Wholesale - 11 6 944 20 Equity Diversified Financial Services - 1 1 133 109 (139 188)Equity Diversified Financial Services - 2 1 126 705 (266 708)Equity Diversified Financial Services - 3 1 119 514 (195 285)Equity Diversified Financial Services - 4 1 055 419 18 705 Equity Diversified Financial Services - 5 890 509 35 437 Equity Diversified Financial Services - 6 571 573 33 603 Equity Diversified Financial Services - 7 548 326 59 242
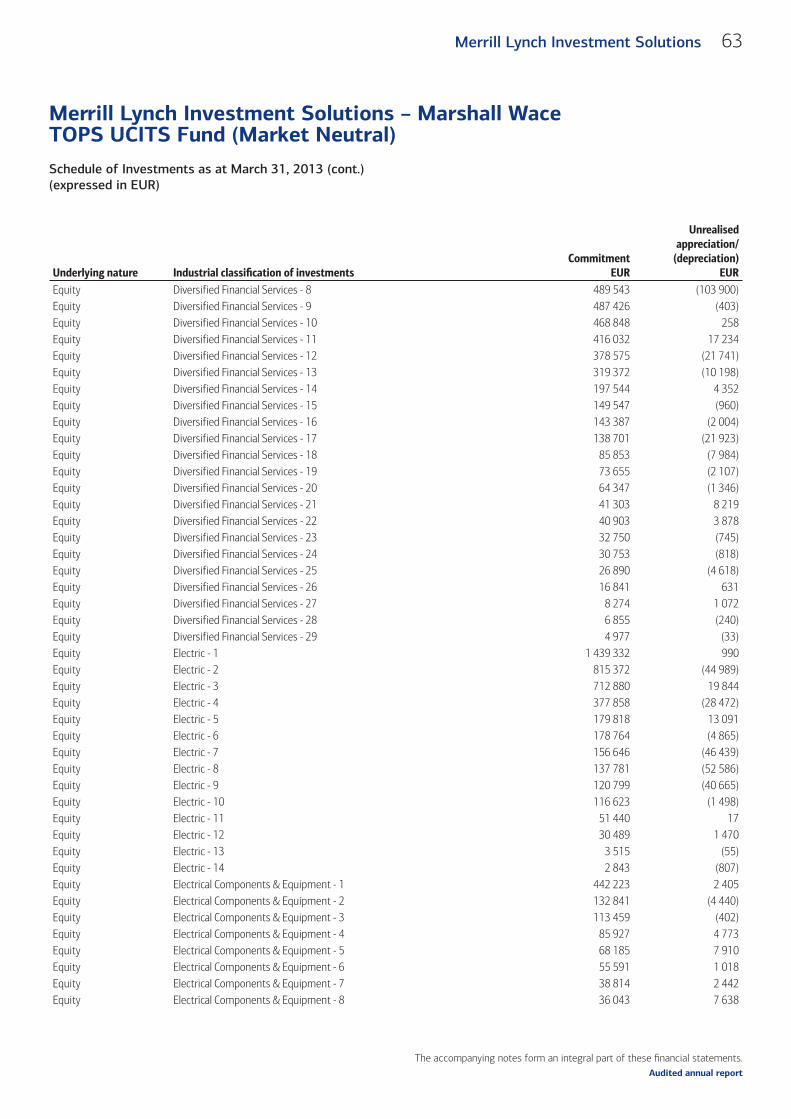
The accompanying notes form an integral part of these fi nancial statements.
Schedule of Investments as at March 31, 2013 (cont.)(expressed in EUR)
Merrill Lynch Investment Solutions – Marshall Wace TOPS UCITS Fund (Market Neutral)
63Merrill Lynch Investment Solutions
Audited annual report
Underlying nature Industrial classifi cation of investmentsCommitment
EUR
Unrealised appreciation/
(depreciation)EUR
Equity Diversified Financial Services - 8 489 543 (103 900)Equity Diversified Financial Services - 9 487 426 (403)Equity Diversified Financial Services - 10 468 848 258 Equity Diversified Financial Services - 11 416 032 17 234 Equity Diversified Financial Services - 12 378 575 (21 741)Equity Diversified Financial Services - 13 319 372 (10 198)Equity Diversified Financial Services - 14 197 544 4 352 Equity Diversified Financial Services - 15 149 547 (960)Equity Diversified Financial Services - 16 143 387 (2 004)Equity Diversified Financial Services - 17 138 701 (21 923)Equity Diversified Financial Services - 18 85 853 (7 984)Equity Diversified Financial Services - 19 73 655 (2 107)Equity Diversified Financial Services - 20 64 347 (1 346)Equity Diversified Financial Services - 21 41 303 8 219 Equity Diversified Financial Services - 22 40 903 3 878 Equity Diversified Financial Services - 23 32 750 (745)Equity Diversified Financial Services - 24 30 753 (818)Equity Diversified Financial Services - 25 26 890 (4 618)Equity Diversified Financial Services - 26 16 841 631 Equity Diversified Financial Services - 27 8 274 1 072 Equity Diversified Financial Services - 28 6 855 (240)Equity Diversified Financial Services - 29 4 977 (33)Equity Electric - 1 1 439 332 990 Equity Electric - 2 815 372 (44 989)Equity Electric - 3 712 880 19 844 Equity Electric - 4 377 858 (28 472)Equity Electric - 5 179 818 13 091 Equity Electric - 6 178 764 (4 865)Equity Electric - 7 156 646 (46 439)Equity Electric - 8 137 781 (52 586)Equity Electric - 9 120 799 (40 665)Equity Electric - 10 116 623 (1 498)Equity Electric - 11 51 440 17 Equity Electric - 12 30 489 1 470 Equity Electric - 13 3 515 (55)Equity Electric - 14 2 843 (807)Equity Electrical Components & Equipment - 1 442 223 2 405 Equity Electrical Components & Equipment - 2 132 841 (4 440)Equity Electrical Components & Equipment - 3 113 459 (402)Equity Electrical Components & Equipment - 4 85 927 4 773 Equity Electrical Components & Equipment - 5 68 185 7 910 Equity Electrical Components & Equipment - 6 55 591 1 018 Equity Electrical Components & Equipment - 7 38 814 2 442 Equity Electrical Components & Equipment - 8 36 043 7 638
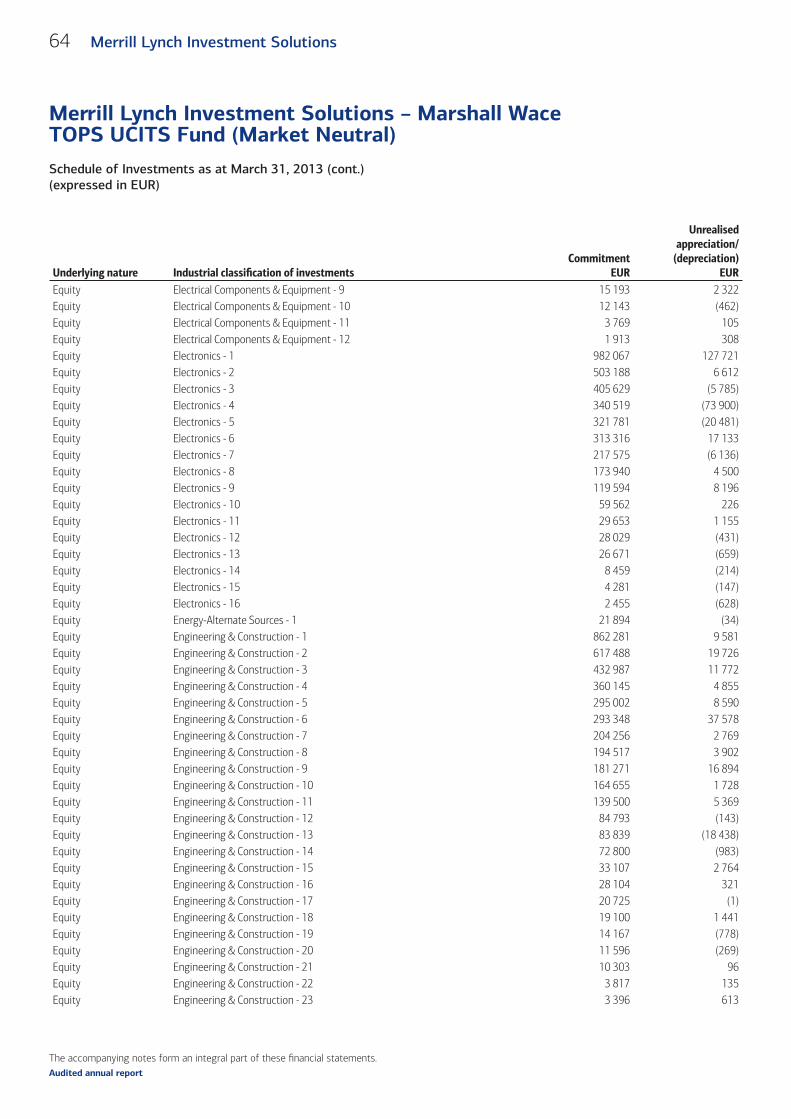
The accompanying notes form an integral part of these fi nancial statements.
Schedule of Investments as at March 31, 2013 (cont.)(expressed in EUR)
Merrill Lynch Investment Solutions – Marshall Wace TOPS UCITS Fund (Market Neutral)
64 Merrill Lynch Investment Solutions
Audited annual report
Underlying nature Industrial classifi cation of investmentsCommitment
EUR
Unrealised appreciation/
(depreciation)EUR
Equity Electrical Components & Equipment - 9 15 193 2 322 Equity Electrical Components & Equipment - 10 12 143 (462)Equity Electrical Components & Equipment - 11 3 769 105 Equity Electrical Components & Equipment - 12 1 913 308 Equity Electronics - 1 982 067 127 721 Equity Electronics - 2 503 188 6 612 Equity Electronics - 3 405 629 (5 785)Equity Electronics - 4 340 519 (73 900)Equity Electronics - 5 321 781 (20 481)Equity Electronics - 6 313 316 17 133 Equity Electronics - 7 217 575 (6 136)Equity Electronics - 8 173 940 4 500 Equity Electronics - 9 119 594 8 196 Equity Electronics - 10 59 562 226 Equity Electronics - 11 29 653 1 155 Equity Electronics - 12 28 029 (431)Equity Electronics - 13 26 671 (659)Equity Electronics - 14 8 459 (214)Equity Electronics - 15 4 281 (147)Equity Electronics - 16 2 455 (628)Equity Energy-Alternate Sources - 1 21 894 (34)Equity Engineering & Construction - 1 862 281 9 581 Equity Engineering & Construction - 2 617 488 19 726 Equity Engineering & Construction - 3 432 987 11 772 Equity Engineering & Construction - 4 360 145 4 855 Equity Engineering & Construction - 5 295 002 8 590 Equity Engineering & Construction - 6 293 348 37 578 Equity Engineering & Construction - 7 204 256 2 769 Equity Engineering & Construction - 8 194 517 3 902 Equity Engineering & Construction - 9 181 271 16 894 Equity Engineering & Construction - 10 164 655 1 728 Equity Engineering & Construction - 11 139 500 5 369 Equity Engineering & Construction - 12 84 793 (143)Equity Engineering & Construction - 13 83 839 (18 438)Equity Engineering & Construction - 14 72 800 (983)Equity Engineering & Construction - 15 33 107 2 764 Equity Engineering & Construction - 16 28 104 321 Equity Engineering & Construction - 17 20 725 (1)Equity Engineering & Construction - 18 19 100 1 441 Equity Engineering & Construction - 19 14 167 (778)Equity Engineering & Construction - 20 11 596 (269)Equity Engineering & Construction - 21 10 303 96 Equity Engineering & Construction - 22 3 817 135 Equity Engineering & Construction - 23 3 396 613
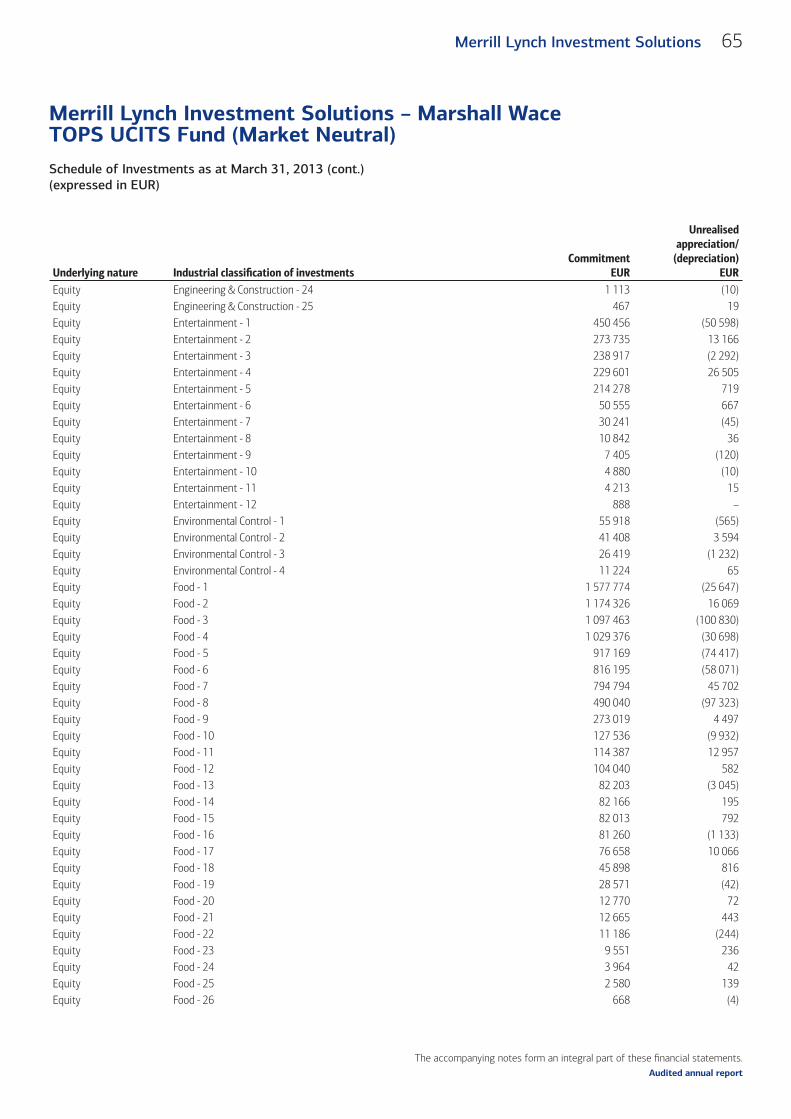
The accompanying notes form an integral part of these fi nancial statements.
Schedule of Investments as at March 31, 2013 (cont.)(expressed in EUR)
Merrill Lynch Investment Solutions – Marshall Wace TOPS UCITS Fund (Market Neutral)
65Merrill Lynch Investment Solutions
Audited annual report
Underlying nature Industrial classifi cation of investmentsCommitment
EUR
Unrealised appreciation/
(depreciation)EUR
Equity Engineering & Construction - 24 1 113 (10)Equity Engineering & Construction - 25 467 19 Equity Entertainment - 1 450 456 (50 598)Equity Entertainment - 2 273 735 13 166 Equity Entertainment - 3 238 917 (2 292)Equity Entertainment - 4 229 601 26 505 Equity Entertainment - 5 214 278 719 Equity Entertainment - 6 50 555 667 Equity Entertainment - 7 30 241 (45)Equity Entertainment - 8 10 842 36 Equity Entertainment - 9 7 405 (120)Equity Entertainment - 10 4 880 (10)Equity Entertainment - 11 4 213 15 Equity Entertainment - 12 888 – Equity Environmental Control - 1 55 918 (565)Equity Environmental Control - 2 41 408 3 594 Equity Environmental Control - 3 26 419 (1 232)Equity Environmental Control - 4 11 224 65 Equity Food - 1 1 577 774 (25 647)Equity Food - 2 1 174 326 16 069 Equity Food - 3 1 097 463 (100 830)Equity Food - 4 1 029 376 (30 698)Equity Food - 5 917 169 (74 417)Equity Food - 6 816 195 (58 071)Equity Food - 7 794 794 45 702 Equity Food - 8 490 040 (97 323)Equity Food - 9 273 019 4 497 Equity Food - 10 127 536 (9 932)Equity Food - 11 114 387 12 957 Equity Food - 12 104 040 582 Equity Food - 13 82 203 (3 045)Equity Food - 14 82 166 195 Equity Food - 15 82 013 792 Equity Food - 16 81 260 (1 133)Equity Food - 17 76 658 10 066 Equity Food - 18 45 898 816 Equity Food - 19 28 571 (42)Equity Food - 20 12 770 72 Equity Food - 21 12 665 443 Equity Food - 22 11 186 (244)Equity Food - 23 9 551 236 Equity Food - 24 3 964 42 Equity Food - 25 2 580 139 Equity Food - 26 668 (4)
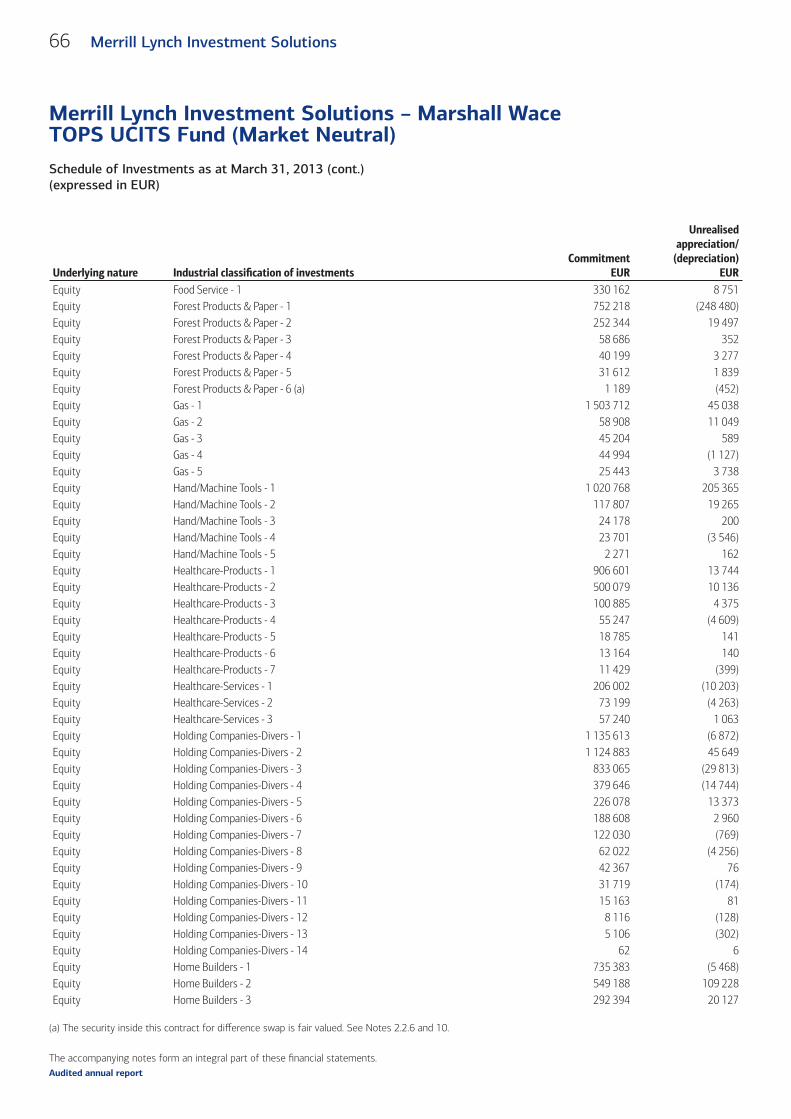
The accompanying notes form an integral part of these fi nancial statements.
Schedule of Investments as at March 31, 2013 (cont.)(expressed in EUR)
Merrill Lynch Investment Solutions – Marshall Wace TOPS UCITS Fund (Market Neutral)
66 Merrill Lynch Investment Solutions
Audited annual report
Underlying nature Industrial classifi cation of investmentsCommitment
EUR
Unrealised appreciation/
(depreciation)EUR
Equity Food Service - 1 330 162 8 751 Equity Forest Products & Paper - 1 752 218 (248 480)Equity Forest Products & Paper - 2 252 344 19 497 Equity Forest Products & Paper - 3 58 686 352 Equity Forest Products & Paper - 4 40 199 3 277 Equity Forest Products & Paper - 5 31 612 1 839 Equity Forest Products & Paper - 6 (a) 1 189 (452)Equity Gas - 1 1 503 712 45 038 Equity Gas - 2 58 908 11 049 Equity Gas - 3 45 204 589 Equity Gas - 4 44 994 (1 127)Equity Gas - 5 25 443 3 738 Equity Hand/Machine Tools - 1 1 020 768 205 365 Equity Hand/Machine Tools - 2 117 807 19 265 Equity Hand/Machine Tools - 3 24 178 200 Equity Hand/Machine Tools - 4 23 701 (3 546)Equity Hand/Machine Tools - 5 2 271 162 Equity Healthcare-Products - 1 906 601 13 744 Equity Healthcare-Products - 2 500 079 10 136 Equity Healthcare-Products - 3 100 885 4 375 Equity Healthcare-Products - 4 55 247 (4 609)Equity Healthcare-Products - 5 18 785 141 Equity Healthcare-Products - 6 13 164 140 Equity Healthcare-Products - 7 11 429 (399)Equity Healthcare-Services - 1 206 002 (10 203)Equity Healthcare-Services - 2 73 199 (4 263)Equity Healthcare-Services - 3 57 240 1 063 Equity Holding Companies-Divers - 1 1 135 613 (6 872)Equity Holding Companies-Divers - 2 1 124 883 45 649 Equity Holding Companies-Divers - 3 833 065 (29 813)Equity Holding Companies-Divers - 4 379 646 (14 744)Equity Holding Companies-Divers - 5 226 078 13 373 Equity Holding Companies-Divers - 6 188 608 2 960 Equity Holding Companies-Divers - 7 122 030 (769)Equity Holding Companies-Divers - 8 62 022 (4 256)Equity Holding Companies-Divers - 9 42 367 76 Equity Holding Companies-Divers - 10 31 719 (174)Equity Holding Companies-Divers - 11 15 163 81 Equity Holding Companies-Divers - 12 8 116 (128)Equity Holding Companies-Divers - 13 5 106 (302)Equity Holding Companies-Divers - 14 62 6 Equity Home Builders - 1 735 383 (5 468)Equity Home Builders - 2 549 188 109 228 Equity Home Builders - 3 292 394 20 127
(a) The security inside this contract for diff erence swap is fair valued. See Notes 2.2.6 and 10.
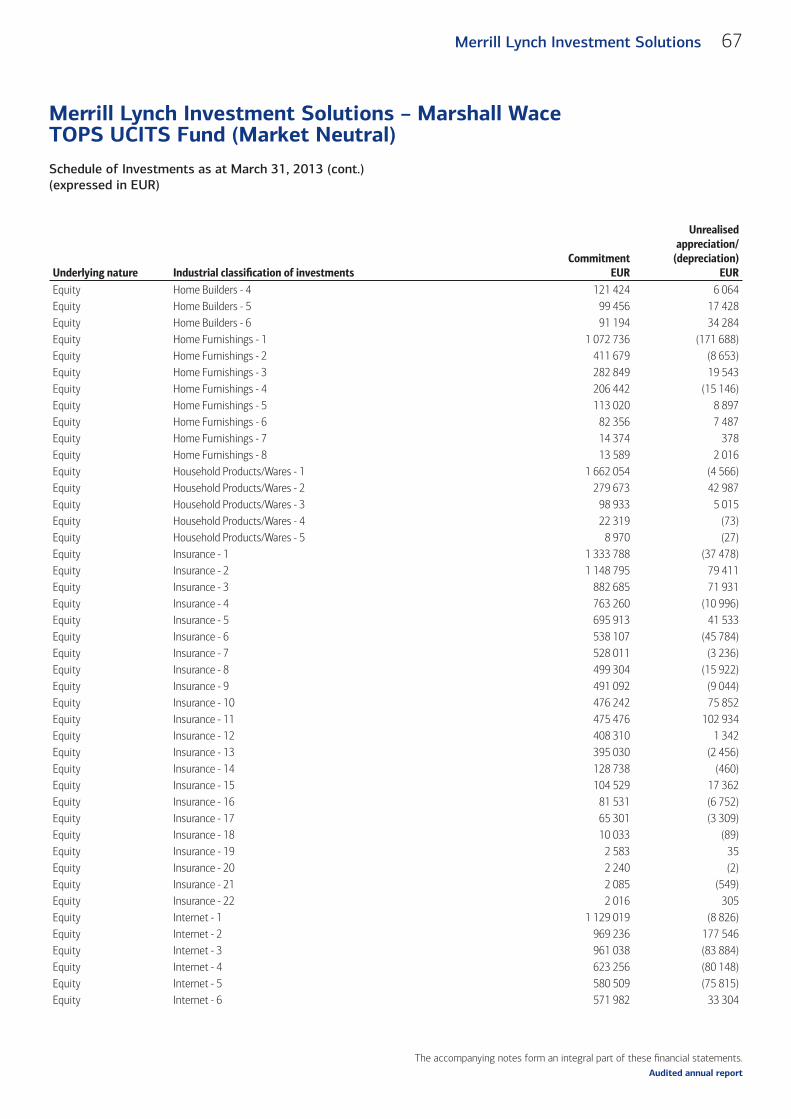
The accompanying notes form an integral part of these fi nancial statements.
Schedule of Investments as at March 31, 2013 (cont.)(expressed in EUR)
Merrill Lynch Investment Solutions – Marshall Wace TOPS UCITS Fund (Market Neutral)
67Merrill Lynch Investment Solutions
Audited annual report
Underlying nature Industrial classifi cation of investmentsCommitment
EUR
Unrealised appreciation/
(depreciation)EUR
Equity Home Builders - 4 121 424 6 064 Equity Home Builders - 5 99 456 17 428 Equity Home Builders - 6 91 194 34 284 Equity Home Furnishings - 1 1 072 736 (171 688)Equity Home Furnishings - 2 411 679 (8 653)Equity Home Furnishings - 3 282 849 19 543 Equity Home Furnishings - 4 206 442 (15 146)Equity Home Furnishings - 5 113 020 8 897 Equity Home Furnishings - 6 82 356 7 487 Equity Home Furnishings - 7 14 374 378 Equity Home Furnishings - 8 13 589 2 016 Equity Household Products/Wares - 1 1 662 054 (4 566)Equity Household Products/Wares - 2 279 673 42 987 Equity Household Products/Wares - 3 98 933 5 015 Equity Household Products/Wares - 4 22 319 (73)Equity Household Products/Wares - 5 8 970 (27)Equity Insurance - 1 1 333 788 (37 478)Equity Insurance - 2 1 148 795 79 411 Equity Insurance - 3 882 685 71 931 Equity Insurance - 4 763 260 (10 996)Equity Insurance - 5 695 913 41 533 Equity Insurance - 6 538 107 (45 784)Equity Insurance - 7 528 011 (3 236)Equity Insurance - 8 499 304 (15 922)Equity Insurance - 9 491 092 (9 044)Equity Insurance - 10 476 242 75 852 Equity Insurance - 11 475 476 102 934 Equity Insurance - 12 408 310 1 342 Equity Insurance - 13 395 030 (2 456)Equity Insurance - 14 128 738 (460)Equity Insurance - 15 104 529 17 362 Equity Insurance - 16 81 531 (6 752)Equity Insurance - 17 65 301 (3 309)Equity Insurance - 18 10 033 (89)Equity Insurance - 19 2 583 35 Equity Insurance - 20 2 240 (2)Equity Insurance - 21 2 085 (549)Equity Insurance - 22 2 016 305 Equity Internet - 1 1 129 019 (8 826)Equity Internet - 2 969 236 177 546 Equity Internet - 3 961 038 (83 884)Equity Internet - 4 623 256 (80 148)Equity Internet - 5 580 509 (75 815)Equity Internet - 6 571 982 33 304
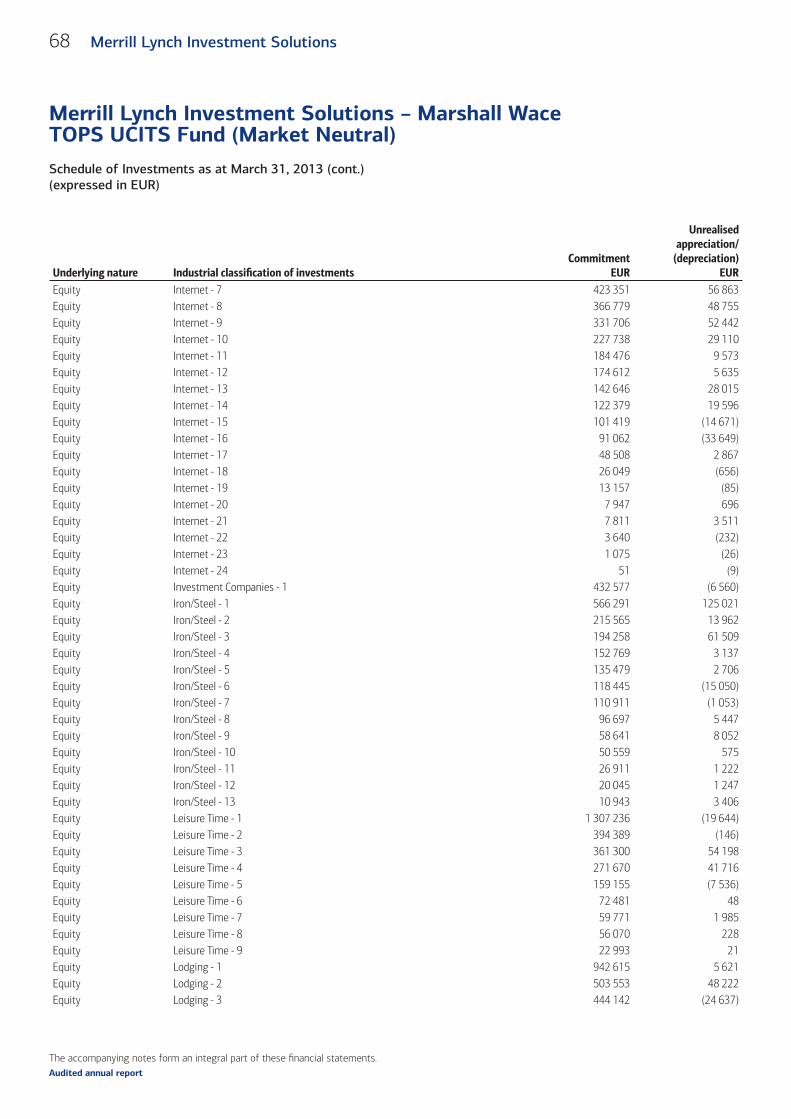
The accompanying notes form an integral part of these fi nancial statements.
Schedule of Investments as at March 31, 2013 (cont.)(expressed in EUR)
Merrill Lynch Investment Solutions – Marshall Wace TOPS UCITS Fund (Market Neutral)
68 Merrill Lynch Investment Solutions
Audited annual report
Underlying nature Industrial classifi cation of investmentsCommitment
EUR
Unrealised appreciation/
(depreciation)EUR
Equity Internet - 7 423 351 56 863 Equity Internet - 8 366 779 48 755 Equity Internet - 9 331 706 52 442 Equity Internet - 10 227 738 29 110 Equity Internet - 11 184 476 9 573 Equity Internet - 12 174 612 5 635 Equity Internet - 13 142 646 28 015 Equity Internet - 14 122 379 19 596 Equity Internet - 15 101 419 (14 671)Equity Internet - 16 91 062 (33 649)Equity Internet - 17 48 508 2 867 Equity Internet - 18 26 049 (656)Equity Internet - 19 13 157 (85)Equity Internet - 20 7 947 696 Equity Internet - 21 7 811 3 511 Equity Internet - 22 3 640 (232)Equity Internet - 23 1 075 (26)Equity Internet - 24 51 (9)Equity Investment Companies - 1 432 577 (6 560)Equity Iron/Steel - 1 566 291 125 021 Equity Iron/Steel - 2 215 565 13 962 Equity Iron/Steel - 3 194 258 61 509 Equity Iron/Steel - 4 152 769 3 137 Equity Iron/Steel - 5 135 479 2 706 Equity Iron/Steel - 6 118 445 (15 050)Equity Iron/Steel - 7 110 911 (1 053)Equity Iron/Steel - 8 96 697 5 447 Equity Iron/Steel - 9 58 641 8 052 Equity Iron/Steel - 10 50 559 575 Equity Iron/Steel - 11 26 911 1 222 Equity Iron/Steel - 12 20 045 1 247 Equity Iron/Steel - 13 10 943 3 406 Equity Leisure Time - 1 1 307 236 (19 644)Equity Leisure Time - 2 394 389 (146)Equity Leisure Time - 3 361 300 54 198 Equity Leisure Time - 4 271 670 41 716 Equity Leisure Time - 5 159 155 (7 536)Equity Leisure Time - 6 72 481 48 Equity Leisure Time - 7 59 771 1 985 Equity Leisure Time - 8 56 070 228 Equity Leisure Time - 9 22 993 21 Equity Lodging - 1 942 615 5 621 Equity Lodging - 2 503 553 48 222 Equity Lodging - 3 444 142 (24 637)
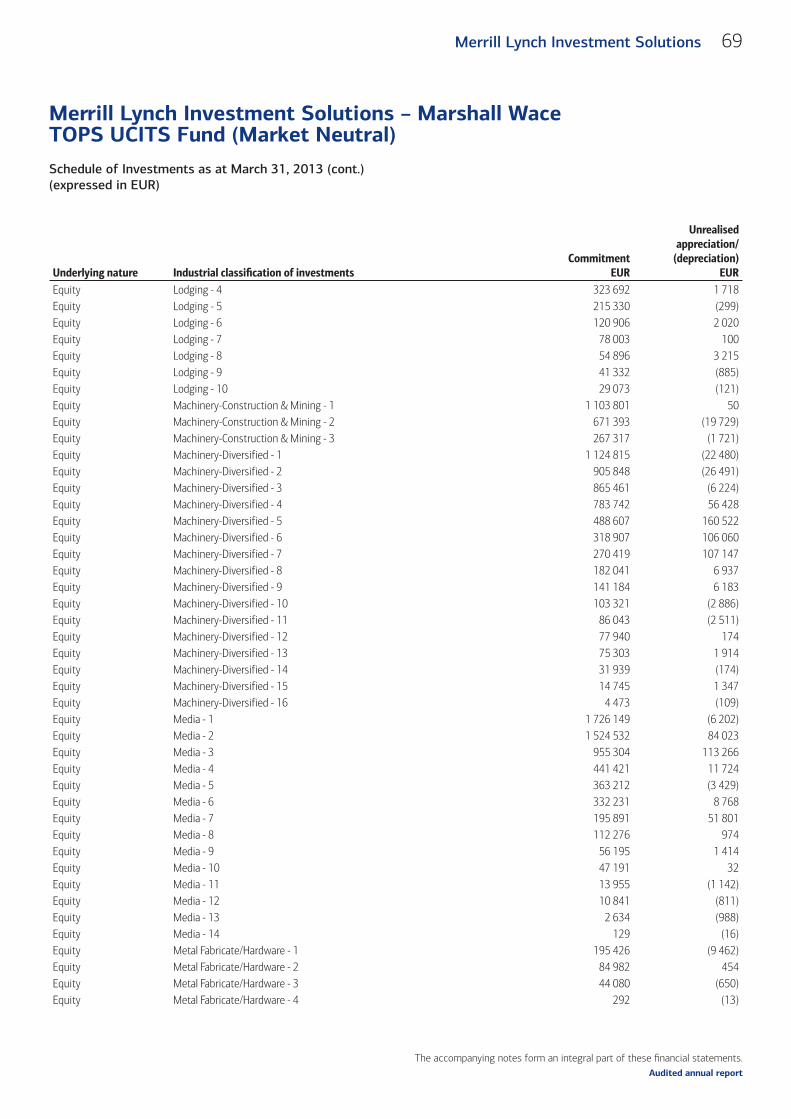
The accompanying notes form an integral part of these fi nancial statements.
Schedule of Investments as at March 31, 2013 (cont.)(expressed in EUR)
Merrill Lynch Investment Solutions – Marshall Wace TOPS UCITS Fund (Market Neutral)
69Merrill Lynch Investment Solutions
Audited annual report
Underlying nature Industrial classifi cation of investmentsCommitment
EUR
Unrealised appreciation/
(depreciation)EUR
Equity Lodging - 4 323 692 1 718 Equity Lodging - 5 215 330 (299)Equity Lodging - 6 120 906 2 020 Equity Lodging - 7 78 003 100 Equity Lodging - 8 54 896 3 215 Equity Lodging - 9 41 332 (885)Equity Lodging - 10 29 073 (121)Equity Machinery-Construction & Mining - 1 1 103 801 50 Equity Machinery-Construction & Mining - 2 671 393 (19 729)Equity Machinery-Construction & Mining - 3 267 317 (1 721)Equity Machinery-Diversified - 1 1 124 815 (22 480)Equity Machinery-Diversified - 2 905 848 (26 491)Equity Machinery-Diversified - 3 865 461 (6 224)Equity Machinery-Diversified - 4 783 742 56 428 Equity Machinery-Diversified - 5 488 607 160 522 Equity Machinery-Diversified - 6 318 907 106 060 Equity Machinery-Diversified - 7 270 419 107 147 Equity Machinery-Diversified - 8 182 041 6 937 Equity Machinery-Diversified - 9 141 184 6 183 Equity Machinery-Diversified - 10 103 321 (2 886)Equity Machinery-Diversified - 11 86 043 (2 511)Equity Machinery-Diversified - 12 77 940 174 Equity Machinery-Diversified - 13 75 303 1 914 Equity Machinery-Diversified - 14 31 939 (174)Equity Machinery-Diversified - 15 14 745 1 347 Equity Machinery-Diversified - 16 4 473 (109)Equity Media - 1 1 726 149 (6 202)Equity Media - 2 1 524 532 84 023 Equity Media - 3 955 304 113 266 Equity Media - 4 441 421 11 724 Equity Media - 5 363 212 (3 429)Equity Media - 6 332 231 8 768 Equity Media - 7 195 891 51 801 Equity Media - 8 112 276 974 Equity Media - 9 56 195 1 414 Equity Media - 10 47 191 32 Equity Media - 11 13 955 (1 142)Equity Media - 12 10 841 (811)Equity Media - 13 2 634 (988)Equity Media - 14 129 (16)Equity Metal Fabricate/Hardware - 1 195 426 (9 462)Equity Metal Fabricate/Hardware - 2 84 982 454 Equity Metal Fabricate/Hardware - 3 44 080 (650)Equity Metal Fabricate/Hardware - 4 292 (13)
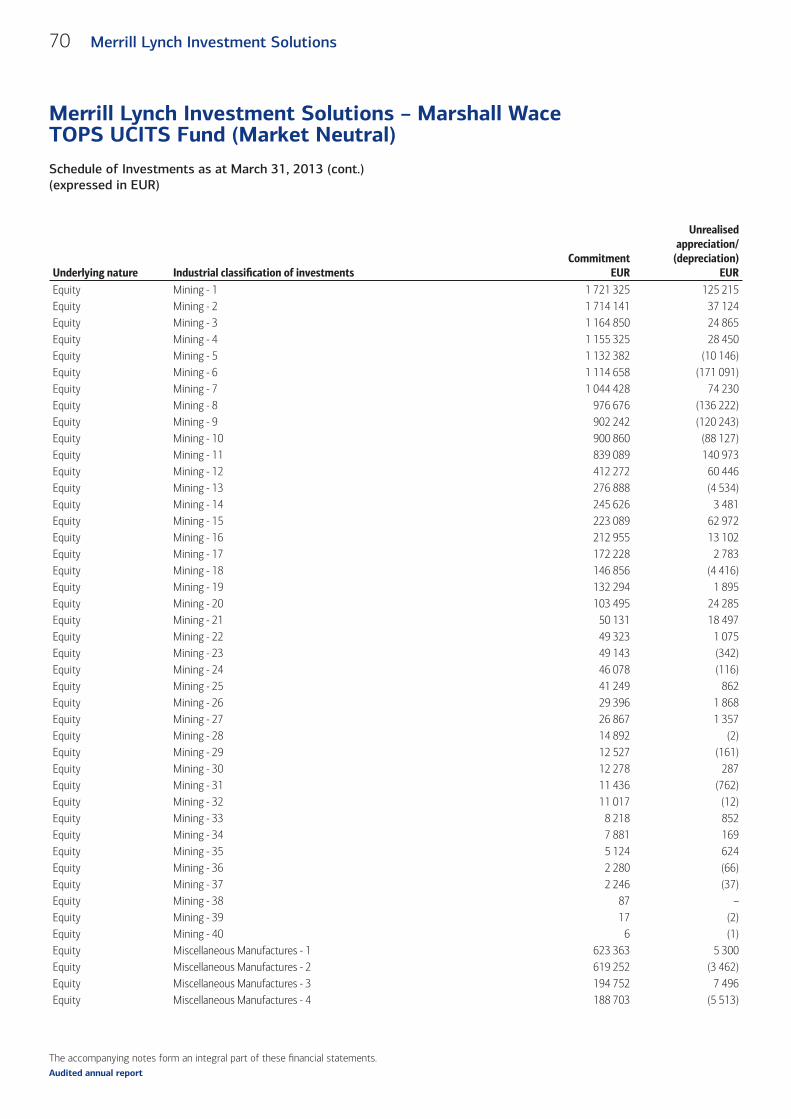
The accompanying notes form an integral part of these fi nancial statements.
Schedule of Investments as at March 31, 2013 (cont.)(expressed in EUR)
Merrill Lynch Investment Solutions – Marshall Wace TOPS UCITS Fund (Market Neutral)
70 Merrill Lynch Investment Solutions
Audited annual report
Underlying nature Industrial classifi cation of investmentsCommitment
EUR
Unrealised appreciation/
(depreciation)EUR
Equity Mining - 1 1 721 325 125 215 Equity Mining - 2 1 714 141 37 124 Equity Mining - 3 1 164 850 24 865 Equity Mining - 4 1 155 325 28 450 Equity Mining - 5 1 132 382 (10 146)Equity Mining - 6 1 114 658 (171 091)Equity Mining - 7 1 044 428 74 230 Equity Mining - 8 976 676 (136 222)Equity Mining - 9 902 242 (120 243)Equity Mining - 10 900 860 (88 127)Equity Mining - 11 839 089 140 973 Equity Mining - 12 412 272 60 446 Equity Mining - 13 276 888 (4 534)Equity Mining - 14 245 626 3 481 Equity Mining - 15 223 089 62 972 Equity Mining - 16 212 955 13 102 Equity Mining - 17 172 228 2 783 Equity Mining - 18 146 856 (4 416)Equity Mining - 19 132 294 1 895 Equity Mining - 20 103 495 24 285 Equity Mining - 21 50 131 18 497 Equity Mining - 22 49 323 1 075 Equity Mining - 23 49 143 (342)Equity Mining - 24 46 078 (116)Equity Mining - 25 41 249 862 Equity Mining - 26 29 396 1 868 Equity Mining - 27 26 867 1 357 Equity Mining - 28 14 892 (2)Equity Mining - 29 12 527 (161)Equity Mining - 30 12 278 287 Equity Mining - 31 11 436 (762)Equity Mining - 32 11 017 (12)Equity Mining - 33 8 218 852 Equity Mining - 34 7 881 169 Equity Mining - 35 5 124 624 Equity Mining - 36 2 280 (66)Equity Mining - 37 2 246 (37)Equity Mining - 38 87 – Equity Mining - 39 17 (2)Equity Mining - 40 6 (1)Equity Miscellaneous Manufactures - 1 623 363 5 300 Equity Miscellaneous Manufactures - 2 619 252 (3 462)Equity Miscellaneous Manufactures - 3 194 752 7 496 Equity Miscellaneous Manufactures - 4 188 703 (5 513)
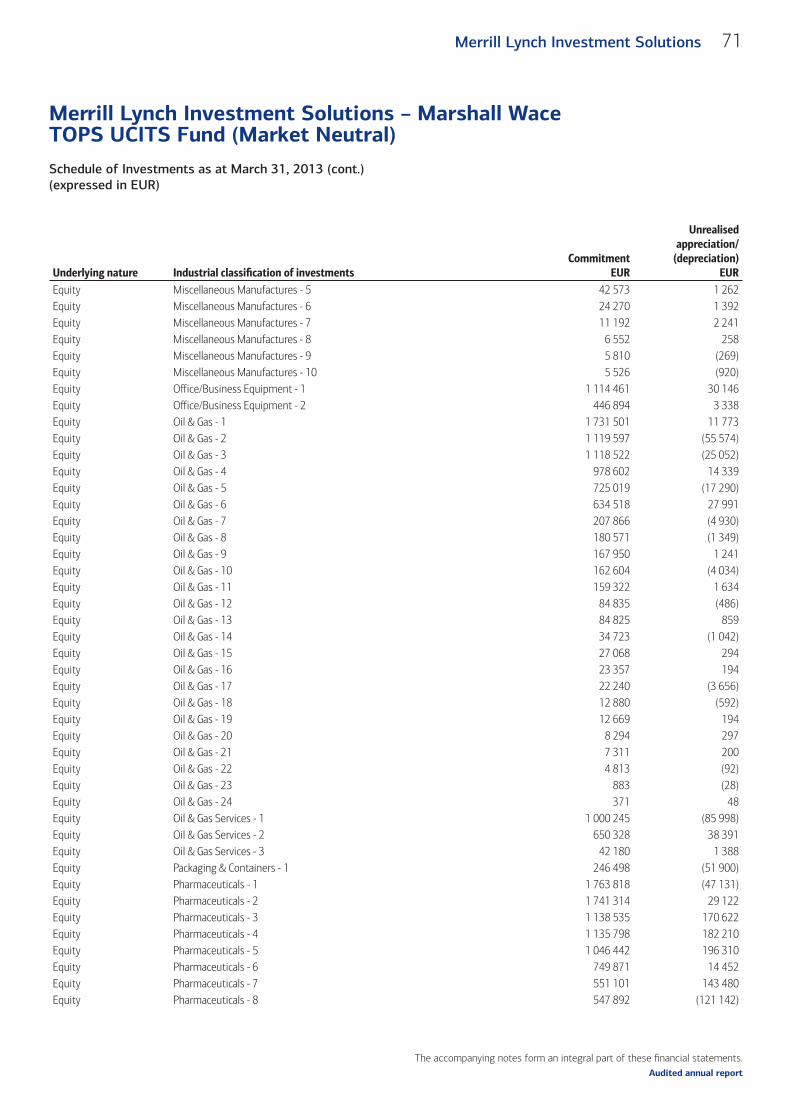
The accompanying notes form an integral part of these fi nancial statements.
Schedule of Investments as at March 31, 2013 (cont.)(expressed in EUR)
Merrill Lynch Investment Solutions – Marshall Wace TOPS UCITS Fund (Market Neutral)
71Merrill Lynch Investment Solutions
Audited annual report
Underlying nature Industrial classifi cation of investmentsCommitment
EUR
Unrealised appreciation/
(depreciation)EUR
Equity Miscellaneous Manufactures - 5 42 573 1 262 Equity Miscellaneous Manufactures - 6 24 270 1 392 Equity Miscellaneous Manufactures - 7 11 192 2 241 Equity Miscellaneous Manufactures - 8 6 552 258 Equity Miscellaneous Manufactures - 9 5 810 (269)Equity Miscellaneous Manufactures - 10 5 526 (920)Equity Office/Business Equipment - 1 1 114 461 30 146 Equity Office/Business Equipment - 2 446 894 3 338 Equity Oil & Gas - 1 1 731 501 11 773 Equity Oil & Gas - 2 1 119 597 (55 574)Equity Oil & Gas - 3 1 118 522 (25 052)Equity Oil & Gas - 4 978 602 14 339 Equity Oil & Gas - 5 725 019 (17 290)Equity Oil & Gas - 6 634 518 27 991 Equity Oil & Gas - 7 207 866 (4 930)Equity Oil & Gas - 8 180 571 (1 349)Equity Oil & Gas - 9 167 950 1 241 Equity Oil & Gas - 10 162 604 (4 034)Equity Oil & Gas - 11 159 322 1 634 Equity Oil & Gas - 12 84 835 (486)Equity Oil & Gas - 13 84 825 859 Equity Oil & Gas - 14 34 723 (1 042)Equity Oil & Gas - 15 27 068 294 Equity Oil & Gas - 16 23 357 194 Equity Oil & Gas - 17 22 240 (3 656)Equity Oil & Gas - 18 12 880 (592)Equity Oil & Gas - 19 12 669 194 Equity Oil & Gas - 20 8 294 297 Equity Oil & Gas - 21 7 311 200 Equity Oil & Gas - 22 4 813 (92)Equity Oil & Gas - 23 883 (28)Equity Oil & Gas - 24 371 48 Equity Oil & Gas Services - 1 1 000 245 (85 998)Equity Oil & Gas Services - 2 650 328 38 391 Equity Oil & Gas Services - 3 42 180 1 388 Equity Packaging & Containers - 1 246 498 (51 900)Equity Pharmaceuticals - 1 1 763 818 (47 131)Equity Pharmaceuticals - 2 1 741 314 29 122 Equity Pharmaceuticals - 3 1 138 535 170 622 Equity Pharmaceuticals - 4 1 135 798 182 210 Equity Pharmaceuticals - 5 1 046 442 196 310 Equity Pharmaceuticals - 6 749 871 14 452 Equity Pharmaceuticals - 7 551 101 143 480 Equity Pharmaceuticals - 8 547 892 (121 142)
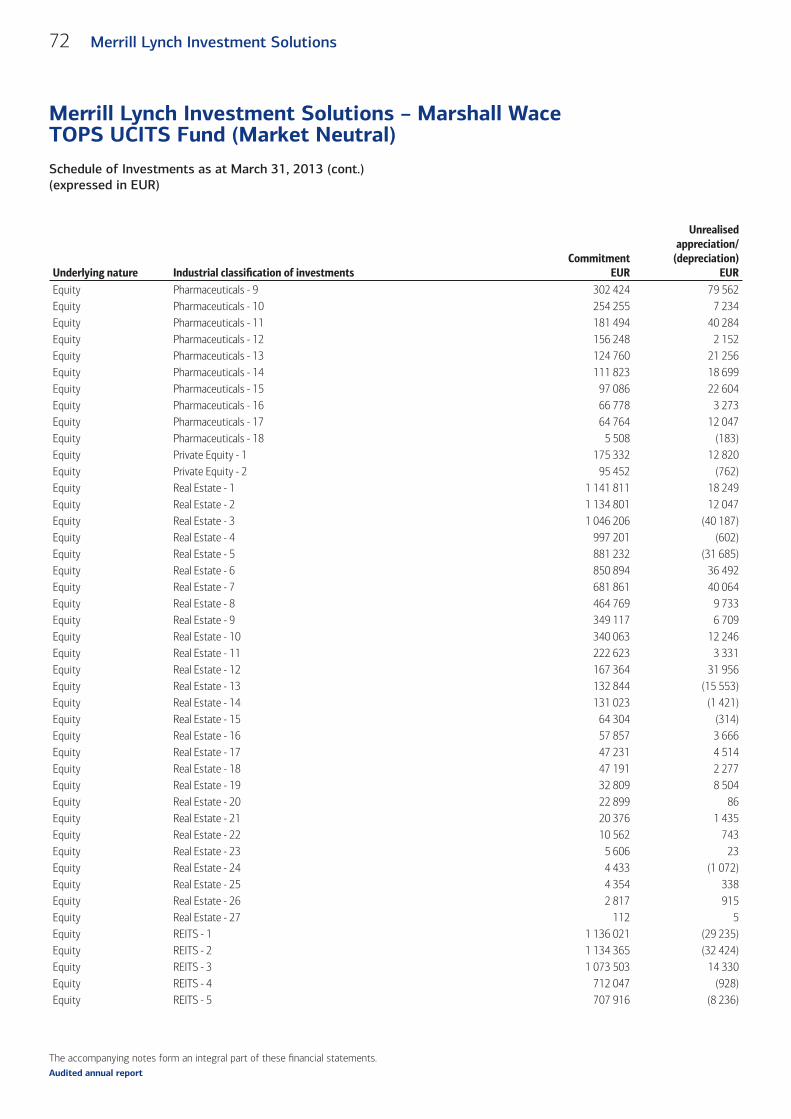
The accompanying notes form an integral part of these fi nancial statements.
Schedule of Investments as at March 31, 2013 (cont.)(expressed in EUR)
Merrill Lynch Investment Solutions – Marshall Wace TOPS UCITS Fund (Market Neutral)
72 Merrill Lynch Investment Solutions
Audited annual report
Underlying nature Industrial classifi cation of investmentsCommitment
EUR
Unrealised appreciation/
(depreciation)EUR
Equity Pharmaceuticals - 9 302 424 79 562 Equity Pharmaceuticals - 10 254 255 7 234 Equity Pharmaceuticals - 11 181 494 40 284 Equity Pharmaceuticals - 12 156 248 2 152 Equity Pharmaceuticals - 13 124 760 21 256 Equity Pharmaceuticals - 14 111 823 18 699 Equity Pharmaceuticals - 15 97 086 22 604 Equity Pharmaceuticals - 16 66 778 3 273 Equity Pharmaceuticals - 17 64 764 12 047 Equity Pharmaceuticals - 18 5 508 (183)Equity Private Equity - 1 175 332 12 820 Equity Private Equity - 2 95 452 (762)Equity Real Estate - 1 1 141 811 18 249 Equity Real Estate - 2 1 134 801 12 047 Equity Real Estate - 3 1 046 206 (40 187)Equity Real Estate - 4 997 201 (602)Equity Real Estate - 5 881 232 (31 685)Equity Real Estate - 6 850 894 36 492 Equity Real Estate - 7 681 861 40 064 Equity Real Estate - 8 464 769 9 733 Equity Real Estate - 9 349 117 6 709 Equity Real Estate - 10 340 063 12 246 Equity Real Estate - 11 222 623 3 331 Equity Real Estate - 12 167 364 31 956 Equity Real Estate - 13 132 844 (15 553)Equity Real Estate - 14 131 023 (1 421)Equity Real Estate - 15 64 304 (314)Equity Real Estate - 16 57 857 3 666 Equity Real Estate - 17 47 231 4 514 Equity Real Estate - 18 47 191 2 277 Equity Real Estate - 19 32 809 8 504 Equity Real Estate - 20 22 899 86 Equity Real Estate - 21 20 376 1 435 Equity Real Estate - 22 10 562 743 Equity Real Estate - 23 5 606 23 Equity Real Estate - 24 4 433 (1 072)Equity Real Estate - 25 4 354 338 Equity Real Estate - 26 2 817 915 Equity Real Estate - 27 112 5 Equity REITS - 1 1 136 021 (29 235)Equity REITS - 2 1 134 365 (32 424)Equity REITS - 3 1 073 503 14 330 Equity REITS - 4 712 047 (928)Equity REITS - 5 707 916 (8 236)
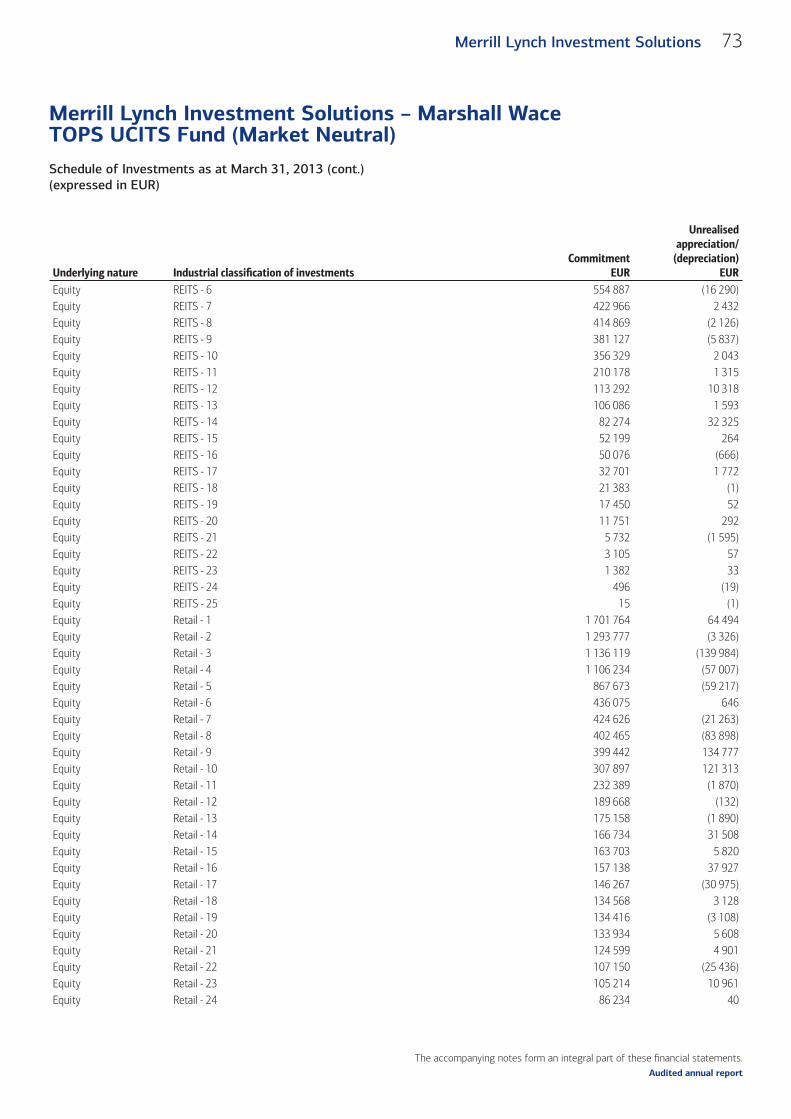
The accompanying notes form an integral part of these fi nancial statements.
Schedule of Investments as at March 31, 2013 (cont.)(expressed in EUR)
Merrill Lynch Investment Solutions – Marshall Wace TOPS UCITS Fund (Market Neutral)
73Merrill Lynch Investment Solutions
Audited annual report
Underlying nature Industrial classifi cation of investmentsCommitment
EUR
Unrealised appreciation/
(depreciation)EUR
Equity REITS - 6 554 887 (16 290)Equity REITS - 7 422 966 2 432 Equity REITS - 8 414 869 (2 126)Equity REITS - 9 381 127 (5 837)Equity REITS - 10 356 329 2 043 Equity REITS - 11 210 178 1 315 Equity REITS - 12 113 292 10 318 Equity REITS - 13 106 086 1 593 Equity REITS - 14 82 274 32 325 Equity REITS - 15 52 199 264 Equity REITS - 16 50 076 (666)Equity REITS - 17 32 701 1 772 Equity REITS - 18 21 383 (1)Equity REITS - 19 17 450 52 Equity REITS - 20 11 751 292 Equity REITS - 21 5 732 (1 595)Equity REITS - 22 3 105 57 Equity REITS - 23 1 382 33 Equity REITS - 24 496 (19)Equity REITS - 25 15 (1)Equity Retail - 1 1 701 764 64 494 Equity Retail - 2 1 293 777 (3 326)Equity Retail - 3 1 136 119 (139 984)Equity Retail - 4 1 106 234 (57 007)Equity Retail - 5 867 673 (59 217)Equity Retail - 6 436 075 646 Equity Retail - 7 424 626 (21 263)Equity Retail - 8 402 465 (83 898)Equity Retail - 9 399 442 134 777 Equity Retail - 10 307 897 121 313 Equity Retail - 11 232 389 (1 870)Equity Retail - 12 189 668 (132)Equity Retail - 13 175 158 (1 890)Equity Retail - 14 166 734 31 508 Equity Retail - 15 163 703 5 820 Equity Retail - 16 157 138 37 927 Equity Retail - 17 146 267 (30 975)Equity Retail - 18 134 568 3 128 Equity Retail - 19 134 416 (3 108)Equity Retail - 20 133 934 5 608 Equity Retail - 21 124 599 4 901 Equity Retail - 22 107 150 (25 436)Equity Retail - 23 105 214 10 961 Equity Retail - 24 86 234 40

The accompanying notes form an integral part of these fi nancial statements.
Schedule of Investments as at March 31, 2013 (cont.)(expressed in EUR)
Merrill Lynch Investment Solutions – Marshall Wace TOPS UCITS Fund (Market Neutral)
74 Merrill Lynch Investment Solutions
Audited annual report
Underlying nature Industrial classifi cation of investmentsCommitment
EUR
Unrealised appreciation/
(depreciation)EUR
Equity Retail - 25 70 621 (4 671)Equity Retail - 26 64 456 928 Equity Retail - 27 64 117 (13 285)Equity Retail - 28 55 730 1 798 Equity Retail - 29 54 821 (2 648)Equity Retail - 30 52 819 2 752 Equity Retail - 31 50 288 (318)Equity Retail - 32 48 765 (17 021)Equity Retail - 33 48 565 775 Equity Retail - 34 38 425 488 Equity Retail - 35 24 149 2 167 Equity Retail - 36 12 259 (23)Equity Retail - 37 11 331 629 Equity Retail - 38 9 330 (809)Equity Retail - 39 7 937 (39)Equity Retail - 40 7 765 1 082 Equity Retail - 41 6 593 33 Equity Retail - 42 6 025 (109)Equity Retail - 43 4 171 (605)Equity Retail - 44 3 665 (959)Equity Retail - 45 2 985 101 Equity Retail - 46 2 809 877 Equity Retail - 47 2 413 193 Equity Retail - 48 2 197 (19)Equity Retail - 49 1 128 2 Equity Retail - 50 14 – Equity Retail - 51 10 – Equity Semiconductors - 1 1 343 049 (11 331)Equity Semiconductors - 2 208 207 9 022 Equity Semiconductors - 3 130 896 12 836 Equity Semiconductors - 4 115 931 7 696 Equity Semiconductors - 5 41 746 815 Equity Shipbuilding - 1 884 301 28 732 Equity Shipbuilding - 2 84 241 (20 537)Equity Shipbuilding - 3 54 915 6 488 Equity Software - 1 444 449 120 555 Equity Software - 2 120 148 (3 602)Equity Software - 3 74 924 4 537 Equity Software - 4 68 389 1 183 Equity Software - 5 30 733 8 270 Equity Software - 6 9 318 399 Equity Software - 7 5 839 (102)Equity Telecommunications - 1 1 127 465 (41 241)Equity Telecommunications - 2 1 069 694 (20 942)
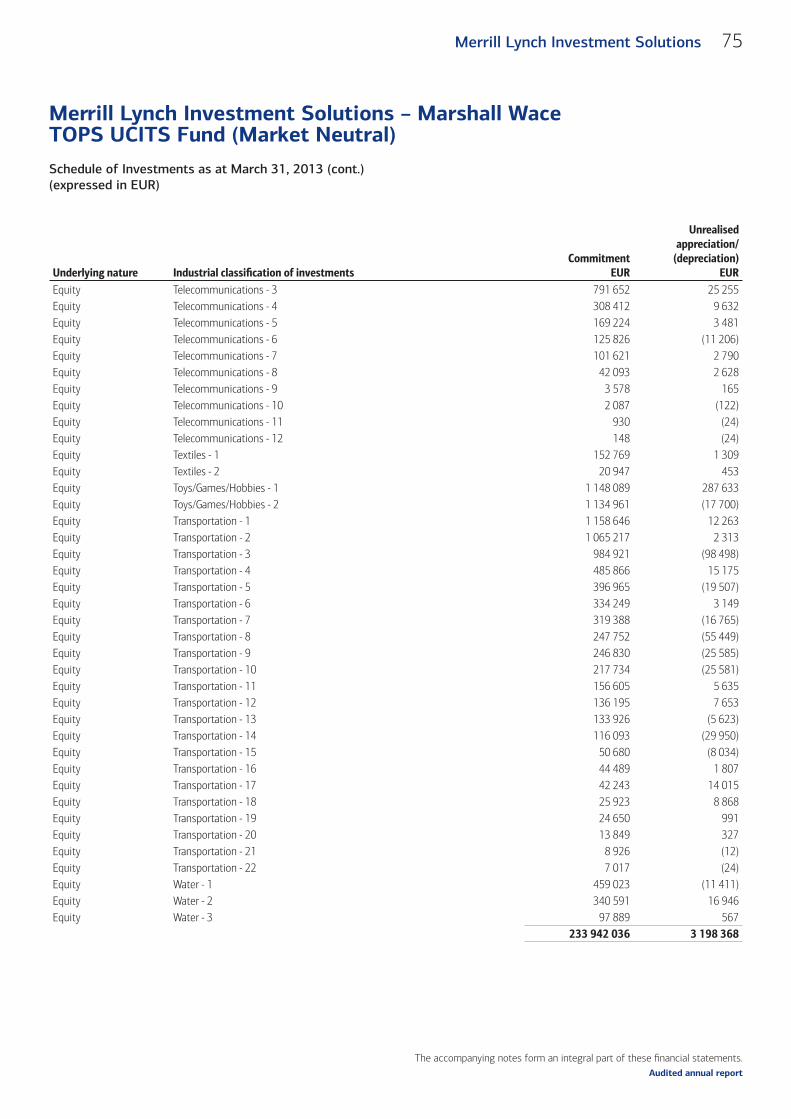
The accompanying notes form an integral part of these fi nancial statements.
Schedule of Investments as at March 31, 2013 (cont.)(expressed in EUR)
Merrill Lynch Investment Solutions – Marshall Wace TOPS UCITS Fund (Market Neutral)
75Merrill Lynch Investment Solutions
Audited annual report
Underlying nature Industrial classifi cation of investmentsCommitment
EUR
Unrealised appreciation/
(depreciation)EUR
Equity Telecommunications - 3 791 652 25 255 Equity Telecommunications - 4 308 412 9 632 Equity Telecommunications - 5 169 224 3 481 Equity Telecommunications - 6 125 826 (11 206)Equity Telecommunications - 7 101 621 2 790 Equity Telecommunications - 8 42 093 2 628 Equity Telecommunications - 9 3 578 165 Equity Telecommunications - 10 2 087 (122)Equity Telecommunications - 11 930 (24)Equity Telecommunications - 12 148 (24)Equity Textiles - 1 152 769 1 309 Equity Textiles - 2 20 947 453 Equity Toys/Games/Hobbies - 1 1 148 089 287 633 Equity Toys/Games/Hobbies - 2 1 134 961 (17 700)Equity Transportation - 1 1 158 646 12 263 Equity Transportation - 2 1 065 217 2 313 Equity Transportation - 3 984 921 (98 498)Equity Transportation - 4 485 866 15 175 Equity Transportation - 5 396 965 (19 507)Equity Transportation - 6 334 249 3 149 Equity Transportation - 7 319 388 (16 765)Equity Transportation - 8 247 752 (55 449)Equity Transportation - 9 246 830 (25 585)Equity Transportation - 10 217 734 (25 581)Equity Transportation - 11 156 605 5 635 Equity Transportation - 12 136 195 7 653 Equity Transportation - 13 133 926 (5 623)Equity Transportation - 14 116 093 (29 950)Equity Transportation - 15 50 680 (8 034)Equity Transportation - 16 44 489 1 807 Equity Transportation - 17 42 243 14 015 Equity Transportation - 18 25 923 8 868 Equity Transportation - 19 24 650 991 Equity Transportation - 20 13 849 327 Equity Transportation - 21 8 926 (12)Equity Transportation - 22 7 017 (24)Equity Water - 1 459 023 (11 411)Equity Water - 2 340 591 16 946 Equity Water - 3 97 889 567
233 942 036 3 198 368
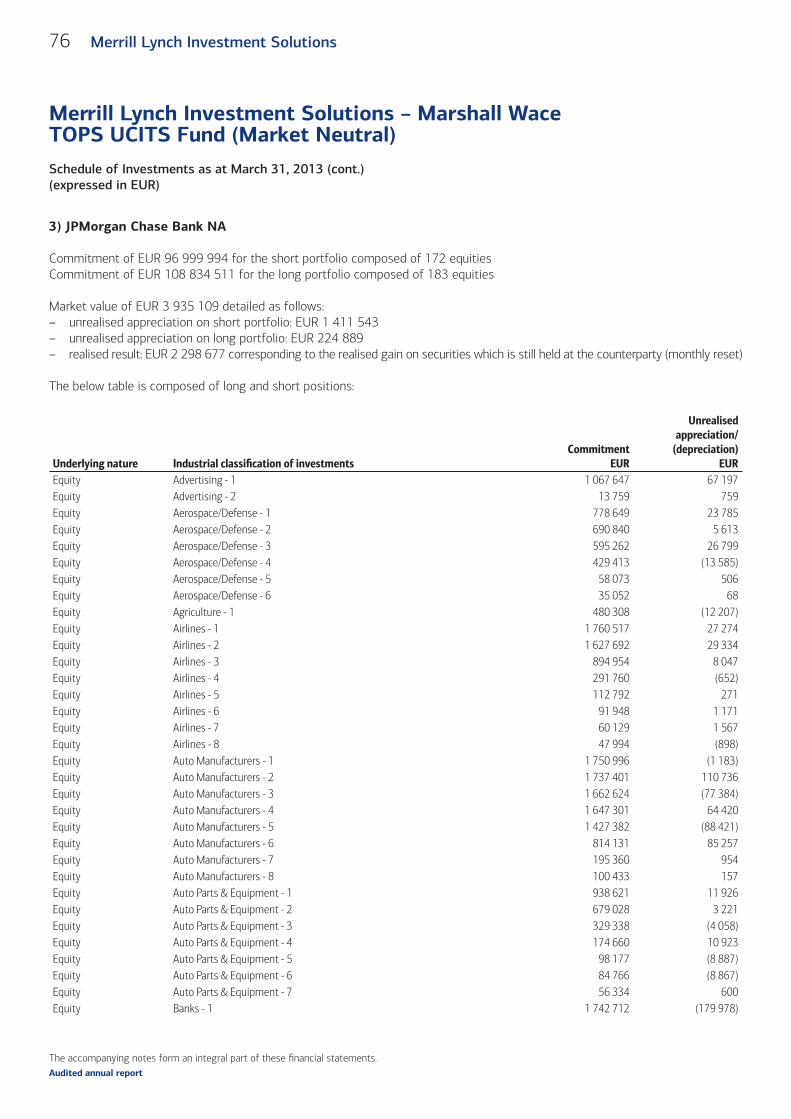
The accompanying notes form an integral part of these fi nancial statements.
Schedule of Investments as at March 31, 2013 (cont.)(expressed in EUR)
Merrill Lynch Investment Solutions – Marshall Wace TOPS UCITS Fund (Market Neutral)
76 Merrill Lynch Investment Solutions
Audited annual report
3) JPMorgan Chase Bank NA
Commitment of EUR 96 999 994 for the short portfolio composed of 172 equitiesCommitment of EUR 108 834 511 for the long portfolio composed of 183 equities
Market value of EUR 3 935 109 detailed as follows:– unrealised appreciation on short portfolio: EUR 1 411 543– unrealised appreciation on long portfolio: EUR 224 889– realised result: EUR 2 298 677 corresponding to the realised gain on securities which is still held at the counterparty (monthly reset)
The below table is composed of long and short positions:
Underlying nature Industrial classifi cation of investments Commitment
EUR
Unrealised appreciation/
(depreciation)EUR
Equity Advertising - 1 1 067 647 67 197 Equity Advertising - 2 13 759 759 Equity Aerospace/Defense - 1 778 649 23 785 Equity Aerospace/Defense - 2 690 840 5 613 Equity Aerospace/Defense - 3 595 262 26 799 Equity Aerospace/Defense - 4 429 413 (13 585)Equity Aerospace/Defense - 5 58 073 506 Equity Aerospace/Defense - 6 35 052 68 Equity Agriculture - 1 480 308 (12 207)Equity Airlines - 1 1 760 517 27 274 Equity Airlines - 2 1 627 692 29 334 Equity Airlines - 3 894 954 8 047 Equity Airlines - 4 291 760 (652)Equity Airlines - 5 112 792 271 Equity Airlines - 6 91 948 1 171 Equity Airlines - 7 60 129 1 567 Equity Airlines - 8 47 994 (898)Equity Auto Manufacturers - 1 1 750 996 (1 183)Equity Auto Manufacturers - 2 1 737 401 110 736 Equity Auto Manufacturers - 3 1 662 624 (77 384)Equity Auto Manufacturers - 4 1 647 301 64 420 Equity Auto Manufacturers - 5 1 427 382 (88 421)Equity Auto Manufacturers - 6 814 131 85 257 Equity Auto Manufacturers - 7 195 360 954 Equity Auto Manufacturers - 8 100 433 157 Equity Auto Parts & Equipment - 1 938 621 11 926 Equity Auto Parts & Equipment - 2 679 028 3 221 Equity Auto Parts & Equipment - 3 329 338 (4 058)Equity Auto Parts & Equipment - 4 174 660 10 923 Equity Auto Parts & Equipment - 5 98 177 (8 887)Equity Auto Parts & Equipment - 6 84 766 (8 867)Equity Auto Parts & Equipment - 7 56 334 600 Equity Banks - 1 1 742 712 (179 978)
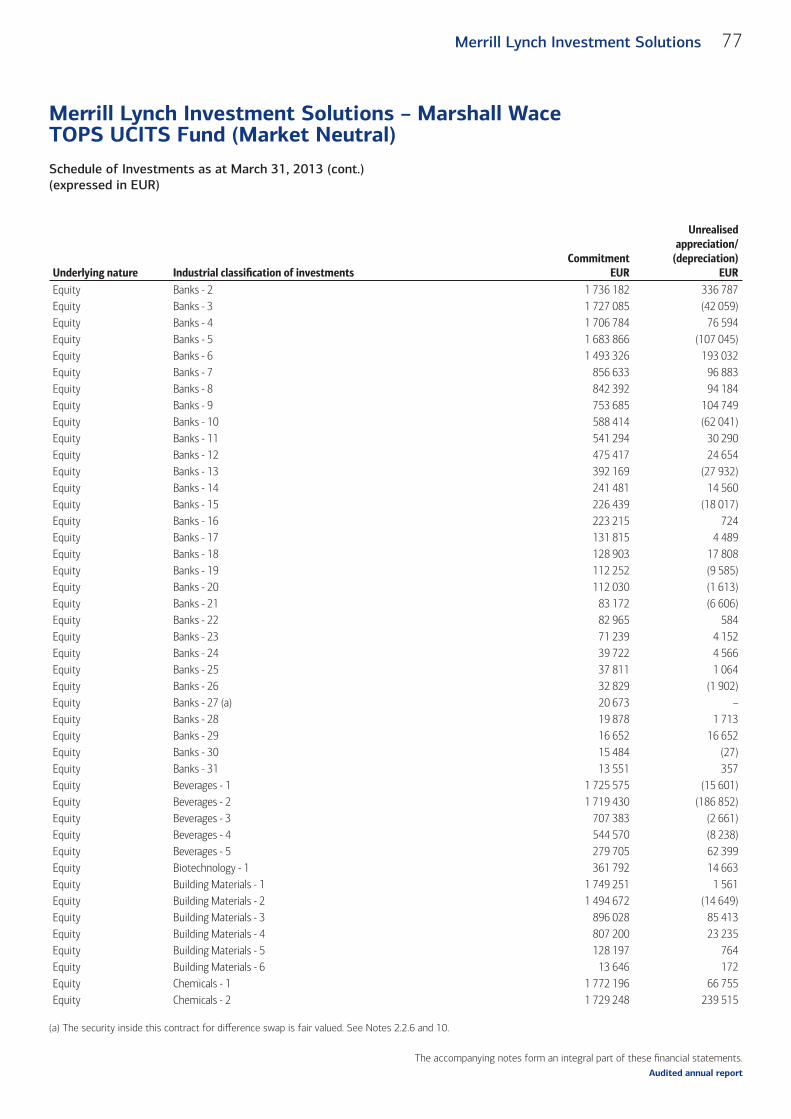
The accompanying notes form an integral part of these fi nancial statements.
Schedule of Investments as at March 31, 2013 (cont.)(expressed in EUR)
Merrill Lynch Investment Solutions – Marshall Wace TOPS UCITS Fund (Market Neutral)
77Merrill Lynch Investment Solutions
Audited annual report
Underlying nature Industrial classifi cation of investments Commitment
EUR
Unrealised appreciation/
(depreciation)EUR
Equity Banks - 2 1 736 182 336 787 Equity Banks - 3 1 727 085 (42 059)Equity Banks - 4 1 706 784 76 594 Equity Banks - 5 1 683 866 (107 045)Equity Banks - 6 1 493 326 193 032 Equity Banks - 7 856 633 96 883 Equity Banks - 8 842 392 94 184 Equity Banks - 9 753 685 104 749 Equity Banks - 10 588 414 (62 041)Equity Banks - 11 541 294 30 290 Equity Banks - 12 475 417 24 654 Equity Banks - 13 392 169 (27 932)Equity Banks - 14 241 481 14 560 Equity Banks - 15 226 439 (18 017)Equity Banks - 16 223 215 724 Equity Banks - 17 131 815 4 489 Equity Banks - 18 128 903 17 808 Equity Banks - 19 112 252 (9 585)Equity Banks - 20 112 030 (1 613)Equity Banks - 21 83 172 (6 606)Equity Banks - 22 82 965 584 Equity Banks - 23 71 239 4 152 Equity Banks - 24 39 722 4 566 Equity Banks - 25 37 811 1 064 Equity Banks - 26 32 829 (1 902)Equity Banks - 27 (a) 20 673 – Equity Banks - 28 19 878 1 713 Equity Banks - 29 16 652 16 652 Equity Banks - 30 15 484 (27)Equity Banks - 31 13 551 357 Equity Beverages - 1 1 725 575 (15 601)Equity Beverages - 2 1 719 430 (186 852)Equity Beverages - 3 707 383 (2 661)Equity Beverages - 4 544 570 (8 238)Equity Beverages - 5 279 705 62 399 Equity Biotechnology - 1 361 792 14 663 Equity Building Materials - 1 1 749 251 1 561 Equity Building Materials - 2 1 494 672 (14 649)Equity Building Materials - 3 896 028 85 413 Equity Building Materials - 4 807 200 23 235 Equity Building Materials - 5 128 197 764 Equity Building Materials - 6 13 646 172 Equity Chemicals - 1 1 772 196 66 755 Equity Chemicals - 2 1 729 248 239 515
(a) The security inside this contract for diff erence swap is fair valued. See Notes 2.2.6 and 10.
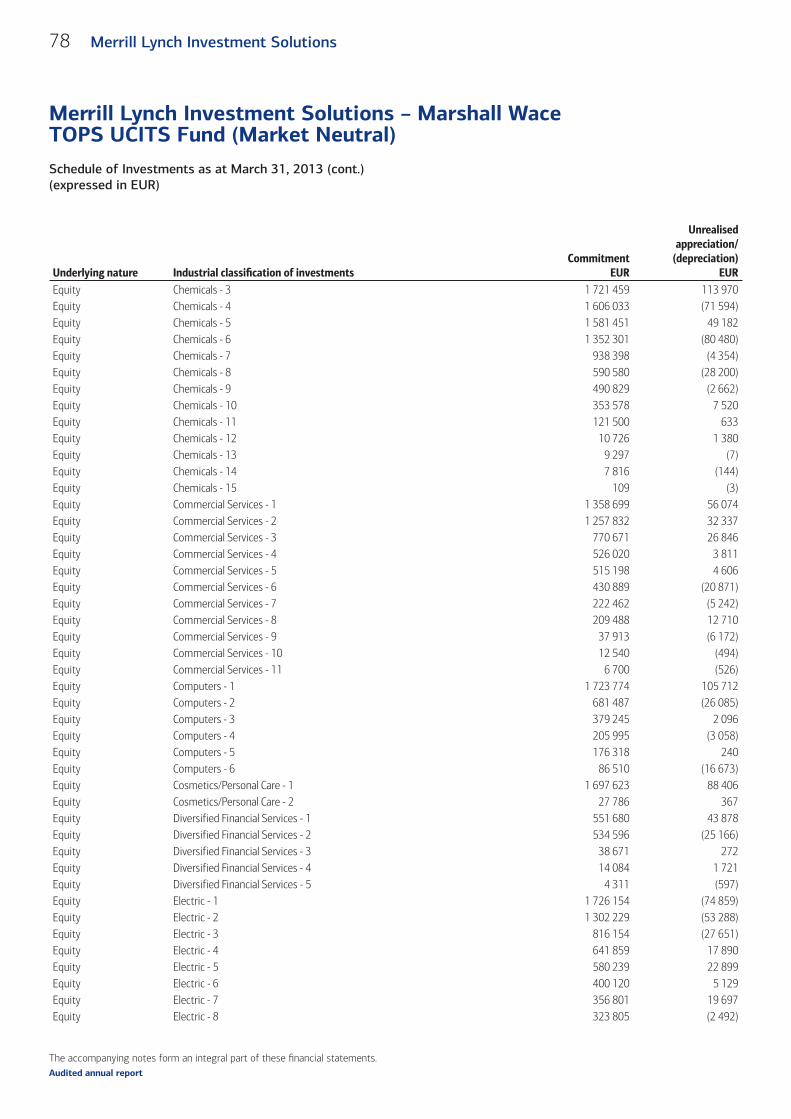
The accompanying notes form an integral part of these fi nancial statements.
Schedule of Investments as at March 31, 2013 (cont.)(expressed in EUR)
Merrill Lynch Investment Solutions – Marshall Wace TOPS UCITS Fund (Market Neutral)
78 Merrill Lynch Investment Solutions
Audited annual report
Underlying nature Industrial classifi cation of investments Commitment
EUR
Unrealised appreciation/
(depreciation)EUR
Equity Chemicals - 3 1 721 459 113 970 Equity Chemicals - 4 1 606 033 (71 594)Equity Chemicals - 5 1 581 451 49 182 Equity Chemicals - 6 1 352 301 (80 480)Equity Chemicals - 7 938 398 (4 354)Equity Chemicals - 8 590 580 (28 200)Equity Chemicals - 9 490 829 (2 662)Equity Chemicals - 10 353 578 7 520 Equity Chemicals - 11 121 500 633 Equity Chemicals - 12 10 726 1 380 Equity Chemicals - 13 9 297 (7)Equity Chemicals - 14 7 816 (144)Equity Chemicals - 15 109 (3)Equity Commercial Services - 1 1 358 699 56 074 Equity Commercial Services - 2 1 257 832 32 337 Equity Commercial Services - 3 770 671 26 846 Equity Commercial Services - 4 526 020 3 811 Equity Commercial Services - 5 515 198 4 606 Equity Commercial Services - 6 430 889 (20 871)Equity Commercial Services - 7 222 462 (5 242)Equity Commercial Services - 8 209 488 12 710 Equity Commercial Services - 9 37 913 (6 172)Equity Commercial Services - 10 12 540 (494)Equity Commercial Services - 11 6 700 (526)Equity Computers - 1 1 723 774 105 712 Equity Computers - 2 681 487 (26 085)Equity Computers - 3 379 245 2 096 Equity Computers - 4 205 995 (3 058)Equity Computers - 5 176 318 240 Equity Computers - 6 86 510 (16 673)Equity Cosmetics/Personal Care - 1 1 697 623 88 406 Equity Cosmetics/Personal Care - 2 27 786 367 Equity Diversified Financial Services - 1 551 680 43 878 Equity Diversified Financial Services - 2 534 596 (25 166)Equity Diversified Financial Services - 3 38 671 272 Equity Diversified Financial Services - 4 14 084 1 721 Equity Diversified Financial Services - 5 4 311 (597)Equity Electric - 1 1 726 154 (74 859)Equity Electric - 2 1 302 229 (53 288)Equity Electric - 3 816 154 (27 651)Equity Electric - 4 641 859 17 890 Equity Electric - 5 580 239 22 899 Equity Electric - 6 400 120 5 129 Equity Electric - 7 356 801 19 697 Equity Electric - 8 323 805 (2 492)
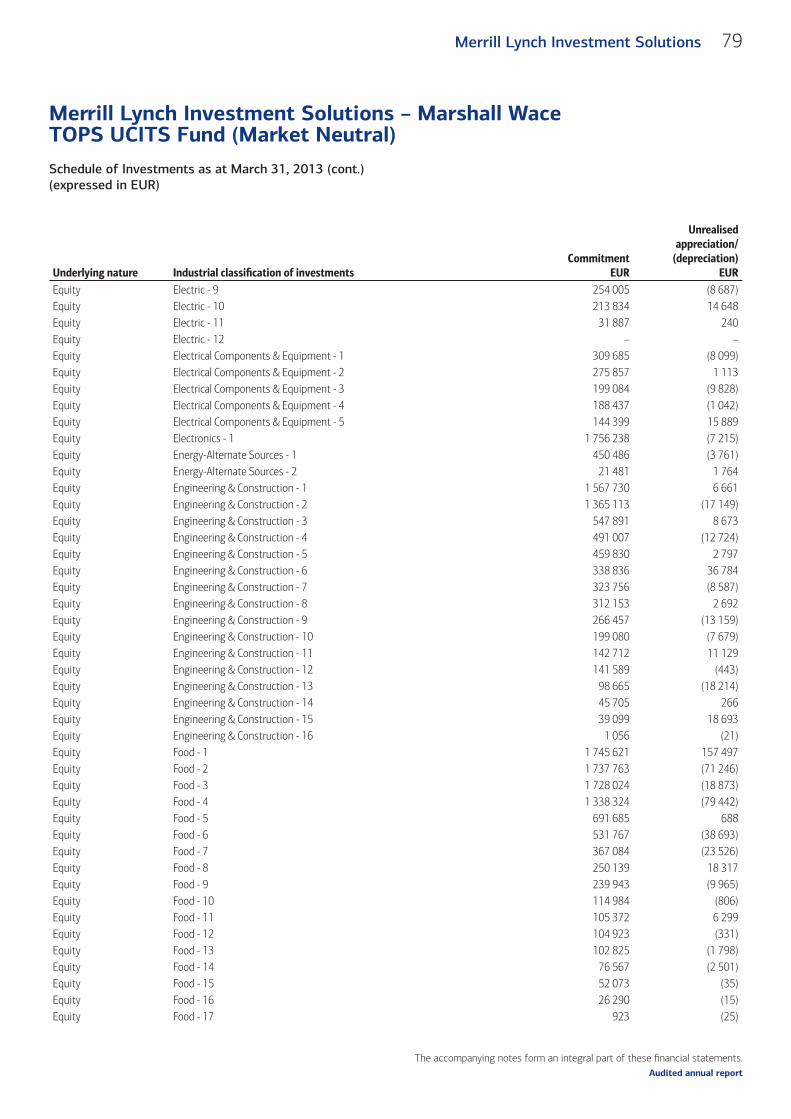
The accompanying notes form an integral part of these fi nancial statements.
Schedule of Investments as at March 31, 2013 (cont.)(expressed in EUR)
Merrill Lynch Investment Solutions – Marshall Wace TOPS UCITS Fund (Market Neutral)
79Merrill Lynch Investment Solutions
Audited annual report
Underlying nature Industrial classifi cation of investments Commitment
EUR
Unrealised appreciation/
(depreciation)EUR
Equity Electric - 9 254 005 (8 687)Equity Electric - 10 213 834 14 648 Equity Electric - 11 31 887 240 Equity Electric - 12 – – Equity Electrical Components & Equipment - 1 309 685 (8 099)Equity Electrical Components & Equipment - 2 275 857 1 113 Equity Electrical Components & Equipment - 3 199 084 (9 828)Equity Electrical Components & Equipment - 4 188 437 (1 042)Equity Electrical Components & Equipment - 5 144 399 15 889 Equity Electronics - 1 1 756 238 (7 215)Equity Energy-Alternate Sources - 1 450 486 (3 761)Equity Energy-Alternate Sources - 2 21 481 1 764 Equity Engineering & Construction - 1 1 567 730 6 661 Equity Engineering & Construction - 2 1 365 113 (17 149)Equity Engineering & Construction - 3 547 891 8 673 Equity Engineering & Construction - 4 491 007 (12 724)Equity Engineering & Construction - 5 459 830 2 797 Equity Engineering & Construction - 6 338 836 36 784 Equity Engineering & Construction - 7 323 756 (8 587)Equity Engineering & Construction - 8 312 153 2 692 Equity Engineering & Construction - 9 266 457 (13 159)Equity Engineering & Construction - 10 199 080 (7 679)Equity Engineering & Construction - 11 142 712 11 129 Equity Engineering & Construction - 12 141 589 (443)Equity Engineering & Construction - 13 98 665 (18 214)Equity Engineering & Construction - 14 45 705 266 Equity Engineering & Construction - 15 39 099 18 693 Equity Engineering & Construction - 16 1 056 (21)Equity Food - 1 1 745 621 157 497 Equity Food - 2 1 737 763 (71 246)Equity Food - 3 1 728 024 (18 873)Equity Food - 4 1 338 324 (79 442)Equity Food - 5 691 685 688 Equity Food - 6 531 767 (38 693)Equity Food - 7 367 084 (23 526)Equity Food - 8 250 139 18 317 Equity Food - 9 239 943 (9 965)Equity Food - 10 114 984 (806)Equity Food - 11 105 372 6 299 Equity Food - 12 104 923 (331)Equity Food - 13 102 825 (1 798)Equity Food - 14 76 567 (2 501)Equity Food - 15 52 073 (35)Equity Food - 16 26 290 (15)Equity Food - 17 923 (25)
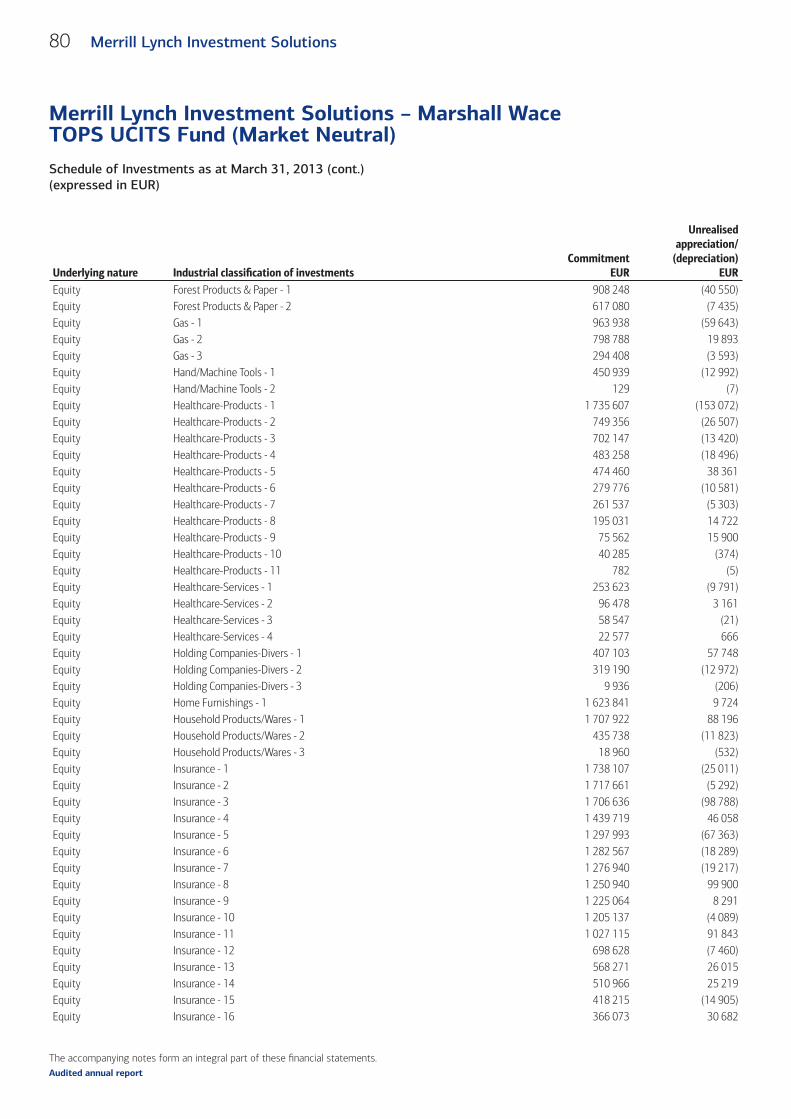
The accompanying notes form an integral part of these fi nancial statements.
Schedule of Investments as at March 31, 2013 (cont.)(expressed in EUR)
Merrill Lynch Investment Solutions – Marshall Wace TOPS UCITS Fund (Market Neutral)
80 Merrill Lynch Investment Solutions
Audited annual report
Underlying nature Industrial classifi cation of investments Commitment
EUR
Unrealised appreciation/
(depreciation)EUR
Equity Forest Products & Paper - 1 908 248 (40 550)Equity Forest Products & Paper - 2 617 080 (7 435)Equity Gas - 1 963 938 (59 643)Equity Gas - 2 798 788 19 893 Equity Gas - 3 294 408 (3 593)Equity Hand/Machine Tools - 1 450 939 (12 992)Equity Hand/Machine Tools - 2 129 (7)Equity Healthcare-Products - 1 1 735 607 (153 072)Equity Healthcare-Products - 2 749 356 (26 507)Equity Healthcare-Products - 3 702 147 (13 420)Equity Healthcare-Products - 4 483 258 (18 496)Equity Healthcare-Products - 5 474 460 38 361 Equity Healthcare-Products - 6 279 776 (10 581)Equity Healthcare-Products - 7 261 537 (5 303)Equity Healthcare-Products - 8 195 031 14 722 Equity Healthcare-Products - 9 75 562 15 900 Equity Healthcare-Products - 10 40 285 (374)Equity Healthcare-Products - 11 782 (5)Equity Healthcare-Services - 1 253 623 (9 791)Equity Healthcare-Services - 2 96 478 3 161 Equity Healthcare-Services - 3 58 547 (21)Equity Healthcare-Services - 4 22 577 666 Equity Holding Companies-Divers - 1 407 103 57 748 Equity Holding Companies-Divers - 2 319 190 (12 972)Equity Holding Companies-Divers - 3 9 936 (206)Equity Home Furnishings - 1 1 623 841 9 724 Equity Household Products/Wares - 1 1 707 922 88 196 Equity Household Products/Wares - 2 435 738 (11 823)Equity Household Products/Wares - 3 18 960 (532)Equity Insurance - 1 1 738 107 (25 011)Equity Insurance - 2 1 717 661 (5 292)Equity Insurance - 3 1 706 636 (98 788)Equity Insurance - 4 1 439 719 46 058 Equity Insurance - 5 1 297 993 (67 363)Equity Insurance - 6 1 282 567 (18 289)Equity Insurance - 7 1 276 940 (19 217)Equity Insurance - 8 1 250 940 99 900 Equity Insurance - 9 1 225 064 8 291 Equity Insurance - 10 1 205 137 (4 089)Equity Insurance - 11 1 027 115 91 843 Equity Insurance - 12 698 628 (7 460)Equity Insurance - 13 568 271 26 015 Equity Insurance - 14 510 966 25 219 Equity Insurance - 15 418 215 (14 905)Equity Insurance - 16 366 073 30 682
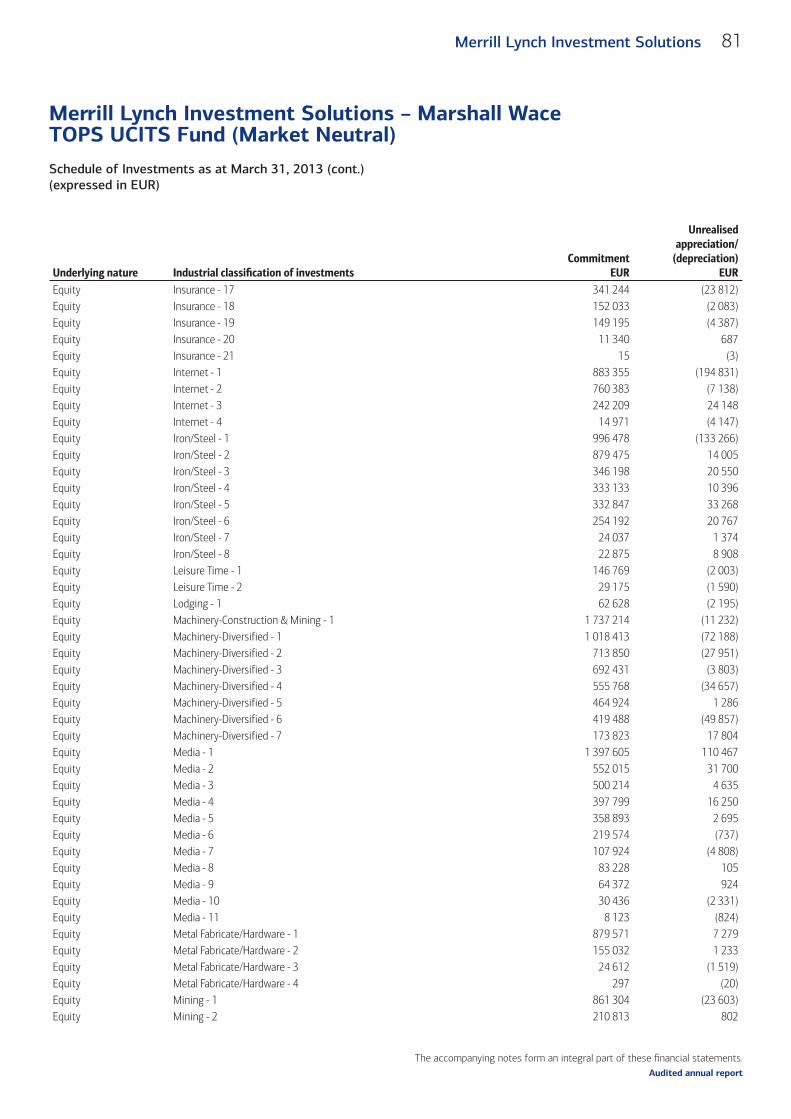
The accompanying notes form an integral part of these fi nancial statements.
Schedule of Investments as at March 31, 2013 (cont.)(expressed in EUR)
Merrill Lynch Investment Solutions – Marshall Wace TOPS UCITS Fund (Market Neutral)
81Merrill Lynch Investment Solutions
Audited annual report
Underlying nature Industrial classifi cation of investments Commitment
EUR
Unrealised appreciation/
(depreciation)EUR
Equity Insurance - 17 341 244 (23 812)Equity Insurance - 18 152 033 (2 083)Equity Insurance - 19 149 195 (4 387)Equity Insurance - 20 11 340 687 Equity Insurance - 21 15 (3)Equity Internet - 1 883 355 (194 831)Equity Internet - 2 760 383 (7 138)Equity Internet - 3 242 209 24 148 Equity Internet - 4 14 971 (4 147)Equity Iron/Steel - 1 996 478 (133 266)Equity Iron/Steel - 2 879 475 14 005 Equity Iron/Steel - 3 346 198 20 550 Equity Iron/Steel - 4 333 133 10 396 Equity Iron/Steel - 5 332 847 33 268 Equity Iron/Steel - 6 254 192 20 767 Equity Iron/Steel - 7 24 037 1 374 Equity Iron/Steel - 8 22 875 8 908 Equity Leisure Time - 1 146 769 (2 003)Equity Leisure Time - 2 29 175 (1 590)Equity Lodging - 1 62 628 (2 195)Equity Machinery-Construction & Mining - 1 1 737 214 (11 232)Equity Machinery-Diversified - 1 1 018 413 (72 188)Equity Machinery-Diversified - 2 713 850 (27 951)Equity Machinery-Diversified - 3 692 431 (3 803)Equity Machinery-Diversified - 4 555 768 (34 657)Equity Machinery-Diversified - 5 464 924 1 286 Equity Machinery-Diversified - 6 419 488 (49 857)Equity Machinery-Diversified - 7 173 823 17 804 Equity Media - 1 1 397 605 110 467 Equity Media - 2 552 015 31 700 Equity Media - 3 500 214 4 635 Equity Media - 4 397 799 16 250 Equity Media - 5 358 893 2 695 Equity Media - 6 219 574 (737)Equity Media - 7 107 924 (4 808)Equity Media - 8 83 228 105 Equity Media - 9 64 372 924 Equity Media - 10 30 436 (2 331)Equity Media - 11 8 123 (824)Equity Metal Fabricate/Hardware - 1 879 571 7 279 Equity Metal Fabricate/Hardware - 2 155 032 1 233 Equity Metal Fabricate/Hardware - 3 24 612 (1 519)Equity Metal Fabricate/Hardware - 4 297 (20)Equity Mining - 1 861 304 (23 603)Equity Mining - 2 210 813 802
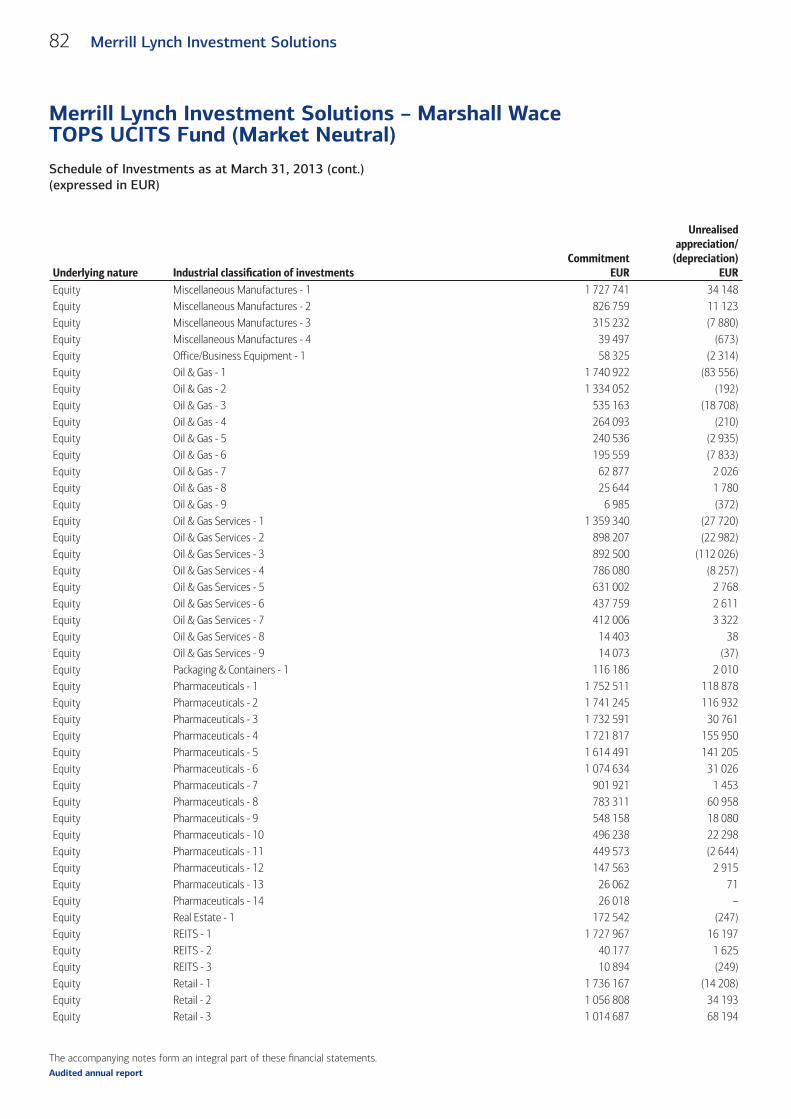
The accompanying notes form an integral part of these fi nancial statements.
Schedule of Investments as at March 31, 2013 (cont.)(expressed in EUR)
Merrill Lynch Investment Solutions – Marshall Wace TOPS UCITS Fund (Market Neutral)
82 Merrill Lynch Investment Solutions
Audited annual report
Underlying nature Industrial classifi cation of investments Commitment
EUR
Unrealised appreciation/
(depreciation)EUR
Equity Miscellaneous Manufactures - 1 1 727 741 34 148 Equity Miscellaneous Manufactures - 2 826 759 11 123 Equity Miscellaneous Manufactures - 3 315 232 (7 880)Equity Miscellaneous Manufactures - 4 39 497 (673)Equity Office/Business Equipment - 1 58 325 (2 314)Equity Oil & Gas - 1 1 740 922 (83 556)Equity Oil & Gas - 2 1 334 052 (192)Equity Oil & Gas - 3 535 163 (18 708)Equity Oil & Gas - 4 264 093 (210)Equity Oil & Gas - 5 240 536 (2 935)Equity Oil & Gas - 6 195 559 (7 833)Equity Oil & Gas - 7 62 877 2 026 Equity Oil & Gas - 8 25 644 1 780 Equity Oil & Gas - 9 6 985 (372)Equity Oil & Gas Services - 1 1 359 340 (27 720)Equity Oil & Gas Services - 2 898 207 (22 982)Equity Oil & Gas Services - 3 892 500 (112 026)Equity Oil & Gas Services - 4 786 080 (8 257)Equity Oil & Gas Services - 5 631 002 2 768 Equity Oil & Gas Services - 6 437 759 2 611 Equity Oil & Gas Services - 7 412 006 3 322 Equity Oil & Gas Services - 8 14 403 38 Equity Oil & Gas Services - 9 14 073 (37)Equity Packaging & Containers - 1 116 186 2 010 Equity Pharmaceuticals - 1 1 752 511 118 878 Equity Pharmaceuticals - 2 1 741 245 116 932 Equity Pharmaceuticals - 3 1 732 591 30 761 Equity Pharmaceuticals - 4 1 721 817 155 950 Equity Pharmaceuticals - 5 1 614 491 141 205 Equity Pharmaceuticals - 6 1 074 634 31 026 Equity Pharmaceuticals - 7 901 921 1 453 Equity Pharmaceuticals - 8 783 311 60 958 Equity Pharmaceuticals - 9 548 158 18 080 Equity Pharmaceuticals - 10 496 238 22 298 Equity Pharmaceuticals - 11 449 573 (2 644)Equity Pharmaceuticals - 12 147 563 2 915 Equity Pharmaceuticals - 13 26 062 71 Equity Pharmaceuticals - 14 26 018 – Equity Real Estate - 1 172 542 (247)Equity REITS - 1 1 727 967 16 197 Equity REITS - 2 40 177 1 625 Equity REITS - 3 10 894 (249)Equity Retail - 1 1 736 167 (14 208)Equity Retail - 2 1 056 808 34 193 Equity Retail - 3 1 014 687 68 194
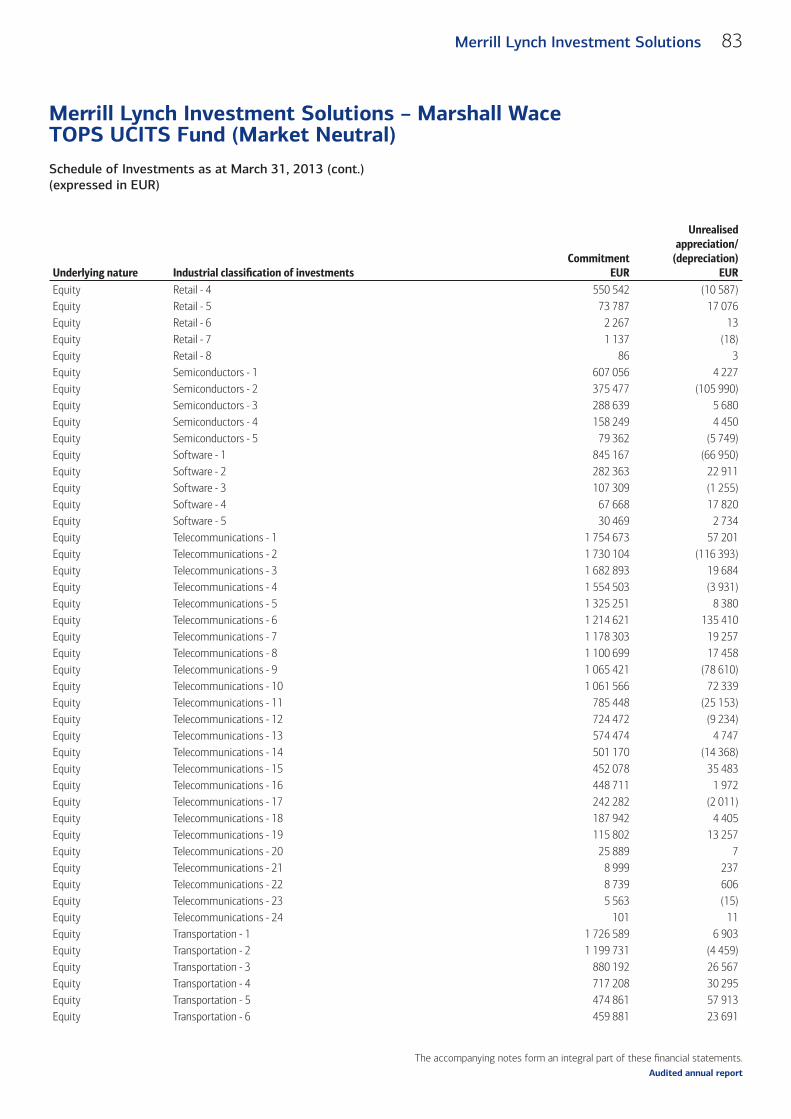
The accompanying notes form an integral part of these fi nancial statements.
Schedule of Investments as at March 31, 2013 (cont.)(expressed in EUR)
Merrill Lynch Investment Solutions – Marshall Wace TOPS UCITS Fund (Market Neutral)
83Merrill Lynch Investment Solutions
Audited annual report
Underlying nature Industrial classifi cation of investments Commitment
EUR
Unrealised appreciation/
(depreciation)EUR
Equity Retail - 4 550 542 (10 587)Equity Retail - 5 73 787 17 076 Equity Retail - 6 2 267 13 Equity Retail - 7 1 137 (18)Equity Retail - 8 86 3 Equity Semiconductors - 1 607 056 4 227 Equity Semiconductors - 2 375 477 (105 990)Equity Semiconductors - 3 288 639 5 680 Equity Semiconductors - 4 158 249 4 450 Equity Semiconductors - 5 79 362 (5 749)Equity Software - 1 845 167 (66 950)Equity Software - 2 282 363 22 911 Equity Software - 3 107 309 (1 255)Equity Software - 4 67 668 17 820 Equity Software - 5 30 469 2 734 Equity Telecommunications - 1 1 754 673 57 201 Equity Telecommunications - 2 1 730 104 (116 393)Equity Telecommunications - 3 1 682 893 19 684 Equity Telecommunications - 4 1 554 503 (3 931)Equity Telecommunications - 5 1 325 251 8 380 Equity Telecommunications - 6 1 214 621 135 410 Equity Telecommunications - 7 1 178 303 19 257 Equity Telecommunications - 8 1 100 699 17 458 Equity Telecommunications - 9 1 065 421 (78 610)Equity Telecommunications - 10 1 061 566 72 339 Equity Telecommunications - 11 785 448 (25 153)Equity Telecommunications - 12 724 472 (9 234)Equity Telecommunications - 13 574 474 4 747 Equity Telecommunications - 14 501 170 (14 368)Equity Telecommunications - 15 452 078 35 483 Equity Telecommunications - 16 448 711 1 972 Equity Telecommunications - 17 242 282 (2 011)Equity Telecommunications - 18 187 942 4 405 Equity Telecommunications - 19 115 802 13 257 Equity Telecommunications - 20 25 889 7 Equity Telecommunications - 21 8 999 237 Equity Telecommunications - 22 8 739 606 Equity Telecommunications - 23 5 563 (15)Equity Telecommunications - 24 101 11 Equity Transportation - 1 1 726 589 6 903 Equity Transportation - 2 1 199 731 (4 459)Equity Transportation - 3 880 192 26 567 Equity Transportation - 4 717 208 30 295 Equity Transportation - 5 474 861 57 913 Equity Transportation - 6 459 881 23 691
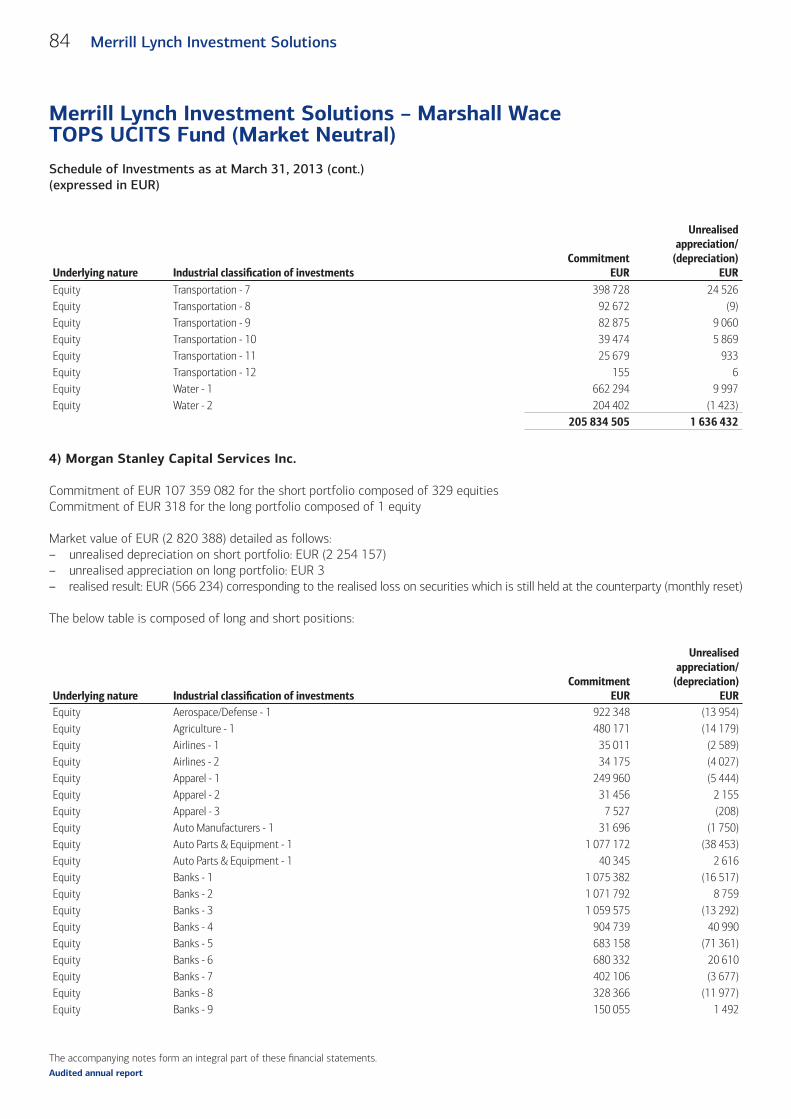
The accompanying notes form an integral part of these fi nancial statements.
Schedule of Investments as at March 31, 2013 (cont.)(expressed in EUR)
Merrill Lynch Investment Solutions – Marshall Wace TOPS UCITS Fund (Market Neutral)
84 Merrill Lynch Investment Solutions
Audited annual report
Underlying nature Industrial classifi cation of investments Commitment
EUR
Unrealised appreciation/
(depreciation)EUR
Equity Transportation - 7 398 728 24 526 Equity Transportation - 8 92 672 (9)Equity Transportation - 9 82 875 9 060 Equity Transportation - 10 39 474 5 869 Equity Transportation - 11 25 679 933 Equity Transportation - 12 155 6 Equity Water - 1 662 294 9 997 Equity Water - 2 204 402 (1 423)
205 834 505 1 636 432
4) Morgan Stanley Capital Services Inc.
Commitment of EUR 107 359 082 for the short portfolio composed of 329 equitiesCommitment of EUR 318 for the long portfolio composed of 1 equity
Market value of EUR (2 820 388) detailed as follows:– unrealised depreciation on short portfolio: EUR (2 254 157)– unrealised appreciation on long portfolio: EUR 3– realised result: EUR (566 234) corresponding to the realised loss on securities which is still held at the counterparty (monthly reset)
The below table is composed of long and short positions:
Underlying nature Industrial classifi cation of investmentsCommitment
EUR
Unrealised appreciation/
(depreciation)EUR
Equity Aerospace/Defense - 1 922 348 (13 954)Equity Agriculture - 1 480 171 (14 179)Equity Airlines - 1 35 011 (2 589)Equity Airlines - 2 34 175 (4 027)Equity Apparel - 1 249 960 (5 444)Equity Apparel - 2 31 456 2 155 Equity Apparel - 3 7 527 (208)Equity Auto Manufacturers - 1 31 696 (1 750)Equity Auto Parts & Equipment - 1 1 077 172 (38 453)Equity Auto Parts & Equipment - 1 40 345 2 616 Equity Banks - 1 1 075 382 (16 517)Equity Banks - 2 1 071 792 8 759 Equity Banks - 3 1 059 575 (13 292)Equity Banks - 4 904 739 40 990 Equity Banks - 5 683 158 (71 361)Equity Banks - 6 680 332 20 610 Equity Banks - 7 402 106 (3 677)Equity Banks - 8 328 366 (11 977)Equity Banks - 9 150 055 1 492
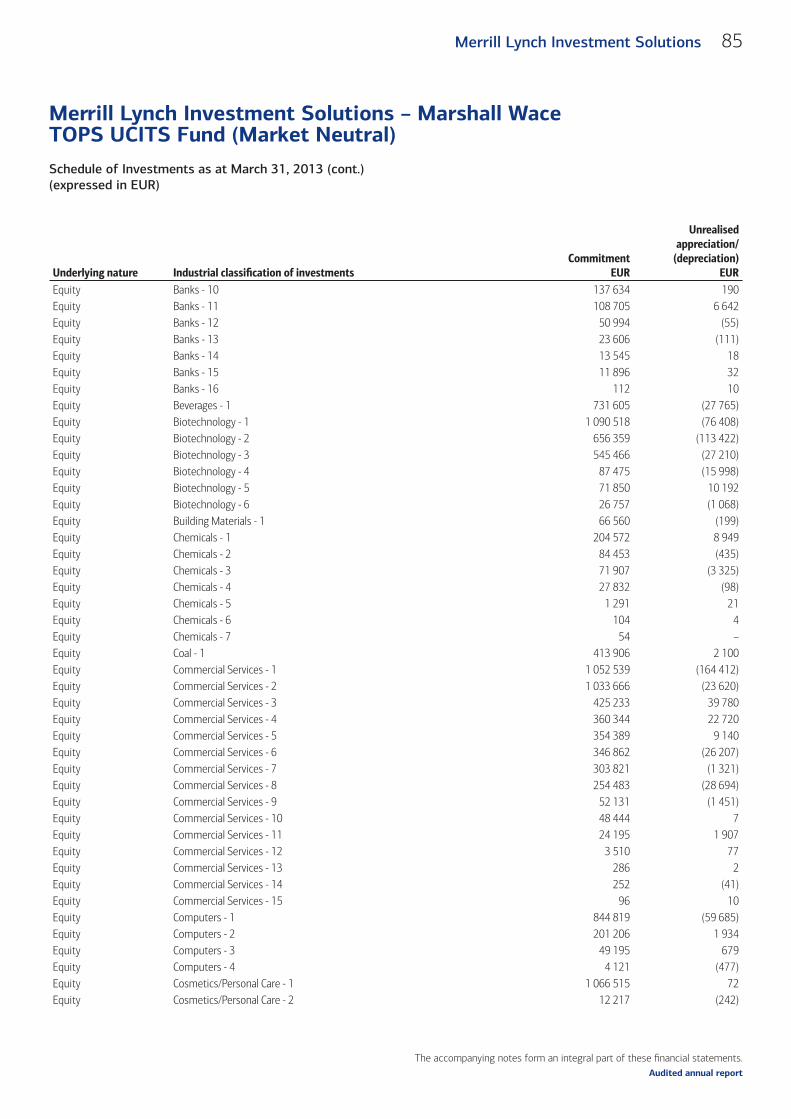
The accompanying notes form an integral part of these fi nancial statements.
Schedule of Investments as at March 31, 2013 (cont.)(expressed in EUR)
Merrill Lynch Investment Solutions – Marshall Wace TOPS UCITS Fund (Market Neutral)
85Merrill Lynch Investment Solutions
Audited annual report
Underlying nature Industrial classifi cation of investmentsCommitment
EUR
Unrealised appreciation/
(depreciation)EUR
Equity Banks - 10 137 634 190 Equity Banks - 11 108 705 6 642 Equity Banks - 12 50 994 (55)Equity Banks - 13 23 606 (111)Equity Banks - 14 13 545 18 Equity Banks - 15 11 896 32 Equity Banks - 16 112 10 Equity Beverages - 1 731 605 (27 765)Equity Biotechnology - 1 1 090 518 (76 408)Equity Biotechnology - 2 656 359 (113 422)Equity Biotechnology - 3 545 466 (27 210)Equity Biotechnology - 4 87 475 (15 998)Equity Biotechnology - 5 71 850 10 192 Equity Biotechnology - 6 26 757 (1 068)Equity Building Materials - 1 66 560 (199)Equity Chemicals - 1 204 572 8 949 Equity Chemicals - 2 84 453 (435)Equity Chemicals - 3 71 907 (3 325)Equity Chemicals - 4 27 832 (98)Equity Chemicals - 5 1 291 21 Equity Chemicals - 6 104 4 Equity Chemicals - 7 54 – Equity Coal - 1 413 906 2 100 Equity Commercial Services - 1 1 052 539 (164 412)Equity Commercial Services - 2 1 033 666 (23 620)Equity Commercial Services - 3 425 233 39 780 Equity Commercial Services - 4 360 344 22 720 Equity Commercial Services - 5 354 389 9 140 Equity Commercial Services - 6 346 862 (26 207)Equity Commercial Services - 7 303 821 (1 321)Equity Commercial Services - 8 254 483 (28 694)Equity Commercial Services - 9 52 131 (1 451)Equity Commercial Services - 10 48 444 7 Equity Commercial Services - 11 24 195 1 907 Equity Commercial Services - 12 3 510 77 Equity Commercial Services - 13 286 2 Equity Commercial Services - 14 252 (41)Equity Commercial Services - 15 96 10 Equity Computers - 1 844 819 (59 685)Equity Computers - 2 201 206 1 934 Equity Computers - 3 49 195 679 Equity Computers - 4 4 121 (477)Equity Cosmetics/Personal Care - 1 1 066 515 72 Equity Cosmetics/Personal Care - 2 12 217 (242)
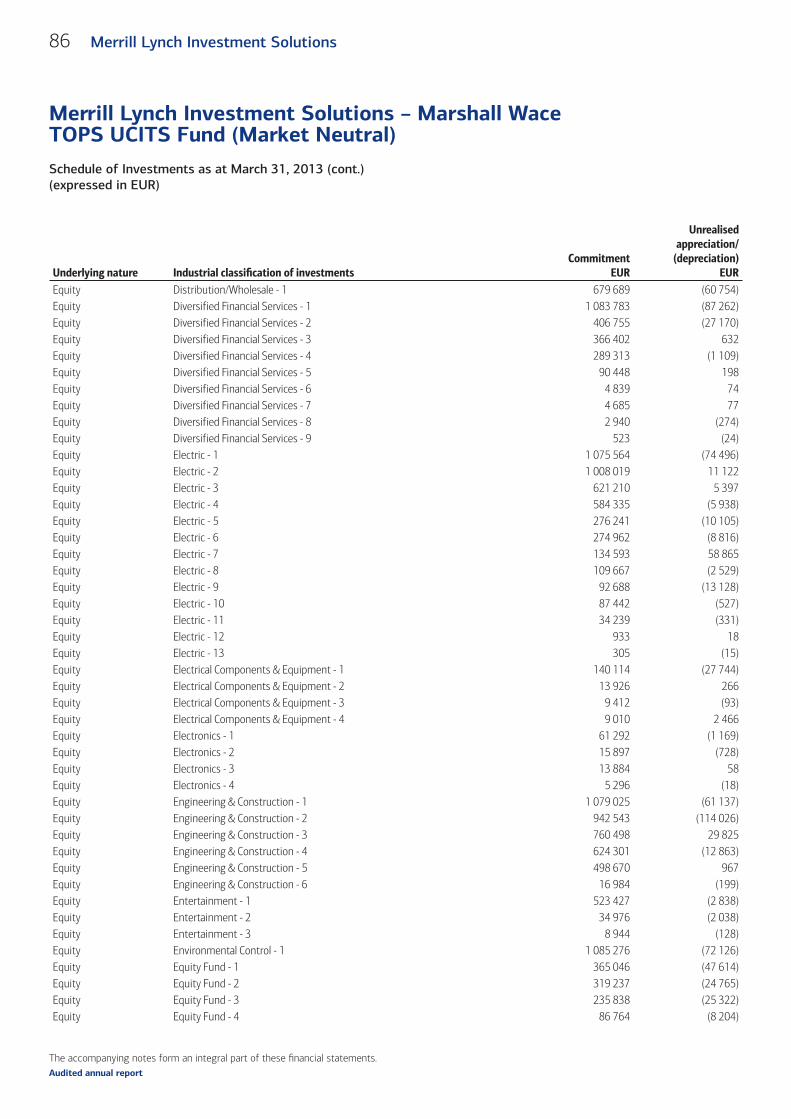
The accompanying notes form an integral part of these fi nancial statements.
Schedule of Investments as at March 31, 2013 (cont.)(expressed in EUR)
Merrill Lynch Investment Solutions – Marshall Wace TOPS UCITS Fund (Market Neutral)
86 Merrill Lynch Investment Solutions
Audited annual report
Underlying nature Industrial classifi cation of investmentsCommitment
EUR
Unrealised appreciation/
(depreciation)EUR
Equity Distribution/Wholesale - 1 679 689 (60 754)Equity Diversified Financial Services - 1 1 083 783 (87 262)Equity Diversified Financial Services - 2 406 755 (27 170)Equity Diversified Financial Services - 3 366 402 632 Equity Diversified Financial Services - 4 289 313 (1 109)Equity Diversified Financial Services - 5 90 448 198 Equity Diversified Financial Services - 6 4 839 74 Equity Diversified Financial Services - 7 4 685 77 Equity Diversified Financial Services - 8 2 940 (274)Equity Diversified Financial Services - 9 523 (24)Equity Electric - 1 1 075 564 (74 496)Equity Electric - 2 1 008 019 11 122 Equity Electric - 3 621 210 5 397 Equity Electric - 4 584 335 (5 938)Equity Electric - 5 276 241 (10 105)Equity Electric - 6 274 962 (8 816)Equity Electric - 7 134 593 58 865 Equity Electric - 8 109 667 (2 529)Equity Electric - 9 92 688 (13 128)Equity Electric - 10 87 442 (527)Equity Electric - 11 34 239 (331)Equity Electric - 12 933 18 Equity Electric - 13 305 (15)Equity Electrical Components & Equipment - 1 140 114 (27 744)Equity Electrical Components & Equipment - 2 13 926 266 Equity Electrical Components & Equipment - 3 9 412 (93)Equity Electrical Components & Equipment - 4 9 010 2 466 Equity Electronics - 1 61 292 (1 169)Equity Electronics - 2 15 897 (728)Equity Electronics - 3 13 884 58 Equity Electronics - 4 5 296 (18)Equity Engineering & Construction - 1 1 079 025 (61 137)Equity Engineering & Construction - 2 942 543 (114 026)Equity Engineering & Construction - 3 760 498 29 825 Equity Engineering & Construction - 4 624 301 (12 863)Equity Engineering & Construction - 5 498 670 967 Equity Engineering & Construction - 6 16 984 (199)Equity Entertainment - 1 523 427 (2 838)Equity Entertainment - 2 34 976 (2 038)Equity Entertainment - 3 8 944 (128)Equity Environmental Control - 1 1 085 276 (72 126)Equity Equity Fund - 1 365 046 (47 614)Equity Equity Fund - 2 319 237 (24 765)Equity Equity Fund - 3 235 838 (25 322)Equity Equity Fund - 4 86 764 (8 204)
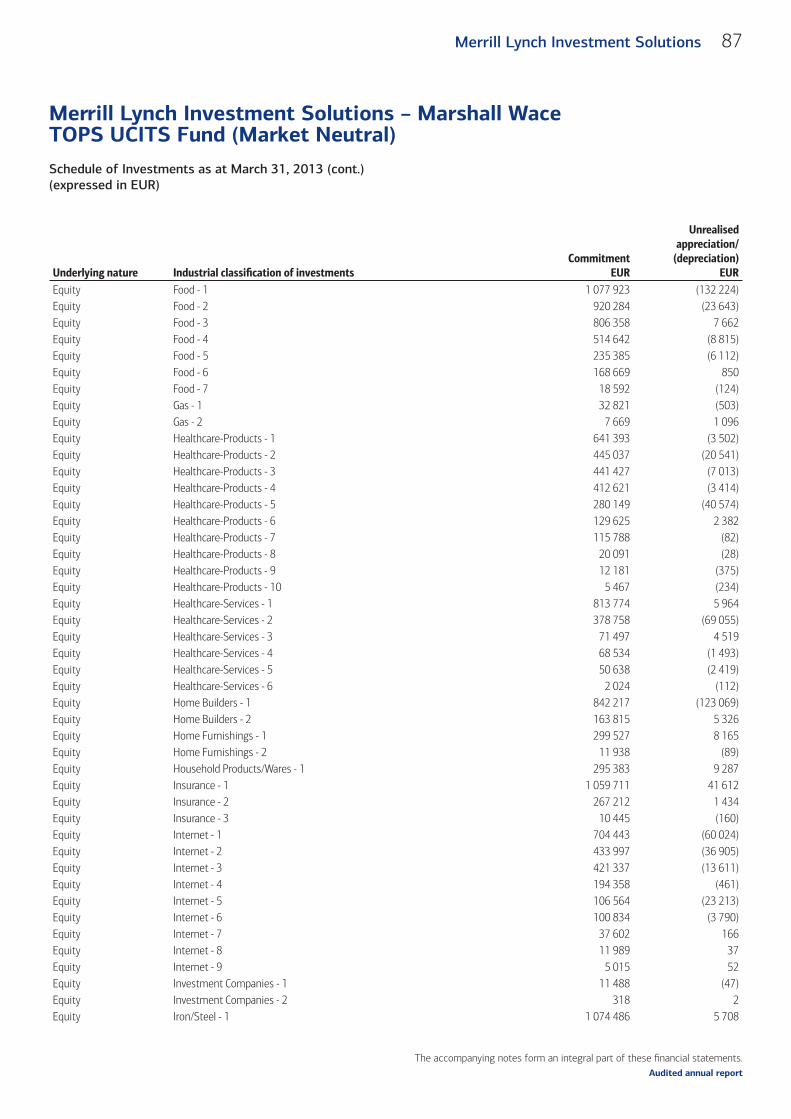
The accompanying notes form an integral part of these fi nancial statements.
Schedule of Investments as at March 31, 2013 (cont.)(expressed in EUR)
Merrill Lynch Investment Solutions – Marshall Wace TOPS UCITS Fund (Market Neutral)
87Merrill Lynch Investment Solutions
Audited annual report
Underlying nature Industrial classifi cation of investmentsCommitment
EUR
Unrealised appreciation/
(depreciation)EUR
Equity Food - 1 1 077 923 (132 224)Equity Food - 2 920 284 (23 643)Equity Food - 3 806 358 7 662 Equity Food - 4 514 642 (8 815)Equity Food - 5 235 385 (6 112)Equity Food - 6 168 669 850 Equity Food - 7 18 592 (124)Equity Gas - 1 32 821 (503)Equity Gas - 2 7 669 1 096 Equity Healthcare-Products - 1 641 393 (3 502)Equity Healthcare-Products - 2 445 037 (20 541)Equity Healthcare-Products - 3 441 427 (7 013)Equity Healthcare-Products - 4 412 621 (3 414)Equity Healthcare-Products - 5 280 149 (40 574)Equity Healthcare-Products - 6 129 625 2 382 Equity Healthcare-Products - 7 115 788 (82)Equity Healthcare-Products - 8 20 091 (28)Equity Healthcare-Products - 9 12 181 (375)Equity Healthcare-Products - 10 5 467 (234)Equity Healthcare-Services - 1 813 774 5 964 Equity Healthcare-Services - 2 378 758 (69 055)Equity Healthcare-Services - 3 71 497 4 519 Equity Healthcare-Services - 4 68 534 (1 493)Equity Healthcare-Services - 5 50 638 (2 419)Equity Healthcare-Services - 6 2 024 (112)Equity Home Builders - 1 842 217 (123 069)Equity Home Builders - 2 163 815 5 326 Equity Home Furnishings - 1 299 527 8 165 Equity Home Furnishings - 2 11 938 (89)Equity Household Products/Wares - 1 295 383 9 287 Equity Insurance - 1 1 059 711 41 612 Equity Insurance - 2 267 212 1 434 Equity Insurance - 3 10 445 (160)Equity Internet - 1 704 443 (60 024)Equity Internet - 2 433 997 (36 905)Equity Internet - 3 421 337 (13 611)Equity Internet - 4 194 358 (461)Equity Internet - 5 106 564 (23 213)Equity Internet - 6 100 834 (3 790)Equity Internet - 7 37 602 166 Equity Internet - 8 11 989 37 Equity Internet - 9 5 015 52 Equity Investment Companies - 1 11 488 (47)Equity Investment Companies - 2 318 2 Equity Iron/Steel - 1 1 074 486 5 708
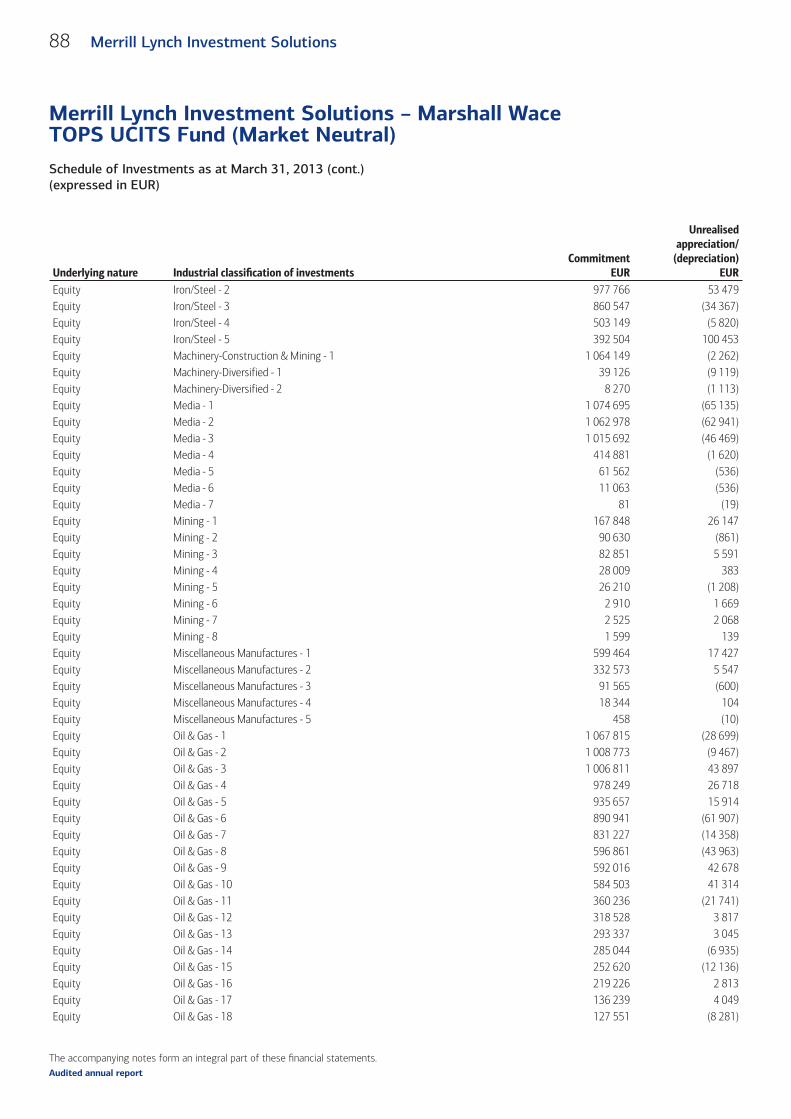
The accompanying notes form an integral part of these fi nancial statements.
Schedule of Investments as at March 31, 2013 (cont.)(expressed in EUR)
Merrill Lynch Investment Solutions – Marshall Wace TOPS UCITS Fund (Market Neutral)
88 Merrill Lynch Investment Solutions
Audited annual report
Underlying nature Industrial classifi cation of investmentsCommitment
EUR
Unrealised appreciation/
(depreciation)EUR
Equity Iron/Steel - 2 977 766 53 479 Equity Iron/Steel - 3 860 547 (34 367)Equity Iron/Steel - 4 503 149 (5 820)Equity Iron/Steel - 5 392 504 100 453 Equity Machinery-Construction & Mining - 1 1 064 149 (2 262)Equity Machinery-Diversified - 1 39 126 (9 119)Equity Machinery-Diversified - 2 8 270 (1 113)Equity Media - 1 1 074 695 (65 135)Equity Media - 2 1 062 978 (62 941)Equity Media - 3 1 015 692 (46 469)Equity Media - 4 414 881 (1 620)Equity Media - 5 61 562 (536)Equity Media - 6 11 063 (536)Equity Media - 7 81 (19)Equity Mining - 1 167 848 26 147 Equity Mining - 2 90 630 (861)Equity Mining - 3 82 851 5 591 Equity Mining - 4 28 009 383 Equity Mining - 5 26 210 (1 208)Equity Mining - 6 2 910 1 669 Equity Mining - 7 2 525 2 068 Equity Mining - 8 1 599 139 Equity Miscellaneous Manufactures - 1 599 464 17 427 Equity Miscellaneous Manufactures - 2 332 573 5 547 Equity Miscellaneous Manufactures - 3 91 565 (600)Equity Miscellaneous Manufactures - 4 18 344 104 Equity Miscellaneous Manufactures - 5 458 (10)Equity Oil & Gas - 1 1 067 815 (28 699)Equity Oil & Gas - 2 1 008 773 (9 467)Equity Oil & Gas - 3 1 006 811 43 897 Equity Oil & Gas - 4 978 249 26 718 Equity Oil & Gas - 5 935 657 15 914 Equity Oil & Gas - 6 890 941 (61 907)Equity Oil & Gas - 7 831 227 (14 358)Equity Oil & Gas - 8 596 861 (43 963)Equity Oil & Gas - 9 592 016 42 678 Equity Oil & Gas - 10 584 503 41 314 Equity Oil & Gas - 11 360 236 (21 741)Equity Oil & Gas - 12 318 528 3 817 Equity Oil & Gas - 13 293 337 3 045 Equity Oil & Gas - 14 285 044 (6 935)Equity Oil & Gas - 15 252 620 (12 136)Equity Oil & Gas - 16 219 226 2 813 Equity Oil & Gas - 17 136 239 4 049 Equity Oil & Gas - 18 127 551 (8 281)
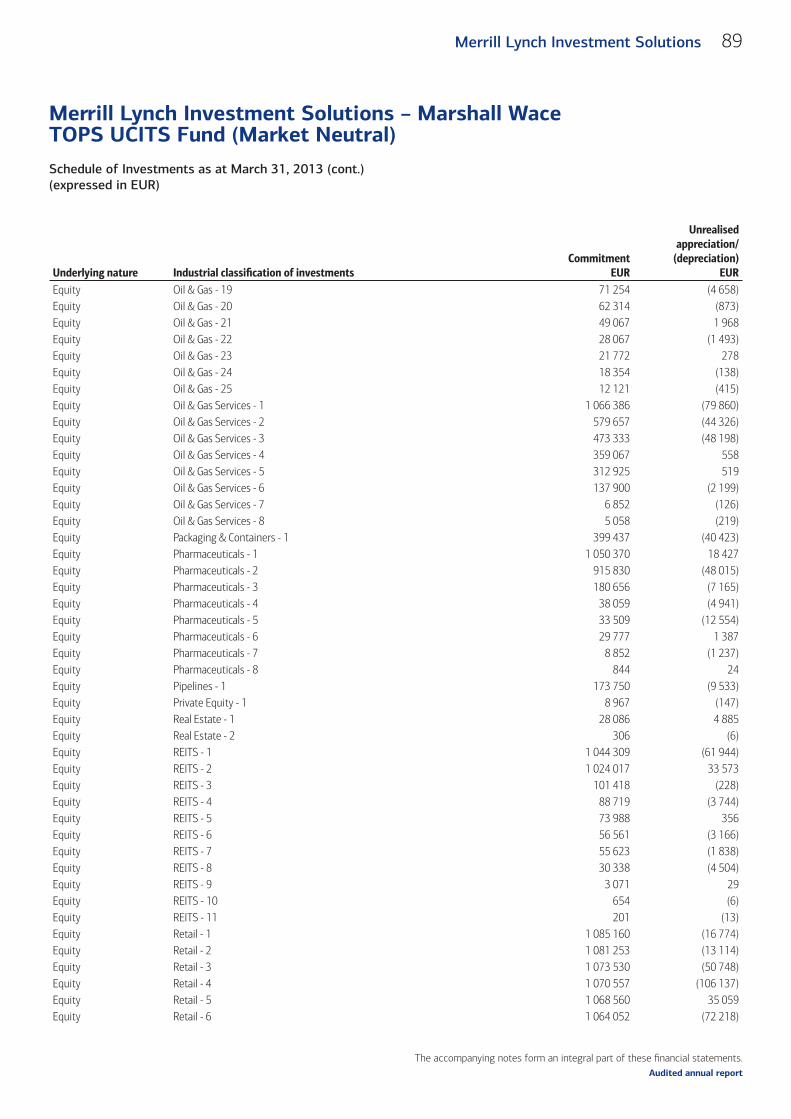
The accompanying notes form an integral part of these fi nancial statements.
Schedule of Investments as at March 31, 2013 (cont.)(expressed in EUR)
Merrill Lynch Investment Solutions – Marshall Wace TOPS UCITS Fund (Market Neutral)
89Merrill Lynch Investment Solutions
Audited annual report
Underlying nature Industrial classifi cation of investmentsCommitment
EUR
Unrealised appreciation/
(depreciation)EUR
Equity Oil & Gas - 19 71 254 (4 658)Equity Oil & Gas - 20 62 314 (873)Equity Oil & Gas - 21 49 067 1 968 Equity Oil & Gas - 22 28 067 (1 493)Equity Oil & Gas - 23 21 772 278 Equity Oil & Gas - 24 18 354 (138)Equity Oil & Gas - 25 12 121 (415)Equity Oil & Gas Services - 1 1 066 386 (79 860)Equity Oil & Gas Services - 2 579 657 (44 326)Equity Oil & Gas Services - 3 473 333 (48 198)Equity Oil & Gas Services - 4 359 067 558 Equity Oil & Gas Services - 5 312 925 519 Equity Oil & Gas Services - 6 137 900 (2 199)Equity Oil & Gas Services - 7 6 852 (126)Equity Oil & Gas Services - 8 5 058 (219)Equity Packaging & Containers - 1 399 437 (40 423)Equity Pharmaceuticals - 1 1 050 370 18 427 Equity Pharmaceuticals - 2 915 830 (48 015)Equity Pharmaceuticals - 3 180 656 (7 165)Equity Pharmaceuticals - 4 38 059 (4 941)Equity Pharmaceuticals - 5 33 509 (12 554)Equity Pharmaceuticals - 6 29 777 1 387 Equity Pharmaceuticals - 7 8 852 (1 237)Equity Pharmaceuticals - 8 844 24 Equity Pipelines - 1 173 750 (9 533)Equity Private Equity - 1 8 967 (147)Equity Real Estate - 1 28 086 4 885 Equity Real Estate - 2 306 (6)Equity REITS - 1 1 044 309 (61 944)Equity REITS - 2 1 024 017 33 573 Equity REITS - 3 101 418 (228)Equity REITS - 4 88 719 (3 744)Equity REITS - 5 73 988 356 Equity REITS - 6 56 561 (3 166)Equity REITS - 7 55 623 (1 838)Equity REITS - 8 30 338 (4 504)Equity REITS - 9 3 071 29 Equity REITS - 10 654 (6)Equity REITS - 11 201 (13)Equity Retail - 1 1 085 160 (16 774)Equity Retail - 2 1 081 253 (13 114)Equity Retail - 3 1 073 530 (50 748)Equity Retail - 4 1 070 557 (106 137)Equity Retail - 5 1 068 560 35 059 Equity Retail - 6 1 064 052 (72 218)
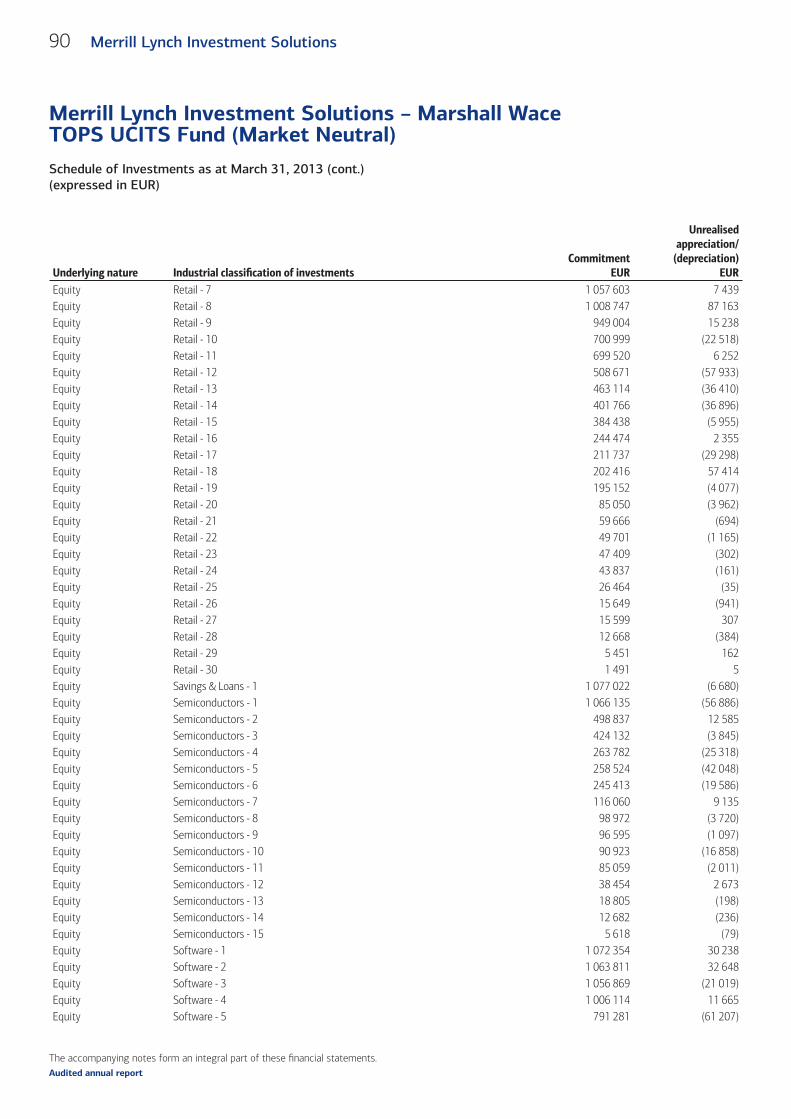
The accompanying notes form an integral part of these fi nancial statements.
Schedule of Investments as at March 31, 2013 (cont.)(expressed in EUR)
Merrill Lynch Investment Solutions – Marshall Wace TOPS UCITS Fund (Market Neutral)
90 Merrill Lynch Investment Solutions
Audited annual report
Underlying nature Industrial classifi cation of investmentsCommitment
EUR
Unrealised appreciation/
(depreciation)EUR
Equity Retail - 7 1 057 603 7 439 Equity Retail - 8 1 008 747 87 163 Equity Retail - 9 949 004 15 238 Equity Retail - 10 700 999 (22 518)Equity Retail - 11 699 520 6 252 Equity Retail - 12 508 671 (57 933)Equity Retail - 13 463 114 (36 410)Equity Retail - 14 401 766 (36 896)Equity Retail - 15 384 438 (5 955)Equity Retail - 16 244 474 2 355 Equity Retail - 17 211 737 (29 298)Equity Retail - 18 202 416 57 414 Equity Retail - 19 195 152 (4 077)Equity Retail - 20 85 050 (3 962)Equity Retail - 21 59 666 (694)Equity Retail - 22 49 701 (1 165)Equity Retail - 23 47 409 (302)Equity Retail - 24 43 837 (161)Equity Retail - 25 26 464 (35)Equity Retail - 26 15 649 (941)Equity Retail - 27 15 599 307 Equity Retail - 28 12 668 (384)Equity Retail - 29 5 451 162 Equity Retail - 30 1 491 5 Equity Savings & Loans - 1 1 077 022 (6 680)Equity Semiconductors - 1 1 066 135 (56 886)Equity Semiconductors - 2 498 837 12 585 Equity Semiconductors - 3 424 132 (3 845)Equity Semiconductors - 4 263 782 (25 318)Equity Semiconductors - 5 258 524 (42 048)Equity Semiconductors - 6 245 413 (19 586)Equity Semiconductors - 7 116 060 9 135 Equity Semiconductors - 8 98 972 (3 720)Equity Semiconductors - 9 96 595 (1 097)Equity Semiconductors - 10 90 923 (16 858)Equity Semiconductors - 11 85 059 (2 011)Equity Semiconductors - 12 38 454 2 673 Equity Semiconductors - 13 18 805 (198)Equity Semiconductors - 14 12 682 (236)Equity Semiconductors - 15 5 618 (79)Equity Software - 1 1 072 354 30 238 Equity Software - 2 1 063 811 32 648 Equity Software - 3 1 056 869 (21 019)Equity Software - 4 1 006 114 11 665 Equity Software - 5 791 281 (61 207)
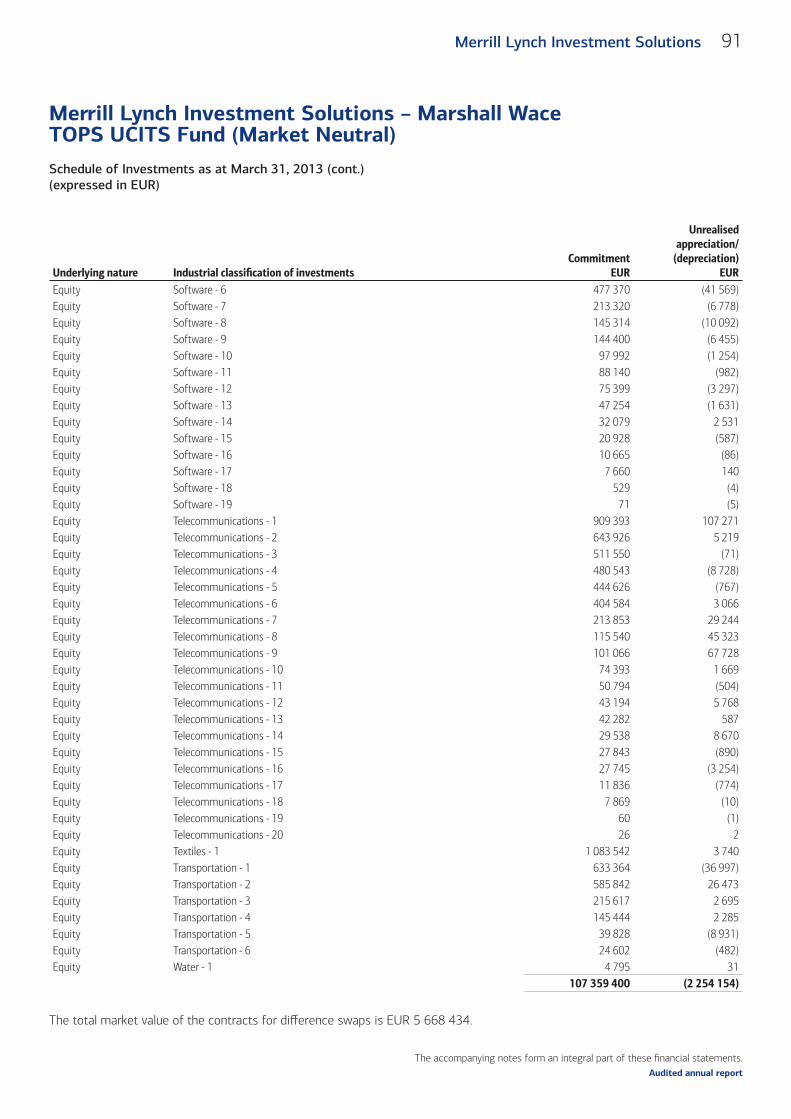
The accompanying notes form an integral part of these fi nancial statements.
Schedule of Investments as at March 31, 2013 (cont.)(expressed in EUR)
Merrill Lynch Investment Solutions – Marshall Wace TOPS UCITS Fund (Market Neutral)
91Merrill Lynch Investment Solutions
Audited annual report
Underlying nature Industrial classifi cation of investmentsCommitment
EUR
Unrealised appreciation/
(depreciation)EUR
Equity Software - 6 477 370 (41 569)Equity Software - 7 213 320 (6 778)Equity Software - 8 145 314 (10 092)Equity Software - 9 144 400 (6 455)Equity Software - 10 97 992 (1 254)Equity Software - 11 88 140 (982)Equity Software - 12 75 399 (3 297)Equity Software - 13 47 254 (1 631)Equity Software - 14 32 079 2 531 Equity Software - 15 20 928 (587)Equity Software - 16 10 665 (86)Equity Software - 17 7 660 140 Equity Software - 18 529 (4)Equity Software - 19 71 (5)Equity Telecommunications - 1 909 393 107 271 Equity Telecommunications - 2 643 926 5 219 Equity Telecommunications - 3 511 550 (71)Equity Telecommunications - 4 480 543 (8 728)Equity Telecommunications - 5 444 626 (767)Equity Telecommunications - 6 404 584 3 066 Equity Telecommunications - 7 213 853 29 244 Equity Telecommunications - 8 115 540 45 323 Equity Telecommunications - 9 101 066 67 728 Equity Telecommunications - 10 74 393 1 669 Equity Telecommunications - 11 50 794 (504)Equity Telecommunications - 12 43 194 5 768 Equity Telecommunications - 13 42 282 587 Equity Telecommunications - 14 29 538 8 670 Equity Telecommunications - 15 27 843 (890)Equity Telecommunications - 16 27 745 (3 254)Equity Telecommunications - 17 11 836 (774)Equity Telecommunications - 18 7 869 (10)Equity Telecommunications - 19 60 (1)Equity Telecommunications - 20 26 2 Equity Textiles - 1 1 083 542 3 740 Equity Transportation - 1 633 364 (36 997)Equity Transportation - 2 585 842 26 473 Equity Transportation - 3 215 617 2 695 Equity Transportation - 4 145 444 2 285 Equity Transportation - 5 39 828 (8 931)Equity Transportation - 6 24 602 (482)Equity Water - 1 4 795 31
107 359 400 (2 254 154)
The total market value of the contracts for diff erence swaps is EUR 5 668 434.
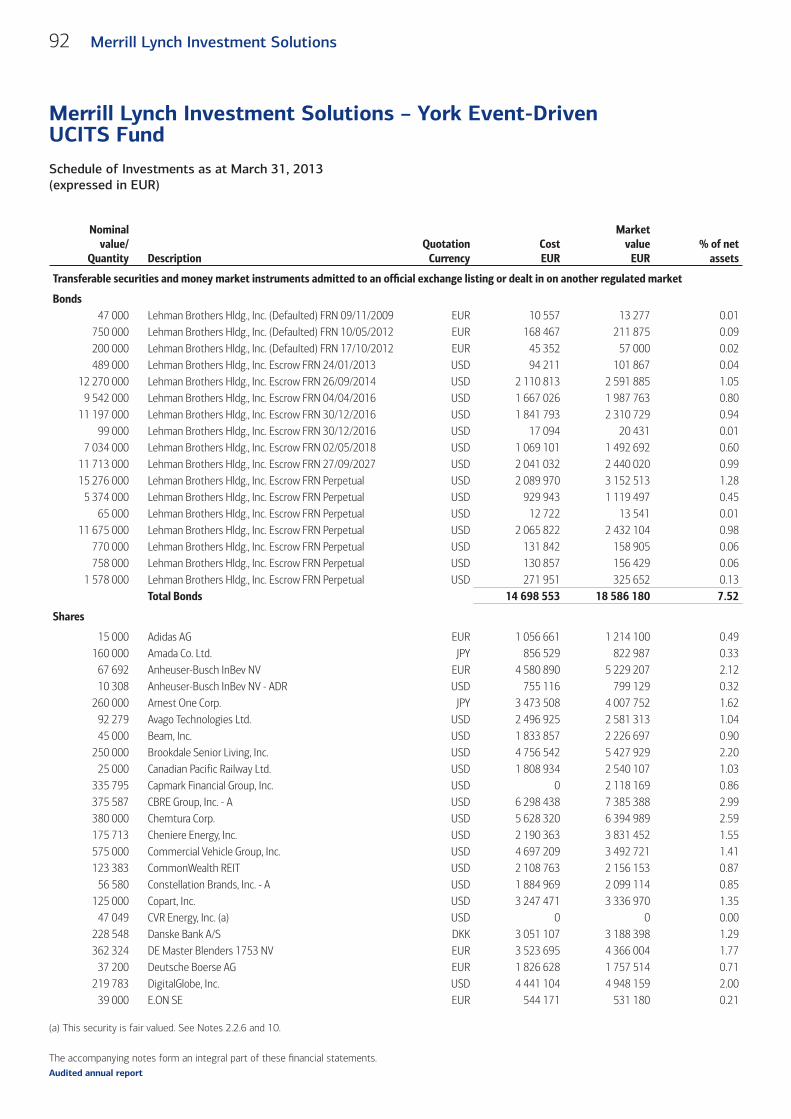
The accompanying notes form an integral part of these fi nancial statements.
Schedule of Investments as at March 31, 2013 (expressed in EUR)
Merrill Lynch Investment Solutions – York Event-Driven UCITS Fund
92 Merrill Lynch Investment Solutions
Audited annual report
Nominalvalue/
Quantity DescriptionQuotation
CurrencyCostEUR
Marketvalue
EUR% of net
assets
Transferable securities and money market instruments admitted to an offi cial exchange listing or dealt in on another regulated market (cont.)
Bonds47 000 Lehman Brothers Hldg., Inc. (Defaulted) FRN 09/11/2009 EUR 10 557 13 277 0.01
750 000 Lehman Brothers Hldg., Inc. (Defaulted) FRN 10/05/2012 EUR 168 467 211 875 0.09200 000 Lehman Brothers Hldg., Inc. (Defaulted) FRN 17/10/2012 EUR 45 352 57 000 0.02489 000 Lehman Brothers Hldg., Inc. Escrow FRN 24/01/2013 USD 94 211 101 867 0.04
12 270 000 Lehman Brothers Hldg., Inc. Escrow FRN 26/09/2014 USD 2 110 813 2 591 885 1.059 542 000 Lehman Brothers Hldg., Inc. Escrow FRN 04/04/2016 USD 1 667 026 1 987 763 0.80
11 197 000 Lehman Brothers Hldg., Inc. Escrow FRN 30/12/2016 USD 1 841 793 2 310 729 0.9499 000 Lehman Brothers Hldg., Inc. Escrow FRN 30/12/2016 USD 17 094 20 431 0.01
7 034 000 Lehman Brothers Hldg., Inc. Escrow FRN 02/05/2018 USD 1 069 101 1 492 692 0.6011 713 000 Lehman Brothers Hldg., Inc. Escrow FRN 27/09/2027 USD 2 041 032 2 440 020 0.9915 276 000 Lehman Brothers Hldg., Inc. Escrow FRN Perpetual USD 2 089 970 3 152 513 1.28
5 374 000 Lehman Brothers Hldg., Inc. Escrow FRN Perpetual USD 929 943 1 119 497 0.4565 000 Lehman Brothers Hldg., Inc. Escrow FRN Perpetual USD 12 722 13 541 0.01
11 675 000 Lehman Brothers Hldg., Inc. Escrow FRN Perpetual USD 2 065 822 2 432 104 0.98770 000 Lehman Brothers Hldg., Inc. Escrow FRN Perpetual USD 131 842 158 905 0.06758 000 Lehman Brothers Hldg., Inc. Escrow FRN Perpetual USD 130 857 156 429 0.06
1 578 000 Lehman Brothers Hldg., Inc. Escrow FRN Perpetual USD 271 951 325 652 0.13Total Bonds 14 698 553 18 586 180 7.52
Shares
15 000 Adidas AG EUR 1 056 661 1 214 100 0.49160 000 Amada Co. Ltd. JPY 856 529 822 987 0.33
67 692 Anheuser-Busch InBev NV EUR 4 580 890 5 229 207 2.1210 308 Anheuser-Busch InBev NV - ADR USD 755 116 799 129 0.32
260 000 Arnest One Corp. JPY 3 473 508 4 007 752 1.6292 279 Avago Technologies Ltd. USD 2 496 925 2 581 313 1.0445 000 Beam, Inc. USD 1 833 857 2 226 697 0.90
250 000 Brookdale Senior Living, Inc. USD 4 756 542 5 427 929 2.2025 000 Canadian Pacific Railway Ltd. USD 1 808 934 2 540 107 1.03
335 795 Capmark Financial Group, Inc. USD 0 2 118 169 0.86375 587 CBRE Group, Inc. - A USD 6 298 438 7 385 388 2.99380 000 Chemtura Corp. USD 5 628 320 6 394 989 2.59175 713 Cheniere Energy, Inc. USD 2 190 363 3 831 452 1.55575 000 Commercial Vehicle Group, Inc. USD 4 697 209 3 492 721 1.41123 383 CommonWealth REIT USD 2 108 763 2 156 153 0.87
56 580 Constellation Brands, Inc. - A USD 1 884 969 2 099 114 0.85125 000 Copart, Inc. USD 3 247 471 3 336 970 1.35
47 049 CVR Energy, Inc. (a) USD 0 0 0.00228 548 Danske Bank A/S DKK 3 051 107 3 188 398 1.29362 324 DE Master Blenders 1753 NV EUR 3 523 695 4 366 004 1.77
37 200 Deutsche Boerse AG EUR 1 826 628 1 757 514 0.71219 783 DigitalGlobe, Inc. USD 4 441 104 4 948 159 2.00
39 000 E.ON SE EUR 544 171 531 180 0.21
(a) This security is fair valued. See Notes 2.2.6 and 10.
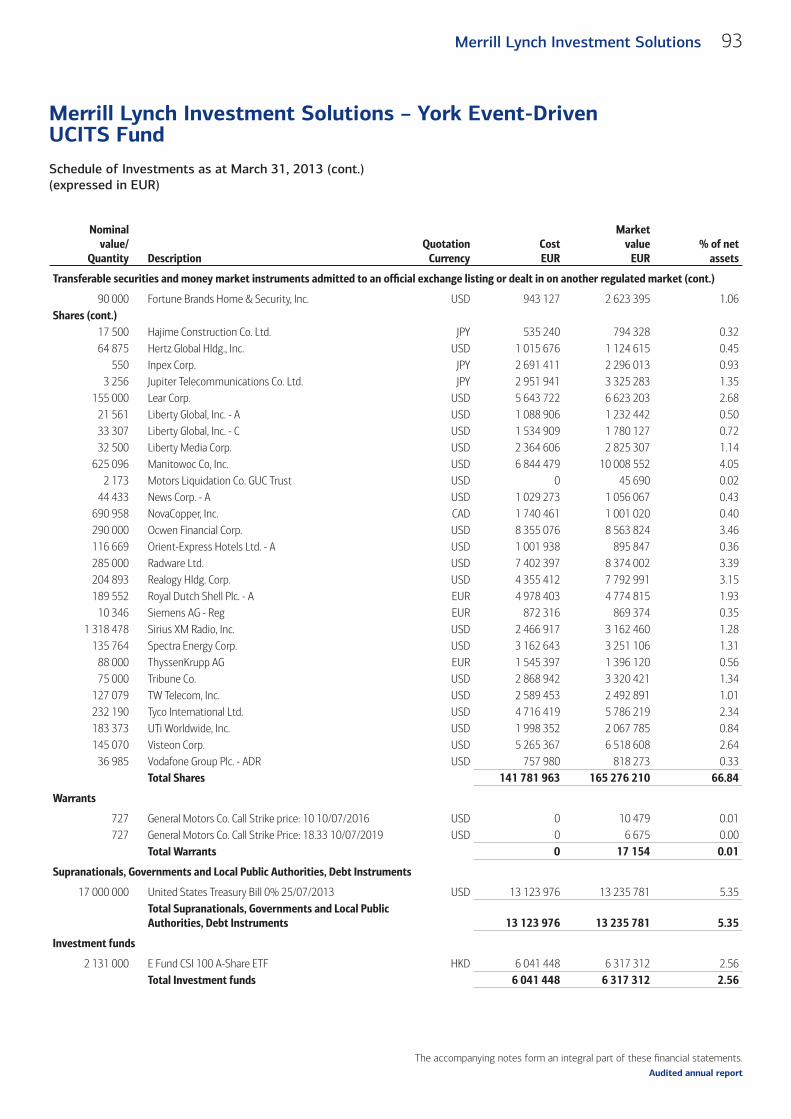
The accompanying notes form an integral part of these fi nancial statements.
Schedule of Investments as at March 31, 2013 (cont.)(expressed in EUR)
Merrill Lynch Investment Solutions – York Event-Driven UCITS Fund
93Merrill Lynch Investment Solutions
Audited annual report
Nominalvalue/
Quantity DescriptionQuotation
CurrencyCostEUR
Marketvalue
EUR% of net
assets
Transferable securities and money market instruments admitted to an offi cial exchange listing or dealt in on another regulated market (cont.)
90 000 Fortune Brands Home & Security, Inc. USD 943 127 2 623 395 1.06Shares (cont.)
17 500 Hajime Construction Co. Ltd. JPY 535 240 794 328 0.3264 875 Hertz Global Hldg., Inc. USD 1 015 676 1 124 615 0.45
550 Inpex Corp. JPY 2 691 411 2 296 013 0.933 256 Jupiter Telecommunications Co. Ltd. JPY 2 951 941 3 325 283 1.35
155 000 Lear Corp. USD 5 643 722 6 623 203 2.6821 561 Liberty Global, Inc. - A USD 1 088 906 1 232 442 0.5033 307 Liberty Global, Inc. - C USD 1 534 909 1 780 127 0.7232 500 Liberty Media Corp. USD 2 364 606 2 825 307 1.14
625 096 Manitowoc Co, Inc. USD 6 844 479 10 008 552 4.052 173 Motors Liquidation Co. GUC Trust USD 0 45 690 0.02
44 433 News Corp. - A USD 1 029 273 1 056 067 0.43690 958 NovaCopper, Inc. CAD 1 740 461 1 001 020 0.40290 000 Ocwen Financial Corp. USD 8 355 076 8 563 824 3.46116 669 Orient-Express Hotels Ltd. - A USD 1 001 938 895 847 0.36285 000 Radware Ltd. USD 7 402 397 8 374 002 3.39204 893 Realogy Hldg. Corp. USD 4 355 412 7 792 991 3.15189 552 Royal Dutch Shell Plc. - A EUR 4 978 403 4 774 815 1.93
10 346 Siemens AG - Reg EUR 872 316 869 374 0.351 318 478 Sirius XM Radio, Inc. USD 2 466 917 3 162 460 1.28
135 764 Spectra Energy Corp. USD 3 162 643 3 251 106 1.3188 000 ThyssenKrupp AG EUR 1 545 397 1 396 120 0.5675 000 Tribune Co. USD 2 868 942 3 320 421 1.34
127 079 TW Telecom, Inc. USD 2 589 453 2 492 891 1.01232 190 Tyco International Ltd. USD 4 716 419 5 786 219 2.34183 373 UTi Worldwide, Inc. USD 1 998 352 2 067 785 0.84145 070 Visteon Corp. USD 5 265 367 6 518 608 2.64
36 985 Vodafone Group Plc. - ADR USD 757 980 818 273 0.33Total Shares 141 781 963 165 276 210 66.84
Warrants
727 General Motors Co. Call Strike price: 10 10/07/2016 USD 0 10 479 0.01727 General Motors Co. Call Strike Price: 18.33 10/07/2019 USD 0 6 675 0.00
Total Warrants 0 17 154 0.01
Supranationals, Governments and Local Public Authorities, Debt Instruments
17 000 000 United States Treasury Bill 0% 25/07/2013 USD 13 123 976 13 235 781 5.35Total Supranationals, Governments and Local Public Authorities, Debt Instruments 13 123 976 13 235 781 5.35
Investment funds
2 131 000 E Fund CSI 100 A-Share ETF HKD 6 041 448 6 317 312 2.56Total Investment funds 6 041 448 6 317 312 2.56
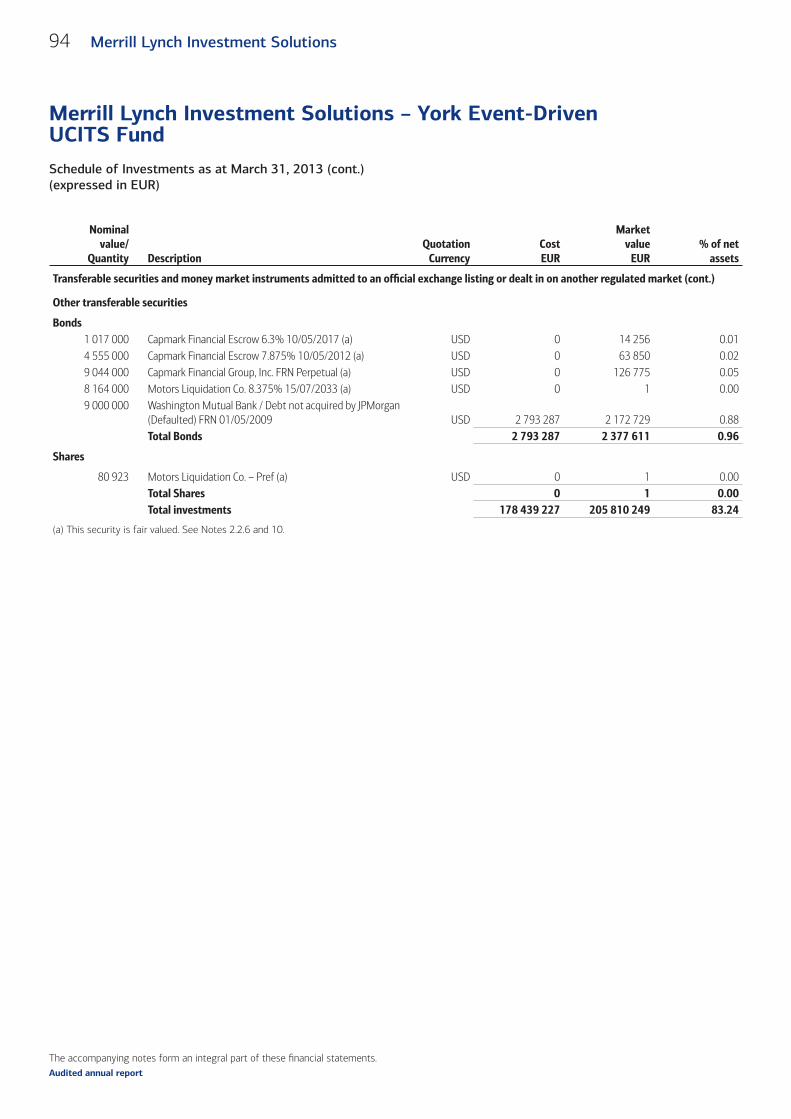
The accompanying notes form an integral part of these fi nancial statements.
Schedule of Investments as at March 31, 2013 (cont.)(expressed in EUR)
Merrill Lynch Investment Solutions – York Event-Driven UCITS Fund
94 Merrill Lynch Investment Solutions
Audited annual report
Nominalvalue/
Quantity DescriptionQuotation
CurrencyCostEUR
Marketvalue
EUR% of net
assets
Transferable securities and money market instruments admitted to an offi cial exchange listing or dealt in on another regulated market (cont.)
Other transferable securities
Bonds1 017 000 Capmark Financial Escrow 6.3% 10/05/2017 (a) USD 0 14 256 0.014 555 000 Capmark Financial Escrow 7.875% 10/05/2012 (a) USD 0 63 850 0.029 044 000 Capmark Financial Group, Inc. FRN Perpetual (a) USD 0 126 775 0.058 164 000 Motors Liquidation Co. 8.375% 15/07/2033 (a) USD 0 1 0.009 000 000 Washington Mutual Bank / Debt not acquired by JPMorgan
(Defaulted) FRN 01/05/2009 USD 2 793 287 2 172 729 0.88Total Bonds 2 793 287 2 377 611 0.96
Shares
80 923 Motors Liquidation Co. – Pref (a) USD 0 1 0.00Total Shares 0 1 0.00Total investments 178 439 227 205 810 249 83.24
(a) This security is fair valued. See Notes 2.2.6 and 10.
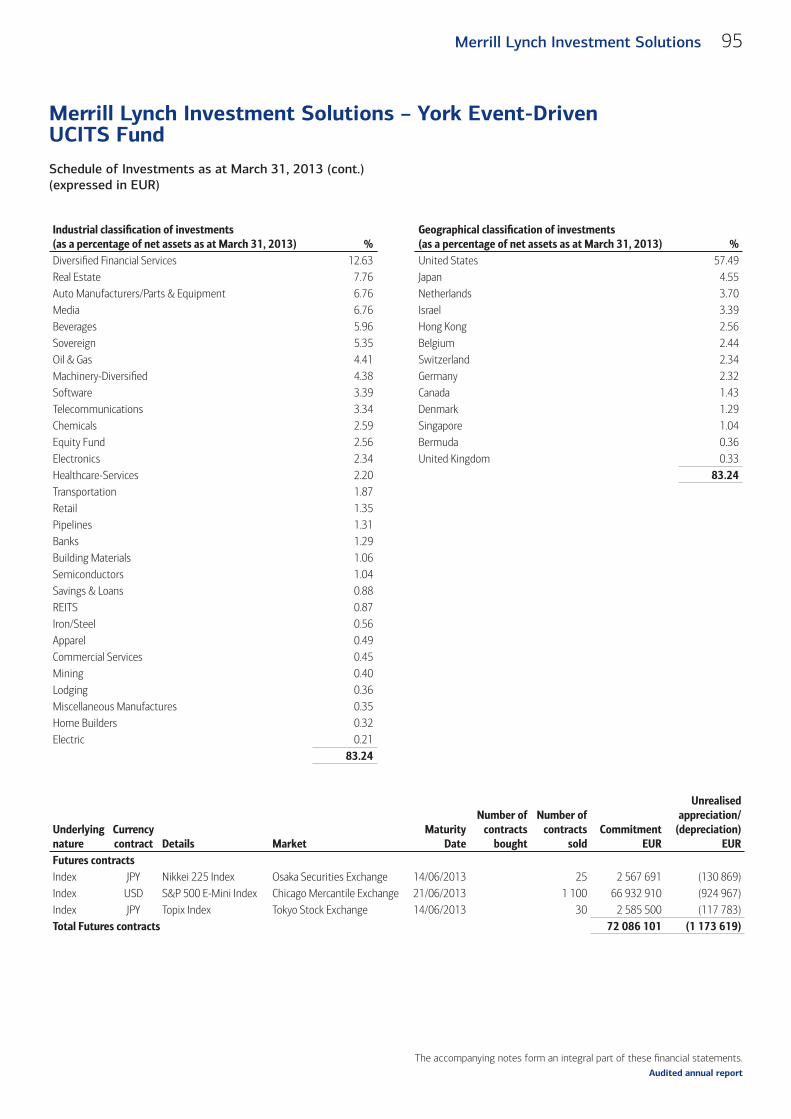
The accompanying notes form an integral part of these fi nancial statements.
Schedule of Investments as at March 31, 2013 (cont.)(expressed in EUR)
Merrill Lynch Investment Solutions – York Event-Driven UCITS Fund
95Merrill Lynch Investment Solutions
Audited annual report
Industrial classifi cation of investments(as a percentage of net assets as at March 31, 2013) %
Geographical classifi cation of investments(as a percentage of net assets as at March 31, 2013) %
Diversifi ed Financial Services 12.63 United States 57.49Real Estate 7.76 Japan 4.55Auto Manufacturers/Parts & Equipment 6.76 Netherlands 3.70Media 6.76 Israel 3.39Beverages 5.96 Hong Kong 2.56Sovereign 5.35 Belgium 2.44Oil & Gas 4.41 Switzerland 2.34Machinery-Diversifi ed 4.38 Germany 2.32Software 3.39 Canada 1.43Telecommunications 3.34 Denmark 1.29Chemicals 2.59 Singapore 1.04Equity Fund 2.56 Bermuda 0.36Electronics 2.34 United Kingdom 0.33Healthcare-Services 2.20 83.24 Transportation 1.87Retail 1.35Pipelines 1.31Banks 1.29Building Materials 1.06Semiconductors 1.04Savings & Loans 0.88REITS 0.87Iron/Steel 0.56Apparel 0.49Commercial Services 0.45Mining 0.40Lodging 0.36Miscellaneous Manufactures 0.35Home Builders 0.32Electric 0.21
83.24
Underlyingnature
Currencycontract Details Market
MaturityDate
Number ofcontracts
bought
Number ofcontracts
soldCommitment
EUR
Unrealisedappreciation/
(depreciation)EUR
Futures contractsIndex JPY Nikkei 225 Index Osaka Securities Exchange 14/06/2013 25 2 567 691 (130 869)Index USD S&P 500 E-Mini Index Chicago Mercantile Exchange 21/06/2013 1 100 66 932 910 (924 967)Index JPY Topix Index Tokyo Stock Exchange 14/06/2013 30 2 585 500 (117 783)Total Futures contracts 72 086 101 (1 173 619)
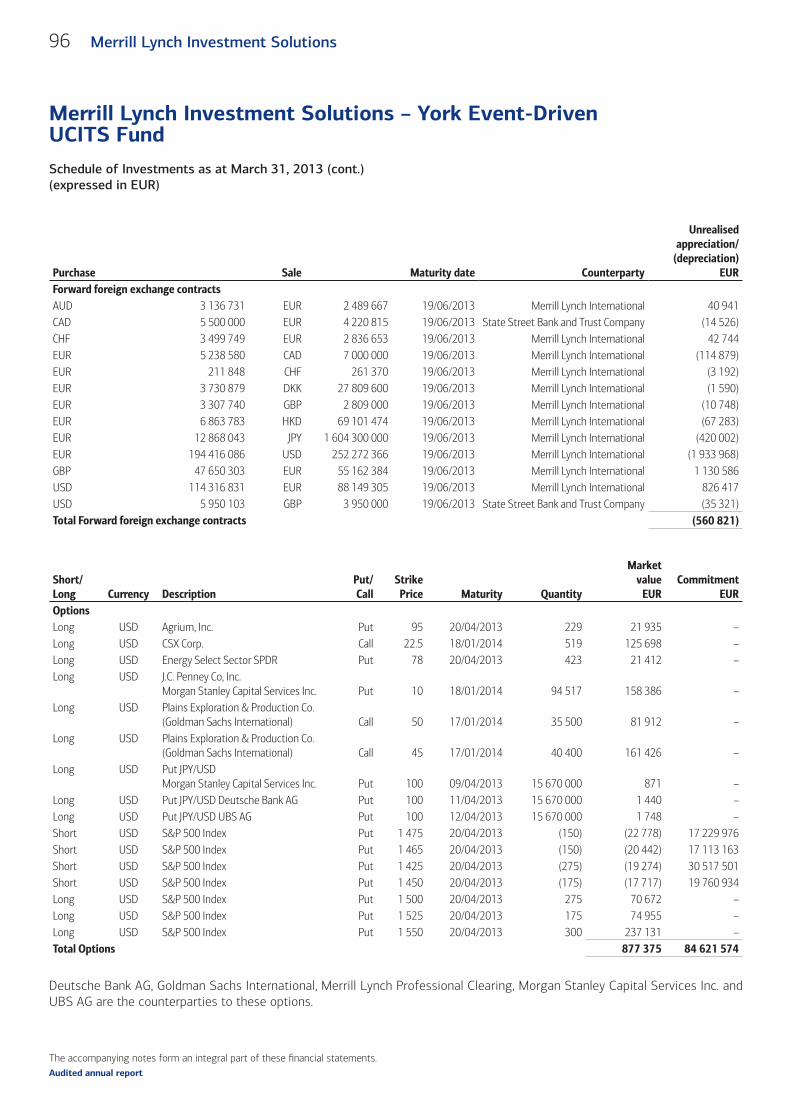
The accompanying notes form an integral part of these fi nancial statements.
Schedule of Investments as at March 31, 2013 (cont.)(expressed in EUR)
Merrill Lynch Investment Solutions – York Event-Driven UCITS Fund
96 Merrill Lynch Investment Solutions
Audited annual report
Purchase Sale Maturity date Counterparty
Unrealisedappreciation/
(depreciation)EUR
Forward foreign exchange contractsAUD 3 136 731 EUR 2 489 667 19/06/2013 Merrill Lynch International 40 941 CAD 5 500 000 EUR 4 220 815 19/06/2013 State Street Bank and Trust Company (14 526)CHF 3 499 749 EUR 2 836 653 19/06/2013 Merrill Lynch International 42 744 EUR 5 238 580 CAD 7 000 000 19/06/2013 Merrill Lynch International (114 879)EUR 211 848 CHF 261 370 19/06/2013 Merrill Lynch International (3 192)EUR 3 730 879 DKK 27 809 600 19/06/2013 Merrill Lynch International (1 590)EUR 3 307 740 GBP 2 809 000 19/06/2013 Merrill Lynch International (10 748)EUR 6 863 783 HKD 69 101 474 19/06/2013 Merrill Lynch International (67 283)EUR 12 868 043 JPY 1 604 300 000 19/06/2013 Merrill Lynch International (420 002)EUR 194 416 086 USD 252 272 366 19/06/2013 Merrill Lynch International (1 933 968)GBP 47 650 303 EUR 55 162 384 19/06/2013 Merrill Lynch International 1 130 586 USD 114 316 831 EUR 88 149 305 19/06/2013 Merrill Lynch International 826 417 USD 5 950 103 GBP 3 950 000 19/06/2013 State Street Bank and Trust Company (35 321)Total Forward foreign exchange contracts (560 821)
Short/Long Currency Description
Put/Call
StrikePrice Maturity Quantity
Marketvalue
EURCommitment
EUROptionsLong USD Agrium, Inc. Put 95 20/04/2013 229 21 935 –Long USD CSX Corp. Call 22.5 18/01/2014 519 125 698 –Long USD Energy Select Sector SPDR Put 78 20/04/2013 423 21 412 –Long USD J.C. Penney Co, Inc.
Morgan Stanley Capital Services Inc. Put 10 18/01/2014 94 517 158 386 –Long USD Plains Exploration & Production Co.
(Goldman Sachs International) Call 50 17/01/2014 35 500 81 912 –Long USD Plains Exploration & Production Co.
(Goldman Sachs International) Call 45 17/01/2014 40 400 161 426 –Long USD Put JPY/USD
Morgan Stanley Capital Services Inc. Put 100 09/04/2013 15 670 000 871 –Long USD Put JPY/USD Deutsche Bank AG Put 100 11/04/2013 15 670 000 1 440 –Long USD Put JPY/USD UBS AG Put 100 12/04/2013 15 670 000 1 748 –Short USD S&P 500 Index Put 1 475 20/04/2013 (150) (22 778) 17 229 976Short USD S&P 500 Index Put 1 465 20/04/2013 (150) (20 442) 17 113 163Short USD S&P 500 Index Put 1 425 20/04/2013 (275) (19 274) 30 517 501Short USD S&P 500 Index Put 1 450 20/04/2013 (175) (17 717) 19 760 934Long USD S&P 500 Index Put 1 500 20/04/2013 275 70 672 –Long USD S&P 500 Index Put 1 525 20/04/2013 175 74 955 –Long USD S&P 500 Index Put 1 550 20/04/2013 300 237 131 –Total Options 877 375 84 621 574
Deutsche Bank AG, Goldman Sachs International, Merrill Lynch Professional Clearing, Morgan Stanley Capital Services Inc. and UBS AG are the counterparties to these options.
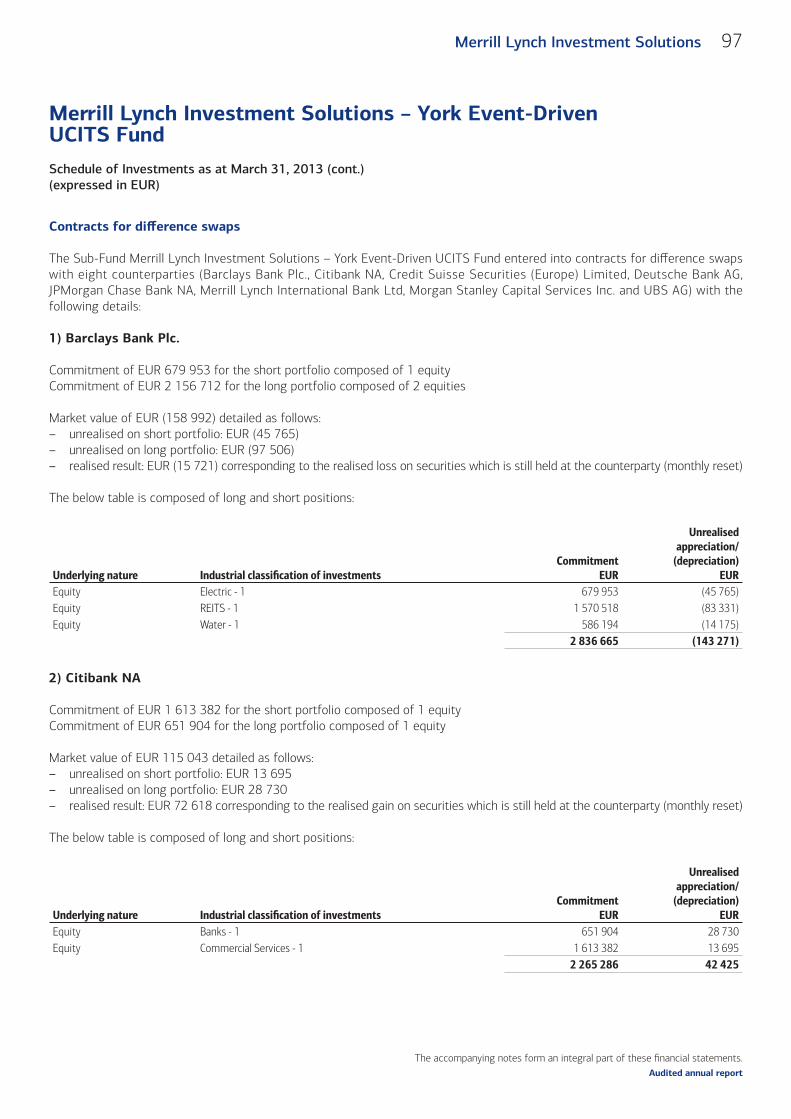
The accompanying notes form an integral part of these fi nancial statements.
Schedule of Investments as at March 31, 2013 (cont.)(expressed in EUR)
Merrill Lynch Investment Solutions – York Event-Driven UCITS Fund
97Merrill Lynch Investment Solutions
Audited annual report
Contracts for diff erence swaps
The Sub-Fund Merrill Lynch Investment Solutions – York Event-Driven UCITS Fund entered into contracts for diff erence swaps with eight counterparties (Barclays Bank Plc., Citibank NA, Credit Suisse Securities (Europe) Limited, Deutsche Bank AG, JPMorgan Chase Bank NA, Merrill Lynch International Bank Ltd, Morgan Stanley Capital Services Inc. and UBS AG) with the following details:
1) Barclays Bank Plc.
Commitment of EUR 679 953 for the short portfolio composed of 1 equityCommitment of EUR 2 156 712 for the long portfolio composed of 2 equities
Market value of EUR (158 992) detailed as follows:– unrealised on short portfolio: EUR (45 765)– unrealised on long portfolio: EUR (97 506)– realised result: EUR (15 721) corresponding to the realised loss on securities which is still held at the counterparty (monthly reset)
The below table is composed of long and short positions:
Underlying nature Industrial classifi cation of investments Commitment
EUR
Unrealised appreciation/
(depreciation)EUR
Equity Electric - 1 679 953 (45 765)Equity REITS - 1 1 570 518 (83 331)Equity Water - 1 586 194 (14 175)
2 836 665 (143 271)
2) Citibank NA
Commitment of EUR 1 613 382 for the short portfolio composed of 1 equityCommitment of EUR 651 904 for the long portfolio composed of 1 equity
Market value of EUR 115 043 detailed as follows:– unrealised on short portfolio: EUR 13 695– unrealised on long portfolio: EUR 28 730– realised result: EUR 72 618 corresponding to the realised gain on securities which is still held at the counterparty (monthly reset)
The below table is composed of long and short positions:
Underlying nature Industrial classifi cation of investments Commitment
EUR
Unrealised appreciation/
(depreciation)EUR
Equity Banks - 1 651 904 28 730 Equity Commercial Services - 1 1 613 382 13 695
2 265 286 42 425
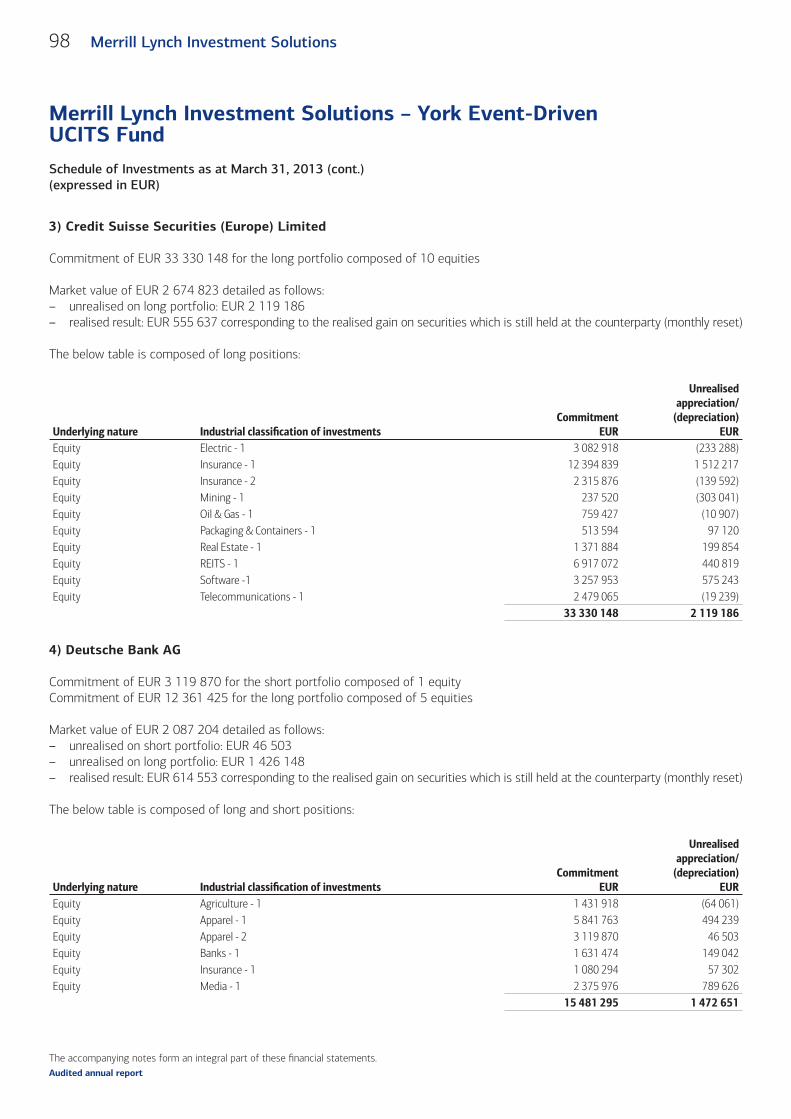
The accompanying notes form an integral part of these fi nancial statements.
Schedule of Investments as at March 31, 2013 (cont.)(expressed in EUR)
Merrill Lynch Investment Solutions – York Event-Driven UCITS Fund
98 Merrill Lynch Investment Solutions
Audited annual report
3) Credit Suisse Securities (Europe) Limited
Commitment of EUR 33 330 148 for the long portfolio composed of 10 equities
Market value of EUR 2 674 823 detailed as follows:– unrealised on long portfolio: EUR 2 119 186– realised result: EUR 555 637 corresponding to the realised gain on securities which is still held at the counterparty (monthly reset)
The below table is composed of long positions:
Underlying nature Industrial classifi cation of investments Commitment
EUR
Unrealised appreciation/
(depreciation)EUR
Equity Electric - 1 3 082 918 (233 288)Equity Insurance - 1 12 394 839 1 512 217 Equity Insurance - 2 2 315 876 (139 592)Equity Mining - 1 237 520 (303 041)Equity Oil & Gas - 1 759 427 (10 907)Equity Packaging & Containers - 1 513 594 97 120 Equity Real Estate - 1 1 371 884 199 854 Equity REITS - 1 6 917 072 440 819 Equity Software -1 3 257 953 575 243 Equity Telecommunications - 1 2 479 065 (19 239)
33 330 148 2 119 186
4) Deutsche Bank AG
Commitment of EUR 3 119 870 for the short portfolio composed of 1 equityCommitment of EUR 12 361 425 for the long portfolio composed of 5 equities
Market value of EUR 2 087 204 detailed as follows:– unrealised on short portfolio: EUR 46 503– unrealised on long portfolio: EUR 1 426 148– realised result: EUR 614 553 corresponding to the realised gain on securities which is still held at the counterparty (monthly reset)
The below table is composed of long and short positions:
Underlying nature Industrial classifi cation of investments Commitment
EUR
Unrealised appreciation/
(depreciation)EUR
Equity Agriculture - 1 1 431 918 (64 061)Equity Apparel - 1 5 841 763 494 239 Equity Apparel - 2 3 119 870 46 503 Equity Banks - 1 1 631 474 149 042 Equity Insurance - 1 1 080 294 57 302 Equity Media - 1 2 375 976 789 626
15 481 295 1 472 651
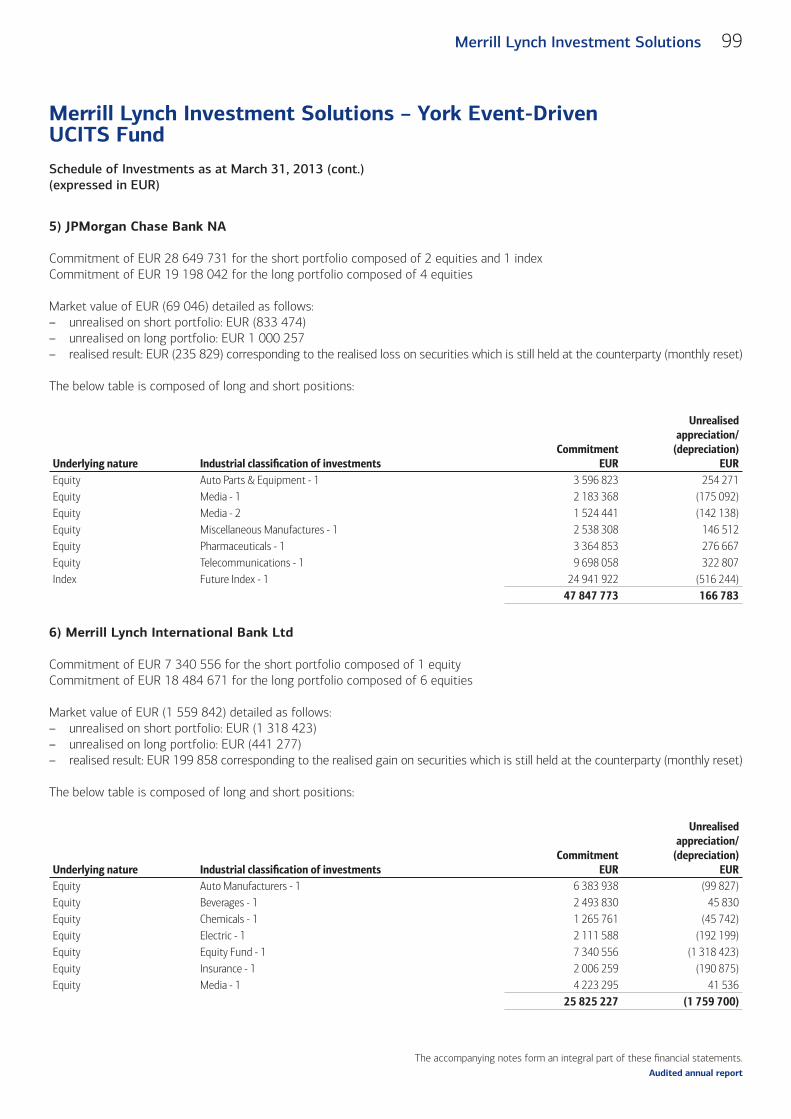
The accompanying notes form an integral part of these fi nancial statements.
Schedule of Investments as at March 31, 2013 (cont.)(expressed in EUR)
Merrill Lynch Investment Solutions – York Event-Driven UCITS Fund
99Merrill Lynch Investment Solutions
Audited annual report
5) JPMorgan Chase Bank NA
Commitment of EUR 28 649 731 for the short portfolio composed of 2 equities and 1 indexCommitment of EUR 19 198 042 for the long portfolio composed of 4 equities
Market value of EUR (69 046) detailed as follows:– unrealised on short portfolio: EUR (833 474)– unrealised on long portfolio: EUR 1 000 257– realised result: EUR (235 829) corresponding to the realised loss on securities which is still held at the counterparty (monthly reset)
The below table is composed of long and short positions:
Underlying nature Industrial classifi cation of investments Commitment
EUR
Unrealised appreciation/
(depreciation)EUR
Equity Auto Parts & Equipment - 1 3 596 823 254 271 Equity Media - 1 2 183 368 (175 092)Equity Media - 2 1 524 441 (142 138)Equity Miscellaneous Manufactures - 1 2 538 308 146 512 Equity Pharmaceuticals - 1 3 364 853 276 667 Equity Telecommunications - 1 9 698 058 322 807 Index Future Index - 1 24 941 922 (516 244)
47 847 773 166 783
6) Merrill Lynch International Bank Ltd
Commitment of EUR 7 340 556 for the short portfolio composed of 1 equityCommitment of EUR 18 484 671 for the long portfolio composed of 6 equities
Market value of EUR (1 559 842) detailed as follows:– unrealised on short portfolio: EUR (1 318 423)– unrealised on long portfolio: EUR (441 277)– realised result: EUR 199 858 corresponding to the realised gain on securities which is still held at the counterparty (monthly reset)
The below table is composed of long and short positions:
Underlying nature Industrial classifi cation of investments Commitment
EUR
Unrealised appreciation/
(depreciation)EUR
Equity Auto Manufacturers - 1 6 383 938 (99 827)Equity Beverages - 1 2 493 830 45 830 Equity Chemicals - 1 1 265 761 (45 742)Equity Electric - 1 2 111 588 (192 199)Equity Equity Fund - 1 7 340 556 (1 318 423)Equity Insurance - 1 2 006 259 (190 875)Equity Media - 1 4 223 295 41 536
25 825 227 (1 759 700)

The accompanying notes form an integral part of these fi nancial statements.
Schedule of Investments as at March 31, 2013 (cont.)(expressed in EUR)
Merrill Lynch Investment Solutions – York Event-Driven UCITS Fund
100 Merrill Lynch Investment Solutions
Audited annual report
7) Morgan Stanley Capital Services Inc.
Commitment of EUR 1 597 028 for the short portfolio composed of 2 equitiesCommitment of EUR 58 666 227 for the long portfolio composed of 12 equities
Market value of EUR 222 886 detailed as follows:– unrealised on short portfolio: EUR 29 985– unrealised on long portfolio: EUR 36 515– realised result: EUR 156 386 corresponding to the realised gain on securities which is still held at the counterparty (monthly reset)
The below table is composed of long and short positions:
Underlying nature Industrial classifi cation of investments Commitment
EUR
Unrealised appreciation/
(depreciation)EUR
Equity Auto Manufacturers - 1 3 668 621 (96 224)Equity Building Materials - 1 3 019 627 (298 301)Equity Commercial Services - 1 6 714 582 1 070 613 Equity Commercial Services - 2 2 613 659 6 718 Equity Electric - 1 510 208 1 835 Equity Engineering & Construction - 1 6 843 927 126 149 Equity Food - 1 12 965 330 (38 561)Equity Food - 2 1 086 820 28 150 Equity Insurance - 1 3 819 110 (66 612)Equity Iron/Steel - 1 1 254 055 (2 269 284)Equity Media - 1 5 433 739 907 817 Equity Oil & Gas - 1 5 010 139 287 503 Equity Pharmaceuticals - 1 3 212 773 41 733 Equity Telecommunications - 1 4 110 665 364 964
60 263 255 66 500
8) UBS AG
Commitment of EUR 5 657 894 for the short portfolio composed of 3 equitiesCommitment of EUR 7 723 164 for the long portfolio composed of 3 equities
Market value of EUR (457 409) detailed as follows:– unrealised on short portfolio: EUR (694 647)– unrealised on long portfolio: EUR 308 786– realised result: EUR (71 548) corresponding to the realised loss on securities which is still held at the counterparty (monthly reset)
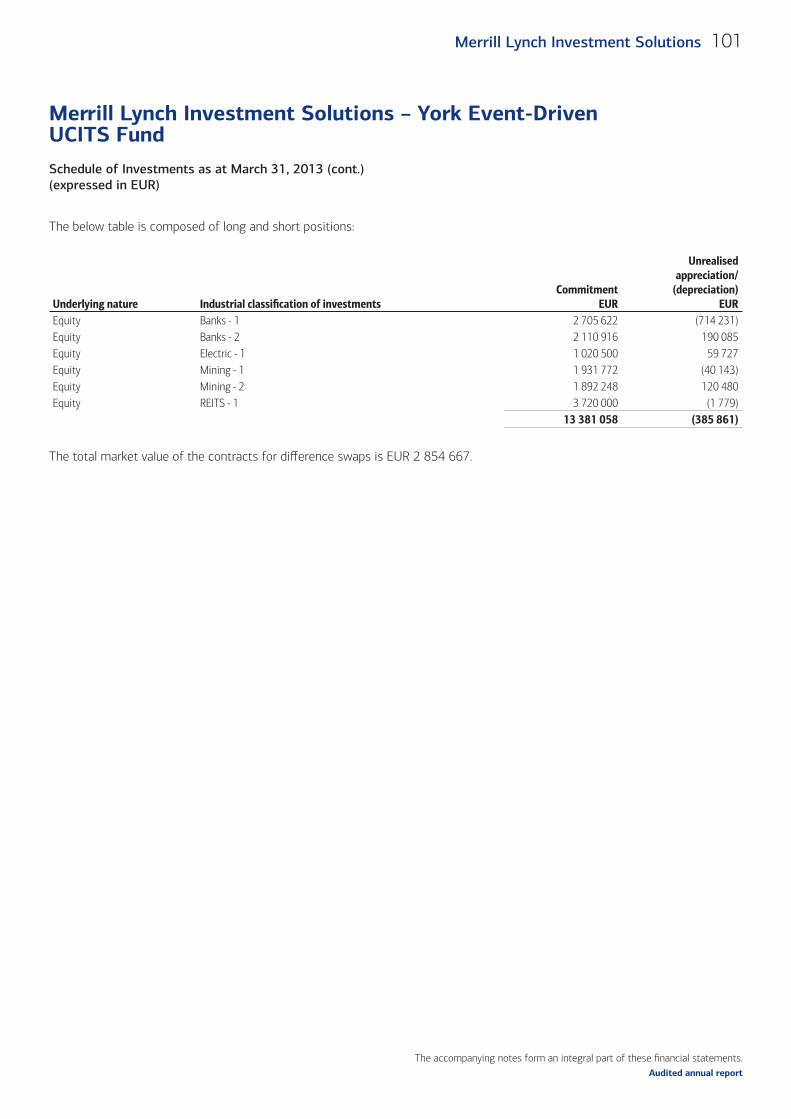
The accompanying notes form an integral part of these fi nancial statements.
Schedule of Investments as at March 31, 2013 (cont.)(expressed in EUR)
Merrill Lynch Investment Solutions – York Event-Driven UCITS Fund
101Merrill Lynch Investment Solutions
Audited annual report
The below table is composed of long and short positions:
Underlying nature Industrial classifi cation of investments Commitment
EUR
Unrealised appreciation/
(depreciation)EUR
Equity Banks - 1 2 705 622 (714 231)Equity Banks - 2 2 110 916 190 085 Equity Electric - 1 1 020 500 59 727 Equity Mining - 1 1 931 772 (40 143)Equity Mining - 2 1 892 248 120 480 Equity REITS - 1 3 720 000 (1 779)
13 381 058 (385 861)
The total market value of the contracts for diff erence swaps is EUR 2 854 667.
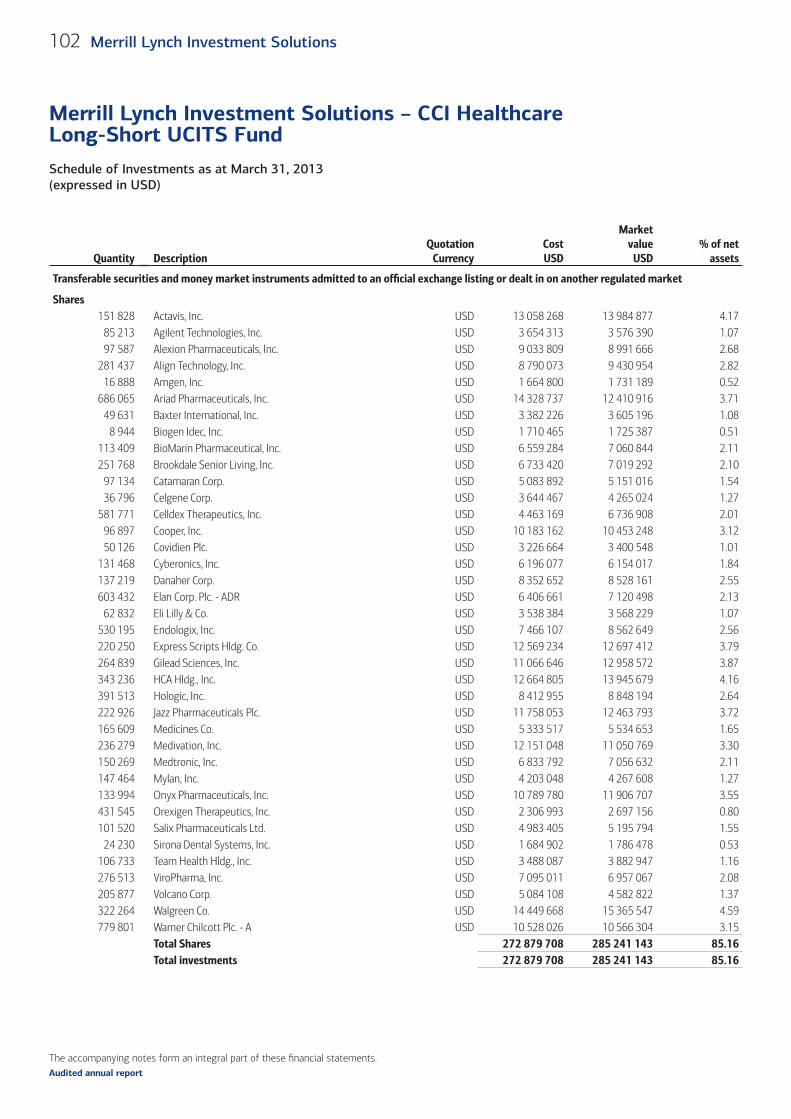
The accompanying notes form an integral part of these fi nancial statements.
Schedule of Investments as at March 31, 2013 (expressed in USD)
Merrill Lynch Investment Solutions – CCI Healthcare Long-Short UCITS Fund
102 Merrill Lynch Investment Solutions
Audited annual report
Quantity DescriptionQuotation
CurrencyCostUSD
Marketvalue
USD% of net
assets
Transferable securities and money market instruments admitted to an offi cial exchange listing or dealt in on another regulated market
Shares151 828 Actavis, Inc. USD 13 058 268 13 984 877 4.17
85 213 Agilent Technologies, Inc. USD 3 654 313 3 576 390 1.0797 587 Alexion Pharmaceuticals, Inc. USD 9 033 809 8 991 666 2.68
281 437 Align Technology, Inc. USD 8 790 073 9 430 954 2.8216 888 Amgen, Inc. USD 1 664 800 1 731 189 0.52
686 065 Ariad Pharmaceuticals, Inc. USD 14 328 737 12 410 916 3.7149 631 Baxter International, Inc. USD 3 382 226 3 605 196 1.08
8 944 Biogen Idec, Inc. USD 1 710 465 1 725 387 0.51113 409 BioMarin Pharmaceutical, Inc. USD 6 559 284 7 060 844 2.11251 768 Brookdale Senior Living, Inc. USD 6 733 420 7 019 292 2.10
97 134 Catamaran Corp. USD 5 083 892 5 151 016 1.5436 796 Celgene Corp. USD 3 644 467 4 265 024 1.27
581 771 Celldex Therapeutics, Inc. USD 4 463 169 6 736 908 2.0196 897 Cooper, Inc. USD 10 183 162 10 453 248 3.1250 126 Covidien Plc. USD 3 226 664 3 400 548 1.01
131 468 Cyberonics, Inc. USD 6 196 077 6 154 017 1.84137 219 Danaher Corp. USD 8 352 652 8 528 161 2.55603 432 Elan Corp. Plc. - ADR USD 6 406 661 7 120 498 2.13
62 832 Eli Lilly & Co. USD 3 538 384 3 568 229 1.07530 195 Endologix, Inc. USD 7 466 107 8 562 649 2.56220 250 Express Scripts Hldg. Co. USD 12 569 234 12 697 412 3.79264 839 Gilead Sciences, Inc. USD 11 066 646 12 958 572 3.87343 236 HCA Hldg., Inc. USD 12 664 805 13 945 679 4.16391 513 Hologic, Inc. USD 8 412 955 8 848 194 2.64222 926 Jazz Pharmaceuticals Plc. USD 11 758 053 12 463 793 3.72165 609 Medicines Co. USD 5 333 517 5 534 653 1.65236 279 Medivation, Inc. USD 12 151 048 11 050 769 3.30150 269 Medtronic, Inc. USD 6 833 792 7 056 632 2.11147 464 Mylan, Inc. USD 4 203 048 4 267 608 1.27133 994 Onyx Pharmaceuticals, Inc. USD 10 789 780 11 906 707 3.55431 545 Orexigen Therapeutics, Inc. USD 2 306 993 2 697 156 0.80101 520 Salix Pharmaceuticals Ltd. USD 4 983 405 5 195 794 1.55
24 230 Sirona Dental Systems, Inc. USD 1 684 902 1 786 478 0.53106 733 Team Health Hldg., Inc. USD 3 488 087 3 882 947 1.16276 513 ViroPharma, Inc. USD 7 095 011 6 957 067 2.08205 877 Volcano Corp. USD 5 084 108 4 582 822 1.37322 264 Walgreen Co. USD 14 449 668 15 365 547 4.59779 801 Warner Chilcott Plc. - A USD 10 528 026 10 566 304 3.15
Total Shares 272 879 708 285 241 143 85.16Total investments 272 879 708 285 241 143 85.16
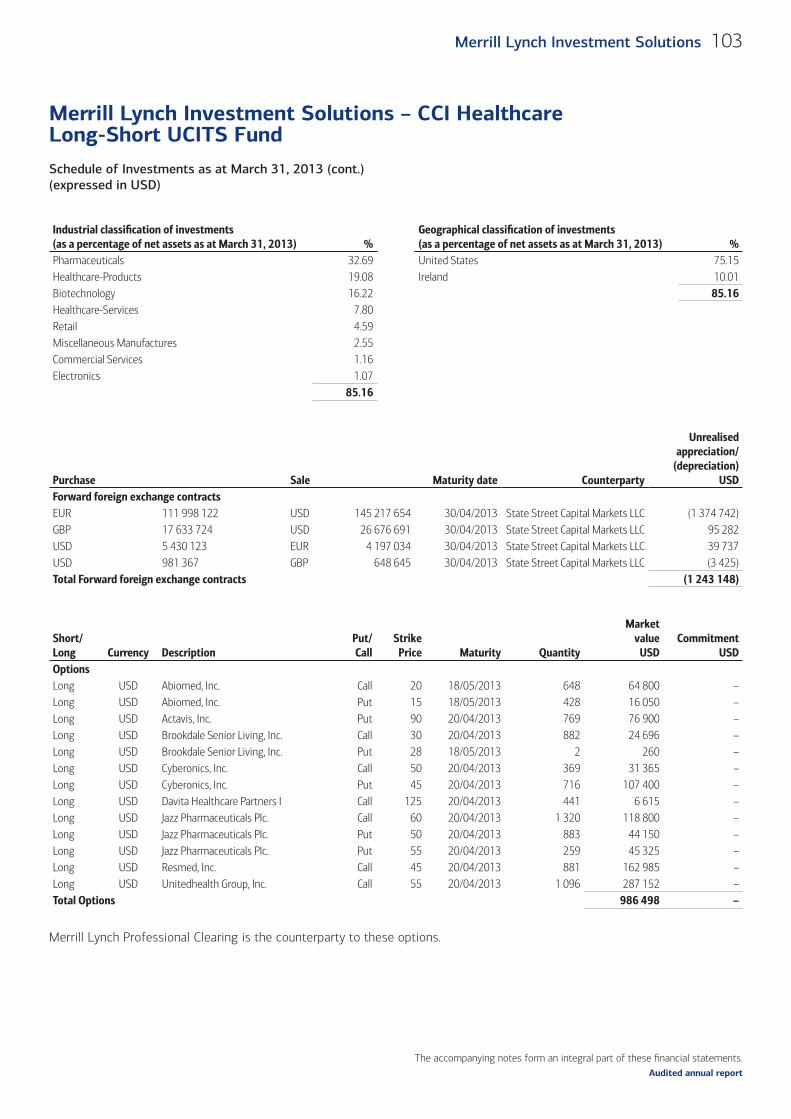
The accompanying notes form an integral part of these fi nancial statements.
Schedule of Investments as at March 31, 2013 (cont.)(expressed in USD)
Merrill Lynch Investment Solutions – CCI Healthcare Long-Short UCITS Fund
103Merrill Lynch Investment Solutions
Audited annual report
Industrial classifi cation of investments (as a percentage of net assets as at March 31, 2013) %
Geographical classifi cation of investments(as a percentage of net assets as at March 31, 2013) %
Pharmaceuticals 32.69 United States 75.15Healthcare-Products 19.08 Ireland 10.01Biotechnology 16.22 85.16Healthcare-Services 7.80Retail 4.59Miscellaneous Manufactures 2.55Commercial Services 1.16Electronics 1.07
85.16
Purchase Sale Maturity date Counterparty
Unrealisedappreciation/
(depreciation)USD
Forward foreign exchange contractsEUR 111 998 122 USD 145 217 654 30/04/2013 State Street Capital Markets LLC (1 374 742)GBP 17 633 724 USD 26 676 691 30/04/2013 State Street Capital Markets LLC 95 282 USD 5 430 123 EUR 4 197 034 30/04/2013 State Street Capital Markets LLC 39 737 USD 981 367 GBP 648 645 30/04/2013 State Street Capital Markets LLC (3 425)Total Forward foreign exchange contracts (1 243 148)
Short/Long Currency Description
Put/Call
StrikePrice Maturity Quantity
Marketvalue
USDCommitment
USDOptionsLong USD Abiomed, Inc. Call 20 18/05/2013 648 64 800 –Long USD Abiomed, Inc. Put 15 18/05/2013 428 16 050 –Long USD Actavis, Inc. Put 90 20/04/2013 769 76 900 –Long USD Brookdale Senior Living, Inc. Call 30 20/04/2013 882 24 696 –Long USD Brookdale Senior Living, Inc. Put 28 18/05/2013 2 260 –Long USD Cyberonics, Inc. Call 50 20/04/2013 369 31 365 –Long USD Cyberonics, Inc. Put 45 20/04/2013 716 107 400 –Long USD Davita Healthcare Partners I Call 125 20/04/2013 441 6 615 –Long USD Jazz Pharmaceuticals Plc. Call 60 20/04/2013 1 320 118 800 –Long USD Jazz Pharmaceuticals Plc. Put 50 20/04/2013 883 44 150 –Long USD Jazz Pharmaceuticals Plc. Put 55 20/04/2013 259 45 325 –Long USD Resmed, Inc. Call 45 20/04/2013 881 162 985 –Long USD Unitedhealth Group, Inc. Call 55 20/04/2013 1 096 287 152 –Total Options 986 498 –
Merrill Lynch Professional Clearing is the counterparty to these options.
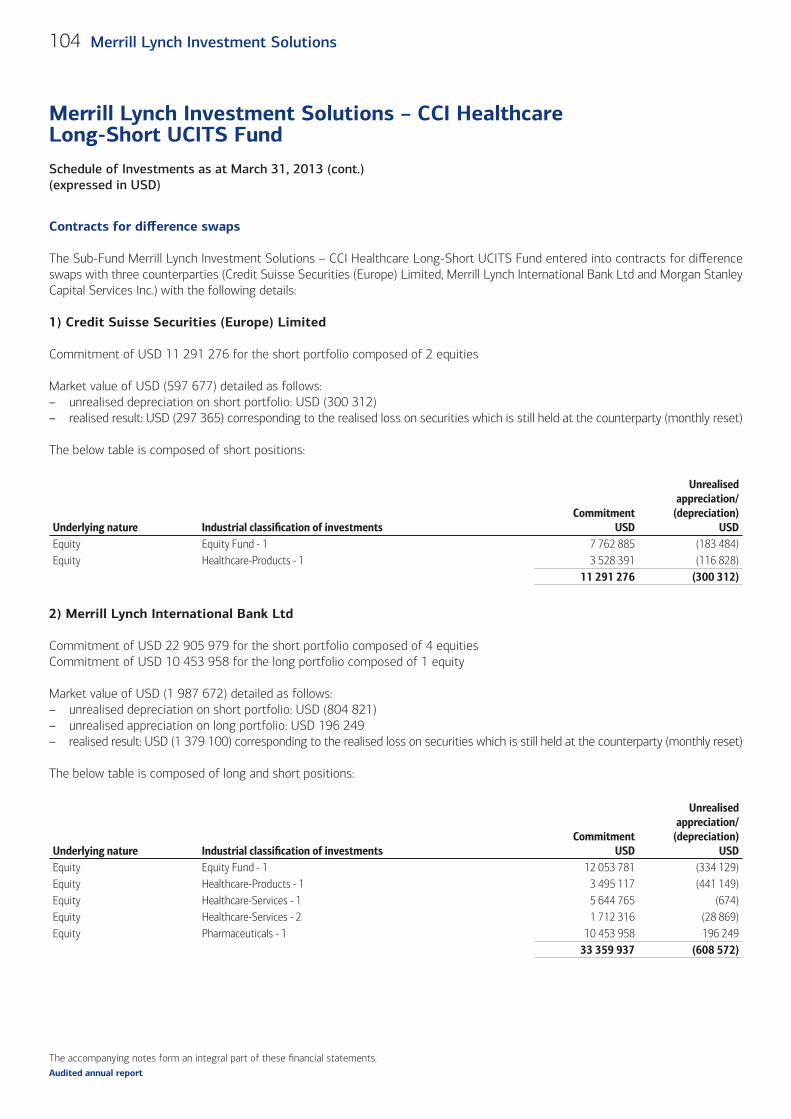
The accompanying notes form an integral part of these fi nancial statements.
Schedule of Investments as at March 31, 2013 (cont.)(expressed in USD)
Merrill Lynch Investment Solutions – CCI Healthcare Long-Short UCITS Fund
104 Merrill Lynch Investment Solutions
Audited annual report
Contracts for diff erence swaps
The Sub-Fund Merrill Lynch Investment Solutions – CCI Healthcare Long-Short UCITS Fund entered into contracts for diff erence swaps with three counterparties (Credit Suisse Securities (Europe) Limited, Merrill Lynch International Bank Ltd and Morgan Stanley Capital Services Inc.) with the following details:
1) Credit Suisse Securities (Europe) Limited
Commitment of USD 11 291 276 for the short portfolio composed of 2 equities
Market value of USD (597 677) detailed as follows:– unrealised depreciation on short portfolio: USD (300 312)– realised result: USD (297 365) corresponding to the realised loss on securities which is still held at the counterparty (monthly reset)
The below table is composed of short positions:
Underlying nature Industrial classifi cation of investmentsCommitment
USD
Unrealised appreciation/
(depreciation)USD
Equity Equity Fund - 1 7 762 885 (183 484)Equity Healthcare-Products - 1 3 528 391 (116 828)
11 291 276 (300 312)
2) Merrill Lynch International Bank Ltd
Commitment of USD 22 905 979 for the short portfolio composed of 4 equitiesCommitment of USD 10 453 958 for the long portfolio composed of 1 equity
Market value of USD (1 987 672) detailed as follows:– unrealised depreciation on short portfolio: USD (804 821)– unrealised appreciation on long portfolio: USD 196 249– realised result: USD (1 379 100) corresponding to the realised loss on securities which is still held at the counterparty (monthly reset)
The below table is composed of long and short positions:
Underlying nature Industrial classifi cation of investmentsCommitment
USD
Unrealised appreciation/
(depreciation)USD
Equity Equity Fund - 1 12 053 781 (334 129)Equity Healthcare-Products - 1 3 495 117 (441 149)Equity Healthcare-Services - 1 5 644 765 (674)Equity Healthcare-Services - 2 1 712 316 (28 869)Equity Pharmaceuticals - 1 10 453 958 196 249
33 359 937 (608 572)
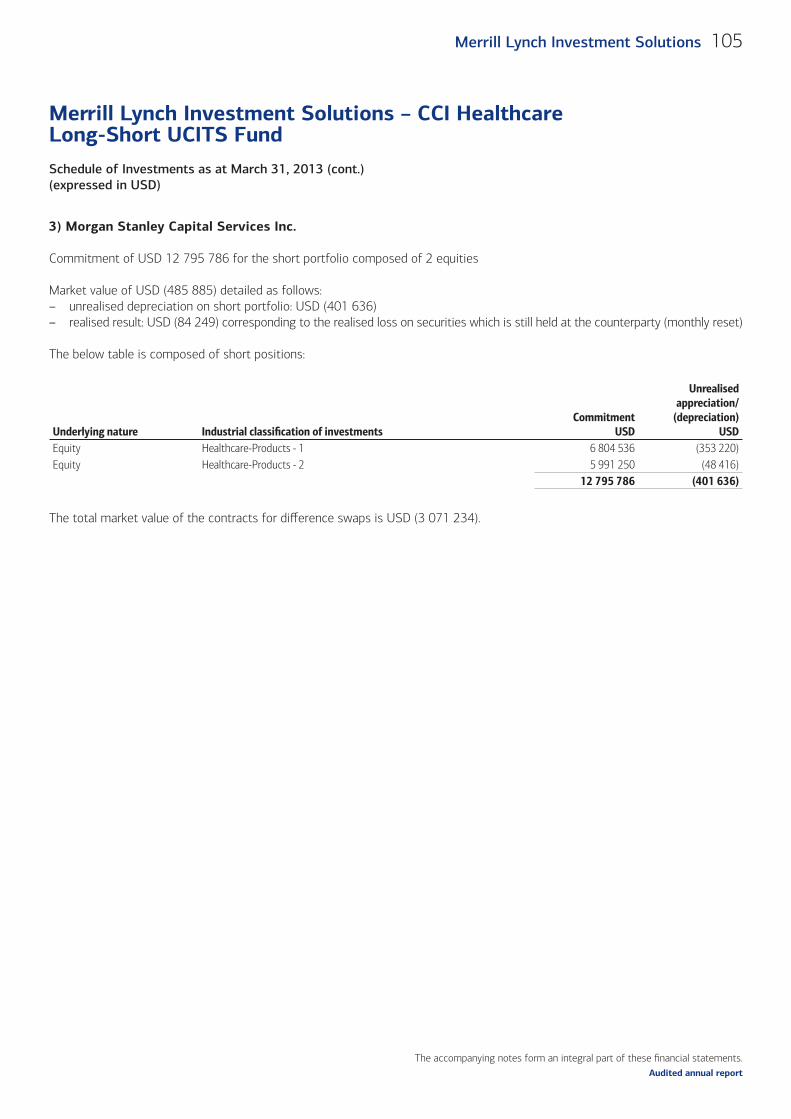
The accompanying notes form an integral part of these fi nancial statements.
Schedule of Investments as at March 31, 2013 (cont.)(expressed in USD)
Merrill Lynch Investment Solutions – CCI Healthcare Long-Short UCITS Fund
105Merrill Lynch Investment Solutions
Audited annual report
3) Morgan Stanley Capital Services Inc.
Commitment of USD 12 795 786 for the short portfolio composed of 2 equities
Market value of USD (485 885) detailed as follows:– unrealised depreciation on short portfolio: USD (401 636)– realised result: USD (84 249) corresponding to the realised loss on securities which is still held at the counterparty (monthly reset)
The below table is composed of short positions:
Underlying nature Industrial classifi cation of investmentsCommitment
USD
Unrealised appreciation/
(depreciation)USD
Equity Healthcare-Products - 1 6 804 536 (353 220)Equity Healthcare-Products - 2 5 991 250 (48 416)
12 795 786 (401 636)
The total market value of the contracts for diff erence swaps is USD (3 071 234).
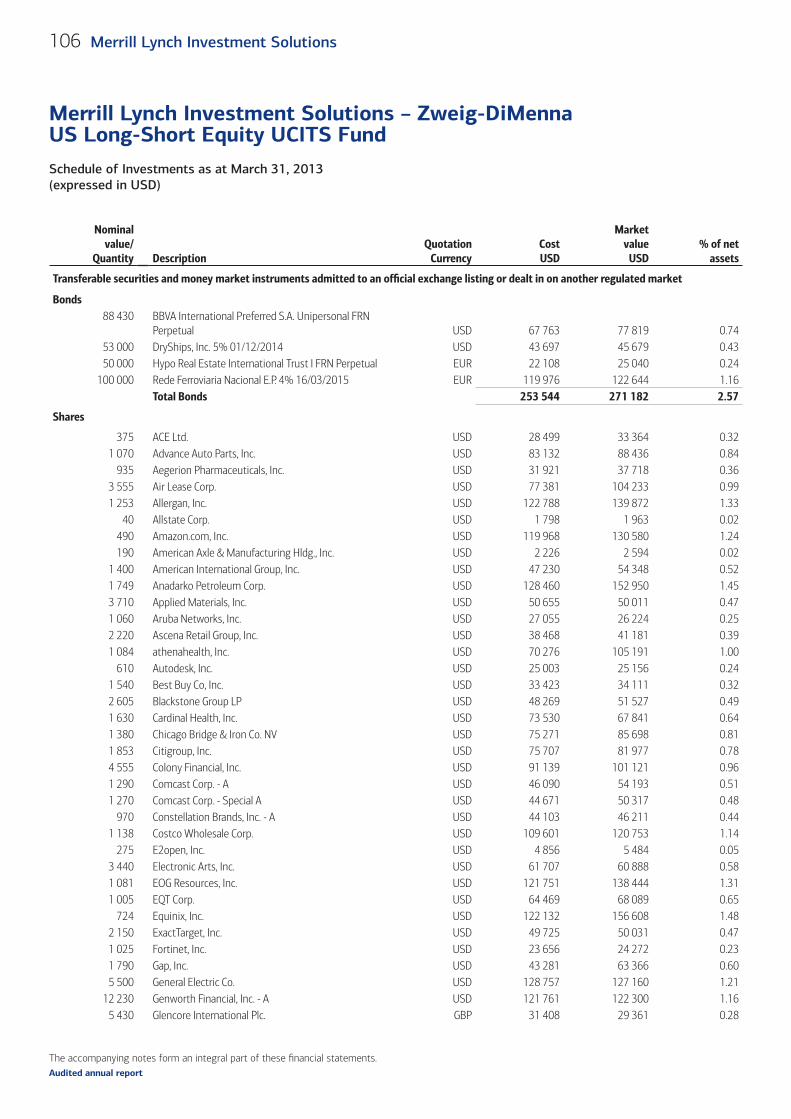
The accompanying notes form an integral part of these fi nancial statements.
Schedule of Investments as at March 31, 2013 (expressed in USD)
Merrill Lynch Investment Solutions – Zweig-DiMenna US Long-Short Equity UCITS Fund
106 Merrill Lynch Investment Solutions
Audited annual report
Nominalvalue/
Quantity DescriptionQuotation
CurrencyCostUSD
Marketvalue
USD% of net
assets
Transferable securities and money market instruments admitted to an offi cial exchange listing or dealt in on another regulated market (cont.)
Bonds88 430 BBVA International Preferred S.A. Unipersonal FRN
Perpetual USD 67 763 77 819 0.7453 000 DryShips, Inc. 5% 01/12/2014 USD 43 697 45 679 0.4350 000 Hypo Real Estate International Trust I FRN Perpetual EUR 22 108 25 040 0.24
100 000 Rede Ferroviaria Nacional E.P. 4% 16/03/2015 EUR 119 976 122 644 1.16Total Bonds 253 544 271 182 2.57
Shares
375 ACE Ltd. USD 28 499 33 364 0.321 070 Advance Auto Parts, Inc. USD 83 132 88 436 0.84
935 Aegerion Pharmaceuticals, Inc. USD 31 921 37 718 0.363 555 Air Lease Corp. USD 77 381 104 233 0.991 253 Allergan, Inc. USD 122 788 139 872 1.33
40 Allstate Corp. USD 1 798 1 963 0.02490 Amazon.com, Inc. USD 119 968 130 580 1.24190 American Axle & Manufacturing Hldg., Inc. USD 2 226 2 594 0.02
1 400 American International Group, Inc. USD 47 230 54 348 0.521 749 Anadarko Petroleum Corp. USD 128 460 152 950 1.453 710 Applied Materials, Inc. USD 50 655 50 011 0.471 060 Aruba Networks, Inc. USD 27 055 26 224 0.252 220 Ascena Retail Group, Inc. USD 38 468 41 181 0.391 084 athenahealth, Inc. USD 70 276 105 191 1.00
610 Autodesk, Inc. USD 25 003 25 156 0.241 540 Best Buy Co, Inc. USD 33 423 34 111 0.322 605 Blackstone Group LP USD 48 269 51 527 0.491 630 Cardinal Health, Inc. USD 73 530 67 841 0.641 380 Chicago Bridge & Iron Co. NV USD 75 271 85 698 0.811 853 Citigroup, Inc. USD 75 707 81 977 0.784 555 Colony Financial, Inc. USD 91 139 101 121 0.961 290 Comcast Corp. - A USD 46 090 54 193 0.511 270 Comcast Corp. - Special A USD 44 671 50 317 0.48
970 Constellation Brands, Inc. - A USD 44 103 46 211 0.441 138 Costco Wholesale Corp. USD 109 601 120 753 1.14
275 E2open, Inc. USD 4 856 5 484 0.053 440 Electronic Arts, Inc. USD 61 707 60 888 0.581 081 EOG Resources, Inc. USD 121 751 138 444 1.311 005 EQT Corp. USD 64 469 68 089 0.65
724 Equinix, Inc. USD 122 132 156 608 1.482 150 ExactTarget, Inc. USD 49 725 50 031 0.471 025 Fortinet, Inc. USD 23 656 24 272 0.231 790 Gap, Inc. USD 43 281 63 366 0.605 500 General Electric Co. USD 128 757 127 160 1.21
12 230 Genworth Financial, Inc. - A USD 121 761 122 300 1.165 430 Glencore International Plc. GBP 31 408 29 361 0.28
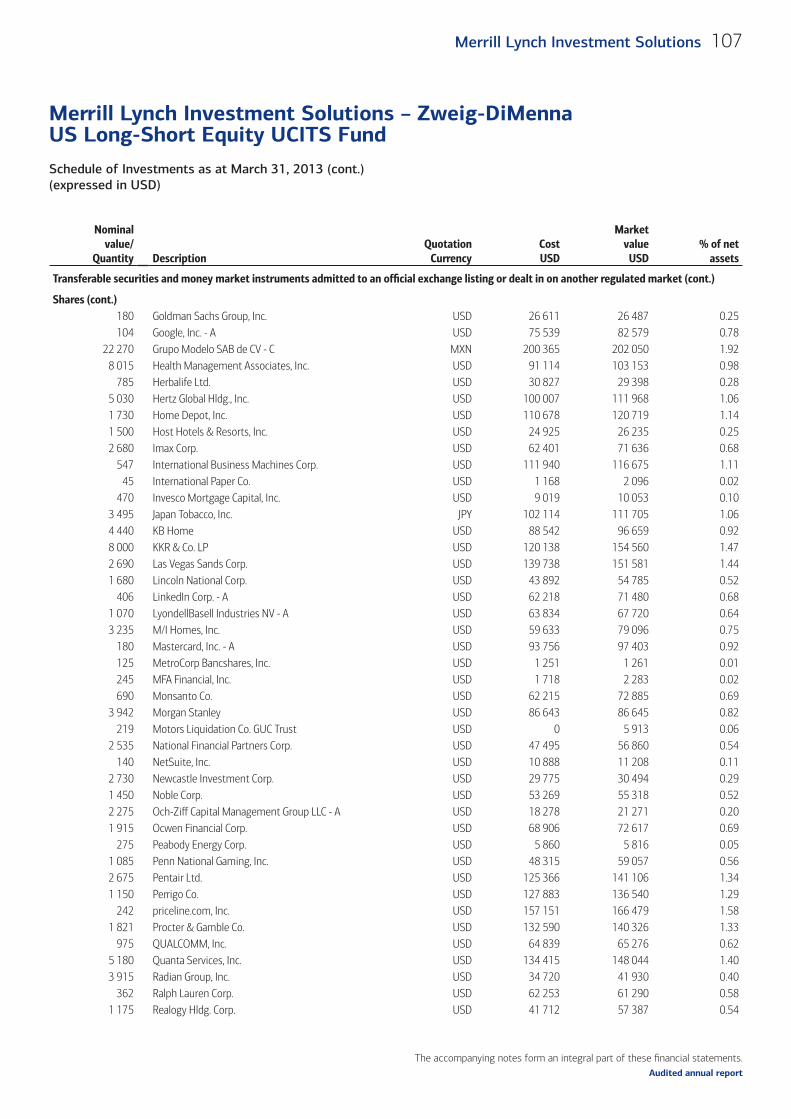
The accompanying notes form an integral part of these fi nancial statements.
Schedule of Investments as at March 31, 2013 (cont.)(expressed in USD)
Merrill Lynch Investment Solutions – Zweig-DiMenna US Long-Short Equity UCITS Fund
107Merrill Lynch Investment Solutions
Audited annual report
Nominalvalue/
Quantity DescriptionQuotation
CurrencyCostUSD
Marketvalue
USD% of net
assets
Transferable securities and money market instruments admitted to an offi cial exchange listing or dealt in on another regulated market (cont.)
Shares (cont.)180 Goldman Sachs Group, Inc. USD 26 611 26 487 0.25104 Google, Inc. - A USD 75 539 82 579 0.78
22 270 Grupo Modelo SAB de CV - C MXN 200 365 202 050 1.928 015 Health Management Associates, Inc. USD 91 114 103 153 0.98
785 Herbalife Ltd. USD 30 827 29 398 0.285 030 Hertz Global Hldg., Inc. USD 100 007 111 968 1.061 730 Home Depot, Inc. USD 110 678 120 719 1.141 500 Host Hotels & Resorts, Inc. USD 24 925 26 235 0.252 680 Imax Corp. USD 62 401 71 636 0.68
547 International Business Machines Corp. USD 111 940 116 675 1.1145 International Paper Co. USD 1 168 2 096 0.02
470 Invesco Mortgage Capital, Inc. USD 9 019 10 053 0.103 495 Japan Tobacco, Inc. JPY 102 114 111 705 1.064 440 KB Home USD 88 542 96 659 0.928 000 KKR & Co. LP USD 120 138 154 560 1.472 690 Las Vegas Sands Corp. USD 139 738 151 581 1.441 680 Lincoln National Corp. USD 43 892 54 785 0.52
406 LinkedIn Corp. - A USD 62 218 71 480 0.681 070 LyondellBasell Industries NV - A USD 63 834 67 720 0.643 235 M/I Homes, Inc. USD 59 633 79 096 0.75
180 Mastercard, Inc. - A USD 93 756 97 403 0.92125 MetroCorp Bancshares, Inc. USD 1 251 1 261 0.01245 MFA Financial, Inc. USD 1 718 2 283 0.02690 Monsanto Co. USD 62 215 72 885 0.69
3 942 Morgan Stanley USD 86 643 86 645 0.82219 Motors Liquidation Co. GUC Trust USD 0 5 913 0.06
2 535 National Financial Partners Corp. USD 47 495 56 860 0.54140 NetSuite, Inc. USD 10 888 11 208 0.11
2 730 Newcastle Investment Corp. USD 29 775 30 494 0.291 450 Noble Corp. USD 53 269 55 318 0.522 275 Och-Ziff Capital Management Group LLC - A USD 18 278 21 271 0.201 915 Ocwen Financial Corp. USD 68 906 72 617 0.69
275 Peabody Energy Corp. USD 5 860 5 816 0.051 085 Penn National Gaming, Inc. USD 48 315 59 057 0.562 675 Pentair Ltd. USD 125 366 141 106 1.341 150 Perrigo Co. USD 127 883 136 540 1.29
242 priceline.com, Inc. USD 157 151 166 479 1.581 821 Procter & Gamble Co. USD 132 590 140 326 1.33
975 QUALCOMM, Inc. USD 64 839 65 276 0.625 180 Quanta Services, Inc. USD 134 415 148 044 1.403 915 Radian Group, Inc. USD 34 720 41 930 0.40
362 Ralph Lauren Corp. USD 62 253 61 290 0.581 175 Realogy Hldg. Corp. USD 41 712 57 387 0.54
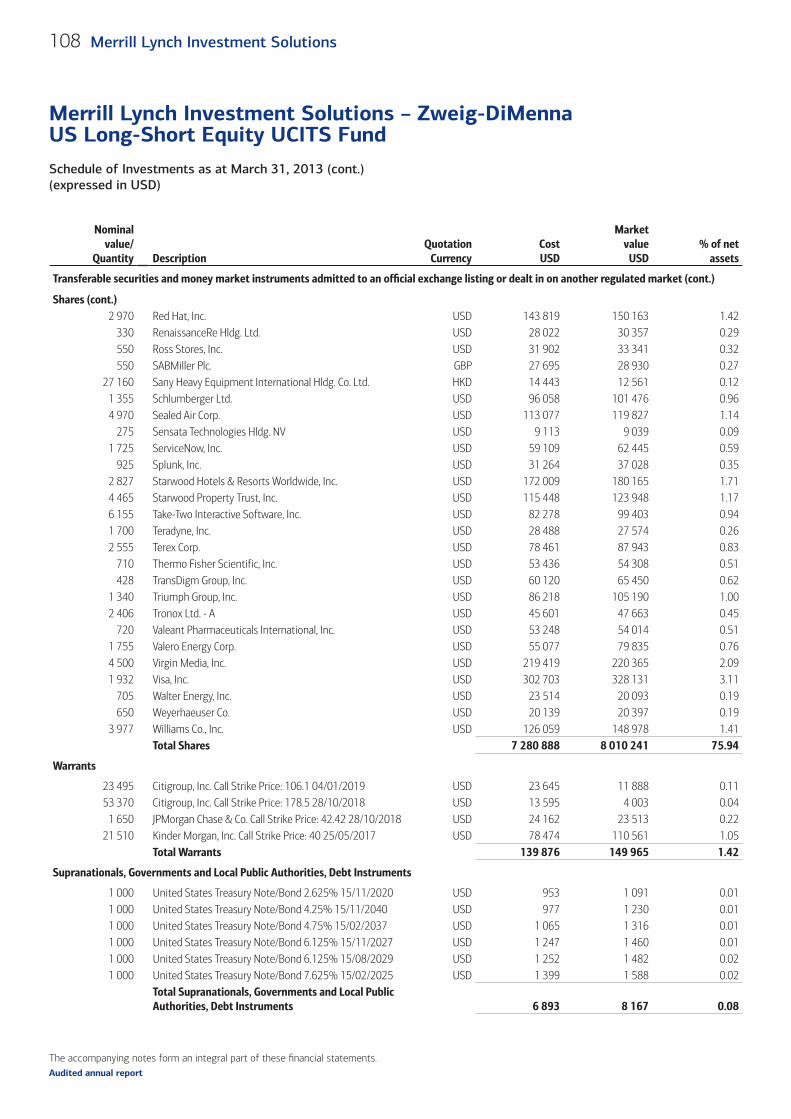
The accompanying notes form an integral part of these fi nancial statements.
Schedule of Investments as at March 31, 2013 (cont.)(expressed in USD)
Merrill Lynch Investment Solutions – Zweig-DiMenna US Long-Short Equity UCITS Fund
108 Merrill Lynch Investment Solutions
Audited annual report
Nominalvalue/
Quantity DescriptionQuotation
CurrencyCostUSD
Marketvalue
USD% of net
assets
Transferable securities and money market instruments admitted to an offi cial exchange listing or dealt in on another regulated market (cont.)
Shares (cont.)2 970 Red Hat, Inc. USD 143 819 150 163 1.42
330 RenaissanceRe Hldg. Ltd. USD 28 022 30 357 0.29550 Ross Stores, Inc. USD 31 902 33 341 0.32550 SABMiller Plc. GBP 27 695 28 930 0.27
27 160 Sany Heavy Equipment International Hldg. Co. Ltd. HKD 14 443 12 561 0.121 355 Schlumberger Ltd. USD 96 058 101 476 0.964 970 Sealed Air Corp. USD 113 077 119 827 1.14
275 Sensata Technologies Hldg. NV USD 9 113 9 039 0.091 725 ServiceNow, Inc. USD 59 109 62 445 0.59
925 Splunk, Inc. USD 31 264 37 028 0.352 827 Starwood Hotels & Resorts Worldwide, Inc. USD 172 009 180 165 1.714 465 Starwood Property Trust, Inc. USD 115 448 123 948 1.176 155 Take-Two Interactive Software, Inc. USD 82 278 99 403 0.941 700 Teradyne, Inc. USD 28 488 27 574 0.262 555 Terex Corp. USD 78 461 87 943 0.83
710 Thermo Fisher Scientific, Inc. USD 53 436 54 308 0.51428 TransDigm Group, Inc. USD 60 120 65 450 0.62
1 340 Triumph Group, Inc. USD 86 218 105 190 1.002 406 Tronox Ltd. - A USD 45 601 47 663 0.45
720 Valeant Pharmaceuticals International, Inc. USD 53 248 54 014 0.511 755 Valero Energy Corp. USD 55 077 79 835 0.764 500 Virgin Media, Inc. USD 219 419 220 365 2.091 932 Visa, Inc. USD 302 703 328 131 3.11
705 Walter Energy, Inc. USD 23 514 20 093 0.19650 Weyerhaeuser Co. USD 20 139 20 397 0.19
3 977 Williams Co., Inc. USD 126 059 148 978 1.41Total Shares 7 280 888 8 010 241 75.94
Warrants
23 495 Citigroup, Inc. Call Strike Price: 106.1 04/01/2019 USD 23 645 11 888 0.1153 370 Citigroup, Inc. Call Strike Price: 178.5 28/10/2018 USD 13 595 4 003 0.04
1 650 JPMorgan Chase & Co. Call Strike Price: 42.42 28/10/2018 USD 24 162 23 513 0.2221 510 Kinder Morgan, Inc. Call Strike Price: 40 25/05/2017 USD 78 474 110 561 1.05
Total Warrants 139 876 149 965 1.42
Supranationals, Governments and Local Public Authorities, Debt Instruments
1 000 United States Treasury Note/Bond 2.625% 15/11/2020 USD 953 1 091 0.011 000 United States Treasury Note/Bond 4.25% 15/11/2040 USD 977 1 230 0.011 000 United States Treasury Note/Bond 4.75% 15/02/2037 USD 1 065 1 316 0.011 000 United States Treasury Note/Bond 6.125% 15/11/2027 USD 1 247 1 460 0.011 000 United States Treasury Note/Bond 6.125% 15/08/2029 USD 1 252 1 482 0.021 000 United States Treasury Note/Bond 7.625% 15/02/2025 USD 1 399 1 588 0.02
Total Supranationals, Governments and Local Public Authorities, Debt Instruments 6 893 8 167 0.08
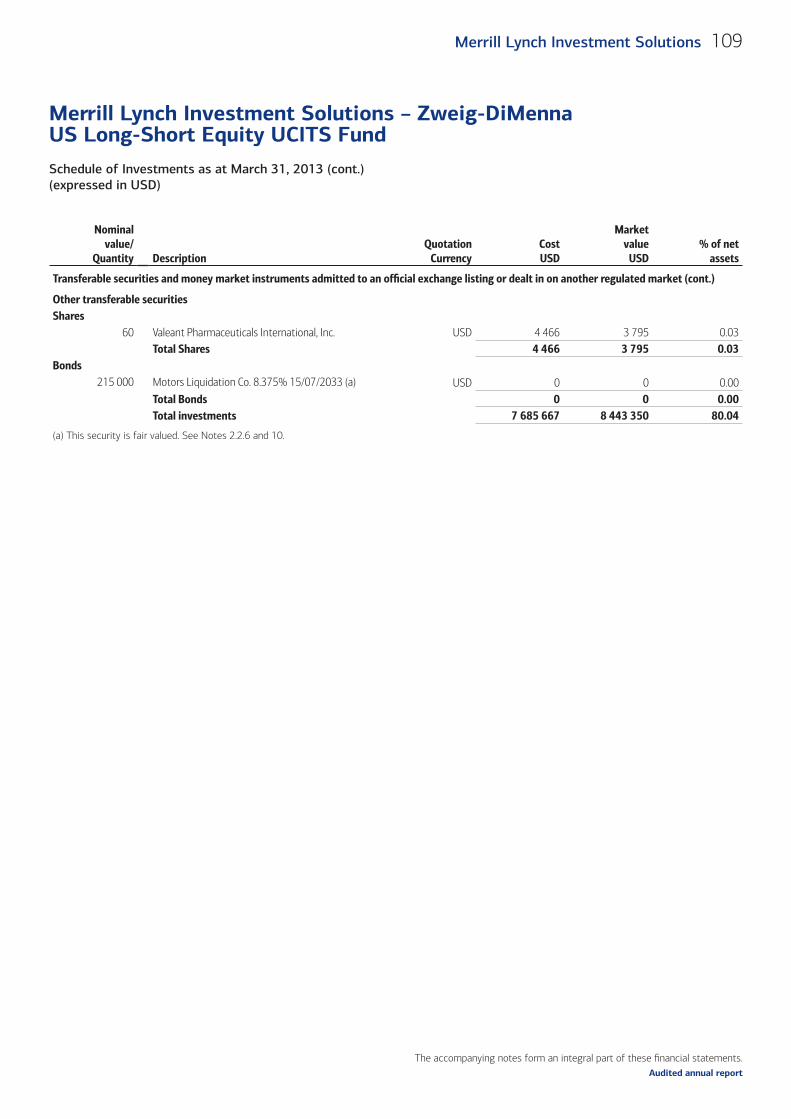
The accompanying notes form an integral part of these fi nancial statements.
Schedule of Investments as at March 31, 2013 (cont.)(expressed in USD)
Merrill Lynch Investment Solutions – Zweig-DiMenna US Long-Short Equity UCITS Fund
109Merrill Lynch Investment Solutions
Audited annual report
Nominalvalue/
Quantity DescriptionQuotation
CurrencyCostUSD
Marketvalue
USD% of net
assets
Transferable securities and money market instruments admitted to an offi cial exchange listing or dealt in on another regulated market (cont.)
Other transferable securitiesShares
60 Valeant Pharmaceuticals International, Inc. USD 4 466 3 795 0.03Total Shares 4 466 3 795 0.03
Bonds215 000 Motors Liquidation Co. 8.375% 15/07/2033 (a) USD 0 0 0.00
Total Bonds 0 0 0.00Total investments 7 685 667 8 443 350 80.04
(a) This security is fair valued. See Notes 2.2.6 and 10.
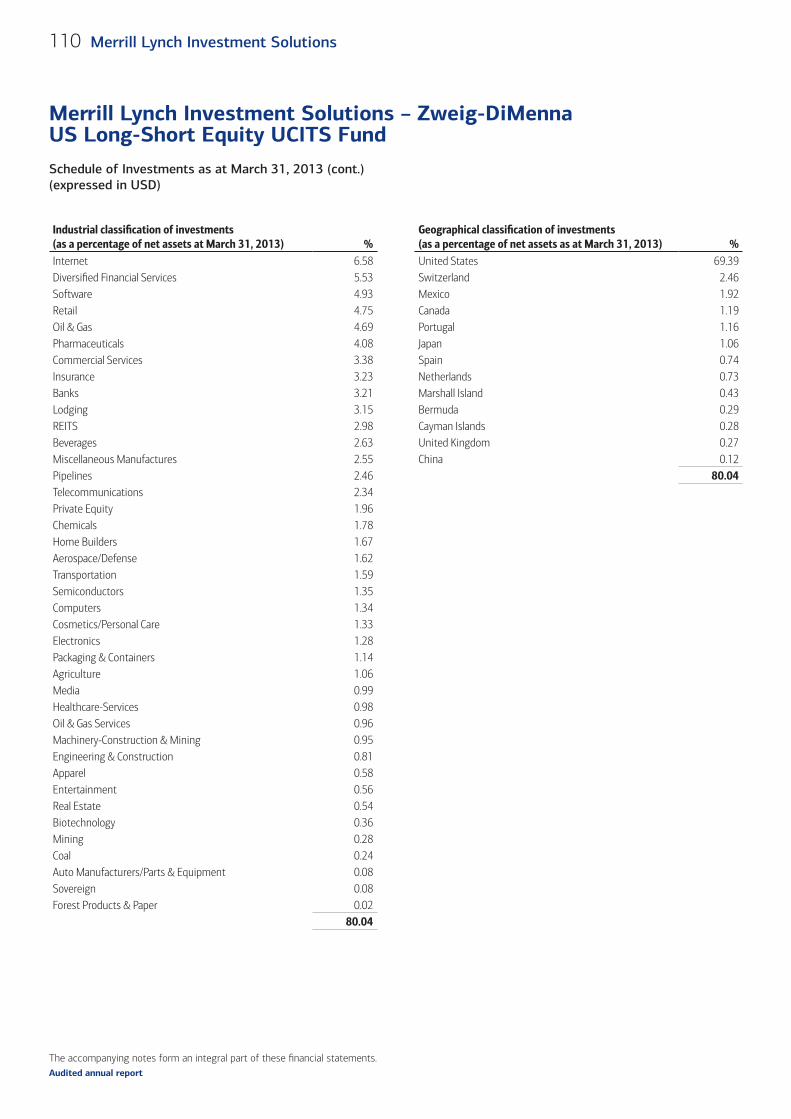
The accompanying notes form an integral part of these fi nancial statements.
Schedule of Investments as at March 31, 2013 (cont.)(expressed in USD)
Merrill Lynch Investment Solutions – Zweig-DiMenna US Long-Short Equity UCITS Fund
110 Merrill Lynch Investment Solutions
Audited annual report
Industrial classifi cation of investments (as a percentage of net assets at March 31, 2013) %
Geographical classifi cation of investments (as a percentage of net assets as at March 31, 2013) %
Internet 6.58 United States 69.39Diversifi ed Financial Services 5.53 Switzerland 2.46Software 4.93 Mexico 1.92Retail 4.75 Canada 1.19Oil & Gas 4.69 Portugal 1.16Pharmaceuticals 4.08 Japan 1.06Commercial Services 3.38 Spain 0.74Insurance 3.23 Netherlands 0.73Banks 3.21 Marshall Island 0.43Lodging 3.15 Bermuda 0.29REITS 2.98 Cayman Islands 0.28Beverages 2.63 United Kingdom 0.27Miscellaneous Manufactures 2.55 China 0.12Pipelines 2.46 80.04 Telecommunications 2.34Private Equity 1.96Chemicals 1.78Home Builders 1.67Aerospace/Defense 1.62Transportation 1.59Semiconductors 1.35Computers 1.34Cosmetics/Personal Care 1.33Electronics 1.28Packaging & Containers 1.14Agriculture 1.06Media 0.99Healthcare-Services 0.98Oil & Gas Services 0.96Machinery-Construction & Mining 0.95Engineering & Construction 0.81Apparel 0.58Entertainment 0.56Real Estate 0.54Biotechnology 0.36Mining 0.28Coal 0.24Auto Manufacturers/Parts & Equipment 0.08Sovereign 0.08Forest Products & Paper 0.02
80.04
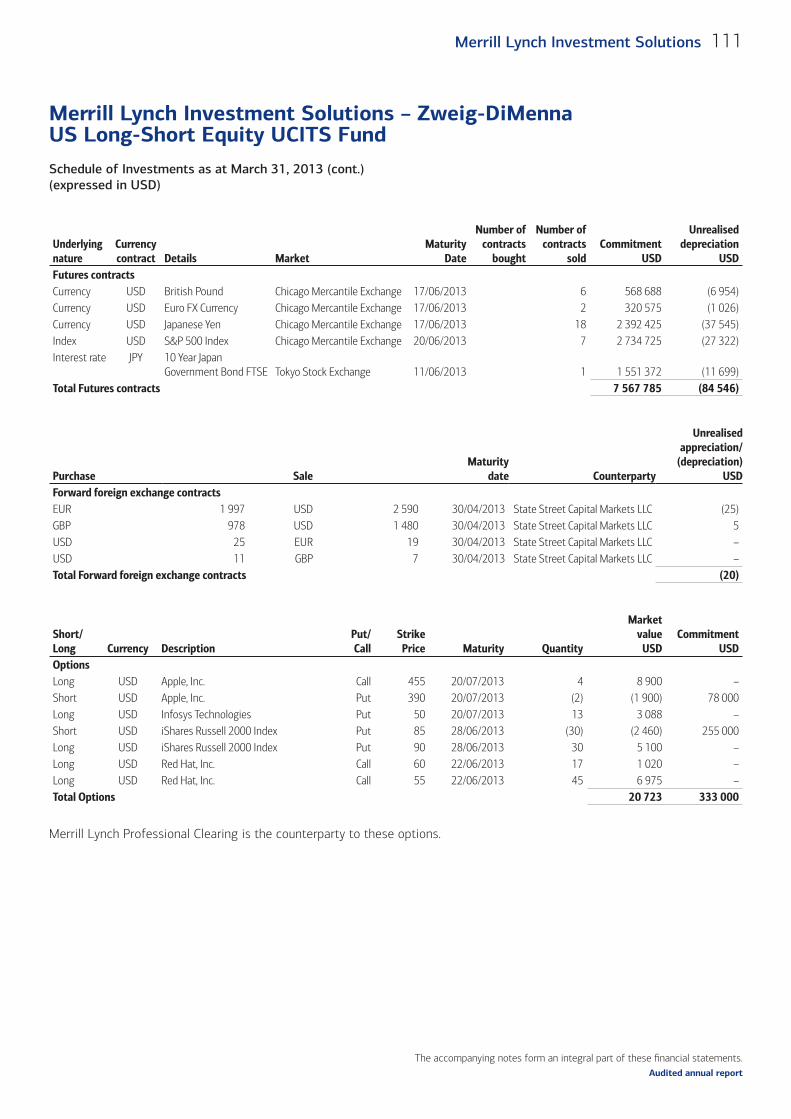
The accompanying notes form an integral part of these fi nancial statements.
Schedule of Investments as at March 31, 2013 (cont.)(expressed in USD)
Merrill Lynch Investment Solutions – Zweig-DiMenna US Long-Short Equity UCITS Fund
111Merrill Lynch Investment Solutions
Audited annual report
Underlyingnature
Currencycontract Details Market
MaturityDate
Number ofcontracts
bought
Number ofcontracts
soldCommitment
USD
Unrealiseddepreciation
USDFutures contractsCurrency USD British Pound Chicago Mercantile Exchange 17/06/2013 6 568 688 (6 954)Currency USD Euro FX Currency Chicago Mercantile Exchange 17/06/2013 2 320 575 (1 026)Currency USD Japanese Yen Chicago Mercantile Exchange 17/06/2013 18 2 392 425 (37 545)Index USD S&P 500 Index Chicago Mercantile Exchange 20/06/2013 7 2 734 725 (27 322)Interest rate JPY 10 Year Japan
Government Bond FTSE Tokyo Stock Exchange 11/06/2013 1 1 551 372 (11 699)Total Futures contracts 7 567 785 (84 546)
Purchase SaleMaturity
date Counterparty
Unrealisedappreciation/
(depreciation)USD
Forward foreign exchange contractsEUR 1 997 USD 2 590 30/04/2013 State Street Capital Markets LLC (25)GBP 978 USD 1 480 30/04/2013 State Street Capital Markets LLC 5 USD 25 EUR 19 30/04/2013 State Street Capital Markets LLC – USD 11 GBP 7 30/04/2013 State Street Capital Markets LLC – Total Forward foreign exchange contracts (20)
Short/Long Currency Description
Put/Call
StrikePrice Maturity Quantity
Marketvalue
USDCommitment
USDOptionsLong USD Apple, Inc. Call 455 20/07/2013 4 8 900 –Short USD Apple, Inc. Put 390 20/07/2013 (2) (1 900) 78 000Long USD Infosys Technologies Put 50 20/07/2013 13 3 088 –Short USD iShares Russell 2000 Index Put 85 28/06/2013 (30) (2 460) 255 000Long USD iShares Russell 2000 Index Put 90 28/06/2013 30 5 100 –Long USD Red Hat, Inc. Call 60 22/06/2013 17 1 020 –Long USD Red Hat, Inc. Call 55 22/06/2013 45 6 975 –Total Options 20 723 333 000
Merrill Lynch Professional Clearing is the counterparty to these options.
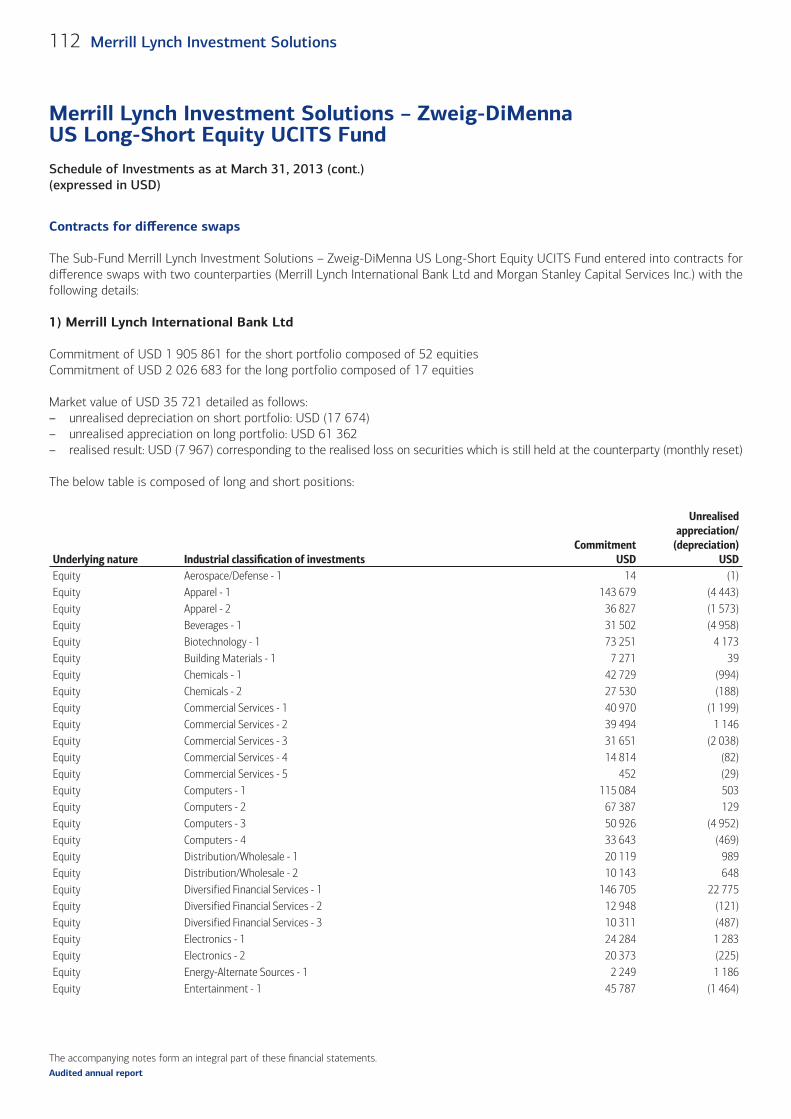
The accompanying notes form an integral part of these fi nancial statements.
Schedule of Investments as at March 31, 2013 (cont.)(expressed in USD)
Merrill Lynch Investment Solutions – Zweig-DiMenna US Long-Short Equity UCITS Fund
112 Merrill Lynch Investment Solutions
Audited annual report
Contracts for diff erence swaps
The Sub-Fund Merrill Lynch Investment Solutions – Zweig-DiMenna US Long-Short Equity UCITS Fund entered into contracts for diff erence swaps with two counterparties (Merrill Lynch International Bank Ltd and Morgan Stanley Capital Services Inc.) with the following details:
1) Merrill Lynch International Bank Ltd
Commitment of USD 1 905 861 for the short portfolio composed of 52 equitiesCommitment of USD 2 026 683 for the long portfolio composed of 17 equities
Market value of USD 35 721 detailed as follows:– unrealised depreciation on short portfolio: USD (17 674)– unrealised appreciation on long portfolio: USD 61 362– realised result: USD (7 967) corresponding to the realised loss on securities which is still held at the counterparty (monthly reset)
The below table is composed of long and short positions:
Underlying nature Industrial classifi cation of investmentsCommitment
USD
Unrealised appreciation/
(depreciation)USD
Equity Aerospace/Defense - 1 14 (1)Equity Apparel - 1 143 679 (4 443)Equity Apparel - 2 36 827 (1 573)Equity Beverages - 1 31 502 (4 958)Equity Biotechnology - 1 73 251 4 173 Equity Building Materials - 1 7 271 39 Equity Chemicals - 1 42 729 (994)Equity Chemicals - 2 27 530 (188)Equity Commercial Services - 1 40 970 (1 199)Equity Commercial Services - 2 39 494 1 146 Equity Commercial Services - 3 31 651 (2 038)Equity Commercial Services - 4 14 814 (82)Equity Commercial Services - 5 452 (29)Equity Computers - 1 115 084 503 Equity Computers - 2 67 387 129 Equity Computers - 3 50 926 (4 952)Equity Computers - 4 33 643 (469)Equity Distribution/Wholesale - 1 20 119 989 Equity Distribution/Wholesale - 2 10 143 648 Equity Diversified Financial Services - 1 146 705 22 775 Equity Diversified Financial Services - 2 12 948 (121)Equity Diversified Financial Services - 3 10 311 (487)Equity Electronics - 1 24 284 1 283 Equity Electronics - 2 20 373 (225)Equity Energy-Alternate Sources - 1 2 249 1 186 Equity Entertainment - 1 45 787 (1 464)
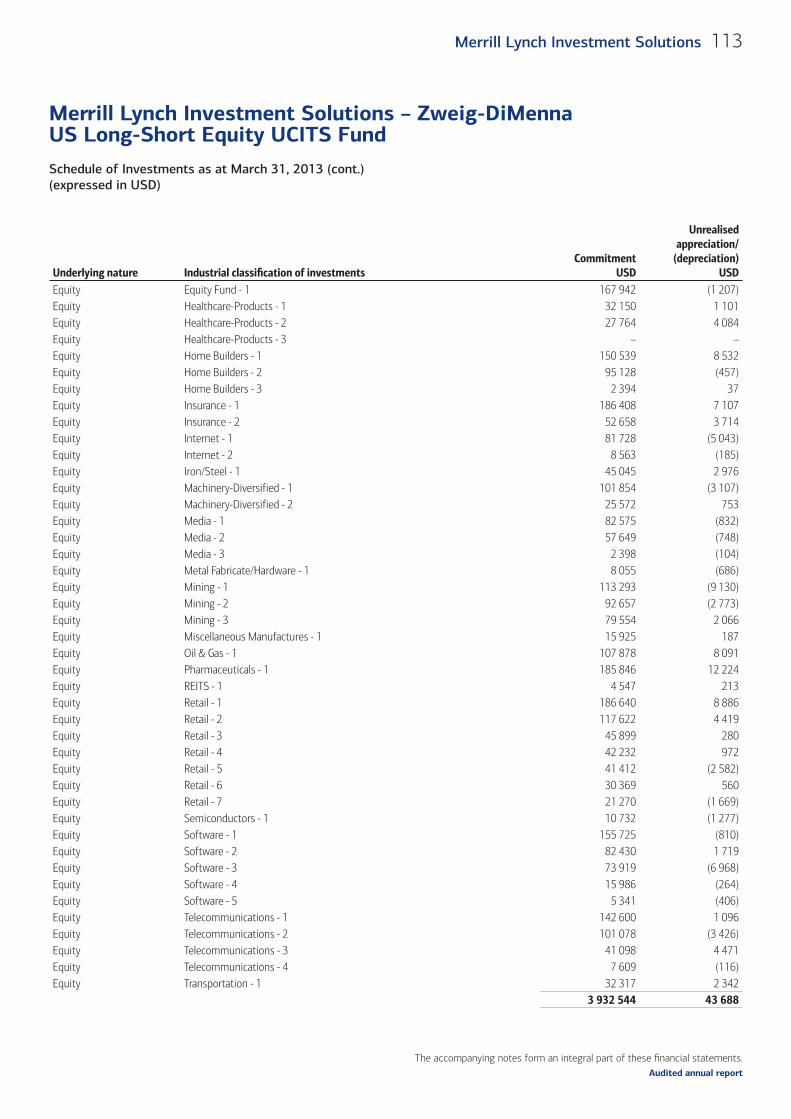
The accompanying notes form an integral part of these fi nancial statements.
Schedule of Investments as at March 31, 2013 (cont.)(expressed in USD)
Merrill Lynch Investment Solutions – Zweig-DiMenna US Long-Short Equity UCITS Fund
113Merrill Lynch Investment Solutions
Audited annual report
Underlying nature Industrial classifi cation of investmentsCommitment
USD
Unrealised appreciation/
(depreciation)USD
Equity Equity Fund - 1 167 942 (1 207)Equity Healthcare-Products - 1 32 150 1 101 Equity Healthcare-Products - 2 27 764 4 084 Equity Healthcare-Products - 3 – – Equity Home Builders - 1 150 539 8 532 Equity Home Builders - 2 95 128 (457)Equity Home Builders - 3 2 394 37 Equity Insurance - 1 186 408 7 107 Equity Insurance - 2 52 658 3 714 Equity Internet - 1 81 728 (5 043)Equity Internet - 2 8 563 (185)Equity Iron/Steel - 1 45 045 2 976 Equity Machinery-Diversified - 1 101 854 (3 107)Equity Machinery-Diversified - 2 25 572 753 Equity Media - 1 82 575 (832)Equity Media - 2 57 649 (748)Equity Media - 3 2 398 (104)Equity Metal Fabricate/Hardware - 1 8 055 (686)Equity Mining - 1 113 293 (9 130)Equity Mining - 2 92 657 (2 773)Equity Mining - 3 79 554 2 066 Equity Miscellaneous Manufactures - 1 15 925 187 Equity Oil & Gas - 1 107 878 8 091 Equity Pharmaceuticals - 1 185 846 12 224 Equity REITS - 1 4 547 213 Equity Retail - 1 186 640 8 886 Equity Retail - 2 117 622 4 419 Equity Retail - 3 45 899 280 Equity Retail - 4 42 232 972 Equity Retail - 5 41 412 (2 582)Equity Retail - 6 30 369 560 Equity Retail - 7 21 270 (1 669)Equity Semiconductors - 1 10 732 (1 277)Equity Software - 1 155 725 (810)Equity Software - 2 82 430 1 719 Equity Software - 3 73 919 (6 968)Equity Software - 4 15 986 (264)Equity Software - 5 5 341 (406)Equity Telecommunications - 1 142 600 1 096 Equity Telecommunications - 2 101 078 (3 426)Equity Telecommunications - 3 41 098 4 471 Equity Telecommunications - 4 7 609 (116)Equity Transportation - 1 32 317 2 342
3 932 544 43 688
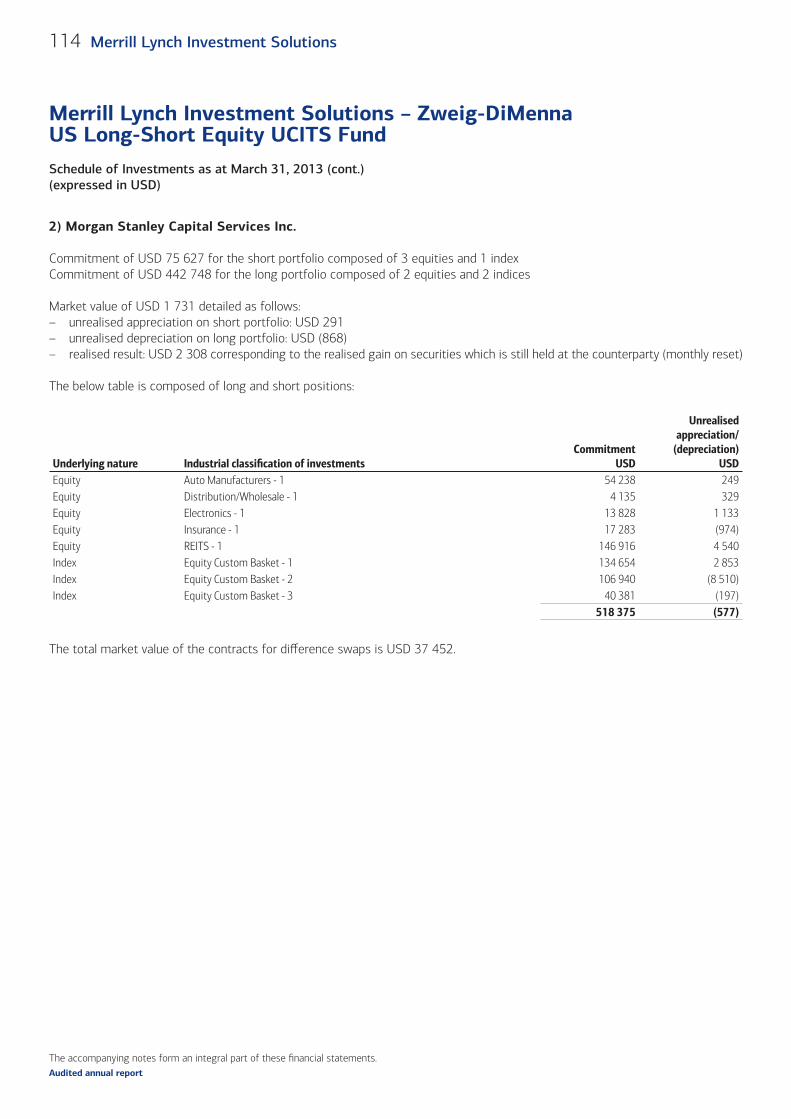
The accompanying notes form an integral part of these fi nancial statements.
Schedule of Investments as at March 31, 2013 (cont.)(expressed in USD)
Merrill Lynch Investment Solutions – Zweig-DiMenna US Long-Short Equity UCITS Fund
114 Merrill Lynch Investment Solutions
Audited annual report
2) Morgan Stanley Capital Services Inc.
Commitment of USD 75 627 for the short portfolio composed of 3 equities and 1 indexCommitment of USD 442 748 for the long portfolio composed of 2 equities and 2 indices
Market value of USD 1 731 detailed as follows:– unrealised appreciation on short portfolio: USD 291– unrealised depreciation on long portfolio: USD (868)– realised result: USD 2 308 corresponding to the realised gain on securities which is still held at the counterparty (monthly reset)
The below table is composed of long and short positions:
Underlying nature Industrial classifi cation of investmentsCommitment
USD
Unrealised appreciation/
(depreciation)USD
Equity Auto Manufacturers - 1 54 238 249 Equity Distribution/Wholesale - 1 4 135 329 Equity Electronics - 1 13 828 1 133 Equity Insurance - 1 17 283 (974)Equity REITS - 1 146 916 4 540 Index Equity Custom Basket - 1 134 654 2 853 Index Equity Custom Basket - 2 106 940 (8 510)Index Equity Custom Basket - 3 40 381 (197)
518 375 (577)
The total market value of the contracts for diff erence swaps is USD 37 452.
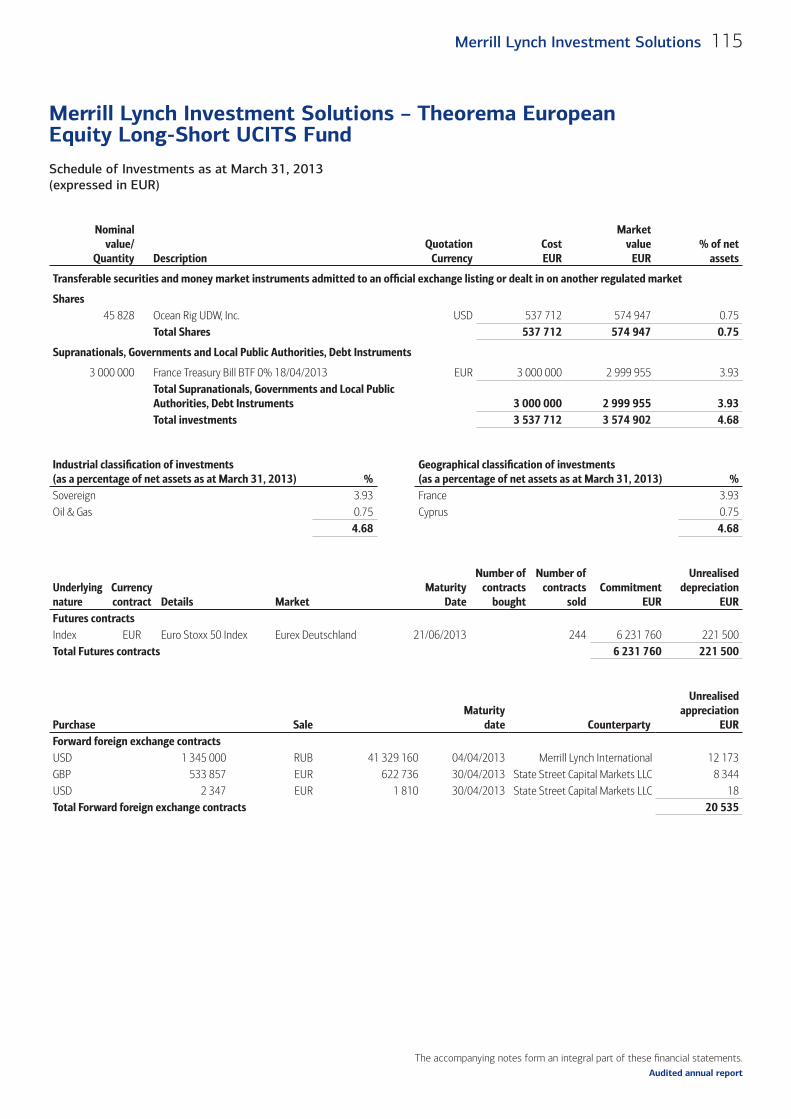
The accompanying notes form an integral part of these fi nancial statements.
Schedule of Investments as at March 31, 2013 (expressed in EUR)
Merrill Lynch Investment Solutions – Theorema European Equity Long-Short UCITS Fund
115Merrill Lynch Investment Solutions
Audited annual report
Nominalvalue/
Quantity DescriptionQuotation
CurrencyCostEUR
Marketvalue
EUR% of net
assets
Transferable securities and money market instruments admitted to an offi cial exchange listing or dealt in on another regulated market
Shares45 828 Ocean Rig UDW, Inc. USD 537 712 574 947 0.75
Total Shares 537 712 574 947 0.75
Supranationals, Governments and Local Public Authorities, Debt Instruments
3 000 000 France Treasury Bill BTF 0% 18/04/2013 EUR 3 000 000 2 999 955 3.93Total Supranationals, Governments and Local Public Authorities, Debt Instruments 3 000 000 2 999 955 3.93Total investments 3 537 712 3 574 902 4.68
Industrial classifi cation of investments(as a percentage of net assets as at March 31, 2013) %
Geographical classifi cation of investments(as a percentage of net assets as at March 31, 2013) %
Sovereign 3.93 France 3.93Oil & Gas 0.75 Cyprus 0.75
4.68 4.68
Underlyingnature
Currencycontract Details Market
MaturityDate
Number ofcontracts
bought
Number ofcontracts
soldCommitment
EUR
Unrealiseddepreciation
EURFutures contractsIndex EUR Euro Stoxx 50 Index Eurex Deutschland 21/06/2013 244 6 231 760 221 500Total Futures contracts 6 231 760 221 500
Purchase SaleMaturity
date Counterparty
Unrealised appreciation
EURForward foreign exchange contractsUSD 1 345 000 RUB 41 329 160 04/04/2013 Merrill Lynch International 12 173 GBP 533 857 EUR 622 736 30/04/2013 State Street Capital Markets LLC 8 344 USD 2 347 EUR 1 810 30/04/2013 State Street Capital Markets LLC 18 Total Forward foreign exchange contracts 20 535
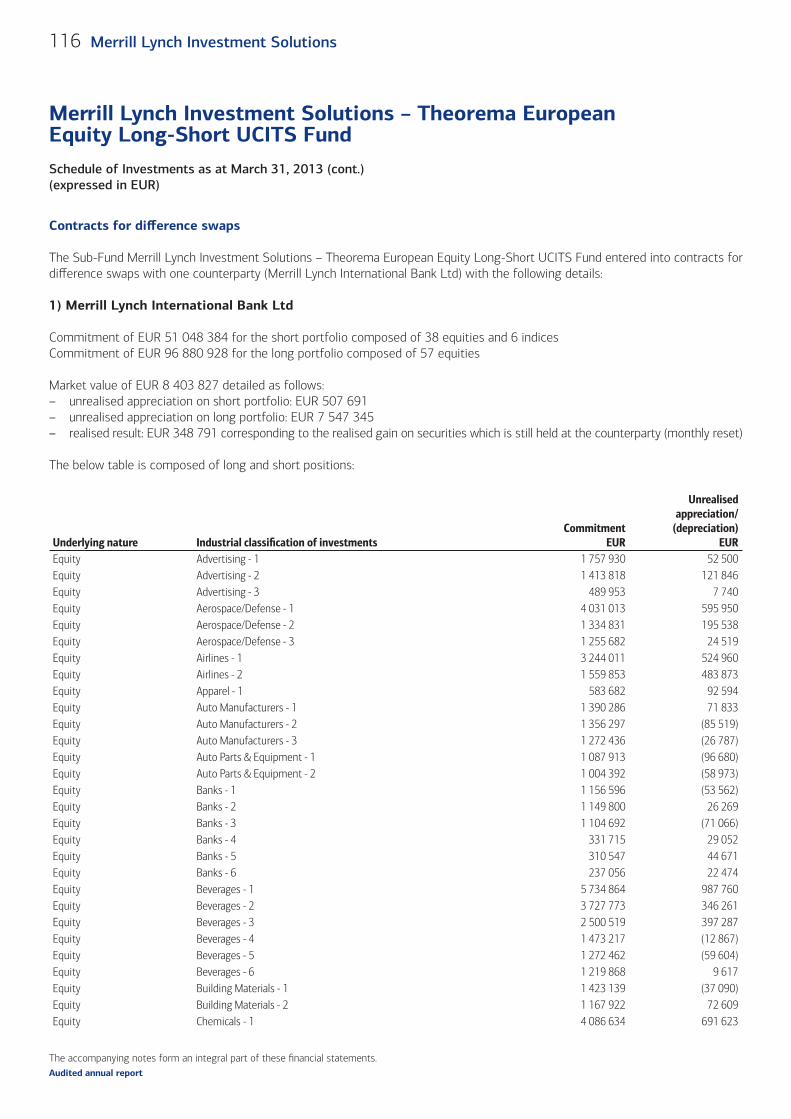
The accompanying notes form an integral part of these fi nancial statements.
Schedule of Investments as at March 31, 2013 (cont.)(expressed in EUR)
Merrill Lynch Investment Solutions – Theorema European Equity Long-Short UCITS Fund
116 Merrill Lynch Investment Solutions
Audited annual report
Contracts for diff erence swaps
The Sub-Fund Merrill Lynch Investment Solutions – Theorema European Equity Long-Short UCITS Fund entered into contracts for diff erence swaps with one counterparty (Merrill Lynch International Bank Ltd) with the following details:
1) Merrill Lynch International Bank Ltd
Commitment of EUR 51 048 384 for the short portfolio composed of 38 equities and 6 indicesCommitment of EUR 96 880 928 for the long portfolio composed of 57 equities
Market value of EUR 8 403 827 detailed as follows:– unrealised appreciation on short portfolio: EUR 507 691– unrealised appreciation on long portfolio: EUR 7 547 345– realised result: EUR 348 791 corresponding to the realised gain on securities which is still held at the counterparty (monthly reset)
The below table is composed of long and short positions:
Underlying nature Industrial classifi cation of investments Commitment
EUR
Unrealised appreciation/
(depreciation)EUR
Equity Advertising - 1 1 757 930 52 500 Equity Advertising - 2 1 413 818 121 846 Equity Advertising - 3 489 953 7 740 Equity Aerospace/Defense - 1 4 031 013 595 950 Equity Aerospace/Defense - 2 1 334 831 195 538 Equity Aerospace/Defense - 3 1 255 682 24 519 Equity Airlines - 1 3 244 011 524 960 Equity Airlines - 2 1 559 853 483 873 Equity Apparel - 1 583 682 92 594 Equity Auto Manufacturers - 1 1 390 286 71 833 Equity Auto Manufacturers - 2 1 356 297 (85 519)Equity Auto Manufacturers - 3 1 272 436 (26 787)Equity Auto Parts & Equipment - 1 1 087 913 (96 680)Equity Auto Parts & Equipment - 2 1 004 392 (58 973)Equity Banks - 1 1 156 596 (53 562)Equity Banks - 2 1 149 800 26 269 Equity Banks - 3 1 104 692 (71 066)Equity Banks - 4 331 715 29 052 Equity Banks - 5 310 547 44 671 Equity Banks - 6 237 056 22 474 Equity Beverages - 1 5 734 864 987 760 Equity Beverages - 2 3 727 773 346 261 Equity Beverages - 3 2 500 519 397 287 Equity Beverages - 4 1 473 217 (12 867)Equity Beverages - 5 1 272 462 (59 604)Equity Beverages - 6 1 219 868 9 617 Equity Building Materials - 1 1 423 139 (37 090)Equity Building Materials - 2 1 167 922 72 609 Equity Chemicals - 1 4 086 634 691 623
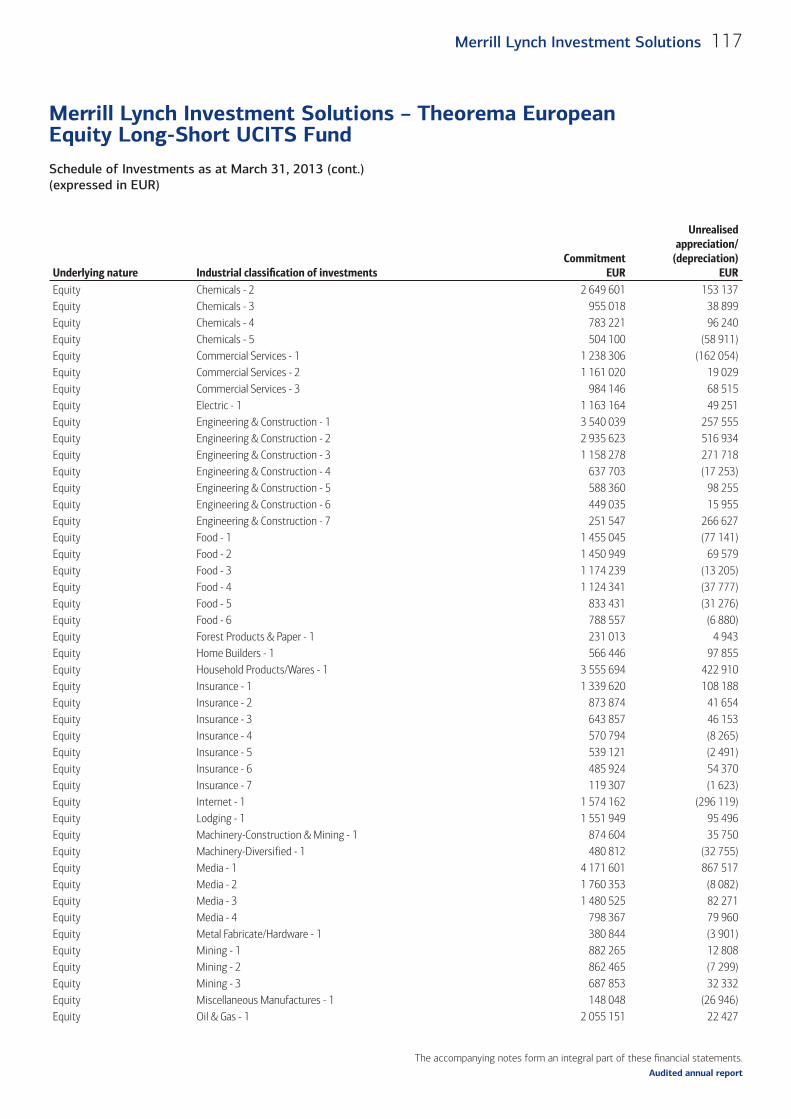
The accompanying notes form an integral part of these fi nancial statements.
Schedule of Investments as at March 31, 2013 (cont.)(expressed in EUR)
Merrill Lynch Investment Solutions – Theorema European Equity Long-Short UCITS Fund
117Merrill Lynch Investment Solutions
Audited annual report
Underlying nature Industrial classifi cation of investments Commitment
EUR
Unrealised appreciation/
(depreciation)EUR
Equity Chemicals - 2 2 649 601 153 137 Equity Chemicals - 3 955 018 38 899 Equity Chemicals - 4 783 221 96 240 Equity Chemicals - 5 504 100 (58 911)Equity Commercial Services - 1 1 238 306 (162 054)Equity Commercial Services - 2 1 161 020 19 029 Equity Commercial Services - 3 984 146 68 515 Equity Electric - 1 1 163 164 49 251 Equity Engineering & Construction - 1 3 540 039 257 555 Equity Engineering & Construction - 2 2 935 623 516 934 Equity Engineering & Construction - 3 1 158 278 271 718 Equity Engineering & Construction - 4 637 703 (17 253)Equity Engineering & Construction - 5 588 360 98 255 Equity Engineering & Construction - 6 449 035 15 955 Equity Engineering & Construction - 7 251 547 266 627 Equity Food - 1 1 455 045 (77 141)Equity Food - 2 1 450 949 69 579 Equity Food - 3 1 174 239 (13 205)Equity Food - 4 1 124 341 (37 777)Equity Food - 5 833 431 (31 276)Equity Food - 6 788 557 (6 880)Equity Forest Products & Paper - 1 231 013 4 943 Equity Home Builders - 1 566 446 97 855 Equity Household Products/Wares - 1 3 555 694 422 910 Equity Insurance - 1 1 339 620 108 188 Equity Insurance - 2 873 874 41 654 Equity Insurance - 3 643 857 46 153 Equity Insurance - 4 570 794 (8 265)Equity Insurance - 5 539 121 (2 491)Equity Insurance - 6 485 924 54 370 Equity Insurance - 7 119 307 (1 623)Equity Internet - 1 1 574 162 (296 119)Equity Lodging - 1 1 551 949 95 496 Equity Machinery-Construction & Mining - 1 874 604 35 750 Equity Machinery-Diversified - 1 480 812 (32 755)Equity Media - 1 4 171 601 867 517 Equity Media - 2 1 760 353 (8 082)Equity Media - 3 1 480 525 82 271 Equity Media - 4 798 367 79 960 Equity Metal Fabricate/Hardware - 1 380 844 (3 901)Equity Mining - 1 882 265 12 808 Equity Mining - 2 862 465 (7 299)Equity Mining - 3 687 853 32 332 Equity Miscellaneous Manufactures - 1 148 048 (26 946)Equity Oil & Gas - 1 2 055 151 22 427
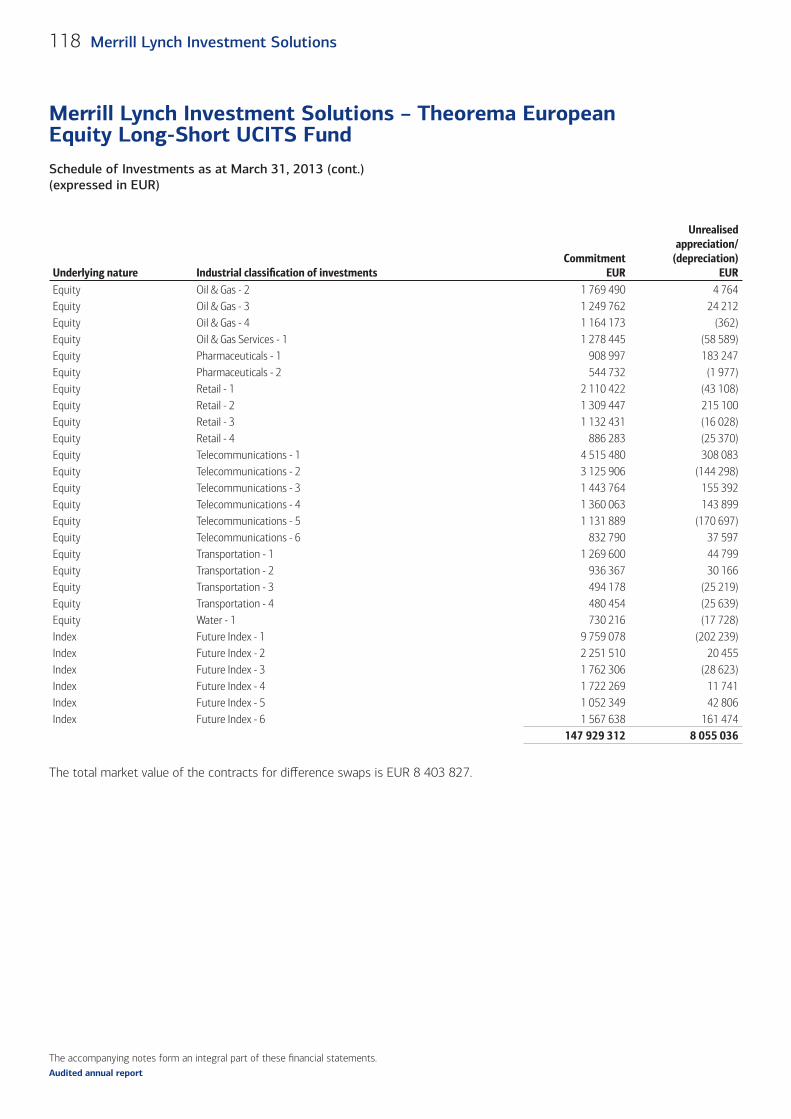
The accompanying notes form an integral part of these fi nancial statements.
Schedule of Investments as at March 31, 2013 (cont.)(expressed in EUR)
Merrill Lynch Investment Solutions – Theorema European Equity Long-Short UCITS Fund
118 Merrill Lynch Investment Solutions
Audited annual report
Underlying nature Industrial classifi cation of investments Commitment
EUR
Unrealised appreciation/
(depreciation)EUR
Equity Oil & Gas - 2 1 769 490 4 764 Equity Oil & Gas - 3 1 249 762 24 212 Equity Oil & Gas - 4 1 164 173 (362)Equity Oil & Gas Services - 1 1 278 445 (58 589)Equity Pharmaceuticals - 1 908 997 183 247 Equity Pharmaceuticals - 2 544 732 (1 977)Equity Retail - 1 2 110 422 (43 108)Equity Retail - 2 1 309 447 215 100 Equity Retail - 3 1 132 431 (16 028)Equity Retail - 4 886 283 (25 370)Equity Telecommunications - 1 4 515 480 308 083 Equity Telecommunications - 2 3 125 906 (144 298)Equity Telecommunications - 3 1 443 764 155 392 Equity Telecommunications - 4 1 360 063 143 899 Equity Telecommunications - 5 1 131 889 (170 697)Equity Telecommunications - 6 832 790 37 597 Equity Transportation - 1 1 269 600 44 799 Equity Transportation - 2 936 367 30 166 Equity Transportation - 3 494 178 (25 219)Equity Transportation - 4 480 454 (25 639)Equity Water - 1 730 216 (17 728)Index Future Index - 1 9 759 078 (202 239)Index Future Index - 2 2 251 510 20 455 Index Future Index - 3 1 762 306 (28 623)Index Future Index - 4 1 722 269 11 741 Index Future Index - 5 1 052 349 42 806 Index Future Index - 6 1 567 638 161 474
147 929 312 8 055 036
The total market value of the contracts for diff erence swaps is EUR 8 403 827.
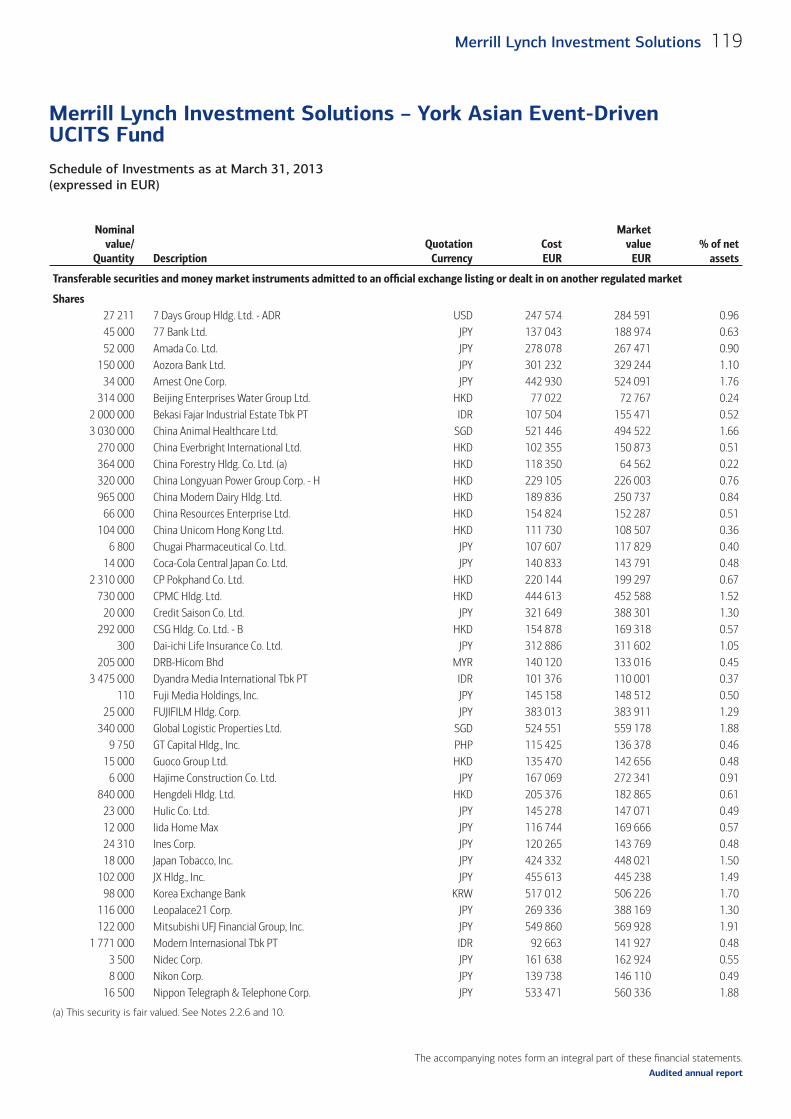
The accompanying notes form an integral part of these fi nancial statements.
Schedule of Investments as at March 31, 2013 (expressed in EUR)
Merrill Lynch Investment Solutions – York Asian Event-Driven UCITS Fund
119Merrill Lynch Investment Solutions
Audited annual report
Nominalvalue/
Quantity DescriptionQuotation
CurrencyCostEUR
Marketvalue
EUR% of net
assets
Transferable securities and money market instruments admitted to an offi cial exchange listing or dealt in on another regulated market (cont.)
Shares (cont.)27 211 7 Days Group Hldg. Ltd. - ADR USD 247 574 284 591 0.9645 000 77 Bank Ltd. JPY 137 043 188 974 0.6352 000 Amada Co. Ltd. JPY 278 078 267 471 0.90
150 000 Aozora Bank Ltd. JPY 301 232 329 244 1.1034 000 Arnest One Corp. JPY 442 930 524 091 1.76
314 000 Beijing Enterprises Water Group Ltd. HKD 77 022 72 767 0.242 000 000 Bekasi Fajar Industrial Estate Tbk PT IDR 107 504 155 471 0.523 030 000 China Animal Healthcare Ltd. SGD 521 446 494 522 1.66
270 000 China Everbright International Ltd. HKD 102 355 150 873 0.51364 000 China Forestry Hldg. Co. Ltd. (a) HKD 118 350 64 562 0.22320 000 China Longyuan Power Group Corp. - H HKD 229 105 226 003 0.76965 000 China Modern Dairy Hldg. Ltd. HKD 189 836 250 737 0.84
66 000 China Resources Enterprise Ltd. HKD 154 824 152 287 0.51104 000 China Unicom Hong Kong Ltd. HKD 111 730 108 507 0.36
6 800 Chugai Pharmaceutical Co. Ltd. JPY 107 607 117 829 0.4014 000 Coca-Cola Central Japan Co. Ltd. JPY 140 833 143 791 0.48
2 310 000 CP Pokphand Co. Ltd. HKD 220 144 199 297 0.67730 000 CPMC Hldg. Ltd. HKD 444 613 452 588 1.52
20 000 Credit Saison Co. Ltd. JPY 321 649 388 301 1.30292 000 CSG Hldg. Co. Ltd. - B HKD 154 878 169 318 0.57
300 Dai-ichi Life Insurance Co. Ltd. JPY 312 886 311 602 1.05205 000 DRB-Hicom Bhd MYR 140 120 133 016 0.45
3 475 000 Dyandra Media International Tbk PT IDR 101 376 110 001 0.37110 Fuji Media Holdings, Inc. JPY 145 158 148 512 0.50
25 000 FUJIFILM Hldg. Corp. JPY 383 013 383 911 1.29340 000 Global Logistic Properties Ltd. SGD 524 551 559 178 1.88
9 750 GT Capital Hldg., Inc. PHP 115 425 136 378 0.4615 000 Guoco Group Ltd. HKD 135 470 142 656 0.48
6 000 Hajime Construction Co. Ltd. JPY 167 069 272 341 0.91840 000 Hengdeli Hldg. Ltd. HKD 205 376 182 865 0.61
23 000 Hulic Co. Ltd. JPY 145 278 147 071 0.4912 000 Iida Home Max JPY 116 744 169 666 0.5724 310 Ines Corp. JPY 120 265 143 769 0.4818 000 Japan Tobacco, Inc. JPY 424 332 448 021 1.50
102 000 JX Hldg., Inc. JPY 455 613 445 238 1.4998 000 Korea Exchange Bank KRW 517 012 506 226 1.70
116 000 Leopalace21 Corp. JPY 269 336 388 169 1.30122 000 Mitsubishi UFJ Financial Group, Inc. JPY 549 860 569 928 1.91
1 771 000 Modern Internasional Tbk PT IDR 92 663 141 927 0.483 500 Nidec Corp. JPY 161 638 162 924 0.558 000 Nikon Corp. JPY 139 738 146 110 0.49
16 500 Nippon Telegraph & Telephone Corp. JPY 533 471 560 336 1.88
(a) This security is fair valued. See Notes 2.2.6 and 10.
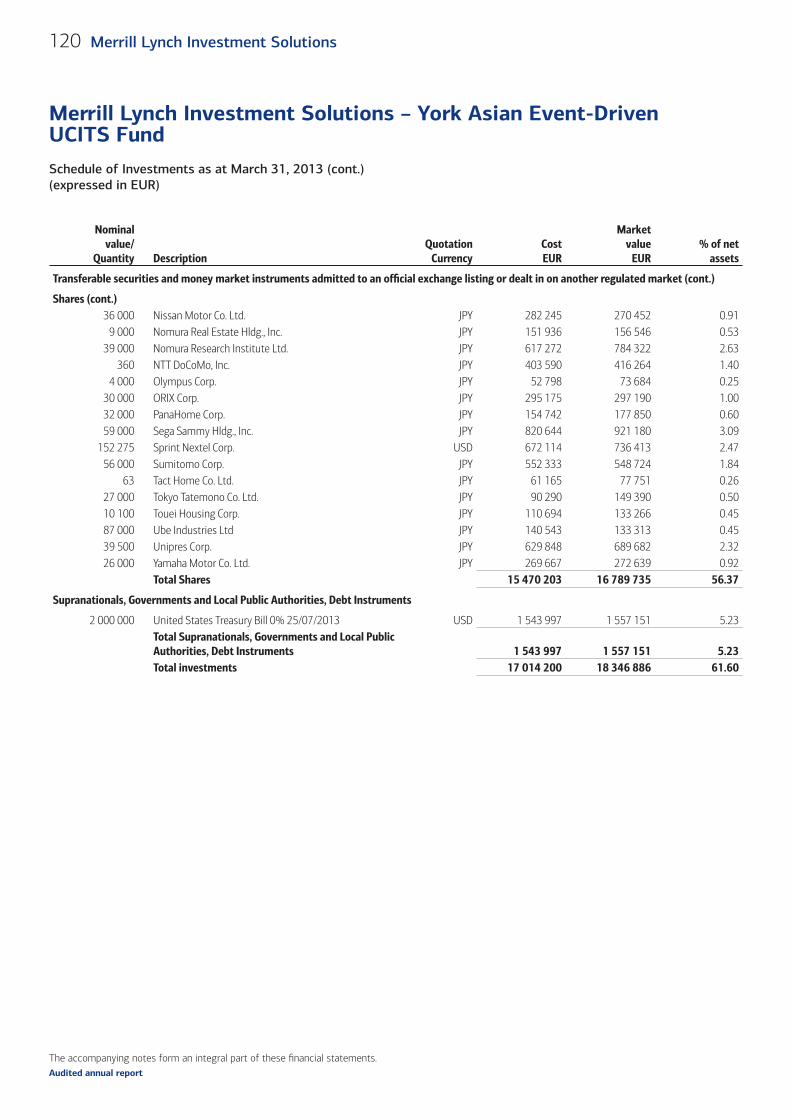
The accompanying notes form an integral part of these fi nancial statements.
Schedule of Investments as at March 31, 2013 (cont.)(expressed in EUR)
Merrill Lynch Investment Solutions – York Asian Event-Driven UCITS Fund
120 Merrill Lynch Investment Solutions
Audited annual report
Nominalvalue/
Quantity DescriptionQuotation
CurrencyCostEUR
Marketvalue
EUR% of net
assets
Transferable securities and money market instruments admitted to an offi cial exchange listing or dealt in on another regulated market (cont.)
Shares (cont.)36 000 Nissan Motor Co. Ltd. JPY 282 245 270 452 0.91
9 000 Nomura Real Estate Hldg., Inc. JPY 151 936 156 546 0.5339 000 Nomura Research Institute Ltd. JPY 617 272 784 322 2.63
360 NTT DoCoMo, Inc. JPY 403 590 416 264 1.404 000 Olympus Corp. JPY 52 798 73 684 0.25
30 000 ORIX Corp. JPY 295 175 297 190 1.0032 000 PanaHome Corp. JPY 154 742 177 850 0.6059 000 Sega Sammy Hldg., Inc. JPY 820 644 921 180 3.09
152 275 Sprint Nextel Corp. USD 672 114 736 413 2.4756 000 Sumitomo Corp. JPY 552 333 548 724 1.84
63 Tact Home Co. Ltd. JPY 61 165 77 751 0.2627 000 Tokyo Tatemono Co. Ltd. JPY 90 290 149 390 0.5010 100 Touei Housing Corp. JPY 110 694 133 266 0.4587 000 Ube Industries Ltd JPY 140 543 133 313 0.4539 500 Unipres Corp. JPY 629 848 689 682 2.3226 000 Yamaha Motor Co. Ltd. JPY 269 667 272 639 0.92
Total Shares 15 470 203 16 789 735 56.37
Supranationals, Governments and Local Public Authorities, Debt Instruments
2 000 000 United States Treasury Bill 0% 25/07/2013 USD 1 543 997 1 557 151 5.23Total Supranationals, Governments and Local Public Authorities, Debt Instruments 1 543 997 1 557 151 5.23Total investments 17 014 200 18 346 886 61.60
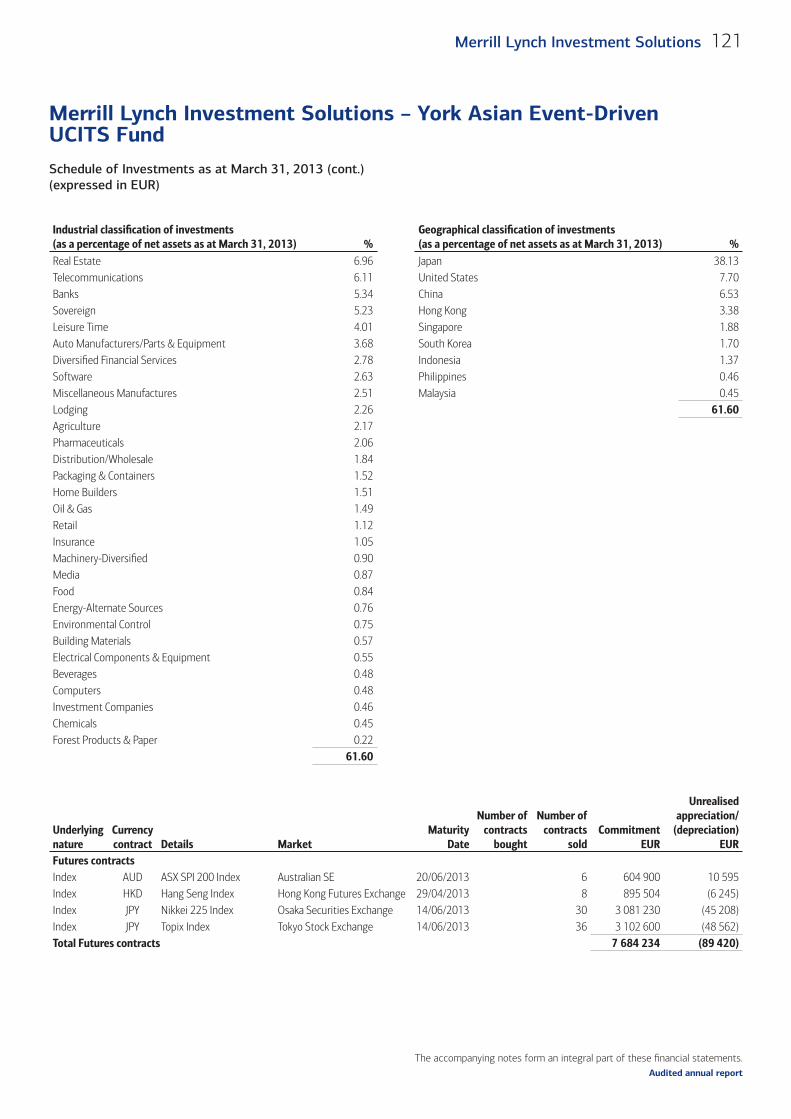
The accompanying notes form an integral part of these fi nancial statements.
Schedule of Investments as at March 31, 2013 (cont.)(expressed in EUR)
Merrill Lynch Investment Solutions – York Asian Event-Driven UCITS Fund
121Merrill Lynch Investment Solutions
Audited annual report
Industrial classifi cation of investments (as a percentage of net assets as at March 31, 2013) %
Geographical classifi cation of investments (as a percentage of net assets as at March 31, 2013) %
Real Estate 6.96 Japan 38.13Telecommunications 6.11 United States 7.70Banks 5.34 China 6.53Sovereign 5.23 Hong Kong 3.38Leisure Time 4.01 Singapore 1.88Auto Manufacturers/Parts & Equipment 3.68 South Korea 1.70Diversifi ed Financial Services 2.78 Indonesia 1.37Software 2.63 Philippines 0.46Miscellaneous Manufactures 2.51 Malaysia 0.45Lodging 2.26 61.60 Agriculture 2.17Pharmaceuticals 2.06Distribution/Wholesale 1.84Packaging & Containers 1.52Home Builders 1.51Oil & Gas 1.49Retail 1.12Insurance 1.05Machinery-Diversifi ed 0.90Media 0.87Food 0.84Energy-Alternate Sources 0.76Environmental Control 0.75Building Materials 0.57Electrical Components & Equipment 0.55Beverages 0.48Computers 0.48Investment Companies 0.46Chemicals 0.45Forest Products & Paper 0.22
61.60
Underlyingnature
Currencycontract Details Market
MaturityDate
Number ofcontracts
bought
Number ofcontracts
soldCommitment
EUR
Unrealisedappreciation/
(depreciation)EUR
Futures contractsIndex AUD ASX SPI 200 Index Australian SE 20/06/2013 6 604 900 10 595Index HKD Hang Seng Index Hong Kong Futures Exchange 29/04/2013 8 895 504 (6 245)Index JPY Nikkei 225 Index Osaka Securities Exchange 14/06/2013 30 3 081 230 (45 208)Index JPY Topix Index Tokyo Stock Exchange 14/06/2013 36 3 102 600 (48 562)Total Futures contracts 7 684 234 (89 420)
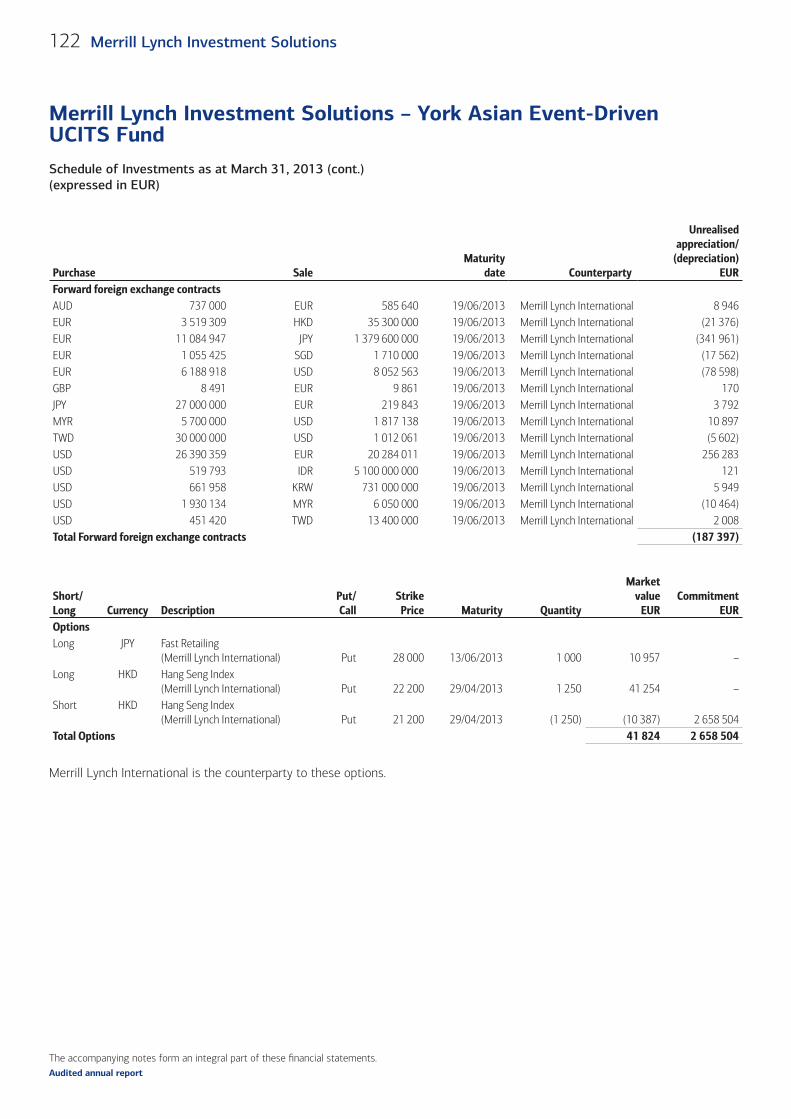
The accompanying notes form an integral part of these fi nancial statements.
Schedule of Investments as at March 31, 2013 (cont.)(expressed in EUR)
Merrill Lynch Investment Solutions – York Asian Event-Driven UCITS Fund
122 Merrill Lynch Investment Solutions
Audited annual report
Purchase SaleMaturity
date Counterparty
Unrealised appreciation/
(depreciation) EUR
Forward foreign exchange contractsAUD 737 000 EUR 585 640 19/06/2013 Merrill Lynch International 8 946 EUR 3 519 309 HKD 35 300 000 19/06/2013 Merrill Lynch International (21 376)EUR 11 084 947 JPY 1 379 600 000 19/06/2013 Merrill Lynch International (341 961)EUR 1 055 425 SGD 1 710 000 19/06/2013 Merrill Lynch International (17 562)EUR 6 188 918 USD 8 052 563 19/06/2013 Merrill Lynch International (78 598)GBP 8 491 EUR 9 861 19/06/2013 Merrill Lynch International 170 JPY 27 000 000 EUR 219 843 19/06/2013 Merrill Lynch International 3 792 MYR 5 700 000 USD 1 817 138 19/06/2013 Merrill Lynch International 10 897 TWD 30 000 000 USD 1 012 061 19/06/2013 Merrill Lynch International (5 602)USD 26 390 359 EUR 20 284 011 19/06/2013 Merrill Lynch International 256 283 USD 519 793 IDR 5 100 000 000 19/06/2013 Merrill Lynch International 121 USD 661 958 KRW 731 000 000 19/06/2013 Merrill Lynch International 5 949 USD 1 930 134 MYR 6 050 000 19/06/2013 Merrill Lynch International (10 464)USD 451 420 TWD 13 400 000 19/06/2013 Merrill Lynch International 2 008Total Forward foreign exchange contracts (187 397)
Short/Long Currency Description
Put/Call
StrikePrice Maturity Quantity
Marketvalue
EURCommitment
EUROptionsLong JPY Fast Retailing
(Merrill Lynch International) Put 28 000 13/06/2013 1 000 10 957 –Long HKD Hang Seng Index
(Merrill Lynch International) Put 22 200 29/04/2013 1 250 41 254 –Short HKD Hang Seng Index
(Merrill Lynch International) Put 21 200 29/04/2013 (1 250) (10 387) 2 658 504Total Options 41 824 2 658 504
Merrill Lynch International is the counterparty to these options.
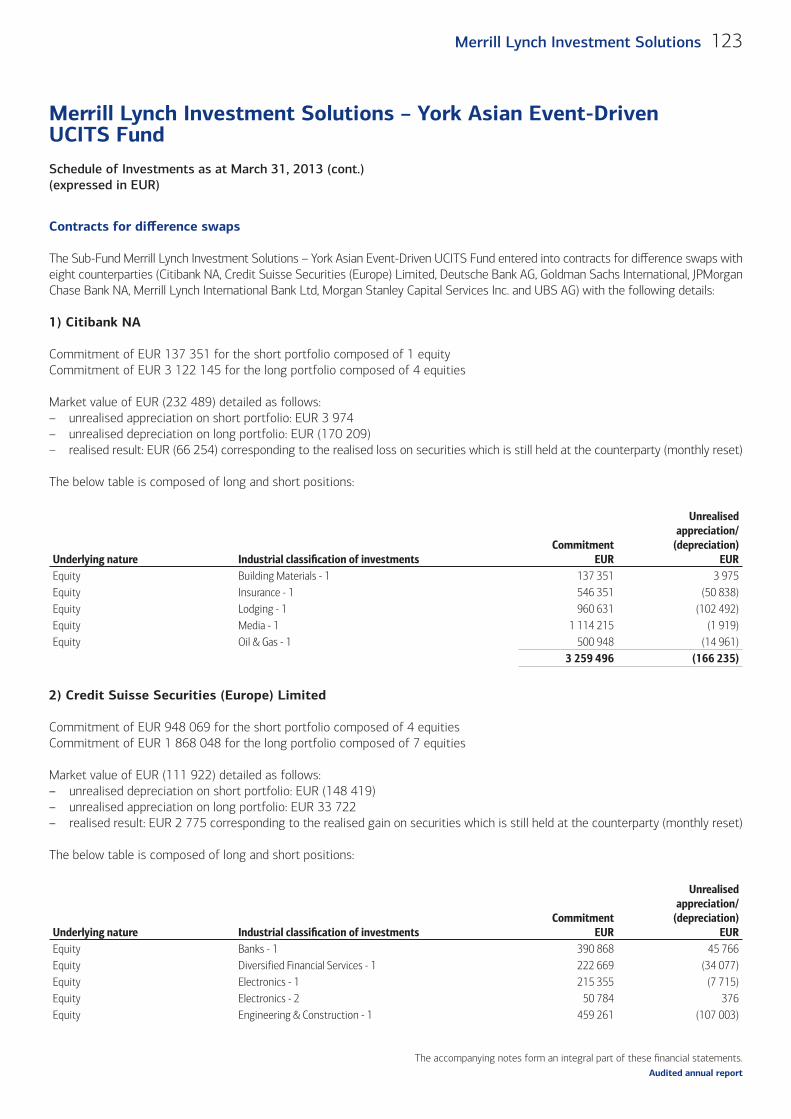
The accompanying notes form an integral part of these fi nancial statements.
Schedule of Investments as at March 31, 2013 (cont.)(expressed in EUR)
Merrill Lynch Investment Solutions – York Asian Event-Driven UCITS Fund
123Merrill Lynch Investment Solutions
Audited annual report
Contracts for diff erence swaps
The Sub-Fund Merrill Lynch Investment Solutions – York Asian Event-Driven UCITS Fund entered into contracts for diff erence swaps with eight counterparties (Citibank NA, Credit Suisse Securities (Europe) Limited, Deutsche Bank AG, Goldman Sachs International, JPMorgan Chase Bank NA, Merrill Lynch International Bank Ltd, Morgan Stanley Capital Services Inc. and UBS AG) with the following details:
1) Citibank NA
Commitment of EUR 137 351 for the short portfolio composed of 1 equityCommitment of EUR 3 122 145 for the long portfolio composed of 4 equities
Market value of EUR (232 489) detailed as follows:– unrealised appreciation on short portfolio: EUR 3 974– unrealised depreciation on long portfolio: EUR (170 209)– realised result: EUR (66 254) corresponding to the realised loss on securities which is still held at the counterparty (monthly reset)
The below table is composed of long and short positions:
Underlying nature Industrial classifi cation of investments Commitment
EUR
Unrealised appreciation/
(depreciation)EUR
Equity Building Materials - 1 137 351 3 975 Equity Insurance - 1 546 351 (50 838)Equity Lodging - 1 960 631 (102 492)Equity Media - 1 1 114 215 (1 919)Equity Oil & Gas - 1 500 948 (14 961)
3 259 496 (166 235)
2) Credit Suisse Securities (Europe) Limited
Commitment of EUR 948 069 for the short portfolio composed of 4 equitiesCommitment of EUR 1 868 048 for the long portfolio composed of 7 equities
Market value of EUR (111 922) detailed as follows:– unrealised depreciation on short portfolio: EUR (148 419)– unrealised appreciation on long portfolio: EUR 33 722– realised result: EUR 2 775 corresponding to the realised gain on securities which is still held at the counterparty (monthly reset)
The below table is composed of long and short positions:
Underlying nature Industrial classifi cation of investments Commitment
EUR
Unrealised appreciation/
(depreciation)EUR
Equity Banks - 1 390 868 45 766 Equity Diversified Financial Services - 1 222 669 (34 077)Equity Electronics - 1 215 355 (7 715)Equity Electronics - 2 50 784 376 Equity Engineering & Construction - 1 459 261 (107 003)
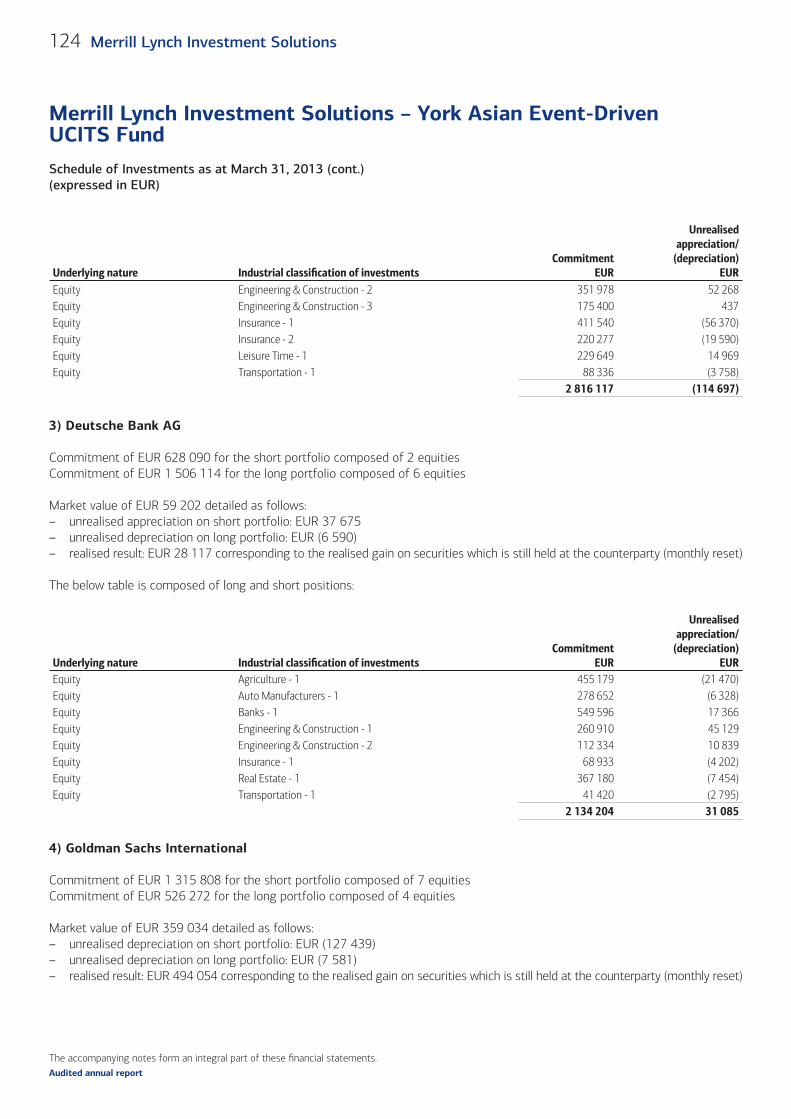
The accompanying notes form an integral part of these fi nancial statements.
Schedule of Investments as at March 31, 2013 (cont.)(expressed in EUR)
Merrill Lynch Investment Solutions – York Asian Event-Driven UCITS Fund
124 Merrill Lynch Investment Solutions
Audited annual report
Underlying nature Industrial classifi cation of investments Commitment
EUR
Unrealised appreciation/
(depreciation)EUR
Equity Engineering & Construction - 2 351 978 52 268 Equity Engineering & Construction - 3 175 400 437 Equity Insurance - 1 411 540 (56 370)Equity Insurance - 2 220 277 (19 590)Equity Leisure Time - 1 229 649 14 969 Equity Transportation - 1 88 336 (3 758)
2 816 117 (114 697)
3) Deutsche Bank AG
Commitment of EUR 628 090 for the short portfolio composed of 2 equitiesCommitment of EUR 1 506 114 for the long portfolio composed of 6 equities
Market value of EUR 59 202 detailed as follows:– unrealised appreciation on short portfolio: EUR 37 675– unrealised depreciation on long portfolio: EUR (6 590)– realised result: EUR 28 117 corresponding to the realised gain on securities which is still held at the counterparty (monthly reset)
The below table is composed of long and short positions:
Underlying nature Industrial classifi cation of investments Commitment
EUR
Unrealised appreciation/
(depreciation)EUR
Equity Agriculture - 1 455 179 (21 470)Equity Auto Manufacturers - 1 278 652 (6 328)Equity Banks - 1 549 596 17 366 Equity Engineering & Construction - 1 260 910 45 129 Equity Engineering & Construction - 2 112 334 10 839 Equity Insurance - 1 68 933 (4 202)Equity Real Estate - 1 367 180 (7 454)Equity Transportation - 1 41 420 (2 795)
2 134 204 31 085
4) Goldman Sachs International
Commitment of EUR 1 315 808 for the short portfolio composed of 7 equitiesCommitment of EUR 526 272 for the long portfolio composed of 4 equities
Market value of EUR 359 034 detailed as follows:– unrealised depreciation on short portfolio: EUR (127 439)– unrealised depreciation on long portfolio: EUR (7 581)– realised result: EUR 494 054 corresponding to the realised gain on securities which is still held at the counterparty (monthly reset)
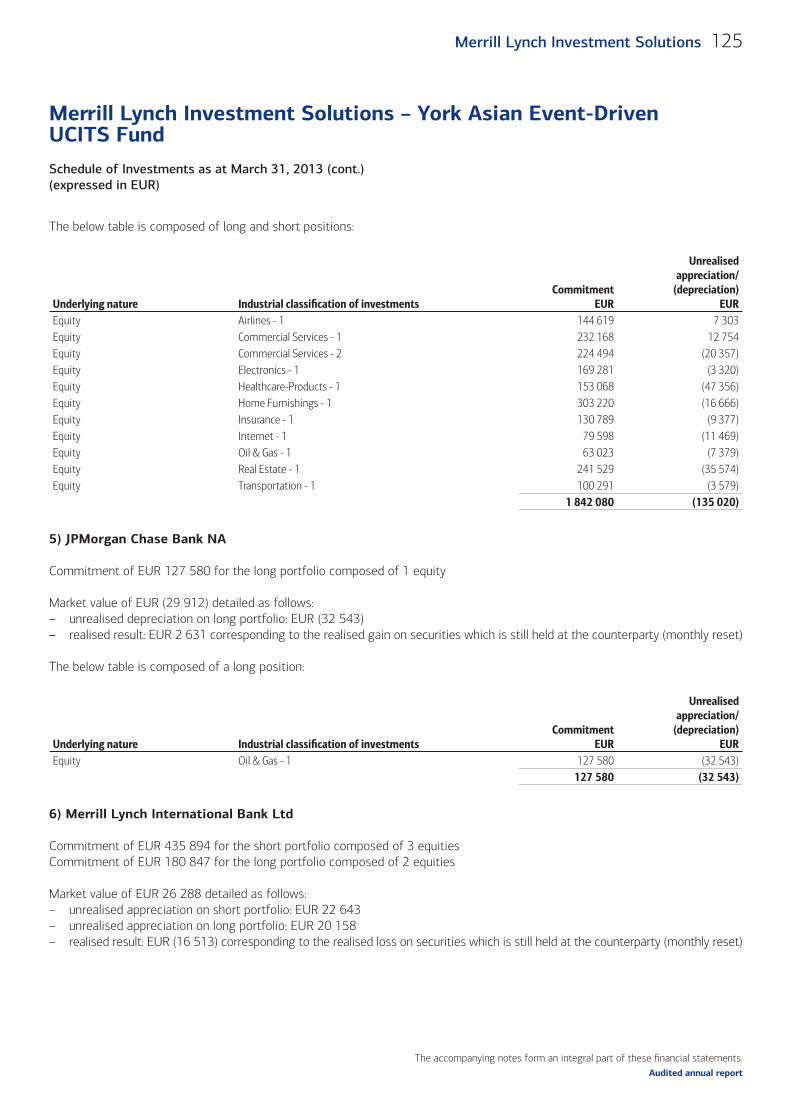
The accompanying notes form an integral part of these fi nancial statements.
Schedule of Investments as at March 31, 2013 (cont.)(expressed in EUR)
Merrill Lynch Investment Solutions – York Asian Event-Driven UCITS Fund
125Merrill Lynch Investment Solutions
Audited annual report
The below table is composed of long and short positions:
Underlying nature Industrial classifi cation of investments Commitment
EUR
Unrealised appreciation/
(depreciation)EUR
Equity Airlines - 1 144 619 7 303 Equity Commercial Services - 1 232 168 12 754 Equity Commercial Services - 2 224 494 (20 357)Equity Electronics - 1 169 281 (3 320)Equity Healthcare-Products - 1 153 068 (47 356)Equity Home Furnishings - 1 303 220 (16 666)Equity Insurance - 1 130 789 (9 377)Equity Internet - 1 79 598 (11 469)Equity Oil & Gas - 1 63 023 (7 379)Equity Real Estate - 1 241 529 (35 574)Equity Transportation - 1 100 291 (3 579)
1 842 080 (135 020)
5) JPMorgan Chase Bank NA
Commitment of EUR 127 580 for the long portfolio composed of 1 equity
Market value of EUR (29 912) detailed as follows:– unrealised depreciation on long portfolio: EUR (32 543)– realised result: EUR 2 631 corresponding to the realised gain on securities which is still held at the counterparty (monthly reset)
The below table is composed of a long position:
Underlying nature Industrial classifi cation of investments Commitment
EUR
Unrealised appreciation/
(depreciation)EUR
Equity Oil & Gas - 1 127 580 (32 543) 127 580 (32 543)
6) Merrill Lynch International Bank Ltd
Commitment of EUR 435 894 for the short portfolio composed of 3 equitiesCommitment of EUR 180 847 for the long portfolio composed of 2 equities
Market value of EUR 26 288 detailed as follows:– unrealised appreciation on short portfolio: EUR 22 643– unrealised appreciation on long portfolio: EUR 20 158– realised result: EUR (16 513) corresponding to the realised loss on securities which is still held at the counterparty (monthly reset)
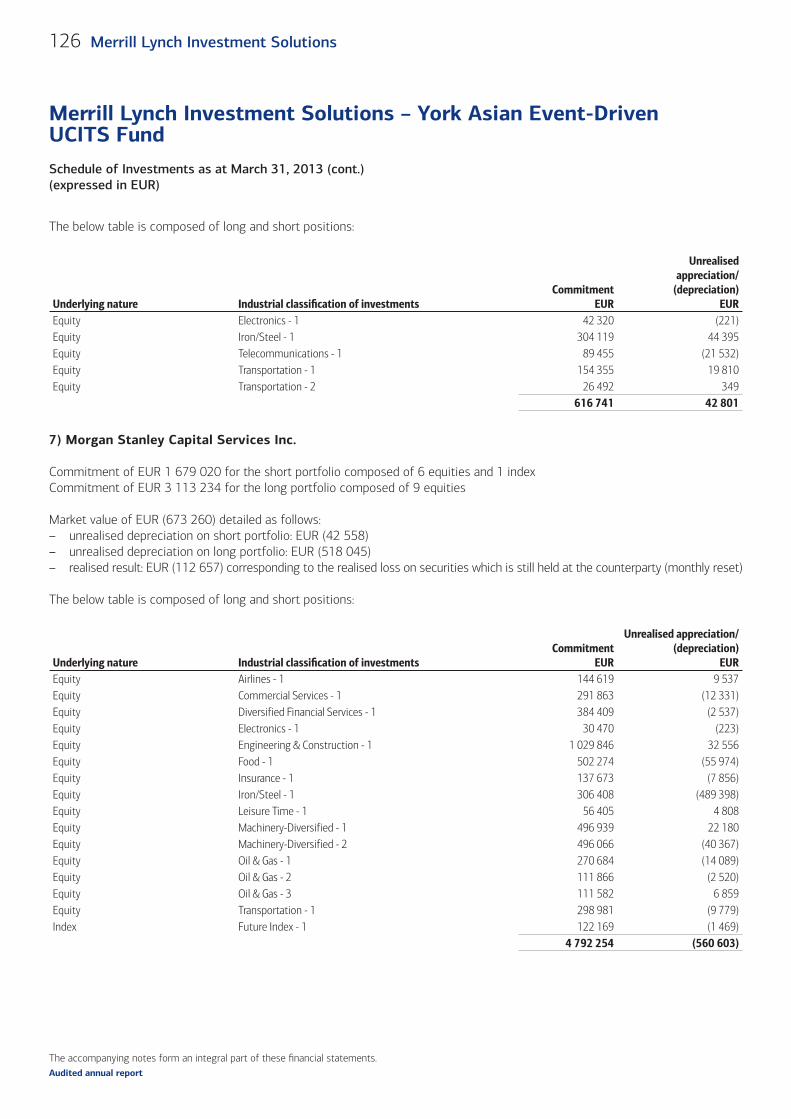
The accompanying notes form an integral part of these fi nancial statements.
Schedule of Investments as at March 31, 2013 (cont.)(expressed in EUR)
Merrill Lynch Investment Solutions – York Asian Event-Driven UCITS Fund
126 Merrill Lynch Investment Solutions
Audited annual report
The below table is composed of long and short positions:
Underlying nature Industrial classifi cation of investments Commitment
EUR
Unrealised appreciation/
(depreciation)EUR
Equity Electronics - 1 42 320 (221)Equity Iron/Steel - 1 304 119 44 395 Equity Telecommunications - 1 89 455 (21 532)Equity Transportation - 1 154 355 19 810 Equity Transportation - 2 26 492 349
616 741 42 801
7) Morgan Stanley Capital Services Inc.
Commitment of EUR 1 679 020 for the short portfolio composed of 6 equities and 1 indexCommitment of EUR 3 113 234 for the long portfolio composed of 9 equities
Market value of EUR (673 260) detailed as follows:– unrealised depreciation on short portfolio: EUR (42 558)– unrealised depreciation on long portfolio: EUR (518 045)– realised result: EUR (112 657) corresponding to the realised loss on securities which is still held at the counterparty (monthly reset)
The below table is composed of long and short positions:
Underlying nature Industrial classifi cation of investments Commitment
EUR
Unrealised appreciation/(depreciation)
EUREquity Airlines - 1 144 619 9 537 Equity Commercial Services - 1 291 863 (12 331)Equity Diversified Financial Services - 1 384 409 (2 537)Equity Electronics - 1 30 470 (223)Equity Engineering & Construction - 1 1 029 846 32 556 Equity Food - 1 502 274 (55 974)Equity Insurance - 1 137 673 (7 856)Equity Iron/Steel - 1 306 408 (489 398)Equity Leisure Time - 1 56 405 4 808 Equity Machinery-Diversified - 1 496 939 22 180 Equity Machinery-Diversified - 2 496 066 (40 367)Equity Oil & Gas - 1 270 684 (14 089)Equity Oil & Gas - 2 111 866 (2 520)Equity Oil & Gas - 3 111 582 6 859 Equity Transportation - 1 298 981 (9 779)Index Future Index - 1 122 169 (1 469)
4 792 254 (560 603)
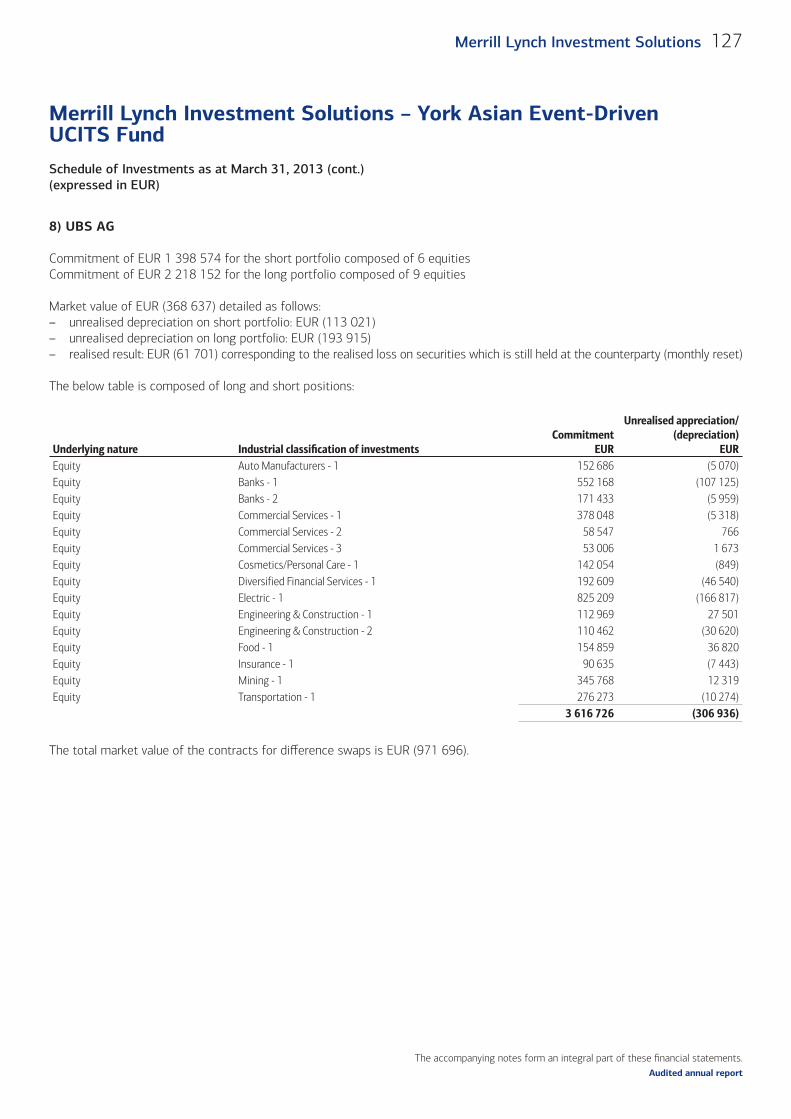
The accompanying notes form an integral part of these fi nancial statements.
Schedule of Investments as at March 31, 2013 (cont.)(expressed in EUR)
Merrill Lynch Investment Solutions – York Asian Event-Driven UCITS Fund
127Merrill Lynch Investment Solutions
Audited annual report
8) UBS AG
Commitment of EUR 1 398 574 for the short portfolio composed of 6 equitiesCommitment of EUR 2 218 152 for the long portfolio composed of 9 equities
Market value of EUR (368 637) detailed as follows:– unrealised depreciation on short portfolio: EUR (113 021)– unrealised depreciation on long portfolio: EUR (193 915)– realised result: EUR (61 701) corresponding to the realised loss on securities which is still held at the counterparty (monthly reset)
The below table is composed of long and short positions:
Underlying nature Industrial classifi cation of investments Commitment
EUR
Unrealised appreciation/(depreciation)
EUREquity Auto Manufacturers - 1 152 686 (5 070)Equity Banks - 1 552 168 (107 125)Equity Banks - 2 171 433 (5 959)Equity Commercial Services - 1 378 048 (5 318)Equity Commercial Services - 2 58 547 766 Equity Commercial Services - 3 53 006 1 673 Equity Cosmetics/Personal Care - 1 142 054 (849)Equity Diversified Financial Services - 1 192 609 (46 540)Equity Electric - 1 825 209 (166 817)Equity Engineering & Construction - 1 112 969 27 501 Equity Engineering & Construction - 2 110 462 (30 620)Equity Food - 1 154 859 36 820 Equity Insurance - 1 90 635 (7 443)Equity Mining - 1 345 768 12 319 Equity Transportation - 1 276 273 (10 274)
3 616 726 (306 936)
The total market value of the contracts for diff erence swaps is EUR (971 696).
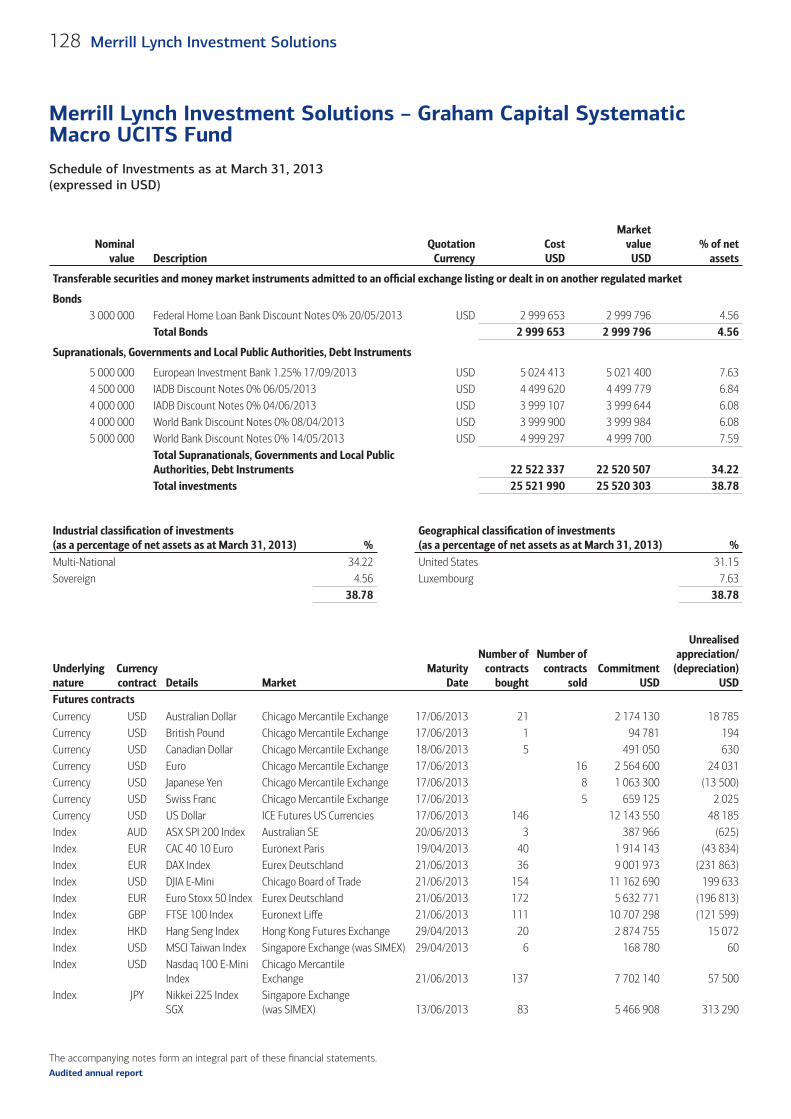
The accompanying notes form an integral part of these fi nancial statements.
Schedule of Investments as at March 31, 2013 (expressed in USD)
Merrill Lynch Investment Solutions – Graham Capital Systematic Macro UCITS Fund
128 Merrill Lynch Investment Solutions
Audited annual report
Nominalvalue Description
QuotationCurrency
CostUSD
Marketvalue
USD% of net
assets
Transferable securities and money market instruments admitted to an offi cial exchange listing or dealt in on another regulated market
Bonds3 000 000 Federal Home Loan Bank Discount Notes 0% 20/05/2013 USD 2 999 653 2 999 796 4.56
Total Bonds 2 999 653 2 999 796 4.56
Supranationals, Governments and Local Public Authorities, Debt Instruments
5 000 000 European Investment Bank 1.25% 17/09/2013 USD 5 024 413 5 021 400 7.634 500 000 IADB Discount Notes 0% 06/05/2013 USD 4 499 620 4 499 779 6.844 000 000 IADB Discount Notes 0% 04/06/2013 USD 3 999 107 3 999 644 6.084 000 000 World Bank Discount Notes 0% 08/04/2013 USD 3 999 900 3 999 984 6.085 000 000 World Bank Discount Notes 0% 14/05/2013 USD 4 999 297 4 999 700 7.59
Total Supranationals, Governments and Local Public Authorities, Debt Instruments 22 522 337 22 520 507 34.22Total investments 25 521 990 25 520 303 38.78
Industrial classifi cation of investments (as a percentage of net assets as at March 31, 2013) %
Geographical classifi cation of investments (as a percentage of net assets as at March 31, 2013) %
Multi-National 34.22 United States 31.15Sovereign 4.56 Luxembourg 7.63
38.78 38.78
Underlyingnature
Currencycontract Details Market
MaturityDate
Number ofcontracts
bought
Number ofcontracts
soldCommitment
USD
Unrealisedappreciation/
(depreciation)USD
Futures contracts (cont.)Currency USD Australian Dollar Chicago Mercantile Exchange 17/06/2013 21 2 174 130 18 785Currency USD British Pound Chicago Mercantile Exchange 17/06/2013 1 94 781 194Currency USD Canadian Dollar Chicago Mercantile Exchange 18/06/2013 5 491 050 630Currency USD Euro Chicago Mercantile Exchange 17/06/2013 16 2 564 600 24 031Currency USD Japanese Yen Chicago Mercantile Exchange 17/06/2013 8 1 063 300 (13 500)Currency USD Swiss Franc Chicago Mercantile Exchange 17/06/2013 5 659 125 2 025Currency USD US Dollar ICE Futures US Currencies 17/06/2013 146 12 143 550 48 185Index AUD ASX SPI 200 Index Australian SE 20/06/2013 3 387 966 (625)Index EUR CAC 40 10 Euro Euronext Paris 19/04/2013 40 1 914 143 (43 834)Index EUR DAX Index Eurex Deutschland 21/06/2013 36 9 001 973 (231 863)Index USD DJIA E-Mini Chicago Board of Trade 21/06/2013 154 11 162 690 199 633Index EUR Euro Stoxx 50 Index Eurex Deutschland 21/06/2013 172 5 632 771 (196 813)Index GBP FTSE 100 Index Euronext Liffe 21/06/2013 111 10 707 298 (121 599)Index HKD Hang Seng Index Hong Kong Futures Exchange 29/04/2013 20 2 874 755 15 072Index USD MSCI Taiwan Index Singapore Exchange (was SIMEX) 29/04/2013 6 168 780 60Index USD Nasdaq 100 E-Mini
IndexChicago Mercantile Exchange 21/06/2013 137 7 702 140 57 500
Index JPY Nikkei 225 Index SGX
Singapore Exchange (was SIMEX) 13/06/2013 83 5 466 908 313 290
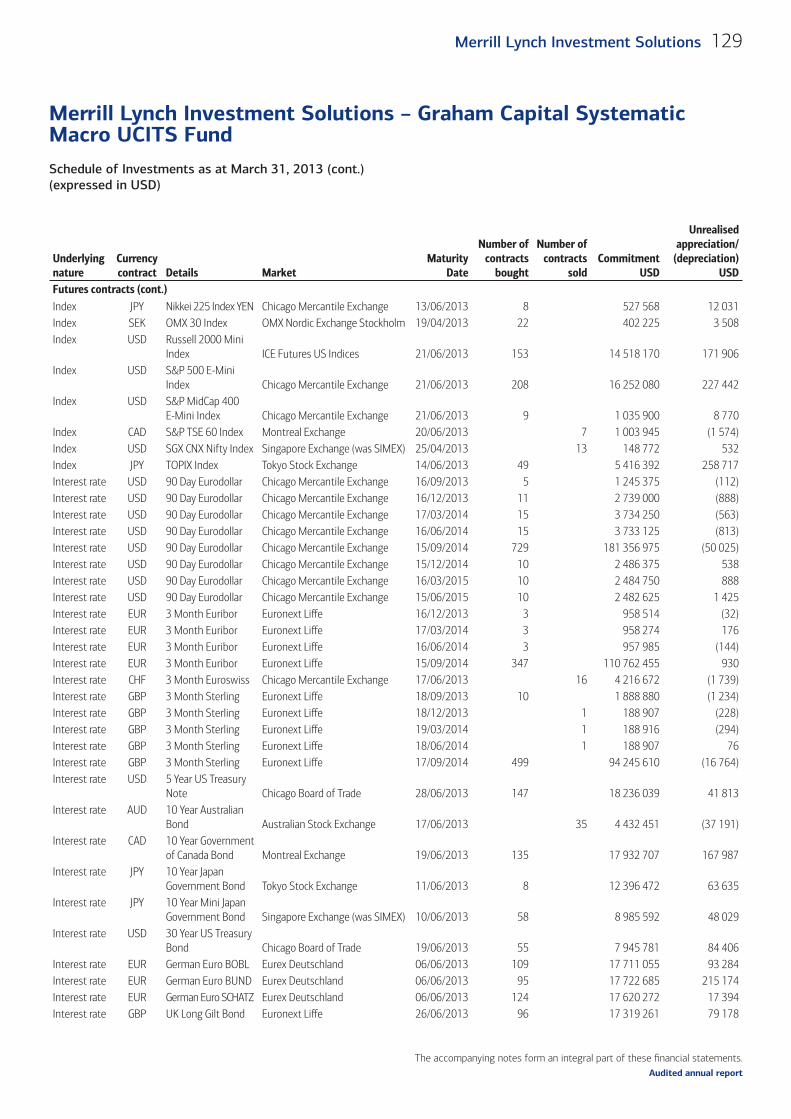
The accompanying notes form an integral part of these fi nancial statements.
Schedule of Investments as at March 31, 2013 (cont.)(expressed in USD)
Merrill Lynch Investment Solutions – Graham Capital Systematic Macro UCITS Fund
129Merrill Lynch Investment Solutions
Audited annual report
Underlyingnature
Currencycontract Details Market
MaturityDate
Number ofcontracts
bought
Number ofcontracts
soldCommitment
USD
Unrealisedappreciation/
(depreciation)USD
Futures contracts (cont.)Index JPY Nikkei 225 Index YEN Chicago Mercantile Exchange 13/06/2013 8 527 568 12 031Index SEK OMX 30 Index OMX Nordic Exchange Stockholm 19/04/2013 22 402 225 3 508Index USD Russell 2000 Mini
Index ICE Futures US Indices 21/06/2013 153 14 518 170 171 906Index USD S&P 500 E-Mini
Index Chicago Mercantile Exchange 21/06/2013 208 16 252 080 227 442Index USD S&P MidCap 400
E-Mini Index Chicago Mercantile Exchange 21/06/2013 9 1 035 900 8 770Index CAD S&P TSE 60 Index Montreal Exchange 20/06/2013 7 1 003 945 (1 574)Index USD SGX CNX Nifty Index Singapore Exchange (was SIMEX) 25/04/2013 13 148 772 532Index JPY TOPIX Index Tokyo Stock Exchange 14/06/2013 49 5 416 392 258 717Interest rate USD 90 Day Eurodollar Chicago Mercantile Exchange 16/09/2013 5 1 245 375 (112)Interest rate USD 90 Day Eurodollar Chicago Mercantile Exchange 16/12/2013 11 2 739 000 (888)Interest rate USD 90 Day Eurodollar Chicago Mercantile Exchange 17/03/2014 15 3 734 250 (563)Interest rate USD 90 Day Eurodollar Chicago Mercantile Exchange 16/06/2014 15 3 733 125 (813)Interest rate USD 90 Day Eurodollar Chicago Mercantile Exchange 15/09/2014 729 181 356 975 (50 025)Interest rate USD 90 Day Eurodollar Chicago Mercantile Exchange 15/12/2014 10 2 486 375 538Interest rate USD 90 Day Eurodollar Chicago Mercantile Exchange 16/03/2015 10 2 484 750 888Interest rate USD 90 Day Eurodollar Chicago Mercantile Exchange 15/06/2015 10 2 482 625 1 425Interest rate EUR 3 Month Euribor Euronext Liffe 16/12/2013 3 958 514 (32)Interest rate EUR 3 Month Euribor Euronext Liffe 17/03/2014 3 958 274 176Interest rate EUR 3 Month Euribor Euronext Liffe 16/06/2014 3 957 985 (144)Interest rate EUR 3 Month Euribor Euronext Liffe 15/09/2014 347 110 762 455 930Interest rate CHF 3 Month Euroswiss Chicago Mercantile Exchange 17/06/2013 16 4 216 672 (1 739)Interest rate GBP 3 Month Sterling Euronext Liffe 18/09/2013 10 1 888 880 (1 234)Interest rate GBP 3 Month Sterling Euronext Liffe 18/12/2013 1 188 907 (228)Interest rate GBP 3 Month Sterling Euronext Liffe 19/03/2014 1 188 916 (294)Interest rate GBP 3 Month Sterling Euronext Liffe 18/06/2014 1 188 907 76Interest rate GBP 3 Month Sterling Euronext Liffe 17/09/2014 499 94 245 610 (16 764)Interest rate USD 5 Year US Treasury
Note Chicago Board of Trade 28/06/2013 147 18 236 039 41 813Interest rate AUD 10 Year Australian
Bond Australian Stock Exchange 17/06/2013 35 4 432 451 (37 191)Interest rate CAD 10 Year Government
of Canada Bond Montreal Exchange 19/06/2013 135 17 932 707 167 987Interest rate JPY 10 Year Japan
Government Bond Tokyo Stock Exchange 11/06/2013 8 12 396 472 63 635Interest rate JPY 10 Year Mini Japan
Government Bond Singapore Exchange (was SIMEX) 10/06/2013 58 8 985 592 48 029Interest rate USD 30 Year US Treasury
Bond Chicago Board of Trade 19/06/2013 55 7 945 781 84 406Interest rate EUR German Euro BOBL Eurex Deutschland 06/06/2013 109 17 711 055 93 284Interest rate EUR German Euro BUND Eurex Deutschland 06/06/2013 95 17 722 685 215 174Interest rate EUR German Euro SCHATZ Eurex Deutschland 06/06/2013 124 17 620 272 17 394Interest rate GBP UK Long Gilt Bond Euronext Liffe 26/06/2013 96 17 319 261 79 178
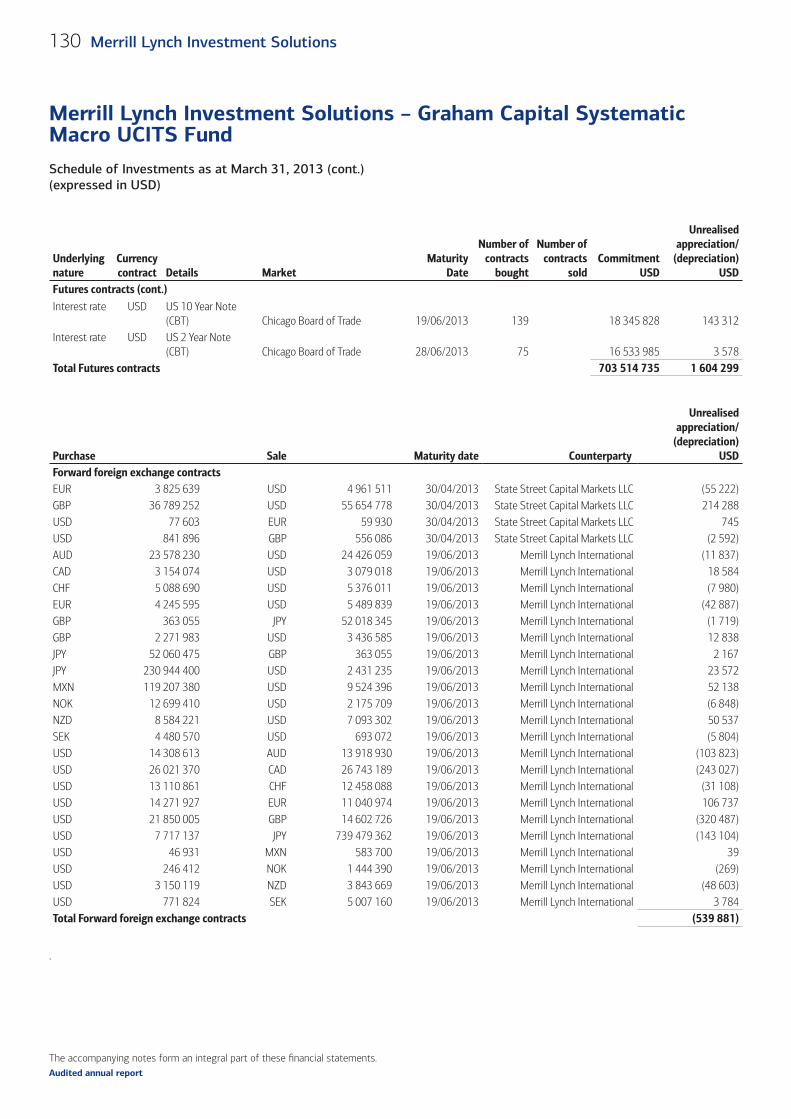
The accompanying notes form an integral part of these fi nancial statements.
Schedule of Investments as at March 31, 2013 (cont.)(expressed in USD)
Merrill Lynch Investment Solutions – Graham Capital Systematic Macro UCITS Fund
130 Merrill Lynch Investment Solutions
Audited annual report
Underlyingnature
Currencycontract Details Market
MaturityDate
Number ofcontracts
bought
Number ofcontracts
soldCommitment
USD
Unrealisedappreciation/
(depreciation)USD
Futures contracts (cont.)Interest rate USD US 10 Year Note
(CBT) Chicago Board of Trade 19/06/2013 139 18 345 828 143 312Interest rate USD US 2 Year Note
(CBT) Chicago Board of Trade 28/06/2013 75 16 533 985 3 578Total Futures contracts 703 514 735 1 604 299
Purchase Sale Maturity date Counterparty
Unrealised appreciation/
(depreciation) USD
Forward foreign exchange contractsEUR 3 825 639 USD 4 961 511 30/04/2013 State Street Capital Markets LLC (55 222)GBP 36 789 252 USD 55 654 778 30/04/2013 State Street Capital Markets LLC 214 288 USD 77 603 EUR 59 930 30/04/2013 State Street Capital Markets LLC 745 USD 841 896 GBP 556 086 30/04/2013 State Street Capital Markets LLC (2 592)AUD 23 578 230 USD 24 426 059 19/06/2013 Merrill Lynch International (11 837)CAD 3 154 074 USD 3 079 018 19/06/2013 Merrill Lynch International 18 584 CHF 5 088 690 USD 5 376 011 19/06/2013 Merrill Lynch International (7 980)EUR 4 245 595 USD 5 489 839 19/06/2013 Merrill Lynch International (42 887)GBP 363 055 JPY 52 018 345 19/06/2013 Merrill Lynch International (1 719)GBP 2 271 983 USD 3 436 585 19/06/2013 Merrill Lynch International 12 838 JPY 52 060 475 GBP 363 055 19/06/2013 Merrill Lynch International 2 167 JPY 230 944 400 USD 2 431 235 19/06/2013 Merrill Lynch International 23 572 MXN 119 207 380 USD 9 524 396 19/06/2013 Merrill Lynch International 52 138 NOK 12 699 410 USD 2 175 709 19/06/2013 Merrill Lynch International (6 848)NZD 8 584 221 USD 7 093 302 19/06/2013 Merrill Lynch International 50 537 SEK 4 480 570 USD 693 072 19/06/2013 Merrill Lynch International (5 804)USD 14 308 613 AUD 13 918 930 19/06/2013 Merrill Lynch International (103 823)USD 26 021 370 CAD 26 743 189 19/06/2013 Merrill Lynch International (243 027)USD 13 110 861 CHF 12 458 088 19/06/2013 Merrill Lynch International (31 108)USD 14 271 927 EUR 11 040 974 19/06/2013 Merrill Lynch International 106 737 USD 21 850 005 GBP 14 602 726 19/06/2013 Merrill Lynch International (320 487)USD 7 717 137 JPY 739 479 362 19/06/2013 Merrill Lynch International (143 104)USD 46 931 MXN 583 700 19/06/2013 Merrill Lynch International 39 USD 246 412 NOK 1 444 390 19/06/2013 Merrill Lynch International (269)USD 3 150 119 NZD 3 843 669 19/06/2013 Merrill Lynch International (48 603)USD 771 824 SEK 5 007 160 19/06/2013 Merrill Lynch International 3 784 Total Forward foreign exchange contracts (539 881)
.
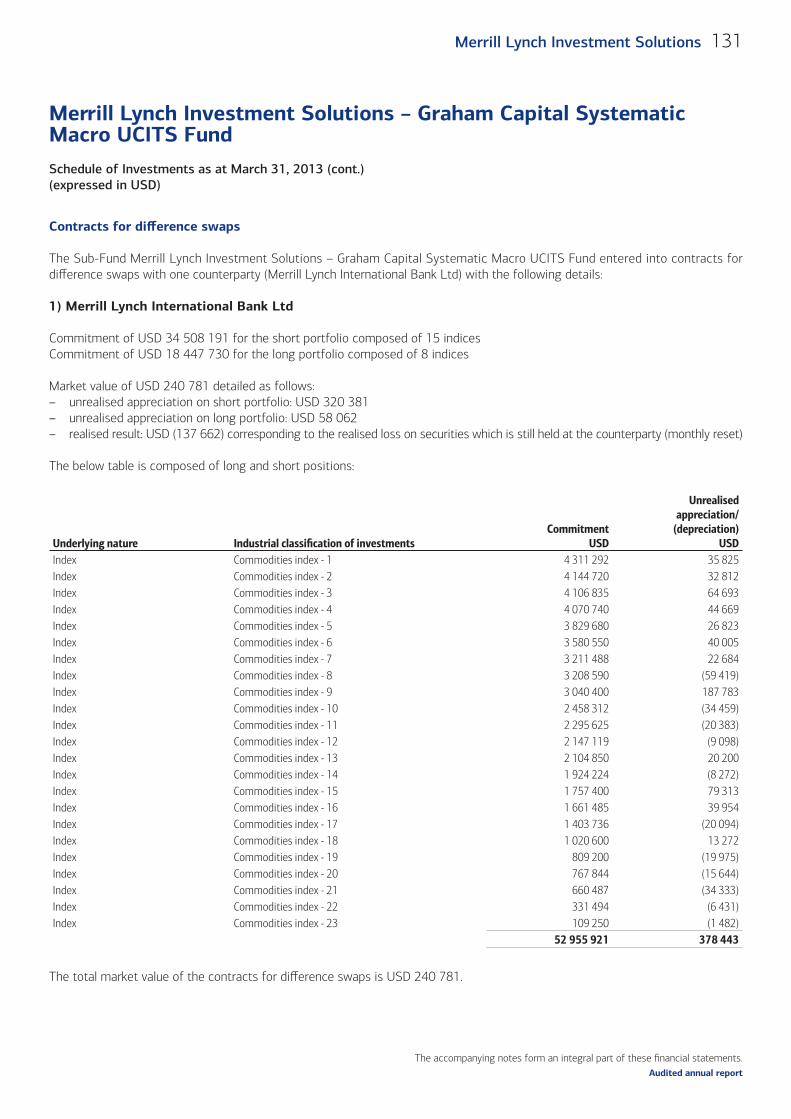
The accompanying notes form an integral part of these fi nancial statements.
Schedule of Investments as at March 31, 2013 (cont.)(expressed in USD)
Merrill Lynch Investment Solutions – Graham Capital Systematic Macro UCITS Fund
131Merrill Lynch Investment Solutions
Audited annual report
Contracts for diff erence swaps
The Sub-Fund Merrill Lynch Investment Solutions – Graham Capital Systematic Macro UCITS Fund entered into contracts for diff erence swaps with one counterparty (Merrill Lynch International Bank Ltd) with the following details:
1) Merrill Lynch International Bank Ltd
Commitment of USD 34 508 191 for the short portfolio composed of 15 indicesCommitment of USD 18 447 730 for the long portfolio composed of 8 indices
Market value of USD 240 781 detailed as follows:– unrealised appreciation on short portfolio: USD 320 381– unrealised appreciation on long portfolio: USD 58 062– realised result: USD (137 662) corresponding to the realised loss on securities which is still held at the counterparty (monthly reset)
The below table is composed of long and short positions:
Underlying nature Industrial classifi cation of investments Commitment
USD
Unrealised appreciation/
(depreciation)USD
Index Commodities index - 1 4 311 292 35 825 Index Commodities index - 2 4 144 720 32 812 Index Commodities index - 3 4 106 835 64 693 Index Commodities index - 4 4 070 740 44 669 Index Commodities index - 5 3 829 680 26 823 Index Commodities index - 6 3 580 550 40 005 Index Commodities index - 7 3 211 488 22 684 Index Commodities index - 8 3 208 590 (59 419)Index Commodities index - 9 3 040 400 187 783 Index Commodities index - 10 2 458 312 (34 459)Index Commodities index - 11 2 295 625 (20 383)Index Commodities index - 12 2 147 119 (9 098)Index Commodities index - 13 2 104 850 20 200 Index Commodities index - 14 1 924 224 (8 272)Index Commodities index - 15 1 757 400 79 313 Index Commodities index - 16 1 661 485 39 954 Index Commodities index - 17 1 403 736 (20 094)Index Commodities index - 18 1 020 600 13 272 Index Commodities index - 19 809 200 (19 975)Index Commodities index - 20 767 844 (15 644)Index Commodities index - 21 660 487 (34 333)Index Commodities index - 22 331 494 (6 431)Index Commodities index - 23 109 250 (1 482)
52 955 921 378 443
The total market value of the contracts for diff erence swaps is USD 240 781.
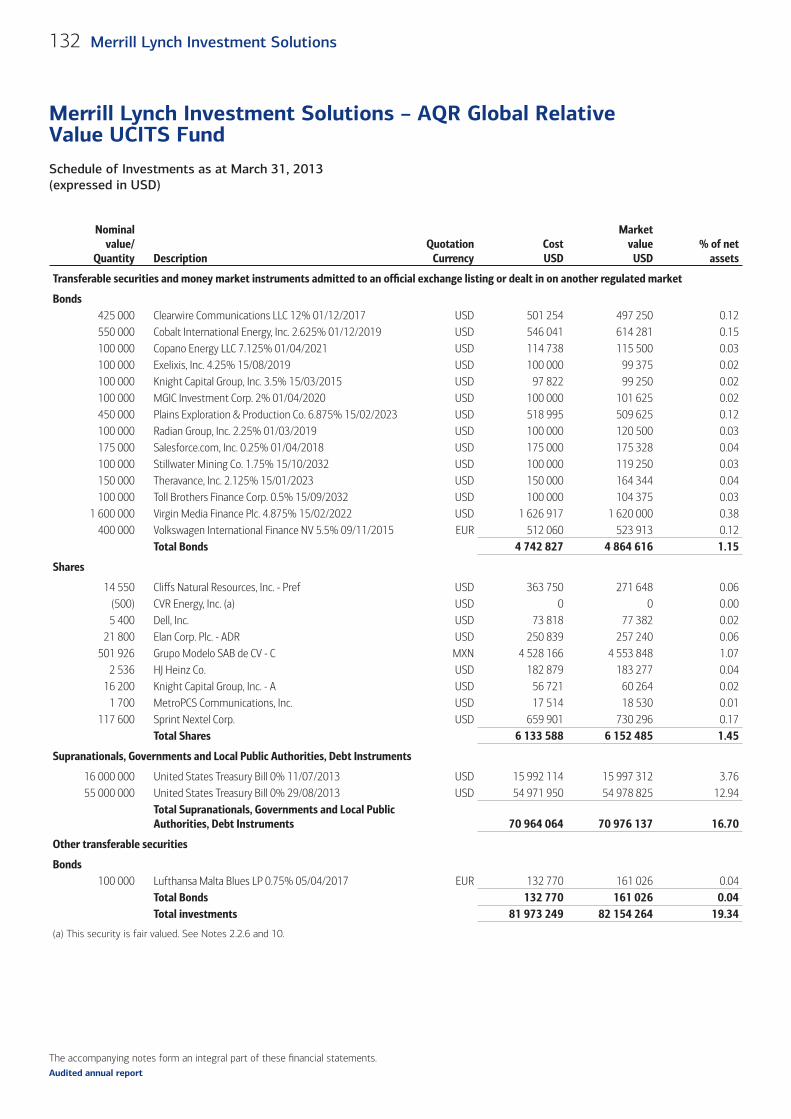
The accompanying notes form an integral part of these fi nancial statements.
Schedule of Investments as at March 31, 2013 (expressed in USD)
Merrill Lynch Investment Solutions – AQR Global Relative Value UCITS Fund
132 Merrill Lynch Investment Solutions
Audited annual report
Nominalvalue/
Quantity DescriptionQuotation
CurrencyCostUSD
Marketvalue
USD% of net
assets
Transferable securities and money market instruments admitted to an offi cial exchange listing or dealt in on another regulated market
Bonds425 000 Clearwire Communications LLC 12% 01/12/2017 USD 501 254 497 250 0.12550 000 Cobalt International Energy, Inc. 2.625% 01/12/2019 USD 546 041 614 281 0.15100 000 Copano Energy LLC 7.125% 01/04/2021 USD 114 738 115 500 0.03100 000 Exelixis, Inc. 4.25% 15/08/2019 USD 100 000 99 375 0.02100 000 Knight Capital Group, Inc. 3.5% 15/03/2015 USD 97 822 99 250 0.02100 000 MGIC Investment Corp. 2% 01/04/2020 USD 100 000 101 625 0.02450 000 Plains Exploration & Production Co. 6.875% 15/02/2023 USD 518 995 509 625 0.12100 000 Radian Group, Inc. 2.25% 01/03/2019 USD 100 000 120 500 0.03175 000 Salesforce.com, Inc. 0.25% 01/04/2018 USD 175 000 175 328 0.04100 000 Stillwater Mining Co. 1.75% 15/10/2032 USD 100 000 119 250 0.03150 000 Theravance, Inc. 2.125% 15/01/2023 USD 150 000 164 344 0.04100 000 Toll Brothers Finance Corp. 0.5% 15/09/2032 USD 100 000 104 375 0.03
1 600 000 Virgin Media Finance Plc. 4.875% 15/02/2022 USD 1 626 917 1 620 000 0.38400 000 Volkswagen International Finance NV 5.5% 09/11/2015 EUR 512 060 523 913 0.12
Total Bonds 4 742 827 4 864 616 1.15
Shares
14 550 Cliffs Natural Resources, Inc. - Pref USD 363 750 271 648 0.06(500) CVR Energy, Inc. (a) USD 0 0 0.005 400 Dell, Inc. USD 73 818 77 382 0.02
21 800 Elan Corp. Plc. - ADR USD 250 839 257 240 0.06501 926 Grupo Modelo SAB de CV - C MXN 4 528 166 4 553 848 1.07
2 536 HJ Heinz Co. USD 182 879 183 277 0.0416 200 Knight Capital Group, Inc. - A USD 56 721 60 264 0.02
1 700 MetroPCS Communications, Inc. USD 17 514 18 530 0.01117 600 Sprint Nextel Corp. USD 659 901 730 296 0.17
Total Shares 6 133 588 6 152 485 1.45
Supranationals, Governments and Local Public Authorities, Debt Instruments
16 000 000 United States Treasury Bill 0% 11/07/2013 USD 15 992 114 15 997 312 3.7655 000 000 United States Treasury Bill 0% 29/08/2013 USD 54 971 950 54 978 825 12.94
Total Supranationals, Governments and Local Public Authorities, Debt Instruments 70 964 064 70 976 137 16.70
Other transferable securities
Bonds100 000 Lufthansa Malta Blues LP 0.75% 05/04/2017 EUR 132 770 161 026 0.04
Total Bonds 132 770 161 026 0.04Total investments 81 973 249 82 154 264 19.34
(a) This security is fair valued. See Notes 2.2.6 and 10.
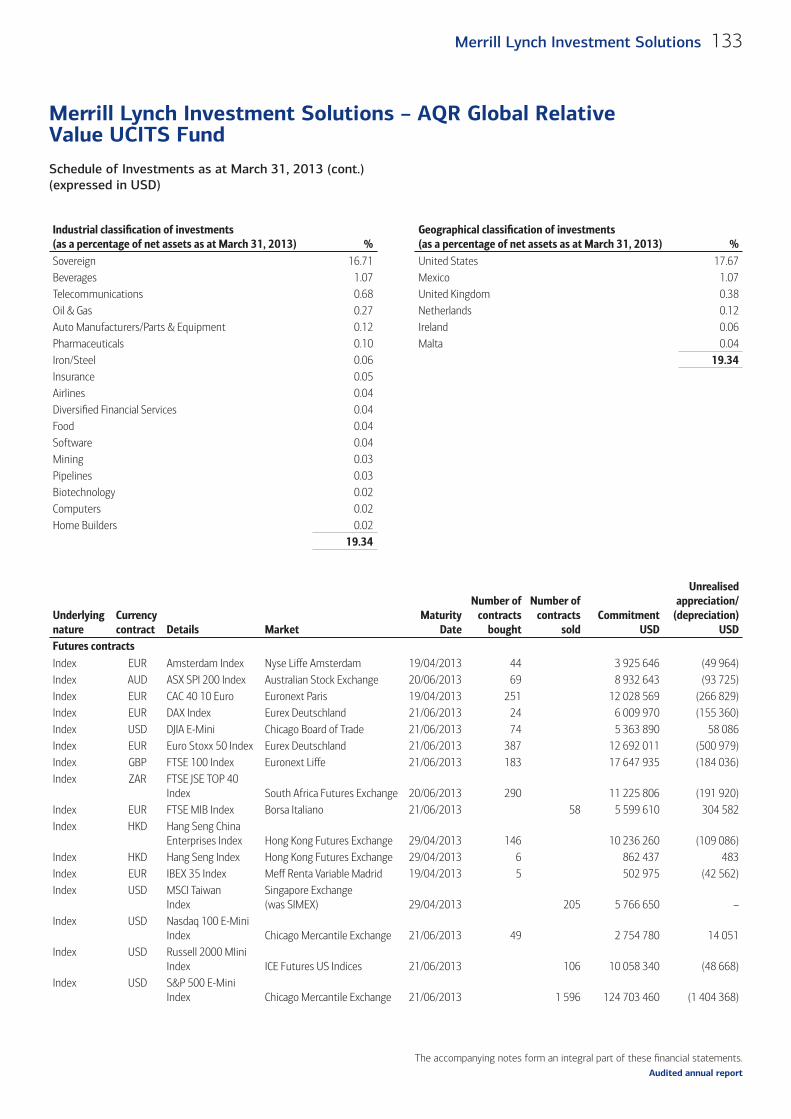
The accompanying notes form an integral part of these fi nancial statements.
Schedule of Investments as at March 31, 2013 (cont.)(expressed in USD)
Merrill Lynch Investment Solutions – AQR Global Relative Value UCITS Fund
133Merrill Lynch Investment Solutions
Audited annual report
Industrial classifi cation of investments (as a percentage of net assets as at March 31, 2013) %
Geographical classifi cation of investments (as a percentage of net assets as at March 31, 2013) %
Sovereign 16.71 United States 17.67Beverages 1.07 Mexico 1.07Telecommunications 0.68 United Kingdom 0.38Oil & Gas 0.27 Netherlands 0.12Auto Manufacturers/Parts & Equipment 0.12 Ireland 0.06Pharmaceuticals 0.10 Malta 0.04Iron/Steel 0.06 19.34 Insurance 0.05Airlines 0.04Diversifi ed Financial Services 0.04Food 0.04Software 0.04Mining 0.03Pipelines 0.03Biotechnology 0.02Computers 0.02Home Builders 0.02
19.34
Underlyingnature
Currencycontract Details Market
MaturityDate
Number ofcontracts
bought
Number ofcontracts
soldCommitment
USD
Unrealisedappreciation/
(depreciation)USD
Futures contracts (cont.)Index EUR Amsterdam Index Nyse Liffe Amsterdam 19/04/2013 44 3 925 646 (49 964)Index AUD ASX SPI 200 Index Australian Stock Exchange 20/06/2013 69 8 932 643 (93 725)Index EUR CAC 40 10 Euro Euronext Paris 19/04/2013 251 12 028 569 (266 829)Index EUR DAX Index Eurex Deutschland 21/06/2013 24 6 009 970 (155 360)Index USD DJIA E-Mini Chicago Board of Trade 21/06/2013 74 5 363 890 58 086Index EUR Euro Stoxx 50 Index Eurex Deutschland 21/06/2013 387 12 692 011 (500 979)Index GBP FTSE 100 Index Euronext Liffe 21/06/2013 183 17 647 935 (184 036)Index ZAR FTSE JSE TOP 40
Index South Africa Futures Exchange 20/06/2013 290 11 225 806 (191 920)Index EUR FTSE MIB Index Borsa Italiano 21/06/2013 58 5 599 610 304 582Index HKD Hang Seng China
Enterprises Index Hong Kong Futures Exchange 29/04/2013 146 10 236 260 (109 086)Index HKD Hang Seng Index Hong Kong Futures Exchange 29/04/2013 6 862 437 483Index EUR IBEX 35 Index Meff Renta Variable Madrid 19/04/2013 5 502 975 (42 562)Index USD MSCI Taiwan
IndexSingapore Exchange (was SIMEX) 29/04/2013 205 5 766 650 –
Index USD Nasdaq 100 E-Mini Index Chicago Mercantile Exchange 21/06/2013 49 2 754 780 14 051
Index USD Russell 2000 MIini Index ICE Futures US Indices 21/06/2013 106 10 058 340 (48 668)
Index USD S&P 500 E-Mini Index Chicago Mercantile Exchange 21/06/2013 1 596 124 703 460 (1 404 368)
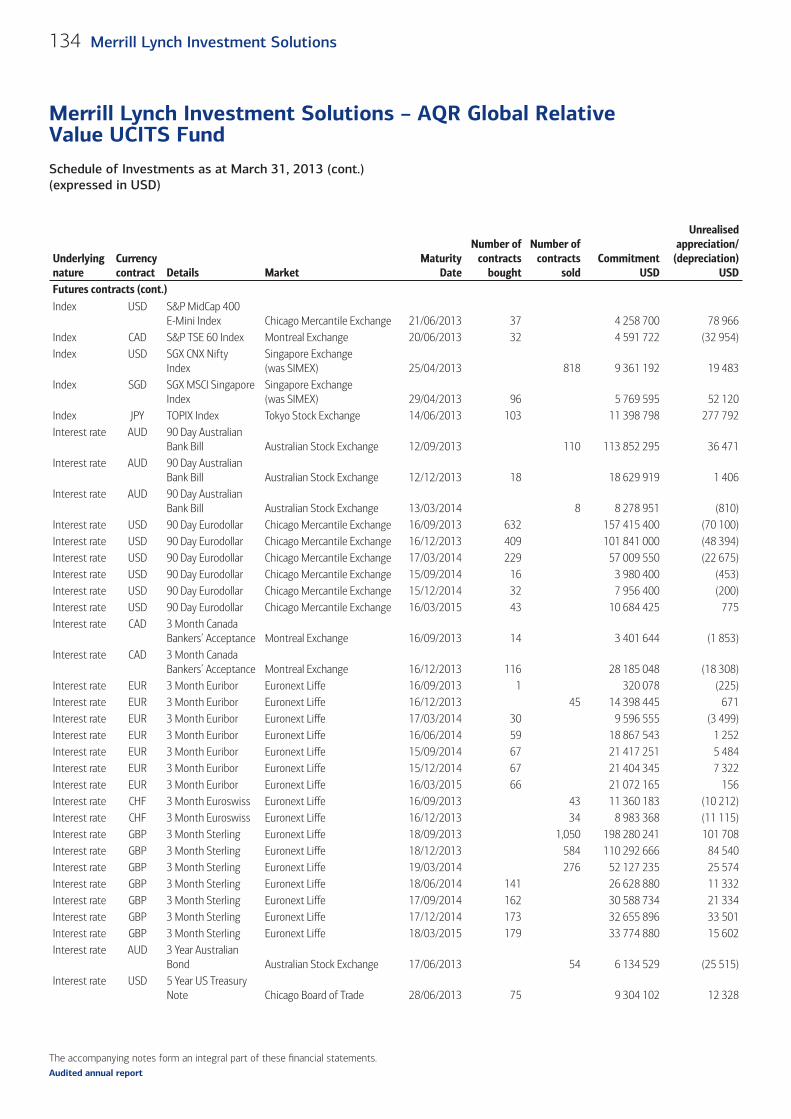
The accompanying notes form an integral part of these fi nancial statements.
Schedule of Investments as at March 31, 2013 (cont.)(expressed in USD)
Merrill Lynch Investment Solutions – AQR Global Relative Value UCITS Fund
134 Merrill Lynch Investment Solutions
Audited annual report
Underlyingnature
Currencycontract Details Market
MaturityDate
Number ofcontracts
bought
Number ofcontracts
soldCommitment
USD
Unrealisedappreciation/
(depreciation)USD
Futures contracts (cont.)Index USD S&P MidCap 400
E-Mini Index Chicago Mercantile Exchange 21/06/2013 37 4 258 700 78 966Index CAD S&P TSE 60 Index Montreal Exchange 20/06/2013 32 4 591 722 (32 954)Index USD SGX CNX Nifty
IndexSingapore Exchange (was SIMEX) 25/04/2013 818 9 361 192 19 483
Index SGD SGX MSCI Singapore Index
Singapore Exchange (was SIMEX) 29/04/2013 96 5 769 595 52 120
Index JPY TOPIX Index Tokyo Stock Exchange 14/06/2013 103 11 398 798 277 792Interest rate AUD 90 Day Australian
Bank Bill Australian Stock Exchange 12/09/2013 110 113 852 295 36 471Interest rate AUD 90 Day Australian
Bank Bill Australian Stock Exchange 12/12/2013 18 18 629 919 1 406Interest rate AUD 90 Day Australian
Bank Bill Australian Stock Exchange 13/03/2014 8 8 278 951 (810)Interest rate USD 90 Day Eurodollar Chicago Mercantile Exchange 16/09/2013 632 157 415 400 (70 100)Interest rate USD 90 Day Eurodollar Chicago Mercantile Exchange 16/12/2013 409 101 841 000 (48 394)Interest rate USD 90 Day Eurodollar Chicago Mercantile Exchange 17/03/2014 229 57 009 550 (22 675)Interest rate USD 90 Day Eurodollar Chicago Mercantile Exchange 15/09/2014 16 3 980 400 (453)Interest rate USD 90 Day Eurodollar Chicago Mercantile Exchange 15/12/2014 32 7 956 400 (200)Interest rate USD 90 Day Eurodollar Chicago Mercantile Exchange 16/03/2015 43 10 684 425 775Interest rate CAD 3 Month Canada
Bankers’ Acceptance Montreal Exchange 16/09/2013 14 3 401 644 (1 853)Interest rate CAD 3 Month Canada
Bankers’ Acceptance Montreal Exchange 16/12/2013 116 28 185 048 (18 308)Interest rate EUR 3 Month Euribor Euronext Liffe 16/09/2013 1 320 078 (225)Interest rate EUR 3 Month Euribor Euronext Liffe 16/12/2013 45 14 398 445 671Interest rate EUR 3 Month Euribor Euronext Liffe 17/03/2014 30 9 596 555 (3 499)Interest rate EUR 3 Month Euribor Euronext Liffe 16/06/2014 59 18 867 543 1 252Interest rate EUR 3 Month Euribor Euronext Liffe 15/09/2014 67 21 417 251 5 484Interest rate EUR 3 Month Euribor Euronext Liffe 15/12/2014 67 21 404 345 7 322Interest rate EUR 3 Month Euribor Euronext Liffe 16/03/2015 66 21 072 165 156Interest rate CHF 3 Month Euroswiss Euronext Liffe 16/09/2013 43 11 360 183 (10 212)Interest rate CHF 3 Month Euroswiss Euronext Liffe 16/12/2013 34 8 983 368 (11 115)Interest rate GBP 3 Month Sterling Euronext Liffe 18/09/2013 1,050 198 280 241 101 708Interest rate GBP 3 Month Sterling Euronext Liffe 18/12/2013 584 110 292 666 84 540Interest rate GBP 3 Month Sterling Euronext Liffe 19/03/2014 276 52 127 235 25 574Interest rate GBP 3 Month Sterling Euronext Liffe 18/06/2014 141 26 628 880 11 332Interest rate GBP 3 Month Sterling Euronext Liffe 17/09/2014 162 30 588 734 21 334Interest rate GBP 3 Month Sterling Euronext Liffe 17/12/2014 173 32 655 896 33 501Interest rate GBP 3 Month Sterling Euronext Liffe 18/03/2015 179 33 774 880 15 602Interest rate AUD 3 Year Australian
Bond Australian Stock Exchange 17/06/2013 54 6 134 529 (25 515)Interest rate USD 5 Year US Treasury
Note Chicago Board of Trade 28/06/2013 75 9 304 102 12 328
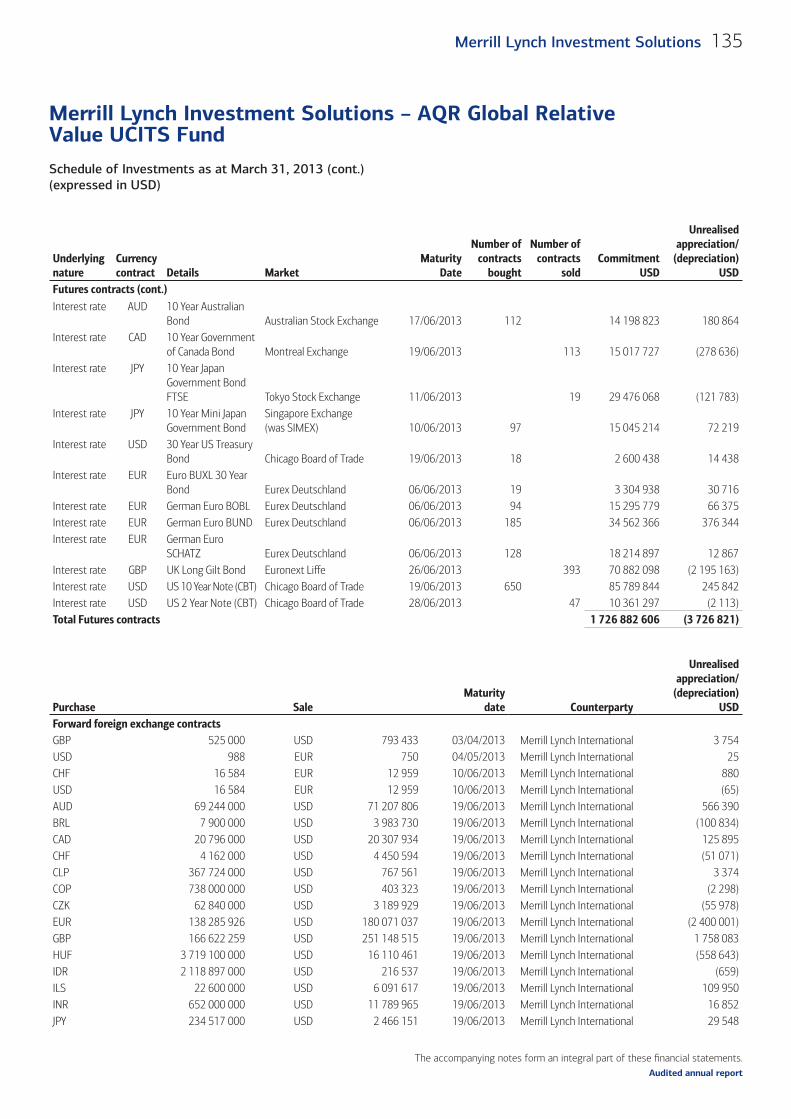
The accompanying notes form an integral part of these fi nancial statements.
Schedule of Investments as at March 31, 2013 (cont.)(expressed in USD)
Merrill Lynch Investment Solutions – AQR Global Relative Value UCITS Fund
135Merrill Lynch Investment Solutions
Audited annual report
Underlyingnature
Currencycontract Details Market
MaturityDate
Number ofcontracts
bought
Number ofcontracts
soldCommitment
USD
Unrealisedappreciation/
(depreciation)USD
Futures contracts (cont.)Interest rate AUD 10 Year Australian
Bond Australian Stock Exchange 17/06/2013 112 14 198 823 180 864Interest rate CAD 10 Year Government
of Canada Bond Montreal Exchange 19/06/2013 113 15 017 727 (278 636)Interest rate JPY 10 Year Japan
Government Bond FTSE Tokyo Stock Exchange 11/06/2013 19 29 476 068 (121 783)
Interest rate JPY 10 Year Mini Japan Government Bond
Singapore Exchange (was SIMEX) 10/06/2013 97 15 045 214 72 219
Interest rate USD 30 Year US Treasury Bond Chicago Board of Trade 19/06/2013 18 2 600 438 14 438
Interest rate EUR Euro BUXL 30 Year Bond Eurex Deutschland 06/06/2013 19 3 304 938 30 716
Interest rate EUR German Euro BOBL Eurex Deutschland 06/06/2013 94 15 295 779 66 375Interest rate EUR German Euro BUND Eurex Deutschland 06/06/2013 185 34 562 366 376 344Interest rate EUR German Euro
SCHATZ Eurex Deutschland 06/06/2013 128 18 214 897 12 867Interest rate GBP UK Long Gilt Bond Euronext Liffe 26/06/2013 393 70 882 098 (2 195 163)Interest rate USD US 10 Year Note (CBT) Chicago Board of Trade 19/06/2013 650 85 789 844 245 842Interest rate USD US 2 Year Note (CBT) Chicago Board of Trade 28/06/2013 47 10 361 297 (2 113)Total Futures contracts 1 726 882 606 (3 726 821)
Purchase SaleMaturity
date Counterparty
Unrealisedappreciation/
(depreciation)USD
Forward foreign exchange contracts (cont.)GBP 525 000 USD 793 433 03/04/2013 Merrill Lynch International 3 754 USD 988 EUR 750 04/05/2013 Merrill Lynch International 25 CHF 16 584 EUR 12 959 10/06/2013 Merrill Lynch International 880 USD 16 584 EUR 12 959 10/06/2013 Merrill Lynch International (65)AUD 69 244 000 USD 71 207 806 19/06/2013 Merrill Lynch International 566 390 BRL 7 900 000 USD 3 983 730 19/06/2013 Merrill Lynch International (100 834)CAD 20 796 000 USD 20 307 934 19/06/2013 Merrill Lynch International 125 895 CHF 4 162 000 USD 4 450 594 19/06/2013 Merrill Lynch International (51 071)CLP 367 724 000 USD 767 561 19/06/2013 Merrill Lynch International 3 374 COP 738 000 000 USD 403 323 19/06/2013 Merrill Lynch International (2 298)CZK 62 840 000 USD 3 189 929 19/06/2013 Merrill Lynch International (55 978)EUR 138 285 926 USD 180 071 037 19/06/2013 Merrill Lynch International (2 400 001)GBP 166 622 259 USD 251 148 515 19/06/2013 Merrill Lynch International 1 758 083 HUF 3 719 100 000 USD 16 110 461 19/06/2013 Merrill Lynch International (558 643)IDR 2 118 897 000 USD 216 537 19/06/2013 Merrill Lynch International (659)ILS 22 600 000 USD 6 091 617 19/06/2013 Merrill Lynch International 109 950 INR 652 000 000 USD 11 789 965 19/06/2013 Merrill Lynch International 16 852 JPY 234 517 000 USD 2 466 151 19/06/2013 Merrill Lynch International 29 548
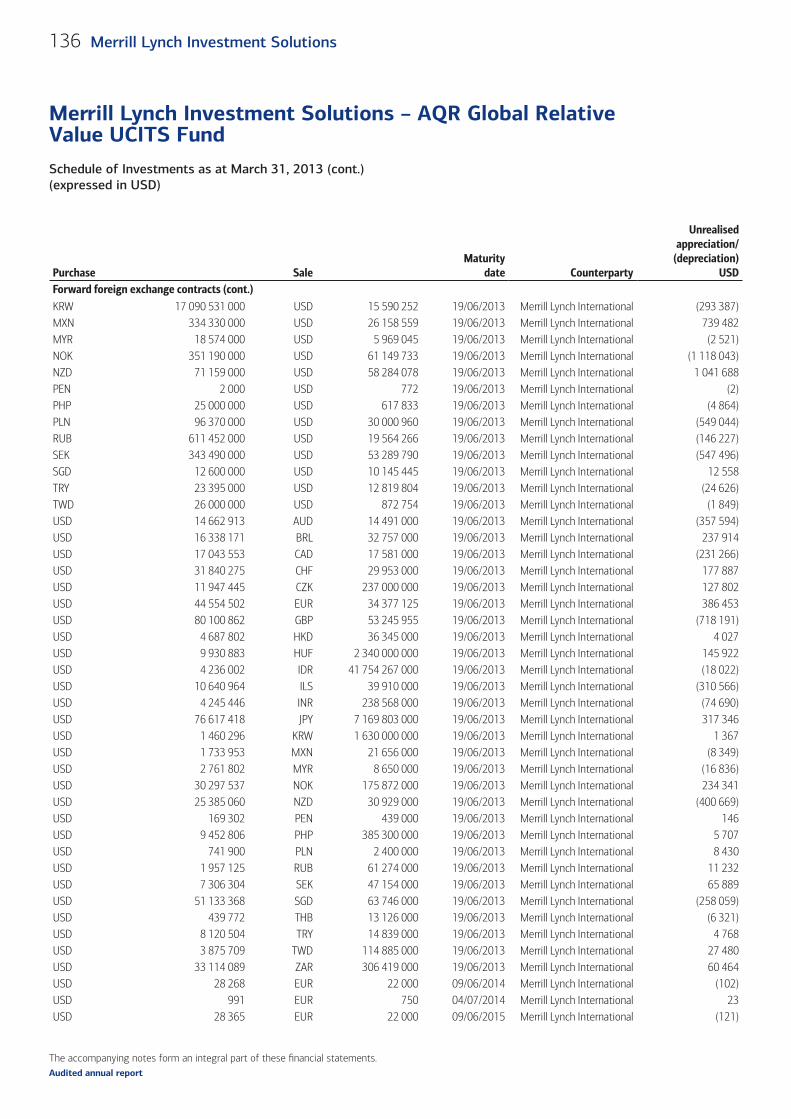
The accompanying notes form an integral part of these fi nancial statements.
Schedule of Investments as at March 31, 2013 (cont.)(expressed in USD)
Merrill Lynch Investment Solutions – AQR Global Relative Value UCITS Fund
136 Merrill Lynch Investment Solutions
Audited annual report
Purchase SaleMaturity
date Counterparty
Unrealisedappreciation/
(depreciation)USD
Forward foreign exchange contracts (cont.)KRW 17 090 531 000 USD 15 590 252 19/06/2013 Merrill Lynch International (293 387)MXN 334 330 000 USD 26 158 559 19/06/2013 Merrill Lynch International 739 482 MYR 18 574 000 USD 5 969 045 19/06/2013 Merrill Lynch International (2 521)NOK 351 190 000 USD 61 149 733 19/06/2013 Merrill Lynch International (1 118 043)NZD 71 159 000 USD 58 284 078 19/06/2013 Merrill Lynch International 1 041 688 PEN 2 000 USD 772 19/06/2013 Merrill Lynch International (2)PHP 25 000 000 USD 617 833 19/06/2013 Merrill Lynch International (4 864)PLN 96 370 000 USD 30 000 960 19/06/2013 Merrill Lynch International (549 044)RUB 611 452 000 USD 19 564 266 19/06/2013 Merrill Lynch International (146 227)SEK 343 490 000 USD 53 289 790 19/06/2013 Merrill Lynch International (547 496)SGD 12 600 000 USD 10 145 445 19/06/2013 Merrill Lynch International 12 558 TRY 23 395 000 USD 12 819 804 19/06/2013 Merrill Lynch International (24 626)TWD 26 000 000 USD 872 754 19/06/2013 Merrill Lynch International (1 849)USD 14 662 913 AUD 14 491 000 19/06/2013 Merrill Lynch International (357 594)USD 16 338 171 BRL 32 757 000 19/06/2013 Merrill Lynch International 237 914 USD 17 043 553 CAD 17 581 000 19/06/2013 Merrill Lynch International (231 266)USD 31 840 275 CHF 29 953 000 19/06/2013 Merrill Lynch International 177 887 USD 11 947 445 CZK 237 000 000 19/06/2013 Merrill Lynch International 127 802 USD 44 554 502 EUR 34 377 125 19/06/2013 Merrill Lynch International 386 453 USD 80 100 862 GBP 53 245 955 19/06/2013 Merrill Lynch International (718 191)USD 4 687 802 HKD 36 345 000 19/06/2013 Merrill Lynch International 4 027 USD 9 930 883 HUF 2 340 000 000 19/06/2013 Merrill Lynch International 145 922 USD 4 236 002 IDR 41 754 267 000 19/06/2013 Merrill Lynch International (18 022)USD 10 640 964 ILS 39 910 000 19/06/2013 Merrill Lynch International (310 566)USD 4 245 446 INR 238 568 000 19/06/2013 Merrill Lynch International (74 690)USD 76 617 418 JPY 7 169 803 000 19/06/2013 Merrill Lynch International 317 346 USD 1 460 296 KRW 1 630 000 000 19/06/2013 Merrill Lynch International 1 367 USD 1 733 953 MXN 21 656 000 19/06/2013 Merrill Lynch International (8 349)USD 2 761 802 MYR 8 650 000 19/06/2013 Merrill Lynch International (16 836)USD 30 297 537 NOK 175 872 000 19/06/2013 Merrill Lynch International 234 341 USD 25 385 060 NZD 30 929 000 19/06/2013 Merrill Lynch International (400 669)USD 169 302 PEN 439 000 19/06/2013 Merrill Lynch International 146 USD 9 452 806 PHP 385 300 000 19/06/2013 Merrill Lynch International 5 707 USD 741 900 PLN 2 400 000 19/06/2013 Merrill Lynch International 8 430 USD 1 957 125 RUB 61 274 000 19/06/2013 Merrill Lynch International 11 232 USD 7 306 304 SEK 47 154 000 19/06/2013 Merrill Lynch International 65 889 USD 51 133 368 SGD 63 746 000 19/06/2013 Merrill Lynch International (258 059)USD 439 772 THB 13 126 000 19/06/2013 Merrill Lynch International (6 321)USD 8 120 504 TRY 14 839 000 19/06/2013 Merrill Lynch International 4 768 USD 3 875 709 TWD 114 885 000 19/06/2013 Merrill Lynch International 27 480 USD 33 114 089 ZAR 306 419 000 19/06/2013 Merrill Lynch International 60 464 USD 28 268 EUR 22 000 09/06/2014 Merrill Lynch International (102)USD 991 EUR 750 04/07/2014 Merrill Lynch International 23 USD 28 365 EUR 22 000 09/06/2015 Merrill Lynch International (121)
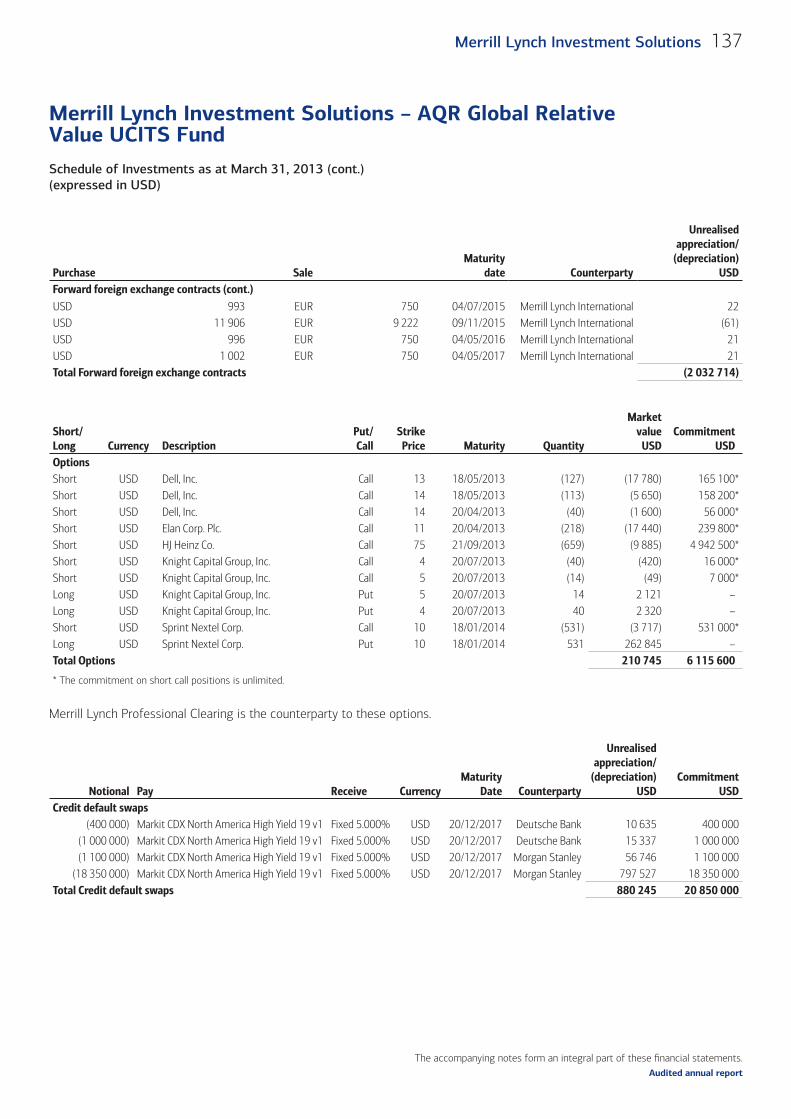
The accompanying notes form an integral part of these fi nancial statements.
Schedule of Investments as at March 31, 2013 (cont.)(expressed in USD)
Merrill Lynch Investment Solutions – AQR Global Relative Value UCITS Fund
137Merrill Lynch Investment Solutions
Audited annual report
Purchase SaleMaturity
date Counterparty
Unrealisedappreciation/
(depreciation)USD
Forward foreign exchange contracts (cont.)USD 993 EUR 750 04/07/2015 Merrill Lynch International 22 USD 11 906 EUR 9 222 09/11/2015 Merrill Lynch International (61)USD 996 EUR 750 04/05/2016 Merrill Lynch International 21 USD 1 002 EUR 750 04/05/2017 Merrill Lynch International 21 Total Forward foreign exchange contracts (2 032 714)
Short/Long Currency Description
Put/Call
StrikePrice Maturity Quantity
Marketvalue
USDCommitment
USDOptionsShort USD Dell, Inc. Call 13 18/05/2013 (127) (17 780) 165 100*Short USD Dell, Inc. Call 14 18/05/2013 (113) (5 650) 158 200*Short USD Dell, Inc. Call 14 20/04/2013 (40) (1 600) 56 000*Short USD Elan Corp. Plc. Call 11 20/04/2013 (218) (17 440) 239 800*Short USD HJ Heinz Co. Call 75 21/09/2013 (659) (9 885) 4 942 500*Short USD Knight Capital Group, Inc. Call 4 20/07/2013 (40) (420) 16 000*Short USD Knight Capital Group, Inc. Call 5 20/07/2013 (14) (49) 7 000*Long USD Knight Capital Group, Inc. Put 5 20/07/2013 14 2 121 –Long USD Knight Capital Group, Inc. Put 4 20/07/2013 40 2 320 –Short USD Sprint Nextel Corp. Call 10 18/01/2014 (531) (3 717) 531 000*Long USD Sprint Nextel Corp. Put 10 18/01/2014 531 262 845 –Total Options 210 745 6 115 600
* The commitment on short call positions is unlimited.
Merrill Lynch Professional Clearing is the counterparty to these options.
Notional Pay Receive CurrencyMaturity
Date Counterparty
Unrealisedappreciation/
(depreciation)USD
CommitmentUSD
Credit default swaps(400 000) Markit CDX North America High Yield 19 v1 Fixed 5.000% USD 20/12/2017 Deutsche Bank 10 635 400 000
(1 000 000) Markit CDX North America High Yield 19 v1 Fixed 5.000% USD 20/12/2017 Deutsche Bank 15 337 1 000 000(1 100 000) Markit CDX North America High Yield 19 v1 Fixed 5.000% USD 20/12/2017 Morgan Stanley 56 746 1 100 000
(18 350 000) Markit CDX North America High Yield 19 v1 Fixed 5.000% USD 20/12/2017 Morgan Stanley 797 527 18 350 000Total Credit default swaps 880 245 20 850 000
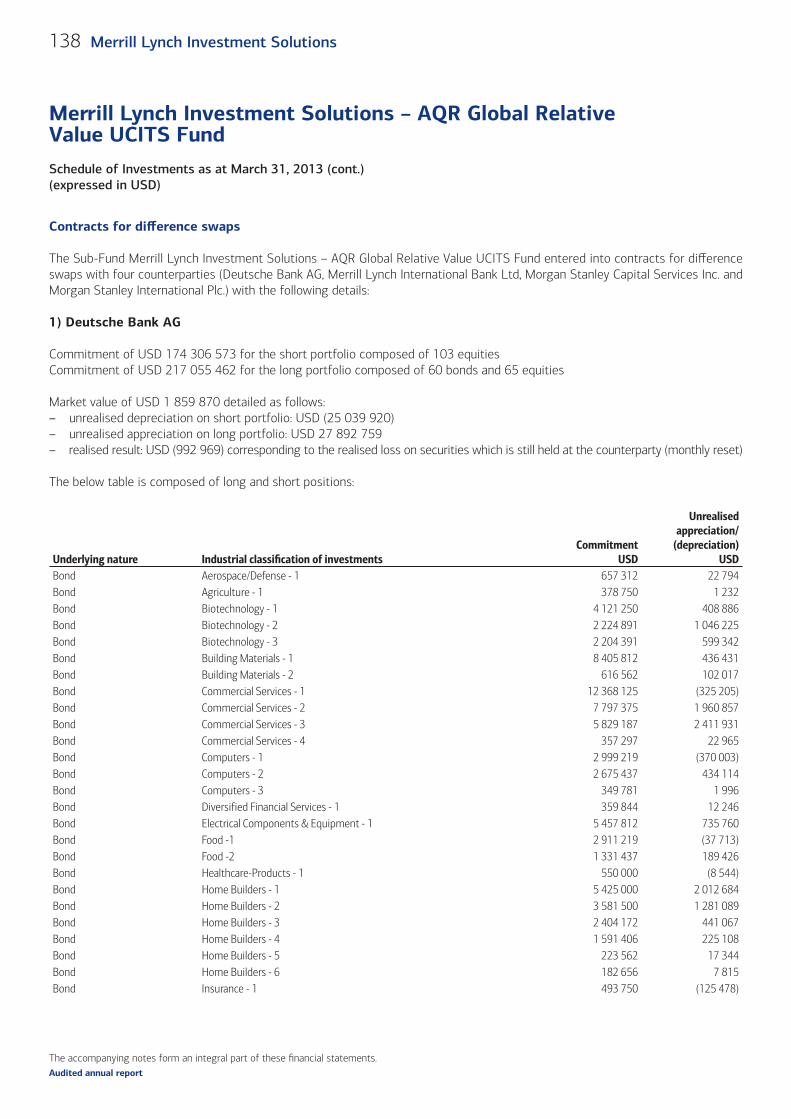
The accompanying notes form an integral part of these fi nancial statements.
Schedule of Investments as at March 31, 2013 (cont.)(expressed in USD)
Merrill Lynch Investment Solutions – AQR Global Relative Value UCITS Fund
138 Merrill Lynch Investment Solutions
Audited annual report
Contracts for diff erence swaps
The Sub-Fund Merrill Lynch Investment Solutions – AQR Global Relative Value UCITS Fund entered into contracts for diff erence swaps with four counterparties (Deutsche Bank AG, Merrill Lynch International Bank Ltd, Morgan Stanley Capital Services Inc. and Morgan Stanley International Plc.) with the following details:
1) Deutsche Bank AG
Commitment of USD 174 306 573 for the short portfolio composed of 103 equitiesCommitment of USD 217 055 462 for the long portfolio composed of 60 bonds and 65 equities
Market value of USD 1 859 870 detailed as follows:– unrealised depreciation on short portfolio: USD (25 039 920)– unrealised appreciation on long portfolio: USD 27 892 759– realised result: USD (992 969) corresponding to the realised loss on securities which is still held at the counterparty (monthly reset)
The below table is composed of long and short positions:
Underlying nature Industrial classifi cation of investments Commitment
USD
Unrealised appreciation/
(depreciation)USD
Bond Aerospace/Defense - 1 657 312 22 794Bond Agriculture - 1 378 750 1 232Bond Biotechnology - 1 4 121 250 408 886Bond Biotechnology - 2 2 224 891 1 046 225Bond Biotechnology - 3 2 204 391 599 342Bond Building Materials - 1 8 405 812 436 431Bond Building Materials - 2 616 562 102 017Bond Commercial Services - 1 12 368 125 (325 205)Bond Commercial Services - 2 7 797 375 1 960 857Bond Commercial Services - 3 5 829 187 2 411 931Bond Commercial Services - 4 357 297 22 965Bond Computers - 1 2 999 219 (370 003)Bond Computers - 2 2 675 437 434 114Bond Computers - 3 349 781 1 996Bond Diversified Financial Services - 1 359 844 12 246Bond Electrical Components & Equipment - 1 5 457 812 735 760Bond Food -1 2 911 219 (37 713)Bond Food -2 1 331 437 189 426Bond Healthcare-Products - 1 550 000 (8 544)Bond Home Builders - 1 5 425 000 2 012 684Bond Home Builders - 2 3 581 500 1 281 089Bond Home Builders - 3 2 404 172 441 067Bond Home Builders - 4 1 591 406 225 108Bond Home Builders - 5 223 562 17 344Bond Home Builders - 6 182 656 7 815Bond Insurance - 1 493 750 (125 478)
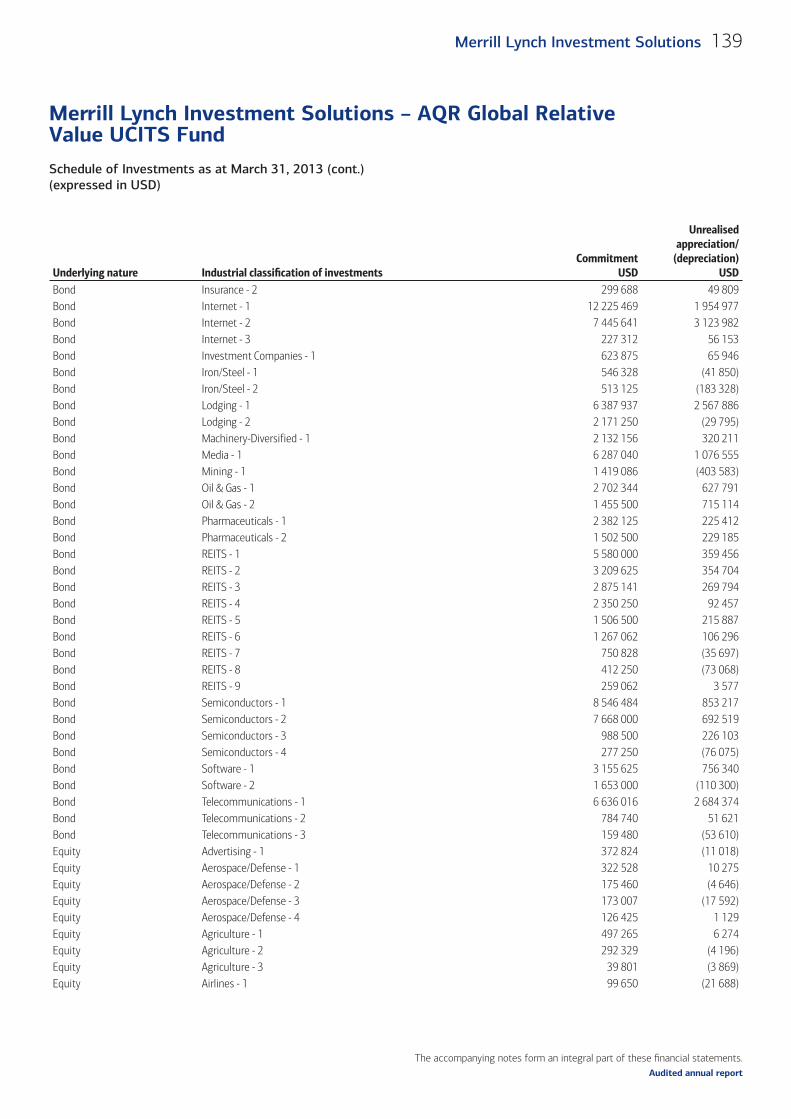
The accompanying notes form an integral part of these fi nancial statements.
Schedule of Investments as at March 31, 2013 (cont.)(expressed in USD)
Merrill Lynch Investment Solutions – AQR Global Relative Value UCITS Fund
139Merrill Lynch Investment Solutions
Audited annual report
Underlying nature Industrial classifi cation of investments Commitment
USD
Unrealised appreciation/
(depreciation)USD
Bond Insurance - 2 299 688 49 809Bond Internet - 1 12 225 469 1 954 977Bond Internet - 2 7 445 641 3 123 982Bond Internet - 3 227 312 56 153Bond Investment Companies - 1 623 875 65 946Bond Iron/Steel - 1 546 328 (41 850)Bond Iron/Steel - 2 513 125 (183 328)Bond Lodging - 1 6 387 937 2 567 886Bond Lodging - 2 2 171 250 (29 795)Bond Machinery-Diversified - 1 2 132 156 320 211Bond Media - 1 6 287 040 1 076 555Bond Mining - 1 1 419 086 (403 583)Bond Oil & Gas - 1 2 702 344 627 791Bond Oil & Gas - 2 1 455 500 715 114Bond Pharmaceuticals - 1 2 382 125 225 412Bond Pharmaceuticals - 2 1 502 500 229 185Bond REITS - 1 5 580 000 359 456Bond REITS - 2 3 209 625 354 704Bond REITS - 3 2 875 141 269 794Bond REITS - 4 2 350 250 92 457Bond REITS - 5 1 506 500 215 887Bond REITS - 6 1 267 062 106 296Bond REITS - 7 750 828 (35 697)Bond REITS - 8 412 250 (73 068)Bond REITS - 9 259 062 3 577Bond Semiconductors - 1 8 546 484 853 217Bond Semiconductors - 2 7 668 000 692 519Bond Semiconductors - 3 988 500 226 103Bond Semiconductors - 4 277 250 (76 075)Bond Software - 1 3 155 625 756 340Bond Software - 2 1 653 000 (110 300)Bond Telecommunications - 1 6 636 016 2 684 374Bond Telecommunications - 2 784 740 51 621Bond Telecommunications - 3 159 480 (53 610)Equity Advertising - 1 372 824 (11 018)Equity Aerospace/Defense - 1 322 528 10 275Equity Aerospace/Defense - 2 175 460 (4 646)Equity Aerospace/Defense - 3 173 007 (17 592)Equity Aerospace/Defense - 4 126 425 1 129Equity Agriculture - 1 497 265 6 274Equity Agriculture - 2 292 329 (4 196)Equity Agriculture - 3 39 801 (3 869)Equity Airlines - 1 99 650 (21 688)
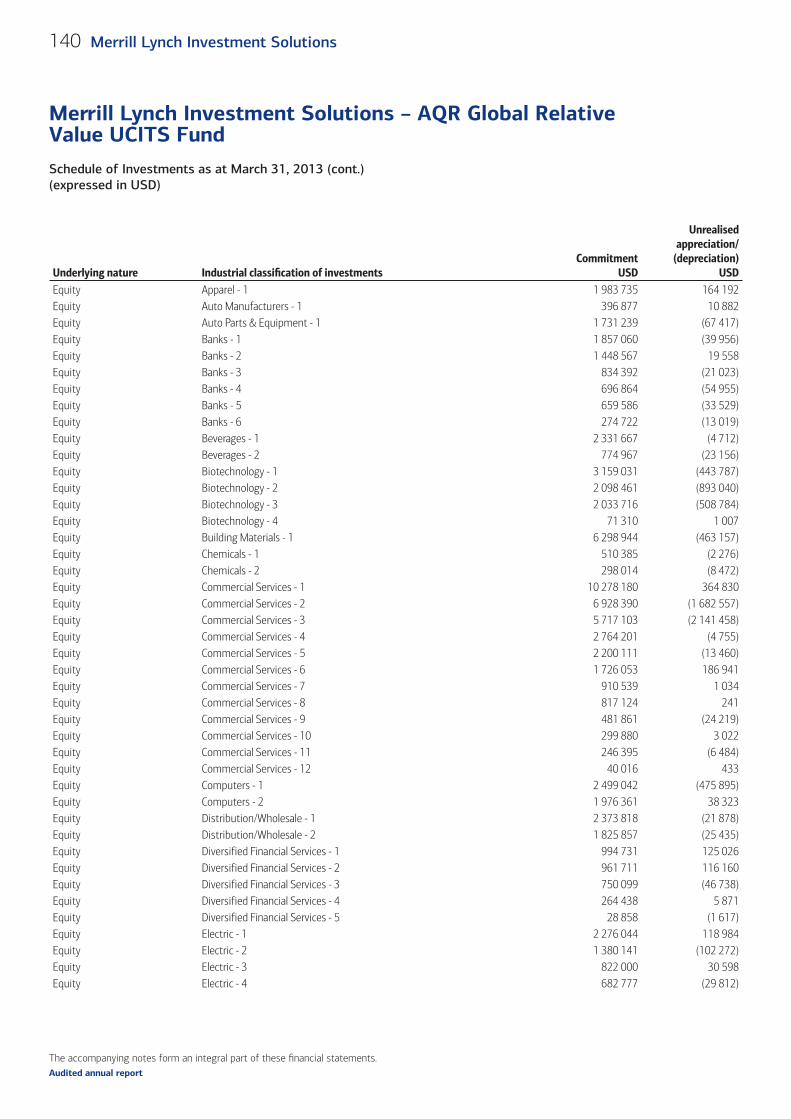
The accompanying notes form an integral part of these fi nancial statements.
Schedule of Investments as at March 31, 2013 (cont.)(expressed in USD)
Merrill Lynch Investment Solutions – AQR Global Relative Value UCITS Fund
140 Merrill Lynch Investment Solutions
Audited annual report
Underlying nature Industrial classifi cation of investments Commitment
USD
Unrealised appreciation/
(depreciation)USD
Equity Apparel - 1 1 983 735 164 192Equity Auto Manufacturers - 1 396 877 10 882Equity Auto Parts & Equipment - 1 1 731 239 (67 417)Equity Banks - 1 1 857 060 (39 956)Equity Banks - 2 1 448 567 19 558Equity Banks - 3 834 392 (21 023)Equity Banks - 4 696 864 (54 955)Equity Banks - 5 659 586 (33 529)Equity Banks - 6 274 722 (13 019)Equity Beverages - 1 2 331 667 (4 712)Equity Beverages - 2 774 967 (23 156)Equity Biotechnology - 1 3 159 031 (443 787)Equity Biotechnology - 2 2 098 461 (893 040)Equity Biotechnology - 3 2 033 716 (508 784)Equity Biotechnology - 4 71 310 1 007Equity Building Materials - 1 6 298 944 (463 157)Equity Chemicals - 1 510 385 (2 276)Equity Chemicals - 2 298 014 (8 472)Equity Commercial Services - 1 10 278 180 364 830Equity Commercial Services - 2 6 928 390 (1 682 557)Equity Commercial Services - 3 5 717 103 (2 141 458)Equity Commercial Services - 4 2 764 201 (4 755)Equity Commercial Services - 5 2 200 111 (13 460)Equity Commercial Services - 6 1 726 053 186 941Equity Commercial Services - 7 910 539 1 034Equity Commercial Services - 8 817 124 241Equity Commercial Services - 9 481 861 (24 219)Equity Commercial Services - 10 299 880 3 022Equity Commercial Services - 11 246 395 (6 484)Equity Commercial Services - 12 40 016 433Equity Computers - 1 2 499 042 (475 895)Equity Computers - 2 1 976 361 38 323Equity Distribution/Wholesale - 1 2 373 818 (21 878)Equity Distribution/Wholesale - 2 1 825 857 (25 435)Equity Diversified Financial Services - 1 994 731 125 026Equity Diversified Financial Services - 2 961 711 116 160Equity Diversified Financial Services - 3 750 099 (46 738)Equity Diversified Financial Services - 4 264 438 5 871Equity Diversified Financial Services - 5 28 858 (1 617)Equity Electric - 1 2 276 044 118 984Equity Electric - 2 1 380 141 (102 272)Equity Electric - 3 822 000 30 598Equity Electric - 4 682 777 (29 812)
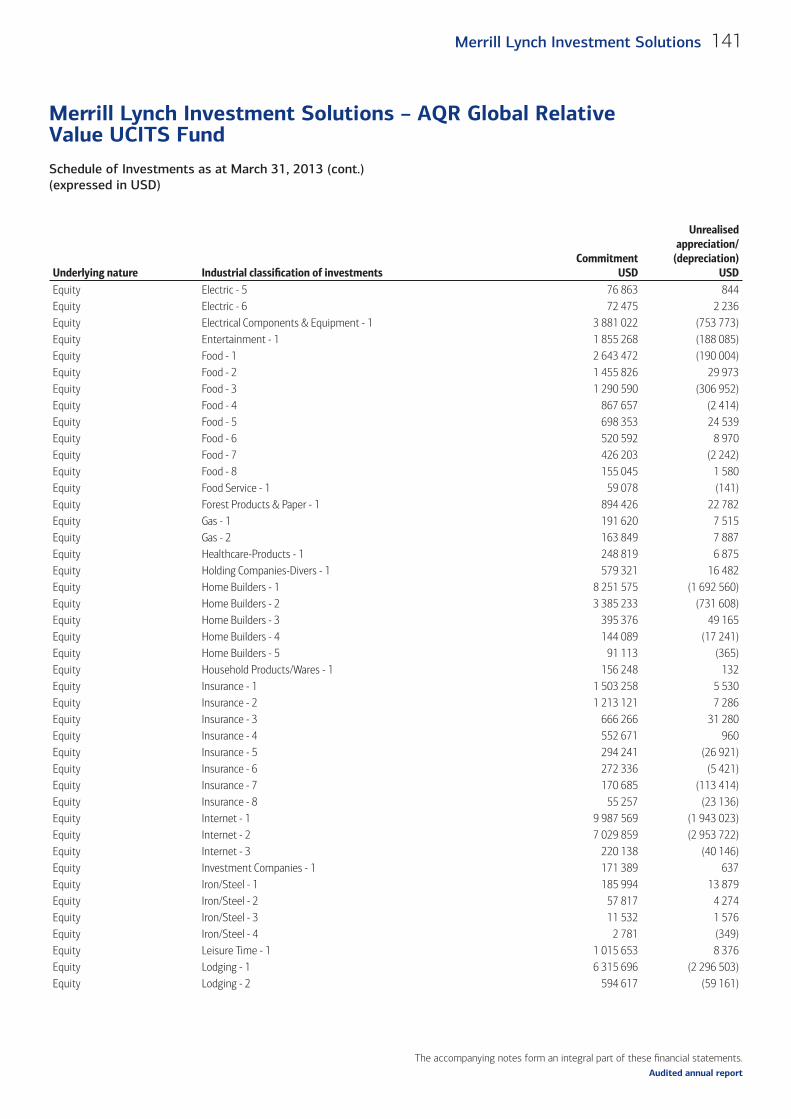
The accompanying notes form an integral part of these fi nancial statements.
Schedule of Investments as at March 31, 2013 (cont.)(expressed in USD)
Merrill Lynch Investment Solutions – AQR Global Relative Value UCITS Fund
141Merrill Lynch Investment Solutions
Audited annual report
Underlying nature Industrial classifi cation of investments Commitment
USD
Unrealised appreciation/
(depreciation)USD
Equity Electric - 5 76 863 844Equity Electric - 6 72 475 2 236Equity Electrical Components & Equipment - 1 3 881 022 (753 773)Equity Entertainment - 1 1 855 268 (188 085)Equity Food - 1 2 643 472 (190 004)Equity Food - 2 1 455 826 29 973Equity Food - 3 1 290 590 (306 952)Equity Food - 4 867 657 (2 414)Equity Food - 5 698 353 24 539Equity Food - 6 520 592 8 970Equity Food - 7 426 203 (2 242)Equity Food - 8 155 045 1 580Equity Food Service - 1 59 078 (141)Equity Forest Products & Paper - 1 894 426 22 782Equity Gas - 1 191 620 7 515Equity Gas - 2 163 849 7 887Equity Healthcare-Products - 1 248 819 6 875Equity Holding Companies-Divers - 1 579 321 16 482Equity Home Builders - 1 8 251 575 (1 692 560)Equity Home Builders - 2 3 385 233 (731 608)Equity Home Builders - 3 395 376 49 165Equity Home Builders - 4 144 089 (17 241)Equity Home Builders - 5 91 113 (365)Equity Household Products/Wares - 1 156 248 132Equity Insurance - 1 1 503 258 5 530Equity Insurance - 2 1 213 121 7 286Equity Insurance - 3 666 266 31 280Equity Insurance - 4 552 671 960Equity Insurance - 5 294 241 (26 921)Equity Insurance - 6 272 336 (5 421)Equity Insurance - 7 170 685 (113 414)Equity Insurance - 8 55 257 (23 136)Equity Internet - 1 9 987 569 (1 943 023)Equity Internet - 2 7 029 859 (2 953 722)Equity Internet - 3 220 138 (40 146)Equity Investment Companies - 1 171 389 637Equity Iron/Steel - 1 185 994 13 879Equity Iron/Steel - 2 57 817 4 274Equity Iron/Steel - 3 11 532 1 576Equity Iron/Steel - 4 2 781 (349)Equity Leisure Time - 1 1 015 653 8 376Equity Lodging - 1 6 315 696 (2 296 503)Equity Lodging - 2 594 617 (59 161)
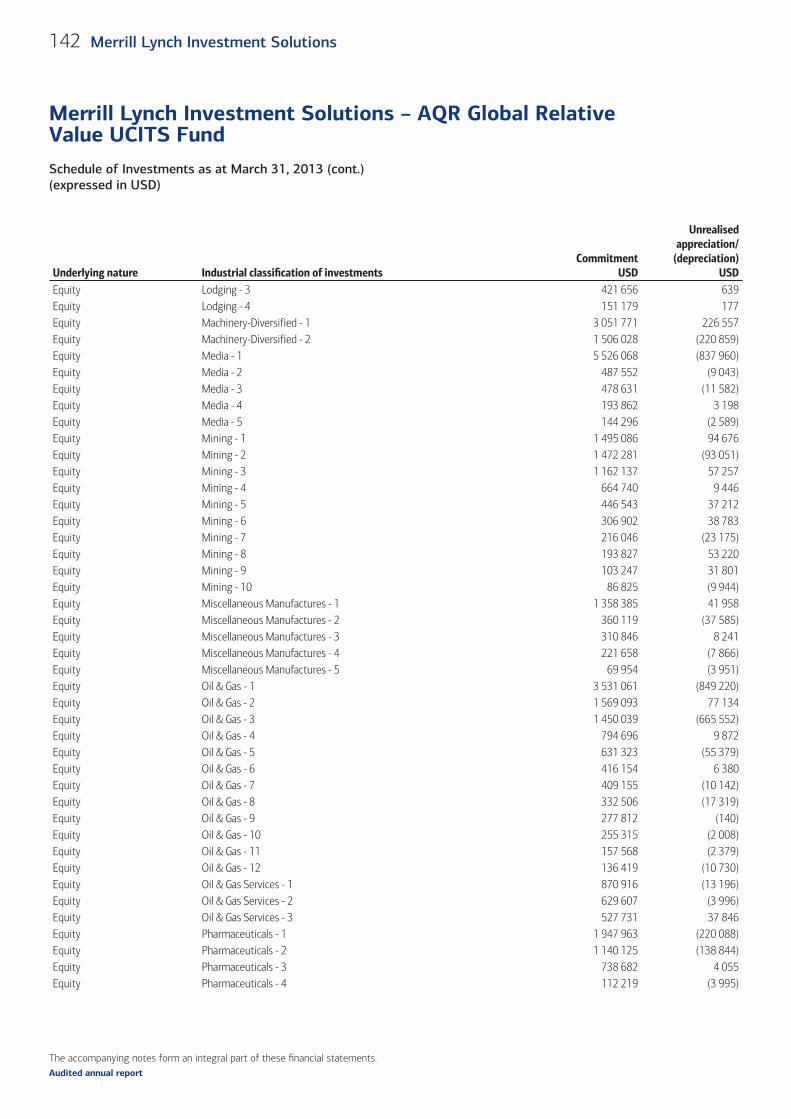
The accompanying notes form an integral part of these fi nancial statements.
Schedule of Investments as at March 31, 2013 (cont.)(expressed in USD)
Merrill Lynch Investment Solutions – AQR Global Relative Value UCITS Fund
142 Merrill Lynch Investment Solutions
Audited annual report
Underlying nature Industrial classifi cation of investments Commitment
USD
Unrealised appreciation/
(depreciation)USD
Equity Lodging - 3 421 656 639Equity Lodging - 4 151 179 177Equity Machinery-Diversified - 1 3 051 771 226 557Equity Machinery-Diversified - 2 1 506 028 (220 859)Equity Media - 1 5 526 068 (837 960)Equity Media - 2 487 552 (9 043)Equity Media - 3 478 631 (11 582)Equity Media - 4 193 862 3 198Equity Media - 5 144 296 (2 589)Equity Mining - 1 1 495 086 94 676Equity Mining - 2 1 472 281 (93 051)Equity Mining - 3 1 162 137 57 257Equity Mining - 4 664 740 9 446Equity Mining - 5 446 543 37 212Equity Mining - 6 306 902 38 783Equity Mining - 7 216 046 (23 175)Equity Mining - 8 193 827 53 220Equity Mining - 9 103 247 31 801Equity Mining - 10 86 825 (9 944)Equity Miscellaneous Manufactures - 1 1 358 385 41 958Equity Miscellaneous Manufactures - 2 360 119 (37 585)Equity Miscellaneous Manufactures - 3 310 846 8 241Equity Miscellaneous Manufactures - 4 221 658 (7 866)Equity Miscellaneous Manufactures - 5 69 954 (3 951)Equity Oil & Gas - 1 3 531 061 (849 220)Equity Oil & Gas - 2 1 569 093 77 134Equity Oil & Gas - 3 1 450 039 (665 552)Equity Oil & Gas - 4 794 696 9 872Equity Oil & Gas - 5 631 323 (55 379)Equity Oil & Gas - 6 416 154 6 380Equity Oil & Gas - 7 409 155 (10 142)Equity Oil & Gas - 8 332 506 (17 319)Equity Oil & Gas - 9 277 812 (140)Equity Oil & Gas - 10 255 315 (2 008)Equity Oil & Gas - 11 157 568 (2 379)Equity Oil & Gas - 12 136 419 (10 730)Equity Oil & Gas Services - 1 870 916 (13 196)Equity Oil & Gas Services - 2 629 607 (3 996)Equity Oil & Gas Services - 3 527 731 37 846Equity Pharmaceuticals - 1 1 947 963 (220 088)Equity Pharmaceuticals - 2 1 140 125 (138 844)Equity Pharmaceuticals - 3 738 682 4 055Equity Pharmaceuticals - 4 112 219 (3 995)
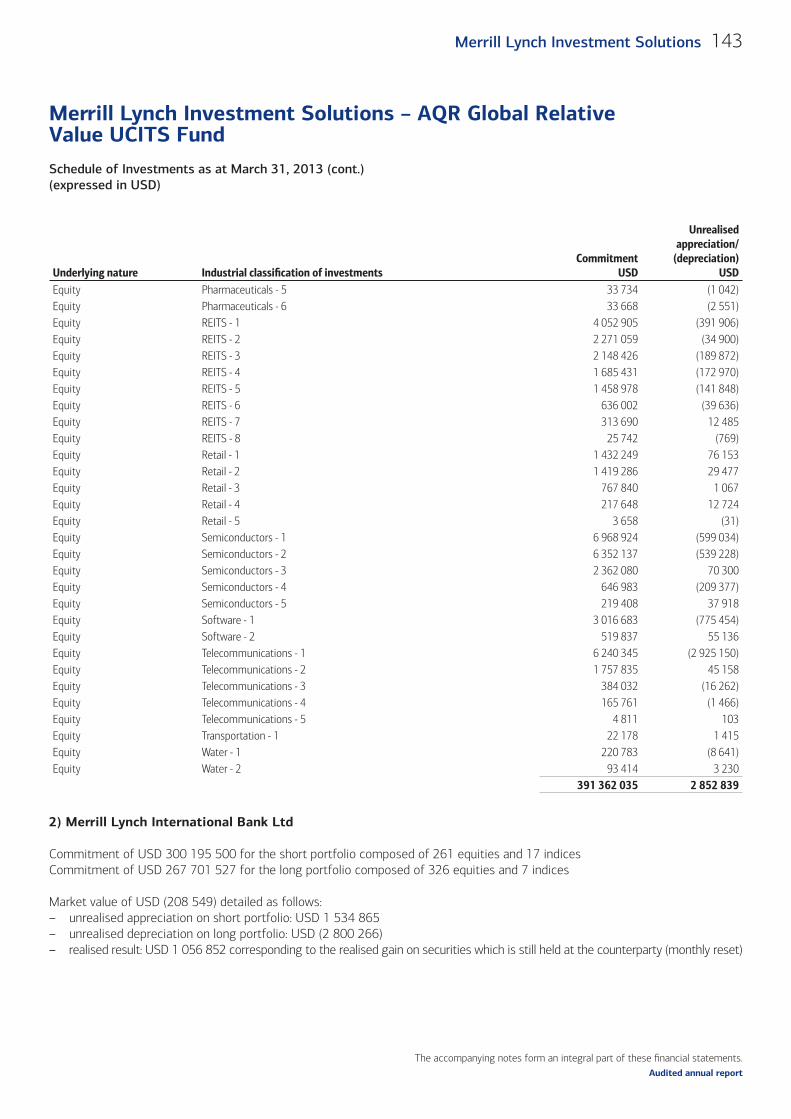
The accompanying notes form an integral part of these fi nancial statements.
Schedule of Investments as at March 31, 2013 (cont.)(expressed in USD)
Merrill Lynch Investment Solutions – AQR Global Relative Value UCITS Fund
143Merrill Lynch Investment Solutions
Audited annual report
Underlying nature Industrial classifi cation of investments Commitment
USD
Unrealised appreciation/
(depreciation)USD
Equity Pharmaceuticals - 5 33 734 (1 042)Equity Pharmaceuticals - 6 33 668 (2 551)Equity REITS - 1 4 052 905 (391 906)Equity REITS - 2 2 271 059 (34 900)Equity REITS - 3 2 148 426 (189 872)Equity REITS - 4 1 685 431 (172 970)Equity REITS - 5 1 458 978 (141 848)Equity REITS - 6 636 002 (39 636)Equity REITS - 7 313 690 12 485Equity REITS - 8 25 742 (769)Equity Retail - 1 1 432 249 76 153Equity Retail - 2 1 419 286 29 477Equity Retail - 3 767 840 1 067Equity Retail - 4 217 648 12 724Equity Retail - 5 3 658 (31)Equity Semiconductors - 1 6 968 924 (599 034)Equity Semiconductors - 2 6 352 137 (539 228)Equity Semiconductors - 3 2 362 080 70 300Equity Semiconductors - 4 646 983 (209 377)Equity Semiconductors - 5 219 408 37 918Equity Software - 1 3 016 683 (775 454)Equity Software - 2 519 837 55 136Equity Telecommunications - 1 6 240 345 (2 925 150)Equity Telecommunications - 2 1 757 835 45 158Equity Telecommunications - 3 384 032 (16 262)Equity Telecommunications - 4 165 761 (1 466)Equity Telecommunications - 5 4 811 103Equity Transportation - 1 22 178 1 415Equity Water - 1 220 783 (8 641)Equity Water - 2 93 414 3 230
391 362 035 2 852 839
2) Merrill Lynch International Bank Ltd
Commitment of USD 300 195 500 for the short portfolio composed of 261 equities and 17 indices Commitment of USD 267 701 527 for the long portfolio composed of 326 equities and 7 indices
Market value of USD (208 549) detailed as follows:– unrealised appreciation on short portfolio: USD 1 534 865– unrealised depreciation on long portfolio: USD (2 800 266)– realised result: USD 1 056 852 corresponding to the realised gain on securities which is still held at the counterparty (monthly reset)
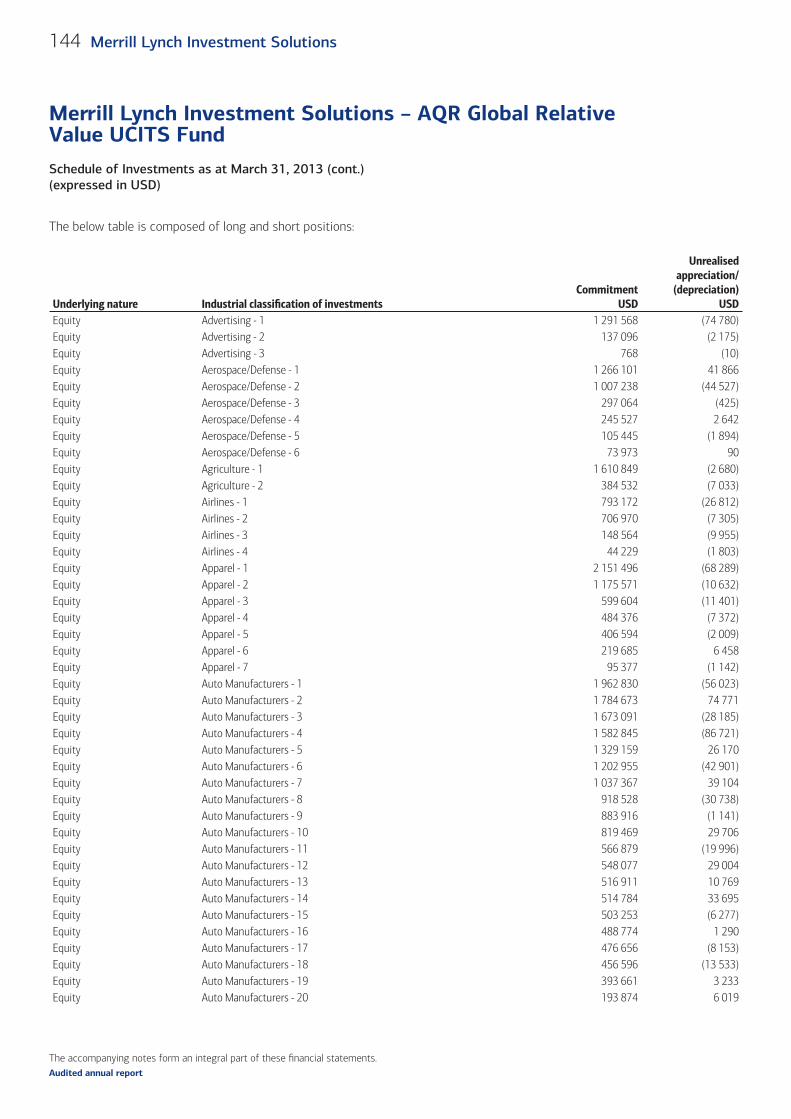
The accompanying notes form an integral part of these fi nancial statements.
Schedule of Investments as at March 31, 2013 (cont.)(expressed in USD)
Merrill Lynch Investment Solutions – AQR Global Relative Value UCITS Fund
144 Merrill Lynch Investment Solutions
Audited annual report
The below table is composed of long and short positions:
Underlying nature Industrial classifi cation of investments Commitment
USD
Unrealised appreciation/
(depreciation)USD
Equity Advertising - 1 1 291 568 (74 780)Equity Advertising - 2 137 096 (2 175)Equity Advertising - 3 768 (10)Equity Aerospace/Defense - 1 1 266 101 41 866 Equity Aerospace/Defense - 2 1 007 238 (44 527)Equity Aerospace/Defense - 3 297 064 (425)Equity Aerospace/Defense - 4 245 527 2 642 Equity Aerospace/Defense - 5 105 445 (1 894)Equity Aerospace/Defense - 6 73 973 90 Equity Agriculture - 1 1 610 849 (2 680)Equity Agriculture - 2 384 532 (7 033)Equity Airlines - 1 793 172 (26 812)Equity Airlines - 2 706 970 (7 305)Equity Airlines - 3 148 564 (9 955)Equity Airlines - 4 44 229 (1 803)Equity Apparel - 1 2 151 496 (68 289)Equity Apparel - 2 1 175 571 (10 632)Equity Apparel - 3 599 604 (11 401)Equity Apparel - 4 484 376 (7 372)Equity Apparel - 5 406 594 (2 009)Equity Apparel - 6 219 685 6 458 Equity Apparel - 7 95 377 (1 142)Equity Auto Manufacturers - 1 1 962 830 (56 023)Equity Auto Manufacturers - 2 1 784 673 74 771 Equity Auto Manufacturers - 3 1 673 091 (28 185)Equity Auto Manufacturers - 4 1 582 845 (86 721)Equity Auto Manufacturers - 5 1 329 159 26 170 Equity Auto Manufacturers - 6 1 202 955 (42 901)Equity Auto Manufacturers - 7 1 037 367 39 104 Equity Auto Manufacturers - 8 918 528 (30 738)Equity Auto Manufacturers - 9 883 916 (1 141)Equity Auto Manufacturers - 10 819 469 29 706 Equity Auto Manufacturers - 11 566 879 (19 996)Equity Auto Manufacturers - 12 548 077 29 004 Equity Auto Manufacturers - 13 516 911 10 769 Equity Auto Manufacturers - 14 514 784 33 695 Equity Auto Manufacturers - 15 503 253 (6 277)Equity Auto Manufacturers - 16 488 774 1 290 Equity Auto Manufacturers - 17 476 656 (8 153)Equity Auto Manufacturers - 18 456 596 (13 533)Equity Auto Manufacturers - 19 393 661 3 233 Equity Auto Manufacturers - 20 193 874 6 019
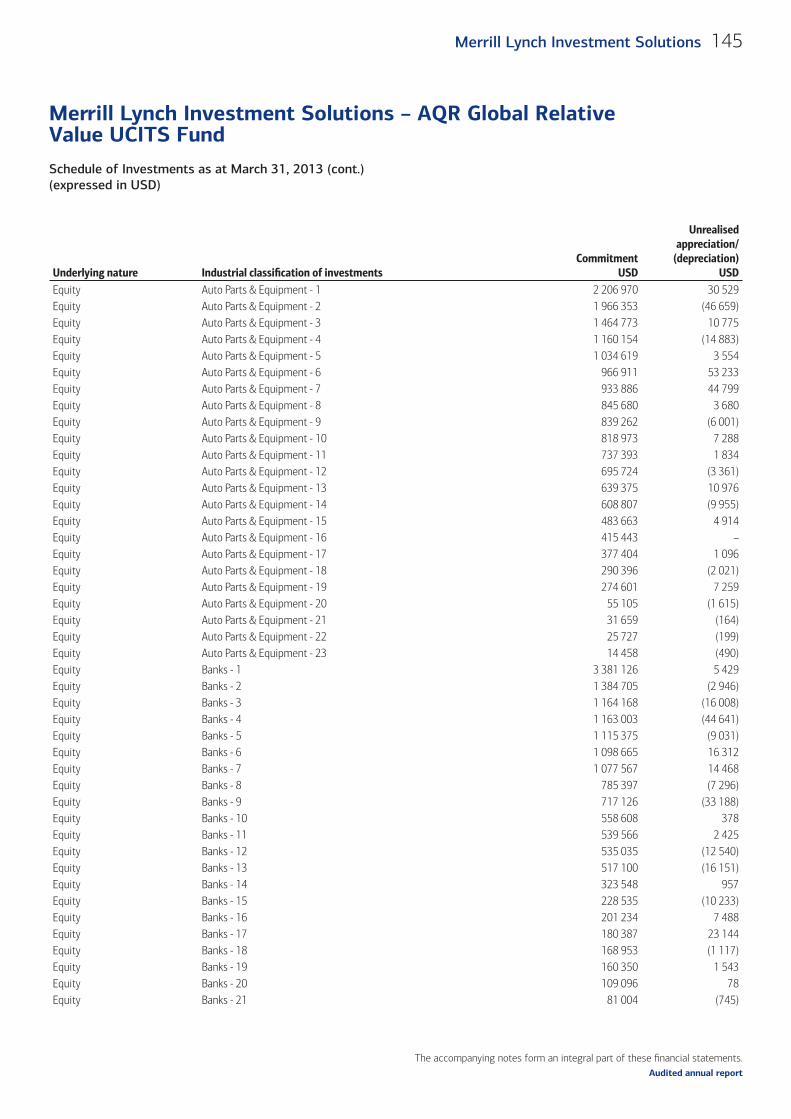
The accompanying notes form an integral part of these fi nancial statements.
Schedule of Investments as at March 31, 2013 (cont.)(expressed in USD)
Merrill Lynch Investment Solutions – AQR Global Relative Value UCITS Fund
145Merrill Lynch Investment Solutions
Audited annual report
Underlying nature Industrial classifi cation of investments Commitment
USD
Unrealised appreciation/
(depreciation)USD
Equity Auto Parts & Equipment - 1 2 206 970 30 529 Equity Auto Parts & Equipment - 2 1 966 353 (46 659)Equity Auto Parts & Equipment - 3 1 464 773 10 775 Equity Auto Parts & Equipment - 4 1 160 154 (14 883)Equity Auto Parts & Equipment - 5 1 034 619 3 554 Equity Auto Parts & Equipment - 6 966 911 53 233 Equity Auto Parts & Equipment - 7 933 886 44 799 Equity Auto Parts & Equipment - 8 845 680 3 680 Equity Auto Parts & Equipment - 9 839 262 (6 001)Equity Auto Parts & Equipment - 10 818 973 7 288 Equity Auto Parts & Equipment - 11 737 393 1 834 Equity Auto Parts & Equipment - 12 695 724 (3 361)Equity Auto Parts & Equipment - 13 639 375 10 976 Equity Auto Parts & Equipment - 14 608 807 (9 955)Equity Auto Parts & Equipment - 15 483 663 4 914 Equity Auto Parts & Equipment - 16 415 443 – Equity Auto Parts & Equipment - 17 377 404 1 096 Equity Auto Parts & Equipment - 18 290 396 (2 021)Equity Auto Parts & Equipment - 19 274 601 7 259 Equity Auto Parts & Equipment - 20 55 105 (1 615)Equity Auto Parts & Equipment - 21 31 659 (164)Equity Auto Parts & Equipment - 22 25 727 (199)Equity Auto Parts & Equipment - 23 14 458 (490)Equity Banks - 1 3 381 126 5 429 Equity Banks - 2 1 384 705 (2 946)Equity Banks - 3 1 164 168 (16 008)Equity Banks - 4 1 163 003 (44 641)Equity Banks - 5 1 115 375 (9 031)Equity Banks - 6 1 098 665 16 312 Equity Banks - 7 1 077 567 14 468 Equity Banks - 8 785 397 (7 296)Equity Banks - 9 717 126 (33 188)Equity Banks - 10 558 608 378 Equity Banks - 11 539 566 2 425 Equity Banks - 12 535 035 (12 540)Equity Banks - 13 517 100 (16 151)Equity Banks - 14 323 548 957 Equity Banks - 15 228 535 (10 233)Equity Banks - 16 201 234 7 488 Equity Banks - 17 180 387 23 144 Equity Banks - 18 168 953 (1 117)Equity Banks - 19 160 350 1 543 Equity Banks - 20 109 096 78 Equity Banks - 21 81 004 (745)
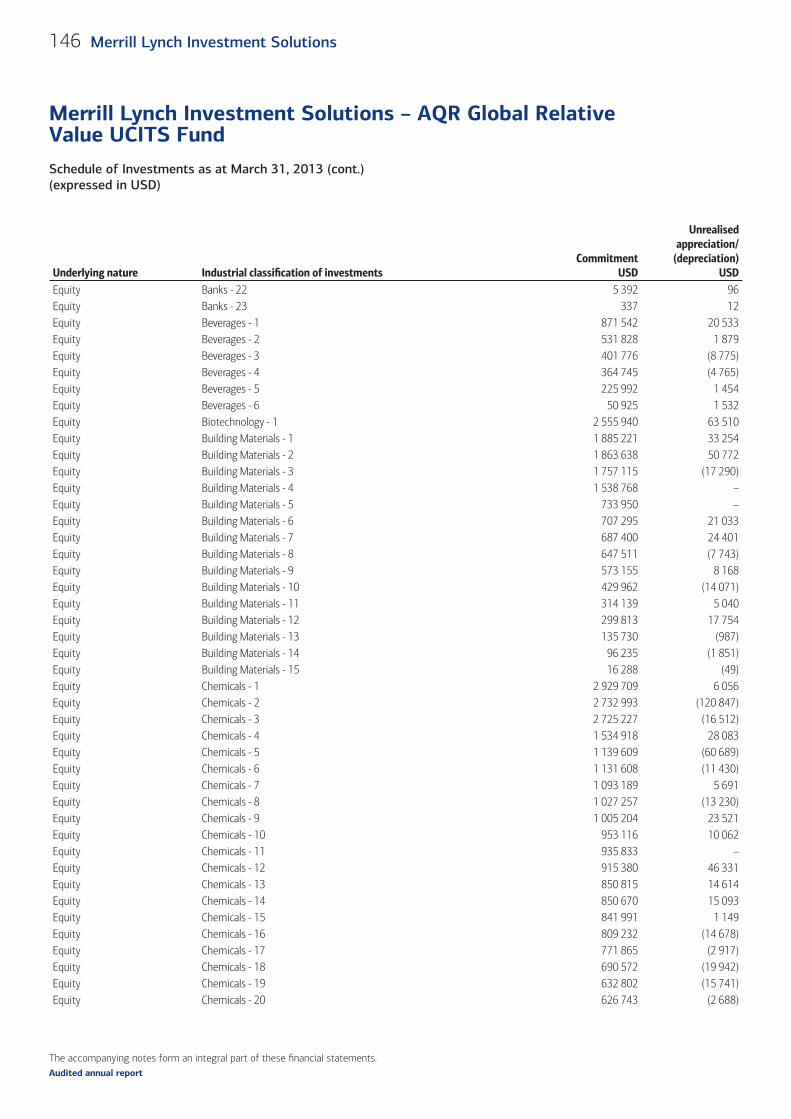
The accompanying notes form an integral part of these fi nancial statements.
Schedule of Investments as at March 31, 2013 (cont.)(expressed in USD)
Merrill Lynch Investment Solutions – AQR Global Relative Value UCITS Fund
146 Merrill Lynch Investment Solutions
Audited annual report
Underlying nature Industrial classifi cation of investments Commitment
USD
Unrealised appreciation/
(depreciation)USD
Equity Banks - 22 5 392 96 Equity Banks - 23 337 12 Equity Beverages - 1 871 542 20 533 Equity Beverages - 2 531 828 1 879 Equity Beverages - 3 401 776 (8 775)Equity Beverages - 4 364 745 (4 765)Equity Beverages - 5 225 992 1 454 Equity Beverages - 6 50 925 1 532 Equity Biotechnology - 1 2 555 940 63 510 Equity Building Materials - 1 1 885 221 33 254 Equity Building Materials - 2 1 863 638 50 772 Equity Building Materials - 3 1 757 115 (17 290)Equity Building Materials - 4 1 538 768 – Equity Building Materials - 5 733 950 – Equity Building Materials - 6 707 295 21 033 Equity Building Materials - 7 687 400 24 401 Equity Building Materials - 8 647 511 (7 743)Equity Building Materials - 9 573 155 8 168 Equity Building Materials - 10 429 962 (14 071)Equity Building Materials - 11 314 139 5 040 Equity Building Materials - 12 299 813 17 754 Equity Building Materials - 13 135 730 (987)Equity Building Materials - 14 96 235 (1 851)Equity Building Materials - 15 16 288 (49)Equity Chemicals - 1 2 929 709 6 056 Equity Chemicals - 2 2 732 993 (120 847)Equity Chemicals - 3 2 725 227 (16 512)Equity Chemicals - 4 1 534 918 28 083 Equity Chemicals - 5 1 139 609 (60 689)Equity Chemicals - 6 1 131 608 (11 430)Equity Chemicals - 7 1 093 189 5 691 Equity Chemicals - 8 1 027 257 (13 230)Equity Chemicals - 9 1 005 204 23 521 Equity Chemicals - 10 953 116 10 062 Equity Chemicals - 11 935 833 – Equity Chemicals - 12 915 380 46 331 Equity Chemicals - 13 850 815 14 614 Equity Chemicals - 14 850 670 15 093 Equity Chemicals - 15 841 991 1 149 Equity Chemicals - 16 809 232 (14 678)Equity Chemicals - 17 771 865 (2 917)Equity Chemicals - 18 690 572 (19 942)Equity Chemicals - 19 632 802 (15 741)Equity Chemicals - 20 626 743 (2 688)
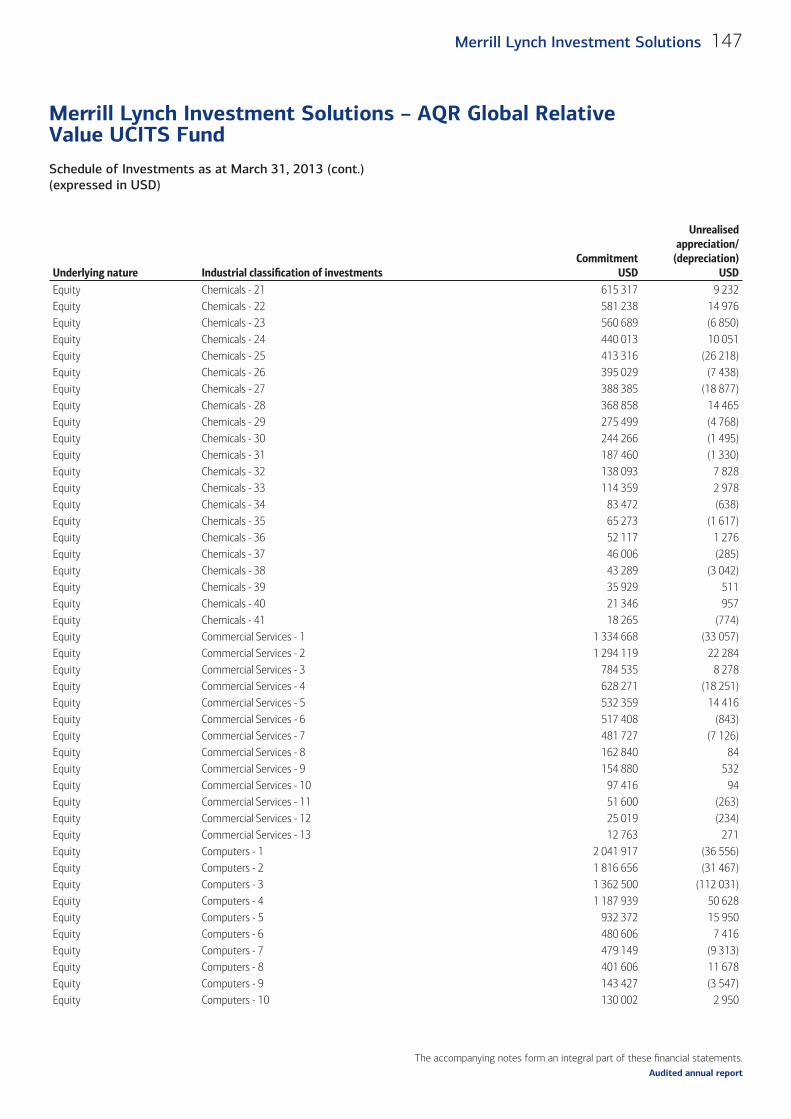
The accompanying notes form an integral part of these fi nancial statements.
Schedule of Investments as at March 31, 2013 (cont.)(expressed in USD)
Merrill Lynch Investment Solutions – AQR Global Relative Value UCITS Fund
147Merrill Lynch Investment Solutions
Audited annual report
Underlying nature Industrial classifi cation of investments Commitment
USD
Unrealised appreciation/
(depreciation)USD
Equity Chemicals - 21 615 317 9 232 Equity Chemicals - 22 581 238 14 976 Equity Chemicals - 23 560 689 (6 850)Equity Chemicals - 24 440 013 10 051 Equity Chemicals - 25 413 316 (26 218)Equity Chemicals - 26 395 029 (7 438)Equity Chemicals - 27 388 385 (18 877)Equity Chemicals - 28 368 858 14 465 Equity Chemicals - 29 275 499 (4 768)Equity Chemicals - 30 244 266 (1 495)Equity Chemicals - 31 187 460 (1 330)Equity Chemicals - 32 138 093 7 828 Equity Chemicals - 33 114 359 2 978 Equity Chemicals - 34 83 472 (638)Equity Chemicals - 35 65 273 (1 617)Equity Chemicals - 36 52 117 1 276 Equity Chemicals - 37 46 006 (285)Equity Chemicals - 38 43 289 (3 042)Equity Chemicals - 39 35 929 511 Equity Chemicals - 40 21 346 957 Equity Chemicals - 41 18 265 (774)Equity Commercial Services - 1 1 334 668 (33 057)Equity Commercial Services - 2 1 294 119 22 284 Equity Commercial Services - 3 784 535 8 278 Equity Commercial Services - 4 628 271 (18 251)Equity Commercial Services - 5 532 359 14 416 Equity Commercial Services - 6 517 408 (843)Equity Commercial Services - 7 481 727 (7 126)Equity Commercial Services - 8 162 840 84 Equity Commercial Services - 9 154 880 532 Equity Commercial Services - 10 97 416 94 Equity Commercial Services - 11 51 600 (263)Equity Commercial Services - 12 25 019 (234)Equity Commercial Services - 13 12 763 271 Equity Computers - 1 2 041 917 (36 556)Equity Computers - 2 1 816 656 (31 467)Equity Computers - 3 1 362 500 (112 031)Equity Computers - 4 1 187 939 50 628 Equity Computers - 5 932 372 15 950 Equity Computers - 6 480 606 7 416 Equity Computers - 7 479 149 (9 313)Equity Computers - 8 401 606 11 678 Equity Computers - 9 143 427 (3 547)Equity Computers - 10 130 002 2 950
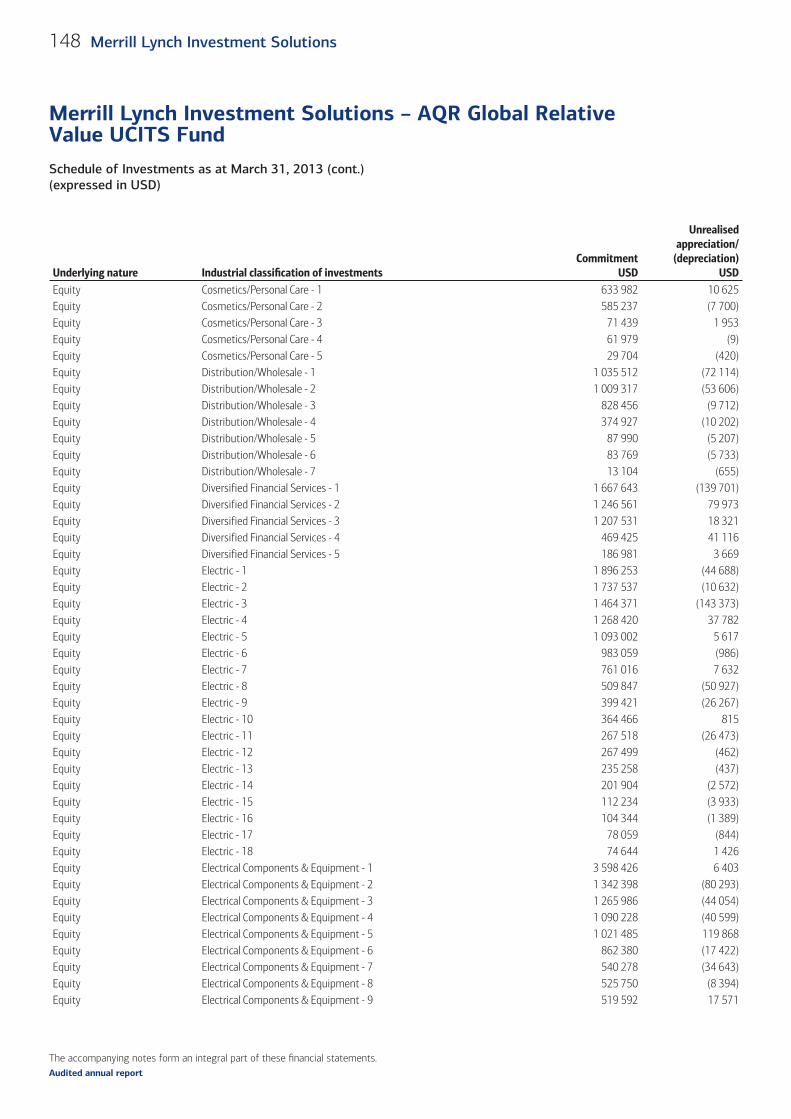
The accompanying notes form an integral part of these fi nancial statements.
Schedule of Investments as at March 31, 2013 (cont.)(expressed in USD)
Merrill Lynch Investment Solutions – AQR Global Relative Value UCITS Fund
148 Merrill Lynch Investment Solutions
Audited annual report
Underlying nature Industrial classifi cation of investments Commitment
USD
Unrealised appreciation/
(depreciation)USD
Equity Cosmetics/Personal Care - 1 633 982 10 625 Equity Cosmetics/Personal Care - 2 585 237 (7 700)Equity Cosmetics/Personal Care - 3 71 439 1 953 Equity Cosmetics/Personal Care - 4 61 979 (9)Equity Cosmetics/Personal Care - 5 29 704 (420)Equity Distribution/Wholesale - 1 1 035 512 (72 114)Equity Distribution/Wholesale - 2 1 009 317 (53 606)Equity Distribution/Wholesale - 3 828 456 (9 712)Equity Distribution/Wholesale - 4 374 927 (10 202)Equity Distribution/Wholesale - 5 87 990 (5 207)Equity Distribution/Wholesale - 6 83 769 (5 733)Equity Distribution/Wholesale - 7 13 104 (655)Equity Diversified Financial Services - 1 1 667 643 (139 701)Equity Diversified Financial Services - 2 1 246 561 79 973 Equity Diversified Financial Services - 3 1 207 531 18 321 Equity Diversified Financial Services - 4 469 425 41 116 Equity Diversified Financial Services - 5 186 981 3 669 Equity Electric - 1 1 896 253 (44 688)Equity Electric - 2 1 737 537 (10 632)Equity Electric - 3 1 464 371 (143 373)Equity Electric - 4 1 268 420 37 782 Equity Electric - 5 1 093 002 5 617 Equity Electric - 6 983 059 (986)Equity Electric - 7 761 016 7 632 Equity Electric - 8 509 847 (50 927)Equity Electric - 9 399 421 (26 267)Equity Electric - 10 364 466 815 Equity Electric - 11 267 518 (26 473)Equity Electric - 12 267 499 (462)Equity Electric - 13 235 258 (437)Equity Electric - 14 201 904 (2 572)Equity Electric - 15 112 234 (3 933)Equity Electric - 16 104 344 (1 389)Equity Electric - 17 78 059 (844)Equity Electric - 18 74 644 1 426 Equity Electrical Components & Equipment - 1 3 598 426 6 403 Equity Electrical Components & Equipment - 2 1 342 398 (80 293)Equity Electrical Components & Equipment - 3 1 265 986 (44 054)Equity Electrical Components & Equipment - 4 1 090 228 (40 599)Equity Electrical Components & Equipment - 5 1 021 485 119 868 Equity Electrical Components & Equipment - 6 862 380 (17 422)Equity Electrical Components & Equipment - 7 540 278 (34 643)Equity Electrical Components & Equipment - 8 525 750 (8 394)Equity Electrical Components & Equipment - 9 519 592 17 571
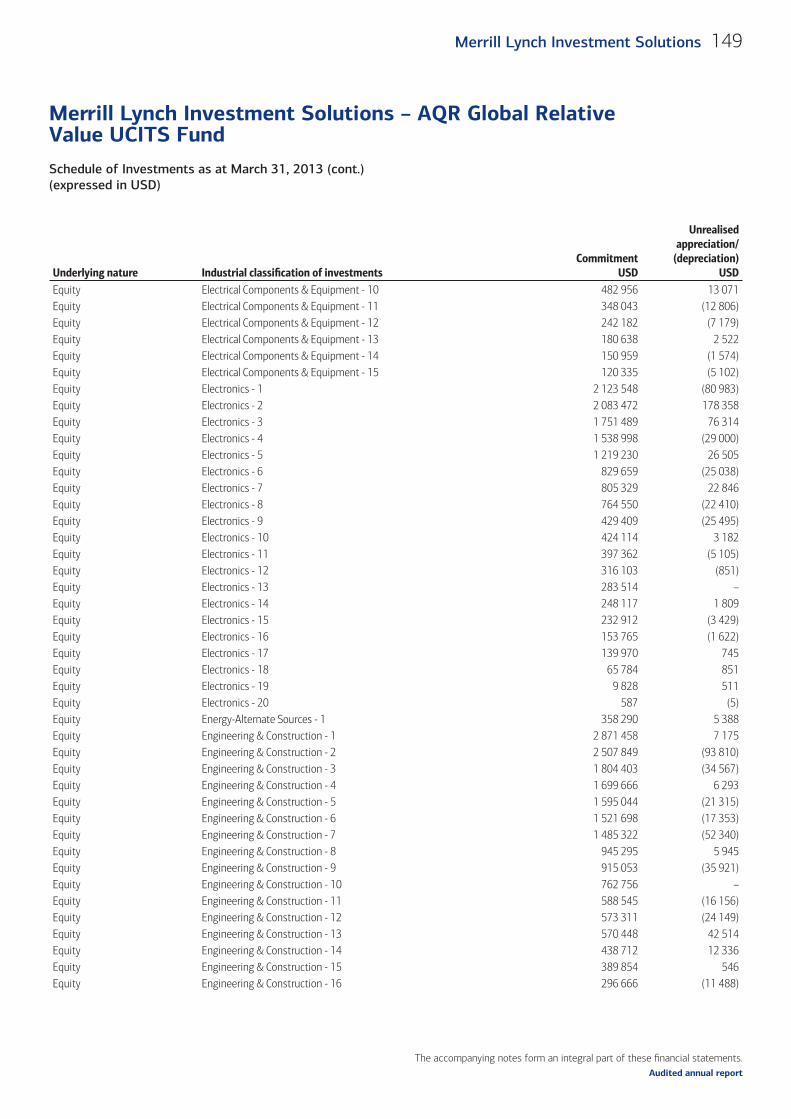
The accompanying notes form an integral part of these fi nancial statements.
Schedule of Investments as at March 31, 2013 (cont.)(expressed in USD)
Merrill Lynch Investment Solutions – AQR Global Relative Value UCITS Fund
149Merrill Lynch Investment Solutions
Audited annual report
Underlying nature Industrial classifi cation of investments Commitment
USD
Unrealised appreciation/
(depreciation)USD
Equity Electrical Components & Equipment - 10 482 956 13 071 Equity Electrical Components & Equipment - 11 348 043 (12 806)Equity Electrical Components & Equipment - 12 242 182 (7 179)Equity Electrical Components & Equipment - 13 180 638 2 522 Equity Electrical Components & Equipment - 14 150 959 (1 574)Equity Electrical Components & Equipment - 15 120 335 (5 102)Equity Electronics - 1 2 123 548 (80 983)Equity Electronics - 2 2 083 472 178 358 Equity Electronics - 3 1 751 489 76 314 Equity Electronics - 4 1 538 998 (29 000)Equity Electronics - 5 1 219 230 26 505 Equity Electronics - 6 829 659 (25 038)Equity Electronics - 7 805 329 22 846 Equity Electronics - 8 764 550 (22 410)Equity Electronics - 9 429 409 (25 495)Equity Electronics - 10 424 114 3 182 Equity Electronics - 11 397 362 (5 105)Equity Electronics - 12 316 103 (851)Equity Electronics - 13 283 514 – Equity Electronics - 14 248 117 1 809 Equity Electronics - 15 232 912 (3 429)Equity Electronics - 16 153 765 (1 622)Equity Electronics - 17 139 970 745 Equity Electronics - 18 65 784 851 Equity Electronics - 19 9 828 511 Equity Electronics - 20 587 (5)Equity Energy-Alternate Sources - 1 358 290 5 388 Equity Engineering & Construction - 1 2 871 458 7 175 Equity Engineering & Construction - 2 2 507 849 (93 810)Equity Engineering & Construction - 3 1 804 403 (34 567)Equity Engineering & Construction - 4 1 699 666 6 293 Equity Engineering & Construction - 5 1 595 044 (21 315)Equity Engineering & Construction - 6 1 521 698 (17 353)Equity Engineering & Construction - 7 1 485 322 (52 340)Equity Engineering & Construction - 8 945 295 5 945 Equity Engineering & Construction - 9 915 053 (35 921)Equity Engineering & Construction - 10 762 756 – Equity Engineering & Construction - 11 588 545 (16 156)Equity Engineering & Construction - 12 573 311 (24 149)Equity Engineering & Construction - 13 570 448 42 514 Equity Engineering & Construction - 14 438 712 12 336 Equity Engineering & Construction - 15 389 854 546 Equity Engineering & Construction - 16 296 666 (11 488)
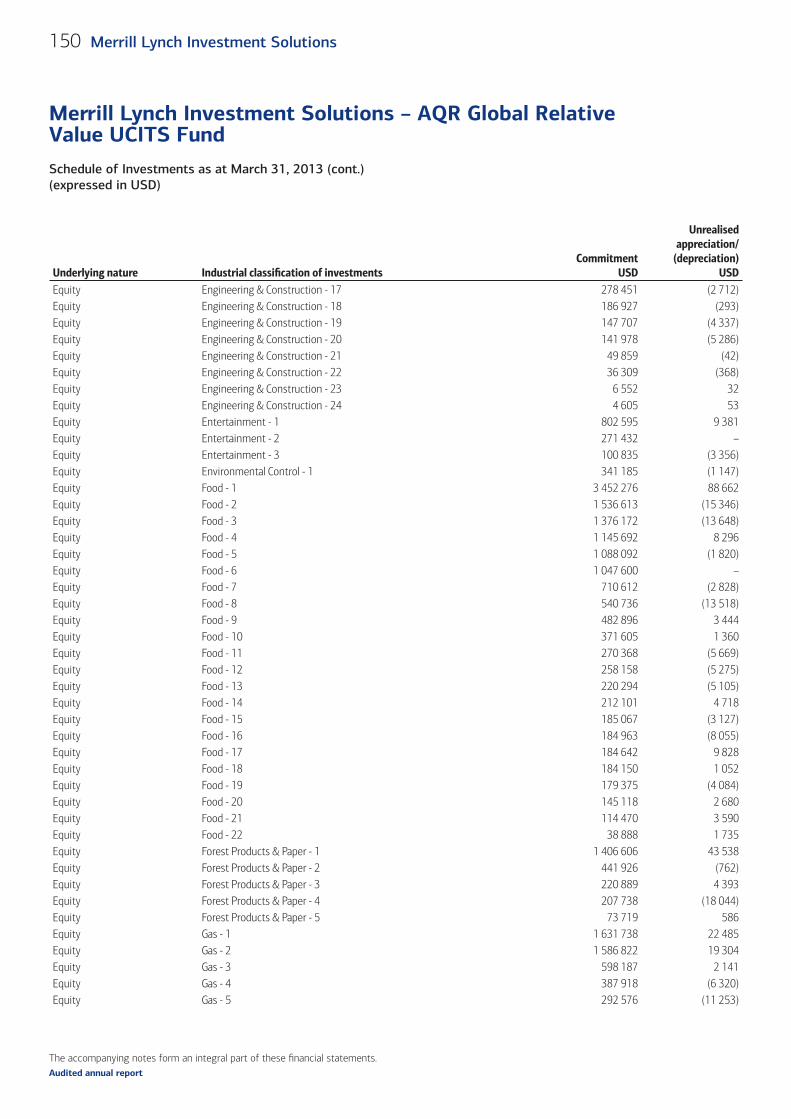
The accompanying notes form an integral part of these fi nancial statements.
Schedule of Investments as at March 31, 2013 (cont.)(expressed in USD)
Merrill Lynch Investment Solutions – AQR Global Relative Value UCITS Fund
150 Merrill Lynch Investment Solutions
Audited annual report
Underlying nature Industrial classifi cation of investments Commitment
USD
Unrealised appreciation/
(depreciation)USD
Equity Engineering & Construction - 17 278 451 (2 712)Equity Engineering & Construction - 18 186 927 (293)Equity Engineering & Construction - 19 147 707 (4 337)Equity Engineering & Construction - 20 141 978 (5 286)Equity Engineering & Construction - 21 49 859 (42)Equity Engineering & Construction - 22 36 309 (368)Equity Engineering & Construction - 23 6 552 32 Equity Engineering & Construction - 24 4 605 53 Equity Entertainment - 1 802 595 9 381 Equity Entertainment - 2 271 432 – Equity Entertainment - 3 100 835 (3 356)Equity Environmental Control - 1 341 185 (1 147)Equity Food - 1 3 452 276 88 662 Equity Food - 2 1 536 613 (15 346)Equity Food - 3 1 376 172 (13 648)Equity Food - 4 1 145 692 8 296 Equity Food - 5 1 088 092 (1 820)Equity Food - 6 1 047 600 – Equity Food - 7 710 612 (2 828)Equity Food - 8 540 736 (13 518)Equity Food - 9 482 896 3 444 Equity Food - 10 371 605 1 360 Equity Food - 11 270 368 (5 669)Equity Food - 12 258 158 (5 275)Equity Food - 13 220 294 (5 105)Equity Food - 14 212 101 4 718 Equity Food - 15 185 067 (3 127)Equity Food - 16 184 963 (8 055)Equity Food - 17 184 642 9 828 Equity Food - 18 184 150 1 052 Equity Food - 19 179 375 (4 084)Equity Food - 20 145 118 2 680 Equity Food - 21 114 470 3 590 Equity Food - 22 38 888 1 735 Equity Forest Products & Paper - 1 1 406 606 43 538 Equity Forest Products & Paper - 2 441 926 (762)Equity Forest Products & Paper - 3 220 889 4 393 Equity Forest Products & Paper - 4 207 738 (18 044)Equity Forest Products & Paper - 5 73 719 586 Equity Gas - 1 1 631 738 22 485 Equity Gas - 2 1 586 822 19 304 Equity Gas - 3 598 187 2 141 Equity Gas - 4 387 918 (6 320)Equity Gas - 5 292 576 (11 253)
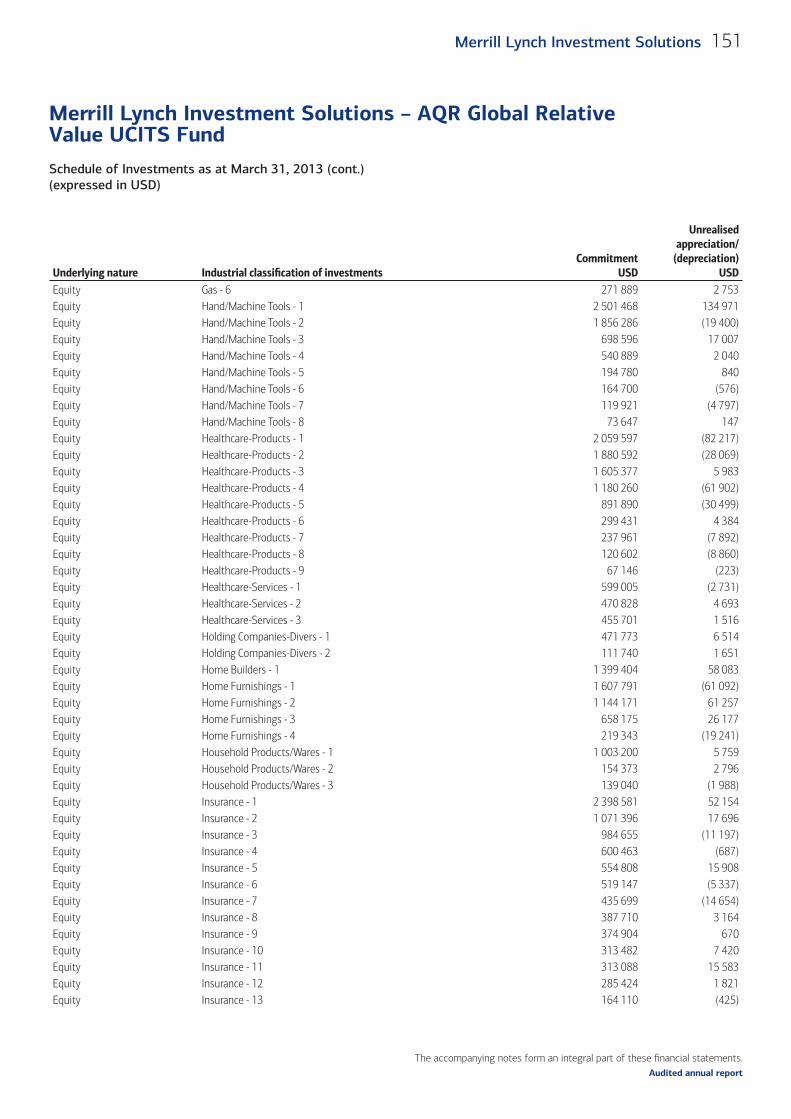
The accompanying notes form an integral part of these fi nancial statements.
Schedule of Investments as at March 31, 2013 (cont.)(expressed in USD)
Merrill Lynch Investment Solutions – AQR Global Relative Value UCITS Fund
151Merrill Lynch Investment Solutions
Audited annual report
Underlying nature Industrial classifi cation of investments Commitment
USD
Unrealised appreciation/
(depreciation)USD
Equity Gas - 6 271 889 2 753 Equity Hand/Machine Tools - 1 2 501 468 134 971 Equity Hand/Machine Tools - 2 1 856 286 (19 400)Equity Hand/Machine Tools - 3 698 596 17 007 Equity Hand/Machine Tools - 4 540 889 2 040 Equity Hand/Machine Tools - 5 194 780 840 Equity Hand/Machine Tools - 6 164 700 (576)Equity Hand/Machine Tools - 7 119 921 (4 797)Equity Hand/Machine Tools - 8 73 647 147 Equity Healthcare-Products - 1 2 059 597 (82 217)Equity Healthcare-Products - 2 1 880 592 (28 069)Equity Healthcare-Products - 3 1 605 377 5 983 Equity Healthcare-Products - 4 1 180 260 (61 902)Equity Healthcare-Products - 5 891 890 (30 499)Equity Healthcare-Products - 6 299 431 4 384 Equity Healthcare-Products - 7 237 961 (7 892)Equity Healthcare-Products - 8 120 602 (8 860)Equity Healthcare-Products - 9 67 146 (223)Equity Healthcare-Services - 1 599 005 (2 731)Equity Healthcare-Services - 2 470 828 4 693 Equity Healthcare-Services - 3 455 701 1 516 Equity Holding Companies-Divers - 1 471 773 6 514 Equity Holding Companies-Divers - 2 111 740 1 651 Equity Home Builders - 1 1 399 404 58 083 Equity Home Furnishings - 1 1 607 791 (61 092)Equity Home Furnishings - 2 1 144 171 61 257 Equity Home Furnishings - 3 658 175 26 177 Equity Home Furnishings - 4 219 343 (19 241)Equity Household Products/Wares - 1 1 003 200 5 759 Equity Household Products/Wares - 2 154 373 2 796 Equity Household Products/Wares - 3 139 040 (1 988)Equity Insurance - 1 2 398 581 52 154 Equity Insurance - 2 1 071 396 17 696 Equity Insurance - 3 984 655 (11 197)Equity Insurance - 4 600 463 (687)Equity Insurance - 5 554 808 15 908 Equity Insurance - 6 519 147 (5 337)Equity Insurance - 7 435 699 (14 654)Equity Insurance - 8 387 710 3 164 Equity Insurance - 9 374 904 670 Equity Insurance - 10 313 482 7 420 Equity Insurance - 11 313 088 15 583 Equity Insurance - 12 285 424 1 821 Equity Insurance - 13 164 110 (425)
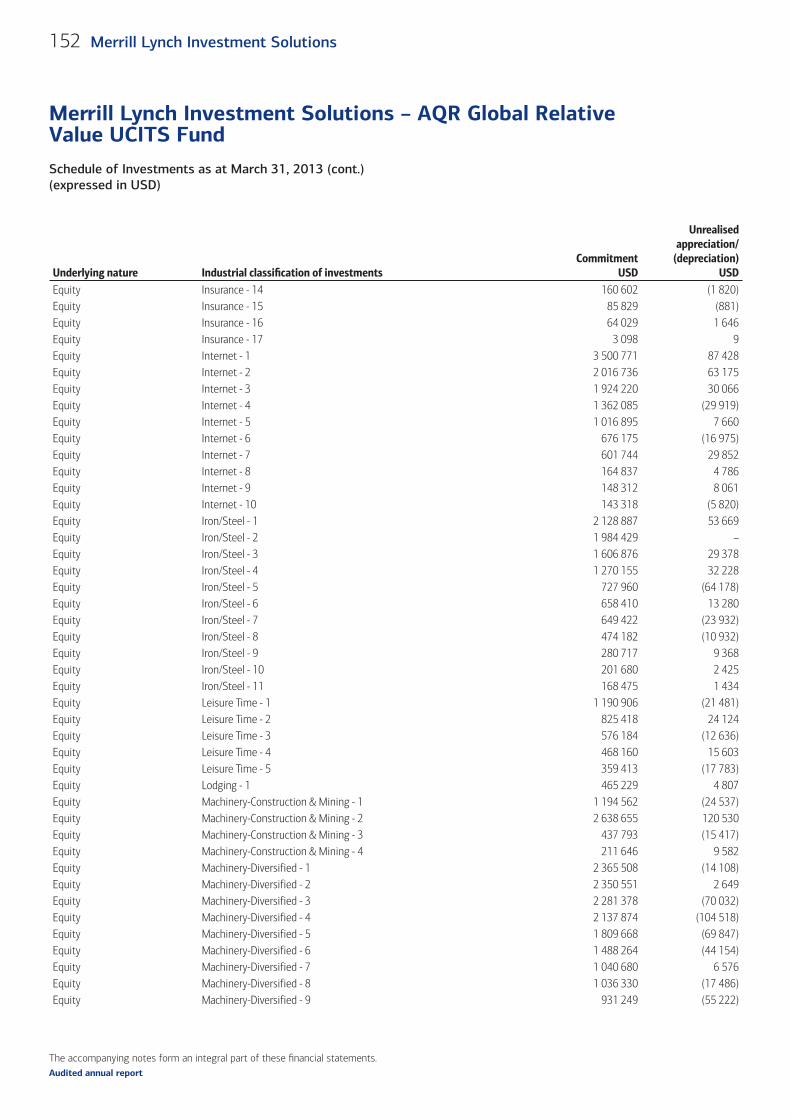
The accompanying notes form an integral part of these fi nancial statements.
Schedule of Investments as at March 31, 2013 (cont.)(expressed in USD)
Merrill Lynch Investment Solutions – AQR Global Relative Value UCITS Fund
152 Merrill Lynch Investment Solutions
Audited annual report
Underlying nature Industrial classifi cation of investments Commitment
USD
Unrealised appreciation/
(depreciation)USD
Equity Insurance - 14 160 602 (1 820)Equity Insurance - 15 85 829 (881)Equity Insurance - 16 64 029 1 646 Equity Insurance - 17 3 098 9 Equity Internet - 1 3 500 771 87 428 Equity Internet - 2 2 016 736 63 175 Equity Internet - 3 1 924 220 30 066 Equity Internet - 4 1 362 085 (29 919)Equity Internet - 5 1 016 895 7 660 Equity Internet - 6 676 175 (16 975)Equity Internet - 7 601 744 29 852 Equity Internet - 8 164 837 4 786 Equity Internet - 9 148 312 8 061 Equity Internet - 10 143 318 (5 820)Equity Iron/Steel - 1 2 128 887 53 669 Equity Iron/Steel - 2 1 984 429 – Equity Iron/Steel - 3 1 606 876 29 378 Equity Iron/Steel - 4 1 270 155 32 228 Equity Iron/Steel - 5 727 960 (64 178)Equity Iron/Steel - 6 658 410 13 280 Equity Iron/Steel - 7 649 422 (23 932)Equity Iron/Steel - 8 474 182 (10 932)Equity Iron/Steel - 9 280 717 9 368 Equity Iron/Steel - 10 201 680 2 425 Equity Iron/Steel - 11 168 475 1 434 Equity Leisure Time - 1 1 190 906 (21 481)Equity Leisure Time - 2 825 418 24 124 Equity Leisure Time - 3 576 184 (12 636)Equity Leisure Time - 4 468 160 15 603 Equity Leisure Time - 5 359 413 (17 783)Equity Lodging - 1 465 229 4 807 Equity Machinery-Construction & Mining - 1 1 194 562 (24 537)Equity Machinery-Construction & Mining - 2 2 638 655 120 530 Equity Machinery-Construction & Mining - 3 437 793 (15 417)Equity Machinery-Construction & Mining - 4 211 646 9 582 Equity Machinery-Diversified - 1 2 365 508 (14 108)Equity Machinery-Diversified - 2 2 350 551 2 649 Equity Machinery-Diversified - 3 2 281 378 (70 032)Equity Machinery-Diversified - 4 2 137 874 (104 518)Equity Machinery-Diversified - 5 1 809 668 (69 847)Equity Machinery-Diversified - 6 1 488 264 (44 154)Equity Machinery-Diversified - 7 1 040 680 6 576 Equity Machinery-Diversified - 8 1 036 330 (17 486)Equity Machinery-Diversified - 9 931 249 (55 222)
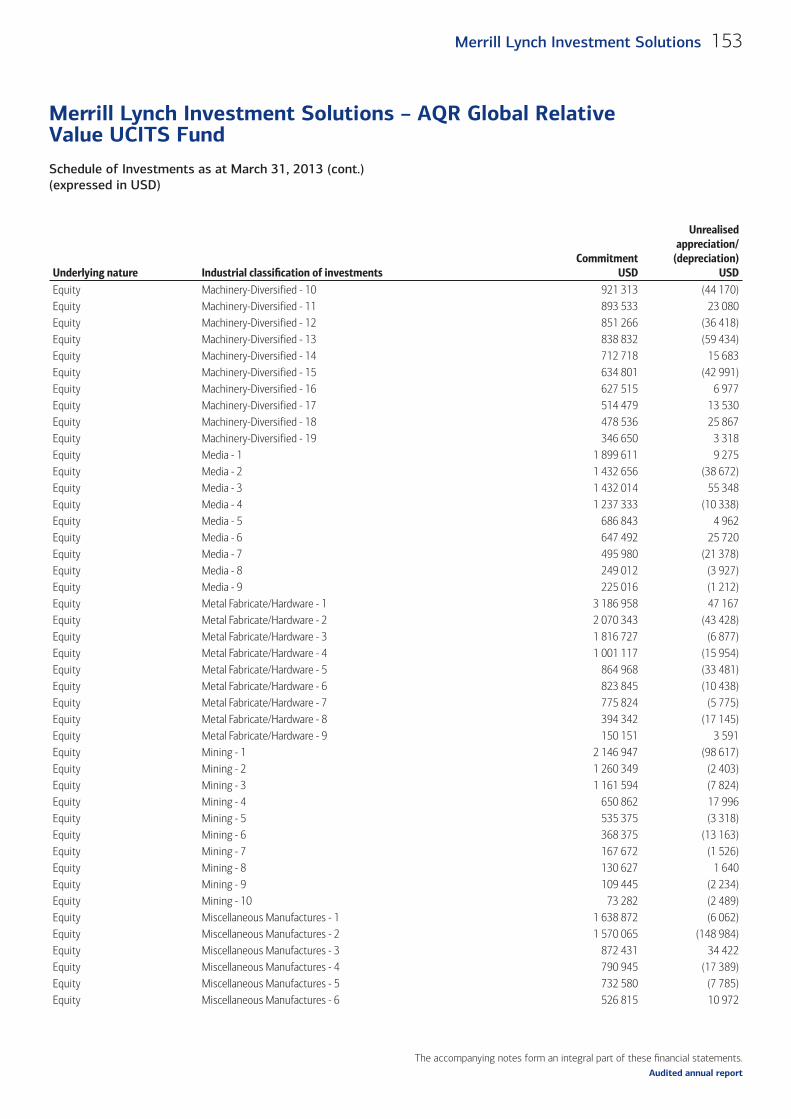
The accompanying notes form an integral part of these fi nancial statements.
Schedule of Investments as at March 31, 2013 (cont.)(expressed in USD)
Merrill Lynch Investment Solutions – AQR Global Relative Value UCITS Fund
153Merrill Lynch Investment Solutions
Audited annual report
Underlying nature Industrial classifi cation of investments Commitment
USD
Unrealised appreciation/
(depreciation)USD
Equity Machinery-Diversified - 10 921 313 (44 170)Equity Machinery-Diversified - 11 893 533 23 080 Equity Machinery-Diversified - 12 851 266 (36 418)Equity Machinery-Diversified - 13 838 832 (59 434)Equity Machinery-Diversified - 14 712 718 15 683 Equity Machinery-Diversified - 15 634 801 (42 991)Equity Machinery-Diversified - 16 627 515 6 977 Equity Machinery-Diversified - 17 514 479 13 530 Equity Machinery-Diversified - 18 478 536 25 867 Equity Machinery-Diversified - 19 346 650 3 318 Equity Media - 1 1 899 611 9 275 Equity Media - 2 1 432 656 (38 672)Equity Media - 3 1 432 014 55 348 Equity Media - 4 1 237 333 (10 338)Equity Media - 5 686 843 4 962 Equity Media - 6 647 492 25 720 Equity Media - 7 495 980 (21 378)Equity Media - 8 249 012 (3 927)Equity Media - 9 225 016 (1 212)Equity Metal Fabricate/Hardware - 1 3 186 958 47 167 Equity Metal Fabricate/Hardware - 2 2 070 343 (43 428)Equity Metal Fabricate/Hardware - 3 1 816 727 (6 877)Equity Metal Fabricate/Hardware - 4 1 001 117 (15 954)Equity Metal Fabricate/Hardware - 5 864 968 (33 481)Equity Metal Fabricate/Hardware - 6 823 845 (10 438)Equity Metal Fabricate/Hardware - 7 775 824 (5 775)Equity Metal Fabricate/Hardware - 8 394 342 (17 145)Equity Metal Fabricate/Hardware - 9 150 151 3 591 Equity Mining - 1 2 146 947 (98 617)Equity Mining - 2 1 260 349 (2 403)Equity Mining - 3 1 161 594 (7 824)Equity Mining - 4 650 862 17 996 Equity Mining - 5 535 375 (3 318)Equity Mining - 6 368 375 (13 163)Equity Mining - 7 167 672 (1 526)Equity Mining - 8 130 627 1 640 Equity Mining - 9 109 445 (2 234)Equity Mining - 10 73 282 (2 489)Equity Miscellaneous Manufactures - 1 1 638 872 (6 062)Equity Miscellaneous Manufactures - 2 1 570 065 (148 984)Equity Miscellaneous Manufactures - 3 872 431 34 422 Equity Miscellaneous Manufactures - 4 790 945 (17 389)Equity Miscellaneous Manufactures - 5 732 580 (7 785)Equity Miscellaneous Manufactures - 6 526 815 10 972
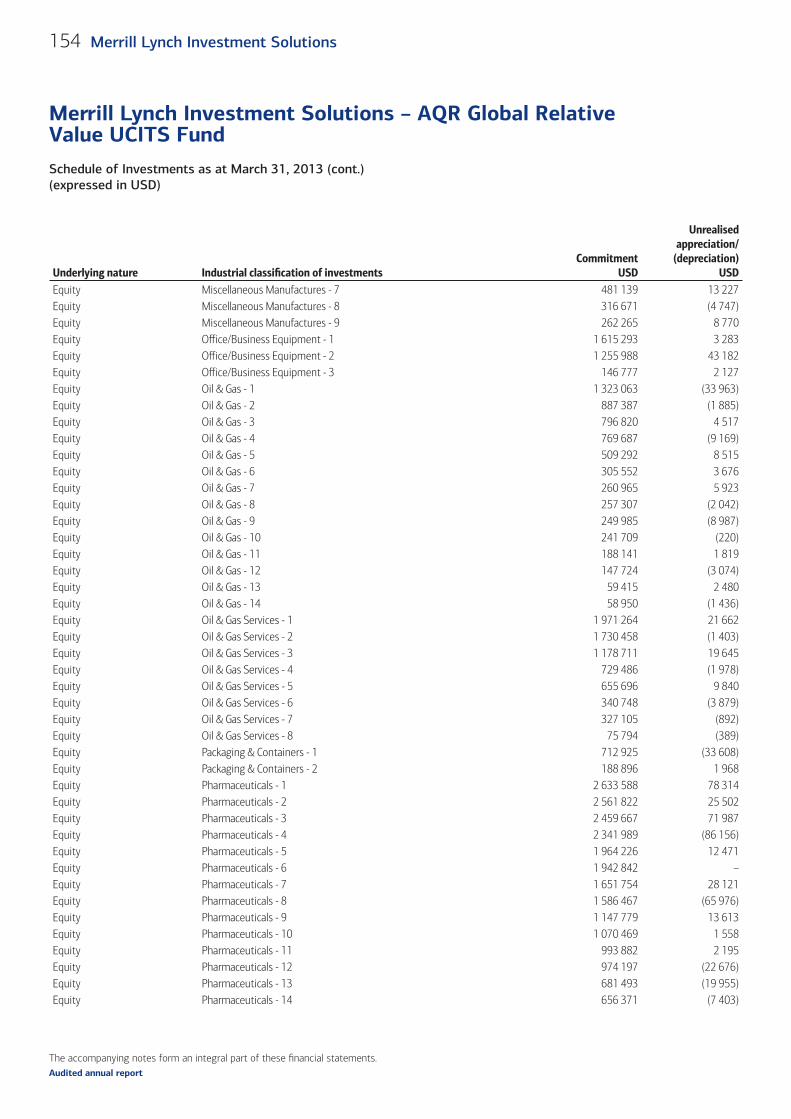
The accompanying notes form an integral part of these fi nancial statements.
Schedule of Investments as at March 31, 2013 (cont.)(expressed in USD)
Merrill Lynch Investment Solutions – AQR Global Relative Value UCITS Fund
154 Merrill Lynch Investment Solutions
Audited annual report
Underlying nature Industrial classifi cation of investments Commitment
USD
Unrealised appreciation/
(depreciation)USD
Equity Miscellaneous Manufactures - 7 481 139 13 227 Equity Miscellaneous Manufactures - 8 316 671 (4 747)Equity Miscellaneous Manufactures - 9 262 265 8 770 Equity Office/Business Equipment - 1 1 615 293 3 283 Equity Office/Business Equipment - 2 1 255 988 43 182 Equity Office/Business Equipment - 3 146 777 2 127 Equity Oil & Gas - 1 1 323 063 (33 963)Equity Oil & Gas - 2 887 387 (1 885)Equity Oil & Gas - 3 796 820 4 517 Equity Oil & Gas - 4 769 687 (9 169)Equity Oil & Gas - 5 509 292 8 515 Equity Oil & Gas - 6 305 552 3 676 Equity Oil & Gas - 7 260 965 5 923 Equity Oil & Gas - 8 257 307 (2 042)Equity Oil & Gas - 9 249 985 (8 987)Equity Oil & Gas - 10 241 709 (220)Equity Oil & Gas - 11 188 141 1 819 Equity Oil & Gas - 12 147 724 (3 074)Equity Oil & Gas - 13 59 415 2 480 Equity Oil & Gas - 14 58 950 (1 436)Equity Oil & Gas Services - 1 1 971 264 21 662 Equity Oil & Gas Services - 2 1 730 458 (1 403)Equity Oil & Gas Services - 3 1 178 711 19 645 Equity Oil & Gas Services - 4 729 486 (1 978)Equity Oil & Gas Services - 5 655 696 9 840 Equity Oil & Gas Services - 6 340 748 (3 879)Equity Oil & Gas Services - 7 327 105 (892)Equity Oil & Gas Services - 8 75 794 (389)Equity Packaging & Containers - 1 712 925 (33 608)Equity Packaging & Containers - 2 188 896 1 968 Equity Pharmaceuticals - 1 2 633 588 78 314 Equity Pharmaceuticals - 2 2 561 822 25 502 Equity Pharmaceuticals - 3 2 459 667 71 987 Equity Pharmaceuticals - 4 2 341 989 (86 156)Equity Pharmaceuticals - 5 1 964 226 12 471 Equity Pharmaceuticals - 6 1 942 842 – Equity Pharmaceuticals - 7 1 651 754 28 121 Equity Pharmaceuticals - 8 1 586 467 (65 976)Equity Pharmaceuticals - 9 1 147 779 13 613 Equity Pharmaceuticals - 10 1 070 469 1 558 Equity Pharmaceuticals - 11 993 882 2 195 Equity Pharmaceuticals - 12 974 197 (22 676)Equity Pharmaceuticals - 13 681 493 (19 955)Equity Pharmaceuticals - 14 656 371 (7 403)
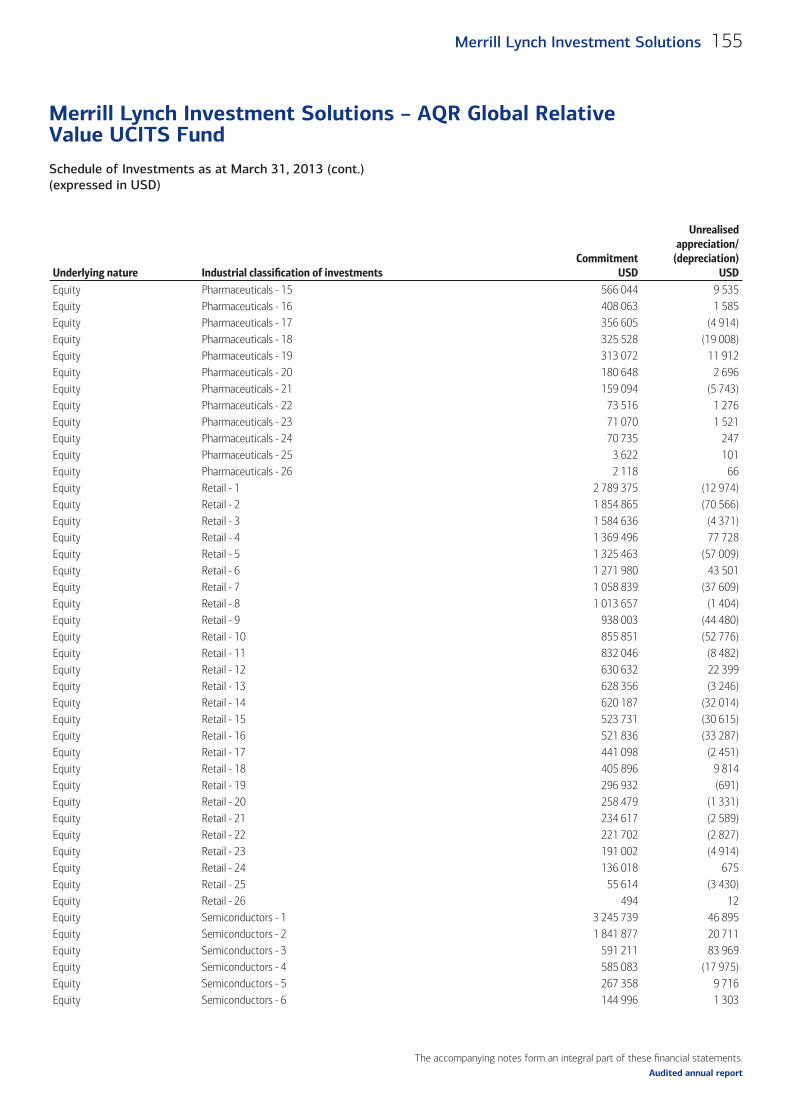
The accompanying notes form an integral part of these fi nancial statements.
Schedule of Investments as at March 31, 2013 (cont.)(expressed in USD)
Merrill Lynch Investment Solutions – AQR Global Relative Value UCITS Fund
155Merrill Lynch Investment Solutions
Audited annual report
Underlying nature Industrial classifi cation of investments Commitment
USD
Unrealised appreciation/
(depreciation)USD
Equity Pharmaceuticals - 15 566 044 9 535 Equity Pharmaceuticals - 16 408 063 1 585 Equity Pharmaceuticals - 17 356 605 (4 914)Equity Pharmaceuticals - 18 325 528 (19 008)Equity Pharmaceuticals - 19 313 072 11 912 Equity Pharmaceuticals - 20 180 648 2 696 Equity Pharmaceuticals - 21 159 094 (5 743)Equity Pharmaceuticals - 22 73 516 1 276 Equity Pharmaceuticals - 23 71 070 1 521 Equity Pharmaceuticals - 24 70 735 247 Equity Pharmaceuticals - 25 3 622 101 Equity Pharmaceuticals - 26 2 118 66 Equity Retail - 1 2 789 375 (12 974)Equity Retail - 2 1 854 865 (70 566)Equity Retail - 3 1 584 636 (4 371)Equity Retail - 4 1 369 496 77 728 Equity Retail - 5 1 325 463 (57 009)Equity Retail - 6 1 271 980 43 501 Equity Retail - 7 1 058 839 (37 609)Equity Retail - 8 1 013 657 (1 404)Equity Retail - 9 938 003 (44 480)Equity Retail - 10 855 851 (52 776)Equity Retail - 11 832 046 (8 482)Equity Retail - 12 630 632 22 399 Equity Retail - 13 628 356 (3 246)Equity Retail - 14 620 187 (32 014)Equity Retail - 15 523 731 (30 615)Equity Retail - 16 521 836 (33 287)Equity Retail - 17 441 098 (2 451)Equity Retail - 18 405 896 9 814 Equity Retail - 19 296 932 (691)Equity Retail - 20 258 479 (1 331)Equity Retail - 21 234 617 (2 589)Equity Retail - 22 221 702 (2 827)Equity Retail - 23 191 002 (4 914)Equity Retail - 24 136 018 675 Equity Retail - 25 55 614 (3 430)Equity Retail - 26 494 12 Equity Semiconductors - 1 3 245 739 46 895 Equity Semiconductors - 2 1 841 877 20 711 Equity Semiconductors - 3 591 211 83 969 Equity Semiconductors - 4 585 083 (17 975)Equity Semiconductors - 5 267 358 9 716 Equity Semiconductors - 6 144 996 1 303
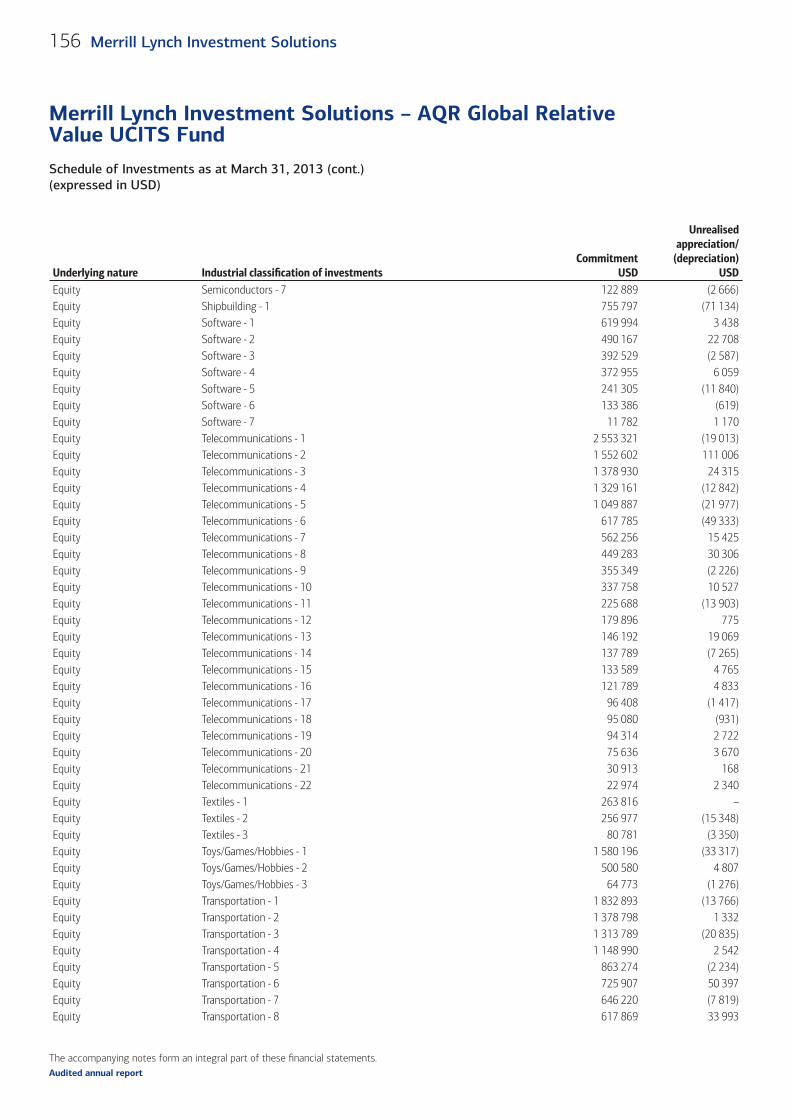
The accompanying notes form an integral part of these fi nancial statements.
Schedule of Investments as at March 31, 2013 (cont.)(expressed in USD)
Merrill Lynch Investment Solutions – AQR Global Relative Value UCITS Fund
156 Merrill Lynch Investment Solutions
Audited annual report
Underlying nature Industrial classifi cation of investments Commitment
USD
Unrealised appreciation/
(depreciation)USD
Equity Semiconductors - 7 122 889 (2 666)Equity Shipbuilding - 1 755 797 (71 134)Equity Software - 1 619 994 3 438 Equity Software - 2 490 167 22 708 Equity Software - 3 392 529 (2 587)Equity Software - 4 372 955 6 059 Equity Software - 5 241 305 (11 840)Equity Software - 6 133 386 (619)Equity Software - 7 11 782 1 170 Equity Telecommunications - 1 2 553 321 (19 013)Equity Telecommunications - 2 1 552 602 111 006 Equity Telecommunications - 3 1 378 930 24 315 Equity Telecommunications - 4 1 329 161 (12 842)Equity Telecommunications - 5 1 049 887 (21 977)Equity Telecommunications - 6 617 785 (49 333)Equity Telecommunications - 7 562 256 15 425 Equity Telecommunications - 8 449 283 30 306 Equity Telecommunications - 9 355 349 (2 226)Equity Telecommunications - 10 337 758 10 527 Equity Telecommunications - 11 225 688 (13 903)Equity Telecommunications - 12 179 896 775 Equity Telecommunications - 13 146 192 19 069 Equity Telecommunications - 14 137 789 (7 265)Equity Telecommunications - 15 133 589 4 765 Equity Telecommunications - 16 121 789 4 833 Equity Telecommunications - 17 96 408 (1 417)Equity Telecommunications - 18 95 080 (931)Equity Telecommunications - 19 94 314 2 722 Equity Telecommunications - 20 75 636 3 670 Equity Telecommunications - 21 30 913 168 Equity Telecommunications - 22 22 974 2 340 Equity Textiles - 1 263 816 – Equity Textiles - 2 256 977 (15 348)Equity Textiles - 3 80 781 (3 350)Equity Toys/Games/Hobbies - 1 1 580 196 (33 317)Equity Toys/Games/Hobbies - 2 500 580 4 807 Equity Toys/Games/Hobbies - 3 64 773 (1 276)Equity Transportation - 1 1 832 893 (13 766)Equity Transportation - 2 1 378 798 1 332 Equity Transportation - 3 1 313 789 (20 835)Equity Transportation - 4 1 148 990 2 542 Equity Transportation - 5 863 274 (2 234)Equity Transportation - 6 725 907 50 397 Equity Transportation - 7 646 220 (7 819)Equity Transportation - 8 617 869 33 993
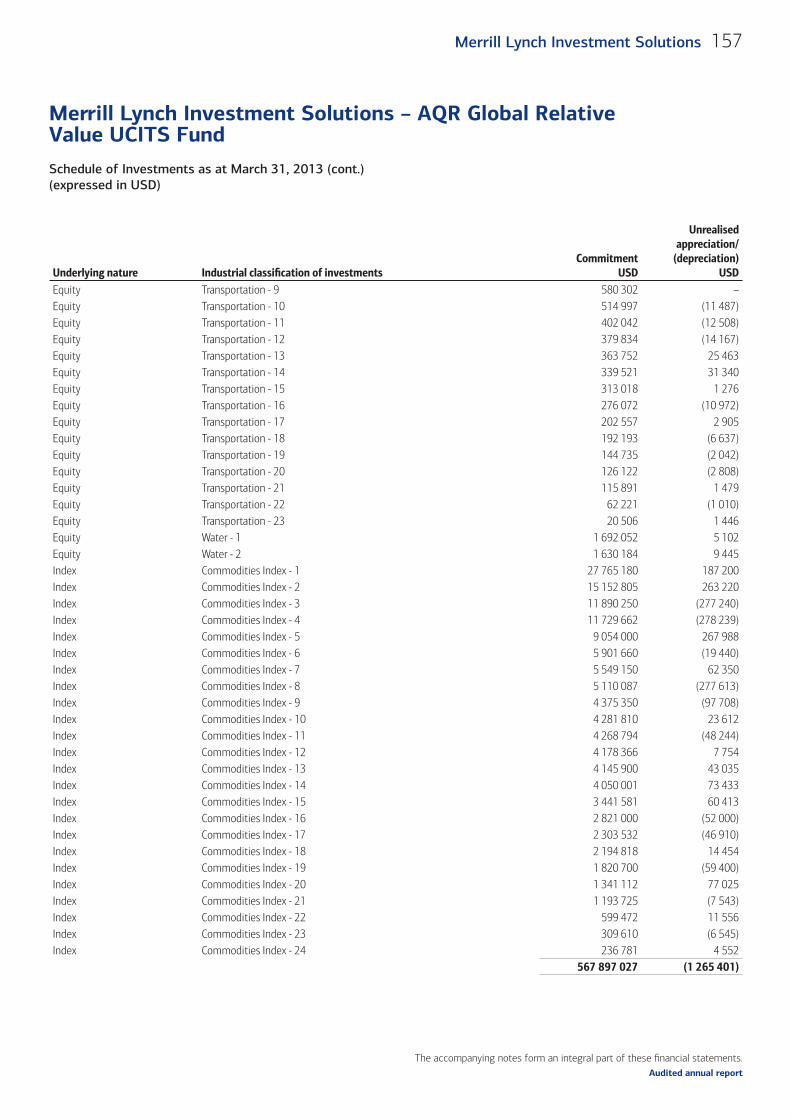
The accompanying notes form an integral part of these fi nancial statements.
Schedule of Investments as at March 31, 2013 (cont.)(expressed in USD)
Merrill Lynch Investment Solutions – AQR Global Relative Value UCITS Fund
157Merrill Lynch Investment Solutions
Audited annual report
Underlying nature Industrial classifi cation of investments Commitment
USD
Unrealised appreciation/
(depreciation)USD
Equity Transportation - 9 580 302 – Equity Transportation - 10 514 997 (11 487)Equity Transportation - 11 402 042 (12 508)Equity Transportation - 12 379 834 (14 167)Equity Transportation - 13 363 752 25 463 Equity Transportation - 14 339 521 31 340 Equity Transportation - 15 313 018 1 276 Equity Transportation - 16 276 072 (10 972)Equity Transportation - 17 202 557 2 905 Equity Transportation - 18 192 193 (6 637)Equity Transportation - 19 144 735 (2 042)Equity Transportation - 20 126 122 (2 808)Equity Transportation - 21 115 891 1 479 Equity Transportation - 22 62 221 (1 010)Equity Transportation - 23 20 506 1 446 Equity Water - 1 1 692 052 5 102 Equity Water - 2 1 630 184 9 445 Index Commodities Index - 1 27 765 180 187 200 Index Commodities Index - 2 15 152 805 263 220 Index Commodities Index - 3 11 890 250 (277 240)Index Commodities Index - 4 11 729 662 (278 239)Index Commodities Index - 5 9 054 000 267 988 Index Commodities Index - 6 5 901 660 (19 440)Index Commodities Index - 7 5 549 150 62 350 Index Commodities Index - 8 5 110 087 (277 613)Index Commodities Index - 9 4 375 350 (97 708)Index Commodities Index - 10 4 281 810 23 612 Index Commodities Index - 11 4 268 794 (48 244)Index Commodities Index - 12 4 178 366 7 754 Index Commodities Index - 13 4 145 900 43 035 Index Commodities Index - 14 4 050 001 73 433 Index Commodities Index - 15 3 441 581 60 413 Index Commodities Index - 16 2 821 000 (52 000)Index Commodities Index - 17 2 303 532 (46 910)Index Commodities Index - 18 2 194 818 14 454 Index Commodities Index - 19 1 820 700 (59 400)Index Commodities Index - 20 1 341 112 77 025 Index Commodities Index - 21 1 193 725 (7 543)Index Commodities Index - 22 599 472 11 556 Index Commodities Index - 23 309 610 (6 545)Index Commodities Index - 24 236 781 4 552
567 897 027 (1 265 401)
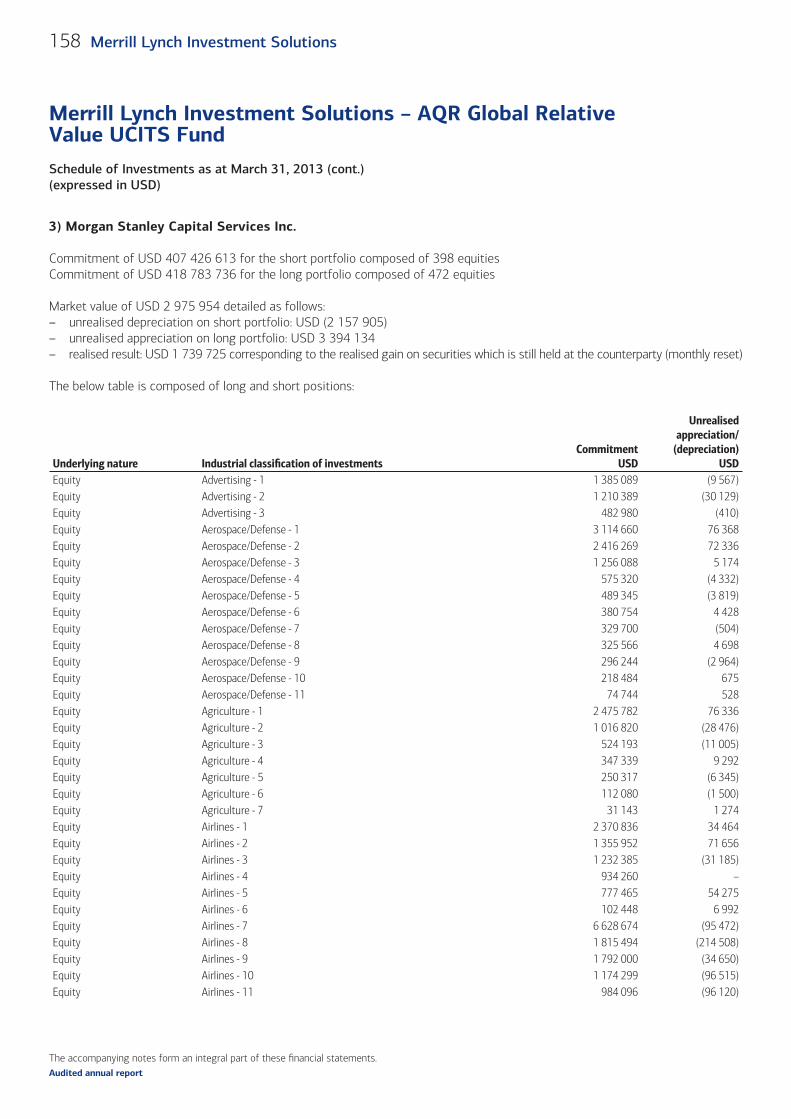
The accompanying notes form an integral part of these fi nancial statements.
Schedule of Investments as at March 31, 2013 (cont.)(expressed in USD)
Merrill Lynch Investment Solutions – AQR Global Relative Value UCITS Fund
158 Merrill Lynch Investment Solutions
Audited annual report
3) Morgan Stanley Capital Services Inc.
Commitment of USD 407 426 613 for the short portfolio composed of 398 equitiesCommitment of USD 418 783 736 for the long portfolio composed of 472 equities
Market value of USD 2 975 954 detailed as follows:– unrealised depreciation on short portfolio: USD (2 157 905)– unrealised appreciation on long portfolio: USD 3 394 134– realised result: USD 1 739 725 corresponding to the realised gain on securities which is still held at the counterparty (monthly reset)
The below table is composed of long and short positions:
Underlying nature Industrial classifi cation of investments Commitment
USD
Unrealised appreciation/
(depreciation)USD
Equity Advertising - 1 1 385 089 (9 567)Equity Advertising - 2 1 210 389 (30 129)Equity Advertising - 3 482 980 (410)Equity Aerospace/Defense - 1 3 114 660 76 368 Equity Aerospace/Defense - 2 2 416 269 72 336 Equity Aerospace/Defense - 3 1 256 088 5 174 Equity Aerospace/Defense - 4 575 320 (4 332)Equity Aerospace/Defense - 5 489 345 (3 819)Equity Aerospace/Defense - 6 380 754 4 428 Equity Aerospace/Defense - 7 329 700 (504)Equity Aerospace/Defense - 8 325 566 4 698 Equity Aerospace/Defense - 9 296 244 (2 964)Equity Aerospace/Defense - 10 218 484 675 Equity Aerospace/Defense - 11 74 744 528 Equity Agriculture - 1 2 475 782 76 336 Equity Agriculture - 2 1 016 820 (28 476)Equity Agriculture - 3 524 193 (11 005)Equity Agriculture - 4 347 339 9 292 Equity Agriculture - 5 250 317 (6 345)Equity Agriculture - 6 112 080 (1 500)Equity Agriculture - 7 31 143 1 274 Equity Airlines - 1 2 370 836 34 464 Equity Airlines - 2 1 355 952 71 656 Equity Airlines - 3 1 232 385 (31 185)Equity Airlines - 4 934 260 – Equity Airlines - 5 777 465 54 275 Equity Airlines - 6 102 448 6 992 Equity Airlines - 7 6 628 674 (95 472)Equity Airlines - 8 1 815 494 (214 508)Equity Airlines - 9 1 792 000 (34 650)Equity Airlines - 10 1 174 299 (96 515)Equity Airlines - 11 984 096 (96 120)
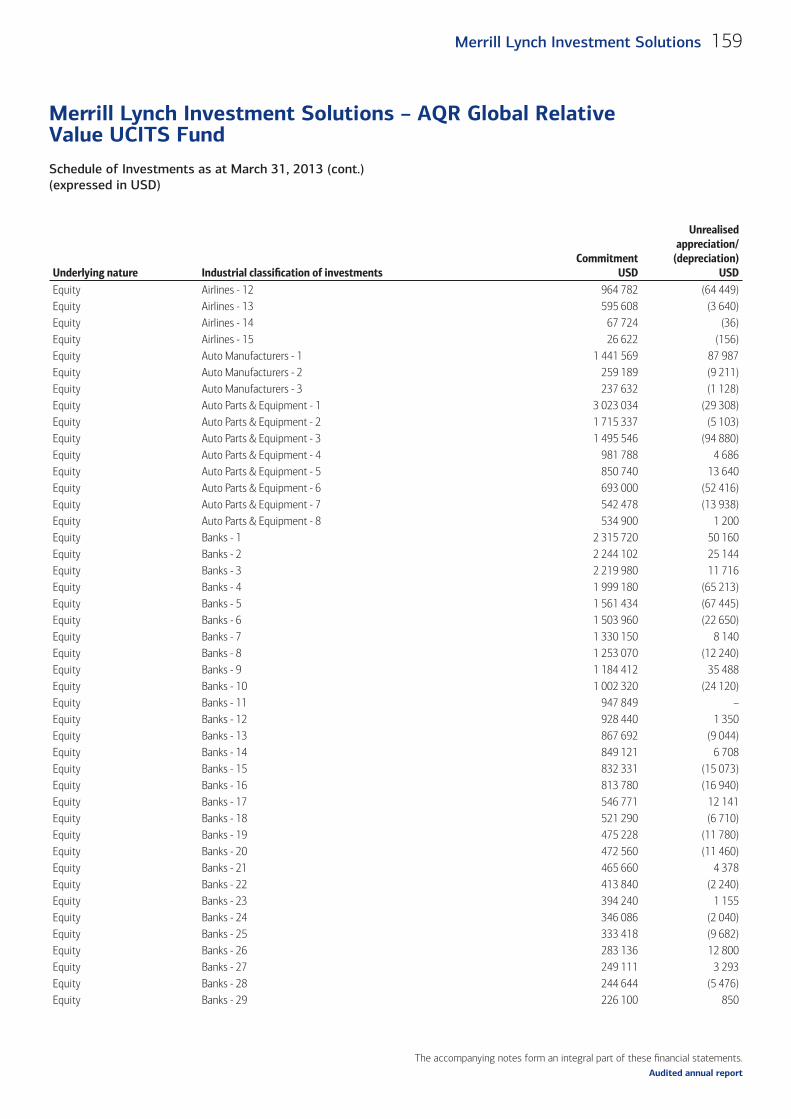
The accompanying notes form an integral part of these fi nancial statements.
Schedule of Investments as at March 31, 2013 (cont.)(expressed in USD)
Merrill Lynch Investment Solutions – AQR Global Relative Value UCITS Fund
159Merrill Lynch Investment Solutions
Audited annual report
Underlying nature Industrial classifi cation of investments Commitment
USD
Unrealised appreciation/
(depreciation)USD
Equity Airlines - 12 964 782 (64 449)Equity Airlines - 13 595 608 (3 640)Equity Airlines - 14 67 724 (36)Equity Airlines - 15 26 622 (156)Equity Auto Manufacturers - 1 1 441 569 87 987 Equity Auto Manufacturers - 2 259 189 (9 211)Equity Auto Manufacturers - 3 237 632 (1 128)Equity Auto Parts & Equipment - 1 3 023 034 (29 308)Equity Auto Parts & Equipment - 2 1 715 337 (5 103)Equity Auto Parts & Equipment - 3 1 495 546 (94 880)Equity Auto Parts & Equipment - 4 981 788 4 686 Equity Auto Parts & Equipment - 5 850 740 13 640 Equity Auto Parts & Equipment - 6 693 000 (52 416)Equity Auto Parts & Equipment - 7 542 478 (13 938)Equity Auto Parts & Equipment - 8 534 900 1 200 Equity Banks - 1 2 315 720 50 160 Equity Banks - 2 2 244 102 25 144 Equity Banks - 3 2 219 980 11 716 Equity Banks - 4 1 999 180 (65 213)Equity Banks - 5 1 561 434 (67 445)Equity Banks - 6 1 503 960 (22 650)Equity Banks - 7 1 330 150 8 140 Equity Banks - 8 1 253 070 (12 240)Equity Banks - 9 1 184 412 35 488 Equity Banks - 10 1 002 320 (24 120)Equity Banks - 11 947 849 – Equity Banks - 12 928 440 1 350 Equity Banks - 13 867 692 (9 044)Equity Banks - 14 849 121 6 708 Equity Banks - 15 832 331 (15 073)Equity Banks - 16 813 780 (16 940)Equity Banks - 17 546 771 12 141 Equity Banks - 18 521 290 (6 710)Equity Banks - 19 475 228 (11 780)Equity Banks - 20 472 560 (11 460)Equity Banks - 21 465 660 4 378 Equity Banks - 22 413 840 (2 240)Equity Banks - 23 394 240 1 155 Equity Banks - 24 346 086 (2 040)Equity Banks - 25 333 418 (9 682)Equity Banks - 26 283 136 12 800 Equity Banks - 27 249 111 3 293 Equity Banks - 28 244 644 (5 476)Equity Banks - 29 226 100 850
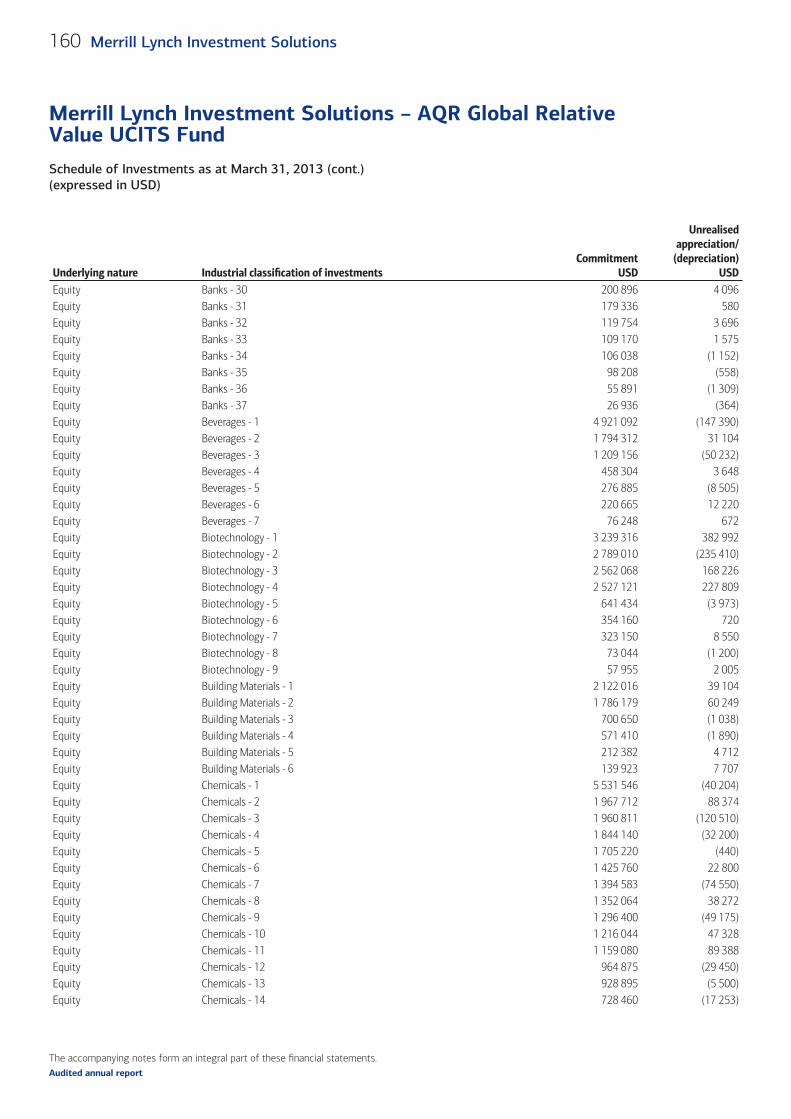
The accompanying notes form an integral part of these fi nancial statements.
Schedule of Investments as at March 31, 2013 (cont.)(expressed in USD)
Merrill Lynch Investment Solutions – AQR Global Relative Value UCITS Fund
160 Merrill Lynch Investment Solutions
Audited annual report
Underlying nature Industrial classifi cation of investments Commitment
USD
Unrealised appreciation/
(depreciation)USD
Equity Banks - 30 200 896 4 096 Equity Banks - 31 179 336 580 Equity Banks - 32 119 754 3 696 Equity Banks - 33 109 170 1 575 Equity Banks - 34 106 038 (1 152)Equity Banks - 35 98 208 (558)Equity Banks - 36 55 891 (1 309)Equity Banks - 37 26 936 (364)Equity Beverages - 1 4 921 092 (147 390)Equity Beverages - 2 1 794 312 31 104 Equity Beverages - 3 1 209 156 (50 232)Equity Beverages - 4 458 304 3 648 Equity Beverages - 5 276 885 (8 505)Equity Beverages - 6 220 665 12 220 Equity Beverages - 7 76 248 672 Equity Biotechnology - 1 3 239 316 382 992 Equity Biotechnology - 2 2 789 010 (235 410)Equity Biotechnology - 3 2 562 068 168 226 Equity Biotechnology - 4 2 527 121 227 809 Equity Biotechnology - 5 641 434 (3 973)Equity Biotechnology - 6 354 160 720 Equity Biotechnology - 7 323 150 8 550 Equity Biotechnology - 8 73 044 (1 200)Equity Biotechnology - 9 57 955 2 005 Equity Building Materials - 1 2 122 016 39 104 Equity Building Materials - 2 1 786 179 60 249 Equity Building Materials - 3 700 650 (1 038)Equity Building Materials - 4 571 410 (1 890)Equity Building Materials - 5 212 382 4 712 Equity Building Materials - 6 139 923 7 707 Equity Chemicals - 1 5 531 546 (40 204)Equity Chemicals - 2 1 967 712 88 374 Equity Chemicals - 3 1 960 811 (120 510)Equity Chemicals - 4 1 844 140 (32 200)Equity Chemicals - 5 1 705 220 (440)Equity Chemicals - 6 1 425 760 22 800 Equity Chemicals - 7 1 394 583 (74 550)Equity Chemicals - 8 1 352 064 38 272 Equity Chemicals - 9 1 296 400 (49 175)Equity Chemicals - 10 1 216 044 47 328 Equity Chemicals - 11 1 159 080 89 388 Equity Chemicals - 12 964 875 (29 450)Equity Chemicals - 13 928 895 (5 500)Equity Chemicals - 14 728 460 (17 253)
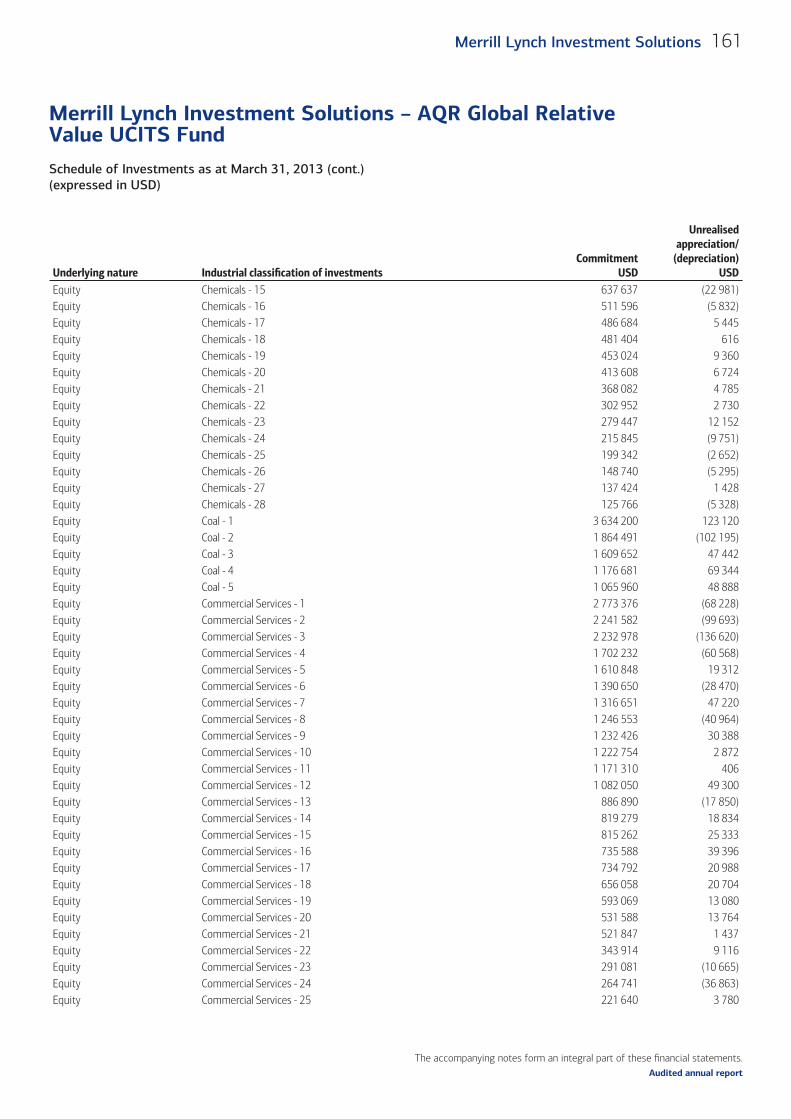
The accompanying notes form an integral part of these fi nancial statements.
Schedule of Investments as at March 31, 2013 (cont.)(expressed in USD)
Merrill Lynch Investment Solutions – AQR Global Relative Value UCITS Fund
161Merrill Lynch Investment Solutions
Audited annual report
Underlying nature Industrial classifi cation of investments Commitment
USD
Unrealised appreciation/
(depreciation)USD
Equity Chemicals - 15 637 637 (22 981)Equity Chemicals - 16 511 596 (5 832)Equity Chemicals - 17 486 684 5 445 Equity Chemicals - 18 481 404 616 Equity Chemicals - 19 453 024 9 360 Equity Chemicals - 20 413 608 6 724 Equity Chemicals - 21 368 082 4 785 Equity Chemicals - 22 302 952 2 730 Equity Chemicals - 23 279 447 12 152 Equity Chemicals - 24 215 845 (9 751)Equity Chemicals - 25 199 342 (2 652)Equity Chemicals - 26 148 740 (5 295)Equity Chemicals - 27 137 424 1 428 Equity Chemicals - 28 125 766 (5 328)Equity Coal - 1 3 634 200 123 120 Equity Coal - 2 1 864 491 (102 195)Equity Coal - 3 1 609 652 47 442 Equity Coal - 4 1 176 681 69 344 Equity Coal - 5 1 065 960 48 888 Equity Commercial Services - 1 2 773 376 (68 228)Equity Commercial Services - 2 2 241 582 (99 693)Equity Commercial Services - 3 2 232 978 (136 620)Equity Commercial Services - 4 1 702 232 (60 568)Equity Commercial Services - 5 1 610 848 19 312 Equity Commercial Services - 6 1 390 650 (28 470)Equity Commercial Services - 7 1 316 651 47 220 Equity Commercial Services - 8 1 246 553 (40 964)Equity Commercial Services - 9 1 232 426 30 388 Equity Commercial Services - 10 1 222 754 2 872 Equity Commercial Services - 11 1 171 310 406 Equity Commercial Services - 12 1 082 050 49 300 Equity Commercial Services - 13 886 890 (17 850)Equity Commercial Services - 14 819 279 18 834 Equity Commercial Services - 15 815 262 25 333 Equity Commercial Services - 16 735 588 39 396 Equity Commercial Services - 17 734 792 20 988 Equity Commercial Services - 18 656 058 20 704 Equity Commercial Services - 19 593 069 13 080 Equity Commercial Services - 20 531 588 13 764 Equity Commercial Services - 21 521 847 1 437 Equity Commercial Services - 22 343 914 9 116 Equity Commercial Services - 23 291 081 (10 665)Equity Commercial Services - 24 264 741 (36 863)Equity Commercial Services - 25 221 640 3 780
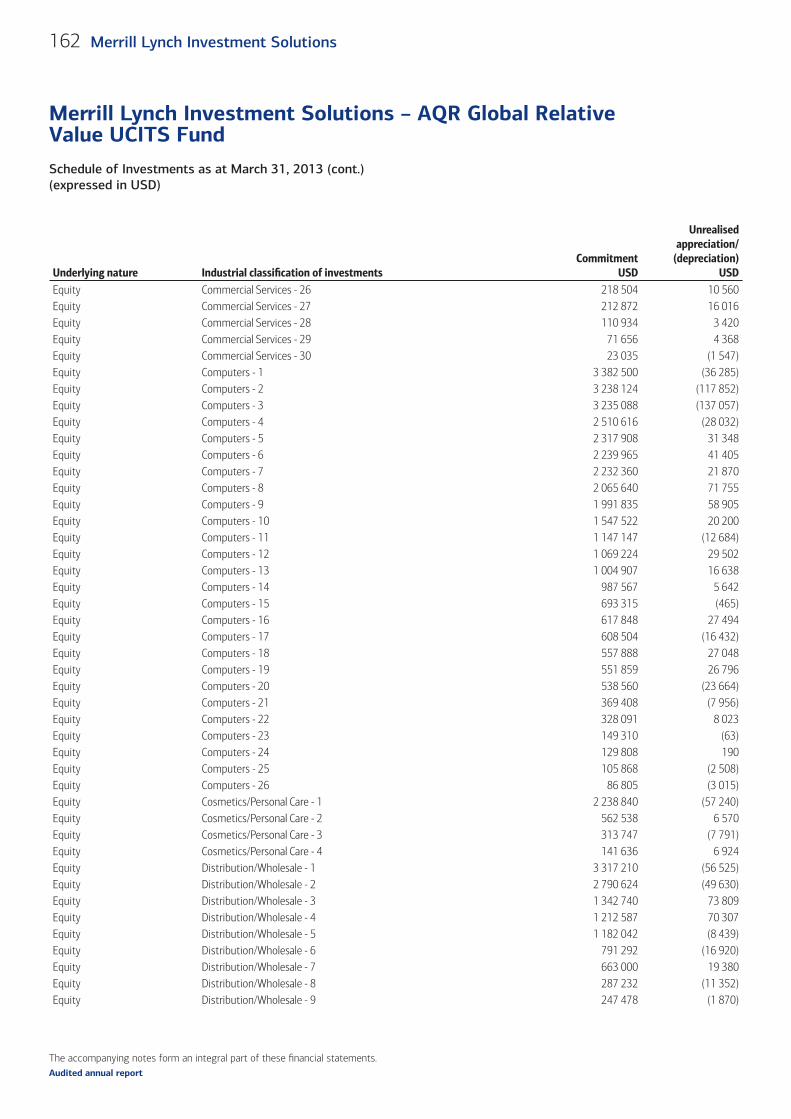
The accompanying notes form an integral part of these fi nancial statements.
Schedule of Investments as at March 31, 2013 (cont.)(expressed in USD)
Merrill Lynch Investment Solutions – AQR Global Relative Value UCITS Fund
162 Merrill Lynch Investment Solutions
Audited annual report
Underlying nature Industrial classifi cation of investments Commitment
USD
Unrealised appreciation/
(depreciation)USD
Equity Commercial Services - 26 218 504 10 560 Equity Commercial Services - 27 212 872 16 016 Equity Commercial Services - 28 110 934 3 420 Equity Commercial Services - 29 71 656 4 368 Equity Commercial Services - 30 23 035 (1 547)Equity Computers - 1 3 382 500 (36 285)Equity Computers - 2 3 238 124 (117 852)Equity Computers - 3 3 235 088 (137 057)Equity Computers - 4 2 510 616 (28 032)Equity Computers - 5 2 317 908 31 348 Equity Computers - 6 2 239 965 41 405 Equity Computers - 7 2 232 360 21 870 Equity Computers - 8 2 065 640 71 755 Equity Computers - 9 1 991 835 58 905 Equity Computers - 10 1 547 522 20 200 Equity Computers - 11 1 147 147 (12 684)Equity Computers - 12 1 069 224 29 502 Equity Computers - 13 1 004 907 16 638 Equity Computers - 14 987 567 5 642 Equity Computers - 15 693 315 (465)Equity Computers - 16 617 848 27 494 Equity Computers - 17 608 504 (16 432)Equity Computers - 18 557 888 27 048 Equity Computers - 19 551 859 26 796 Equity Computers - 20 538 560 (23 664)Equity Computers - 21 369 408 (7 956)Equity Computers - 22 328 091 8 023 Equity Computers - 23 149 310 (63)Equity Computers - 24 129 808 190 Equity Computers - 25 105 868 (2 508)Equity Computers - 26 86 805 (3 015)Equity Cosmetics/Personal Care - 1 2 238 840 (57 240)Equity Cosmetics/Personal Care - 2 562 538 6 570 Equity Cosmetics/Personal Care - 3 313 747 (7 791)Equity Cosmetics/Personal Care - 4 141 636 6 924 Equity Distribution/Wholesale - 1 3 317 210 (56 525)Equity Distribution/Wholesale - 2 2 790 624 (49 630)Equity Distribution/Wholesale - 3 1 342 740 73 809 Equity Distribution/Wholesale - 4 1 212 587 70 307 Equity Distribution/Wholesale - 5 1 182 042 (8 439)Equity Distribution/Wholesale - 6 791 292 (16 920)Equity Distribution/Wholesale - 7 663 000 19 380 Equity Distribution/Wholesale - 8 287 232 (11 352)Equity Distribution/Wholesale - 9 247 478 (1 870)
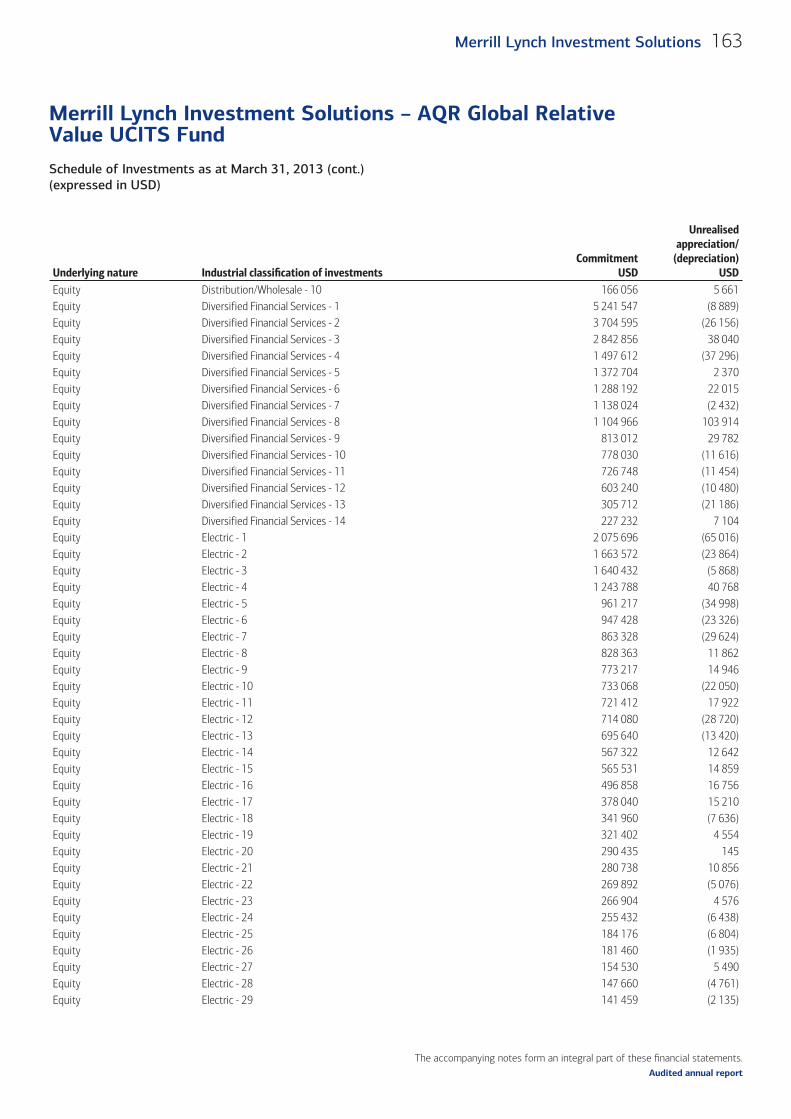
The accompanying notes form an integral part of these fi nancial statements.
Schedule of Investments as at March 31, 2013 (cont.)(expressed in USD)
Merrill Lynch Investment Solutions – AQR Global Relative Value UCITS Fund
163Merrill Lynch Investment Solutions
Audited annual report
Underlying nature Industrial classifi cation of investments Commitment
USD
Unrealised appreciation/
(depreciation)USD
Equity Distribution/Wholesale - 10 166 056 5 661 Equity Diversified Financial Services - 1 5 241 547 (8 889)Equity Diversified Financial Services - 2 3 704 595 (26 156)Equity Diversified Financial Services - 3 2 842 856 38 040 Equity Diversified Financial Services - 4 1 497 612 (37 296)Equity Diversified Financial Services - 5 1 372 704 2 370 Equity Diversified Financial Services - 6 1 288 192 22 015 Equity Diversified Financial Services - 7 1 138 024 (2 432)Equity Diversified Financial Services - 8 1 104 966 103 914 Equity Diversified Financial Services - 9 813 012 29 782 Equity Diversified Financial Services - 10 778 030 (11 616)Equity Diversified Financial Services - 11 726 748 (11 454)Equity Diversified Financial Services - 12 603 240 (10 480)Equity Diversified Financial Services - 13 305 712 (21 186)Equity Diversified Financial Services - 14 227 232 7 104 Equity Electric - 1 2 075 696 (65 016)Equity Electric - 2 1 663 572 (23 864)Equity Electric - 3 1 640 432 (5 868)Equity Electric - 4 1 243 788 40 768 Equity Electric - 5 961 217 (34 998)Equity Electric - 6 947 428 (23 326)Equity Electric - 7 863 328 (29 624)Equity Electric - 8 828 363 11 862 Equity Electric - 9 773 217 14 946 Equity Electric - 10 733 068 (22 050)Equity Electric - 11 721 412 17 922 Equity Electric - 12 714 080 (28 720)Equity Electric - 13 695 640 (13 420)Equity Electric - 14 567 322 12 642 Equity Electric - 15 565 531 14 859 Equity Electric - 16 496 858 16 756 Equity Electric - 17 378 040 15 210 Equity Electric - 18 341 960 (7 636)Equity Electric - 19 321 402 4 554 Equity Electric - 20 290 435 145 Equity Electric - 21 280 738 10 856 Equity Electric - 22 269 892 (5 076)Equity Electric - 23 266 904 4 576 Equity Electric - 24 255 432 (6 438)Equity Electric - 25 184 176 (6 804)Equity Electric - 26 181 460 (1 935)Equity Electric - 27 154 530 5 490 Equity Electric - 28 147 660 (4 761)Equity Electric - 29 141 459 (2 135)
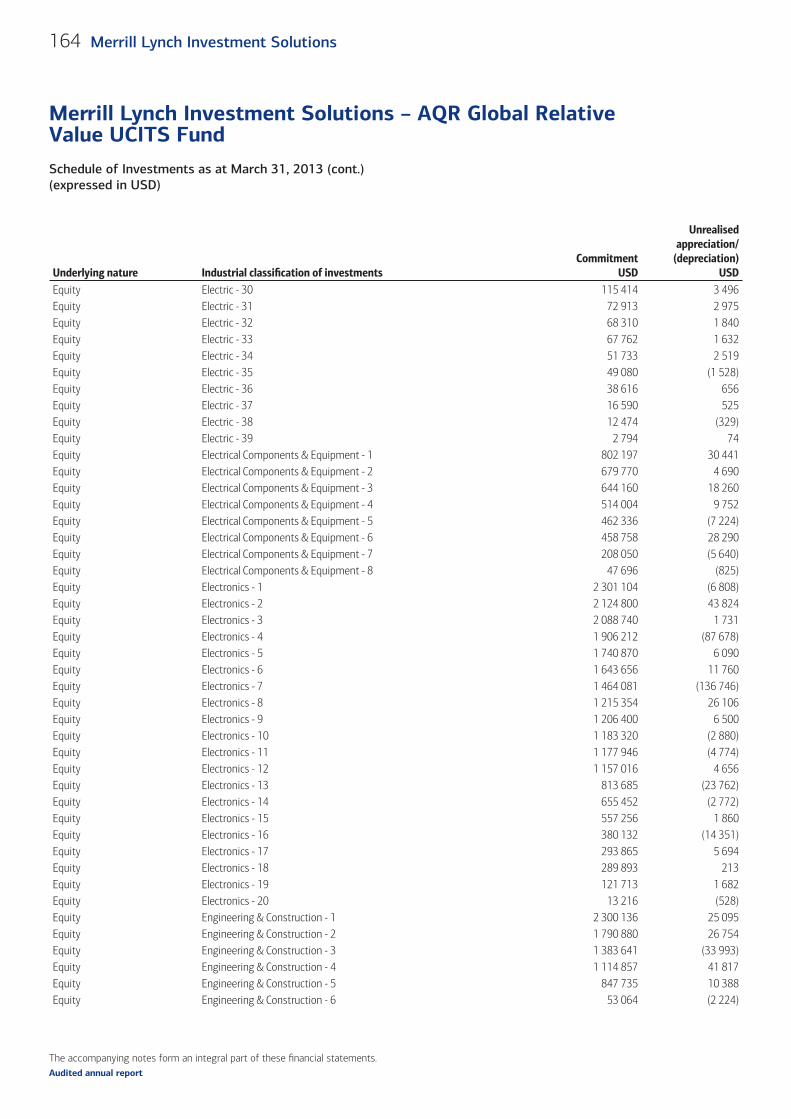
The accompanying notes form an integral part of these fi nancial statements.
Schedule of Investments as at March 31, 2013 (cont.)(expressed in USD)
Merrill Lynch Investment Solutions – AQR Global Relative Value UCITS Fund
164 Merrill Lynch Investment Solutions
Audited annual report
Underlying nature Industrial classifi cation of investments Commitment
USD
Unrealised appreciation/
(depreciation)USD
Equity Electric - 30 115 414 3 496 Equity Electric - 31 72 913 2 975 Equity Electric - 32 68 310 1 840 Equity Electric - 33 67 762 1 632 Equity Electric - 34 51 733 2 519 Equity Electric - 35 49 080 (1 528)Equity Electric - 36 38 616 656 Equity Electric - 37 16 590 525 Equity Electric - 38 12 474 (329)Equity Electric - 39 2 794 74 Equity Electrical Components & Equipment - 1 802 197 30 441 Equity Electrical Components & Equipment - 2 679 770 4 690 Equity Electrical Components & Equipment - 3 644 160 18 260 Equity Electrical Components & Equipment - 4 514 004 9 752 Equity Electrical Components & Equipment - 5 462 336 (7 224)Equity Electrical Components & Equipment - 6 458 758 28 290 Equity Electrical Components & Equipment - 7 208 050 (5 640)Equity Electrical Components & Equipment - 8 47 696 (825)Equity Electronics - 1 2 301 104 (6 808)Equity Electronics - 2 2 124 800 43 824 Equity Electronics - 3 2 088 740 1 731 Equity Electronics - 4 1 906 212 (87 678)Equity Electronics - 5 1 740 870 6 090 Equity Electronics - 6 1 643 656 11 760 Equity Electronics - 7 1 464 081 (136 746)Equity Electronics - 8 1 215 354 26 106 Equity Electronics - 9 1 206 400 6 500 Equity Electronics - 10 1 183 320 (2 880)Equity Electronics - 11 1 177 946 (4 774)Equity Electronics - 12 1 157 016 4 656 Equity Electronics - 13 813 685 (23 762)Equity Electronics - 14 655 452 (2 772)Equity Electronics - 15 557 256 1 860 Equity Electronics - 16 380 132 (14 351)Equity Electronics - 17 293 865 5 694 Equity Electronics - 18 289 893 213 Equity Electronics - 19 121 713 1 682 Equity Electronics - 20 13 216 (528)Equity Engineering & Construction - 1 2 300 136 25 095 Equity Engineering & Construction - 2 1 790 880 26 754 Equity Engineering & Construction - 3 1 383 641 (33 993)Equity Engineering & Construction - 4 1 114 857 41 817 Equity Engineering & Construction - 5 847 735 10 388 Equity Engineering & Construction - 6 53 064 (2 224)
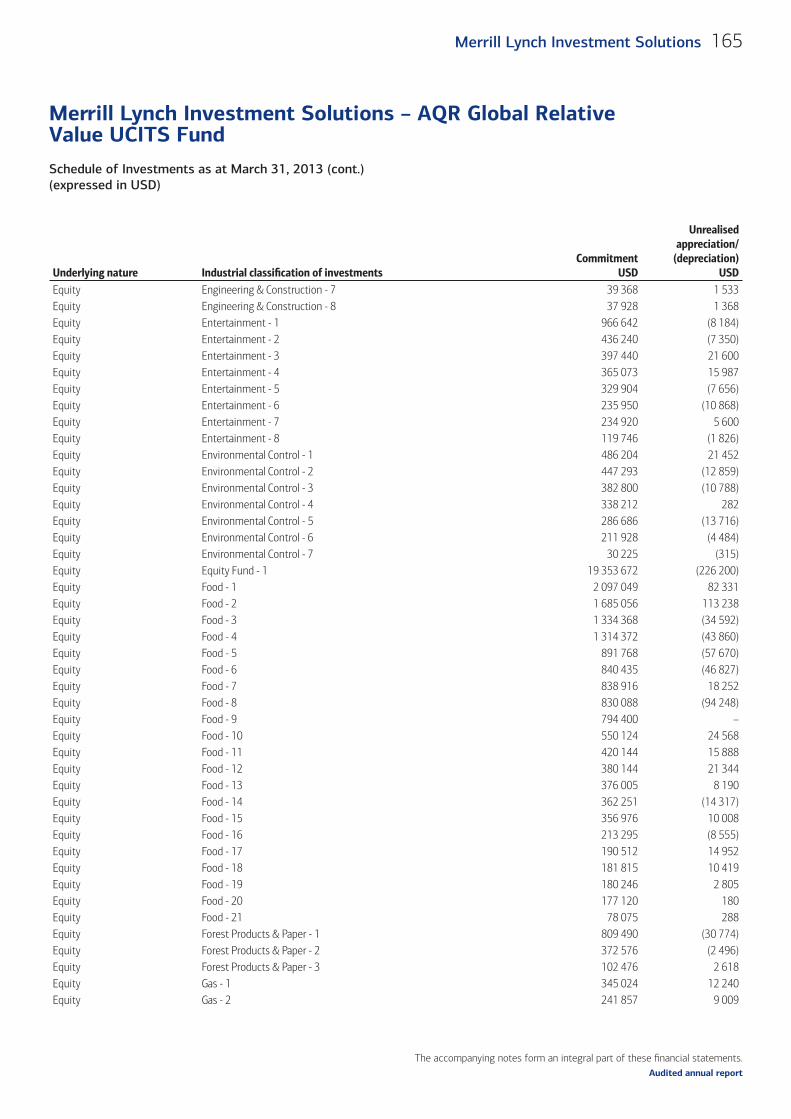
The accompanying notes form an integral part of these fi nancial statements.
Schedule of Investments as at March 31, 2013 (cont.)(expressed in USD)
Merrill Lynch Investment Solutions – AQR Global Relative Value UCITS Fund
165Merrill Lynch Investment Solutions
Audited annual report
Underlying nature Industrial classifi cation of investments Commitment
USD
Unrealised appreciation/
(depreciation)USD
Equity Engineering & Construction - 7 39 368 1 533 Equity Engineering & Construction - 8 37 928 1 368 Equity Entertainment - 1 966 642 (8 184)Equity Entertainment - 2 436 240 (7 350)Equity Entertainment - 3 397 440 21 600 Equity Entertainment - 4 365 073 15 987 Equity Entertainment - 5 329 904 (7 656)Equity Entertainment - 6 235 950 (10 868)Equity Entertainment - 7 234 920 5 600 Equity Entertainment - 8 119 746 (1 826)Equity Environmental Control - 1 486 204 21 452 Equity Environmental Control - 2 447 293 (12 859)Equity Environmental Control - 3 382 800 (10 788)Equity Environmental Control - 4 338 212 282 Equity Environmental Control - 5 286 686 (13 716)Equity Environmental Control - 6 211 928 (4 484)Equity Environmental Control - 7 30 225 (315)Equity Equity Fund - 1 19 353 672 (226 200)Equity Food - 1 2 097 049 82 331 Equity Food - 2 1 685 056 113 238 Equity Food - 3 1 334 368 (34 592)Equity Food - 4 1 314 372 (43 860)Equity Food - 5 891 768 (57 670)Equity Food - 6 840 435 (46 827)Equity Food - 7 838 916 18 252 Equity Food - 8 830 088 (94 248)Equity Food - 9 794 400 – Equity Food - 10 550 124 24 568 Equity Food - 11 420 144 15 888 Equity Food - 12 380 144 21 344 Equity Food - 13 376 005 8 190 Equity Food - 14 362 251 (14 317)Equity Food - 15 356 976 10 008 Equity Food - 16 213 295 (8 555)Equity Food - 17 190 512 14 952 Equity Food - 18 181 815 10 419 Equity Food - 19 180 246 2 805 Equity Food - 20 177 120 180 Equity Food - 21 78 075 288 Equity Forest Products & Paper - 1 809 490 (30 774)Equity Forest Products & Paper - 2 372 576 (2 496)Equity Forest Products & Paper - 3 102 476 2 618 Equity Gas - 1 345 024 12 240 Equity Gas - 2 241 857 9 009
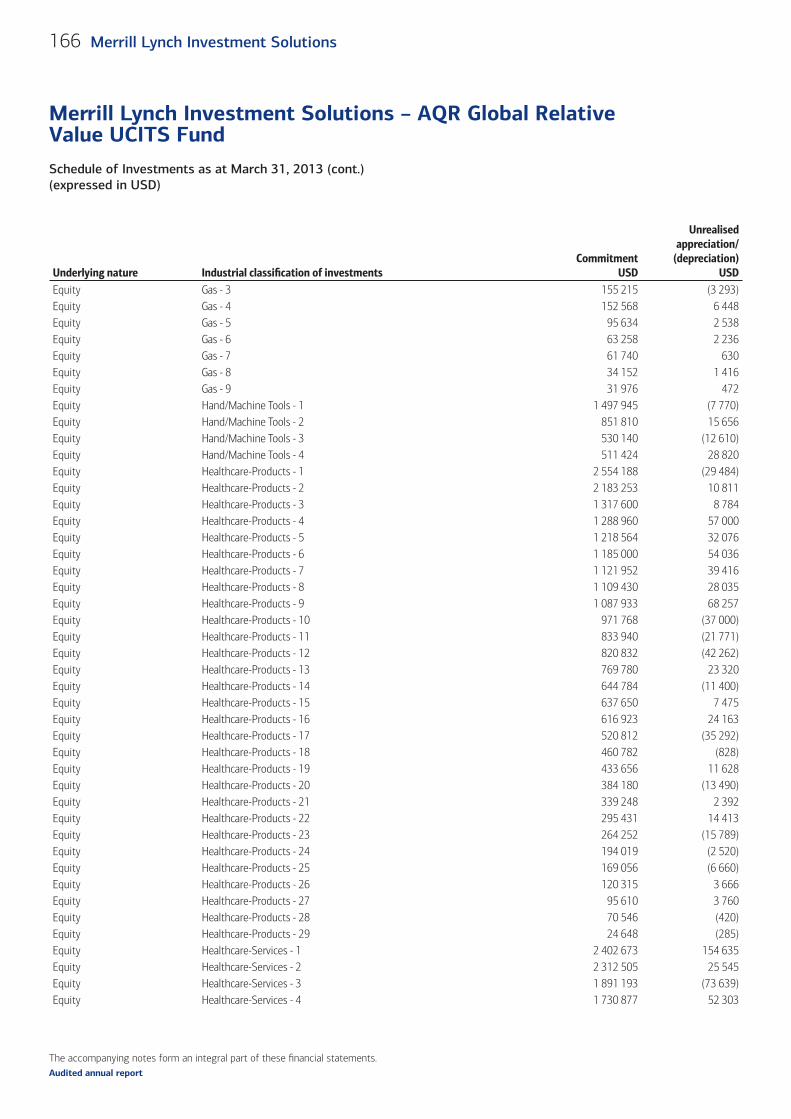
The accompanying notes form an integral part of these fi nancial statements.
Schedule of Investments as at March 31, 2013 (cont.)(expressed in USD)
Merrill Lynch Investment Solutions – AQR Global Relative Value UCITS Fund
166 Merrill Lynch Investment Solutions
Audited annual report
Underlying nature Industrial classifi cation of investments Commitment
USD
Unrealised appreciation/
(depreciation)USD
Equity Gas - 3 155 215 (3 293)Equity Gas - 4 152 568 6 448 Equity Gas - 5 95 634 2 538 Equity Gas - 6 63 258 2 236 Equity Gas - 7 61 740 630 Equity Gas - 8 34 152 1 416 Equity Gas - 9 31 976 472 Equity Hand/Machine Tools - 1 1 497 945 (7 770)Equity Hand/Machine Tools - 2 851 810 15 656 Equity Hand/Machine Tools - 3 530 140 (12 610)Equity Hand/Machine Tools - 4 511 424 28 820 Equity Healthcare-Products - 1 2 554 188 (29 484)Equity Healthcare-Products - 2 2 183 253 10 811 Equity Healthcare-Products - 3 1 317 600 8 784 Equity Healthcare-Products - 4 1 288 960 57 000 Equity Healthcare-Products - 5 1 218 564 32 076 Equity Healthcare-Products - 6 1 185 000 54 036 Equity Healthcare-Products - 7 1 121 952 39 416 Equity Healthcare-Products - 8 1 109 430 28 035 Equity Healthcare-Products - 9 1 087 933 68 257 Equity Healthcare-Products - 10 971 768 (37 000)Equity Healthcare-Products - 11 833 940 (21 771)Equity Healthcare-Products - 12 820 832 (42 262)Equity Healthcare-Products - 13 769 780 23 320 Equity Healthcare-Products - 14 644 784 (11 400)Equity Healthcare-Products - 15 637 650 7 475 Equity Healthcare-Products - 16 616 923 24 163 Equity Healthcare-Products - 17 520 812 (35 292)Equity Healthcare-Products - 18 460 782 (828)Equity Healthcare-Products - 19 433 656 11 628 Equity Healthcare-Products - 20 384 180 (13 490)Equity Healthcare-Products - 21 339 248 2 392 Equity Healthcare-Products - 22 295 431 14 413 Equity Healthcare-Products - 23 264 252 (15 789)Equity Healthcare-Products - 24 194 019 (2 520)Equity Healthcare-Products - 25 169 056 (6 660)Equity Healthcare-Products - 26 120 315 3 666 Equity Healthcare-Products - 27 95 610 3 760 Equity Healthcare-Products - 28 70 546 (420)Equity Healthcare-Products - 29 24 648 (285)Equity Healthcare-Services - 1 2 402 673 154 635 Equity Healthcare-Services - 2 2 312 505 25 545 Equity Healthcare-Services - 3 1 891 193 (73 639)Equity Healthcare-Services - 4 1 730 877 52 303
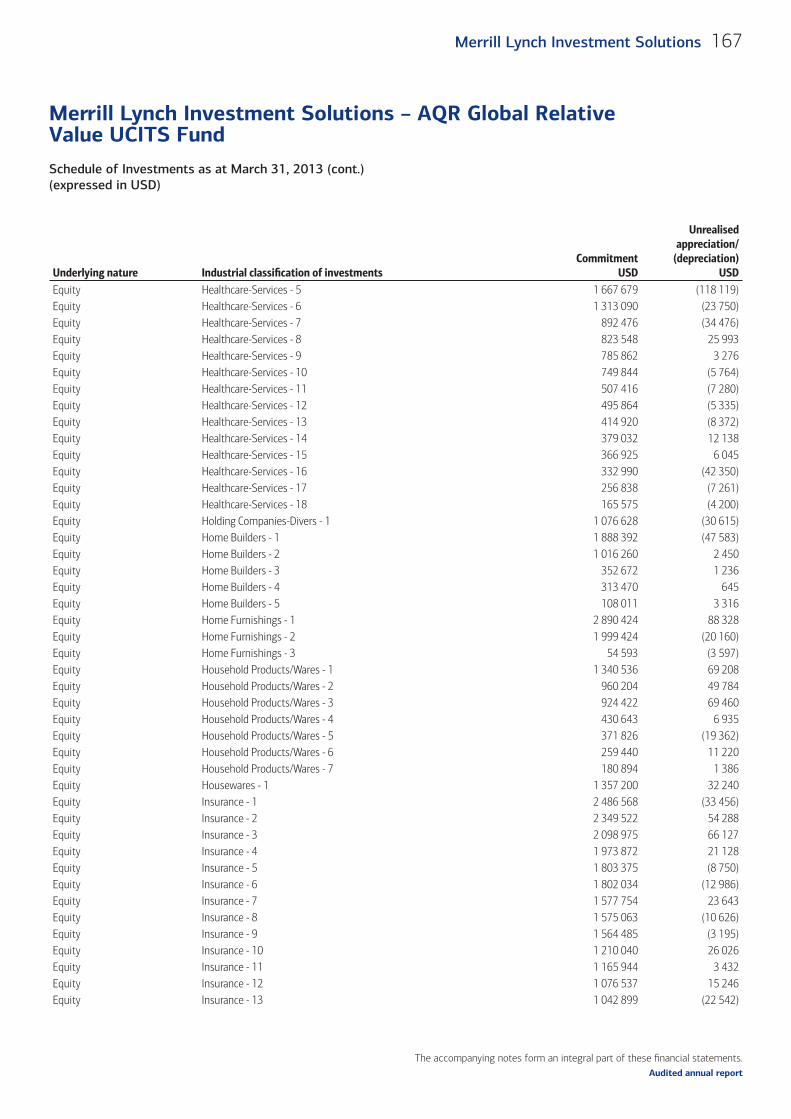
The accompanying notes form an integral part of these fi nancial statements.
Schedule of Investments as at March 31, 2013 (cont.)(expressed in USD)
Merrill Lynch Investment Solutions – AQR Global Relative Value UCITS Fund
167Merrill Lynch Investment Solutions
Audited annual report
Underlying nature Industrial classifi cation of investments Commitment
USD
Unrealised appreciation/
(depreciation)USD
Equity Healthcare-Services - 5 1 667 679 (118 119)Equity Healthcare-Services - 6 1 313 090 (23 750)Equity Healthcare-Services - 7 892 476 (34 476)Equity Healthcare-Services - 8 823 548 25 993 Equity Healthcare-Services - 9 785 862 3 276 Equity Healthcare-Services - 10 749 844 (5 764)Equity Healthcare-Services - 11 507 416 (7 280)Equity Healthcare-Services - 12 495 864 (5 335)Equity Healthcare-Services - 13 414 920 (8 372)Equity Healthcare-Services - 14 379 032 12 138 Equity Healthcare-Services - 15 366 925 6 045 Equity Healthcare-Services - 16 332 990 (42 350)Equity Healthcare-Services - 17 256 838 (7 261)Equity Healthcare-Services - 18 165 575 (4 200)Equity Holding Companies-Divers - 1 1 076 628 (30 615)Equity Home Builders - 1 1 888 392 (47 583)Equity Home Builders - 2 1 016 260 2 450 Equity Home Builders - 3 352 672 1 236 Equity Home Builders - 4 313 470 645 Equity Home Builders - 5 108 011 3 316 Equity Home Furnishings - 1 2 890 424 88 328 Equity Home Furnishings - 2 1 999 424 (20 160)Equity Home Furnishings - 3 54 593 (3 597)Equity Household Products/Wares - 1 1 340 536 69 208 Equity Household Products/Wares - 2 960 204 49 784 Equity Household Products/Wares - 3 924 422 69 460 Equity Household Products/Wares - 4 430 643 6 935 Equity Household Products/Wares - 5 371 826 (19 362)Equity Household Products/Wares - 6 259 440 11 220 Equity Household Products/Wares - 7 180 894 1 386 Equity Housewares - 1 1 357 200 32 240 Equity Insurance - 1 2 486 568 (33 456)Equity Insurance - 2 2 349 522 54 288 Equity Insurance - 3 2 098 975 66 127 Equity Insurance - 4 1 973 872 21 128 Equity Insurance - 5 1 803 375 (8 750)Equity Insurance - 6 1 802 034 (12 986)Equity Insurance - 7 1 577 754 23 643 Equity Insurance - 8 1 575 063 (10 626)Equity Insurance - 9 1 564 485 (3 195)Equity Insurance - 10 1 210 040 26 026 Equity Insurance - 11 1 165 944 3 432 Equity Insurance - 12 1 076 537 15 246 Equity Insurance - 13 1 042 899 (22 542)

The accompanying notes form an integral part of these fi nancial statements.
Schedule of Investments as at March 31, 2013 (cont.)(expressed in USD)
Merrill Lynch Investment Solutions – AQR Global Relative Value UCITS Fund
168 Merrill Lynch Investment Solutions
Audited annual report
Underlying nature Industrial classifi cation of investments Commitment
USD
Unrealised appreciation/
(depreciation)USD
Equity Insurance - 14 1 030 342 30 623 Equity Insurance - 15 940 612 13 560 Equity Insurance - 16 879 000 (38 676)Equity Insurance - 17 823 526 (9 196)Equity Insurance - 18 695 400 25 275 Equity Insurance - 19 618 372 18 335 Equity Insurance - 20 589 900 4 100 Equity Insurance - 21 553 850 5 016 Equity Insurance - 22 544 180 10 374 Equity Insurance - 23 515 235 12 705 Equity Insurance - 24 483 644 (8 832)Equity Insurance - 25 456 289 (9 334)Equity Insurance - 26 433 440 2 016 Equity Insurance - 27 360 715 11 115 Equity Insurance - 28 317 952 27 264 Equity Insurance - 29 279 247 (1 475)Equity Insurance - 30 231 165 5 005 Equity Insurance - 31 218 894 4 316 Equity Insurance - 32 196 800 8 128 Equity Insurance - 33 174 781 2 337 Equity Insurance - 34 141 288 (6 832)Equity Insurance - 35 103 275 4 300 Equity Insurance - 36 57 681 1 872 Equity Insurance - 37 26 010 (900)Equity Internet - 1 4 800 120 310 080 Equity Internet - 2 2 803 648 19 312 Equity Internet - 3 2 357 779 (109 000)Equity Internet - 4 1 877 856 66 960 Equity Internet - 5 1 733 584 61 692 Equity Internet - 6 1 728 288 (127 584)Equity Internet - 7 1 051 144 13 688 Equity Internet - 8 879 417 28 380 Equity Internet - 9 756 723 9 768 Equity Internet - 10 700 335 13 509 Equity Internet - 11 676 104 (29 315)Equity Internet - 12 340 938 (6 876)Equity Internet - 13 317 612 5 504 Equity Internet - 14 203 401 12 300 Equity Internet - 15 59 642 (4 521)Equity Investment Companies - 1 296 840 984 Equity Iron/Steel - 1 3 049 204 442 704 Equity Iron/Steel - 2 2 313 025 70 525 Equity Iron/Steel - 3 2 159 907 68 050 Equity Iron/Steel - 4 1 431 255 (27 993)
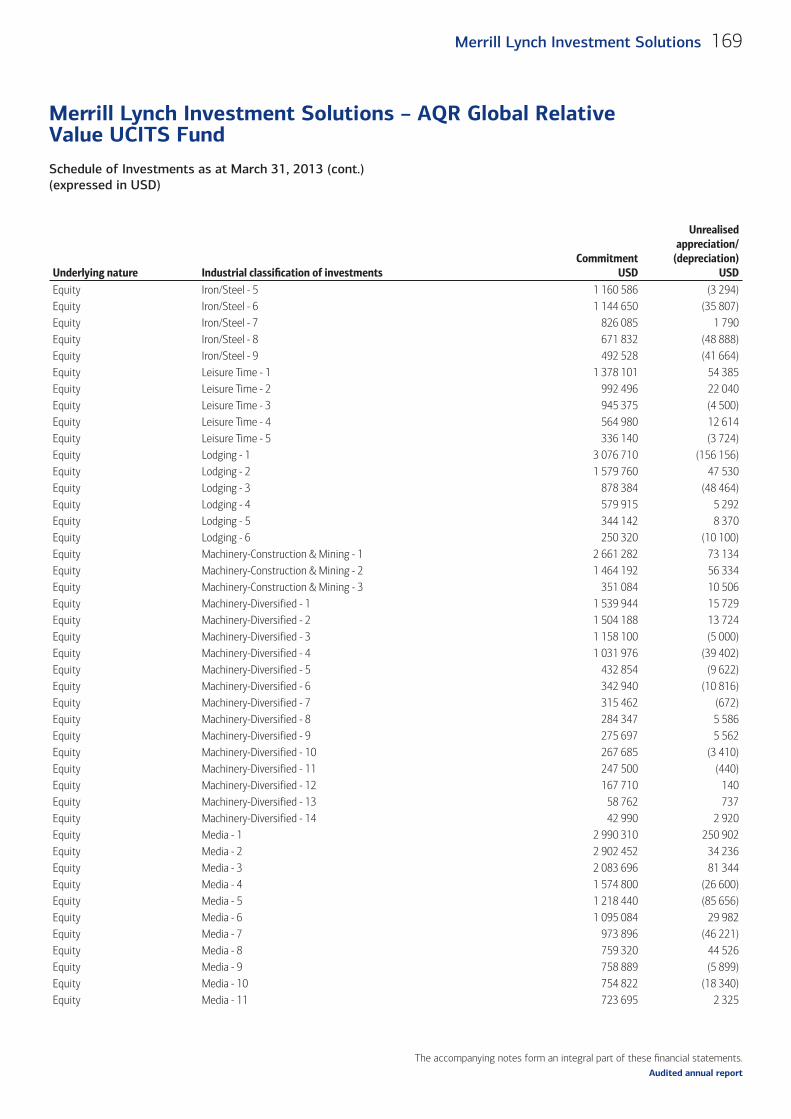
The accompanying notes form an integral part of these fi nancial statements.
Schedule of Investments as at March 31, 2013 (cont.)(expressed in USD)
Merrill Lynch Investment Solutions – AQR Global Relative Value UCITS Fund
169Merrill Lynch Investment Solutions
Audited annual report
Underlying nature Industrial classifi cation of investments Commitment
USD
Unrealised appreciation/
(depreciation)USD
Equity Iron/Steel - 5 1 160 586 (3 294)Equity Iron/Steel - 6 1 144 650 (35 807)Equity Iron/Steel - 7 826 085 1 790 Equity Iron/Steel - 8 671 832 (48 888)Equity Iron/Steel - 9 492 528 (41 664)Equity Leisure Time - 1 1 378 101 54 385 Equity Leisure Time - 2 992 496 22 040 Equity Leisure Time - 3 945 375 (4 500)Equity Leisure Time - 4 564 980 12 614 Equity Leisure Time - 5 336 140 (3 724)Equity Lodging - 1 3 076 710 (156 156)Equity Lodging - 2 1 579 760 47 530 Equity Lodging - 3 878 384 (48 464)Equity Lodging - 4 579 915 5 292 Equity Lodging - 5 344 142 8 370 Equity Lodging - 6 250 320 (10 100)Equity Machinery-Construction & Mining - 1 2 661 282 73 134 Equity Machinery-Construction & Mining - 2 1 464 192 56 334 Equity Machinery-Construction & Mining - 3 351 084 10 506 Equity Machinery-Diversified - 1 1 539 944 15 729 Equity Machinery-Diversified - 2 1 504 188 13 724 Equity Machinery-Diversified - 3 1 158 100 (5 000)Equity Machinery-Diversified - 4 1 031 976 (39 402)Equity Machinery-Diversified - 5 432 854 (9 622)Equity Machinery-Diversified - 6 342 940 (10 816)Equity Machinery-Diversified - 7 315 462 (672)Equity Machinery-Diversified - 8 284 347 5 586 Equity Machinery-Diversified - 9 275 697 5 562 Equity Machinery-Diversified - 10 267 685 (3 410)Equity Machinery-Diversified - 11 247 500 (440)Equity Machinery-Diversified - 12 167 710 140 Equity Machinery-Diversified - 13 58 762 737 Equity Machinery-Diversified - 14 42 990 2 920 Equity Media - 1 2 990 310 250 902 Equity Media - 2 2 902 452 34 236 Equity Media - 3 2 083 696 81 344 Equity Media - 4 1 574 800 (26 600)Equity Media - 5 1 218 440 (85 656)Equity Media - 6 1 095 084 29 982 Equity Media - 7 973 896 (46 221)Equity Media - 8 759 320 44 526 Equity Media - 9 758 889 (5 899)Equity Media - 10 754 822 (18 340)Equity Media - 11 723 695 2 325
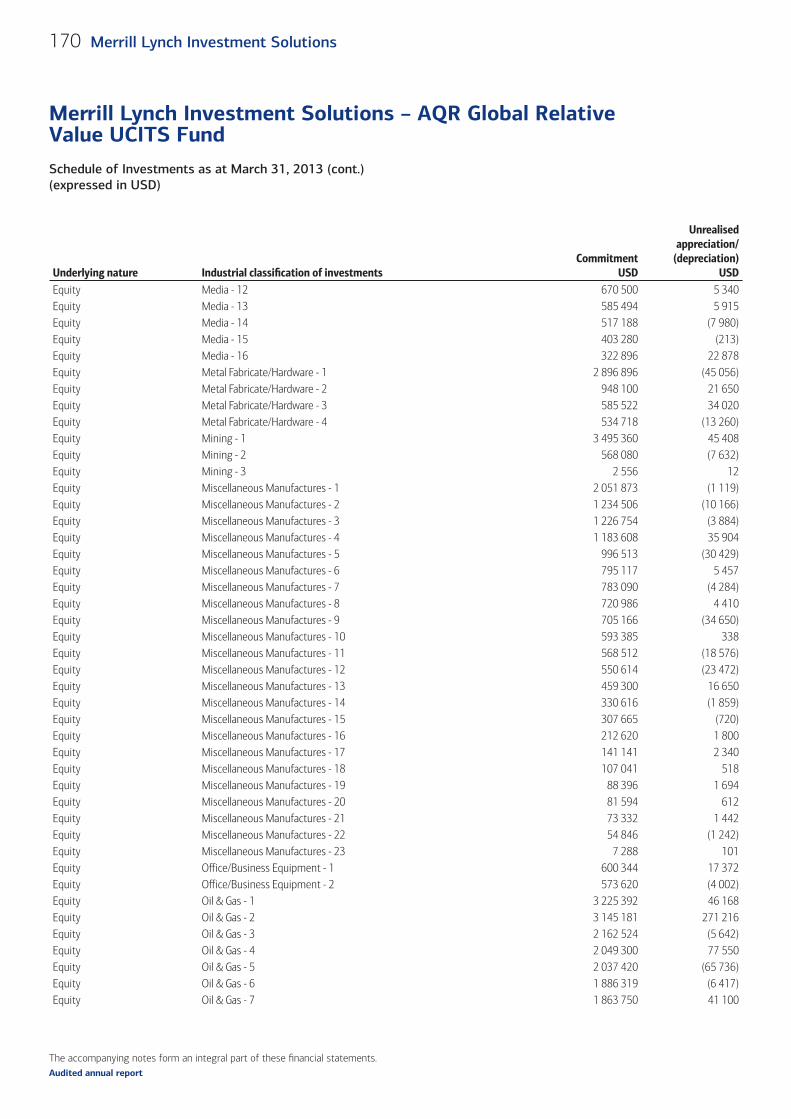
The accompanying notes form an integral part of these fi nancial statements.
Schedule of Investments as at March 31, 2013 (cont.)(expressed in USD)
Merrill Lynch Investment Solutions – AQR Global Relative Value UCITS Fund
170 Merrill Lynch Investment Solutions
Audited annual report
Underlying nature Industrial classifi cation of investments Commitment
USD
Unrealised appreciation/
(depreciation)USD
Equity Media - 12 670 500 5 340 Equity Media - 13 585 494 5 915 Equity Media - 14 517 188 (7 980)Equity Media - 15 403 280 (213)Equity Media - 16 322 896 22 878 Equity Metal Fabricate/Hardware - 1 2 896 896 (45 056)Equity Metal Fabricate/Hardware - 2 948 100 21 650 Equity Metal Fabricate/Hardware - 3 585 522 34 020 Equity Metal Fabricate/Hardware - 4 534 718 (13 260)Equity Mining - 1 3 495 360 45 408 Equity Mining - 2 568 080 (7 632)Equity Mining - 3 2 556 12 Equity Miscellaneous Manufactures - 1 2 051 873 (1 119)Equity Miscellaneous Manufactures - 2 1 234 506 (10 166)Equity Miscellaneous Manufactures - 3 1 226 754 (3 884)Equity Miscellaneous Manufactures - 4 1 183 608 35 904 Equity Miscellaneous Manufactures - 5 996 513 (30 429)Equity Miscellaneous Manufactures - 6 795 117 5 457 Equity Miscellaneous Manufactures - 7 783 090 (4 284)Equity Miscellaneous Manufactures - 8 720 986 4 410 Equity Miscellaneous Manufactures - 9 705 166 (34 650)Equity Miscellaneous Manufactures - 10 593 385 338 Equity Miscellaneous Manufactures - 11 568 512 (18 576)Equity Miscellaneous Manufactures - 12 550 614 (23 472)Equity Miscellaneous Manufactures - 13 459 300 16 650 Equity Miscellaneous Manufactures - 14 330 616 (1 859)Equity Miscellaneous Manufactures - 15 307 665 (720)Equity Miscellaneous Manufactures - 16 212 620 1 800 Equity Miscellaneous Manufactures - 17 141 141 2 340 Equity Miscellaneous Manufactures - 18 107 041 518 Equity Miscellaneous Manufactures - 19 88 396 1 694 Equity Miscellaneous Manufactures - 20 81 594 612 Equity Miscellaneous Manufactures - 21 73 332 1 442 Equity Miscellaneous Manufactures - 22 54 846 (1 242)Equity Miscellaneous Manufactures - 23 7 288 101 Equity Office/Business Equipment - 1 600 344 17 372 Equity Office/Business Equipment - 2 573 620 (4 002)Equity Oil & Gas - 1 3 225 392 46 168 Equity Oil & Gas - 2 3 145 181 271 216 Equity Oil & Gas - 3 2 162 524 (5 642)Equity Oil & Gas - 4 2 049 300 77 550 Equity Oil & Gas - 5 2 037 420 (65 736)Equity Oil & Gas - 6 1 886 319 (6 417)Equity Oil & Gas - 7 1 863 750 41 100
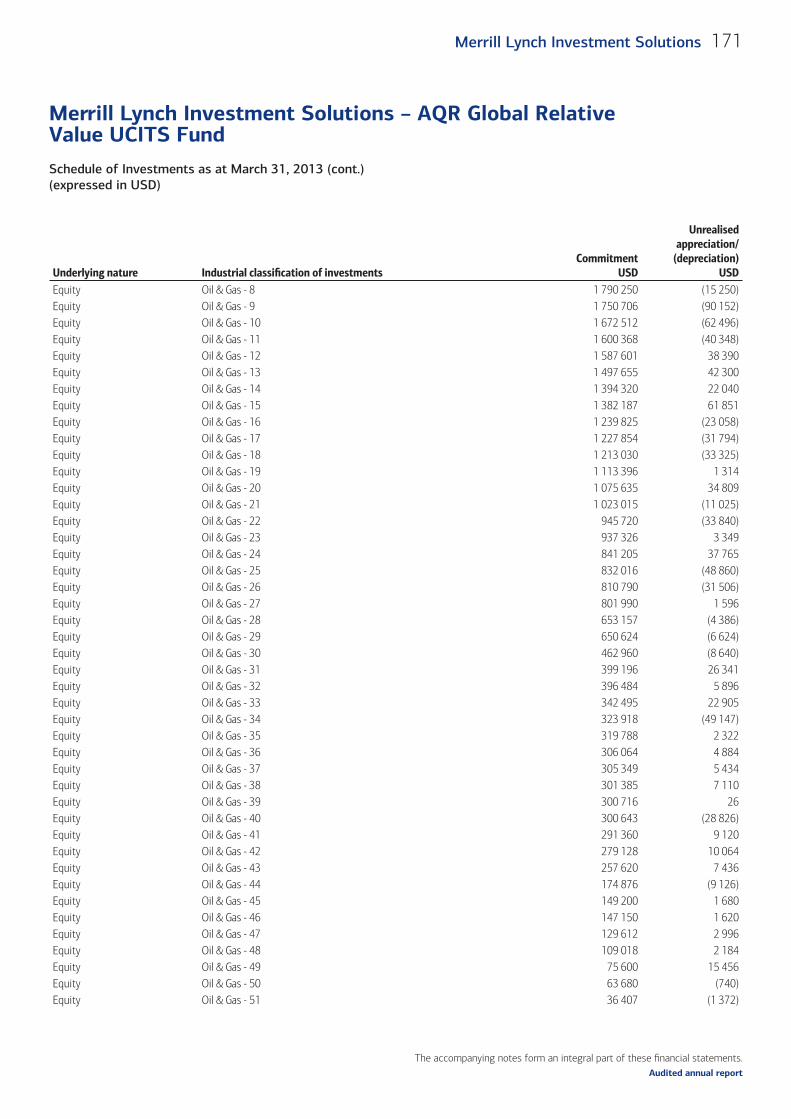
The accompanying notes form an integral part of these fi nancial statements.
Schedule of Investments as at March 31, 2013 (cont.)(expressed in USD)
Merrill Lynch Investment Solutions – AQR Global Relative Value UCITS Fund
171Merrill Lynch Investment Solutions
Audited annual report
Underlying nature Industrial classifi cation of investments Commitment
USD
Unrealised appreciation/
(depreciation)USD
Equity Oil & Gas - 8 1 790 250 (15 250)Equity Oil & Gas - 9 1 750 706 (90 152)Equity Oil & Gas - 10 1 672 512 (62 496)Equity Oil & Gas - 11 1 600 368 (40 348)Equity Oil & Gas - 12 1 587 601 38 390 Equity Oil & Gas - 13 1 497 655 42 300 Equity Oil & Gas - 14 1 394 320 22 040 Equity Oil & Gas - 15 1 382 187 61 851 Equity Oil & Gas - 16 1 239 825 (23 058)Equity Oil & Gas - 17 1 227 854 (31 794)Equity Oil & Gas - 18 1 213 030 (33 325)Equity Oil & Gas - 19 1 113 396 1 314 Equity Oil & Gas - 20 1 075 635 34 809 Equity Oil & Gas - 21 1 023 015 (11 025)Equity Oil & Gas - 22 945 720 (33 840)Equity Oil & Gas - 23 937 326 3 349 Equity Oil & Gas - 24 841 205 37 765 Equity Oil & Gas - 25 832 016 (48 860)Equity Oil & Gas - 26 810 790 (31 506)Equity Oil & Gas - 27 801 990 1 596 Equity Oil & Gas - 28 653 157 (4 386)Equity Oil & Gas - 29 650 624 (6 624)Equity Oil & Gas - 30 462 960 (8 640)Equity Oil & Gas - 31 399 196 26 341 Equity Oil & Gas - 32 396 484 5 896 Equity Oil & Gas - 33 342 495 22 905 Equity Oil & Gas - 34 323 918 (49 147)Equity Oil & Gas - 35 319 788 2 322 Equity Oil & Gas - 36 306 064 4 884 Equity Oil & Gas - 37 305 349 5 434 Equity Oil & Gas - 38 301 385 7 110 Equity Oil & Gas - 39 300 716 26 Equity Oil & Gas - 40 300 643 (28 826)Equity Oil & Gas - 41 291 360 9 120 Equity Oil & Gas - 42 279 128 10 064 Equity Oil & Gas - 43 257 620 7 436 Equity Oil & Gas - 44 174 876 (9 126)Equity Oil & Gas - 45 149 200 1 680 Equity Oil & Gas - 46 147 150 1 620 Equity Oil & Gas - 47 129 612 2 996 Equity Oil & Gas - 48 109 018 2 184 Equity Oil & Gas - 49 75 600 15 456 Equity Oil & Gas - 50 63 680 (740)Equity Oil & Gas - 51 36 407 (1 372)
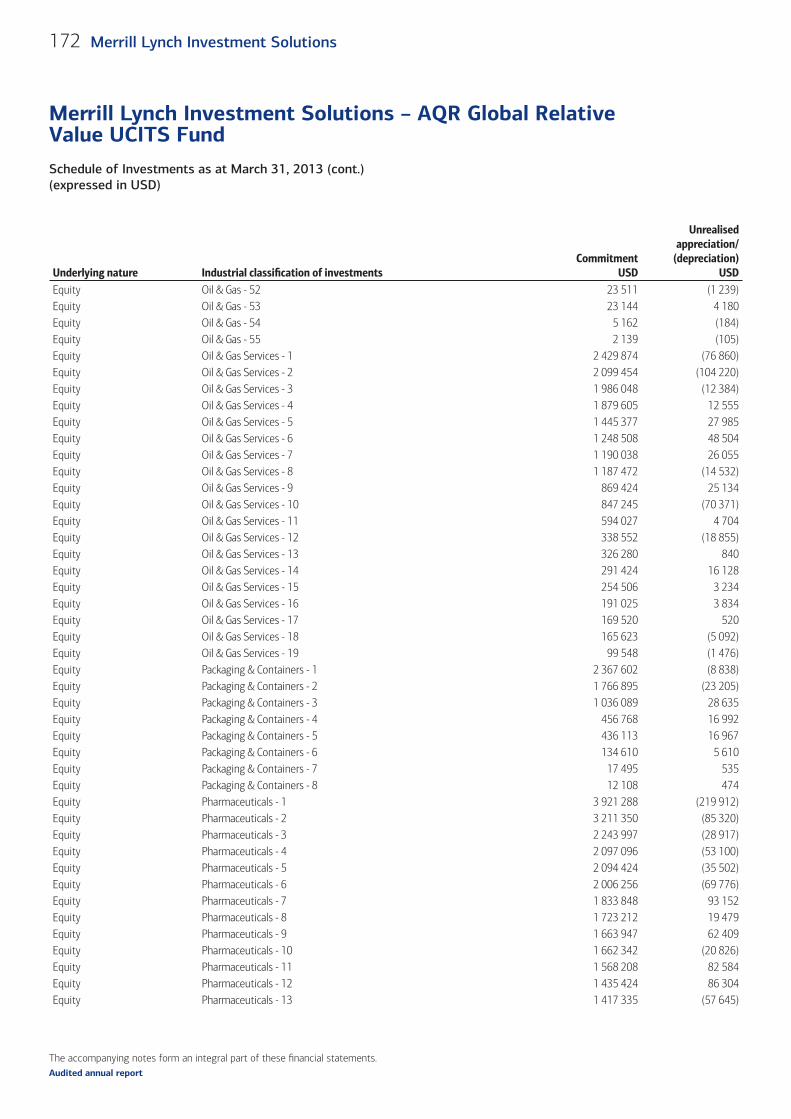
The accompanying notes form an integral part of these fi nancial statements.
Schedule of Investments as at March 31, 2013 (cont.)(expressed in USD)
Merrill Lynch Investment Solutions – AQR Global Relative Value UCITS Fund
172 Merrill Lynch Investment Solutions
Audited annual report
Underlying nature Industrial classifi cation of investments Commitment
USD
Unrealised appreciation/
(depreciation)USD
Equity Oil & Gas - 52 23 511 (1 239)Equity Oil & Gas - 53 23 144 4 180 Equity Oil & Gas - 54 5 162 (184)Equity Oil & Gas - 55 2 139 (105)Equity Oil & Gas Services - 1 2 429 874 (76 860)Equity Oil & Gas Services - 2 2 099 454 (104 220)Equity Oil & Gas Services - 3 1 986 048 (12 384)Equity Oil & Gas Services - 4 1 879 605 12 555 Equity Oil & Gas Services - 5 1 445 377 27 985 Equity Oil & Gas Services - 6 1 248 508 48 504 Equity Oil & Gas Services - 7 1 190 038 26 055 Equity Oil & Gas Services - 8 1 187 472 (14 532)Equity Oil & Gas Services - 9 869 424 25 134 Equity Oil & Gas Services - 10 847 245 (70 371)Equity Oil & Gas Services - 11 594 027 4 704 Equity Oil & Gas Services - 12 338 552 (18 855)Equity Oil & Gas Services - 13 326 280 840 Equity Oil & Gas Services - 14 291 424 16 128 Equity Oil & Gas Services - 15 254 506 3 234 Equity Oil & Gas Services - 16 191 025 3 834 Equity Oil & Gas Services - 17 169 520 520 Equity Oil & Gas Services - 18 165 623 (5 092)Equity Oil & Gas Services - 19 99 548 (1 476)Equity Packaging & Containers - 1 2 367 602 (8 838)Equity Packaging & Containers - 2 1 766 895 (23 205)Equity Packaging & Containers - 3 1 036 089 28 635 Equity Packaging & Containers - 4 456 768 16 992 Equity Packaging & Containers - 5 436 113 16 967 Equity Packaging & Containers - 6 134 610 5 610 Equity Packaging & Containers - 7 17 495 535 Equity Packaging & Containers - 8 12 108 474 Equity Pharmaceuticals - 1 3 921 288 (219 912)Equity Pharmaceuticals - 2 3 211 350 (85 320)Equity Pharmaceuticals - 3 2 243 997 (28 917)Equity Pharmaceuticals - 4 2 097 096 (53 100)Equity Pharmaceuticals - 5 2 094 424 (35 502)Equity Pharmaceuticals - 6 2 006 256 (69 776)Equity Pharmaceuticals - 7 1 833 848 93 152 Equity Pharmaceuticals - 8 1 723 212 19 479 Equity Pharmaceuticals - 9 1 663 947 62 409 Equity Pharmaceuticals - 10 1 662 342 (20 826)Equity Pharmaceuticals - 11 1 568 208 82 584 Equity Pharmaceuticals - 12 1 435 424 86 304 Equity Pharmaceuticals - 13 1 417 335 (57 645)
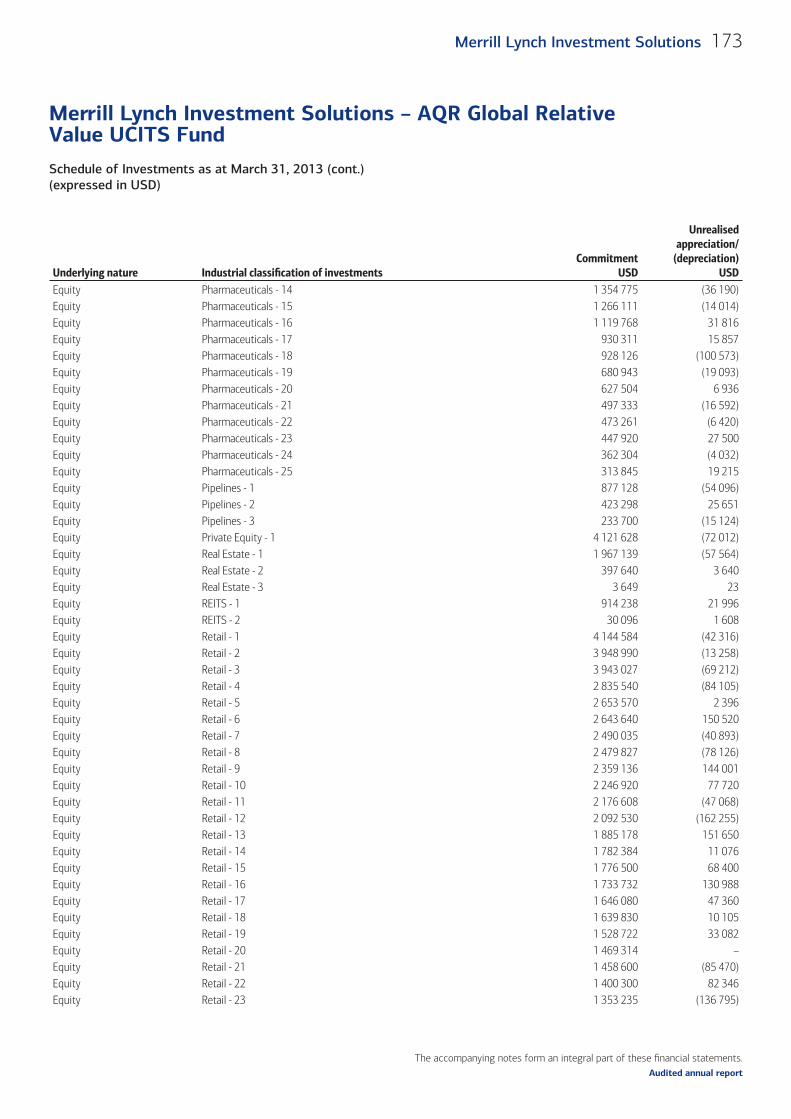
The accompanying notes form an integral part of these fi nancial statements.
Schedule of Investments as at March 31, 2013 (cont.)(expressed in USD)
Merrill Lynch Investment Solutions – AQR Global Relative Value UCITS Fund
173Merrill Lynch Investment Solutions
Audited annual report
Underlying nature Industrial classifi cation of investments Commitment
USD
Unrealised appreciation/
(depreciation)USD
Equity Pharmaceuticals - 14 1 354 775 (36 190)Equity Pharmaceuticals - 15 1 266 111 (14 014)Equity Pharmaceuticals - 16 1 119 768 31 816 Equity Pharmaceuticals - 17 930 311 15 857 Equity Pharmaceuticals - 18 928 126 (100 573)Equity Pharmaceuticals - 19 680 943 (19 093)Equity Pharmaceuticals - 20 627 504 6 936 Equity Pharmaceuticals - 21 497 333 (16 592)Equity Pharmaceuticals - 22 473 261 (6 420)Equity Pharmaceuticals - 23 447 920 27 500 Equity Pharmaceuticals - 24 362 304 (4 032)Equity Pharmaceuticals - 25 313 845 19 215 Equity Pipelines - 1 877 128 (54 096)Equity Pipelines - 2 423 298 25 651 Equity Pipelines - 3 233 700 (15 124)Equity Private Equity - 1 4 121 628 (72 012)Equity Real Estate - 1 1 967 139 (57 564)Equity Real Estate - 2 397 640 3 640 Equity Real Estate - 3 3 649 23 Equity REITS - 1 914 238 21 996 Equity REITS - 2 30 096 1 608 Equity Retail - 1 4 144 584 (42 316)Equity Retail - 2 3 948 990 (13 258)Equity Retail - 3 3 943 027 (69 212)Equity Retail - 4 2 835 540 (84 105)Equity Retail - 5 2 653 570 2 396 Equity Retail - 6 2 643 640 150 520 Equity Retail - 7 2 490 035 (40 893)Equity Retail - 8 2 479 827 (78 126)Equity Retail - 9 2 359 136 144 001 Equity Retail - 10 2 246 920 77 720 Equity Retail - 11 2 176 608 (47 068)Equity Retail - 12 2 092 530 (162 255)Equity Retail - 13 1 885 178 151 650 Equity Retail - 14 1 782 384 11 076 Equity Retail - 15 1 776 500 68 400 Equity Retail - 16 1 733 732 130 988 Equity Retail - 17 1 646 080 47 360 Equity Retail - 18 1 639 830 10 105 Equity Retail - 19 1 528 722 33 082 Equity Retail - 20 1 469 314 – Equity Retail - 21 1 458 600 (85 470)Equity Retail - 22 1 400 300 82 346 Equity Retail - 23 1 353 235 (136 795)
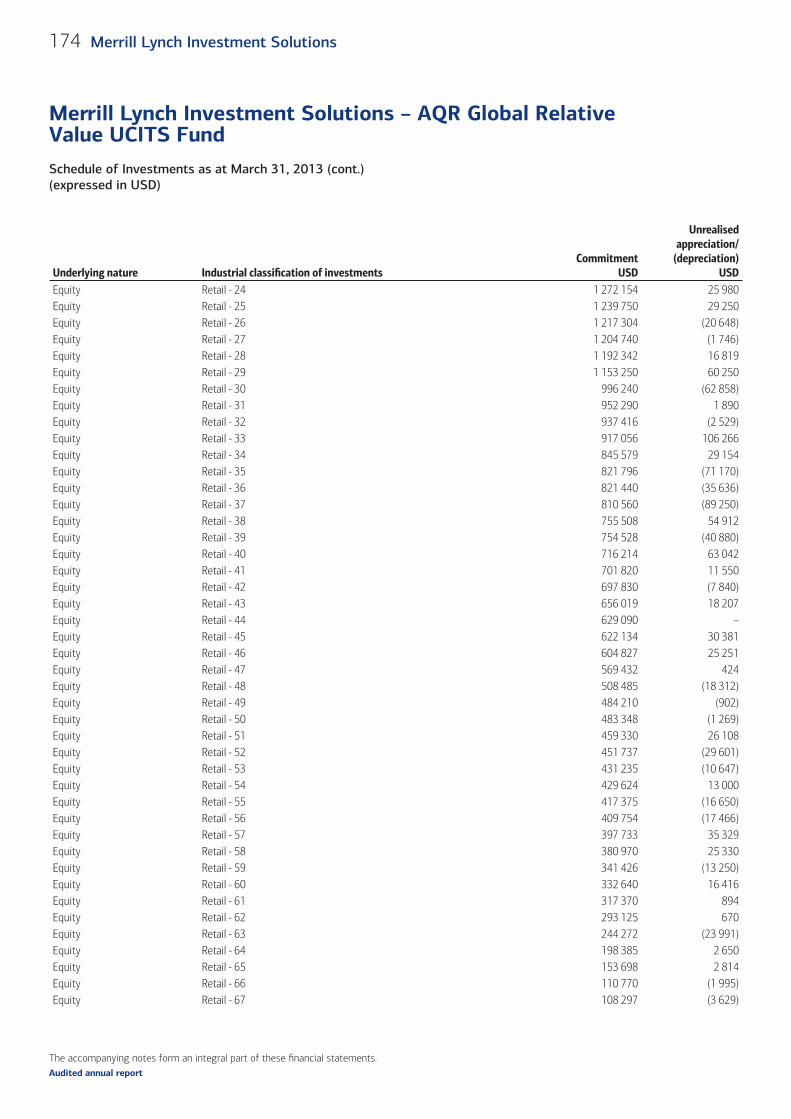
The accompanying notes form an integral part of these fi nancial statements.
Schedule of Investments as at March 31, 2013 (cont.)(expressed in USD)
Merrill Lynch Investment Solutions – AQR Global Relative Value UCITS Fund
174 Merrill Lynch Investment Solutions
Audited annual report
Underlying nature Industrial classifi cation of investments Commitment
USD
Unrealised appreciation/
(depreciation)USD
Equity Retail - 24 1 272 154 25 980 Equity Retail - 25 1 239 750 29 250 Equity Retail - 26 1 217 304 (20 648)Equity Retail - 27 1 204 740 (1 746)Equity Retail - 28 1 192 342 16 819 Equity Retail - 29 1 153 250 60 250 Equity Retail - 30 996 240 (62 858)Equity Retail - 31 952 290 1 890 Equity Retail - 32 937 416 (2 529)Equity Retail - 33 917 056 106 266 Equity Retail - 34 845 579 29 154 Equity Retail - 35 821 796 (71 170)Equity Retail - 36 821 440 (35 636)Equity Retail - 37 810 560 (89 250)Equity Retail - 38 755 508 54 912 Equity Retail - 39 754 528 (40 880)Equity Retail - 40 716 214 63 042 Equity Retail - 41 701 820 11 550 Equity Retail - 42 697 830 (7 840)Equity Retail - 43 656 019 18 207 Equity Retail - 44 629 090 – Equity Retail - 45 622 134 30 381 Equity Retail - 46 604 827 25 251 Equity Retail - 47 569 432 424 Equity Retail - 48 508 485 (18 312)Equity Retail - 49 484 210 (902)Equity Retail - 50 483 348 (1 269)Equity Retail - 51 459 330 26 108 Equity Retail - 52 451 737 (29 601)Equity Retail - 53 431 235 (10 647)Equity Retail - 54 429 624 13 000 Equity Retail - 55 417 375 (16 650)Equity Retail - 56 409 754 (17 466)Equity Retail - 57 397 733 35 329 Equity Retail - 58 380 970 25 330 Equity Retail - 59 341 426 (13 250)Equity Retail - 60 332 640 16 416 Equity Retail - 61 317 370 894 Equity Retail - 62 293 125 670 Equity Retail - 63 244 272 (23 991)Equity Retail - 64 198 385 2 650 Equity Retail - 65 153 698 2 814 Equity Retail - 66 110 770 (1 995)Equity Retail - 67 108 297 (3 629)
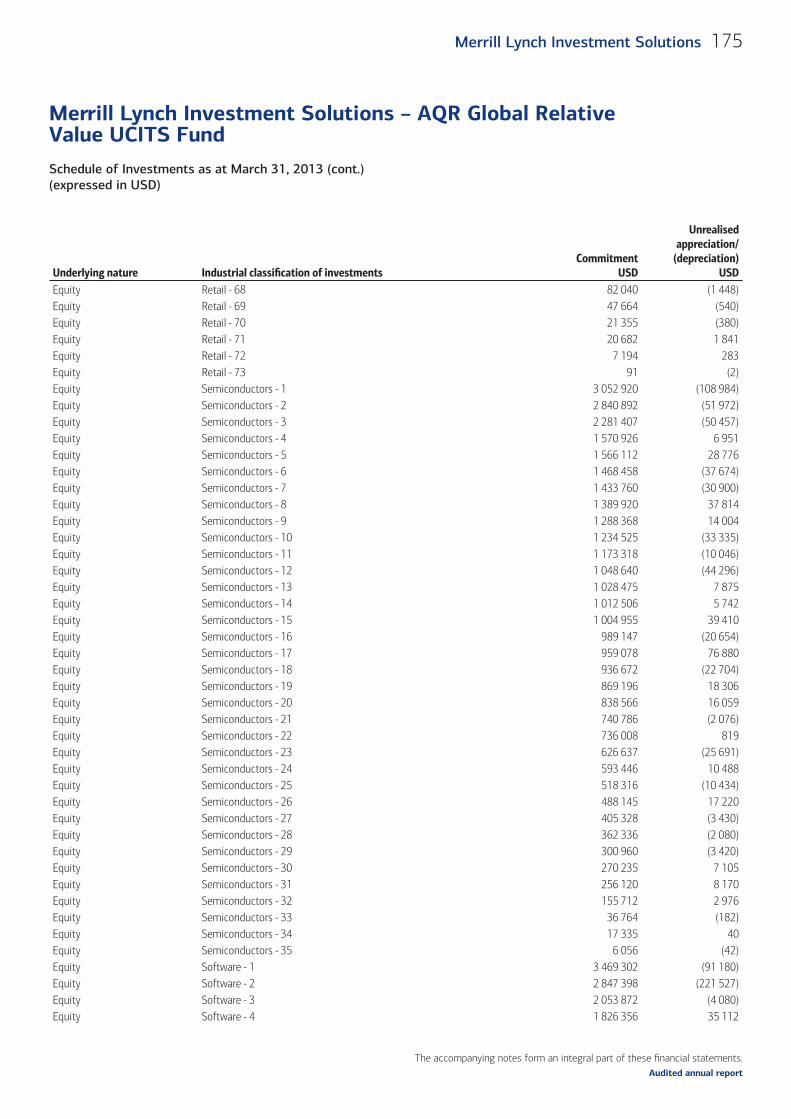
The accompanying notes form an integral part of these fi nancial statements.
Schedule of Investments as at March 31, 2013 (cont.)(expressed in USD)
Merrill Lynch Investment Solutions – AQR Global Relative Value UCITS Fund
175Merrill Lynch Investment Solutions
Audited annual report
Underlying nature Industrial classifi cation of investments Commitment
USD
Unrealised appreciation/
(depreciation)USD
Equity Retail - 68 82 040 (1 448)Equity Retail - 69 47 664 (540)Equity Retail - 70 21 355 (380)Equity Retail - 71 20 682 1 841 Equity Retail - 72 7 194 283 Equity Retail - 73 91 (2)Equity Semiconductors - 1 3 052 920 (108 984)Equity Semiconductors - 2 2 840 892 (51 972)Equity Semiconductors - 3 2 281 407 (50 457)Equity Semiconductors - 4 1 570 926 6 951 Equity Semiconductors - 5 1 566 112 28 776 Equity Semiconductors - 6 1 468 458 (37 674)Equity Semiconductors - 7 1 433 760 (30 900)Equity Semiconductors - 8 1 389 920 37 814 Equity Semiconductors - 9 1 288 368 14 004 Equity Semiconductors - 10 1 234 525 (33 335)Equity Semiconductors - 11 1 173 318 (10 046)Equity Semiconductors - 12 1 048 640 (44 296)Equity Semiconductors - 13 1 028 475 7 875 Equity Semiconductors - 14 1 012 506 5 742 Equity Semiconductors - 15 1 004 955 39 410 Equity Semiconductors - 16 989 147 (20 654)Equity Semiconductors - 17 959 078 76 880 Equity Semiconductors - 18 936 672 (22 704)Equity Semiconductors - 19 869 196 18 306 Equity Semiconductors - 20 838 566 16 059 Equity Semiconductors - 21 740 786 (2 076)Equity Semiconductors - 22 736 008 819 Equity Semiconductors - 23 626 637 (25 691)Equity Semiconductors - 24 593 446 10 488 Equity Semiconductors - 25 518 316 (10 434)Equity Semiconductors - 26 488 145 17 220 Equity Semiconductors - 27 405 328 (3 430)Equity Semiconductors - 28 362 336 (2 080)Equity Semiconductors - 29 300 960 (3 420)Equity Semiconductors - 30 270 235 7 105 Equity Semiconductors - 31 256 120 8 170 Equity Semiconductors - 32 155 712 2 976 Equity Semiconductors - 33 36 764 (182)Equity Semiconductors - 34 17 335 40 Equity Semiconductors - 35 6 056 (42)Equity Software - 1 3 469 302 (91 180)Equity Software - 2 2 847 398 (221 527)Equity Software - 3 2 053 872 (4 080)Equity Software - 4 1 826 356 35 112
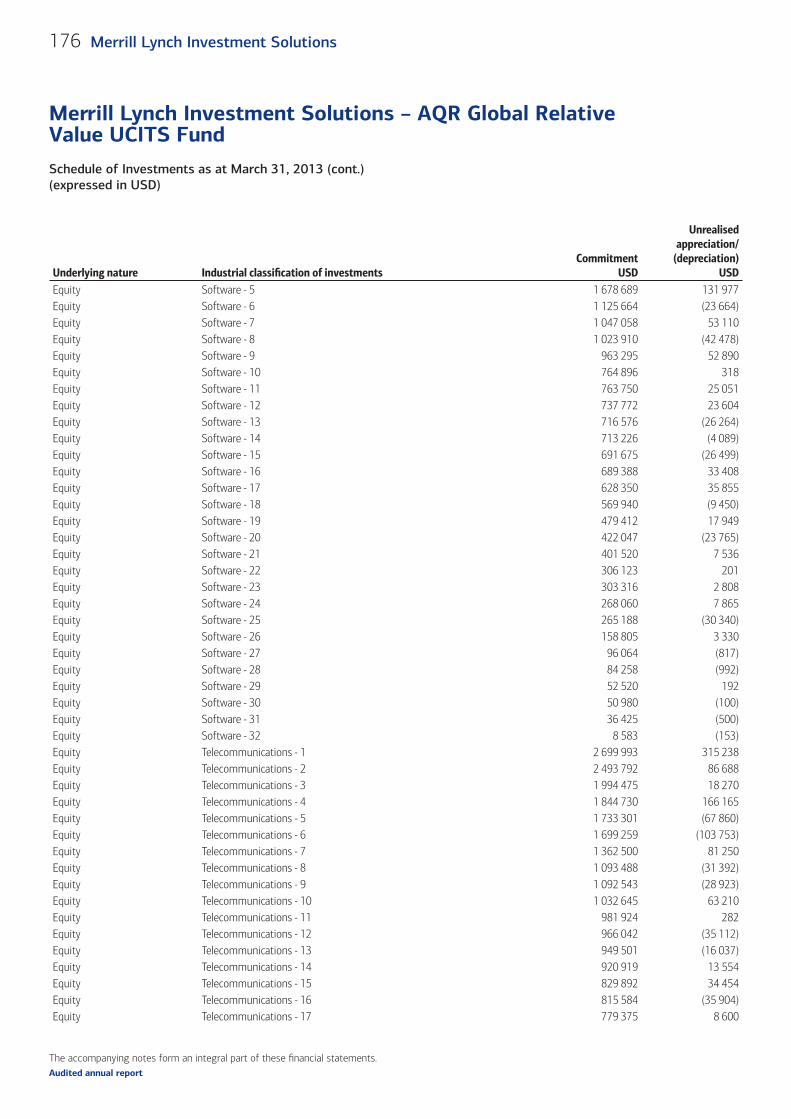
The accompanying notes form an integral part of these fi nancial statements.
Schedule of Investments as at March 31, 2013 (cont.)(expressed in USD)
Merrill Lynch Investment Solutions – AQR Global Relative Value UCITS Fund
176 Merrill Lynch Investment Solutions
Audited annual report
Underlying nature Industrial classifi cation of investments Commitment
USD
Unrealised appreciation/
(depreciation)USD
Equity Software - 5 1 678 689 131 977 Equity Software - 6 1 125 664 (23 664)Equity Software - 7 1 047 058 53 110 Equity Software - 8 1 023 910 (42 478)Equity Software - 9 963 295 52 890 Equity Software - 10 764 896 318 Equity Software - 11 763 750 25 051 Equity Software - 12 737 772 23 604 Equity Software - 13 716 576 (26 264)Equity Software - 14 713 226 (4 089)Equity Software - 15 691 675 (26 499)Equity Software - 16 689 388 33 408 Equity Software - 17 628 350 35 855 Equity Software - 18 569 940 (9 450)Equity Software - 19 479 412 17 949 Equity Software - 20 422 047 (23 765)Equity Software - 21 401 520 7 536 Equity Software - 22 306 123 201 Equity Software - 23 303 316 2 808 Equity Software - 24 268 060 7 865 Equity Software - 25 265 188 (30 340)Equity Software - 26 158 805 3 330 Equity Software - 27 96 064 (817)Equity Software - 28 84 258 (992)Equity Software - 29 52 520 192 Equity Software - 30 50 980 (100)Equity Software - 31 36 425 (500)Equity Software - 32 8 583 (153)Equity Telecommunications - 1 2 699 993 315 238 Equity Telecommunications - 2 2 493 792 86 688 Equity Telecommunications - 3 1 994 475 18 270 Equity Telecommunications - 4 1 844 730 166 165 Equity Telecommunications - 5 1 733 301 (67 860)Equity Telecommunications - 6 1 699 259 (103 753)Equity Telecommunications - 7 1 362 500 81 250 Equity Telecommunications - 8 1 093 488 (31 392)Equity Telecommunications - 9 1 092 543 (28 923)Equity Telecommunications - 10 1 032 645 63 210 Equity Telecommunications - 11 981 924 282 Equity Telecommunications - 12 966 042 (35 112)Equity Telecommunications - 13 949 501 (16 037)Equity Telecommunications - 14 920 919 13 554 Equity Telecommunications - 15 829 892 34 454 Equity Telecommunications - 16 815 584 (35 904)Equity Telecommunications - 17 779 375 8 600
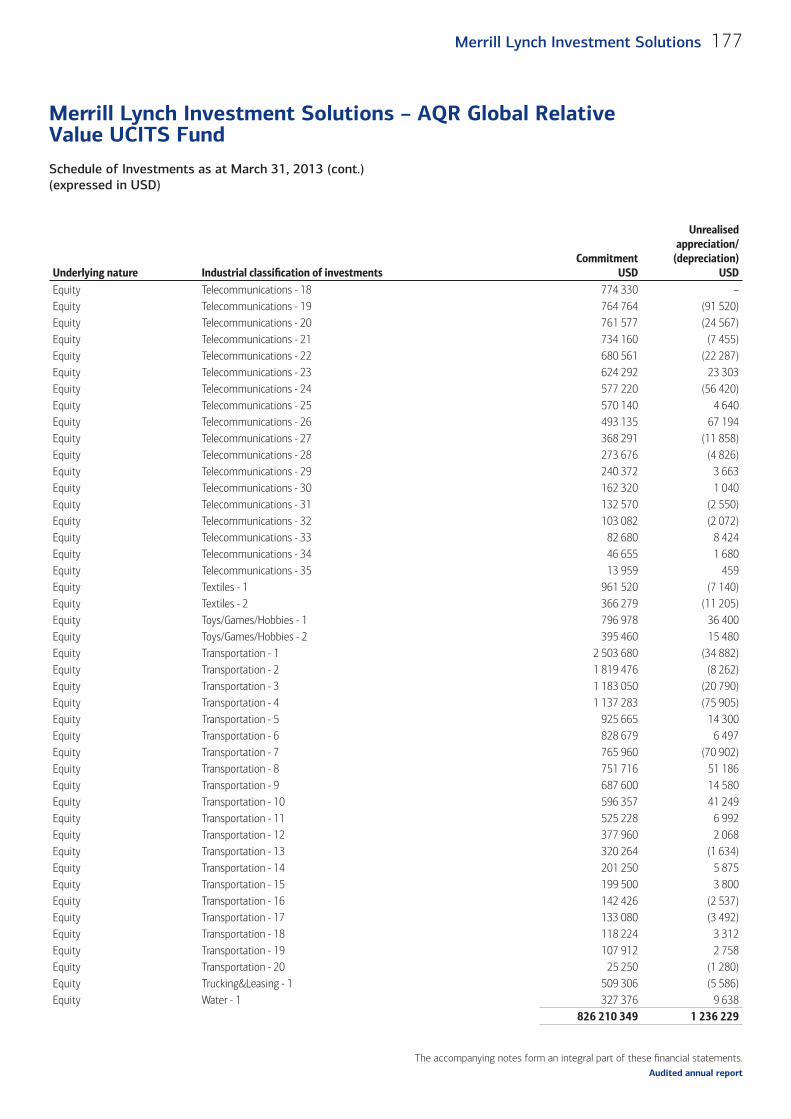
The accompanying notes form an integral part of these fi nancial statements.
Schedule of Investments as at March 31, 2013 (cont.)(expressed in USD)
Merrill Lynch Investment Solutions – AQR Global Relative Value UCITS Fund
177Merrill Lynch Investment Solutions
Audited annual report
Underlying nature Industrial classifi cation of investments Commitment
USD
Unrealised appreciation/
(depreciation)USD
Equity Telecommunications - 18 774 330 – Equity Telecommunications - 19 764 764 (91 520)Equity Telecommunications - 20 761 577 (24 567)Equity Telecommunications - 21 734 160 (7 455)Equity Telecommunications - 22 680 561 (22 287)Equity Telecommunications - 23 624 292 23 303 Equity Telecommunications - 24 577 220 (56 420)Equity Telecommunications - 25 570 140 4 640 Equity Telecommunications - 26 493 135 67 194 Equity Telecommunications - 27 368 291 (11 858)Equity Telecommunications - 28 273 676 (4 826)Equity Telecommunications - 29 240 372 3 663 Equity Telecommunications - 30 162 320 1 040 Equity Telecommunications - 31 132 570 (2 550)Equity Telecommunications - 32 103 082 (2 072)Equity Telecommunications - 33 82 680 8 424 Equity Telecommunications - 34 46 655 1 680 Equity Telecommunications - 35 13 959 459 Equity Textiles - 1 961 520 (7 140)Equity Textiles - 2 366 279 (11 205)Equity Toys/Games/Hobbies - 1 796 978 36 400 Equity Toys/Games/Hobbies - 2 395 460 15 480 Equity Transportation - 1 2 503 680 (34 882)Equity Transportation - 2 1 819 476 (8 262)Equity Transportation - 3 1 183 050 (20 790)Equity Transportation - 4 1 137 283 (75 905)Equity Transportation - 5 925 665 14 300 Equity Transportation - 6 828 679 6 497 Equity Transportation - 7 765 960 (70 902)Equity Transportation - 8 751 716 51 186 Equity Transportation - 9 687 600 14 580 Equity Transportation - 10 596 357 41 249 Equity Transportation - 11 525 228 6 992 Equity Transportation - 12 377 960 2 068 Equity Transportation - 13 320 264 (1 634)Equity Transportation - 14 201 250 5 875 Equity Transportation - 15 199 500 3 800 Equity Transportation - 16 142 426 (2 537)Equity Transportation - 17 133 080 (3 492)Equity Transportation - 18 118 224 3 312 Equity Transportation - 19 107 912 2 758 Equity Transportation - 20 25 250 (1 280)Equity Trucking&Leasing - 1 509 306 (5 586)Equity Water - 1 327 376 9 638
826 210 349 1 236 229
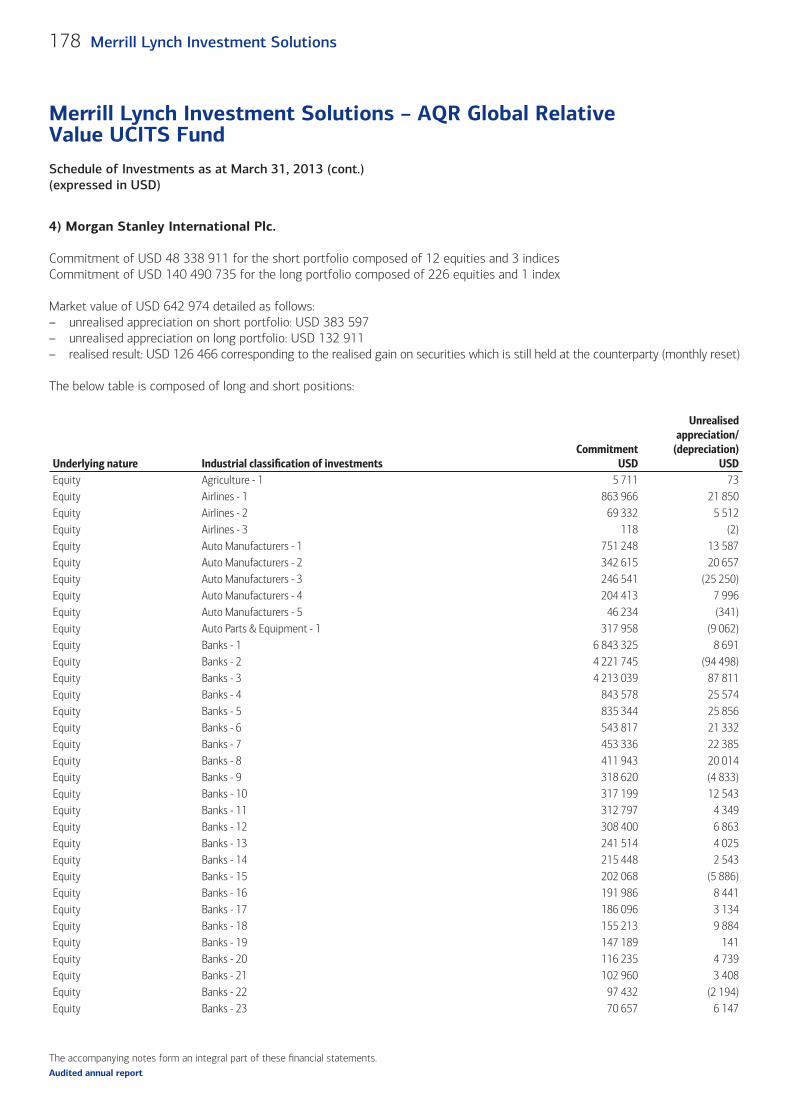
The accompanying notes form an integral part of these fi nancial statements.
Schedule of Investments as at March 31, 2013 (cont.)(expressed in USD)
Merrill Lynch Investment Solutions – AQR Global Relative Value UCITS Fund
178 Merrill Lynch Investment Solutions
Audited annual report
4) Morgan Stanley International Plc.
Commitment of USD 48 338 911 for the short portfolio composed of 12 equities and 3 indicesCommitment of USD 140 490 735 for the long portfolio composed of 226 equities and 1 index
Market value of USD 642 974 detailed as follows:– unrealised appreciation on short portfolio: USD 383 597– unrealised appreciation on long portfolio: USD 132 911– realised result: USD 126 466 corresponding to the realised gain on securities which is still held at the counterparty (monthly reset)
The below table is composed of long and short positions:
Underlying nature Industrial classifi cation of investments Commitment
USD
Unrealised appreciation/
(depreciation)USD
Equity Agriculture - 1 5 711 73 Equity Airlines - 1 863 966 21 850 Equity Airlines - 2 69 332 5 512 Equity Airlines - 3 118 (2)Equity Auto Manufacturers - 1 751 248 13 587 Equity Auto Manufacturers - 2 342 615 20 657 Equity Auto Manufacturers - 3 246 541 (25 250)Equity Auto Manufacturers - 4 204 413 7 996 Equity Auto Manufacturers - 5 46 234 (341)Equity Auto Parts & Equipment - 1 317 958 (9 062)Equity Banks - 1 6 843 325 8 691 Equity Banks - 2 4 221 745 (94 498)Equity Banks - 3 4 213 039 87 811 Equity Banks - 4 843 578 25 574 Equity Banks - 5 835 344 25 856 Equity Banks - 6 543 817 21 332 Equity Banks - 7 453 336 22 385 Equity Banks - 8 411 943 20 014 Equity Banks - 9 318 620 (4 833)Equity Banks - 10 317 199 12 543 Equity Banks - 11 312 797 4 349 Equity Banks - 12 308 400 6 863 Equity Banks - 13 241 514 4 025 Equity Banks - 14 215 448 2 543 Equity Banks - 15 202 068 (5 886)Equity Banks - 16 191 986 8 441 Equity Banks - 17 186 096 3 134 Equity Banks - 18 155 213 9 884 Equity Banks - 19 147 189 141 Equity Banks - 20 116 235 4 739 Equity Banks - 21 102 960 3 408 Equity Banks - 22 97 432 (2 194)Equity Banks - 23 70 657 6 147

The accompanying notes form an integral part of these fi nancial statements.
Schedule of Investments as at March 31, 2013 (cont.)(expressed in USD)
Merrill Lynch Investment Solutions – AQR Global Relative Value UCITS Fund
179Merrill Lynch Investment Solutions
Audited annual report
Underlying nature Industrial classifi cation of investments Commitment
USD
Unrealised appreciation/
(depreciation)USD
Equity Banks - 24 51 120 72 Equity Banks - 25 42 029 1 665 Equity Banks - 26 36 283 653 Equity Banks - 27 24 249 326 Equity Banks - 28 17 678 (1 051)Equity Banks - 29 11 371 (412)Equity Banks - 30 8 984 295 Equity Banks - 31 8 361 291 Equity Banks - 32 2 249 (59)Equity Banks - 33 113 2 Equity Beverages - 1 431 766 (7 242)Equity Beverages - 2 273 090 41 Equity Beverages - 3 261 768 4 011 Equity Beverages - 4 196 524 3 384 Equity Beverages - 5 136 200 3 600 Equity Building Materials - 1 4 022 (308)Equity Chemicals - 1 157 387 5 190 Equity Chemicals - 2 135 378 (4 093)Equity Chemicals - 3 134 810 (1 542)Equity Chemicals - 4 71 715 (3 137)Equity Chemicals - 5 8 868 (98)Equity Chemicals - 6 69 (2)Equity Coal - 1 397 586 (1 227)Equity Commercial Services - 1 5 291 670 (4 589)Equity Commercial Services - 2 134 465 6 297 Equity Commercial Services - 3 56 857 (945)Equity Commercial Services - 4 1 771 24 Equity Computers - 1 1 776 232 19 832 Equity Computers - 2 706 221 9 039 Equity Computers - 3 367 354 11 005 Equity Computers - 4 254 587 12 466 Equity Computers - 5 222 684 7 076 Equity Computers - 6 184 830 2 562 Equity Computers - 7 2 616 78 Equity Computers - 8 827 18 Equity Cosmetics/Personal Care - 1 303 673 2 921 Equity Diversified Financial Services - 1 4 808 632 72 697 Equity Diversified Financial Services - 2 3 579 060 (67 859)Equity Diversified Financial Services - 3 1 080 178 1 377 Equity Diversified Financial Services - 4 667 316 689 Equity Diversified Financial Services - 5 336 374 588 Equity Diversified Financial Services - 6 285 676 (2 632)Equity Diversified Financial Services - 7 225 138 3 834 Equity Diversified Financial Services - 8 197 447 4 746 Equity Diversified Financial Services - 9 163 080 (8 096)
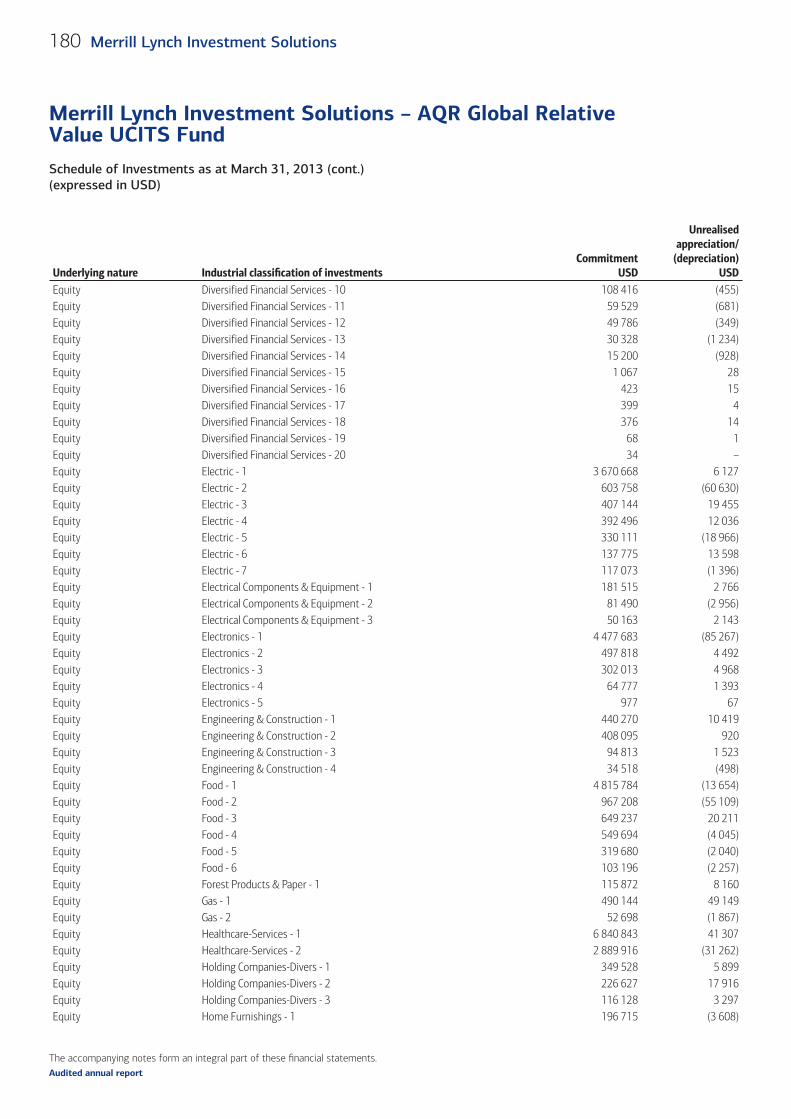
The accompanying notes form an integral part of these fi nancial statements.
Schedule of Investments as at March 31, 2013 (cont.)(expressed in USD)
Merrill Lynch Investment Solutions – AQR Global Relative Value UCITS Fund
180 Merrill Lynch Investment Solutions
Audited annual report
Underlying nature Industrial classifi cation of investments Commitment
USD
Unrealised appreciation/
(depreciation)USD
Equity Diversified Financial Services - 10 108 416 (455)Equity Diversified Financial Services - 11 59 529 (681)Equity Diversified Financial Services - 12 49 786 (349)Equity Diversified Financial Services - 13 30 328 (1 234)Equity Diversified Financial Services - 14 15 200 (928)Equity Diversified Financial Services - 15 1 067 28 Equity Diversified Financial Services - 16 423 15 Equity Diversified Financial Services - 17 399 4 Equity Diversified Financial Services - 18 376 14 Equity Diversified Financial Services - 19 68 1 Equity Diversified Financial Services - 20 34 – Equity Electric - 1 3 670 668 6 127 Equity Electric - 2 603 758 (60 630)Equity Electric - 3 407 144 19 455 Equity Electric - 4 392 496 12 036 Equity Electric - 5 330 111 (18 966)Equity Electric - 6 137 775 13 598 Equity Electric - 7 117 073 (1 396)Equity Electrical Components & Equipment - 1 181 515 2 766 Equity Electrical Components & Equipment - 2 81 490 (2 956)Equity Electrical Components & Equipment - 3 50 163 2 143 Equity Electronics - 1 4 477 683 (85 267)Equity Electronics - 2 497 818 4 492 Equity Electronics - 3 302 013 4 968 Equity Electronics - 4 64 777 1 393 Equity Electronics - 5 977 67 Equity Engineering & Construction - 1 440 270 10 419 Equity Engineering & Construction - 2 408 095 920 Equity Engineering & Construction - 3 94 813 1 523 Equity Engineering & Construction - 4 34 518 (498)Equity Food - 1 4 815 784 (13 654)Equity Food - 2 967 208 (55 109)Equity Food - 3 649 237 20 211 Equity Food - 4 549 694 (4 045)Equity Food - 5 319 680 (2 040)Equity Food - 6 103 196 (2 257)Equity Forest Products & Paper - 1 115 872 8 160 Equity Gas - 1 490 144 49 149 Equity Gas - 2 52 698 (1 867)Equity Healthcare-Services - 1 6 840 843 41 307 Equity Healthcare-Services - 2 2 889 916 (31 262)Equity Holding Companies-Divers - 1 349 528 5 899 Equity Holding Companies-Divers - 2 226 627 17 916 Equity Holding Companies-Divers - 3 116 128 3 297 Equity Home Furnishings - 1 196 715 (3 608)
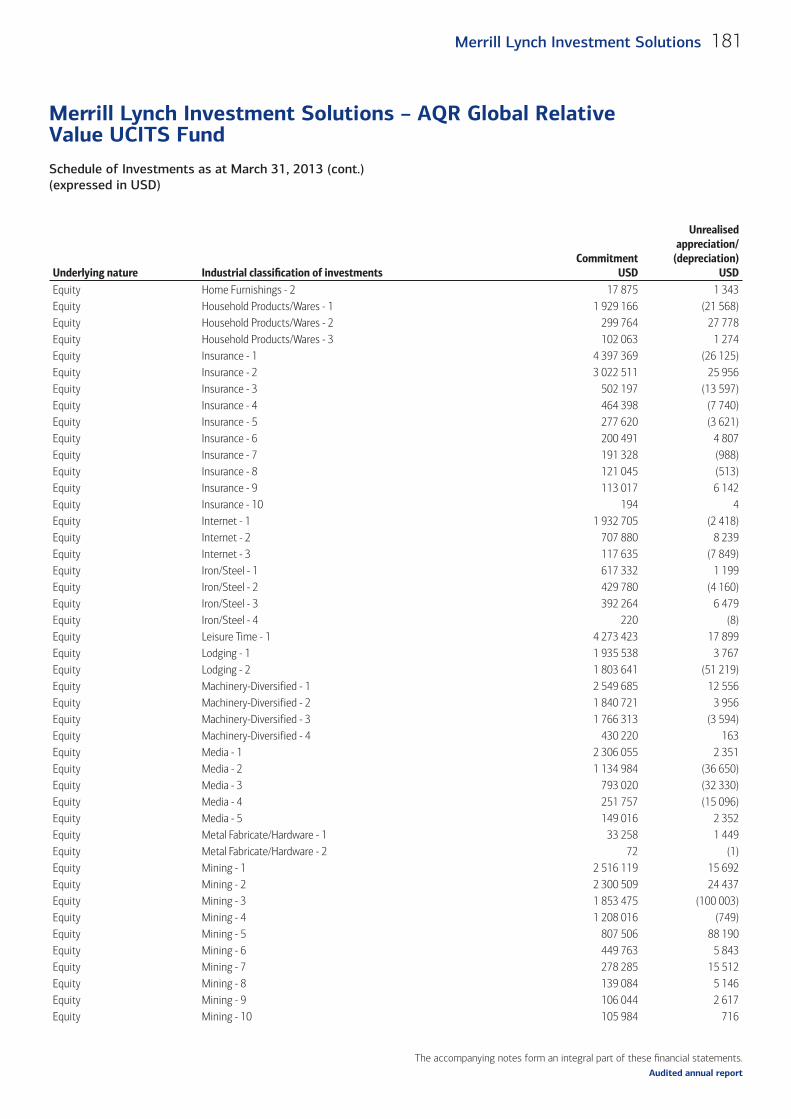
The accompanying notes form an integral part of these fi nancial statements.
Schedule of Investments as at March 31, 2013 (cont.)(expressed in USD)
Merrill Lynch Investment Solutions – AQR Global Relative Value UCITS Fund
181Merrill Lynch Investment Solutions
Audited annual report
Underlying nature Industrial classifi cation of investments Commitment
USD
Unrealised appreciation/
(depreciation)USD
Equity Home Furnishings - 2 17 875 1 343 Equity Household Products/Wares - 1 1 929 166 (21 568)Equity Household Products/Wares - 2 299 764 27 778 Equity Household Products/Wares - 3 102 063 1 274 Equity Insurance - 1 4 397 369 (26 125)Equity Insurance - 2 3 022 511 25 956 Equity Insurance - 3 502 197 (13 597)Equity Insurance - 4 464 398 (7 740)Equity Insurance - 5 277 620 (3 621)Equity Insurance - 6 200 491 4 807 Equity Insurance - 7 191 328 (988)Equity Insurance - 8 121 045 (513)Equity Insurance - 9 113 017 6 142 Equity Insurance - 10 194 4 Equity Internet - 1 1 932 705 (2 418)Equity Internet - 2 707 880 8 239 Equity Internet - 3 117 635 (7 849)Equity Iron/Steel - 1 617 332 1 199 Equity Iron/Steel - 2 429 780 (4 160)Equity Iron/Steel - 3 392 264 6 479 Equity Iron/Steel - 4 220 (8)Equity Leisure Time - 1 4 273 423 17 899 Equity Lodging - 1 1 935 538 3 767 Equity Lodging - 2 1 803 641 (51 219)Equity Machinery-Diversified - 1 2 549 685 12 556 Equity Machinery-Diversified - 2 1 840 721 3 956 Equity Machinery-Diversified - 3 1 766 313 (3 594)Equity Machinery-Diversified - 4 430 220 163 Equity Media - 1 2 306 055 2 351 Equity Media - 2 1 134 984 (36 650)Equity Media - 3 793 020 (32 330)Equity Media - 4 251 757 (15 096)Equity Media - 5 149 016 2 352 Equity Metal Fabricate/Hardware - 1 33 258 1 449 Equity Metal Fabricate/Hardware - 2 72 (1)Equity Mining - 1 2 516 119 15 692 Equity Mining - 2 2 300 509 24 437 Equity Mining - 3 1 853 475 (100 003)Equity Mining - 4 1 208 016 (749)Equity Mining - 5 807 506 88 190 Equity Mining - 6 449 763 5 843 Equity Mining - 7 278 285 15 512 Equity Mining - 8 139 084 5 146 Equity Mining - 9 106 044 2 617 Equity Mining - 10 105 984 716
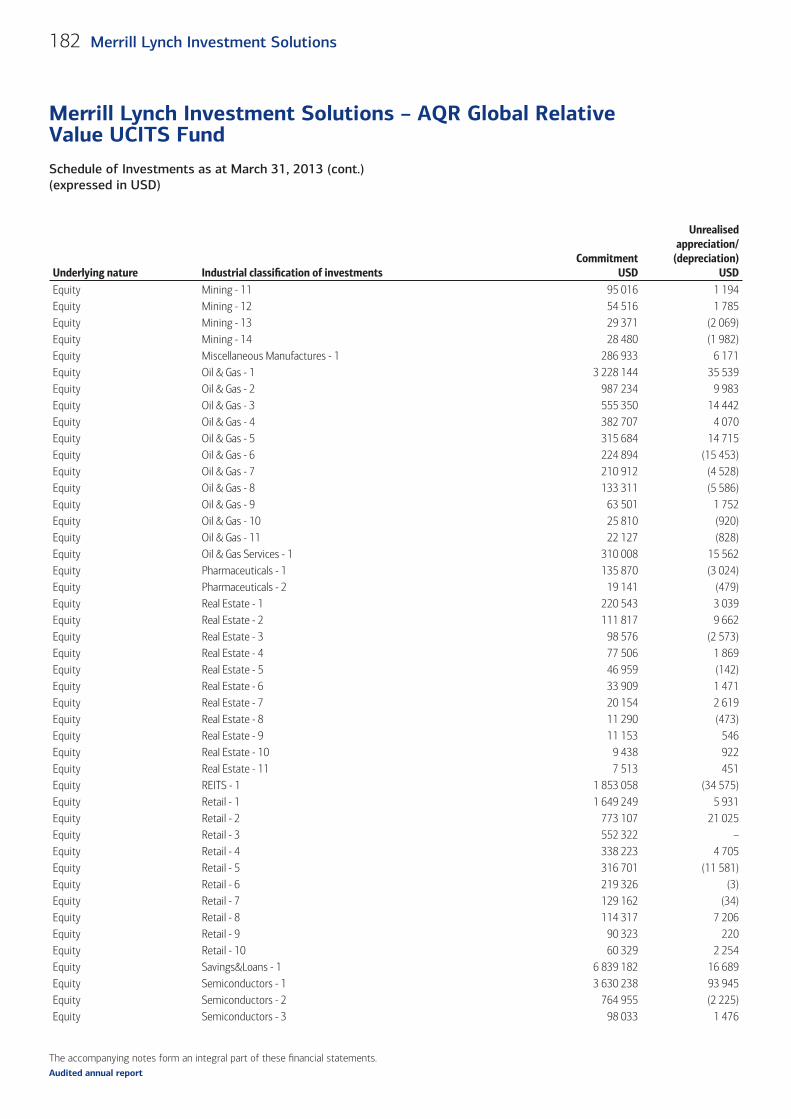
The accompanying notes form an integral part of these fi nancial statements.
Schedule of Investments as at March 31, 2013 (cont.)(expressed in USD)
Merrill Lynch Investment Solutions – AQR Global Relative Value UCITS Fund
182 Merrill Lynch Investment Solutions
Audited annual report
Underlying nature Industrial classifi cation of investments Commitment
USD
Unrealised appreciation/
(depreciation)USD
Equity Mining - 11 95 016 1 194 Equity Mining - 12 54 516 1 785 Equity Mining - 13 29 371 (2 069)Equity Mining - 14 28 480 (1 982)Equity Miscellaneous Manufactures - 1 286 933 6 171 Equity Oil & Gas - 1 3 228 144 35 539 Equity Oil & Gas - 2 987 234 9 983 Equity Oil & Gas - 3 555 350 14 442 Equity Oil & Gas - 4 382 707 4 070 Equity Oil & Gas - 5 315 684 14 715 Equity Oil & Gas - 6 224 894 (15 453)Equity Oil & Gas - 7 210 912 (4 528)Equity Oil & Gas - 8 133 311 (5 586)Equity Oil & Gas - 9 63 501 1 752 Equity Oil & Gas - 10 25 810 (920)Equity Oil & Gas - 11 22 127 (828)Equity Oil & Gas Services - 1 310 008 15 562 Equity Pharmaceuticals - 1 135 870 (3 024)Equity Pharmaceuticals - 2 19 141 (479)Equity Real Estate - 1 220 543 3 039 Equity Real Estate - 2 111 817 9 662 Equity Real Estate - 3 98 576 (2 573)Equity Real Estate - 4 77 506 1 869 Equity Real Estate - 5 46 959 (142)Equity Real Estate - 6 33 909 1 471 Equity Real Estate - 7 20 154 2 619 Equity Real Estate - 8 11 290 (473)Equity Real Estate - 9 11 153 546 Equity Real Estate - 10 9 438 922 Equity Real Estate - 11 7 513 451 Equity REITS - 1 1 853 058 (34 575)Equity Retail - 1 1 649 249 5 931 Equity Retail - 2 773 107 21 025 Equity Retail - 3 552 322 – Equity Retail - 4 338 223 4 705 Equity Retail - 5 316 701 (11 581)Equity Retail - 6 219 326 (3)Equity Retail - 7 129 162 (34)Equity Retail - 8 114 317 7 206 Equity Retail - 9 90 323 220 Equity Retail - 10 60 329 2 254 Equity Savings&Loans - 1 6 839 182 16 689 Equity Semiconductors - 1 3 630 238 93 945 Equity Semiconductors - 2 764 955 (2 225)Equity Semiconductors - 3 98 033 1 476
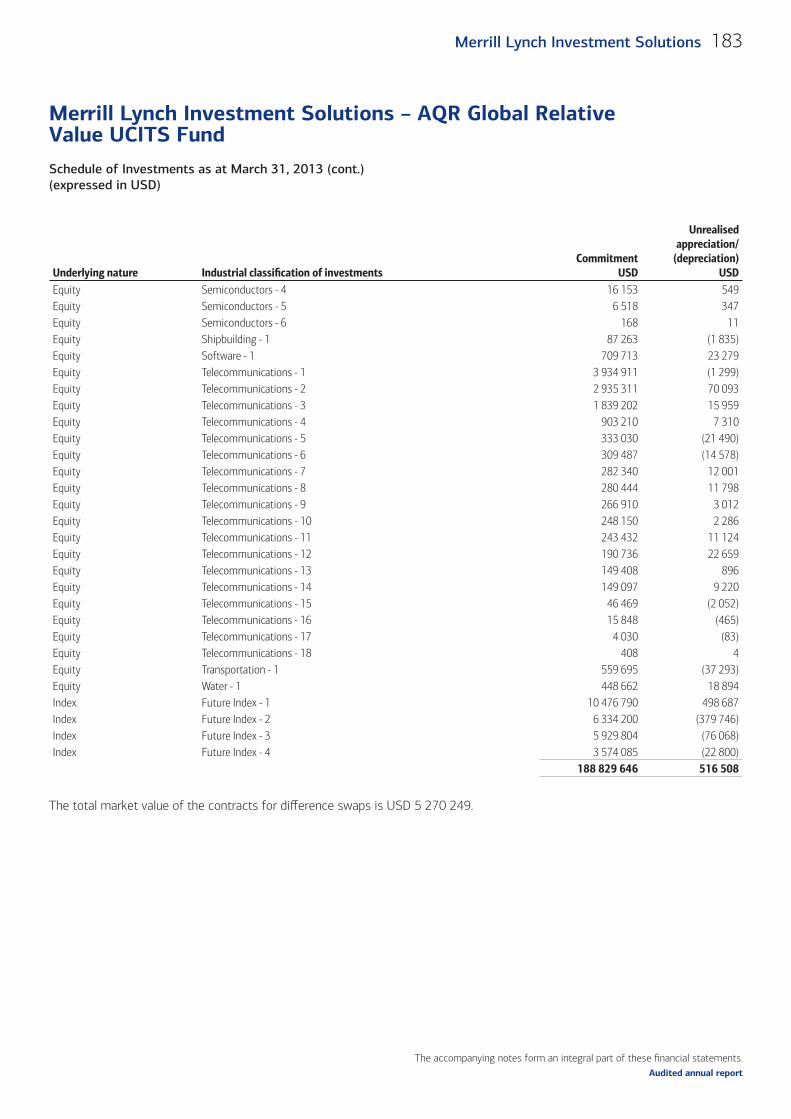
The accompanying notes form an integral part of these fi nancial statements.
Schedule of Investments as at March 31, 2013 (cont.)(expressed in USD)
Merrill Lynch Investment Solutions – AQR Global Relative Value UCITS Fund
183Merrill Lynch Investment Solutions
Audited annual report
Underlying nature Industrial classifi cation of investments Commitment
USD
Unrealised appreciation/
(depreciation)USD
Equity Semiconductors - 4 16 153 549 Equity Semiconductors - 5 6 518 347 Equity Semiconductors - 6 168 11 Equity Shipbuilding - 1 87 263 (1 835)Equity Software - 1 709 713 23 279 Equity Telecommunications - 1 3 934 911 (1 299)Equity Telecommunications - 2 2 935 311 70 093 Equity Telecommunications - 3 1 839 202 15 959 Equity Telecommunications - 4 903 210 7 310 Equity Telecommunications - 5 333 030 (21 490)Equity Telecommunications - 6 309 487 (14 578)Equity Telecommunications - 7 282 340 12 001 Equity Telecommunications - 8 280 444 11 798 Equity Telecommunications - 9 266 910 3 012 Equity Telecommunications - 10 248 150 2 286 Equity Telecommunications - 11 243 432 11 124 Equity Telecommunications - 12 190 736 22 659 Equity Telecommunications - 13 149 408 896 Equity Telecommunications - 14 149 097 9 220 Equity Telecommunications - 15 46 469 (2 052)Equity Telecommunications - 16 15 848 (465)Equity Telecommunications - 17 4 030 (83)Equity Telecommunications - 18 408 4 Equity Transportation - 1 559 695 (37 293)Equity Water - 1 448 662 18 894 Index Future Index - 1 10 476 790 498 687 Index Future Index - 2 6 334 200 (379 746)Index Future Index - 3 5 929 804 (76 068)Index Future Index - 4 3 574 085 (22 800)
188 829 646 516 508
The total market value of the contracts for diff erence swaps is USD 5 270 249.
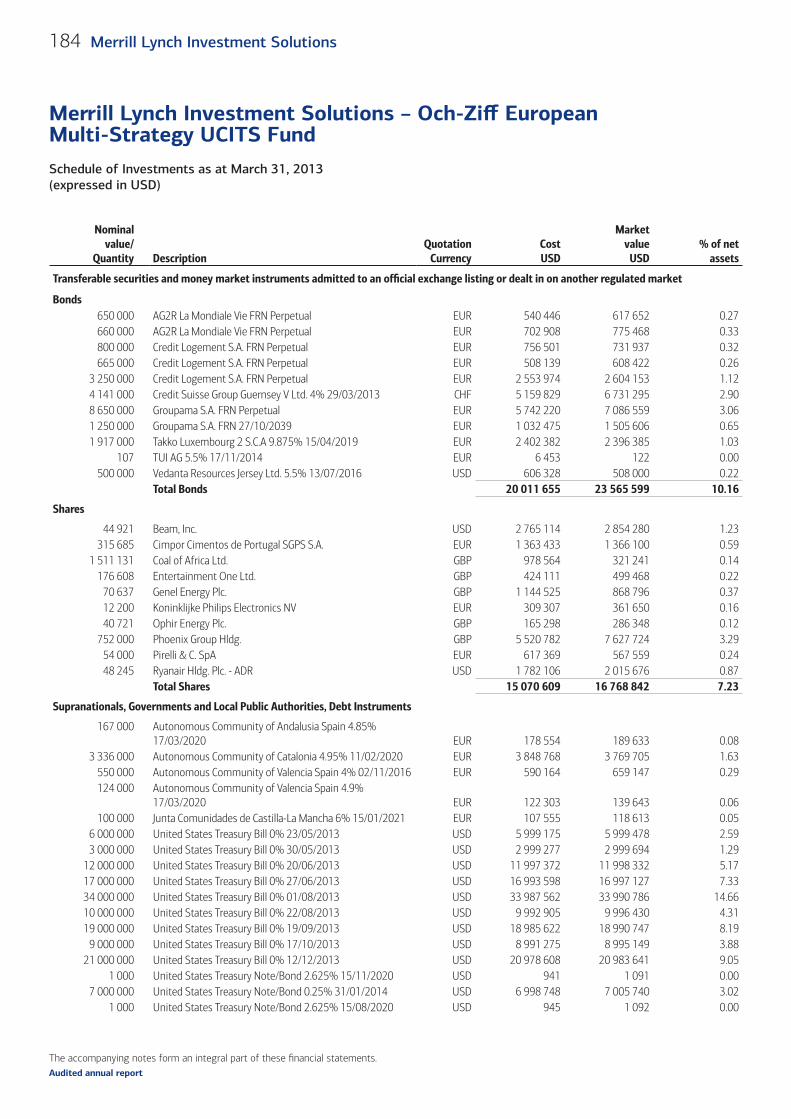
The accompanying notes form an integral part of these fi nancial statements.
Schedule of Investments as at March 31, 2013 (expressed in USD)
Merrill Lynch Investment Solutions – Och-Ziff European Multi-Strategy UCITS Fund
184 Merrill Lynch Investment Solutions
Audited annual report
Nominalvalue/
Quantity DescriptionQuotation
CurrencyCostUSD
Marketvalue
USD% of net
assets
Transferable securities and money market instruments admitted to an offi cial exchange listing or dealt in on another regulated market (cont.)
Bonds650 000 AG2R La Mondiale Vie FRN Perpetual EUR 540 446 617 652 0.27660 000 AG2R La Mondiale Vie FRN Perpetual EUR 702 908 775 468 0.33800 000 Credit Logement S.A. FRN Perpetual EUR 756 501 731 937 0.32665 000 Credit Logement S.A. FRN Perpetual EUR 508 139 608 422 0.26
3 250 000 Credit Logement S.A. FRN Perpetual EUR 2 553 974 2 604 153 1.124 141 000 Credit Suisse Group Guernsey V Ltd. 4% 29/03/2013 CHF 5 159 829 6 731 295 2.908 650 000 Groupama S.A. FRN Perpetual EUR 5 742 220 7 086 559 3.061 250 000 Groupama S.A. FRN 27/10/2039 EUR 1 032 475 1 505 606 0.651 917 000 Takko Luxembourg 2 S.C.A 9.875% 15/04/2019 EUR 2 402 382 2 396 385 1.03
107 TUI AG 5.5% 17/11/2014 EUR 6 453 122 0.00500 000 Vedanta Resources Jersey Ltd. 5.5% 13/07/2016 USD 606 328 508 000 0.22
Total Bonds 20 011 655 23 565 599 10.16
Shares
44 921 Beam, Inc. USD 2 765 114 2 854 280 1.23315 685 Cimpor Cimentos de Portugal SGPS S.A. EUR 1 363 433 1 366 100 0.59
1 511 131 Coal of Africa Ltd. GBP 978 564 321 241 0.14176 608 Entertainment One Ltd. GBP 424 111 499 468 0.22
70 637 Genel Energy Plc. GBP 1 144 525 868 796 0.3712 200 Koninklijke Philips Electronics NV EUR 309 307 361 650 0.1640 721 Ophir Energy Plc. GBP 165 298 286 348 0.12
752 000 Phoenix Group Hldg. GBP 5 520 782 7 627 724 3.2954 000 Pirelli & C. SpA EUR 617 369 567 559 0.2448 245 Ryanair Hldg. Plc. - ADR USD 1 782 106 2 015 676 0.87
Total Shares 15 070 609 16 768 842 7.23
Supranationals, Governments and Local Public Authorities, Debt Instruments
167 000 Autonomous Community of Andalusia Spain 4.85% 17/03/2020 EUR 178 554 189 633 0.08
3 336 000 Autonomous Community of Catalonia 4.95% 11/02/2020 EUR 3 848 768 3 769 705 1.63550 000 Autonomous Community of Valencia Spain 4% 02/11/2016 EUR 590 164 659 147 0.29124 000 Autonomous Community of Valencia Spain 4.9%
17/03/2020 EUR 122 303 139 643 0.06100 000 Junta Comunidades de Castilla-La Mancha 6% 15/01/2021 EUR 107 555 118 613 0.05
6 000 000 United States Treasury Bill 0% 23/05/2013 USD 5 999 175 5 999 478 2.593 000 000 United States Treasury Bill 0% 30/05/2013 USD 2 999 277 2 999 694 1.29
12 000 000 United States Treasury Bill 0% 20/06/2013 USD 11 997 372 11 998 332 5.1717 000 000 United States Treasury Bill 0% 27/06/2013 USD 16 993 598 16 997 127 7.3334 000 000 United States Treasury Bill 0% 01/08/2013 USD 33 987 562 33 990 786 14.6610 000 000 United States Treasury Bill 0% 22/08/2013 USD 9 992 905 9 996 430 4.3119 000 000 United States Treasury Bill 0% 19/09/2013 USD 18 985 622 18 990 747 8.19
9 000 000 United States Treasury Bill 0% 17/10/2013 USD 8 991 275 8 995 149 3.8821 000 000 United States Treasury Bill 0% 12/12/2013 USD 20 978 608 20 983 641 9.05
1 000 United States Treasury Note/Bond 2.625% 15/11/2020 USD 941 1 091 0.007 000 000 United States Treasury Note/Bond 0.25% 31/01/2014 USD 6 998 748 7 005 740 3.02
1 000 United States Treasury Note/Bond 2.625% 15/08/2020 USD 945 1 092 0.00
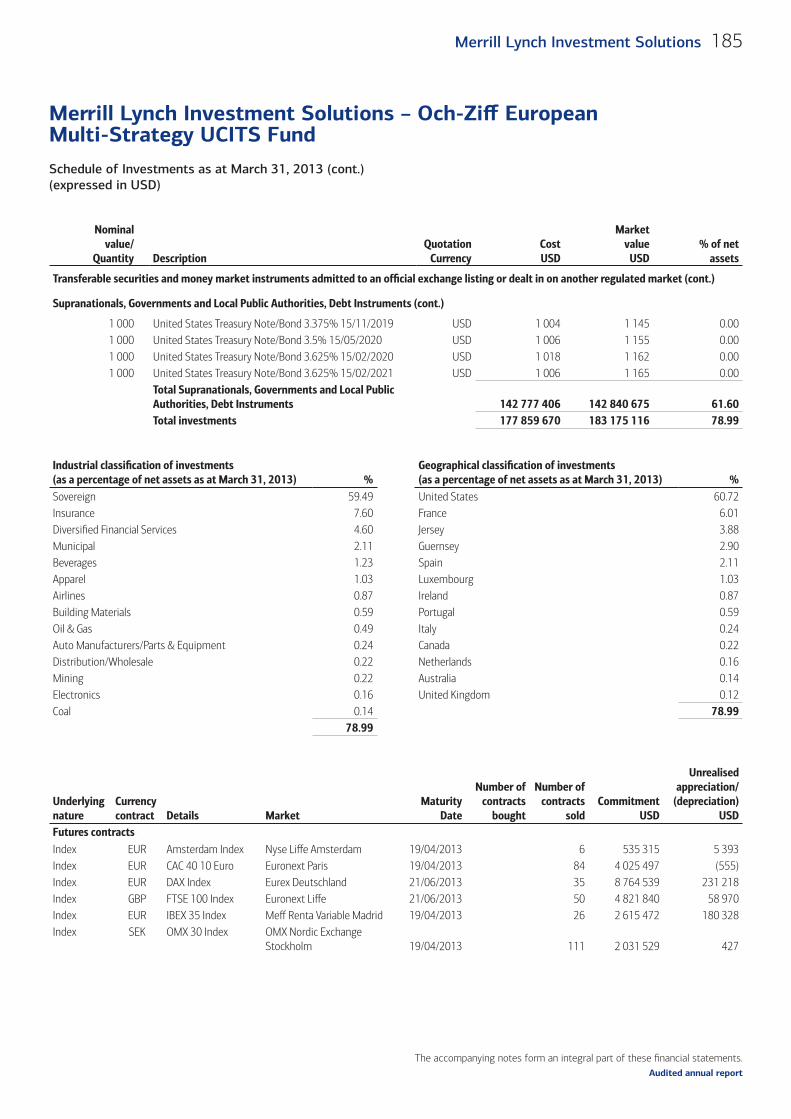
The accompanying notes form an integral part of these fi nancial statements.
Schedule of Investments as at March 31, 2013 (cont.)(expressed in USD)
Merrill Lynch Investment Solutions – Och-Ziff European Multi-Strategy UCITS Fund
185Merrill Lynch Investment Solutions
Audited annual report
Nominalvalue/
Quantity DescriptionQuotation
CurrencyCostUSD
Marketvalue
USD% of net
assets
Transferable securities and money market instruments admitted to an offi cial exchange listing or dealt in on another regulated market (cont.)
Supranationals, Governments and Local Public Authorities, Debt Instruments (cont.)
1 000 United States Treasury Note/Bond 3.375% 15/11/2019 USD 1 004 1 145 0.001 000 United States Treasury Note/Bond 3.5% 15/05/2020 USD 1 006 1 155 0.001 000 United States Treasury Note/Bond 3.625% 15/02/2020 USD 1 018 1 162 0.001 000 United States Treasury Note/Bond 3.625% 15/02/2021 USD 1 006 1 165 0.00
Total Supranationals, Governments and Local Public Authorities, Debt Instruments 142 777 406 142 840 675 61.60Total investments 177 859 670 183 175 116 78.99
Industrial classifi cation of investments (as a percentage of net assets as at March 31, 2013) %
Geographical classifi cation of investments (as a percentage of net assets as at March 31, 2013) %
Sovereign 59.49 United States 60.72Insurance 7.60 France 6.01Diversifi ed Financial Services 4.60 Jersey 3.88Municipal 2.11 Guernsey 2.90Beverages 1.23 Spain 2.11Apparel 1.03 Luxembourg 1.03Airlines 0.87 Ireland 0.87Building Materials 0.59 Portugal 0.59Oil & Gas 0.49 Italy 0.24Auto Manufacturers/Parts & Equipment 0.24 Canada 0.22Distribution/Wholesale 0.22 Netherlands 0.16Mining 0.22 Australia 0.14Electronics 0.16 United Kingdom 0.12Coal 0.14 78.99
78.99
Underlyingnature
Currencycontract Details Market
MaturityDate
Number ofcontracts
bought
Number ofcontracts
soldCommitment
USD
Unrealisedappreciation/
(depreciation)USD
Futures contracts (cont.)Index EUR Amsterdam Index Nyse Liffe Amsterdam 19/04/2013 6 535 315 5 393Index EUR CAC 40 10 Euro Euronext Paris 19/04/2013 84 4 025 497 (555)Index EUR DAX Index Eurex Deutschland 21/06/2013 35 8 764 539 231 218Index GBP FTSE 100 Index Euronext Liffe 21/06/2013 50 4 821 840 58 970Index EUR IBEX 35 Index Meff Renta Variable Madrid 19/04/2013 26 2 615 472 180 328Index SEK OMX 30 Index OMX Nordic Exchange
Stockholm 19/04/2013 111 2 031 529 427
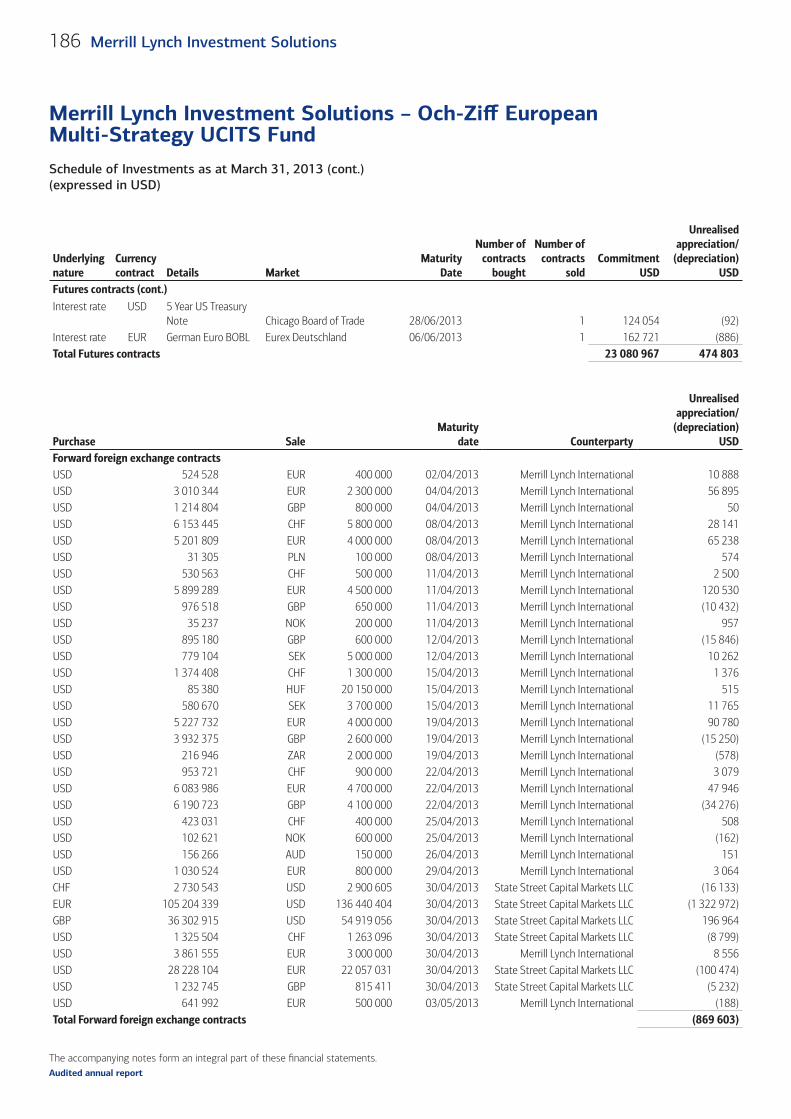
The accompanying notes form an integral part of these fi nancial statements.
Schedule of Investments as at March 31, 2013 (cont.)(expressed in USD)
Merrill Lynch Investment Solutions – Och-Ziff European Multi-Strategy UCITS Fund
186 Merrill Lynch Investment Solutions
Audited annual report
Underlyingnature
Currencycontract Details Market
MaturityDate
Number ofcontracts
bought
Number ofcontracts
soldCommitment
USD
Unrealisedappreciation/
(depreciation)USD
Futures contracts (cont.)Interest rate USD 5 Year US Treasury
Note Chicago Board of Trade 28/06/2013 1 124 054 (92)Interest rate EUR German Euro BOBL Eurex Deutschland 06/06/2013 1 162 721 (886)Total Futures contracts 23 080 967 474 803
Purchase SaleMaturity
date Counterparty
Unrealisedappreciation/
(depreciation)USD
Forward foreign exchange contractsUSD 524 528 EUR 400 000 02/04/2013 Merrill Lynch International 10 888 USD 3 010 344 EUR 2 300 000 04/04/2013 Merrill Lynch International 56 895 USD 1 214 804 GBP 800 000 04/04/2013 Merrill Lynch International 50 USD 6 153 445 CHF 5 800 000 08/04/2013 Merrill Lynch International 28 141 USD 5 201 809 EUR 4 000 000 08/04/2013 Merrill Lynch International 65 238 USD 31 305 PLN 100 000 08/04/2013 Merrill Lynch International 574 USD 530 563 CHF 500 000 11/04/2013 Merrill Lynch International 2 500 USD 5 899 289 EUR 4 500 000 11/04/2013 Merrill Lynch International 120 530 USD 976 518 GBP 650 000 11/04/2013 Merrill Lynch International (10 432)USD 35 237 NOK 200 000 11/04/2013 Merrill Lynch International 957 USD 895 180 GBP 600 000 12/04/2013 Merrill Lynch International (15 846)USD 779 104 SEK 5 000 000 12/04/2013 Merrill Lynch International 10 262 USD 1 374 408 CHF 1 300 000 15/04/2013 Merrill Lynch International 1 376 USD 85 380 HUF 20 150 000 15/04/2013 Merrill Lynch International 515 USD 580 670 SEK 3 700 000 15/04/2013 Merrill Lynch International 11 765 USD 5 227 732 EUR 4 000 000 19/04/2013 Merrill Lynch International 90 780 USD 3 932 375 GBP 2 600 000 19/04/2013 Merrill Lynch International (15 250)USD 216 946 ZAR 2 000 000 19/04/2013 Merrill Lynch International (578)USD 953 721 CHF 900 000 22/04/2013 Merrill Lynch International 3 079 USD 6 083 986 EUR 4 700 000 22/04/2013 Merrill Lynch International 47 946 USD 6 190 723 GBP 4 100 000 22/04/2013 Merrill Lynch International (34 276)USD 423 031 CHF 400 000 25/04/2013 Merrill Lynch International 508 USD 102 621 NOK 600 000 25/04/2013 Merrill Lynch International (162)USD 156 266 AUD 150 000 26/04/2013 Merrill Lynch International 151 USD 1 030 524 EUR 800 000 29/04/2013 Merrill Lynch International 3 064 CHF 2 730 543 USD 2 900 605 30/04/2013 State Street Capital Markets LLC (16 133)EUR 105 204 339 USD 136 440 404 30/04/2013 State Street Capital Markets LLC (1 322 972)GBP 36 302 915 USD 54 919 056 30/04/2013 State Street Capital Markets LLC 196 964 USD 1 325 504 CHF 1 263 096 30/04/2013 State Street Capital Markets LLC (8 799)USD 3 861 555 EUR 3 000 000 30/04/2013 Merrill Lynch International 8 556USD 28 228 104 EUR 22 057 031 30/04/2013 State Street Capital Markets LLC (100 474)USD 1 232 745 GBP 815 411 30/04/2013 State Street Capital Markets LLC (5 232)USD 641 992 EUR 500 000 03/05/2013 Merrill Lynch International (188)Total Forward foreign exchange contracts (869 603)
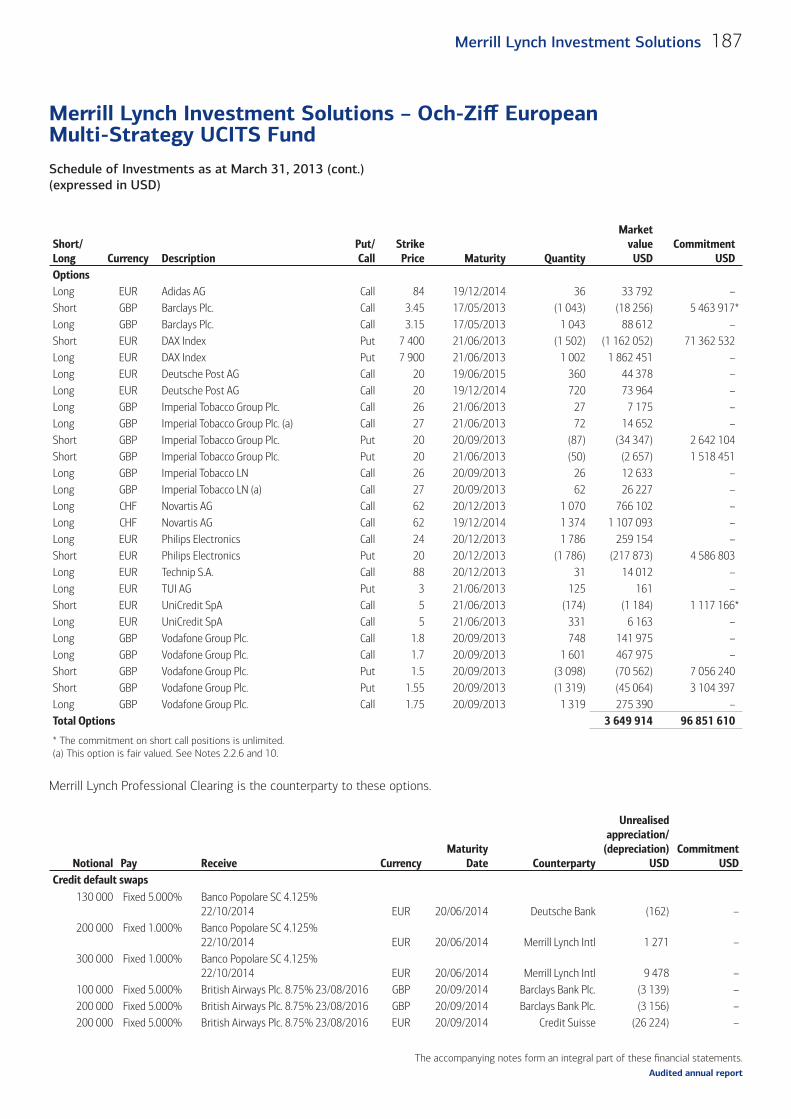
The accompanying notes form an integral part of these fi nancial statements.
Schedule of Investments as at March 31, 2013 (cont.)(expressed in USD)
Merrill Lynch Investment Solutions – Och-Ziff European Multi-Strategy UCITS Fund
187Merrill Lynch Investment Solutions
Audited annual report
Short/Long Currency Description
Put/Call
StrikePrice Maturity Quantity
Marketvalue
USDCommitment
USDOptions Long EUR Adidas AG Call 84 19/12/2014 36 33 792 –Short GBP Barclays Plc. Call 3.45 17/05/2013 (1 043) (18 256) 5 463 917*Long GBP Barclays Plc. Call 3.15 17/05/2013 1 043 88 612 –Short EUR DAX Index Put 7 400 21/06/2013 (1 502) (1 162 052) 71 362 532Long EUR DAX Index Put 7 900 21/06/2013 1 002 1 862 451 –Long EUR Deutsche Post AG Call 20 19/06/2015 360 44 378 –Long EUR Deutsche Post AG Call 20 19/12/2014 720 73 964 –Long GBP Imperial Tobacco Group Plc. Call 26 21/06/2013 27 7 175 –Long GBP Imperial Tobacco Group Plc. (a) Call 27 21/06/2013 72 14 652 –Short GBP Imperial Tobacco Group Plc. Put 20 20/09/2013 (87) (34 347) 2 642 104Short GBP Imperial Tobacco Group Plc. Put 20 21/06/2013 (50) (2 657) 1 518 451Long GBP Imperial Tobacco LN Call 26 20/09/2013 26 12 633 –Long GBP Imperial Tobacco LN (a) Call 27 20/09/2013 62 26 227 –Long CHF Novartis AG Call 62 20/12/2013 1 070 766 102 –Long CHF Novartis AG Call 62 19/12/2014 1 374 1 107 093 –Long EUR Philips Electronics Call 24 20/12/2013 1 786 259 154 –Short EUR Philips Electronics Put 20 20/12/2013 (1 786) (217 873) 4 586 803Long EUR Technip S.A. Call 88 20/12/2013 31 14 012 –Long EUR TUI AG Put 3 21/06/2013 125 161 –Short EUR UniCredit SpA Call 5 21/06/2013 (174) (1 184) 1 117 166*Long EUR UniCredit SpA Call 5 21/06/2013 331 6 163 –Long GBP Vodafone Group Plc. Call 1.8 20/09/2013 748 141 975 –Long GBP Vodafone Group Plc. Call 1.7 20/09/2013 1 601 467 975 –Short GBP Vodafone Group Plc. Put 1.5 20/09/2013 (3 098) (70 562) 7 056 240Short GBP Vodafone Group Plc. Put 1.55 20/09/2013 (1 319) (45 064) 3 104 397Long GBP Vodafone Group Plc. Call 1.75 20/09/2013 1 319 275 390 –Total Options 3 649 914 96 851 610
* The commitment on short call positions is unlimited.(a) This option is fair valued. See Notes 2.2.6 and 10.
Merrill Lynch Professional Clearing is the counterparty to these options.
Notional Pay Receive CurrencyMaturity
Date Counterparty
Unrealisedappreciation/
(depreciation)USD
CommitmentUSD
Credit default swaps 130 000 Fixed 5.000% Banco Popolare SC 4.125%
22/10/2014 EUR 20/06/2014 Deutsche Bank (162) –200 000 Fixed 1.000% Banco Popolare SC 4.125%
22/10/2014 EUR 20/06/2014 Merrill Lynch Intl 1 271 –300 000 Fixed 1.000% Banco Popolare SC 4.125%
22/10/2014 EUR 20/06/2014 Merrill Lynch Intl 9 478 –100 000 Fixed 5.000% British Airways Plc. 8.75% 23/08/2016 GBP 20/09/2014 Barclays Bank Plc. (3 139) –200 000 Fixed 5.000% British Airways Plc. 8.75% 23/08/2016 GBP 20/09/2014 Barclays Bank Plc. (3 156) –
200 000 Fixed 5.000% British Airways Plc. 8.75% 23/08/2016 EUR 20/09/2014 Credit Suisse (26 224) –
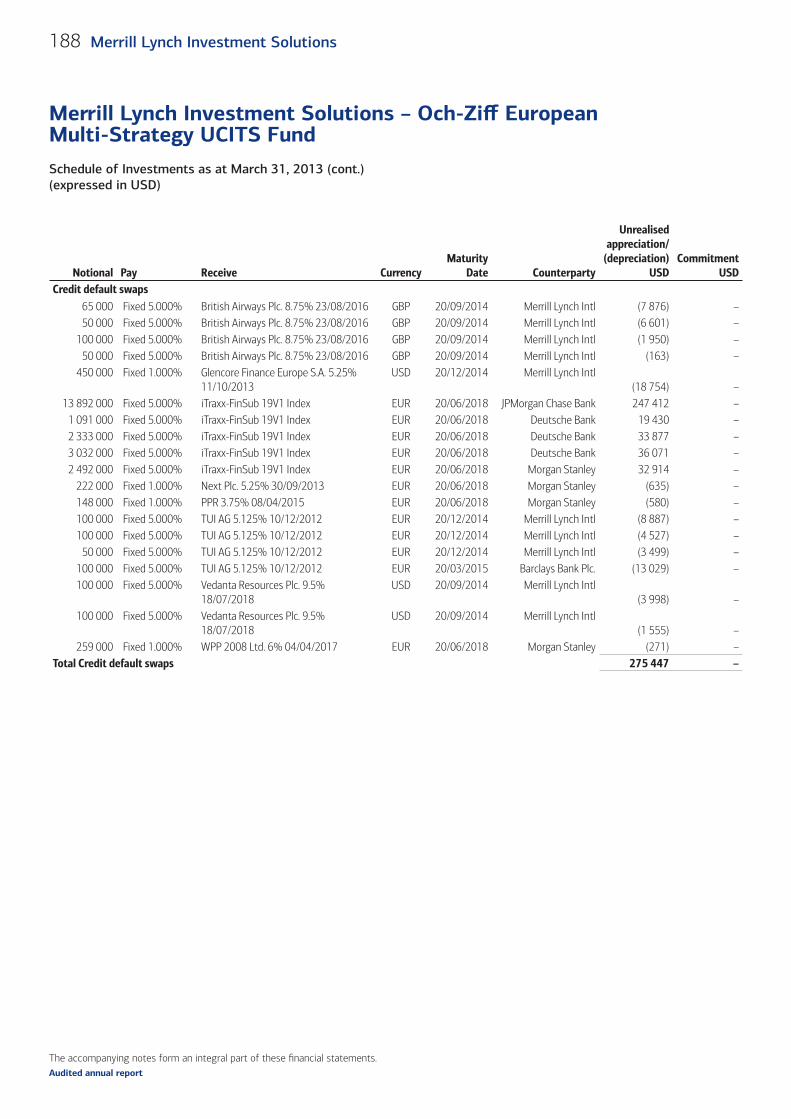
The accompanying notes form an integral part of these fi nancial statements.
Schedule of Investments as at March 31, 2013 (cont.)(expressed in USD)
Merrill Lynch Investment Solutions – Och-Ziff European Multi-Strategy UCITS Fund
188 Merrill Lynch Investment Solutions
Audited annual report
Notional Pay Receive CurrencyMaturity
Date Counterparty
Unrealisedappreciation/
(depreciation)USD
CommitmentUSD
Credit default swaps 65 000 Fixed 5.000% British Airways Plc. 8.75% 23/08/2016 GBP 20/09/2014 Merrill Lynch Intl (7 876) –50 000 Fixed 5.000% British Airways Plc. 8.75% 23/08/2016 GBP 20/09/2014 Merrill Lynch Intl (6 601) –
100 000 Fixed 5.000% British Airways Plc. 8.75% 23/08/2016 GBP 20/09/2014 Merrill Lynch Intl (1 950) – 50 000 Fixed 5.000% British Airways Plc. 8.75% 23/08/2016 GBP 20/09/2014 Merrill Lynch Intl (163) –
450 000 Fixed 1.000% Glencore Finance Europe S.A. 5.25% 11/10/2013
USD 20/12/2014 Merrill Lynch Intl(18 754) –
13 892 000 Fixed 5.000% iTraxx-FinSub 19V1 Index EUR 20/06/2018 JPMorgan Chase Bank 247 412 –1 091 000 Fixed 5.000% iTraxx-FinSub 19V1 Index EUR 20/06/2018 Deutsche Bank 19 430 –2 333 000 Fixed 5.000% iTraxx-FinSub 19V1 Index EUR 20/06/2018 Deutsche Bank 33 877 –3 032 000 Fixed 5.000% iTraxx-FinSub 19V1 Index EUR 20/06/2018 Deutsche Bank 36 071 –2 492 000 Fixed 5.000% iTraxx-FinSub 19V1 Index EUR 20/06/2018 Morgan Stanley 32 914 –
222 000 Fixed 1.000% Next Plc. 5.25% 30/09/2013 EUR 20/06/2018 Morgan Stanley (635) –148 000 Fixed 1.000% PPR 3.75% 08/04/2015 EUR 20/06/2018 Morgan Stanley (580) –100 000 Fixed 5.000% TUI AG 5.125% 10/12/2012 EUR 20/12/2014 Merrill Lynch Intl (8 887) –100 000 Fixed 5.000% TUI AG 5.125% 10/12/2012 EUR 20/12/2014 Merrill Lynch Intl (4 527) –
50 000 Fixed 5.000% TUI AG 5.125% 10/12/2012 EUR 20/12/2014 Merrill Lynch Intl (3 499) –100 000 Fixed 5.000% TUI AG 5.125% 10/12/2012 EUR 20/03/2015 Barclays Bank Plc. (13 029) –100 000 Fixed 5.000% Vedanta Resources Plc. 9.5%
18/07/2018USD 20/09/2014 Merrill Lynch Intl
(3 998) –100 000 Fixed 5.000% Vedanta Resources Plc. 9.5%
18/07/2018USD 20/09/2014 Merrill Lynch Intl
(1 555) –259 000 Fixed 1.000% WPP 2008 Ltd. 6% 04/04/2017 EUR 20/06/2018 Morgan Stanley (271) –
Total Credit default swaps 275 447 –
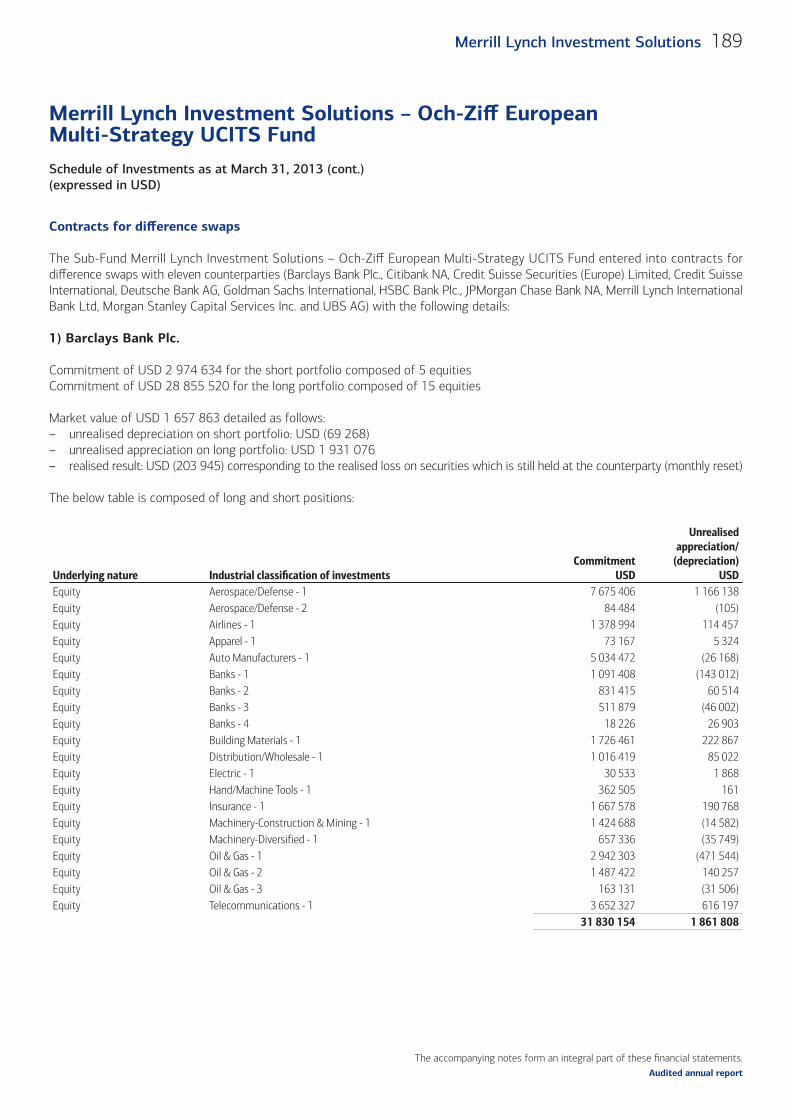
The accompanying notes form an integral part of these fi nancial statements.
Schedule of Investments as at March 31, 2013 (cont.)(expressed in USD)
Merrill Lynch Investment Solutions – Och-Ziff European Multi-Strategy UCITS Fund
189Merrill Lynch Investment Solutions
Audited annual report
Contracts for diff erence swaps
The Sub-Fund Merrill Lynch Investment Solutions – Och-Ziff European Multi-Strategy UCITS Fund entered into contracts for diff erence swaps with eleven counterparties (Barclays Bank Plc., Citibank NA, Credit Suisse Securities (Europe) Limited, Credit Suisse International, Deutsche Bank AG, Goldman Sachs International, HSBC Bank Plc., JPMorgan Chase Bank NA, Merrill Lynch International Bank Ltd, Morgan Stanley Capital Services Inc. and UBS AG) with the following details:
1) Barclays Bank Plc.
Commitment of USD 2 974 634 for the short portfolio composed of 5 equitiesCommitment of USD 28 855 520 for the long portfolio composed of 15 equities
Market value of USD 1 657 863 detailed as follows:– unrealised depreciation on short portfolio: USD (69 268)– unrealised appreciation on long portfolio: USD 1 931 076– realised result: USD (203 945) corresponding to the realised loss on securities which is still held at the counterparty (monthly reset)
The below table is composed of long and short positions:
Underlying nature Industrial classifi cation of investments Commitment
USD
Unrealised appreciation/
(depreciation)USD
Equity Aerospace/Defense - 1 7 675 406 1 166 138 Equity Aerospace/Defense - 2 84 484 (105)Equity Airlines - 1 1 378 994 114 457 Equity Apparel - 1 73 167 5 324 Equity Auto Manufacturers - 1 5 034 472 (26 168)Equity Banks - 1 1 091 408 (143 012)Equity Banks - 2 831 415 60 514 Equity Banks - 3 511 879 (46 002)Equity Banks - 4 18 226 26 903 Equity Building Materials - 1 1 726 461 222 867 Equity Distribution/Wholesale - 1 1 016 419 85 022 Equity Electric - 1 30 533 1 868 Equity Hand/Machine Tools - 1 362 505 161 Equity Insurance - 1 1 667 578 190 768 Equity Machinery-Construction & Mining - 1 1 424 688 (14 582)Equity Machinery-Diversified - 1 657 336 (35 749)Equity Oil & Gas - 1 2 942 303 (471 544)Equity Oil & Gas - 2 1 487 422 140 257 Equity Oil & Gas - 3 163 131 (31 506)Equity Telecommunications - 1 3 652 327 616 197
31 830 154 1 861 808
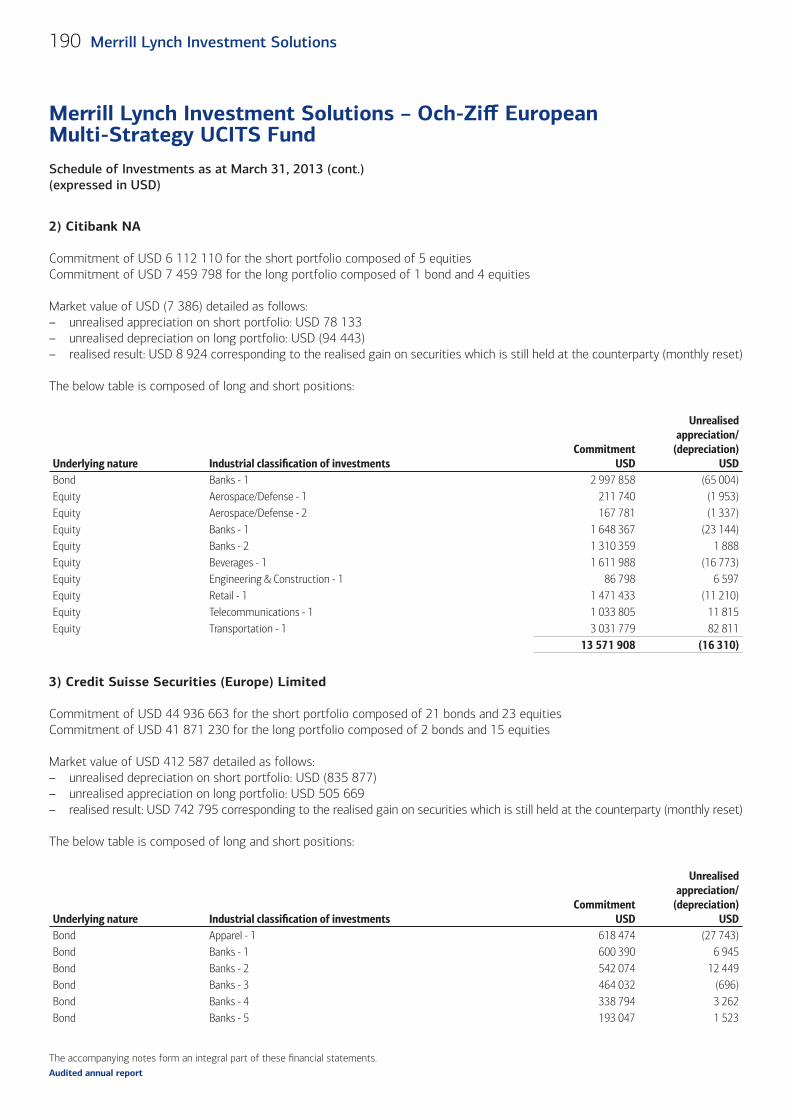
The accompanying notes form an integral part of these fi nancial statements.
Schedule of Investments as at March 31, 2013 (cont.)(expressed in USD)
Merrill Lynch Investment Solutions – Och-Ziff European Multi-Strategy UCITS Fund
190 Merrill Lynch Investment Solutions
Audited annual report
2) Citibank NA
Commitment of USD 6 112 110 for the short portfolio composed of 5 equitiesCommitment of USD 7 459 798 for the long portfolio composed of 1 bond and 4 equities
Market value of USD (7 386) detailed as follows:– unrealised appreciation on short portfolio: USD 78 133– unrealised depreciation on long portfolio: USD (94 443)– realised result: USD 8 924 corresponding to the realised gain on securities which is still held at the counterparty (monthly reset)
The below table is composed of long and short positions:
Underlying nature Industrial classifi cation of investments Commitment
USD
Unrealised appreciation/
(depreciation)USD
Bond Banks - 1 2 997 858 (65 004)Equity Aerospace/Defense - 1 211 740 (1 953)Equity Aerospace/Defense - 2 167 781 (1 337)Equity Banks - 1 1 648 367 (23 144)Equity Banks - 2 1 310 359 1 888 Equity Beverages - 1 1 611 988 (16 773)Equity Engineering & Construction - 1 86 798 6 597 Equity Retail - 1 1 471 433 (11 210)Equity Telecommunications - 1 1 033 805 11 815 Equity Transportation - 1 3 031 779 82 811
13 571 908 (16 310)
3) Credit Suisse Securities (Europe) Limited
Commitment of USD 44 936 663 for the short portfolio composed of 21 bonds and 23 equitiesCommitment of USD 41 871 230 for the long portfolio composed of 2 bonds and 15 equities
Market value of USD 412 587 detailed as follows:– unrealised depreciation on short portfolio: USD (835 877)– unrealised appreciation on long portfolio: USD 505 669– realised result: USD 742 795 corresponding to the realised gain on securities which is still held at the counterparty (monthly reset)
The below table is composed of long and short positions:
Underlying nature Industrial classifi cation of investments Commitment
USD
Unrealised appreciation/
(depreciation)USD
Bond Apparel - 1 618 474 (27 743)Bond Banks - 1 600 390 6 945 Bond Banks - 2 542 074 12 449 Bond Banks - 3 464 032 (696)Bond Banks - 4 338 794 3 262 Bond Banks - 5 193 047 1 523
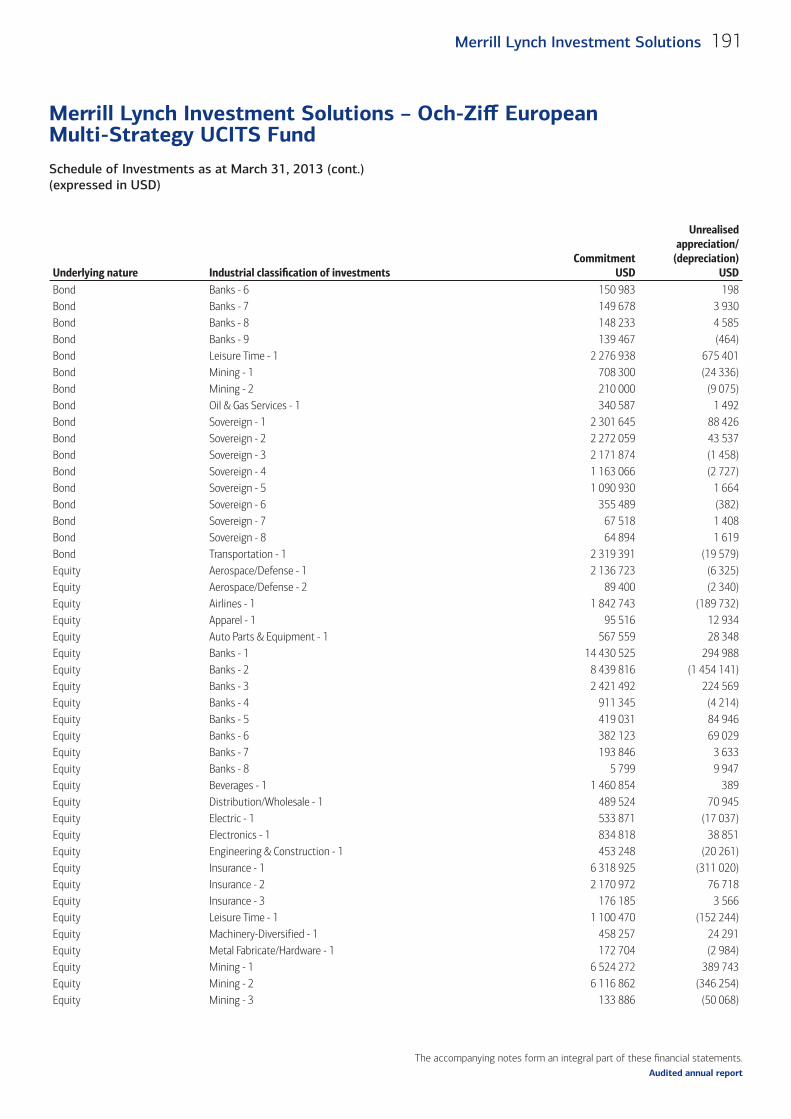
The accompanying notes form an integral part of these fi nancial statements.
Schedule of Investments as at March 31, 2013 (cont.)(expressed in USD)
Merrill Lynch Investment Solutions – Och-Ziff European Multi-Strategy UCITS Fund
191Merrill Lynch Investment Solutions
Audited annual report
Underlying nature Industrial classifi cation of investments Commitment
USD
Unrealised appreciation/
(depreciation)USD
Bond Banks - 6 150 983 198 Bond Banks - 7 149 678 3 930 Bond Banks - 8 148 233 4 585 Bond Banks - 9 139 467 (464)Bond Leisure Time - 1 2 276 938 675 401 Bond Mining - 1 708 300 (24 336)Bond Mining - 2 210 000 (9 075)Bond Oil & Gas Services - 1 340 587 1 492 Bond Sovereign - 1 2 301 645 88 426 Bond Sovereign - 2 2 272 059 43 537 Bond Sovereign - 3 2 171 874 (1 458)Bond Sovereign - 4 1 163 066 (2 727)Bond Sovereign - 5 1 090 930 1 664 Bond Sovereign - 6 355 489 (382)Bond Sovereign - 7 67 518 1 408 Bond Sovereign - 8 64 894 1 619 Bond Transportation - 1 2 319 391 (19 579)Equity Aerospace/Defense - 1 2 136 723 (6 325)Equity Aerospace/Defense - 2 89 400 (2 340)Equity Airlines - 1 1 842 743 (189 732)Equity Apparel - 1 95 516 12 934 Equity Auto Parts & Equipment - 1 567 559 28 348 Equity Banks - 1 14 430 525 294 988 Equity Banks - 2 8 439 816 (1 454 141)Equity Banks - 3 2 421 492 224 569 Equity Banks - 4 911 345 (4 214)Equity Banks - 5 419 031 84 946 Equity Banks - 6 382 123 69 029 Equity Banks - 7 193 846 3 633 Equity Banks - 8 5 799 9 947 Equity Beverages - 1 1 460 854 389 Equity Distribution/Wholesale - 1 489 524 70 945 Equity Electric - 1 533 871 (17 037)Equity Electronics - 1 834 818 38 851 Equity Engineering & Construction - 1 453 248 (20 261)Equity Insurance - 1 6 318 925 (311 020)Equity Insurance - 2 2 170 972 76 718 Equity Insurance - 3 176 185 3 566 Equity Leisure Time - 1 1 100 470 (152 244)Equity Machinery-Diversified - 1 458 257 24 291 Equity Metal Fabricate/Hardware - 1 172 704 (2 984)Equity Mining - 1 6 524 272 389 743 Equity Mining - 2 6 116 862 (346 254)Equity Mining - 3 133 886 (50 068)
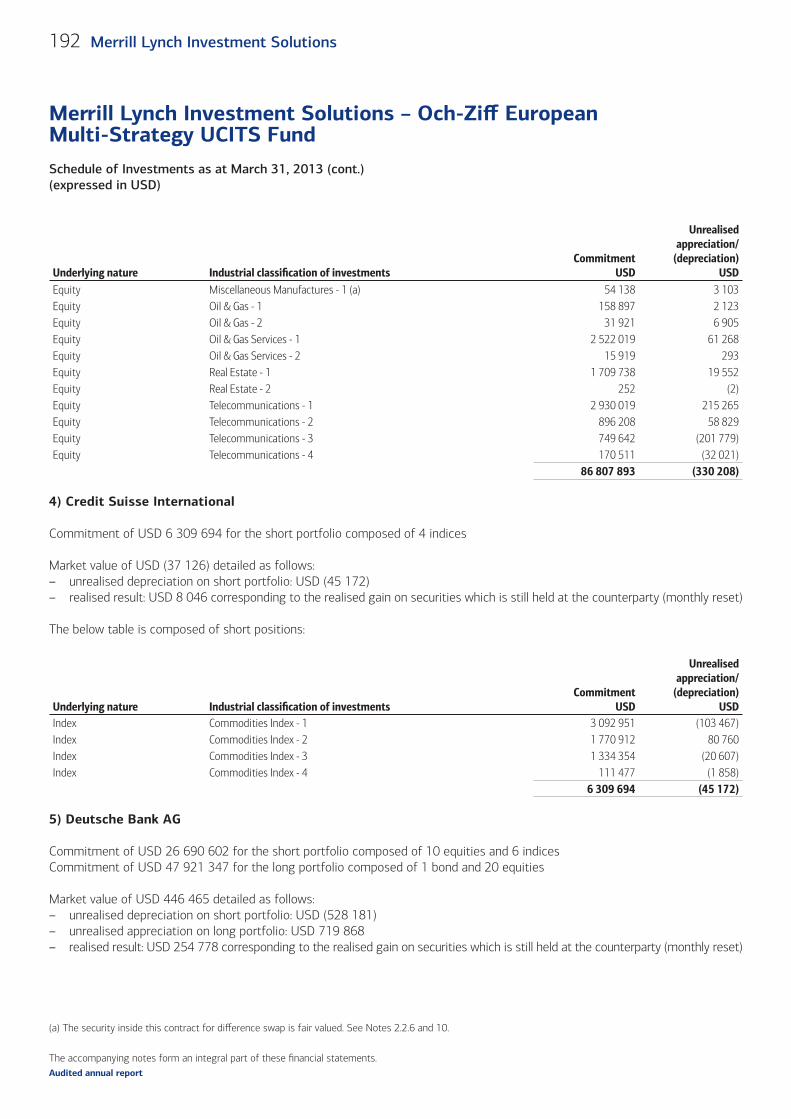
The accompanying notes form an integral part of these fi nancial statements.
Schedule of Investments as at March 31, 2013 (cont.)(expressed in USD)
Merrill Lynch Investment Solutions – Och-Ziff European Multi-Strategy UCITS Fund
192 Merrill Lynch Investment Solutions
Audited annual report
Underlying nature Industrial classifi cation of investments Commitment
USD
Unrealised appreciation/
(depreciation)USD
Equity Miscellaneous Manufactures - 1 (a) 54 138 3 103 Equity Oil & Gas - 1 158 897 2 123 Equity Oil & Gas - 2 31 921 6 905 Equity Oil & Gas Services - 1 2 522 019 61 268 Equity Oil & Gas Services - 2 15 919 293 Equity Real Estate - 1 1 709 738 19 552 Equity Real Estate - 2 252 (2)Equity Telecommunications - 1 2 930 019 215 265 Equity Telecommunications - 2 896 208 58 829 Equity Telecommunications - 3 749 642 (201 779)Equity Telecommunications - 4 170 511 (32 021)
86 807 893 (330 208)
4) Credit Suisse International
Commitment of USD 6 309 694 for the short portfolio composed of 4 indices
Market value of USD (37 126) detailed as follows:– unrealised depreciation on short portfolio: USD (45 172)– realised result: USD 8 046 corresponding to the realised gain on securities which is still held at the counterparty (monthly reset)
The below table is composed of short positions:
Underlying nature Industrial classifi cation of investments Commitment
USD
Unrealised appreciation/
(depreciation)USD
Index Commodities Index - 1 3 092 951 (103 467)Index Commodities Index - 2 1 770 912 80 760 Index Commodities Index - 3 1 334 354 (20 607)Index Commodities Index - 4 111 477 (1 858)
6 309 694 (45 172)
5) Deutsche Bank AG
Commitment of USD 26 690 602 for the short portfolio composed of 10 equities and 6 indicesCommitment of USD 47 921 347 for the long portfolio composed of 1 bond and 20 equities
Market value of USD 446 465 detailed as follows:– unrealised depreciation on short portfolio: USD (528 181)– unrealised appreciation on long portfolio: USD 719 868– realised result: USD 254 778 corresponding to the realised gain on securities which is still held at the counterparty (monthly reset)
(a) The security inside this contract for diff erence swap is fair valued. See Notes 2.2.6 and 10.
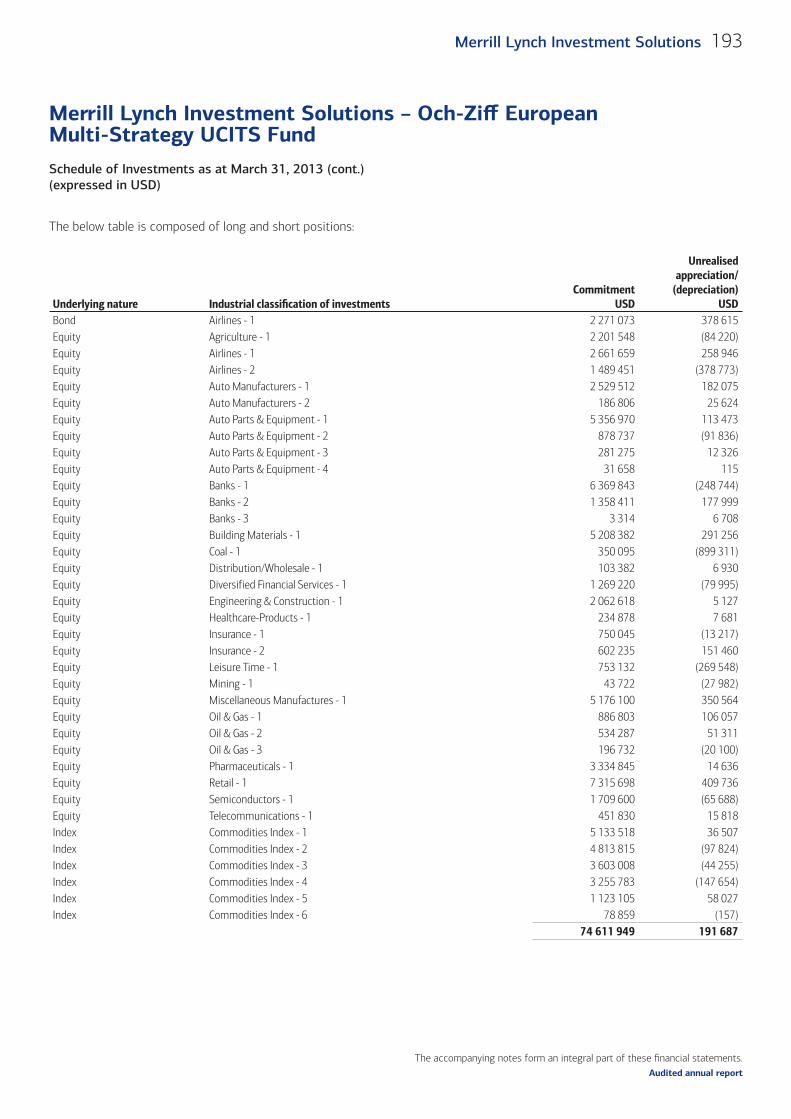
The accompanying notes form an integral part of these fi nancial statements.
Schedule of Investments as at March 31, 2013 (cont.)(expressed in USD)
Merrill Lynch Investment Solutions – Och-Ziff European Multi-Strategy UCITS Fund
193Merrill Lynch Investment Solutions
Audited annual report
The below table is composed of long and short positions:
Underlying nature Industrial classifi cation of investments Commitment
USD
Unrealised appreciation/
(depreciation)USD
Bond Airlines - 1 2 271 073 378 615 Equity Agriculture - 1 2 201 548 (84 220)Equity Airlines - 1 2 661 659 258 946 Equity Airlines - 2 1 489 451 (378 773)Equity Auto Manufacturers - 1 2 529 512 182 075 Equity Auto Manufacturers - 2 186 806 25 624 Equity Auto Parts & Equipment - 1 5 356 970 113 473 Equity Auto Parts & Equipment - 2 878 737 (91 836)Equity Auto Parts & Equipment - 3 281 275 12 326 Equity Auto Parts & Equipment - 4 31 658 115 Equity Banks - 1 6 369 843 (248 744)Equity Banks - 2 1 358 411 177 999 Equity Banks - 3 3 314 6 708 Equity Building Materials - 1 5 208 382 291 256 Equity Coal - 1 350 095 (899 311)Equity Distribution/Wholesale - 1 103 382 6 930 Equity Diversified Financial Services - 1 1 269 220 (79 995)Equity Engineering & Construction - 1 2 062 618 5 127 Equity Healthcare-Products - 1 234 878 7 681 Equity Insurance - 1 750 045 (13 217)Equity Insurance - 2 602 235 151 460 Equity Leisure Time - 1 753 132 (269 548)Equity Mining - 1 43 722 (27 982)Equity Miscellaneous Manufactures - 1 5 176 100 350 564 Equity Oil & Gas - 1 886 803 106 057 Equity Oil & Gas - 2 534 287 51 311 Equity Oil & Gas - 3 196 732 (20 100)Equity Pharmaceuticals - 1 3 334 845 14 636 Equity Retail - 1 7 315 698 409 736 Equity Semiconductors - 1 1 709 600 (65 688)Equity Telecommunications - 1 451 830 15 818 Index Commodities Index - 1 5 133 518 36 507 Index Commodities Index - 2 4 813 815 (97 824)Index Commodities Index - 3 3 603 008 (44 255)Index Commodities Index - 4 3 255 783 (147 654)Index Commodities Index - 5 1 123 105 58 027 Index Commodities Index - 6 78 859 (157)
74 611 949 191 687
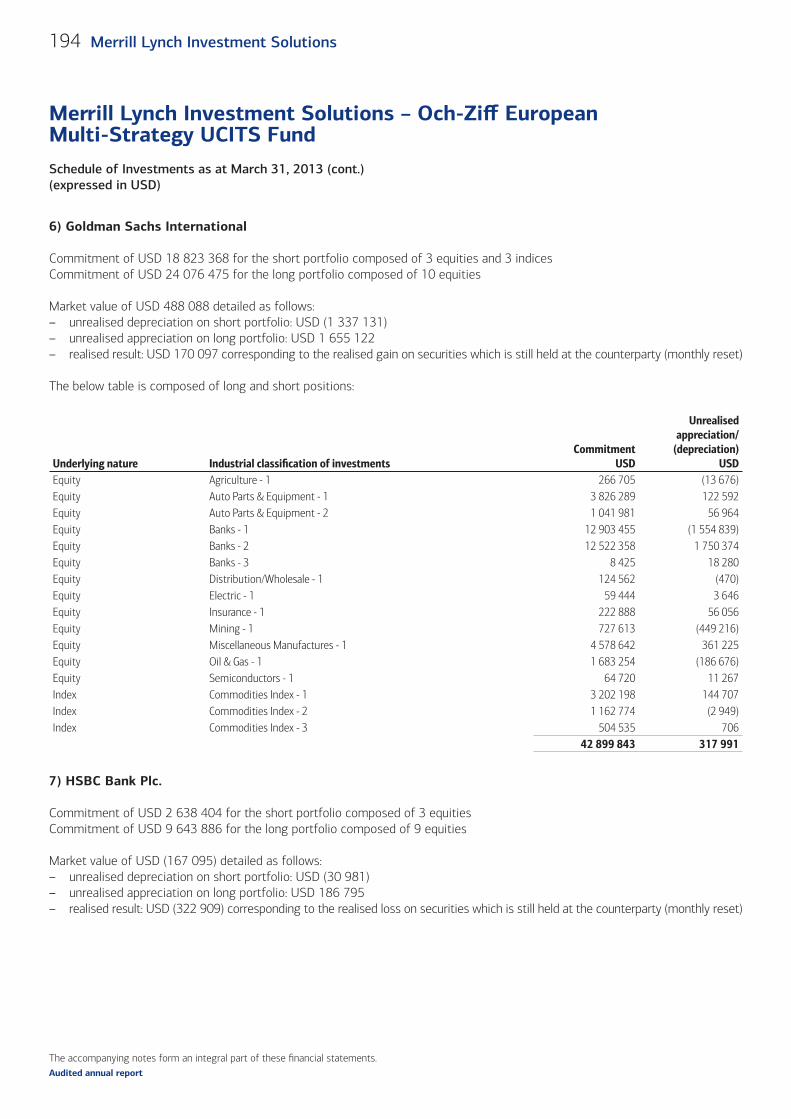
The accompanying notes form an integral part of these fi nancial statements.
Schedule of Investments as at March 31, 2013 (cont.)(expressed in USD)
Merrill Lynch Investment Solutions – Och-Ziff European Multi-Strategy UCITS Fund
194 Merrill Lynch Investment Solutions
Audited annual report
6) Goldman Sachs International
Commitment of USD 18 823 368 for the short portfolio composed of 3 equities and 3 indicesCommitment of USD 24 076 475 for the long portfolio composed of 10 equities
Market value of USD 488 088 detailed as follows:– unrealised depreciation on short portfolio: USD (1 337 131)– unrealised appreciation on long portfolio: USD 1 655 122– realised result: USD 170 097 corresponding to the realised gain on securities which is still held at the counterparty (monthly reset)
The below table is composed of long and short positions:
Underlying nature Industrial classifi cation of investments Commitment
USD
Unrealised appreciation/
(depreciation)USD
Equity Agriculture - 1 266 705 (13 676)Equity Auto Parts & Equipment - 1 3 826 289 122 592 Equity Auto Parts & Equipment - 2 1 041 981 56 964 Equity Banks - 1 12 903 455 (1 554 839)Equity Banks - 2 12 522 358 1 750 374 Equity Banks - 3 8 425 18 280 Equity Distribution/Wholesale - 1 124 562 (470)Equity Electric - 1 59 444 3 646 Equity Insurance - 1 222 888 56 056 Equity Mining - 1 727 613 (449 216)Equity Miscellaneous Manufactures - 1 4 578 642 361 225 Equity Oil & Gas - 1 1 683 254 (186 676)Equity Semiconductors - 1 64 720 11 267 Index Commodities Index - 1 3 202 198 144 707 Index Commodities Index - 2 1 162 774 (2 949)Index Commodities Index - 3 504 535 706
42 899 843 317 991
7) HSBC Bank Plc.
Commitment of USD 2 638 404 for the short portfolio composed of 3 equitiesCommitment of USD 9 643 886 for the long portfolio composed of 9 equities
Market value of USD (167 095) detailed as follows:– unrealised depreciation on short portfolio: USD (30 981)– unrealised appreciation on long portfolio: USD 186 795– realised result: USD (322 909) corresponding to the realised loss on securities which is still held at the counterparty (monthly reset)
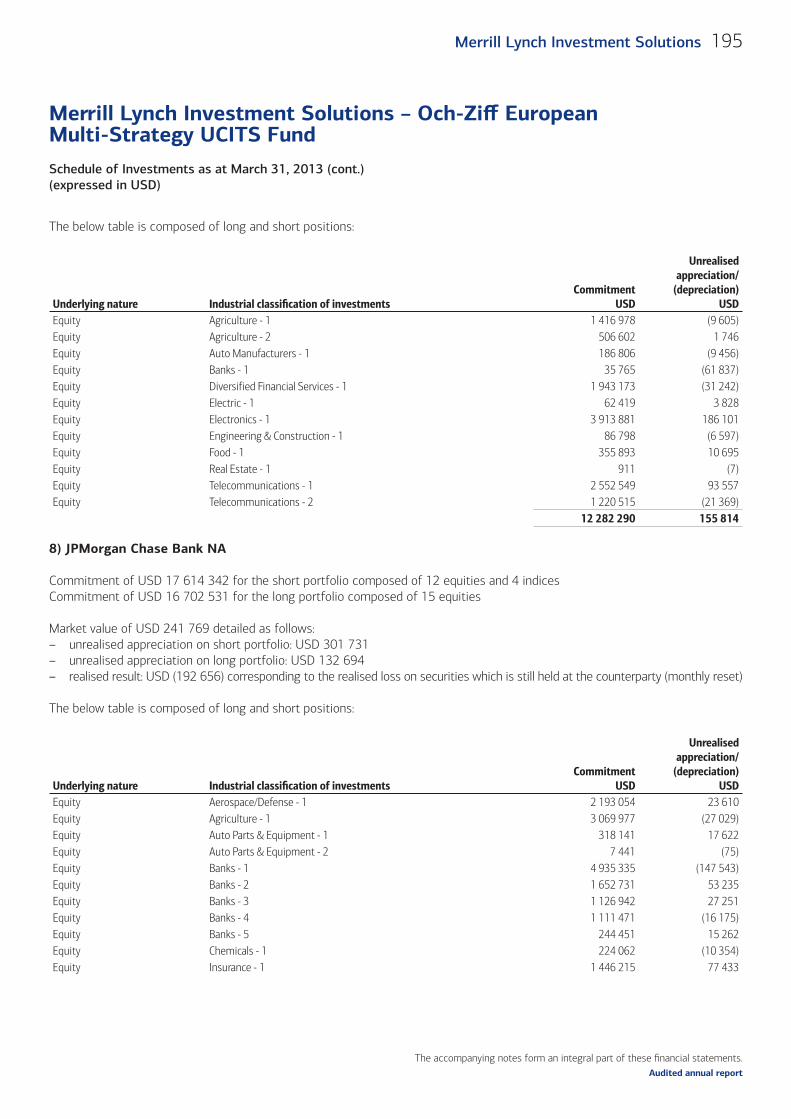
The accompanying notes form an integral part of these fi nancial statements.
Schedule of Investments as at March 31, 2013 (cont.)(expressed in USD)
Merrill Lynch Investment Solutions – Och-Ziff European Multi-Strategy UCITS Fund
195Merrill Lynch Investment Solutions
Audited annual report
The below table is composed of long and short positions:
Underlying nature Industrial classifi cation of investments Commitment
USD
Unrealised appreciation/
(depreciation)USD
Equity Agriculture - 1 1 416 978 (9 605)Equity Agriculture - 2 506 602 1 746 Equity Auto Manufacturers - 1 186 806 (9 456)Equity Banks - 1 35 765 (61 837)Equity Diversified Financial Services - 1 1 943 173 (31 242)Equity Electric - 1 62 419 3 828 Equity Electronics - 1 3 913 881 186 101 Equity Engineering & Construction - 1 86 798 (6 597)Equity Food - 1 355 893 10 695 Equity Real Estate - 1 911 (7)Equity Telecommunications - 1 2 552 549 93 557 Equity Telecommunications - 2 1 220 515 (21 369)
12 282 290 155 814
8) JPMorgan Chase Bank NA
Commitment of USD 17 614 342 for the short portfolio composed of 12 equities and 4 indicesCommitment of USD 16 702 531 for the long portfolio composed of 15 equities
Market value of USD 241 769 detailed as follows:– unrealised appreciation on short portfolio: USD 301 731– unrealised appreciation on long portfolio: USD 132 694– realised result: USD (192 656) corresponding to the realised loss on securities which is still held at the counterparty (monthly reset)
The below table is composed of long and short positions:
Underlying nature Industrial classifi cation of investments Commitment
USD
Unrealised appreciation/
(depreciation)USD
Equity Aerospace/Defense - 1 2 193 054 23 610 Equity Agriculture - 1 3 069 977 (27 029)Equity Auto Parts & Equipment - 1 318 141 17 622 Equity Auto Parts & Equipment - 2 7 441 (75)Equity Banks - 1 4 935 335 (147 543)Equity Banks - 2 1 652 731 53 235 Equity Banks - 3 1 126 942 27 251 Equity Banks - 4 1 111 471 (16 175)Equity Banks - 5 244 451 15 262 Equity Chemicals - 1 224 062 (10 354)Equity Insurance - 1 1 446 215 77 433
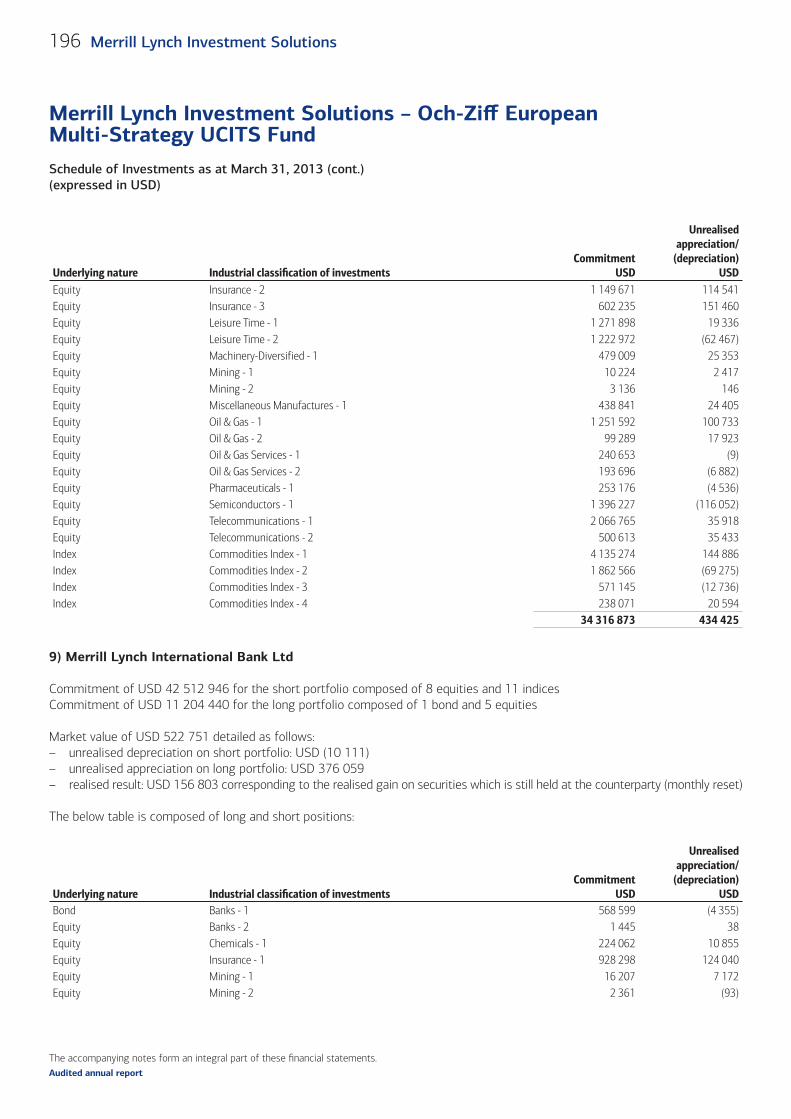
The accompanying notes form an integral part of these fi nancial statements.
Schedule of Investments as at March 31, 2013 (cont.)(expressed in USD)
Merrill Lynch Investment Solutions – Och-Ziff European Multi-Strategy UCITS Fund
196 Merrill Lynch Investment Solutions
Audited annual report
Underlying nature Industrial classifi cation of investments Commitment
USD
Unrealised appreciation/
(depreciation)USD
Equity Insurance - 2 1 149 671 114 541 Equity Insurance - 3 602 235 151 460 Equity Leisure Time - 1 1 271 898 19 336 Equity Leisure Time - 2 1 222 972 (62 467)Equity Machinery-Diversified - 1 479 009 25 353 Equity Mining - 1 10 224 2 417 Equity Mining - 2 3 136 146 Equity Miscellaneous Manufactures - 1 438 841 24 405 Equity Oil & Gas - 1 1 251 592 100 733 Equity Oil & Gas - 2 99 289 17 923 Equity Oil & Gas Services - 1 240 653 (9)Equity Oil & Gas Services - 2 193 696 (6 882)Equity Pharmaceuticals - 1 253 176 (4 536)Equity Semiconductors - 1 1 396 227 (116 052)Equity Telecommunications - 1 2 066 765 35 918 Equity Telecommunications - 2 500 613 35 433 Index Commodities Index - 1 4 135 274 144 886 Index Commodities Index - 2 1 862 566 (69 275)Index Commodities Index - 3 571 145 (12 736)Index Commodities Index - 4 238 071 20 594
34 316 873 434 425
9) Merrill Lynch International Bank Ltd
Commitment of USD 42 512 946 for the short portfolio composed of 8 equities and 11 indicesCommitment of USD 11 204 440 for the long portfolio composed of 1 bond and 5 equities
Market value of USD 522 751 detailed as follows:– unrealised depreciation on short portfolio: USD (10 111)– unrealised appreciation on long portfolio: USD 376 059– realised result: USD 156 803 corresponding to the realised gain on securities which is still held at the counterparty (monthly reset)
The below table is composed of long and short positions:
Underlying nature Industrial classifi cation of investments Commitment
USD
Unrealised appreciation/
(depreciation)USD
Bond Banks - 1 568 599 (4 355)Equity Banks - 2 1 445 38 Equity Chemicals - 1 224 062 10 855 Equity Insurance - 1 928 298 124 040 Equity Mining - 1 16 207 7 172 Equity Mining - 2 2 361 (93)
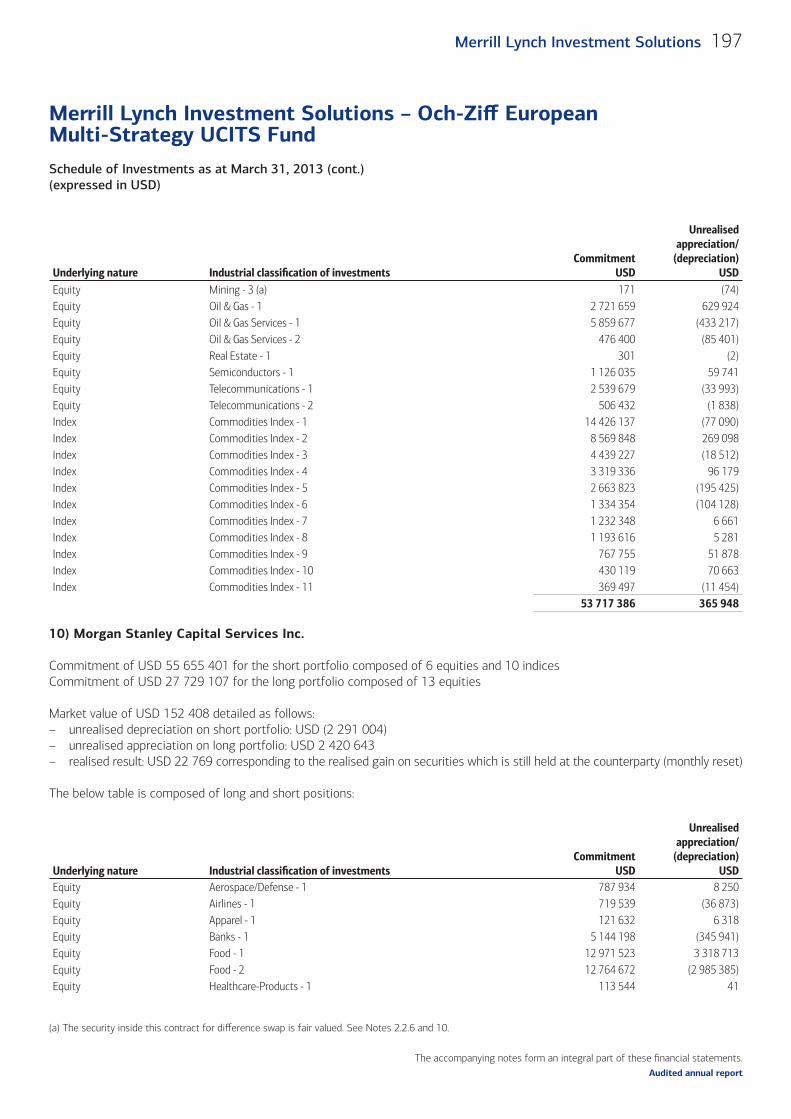
The accompanying notes form an integral part of these fi nancial statements.
Schedule of Investments as at March 31, 2013 (cont.)(expressed in USD)
Merrill Lynch Investment Solutions – Och-Ziff European Multi-Strategy UCITS Fund
197Merrill Lynch Investment Solutions
Audited annual report
Underlying nature Industrial classifi cation of investments Commitment
USD
Unrealised appreciation/
(depreciation)USD
Equity Mining - 3 (a) 171 (74)Equity Oil & Gas - 1 2 721 659 629 924 Equity Oil & Gas Services - 1 5 859 677 (433 217)Equity Oil & Gas Services - 2 476 400 (85 401)Equity Real Estate - 1 301 (2)Equity Semiconductors - 1 1 126 035 59 741 Equity Telecommunications - 1 2 539 679 (33 993)Equity Telecommunications - 2 506 432 (1 838)Index Commodities Index - 1 14 426 137 (77 090)Index Commodities Index - 2 8 569 848 269 098 Index Commodities Index - 3 4 439 227 (18 512)Index Commodities Index - 4 3 319 336 96 179 Index Commodities Index - 5 2 663 823 (195 425)Index Commodities Index - 6 1 334 354 (104 128)Index Commodities Index - 7 1 232 348 6 661 Index Commodities Index - 8 1 193 616 5 281 Index Commodities Index - 9 767 755 51 878 Index Commodities Index - 10 430 119 70 663 Index Commodities Index - 11 369 497 (11 454)
53 717 386 365 948
10) Morgan Stanley Capital Services Inc.
Commitment of USD 55 655 401 for the short portfolio composed of 6 equities and 10 indicesCommitment of USD 27 729 107 for the long portfolio composed of 13 equities
Market value of USD 152 408 detailed as follows:– unrealised depreciation on short portfolio: USD (2 291 004)– unrealised appreciation on long portfolio: USD 2 420 643– realised result: USD 22 769 corresponding to the realised gain on securities which is still held at the counterparty (monthly reset)
The below table is composed of long and short positions:
Underlying nature Industrial classifi cation of investments Commitment
USD
Unrealised appreciation/
(depreciation)USD
Equity Aerospace/Defense - 1 787 934 8 250 Equity Airlines - 1 719 539 (36 873)Equity Apparel - 1 121 632 6 318 Equity Banks - 1 5 144 198 (345 941)Equity Food - 1 12 971 523 3 318 713 Equity Food - 2 12 764 672 (2 985 385)Equity Healthcare-Products - 1 113 544 41
(a) The security inside this contract for diff erence swap is fair valued. See Notes 2.2.6 and 10.
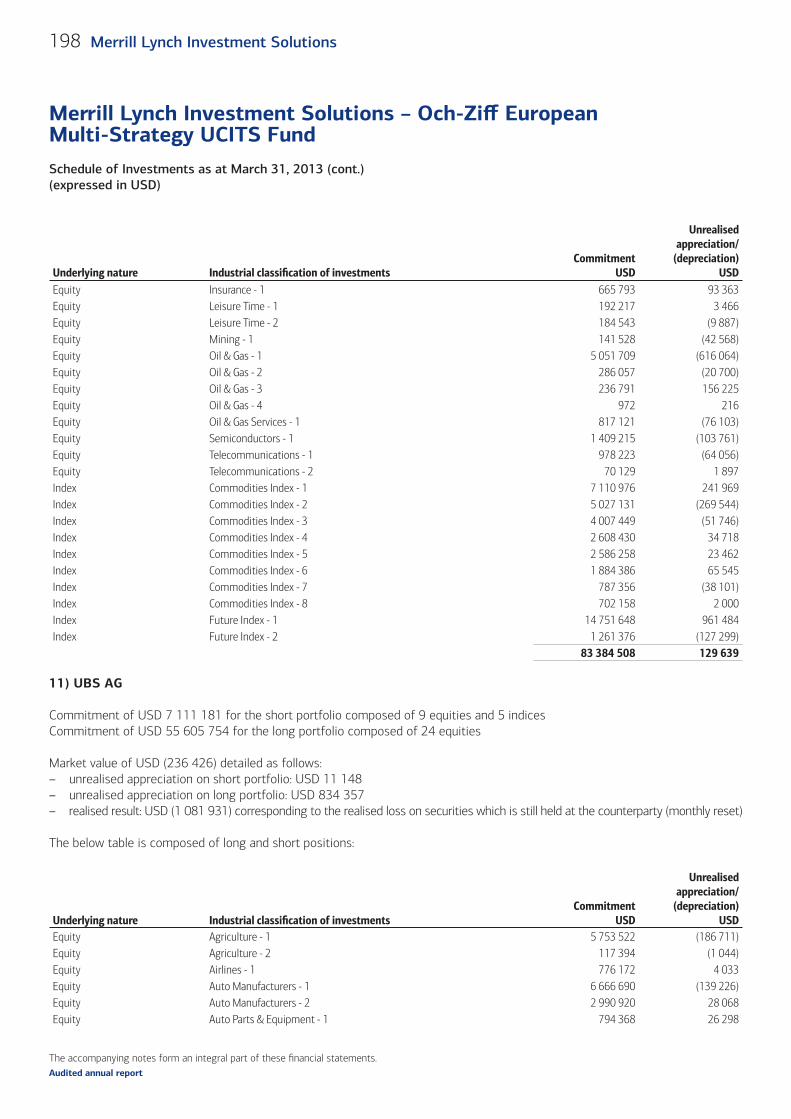
The accompanying notes form an integral part of these fi nancial statements.
Schedule of Investments as at March 31, 2013 (cont.)(expressed in USD)
Merrill Lynch Investment Solutions – Och-Ziff European Multi-Strategy UCITS Fund
198 Merrill Lynch Investment Solutions
Audited annual report
Underlying nature Industrial classifi cation of investments Commitment
USD
Unrealised appreciation/
(depreciation)USD
Equity Insurance - 1 665 793 93 363 Equity Leisure Time - 1 192 217 3 466 Equity Leisure Time - 2 184 543 (9 887)Equity Mining - 1 141 528 (42 568)Equity Oil & Gas - 1 5 051 709 (616 064)Equity Oil & Gas - 2 286 057 (20 700)Equity Oil & Gas - 3 236 791 156 225 Equity Oil & Gas - 4 972 216 Equity Oil & Gas Services - 1 817 121 (76 103)Equity Semiconductors - 1 1 409 215 (103 761)Equity Telecommunications - 1 978 223 (64 056)Equity Telecommunications - 2 70 129 1 897 Index Commodities Index - 1 7 110 976 241 969 Index Commodities Index - 2 5 027 131 (269 544)Index Commodities Index - 3 4 007 449 (51 746)Index Commodities Index - 4 2 608 430 34 718 Index Commodities Index - 5 2 586 258 23 462 Index Commodities Index - 6 1 884 386 65 545 Index Commodities Index - 7 787 356 (38 101)Index Commodities Index - 8 702 158 2 000 Index Future Index - 1 14 751 648 961 484 Index Future Index - 2 1 261 376 (127 299)
83 384 508 129 639
11) UBS AG
Commitment of USD 7 111 181 for the short portfolio composed of 9 equities and 5 indicesCommitment of USD 55 605 754 for the long portfolio composed of 24 equities
Market value of USD (236 426) detailed as follows:– unrealised appreciation on short portfolio: USD 11 148– unrealised appreciation on long portfolio: USD 834 357– realised result: USD (1 081 931) corresponding to the realised loss on securities which is still held at the counterparty (monthly reset)
The below table is composed of long and short positions:
Underlying nature Industrial classifi cation of investments Commitment
USD
Unrealised appreciation/
(depreciation)USD
Equity Agriculture - 1 5 753 522 (186 711)Equity Agriculture - 2 117 394 (1 044)Equity Airlines - 1 776 172 4 033 Equity Auto Manufacturers - 1 6 666 690 (139 226)Equity Auto Manufacturers - 2 2 990 920 28 068 Equity Auto Parts & Equipment - 1 794 368 26 298
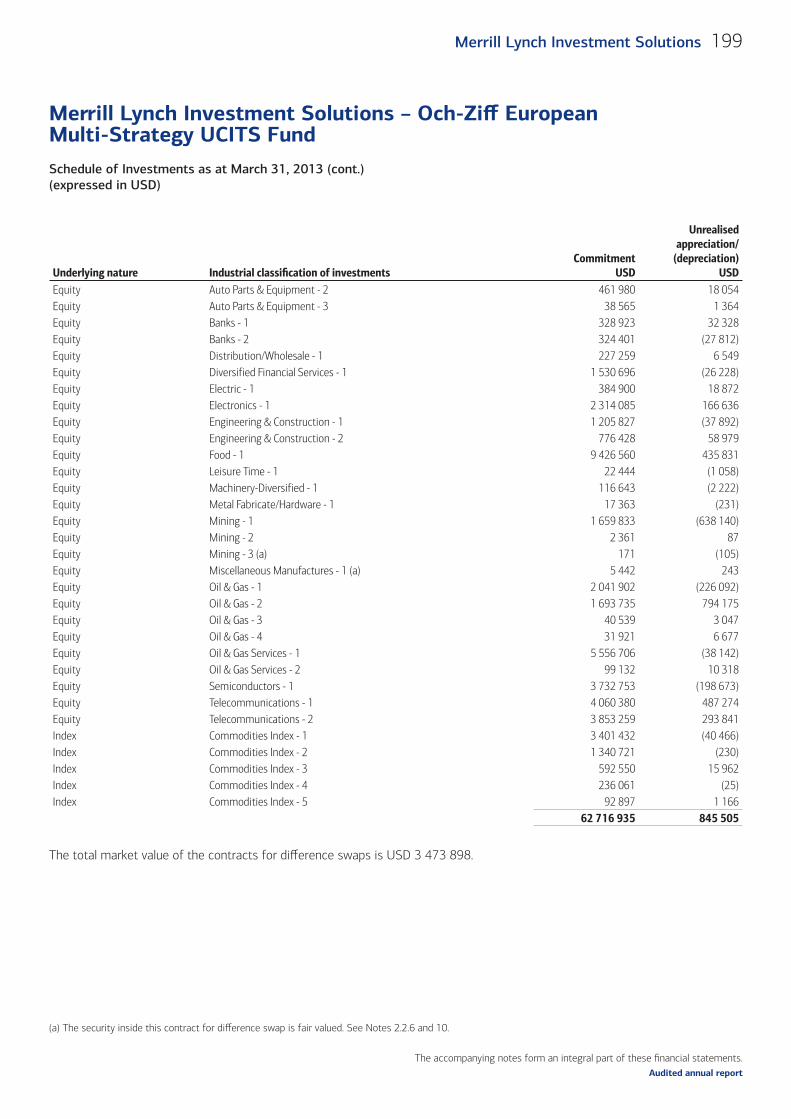
The accompanying notes form an integral part of these fi nancial statements.
Schedule of Investments as at March 31, 2013 (cont.)(expressed in USD)
Merrill Lynch Investment Solutions – Och-Ziff European Multi-Strategy UCITS Fund
199Merrill Lynch Investment Solutions
Audited annual report
Underlying nature Industrial classifi cation of investments Commitment
USD
Unrealised appreciation/
(depreciation)USD
Equity Auto Parts & Equipment - 2 461 980 18 054 Equity Auto Parts & Equipment - 3 38 565 1 364 Equity Banks - 1 328 923 32 328 Equity Banks - 2 324 401 (27 812)Equity Distribution/Wholesale - 1 227 259 6 549 Equity Diversified Financial Services - 1 1 530 696 (26 228)Equity Electric - 1 384 900 18 872 Equity Electronics - 1 2 314 085 166 636 Equity Engineering & Construction - 1 1 205 827 (37 892)Equity Engineering & Construction - 2 776 428 58 979 Equity Food - 1 9 426 560 435 831 Equity Leisure Time - 1 22 444 (1 058)Equity Machinery-Diversified - 1 116 643 (2 222)Equity Metal Fabricate/Hardware - 1 17 363 (231)Equity Mining - 1 1 659 833 (638 140)Equity Mining - 2 2 361 87 Equity Mining - 3 (a) 171 (105)Equity Miscellaneous Manufactures - 1 (a) 5 442 243 Equity Oil & Gas - 1 2 041 902 (226 092)Equity Oil & Gas - 2 1 693 735 794 175 Equity Oil & Gas - 3 40 539 3 047 Equity Oil & Gas - 4 31 921 6 677 Equity Oil & Gas Services - 1 5 556 706 (38 142)Equity Oil & Gas Services - 2 99 132 10 318 Equity Semiconductors - 1 3 732 753 (198 673)Equity Telecommunications - 1 4 060 380 487 274 Equity Telecommunications - 2 3 853 259 293 841 Index Commodities Index - 1 3 401 432 (40 466)Index Commodities Index - 2 1 340 721 (230)Index Commodities Index - 3 592 550 15 962 Index Commodities Index - 4 236 061 (25)Index Commodities Index - 5 92 897 1 166
62 716 935 845 505
The total market value of the contracts for diff erence swaps is USD 3 473 898.
(a) The security inside this contract for diff erence swap is fair valued. See Notes 2.2.6 and 10.
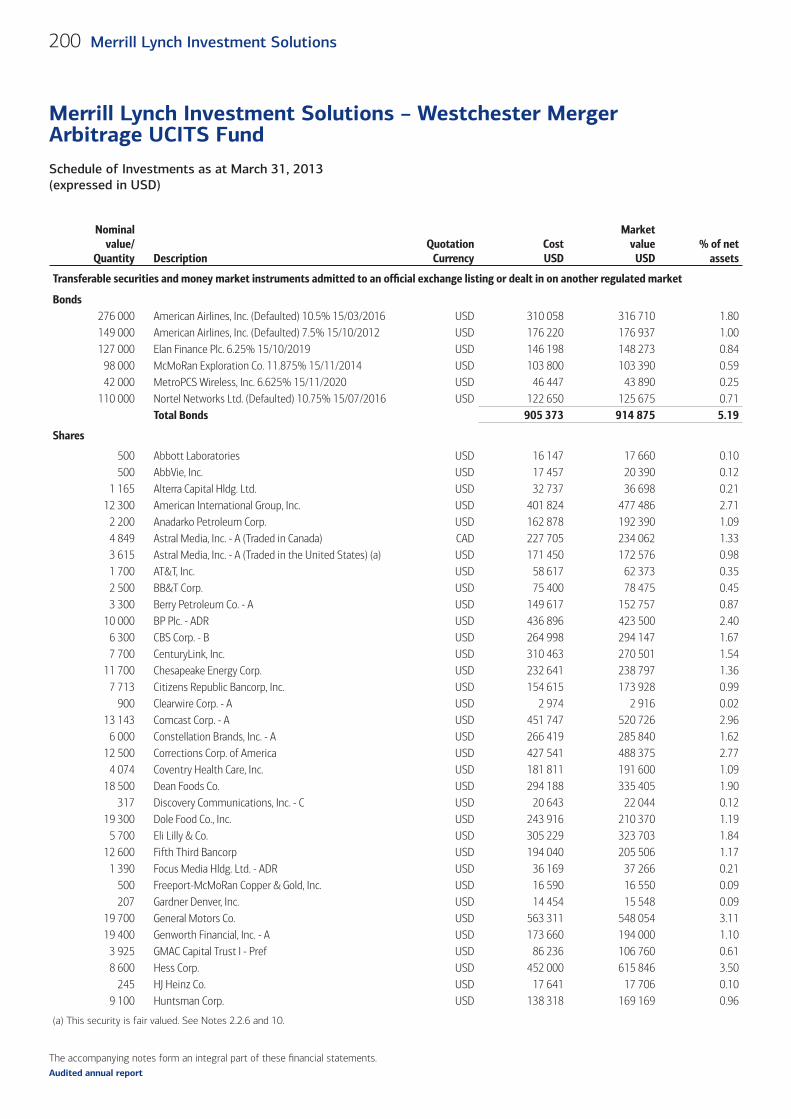
The accompanying notes form an integral part of these fi nancial statements.
Schedule of Investments as at March 31, 2013 (expressed in USD)
Merrill Lynch Investment Solutions – Westchester Merger Arbitrage UCITS Fund
200 Merrill Lynch Investment Solutions
Audited annual report
Nominalvalue/
Quantity DescriptionQuotation
CurrencyCostUSD
Marketvalue
USD% of net
assets
Transferable securities and money market instruments admitted to an offi cial exchange listing or dealt in on another regulated market (cont.)
Bonds276 000 American Airlines, Inc. (Defaulted) 10.5% 15/03/2016 USD 310 058 316 710 1.80149 000 American Airlines, Inc. (Defaulted) 7.5% 15/10/2012 USD 176 220 176 937 1.00127 000 Elan Finance Plc. 6.25% 15/10/2019 USD 146 198 148 273 0.84
98 000 McMoRan Exploration Co. 11.875% 15/11/2014 USD 103 800 103 390 0.5942 000 MetroPCS Wireless, Inc. 6.625% 15/11/2020 USD 46 447 43 890 0.25
110 000 Nortel Networks Ltd. (Defaulted) 10.75% 15/07/2016 USD 122 650 125 675 0.71Total Bonds 905 373 914 875 5.19
Shares
500 Abbott Laboratories USD 16 147 17 660 0.10500 AbbVie, Inc. USD 17 457 20 390 0.12
1 165 Alterra Capital Hldg. Ltd. USD 32 737 36 698 0.2112 300 American International Group, Inc. USD 401 824 477 486 2.71
2 200 Anadarko Petroleum Corp. USD 162 878 192 390 1.094 849 Astral Media, Inc. - A (Traded in Canada) CAD 227 705 234 062 1.333 615 Astral Media, Inc. - A (Traded in the United States) (a) USD 171 450 172 576 0.981 700 AT&T, Inc. USD 58 617 62 373 0.352 500 BB&T Corp. USD 75 400 78 475 0.453 300 Berry Petroleum Co. - A USD 149 617 152 757 0.87
10 000 BP Plc. - ADR USD 436 896 423 500 2.406 300 CBS Corp. - B USD 264 998 294 147 1.677 700 CenturyLink, Inc. USD 310 463 270 501 1.54
11 700 Chesapeake Energy Corp. USD 232 641 238 797 1.367 713 Citizens Republic Bancorp, Inc. USD 154 615 173 928 0.99
900 Clearwire Corp. - A USD 2 974 2 916 0.0213 143 Comcast Corp. - A USD 451 747 520 726 2.96
6 000 Constellation Brands, Inc. - A USD 266 419 285 840 1.6212 500 Corrections Corp. of America USD 427 541 488 375 2.77
4 074 Coventry Health Care, Inc. USD 181 811 191 600 1.0918 500 Dean Foods Co. USD 294 188 335 405 1.90
317 Discovery Communications, Inc. - C USD 20 643 22 044 0.1219 300 Dole Food Co., Inc. USD 243 916 210 370 1.19
5 700 Eli Lilly & Co. USD 305 229 323 703 1.8412 600 Fifth Third Bancorp USD 194 040 205 506 1.17
1 390 Focus Media Hldg. Ltd. - ADR USD 36 169 37 266 0.21500 Freeport-McMoRan Copper & Gold, Inc. USD 16 590 16 550 0.09207 Gardner Denver, Inc. USD 14 454 15 548 0.09
19 700 General Motors Co. USD 563 311 548 054 3.1119 400 Genworth Financial, Inc. - A USD 173 660 194 000 1.10
3 925 GMAC Capital Trust I - Pref USD 86 236 106 760 0.618 600 Hess Corp. USD 452 000 615 846 3.50
245 HJ Heinz Co. USD 17 641 17 706 0.109 100 Huntsman Corp. USD 138 318 169 169 0.96
(a) This security is fair valued. See Notes 2.2.6 and 10.
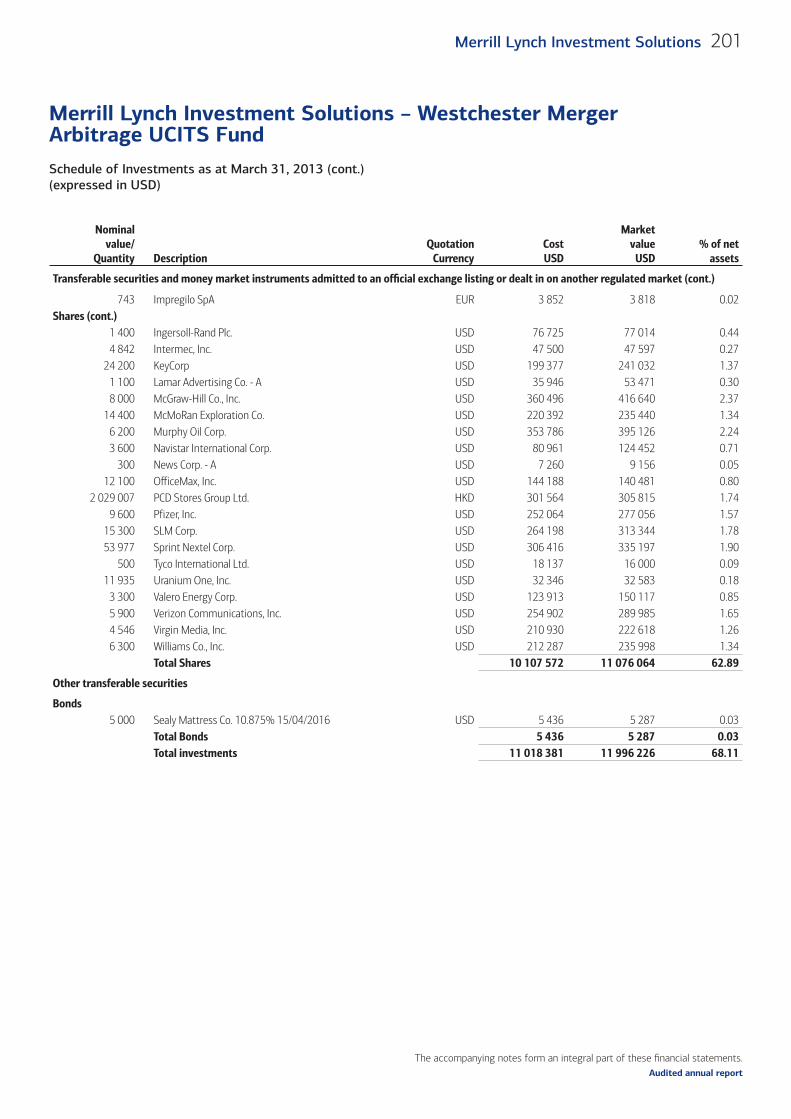
The accompanying notes form an integral part of these fi nancial statements.
Schedule of Investments as at March 31, 2013 (cont.)(expressed in USD)
Merrill Lynch Investment Solutions – Westchester Merger Arbitrage UCITS Fund
201Merrill Lynch Investment Solutions
Audited annual report
Nominalvalue/
Quantity DescriptionQuotation
CurrencyCostUSD
Marketvalue
USD% of net
assets
Transferable securities and money market instruments admitted to an offi cial exchange listing or dealt in on another regulated market (cont.)
743 Impregilo SpA EUR 3 852 3 818 0.02Shares (cont.)
1 400 Ingersoll-Rand Plc. USD 76 725 77 014 0.444 842 Intermec, Inc. USD 47 500 47 597 0.27
24 200 KeyCorp USD 199 377 241 032 1.371 100 Lamar Advertising Co. - A USD 35 946 53 471 0.308 000 McGraw-Hill Co., Inc. USD 360 496 416 640 2.37
14 400 McMoRan Exploration Co. USD 220 392 235 440 1.346 200 Murphy Oil Corp. USD 353 786 395 126 2.243 600 Navistar International Corp. USD 80 961 124 452 0.71
300 News Corp. - A USD 7 260 9 156 0.0512 100 OfficeMax, Inc. USD 144 188 140 481 0.80
2 029 007 PCD Stores Group Ltd. HKD 301 564 305 815 1.749 600 Pfizer, Inc. USD 252 064 277 056 1.57
15 300 SLM Corp. USD 264 198 313 344 1.7853 977 Sprint Nextel Corp. USD 306 416 335 197 1.90
500 Tyco International Ltd. USD 18 137 16 000 0.0911 935 Uranium One, Inc. USD 32 346 32 583 0.18
3 300 Valero Energy Corp. USD 123 913 150 117 0.855 900 Verizon Communications, Inc. USD 254 902 289 985 1.654 546 Virgin Media, Inc. USD 210 930 222 618 1.266 300 Williams Co., Inc. USD 212 287 235 998 1.34
Total Shares 10 107 572 11 076 064 62.89
Other transferable securities
Bonds5 000 Sealy Mattress Co. 10.875% 15/04/2016 USD 5 436 5 287 0.03
Total Bonds 5 436 5 287 0.03Total investments 11 018 381 11 996 226 68.11
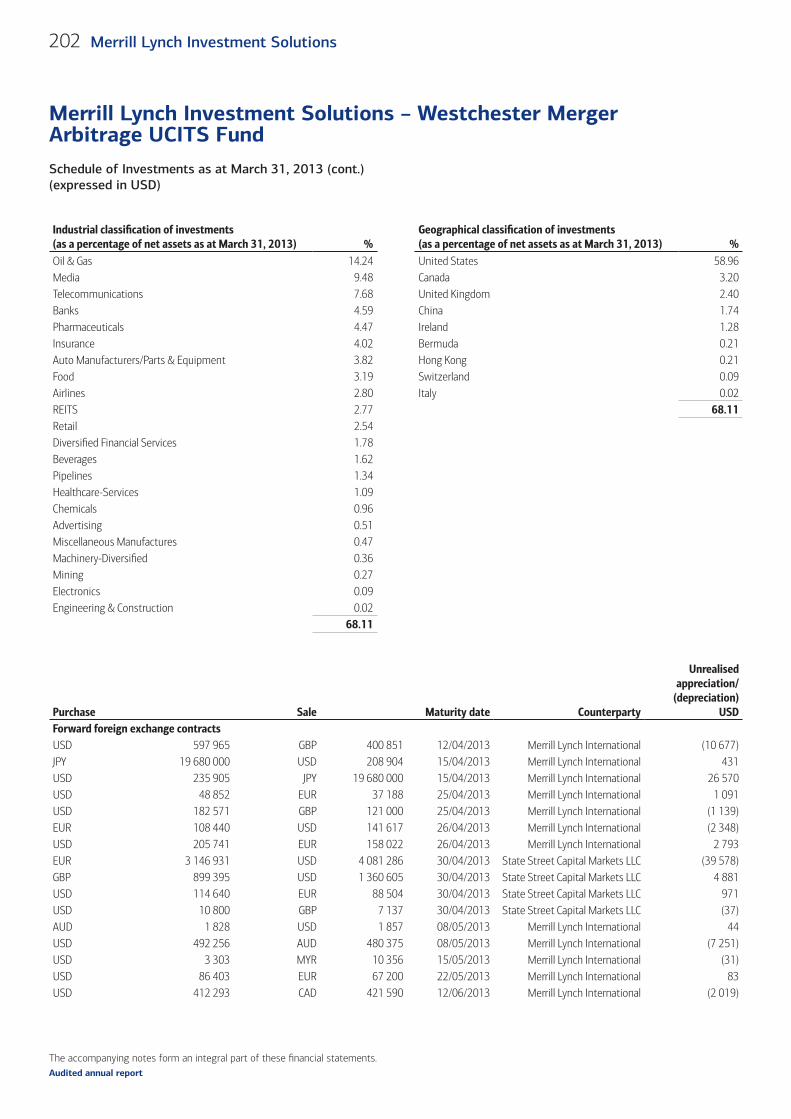
The accompanying notes form an integral part of these fi nancial statements.
Schedule of Investments as at March 31, 2013 (cont.)(expressed in USD)
Merrill Lynch Investment Solutions – Westchester Merger Arbitrage UCITS Fund
202 Merrill Lynch Investment Solutions
Audited annual report
Industrial classifi cation of investments (as a percentage of net assets as at March 31, 2013) %
Geographical classifi cation of investments (as a percentage of net assets as at March 31, 2013) %
Oil & Gas 14.24 United States 58.96Media 9.48 Canada 3.20Telecommunications 7.68 United Kingdom 2.40Banks 4.59 China 1.74Pharmaceuticals 4.47 Ireland 1.28Insurance 4.02 Bermuda 0.21Auto Manufacturers/Parts & Equipment 3.82 Hong Kong 0.21Food 3.19 Switzerland 0.09Airlines 2.80 Italy 0.02REITS 2.77 68.11Retail 2.54Diversifi ed Financial Services 1.78Beverages 1.62Pipelines 1.34Healthcare-Services 1.09Chemicals 0.96Advertising 0.51Miscellaneous Manufactures 0.47Machinery-Diversifi ed 0.36Mining 0.27Electronics 0.09Engineering & Construction 0.02
68.11
Purchase Sale Maturity date Counterparty
Unrealisedappreciation/
(depreciation)USD
Forward foreign exchange contracts (cont.)USD 597 965 GBP 400 851 12/04/2013 Merrill Lynch International (10 677)JPY 19 680 000 USD 208 904 15/04/2013 Merrill Lynch International 431 USD 235 905 JPY 19 680 000 15/04/2013 Merrill Lynch International 26 570 USD 48 852 EUR 37 188 25/04/2013 Merrill Lynch International 1 091 USD 182 571 GBP 121 000 25/04/2013 Merrill Lynch International (1 139)EUR 108 440 USD 141 617 26/04/2013 Merrill Lynch International (2 348)USD 205 741 EUR 158 022 26/04/2013 Merrill Lynch International 2 793 EUR 3 146 931 USD 4 081 286 30/04/2013 State Street Capital Markets LLC (39 578)GBP 899 395 USD 1 360 605 30/04/2013 State Street Capital Markets LLC 4 881 USD 114 640 EUR 88 504 30/04/2013 State Street Capital Markets LLC 971 USD 10 800 GBP 7 137 30/04/2013 State Street Capital Markets LLC (37)AUD 1 828 USD 1 857 08/05/2013 Merrill Lynch International 44 USD 492 256 AUD 480 375 08/05/2013 Merrill Lynch International (7 251)USD 3 303 MYR 10 356 15/05/2013 Merrill Lynch International (31)USD 86 403 EUR 67 200 22/05/2013 Merrill Lynch International 83 USD 412 293 CAD 421 590 12/06/2013 Merrill Lynch International (2 019)
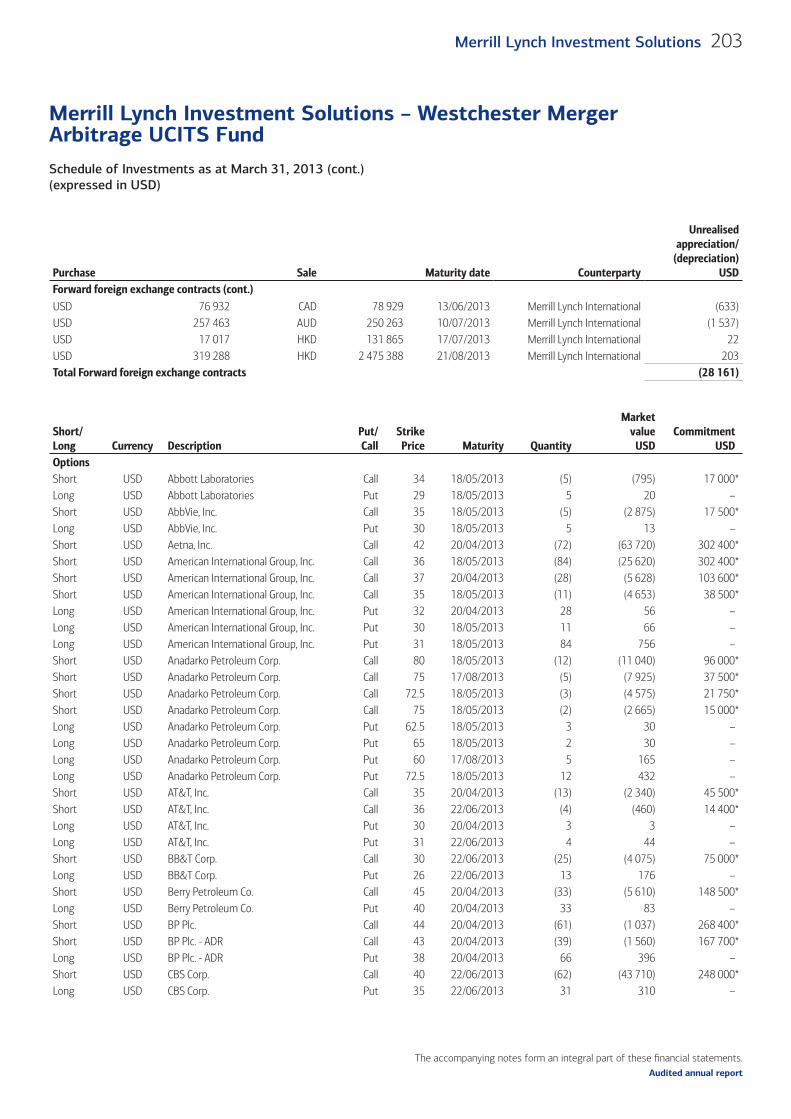
The accompanying notes form an integral part of these fi nancial statements.
Schedule of Investments as at March 31, 2013 (cont.)(expressed in USD)
Merrill Lynch Investment Solutions – Westchester Merger Arbitrage UCITS Fund
203Merrill Lynch Investment Solutions
Audited annual report
Purchase Sale Maturity date Counterparty
Unrealisedappreciation/
(depreciation)USD
Forward foreign exchange contracts (cont.)USD 76 932 CAD 78 929 13/06/2013 Merrill Lynch International (633)USD 257 463 AUD 250 263 10/07/2013 Merrill Lynch International (1 537)USD 17 017 HKD 131 865 17/07/2013 Merrill Lynch International 22 USD 319 288 HKD 2 475 388 21/08/2013 Merrill Lynch International 203 Total Forward foreign exchange contracts (28 161)
Short/Long Currency Description
Put/Call
StrikePrice Maturity Quantity
Marketvalue
USDCommitment
USDOptions (cont.)Short USD Abbott Laboratories Call 34 18/05/2013 (5) (795) 17 000*Long USD Abbott Laboratories Put 29 18/05/2013 5 20 –Short USD AbbVie, Inc. Call 35 18/05/2013 (5) (2 875) 17 500*Long USD AbbVie, Inc. Put 30 18/05/2013 5 13 –Short USD Aetna, Inc. Call 42 20/04/2013 (72) (63 720) 302 400*Short USD American International Group, Inc. Call 36 18/05/2013 (84) (25 620) 302 400*Short USD American International Group, Inc. Call 37 20/04/2013 (28) (5 628) 103 600*Short USD American International Group, Inc. Call 35 18/05/2013 (11) (4 653) 38 500*Long USD American International Group, Inc. Put 32 20/04/2013 28 56 –Long USD American International Group, Inc. Put 30 18/05/2013 11 66 –Long USD American International Group, Inc. Put 31 18/05/2013 84 756 –Short USD Anadarko Petroleum Corp. Call 80 18/05/2013 (12) (11 040) 96 000*Short USD Anadarko Petroleum Corp. Call 75 17/08/2013 (5) (7 925) 37 500*Short USD Anadarko Petroleum Corp. Call 72.5 18/05/2013 (3) (4 575) 21 750*Short USD Anadarko Petroleum Corp. Call 75 18/05/2013 (2) (2 665) 15 000*Long USD Anadarko Petroleum Corp. Put 62.5 18/05/2013 3 30 –Long USD Anadarko Petroleum Corp. Put 65 18/05/2013 2 30 –Long USD Anadarko Petroleum Corp. Put 60 17/08/2013 5 165 –Long USD Anadarko Petroleum Corp. Put 72.5 18/05/2013 12 432 –Short USD AT&T, Inc. Call 35 20/04/2013 (13) (2 340) 45 500*Short USD AT&T, Inc. Call 36 22/06/2013 (4) (460) 14 400*Long USD AT&T, Inc. Put 30 20/04/2013 3 3 –Long USD AT&T, Inc. Put 31 22/06/2013 4 44 –Short USD BB&T Corp. Call 30 22/06/2013 (25) (4 075) 75 000*Long USD BB&T Corp. Put 26 22/06/2013 13 176 –Short USD Berry Petroleum Co. Call 45 20/04/2013 (33) (5 610) 148 500*Long USD Berry Petroleum Co. Put 40 20/04/2013 33 83 –Short USD BP Plc. Call 44 20/04/2013 (61) (1 037) 268 400*Short USD BP Plc. - ADR Call 43 20/04/2013 (39) (1 560) 167 700*Long USD BP Plc. - ADR Put 38 20/04/2013 66 396 –Short USD CBS Corp. Call 40 22/06/2013 (62) (43 710) 248 000*Long USD CBS Corp. Put 35 22/06/2013 31 310 –
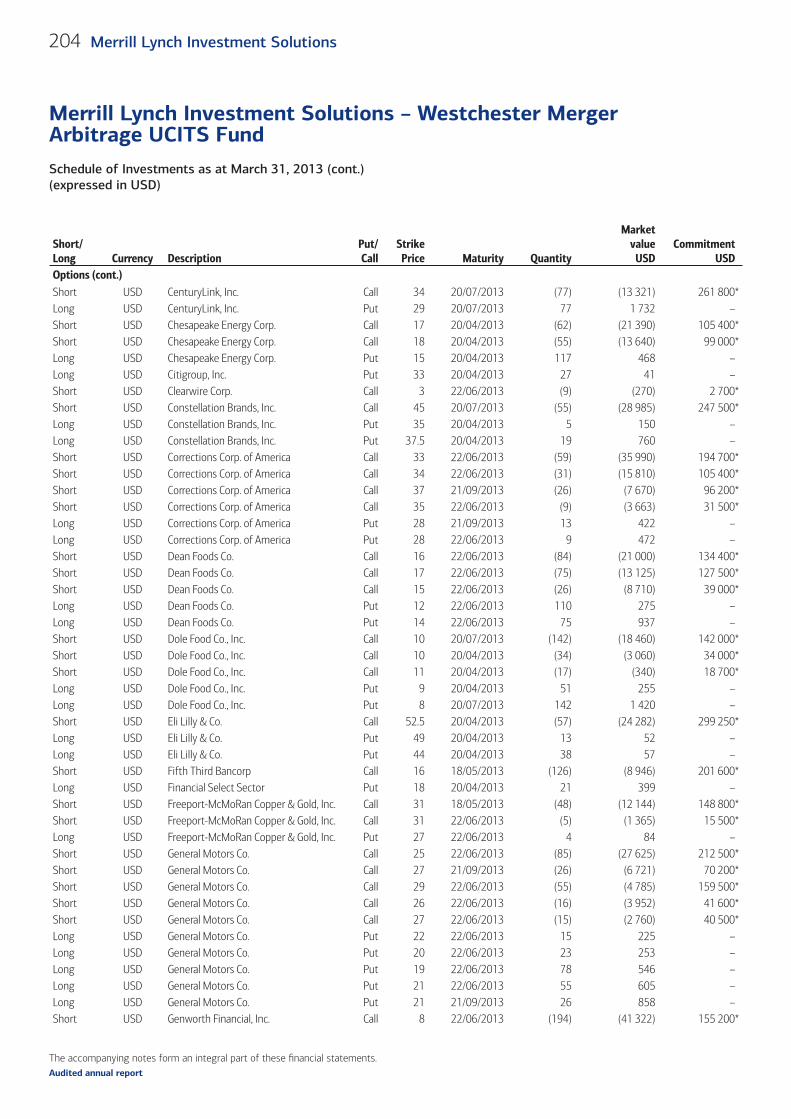
The accompanying notes form an integral part of these fi nancial statements.
Schedule of Investments as at March 31, 2013 (cont.)(expressed in USD)
Merrill Lynch Investment Solutions – Westchester Merger Arbitrage UCITS Fund
204 Merrill Lynch Investment Solutions
Audited annual report
Short/Long Currency Description
Put/Call
StrikePrice Maturity Quantity
Marketvalue
USDCommitment
USDOptions (cont.)Short USD CenturyLink, Inc. Call 34 20/07/2013 (77) (13 321) 261 800*Long USD CenturyLink, Inc. Put 29 20/07/2013 77 1 732 –Short USD Chesapeake Energy Corp. Call 17 20/04/2013 (62) (21 390) 105 400*Short USD Chesapeake Energy Corp. Call 18 20/04/2013 (55) (13 640) 99 000*Long USD Chesapeake Energy Corp. Put 15 20/04/2013 117 468 –Long USD Citigroup, Inc. Put 33 20/04/2013 27 41 –Short USD Clearwire Corp. Call 3 22/06/2013 (9) (270) 2 700*Short USD Constellation Brands, Inc. Call 45 20/07/2013 (55) (28 985) 247 500*Long USD Constellation Brands, Inc. Put 35 20/04/2013 5 150 –Long USD Constellation Brands, Inc. Put 37.5 20/04/2013 19 760 –Short USD Corrections Corp. of America Call 33 22/06/2013 (59) (35 990) 194 700*Short USD Corrections Corp. of America Call 34 22/06/2013 (31) (15 810) 105 400*Short USD Corrections Corp. of America Call 37 21/09/2013 (26) (7 670) 96 200*Short USD Corrections Corp. of America Call 35 22/06/2013 (9) (3 663) 31 500*Long USD Corrections Corp. of America Put 28 21/09/2013 13 422 –Long USD Corrections Corp. of America Put 28 22/06/2013 9 472 –Short USD Dean Foods Co. Call 16 22/06/2013 (84) (21 000) 134 400*Short USD Dean Foods Co. Call 17 22/06/2013 (75) (13 125) 127 500*Short USD Dean Foods Co. Call 15 22/06/2013 (26) (8 710) 39 000*Long USD Dean Foods Co. Put 12 22/06/2013 110 275 –Long USD Dean Foods Co. Put 14 22/06/2013 75 937 –Short USD Dole Food Co., Inc. Call 10 20/07/2013 (142) (18 460) 142 000*Short USD Dole Food Co., Inc. Call 10 20/04/2013 (34) (3 060) 34 000*Short USD Dole Food Co., Inc. Call 11 20/04/2013 (17) (340) 18 700*Long USD Dole Food Co., Inc. Put 9 20/04/2013 51 255 –Long USD Dole Food Co., Inc. Put 8 20/07/2013 142 1 420 –Short USD Eli Lilly & Co. Call 52.5 20/04/2013 (57) (24 282) 299 250*Long USD Eli Lilly & Co. Put 49 20/04/2013 13 52 –Long USD Eli Lilly & Co. Put 44 20/04/2013 38 57 –Short USD Fifth Third Bancorp Call 16 18/05/2013 (126) (8 946) 201 600*Long USD Financial Select Sector Put 18 20/04/2013 21 399 –Short USD Freeport-McMoRan Copper & Gold, Inc. Call 31 18/05/2013 (48) (12 144) 148 800*Short USD Freeport-McMoRan Copper & Gold, Inc. Call 31 22/06/2013 (5) (1 365) 15 500*Long USD Freeport-McMoRan Copper & Gold, Inc. Put 27 22/06/2013 4 84 –Short USD General Motors Co. Call 25 22/06/2013 (85) (27 625) 212 500*Short USD General Motors Co. Call 27 21/09/2013 (26) (6 721) 70 200*Short USD General Motors Co. Call 29 22/06/2013 (55) (4 785) 159 500*Short USD General Motors Co. Call 26 22/06/2013 (16) (3 952) 41 600*Short USD General Motors Co. Call 27 22/06/2013 (15) (2 760) 40 500*Long USD General Motors Co. Put 22 22/06/2013 15 225 –Long USD General Motors Co. Put 20 22/06/2013 23 253 –Long USD General Motors Co. Put 19 22/06/2013 78 546 –Long USD General Motors Co. Put 21 22/06/2013 55 605 –Long USD General Motors Co. Put 21 21/09/2013 26 858 –Short USD Genworth Financial, Inc. Call 8 22/06/2013 (194) (41 322) 155 200*
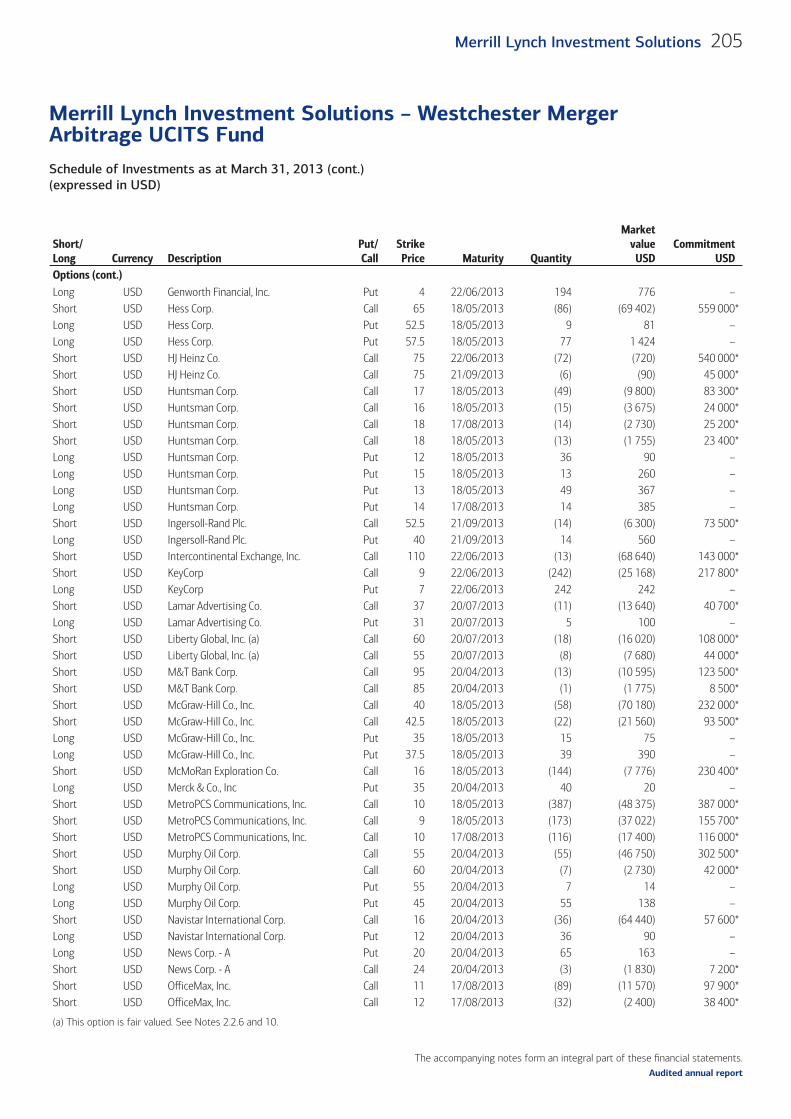
The accompanying notes form an integral part of these fi nancial statements.
Schedule of Investments as at March 31, 2013 (cont.)(expressed in USD)
Merrill Lynch Investment Solutions – Westchester Merger Arbitrage UCITS Fund
205Merrill Lynch Investment Solutions
Audited annual report
Short/Long Currency Description
Put/Call
StrikePrice Maturity Quantity
Marketvalue
USDCommitment
USDOptions (cont.)Long USD Genworth Financial, Inc. Put 4 22/06/2013 194 776 –Short USD Hess Corp. Call 65 18/05/2013 (86) (69 402) 559 000*Long USD Hess Corp. Put 52.5 18/05/2013 9 81 –Long USD Hess Corp. Put 57.5 18/05/2013 77 1 424 –Short USD HJ Heinz Co. Call 75 22/06/2013 (72) (720) 540 000*Short USD HJ Heinz Co. Call 75 21/09/2013 (6) (90) 45 000*Short USD Huntsman Corp. Call 17 18/05/2013 (49) (9 800) 83 300*Short USD Huntsman Corp. Call 16 18/05/2013 (15) (3 675) 24 000*Short USD Huntsman Corp. Call 18 17/08/2013 (14) (2 730) 25 200*Short USD Huntsman Corp. Call 18 18/05/2013 (13) (1 755) 23 400*Long USD Huntsman Corp. Put 12 18/05/2013 36 90 –Long USD Huntsman Corp. Put 15 18/05/2013 13 260 –Long USD Huntsman Corp. Put 13 18/05/2013 49 367 –Long USD Huntsman Corp. Put 14 17/08/2013 14 385 –Short USD Ingersoll-Rand Plc. Call 52.5 21/09/2013 (14) (6 300) 73 500*Long USD Ingersoll-Rand Plc. Put 40 21/09/2013 14 560 –Short USD Intercontinental Exchange, Inc. Call 110 22/06/2013 (13) (68 640) 143 000*Short USD KeyCorp Call 9 22/06/2013 (242) (25 168) 217 800*Long USD KeyCorp Put 7 22/06/2013 242 242 –Short USD Lamar Advertising Co. Call 37 20/07/2013 (11) (13 640) 40 700*Long USD Lamar Advertising Co. Put 31 20/07/2013 5 100 –Short USD Liberty Global, Inc. (a) Call 60 20/07/2013 (18) (16 020) 108 000*Short USD Liberty Global, Inc. (a) Call 55 20/07/2013 (8) (7 680) 44 000*Short USD M&T Bank Corp. Call 95 20/04/2013 (13) (10 595) 123 500*Short USD M&T Bank Corp. Call 85 20/04/2013 (1) (1 775) 8 500*Short USD McGraw-Hill Co., Inc. Call 40 18/05/2013 (58) (70 180) 232 000*Short USD McGraw-Hill Co., Inc. Call 42.5 18/05/2013 (22) (21 560) 93 500*Long USD McGraw-Hill Co., Inc. Put 35 18/05/2013 15 75 –Long USD McGraw-Hill Co., Inc. Put 37.5 18/05/2013 39 390 –Short USD McMoRan Exploration Co. Call 16 18/05/2013 (144) (7 776) 230 400*Long USD Merck & Co., Inc Put 35 20/04/2013 40 20 –Short USD MetroPCS Communications, Inc. Call 10 18/05/2013 (387) (48 375) 387 000*Short USD MetroPCS Communications, Inc. Call 9 18/05/2013 (173) (37 022) 155 700*Short USD MetroPCS Communications, Inc. Call 10 17/08/2013 (116) (17 400) 116 000*Short USD Murphy Oil Corp. Call 55 20/04/2013 (55) (46 750) 302 500*Short USD Murphy Oil Corp. Call 60 20/04/2013 (7) (2 730) 42 000*Long USD Murphy Oil Corp. Put 55 20/04/2013 7 14 –Long USD Murphy Oil Corp. Put 45 20/04/2013 55 138 –Short USD Navistar International Corp. Call 16 20/04/2013 (36) (64 440) 57 600*Long USD Navistar International Corp. Put 12 20/04/2013 36 90 –Long USD News Corp. - A Put 20 20/04/2013 65 163 –Short USD News Corp. - A Call 24 20/04/2013 (3) (1 830) 7 200*Short USD OfficeMax, Inc. Call 11 17/08/2013 (89) (11 570) 97 900*Short USD OfficeMax, Inc. Call 12 17/08/2013 (32) (2 400) 38 400*
(a) This option is fair valued. See Notes 2.2.6 and 10.
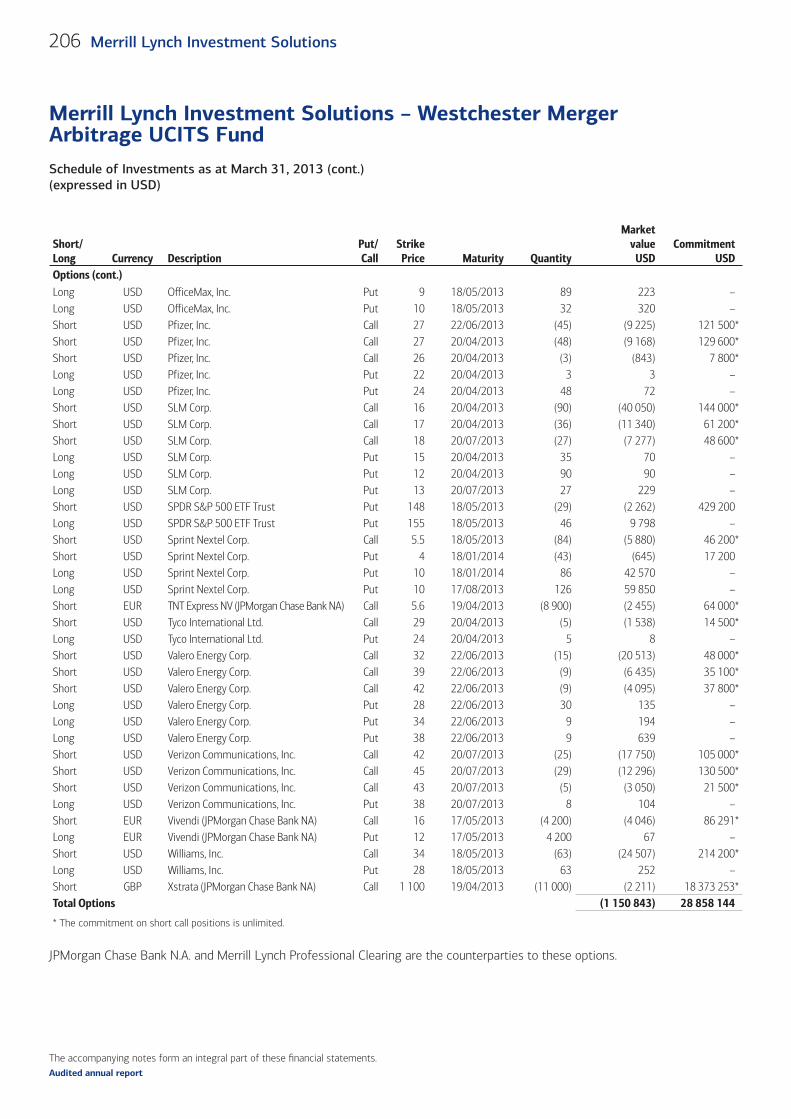
The accompanying notes form an integral part of these fi nancial statements.
Schedule of Investments as at March 31, 2013 (cont.)(expressed in USD)
Merrill Lynch Investment Solutions – Westchester Merger Arbitrage UCITS Fund
206 Merrill Lynch Investment Solutions
Audited annual report
Short/Long Currency Description
Put/Call
StrikePrice Maturity Quantity
Marketvalue
USDCommitment
USDOptions (cont.)Long USD OfficeMax, Inc. Put 9 18/05/2013 89 223 –Long USD OfficeMax, Inc. Put 10 18/05/2013 32 320 –Short USD Pfizer, Inc. Call 27 22/06/2013 (45) (9 225) 121 500*Short USD Pfizer, Inc. Call 27 20/04/2013 (48) (9 168) 129 600*Short USD Pfizer, Inc. Call 26 20/04/2013 (3) (843) 7 800*Long USD Pfizer, Inc. Put 22 20/04/2013 3 3 –Long USD Pfizer, Inc. Put 24 20/04/2013 48 72 –Short USD SLM Corp. Call 16 20/04/2013 (90) (40 050) 144 000*Short USD SLM Corp. Call 17 20/04/2013 (36) (11 340) 61 200*Short USD SLM Corp. Call 18 20/07/2013 (27) (7 277) 48 600*Long USD SLM Corp. Put 15 20/04/2013 35 70 –Long USD SLM Corp. Put 12 20/04/2013 90 90 –Long USD SLM Corp. Put 13 20/07/2013 27 229 –Short USD SPDR S&P 500 ETF Trust Put 148 18/05/2013 (29) (2 262) 429 200Long USD SPDR S&P 500 ETF Trust Put 155 18/05/2013 46 9 798 –Short USD Sprint Nextel Corp. Call 5.5 18/05/2013 (84) (5 880) 46 200*Short USD Sprint Nextel Corp. Put 4 18/01/2014 (43) (645) 17 200Long USD Sprint Nextel Corp. Put 10 18/01/2014 86 42 570 –Long USD Sprint Nextel Corp. Put 10 17/08/2013 126 59 850 –Short EUR TNT Express NV (JPMorgan Chase Bank NA) Call 5.6 19/04/2013 (8 900) (2 455) 64 000*Short USD Tyco International Ltd. Call 29 20/04/2013 (5) (1 538) 14 500*Long USD Tyco International Ltd. Put 24 20/04/2013 5 8 –Short USD Valero Energy Corp. Call 32 22/06/2013 (15) (20 513) 48 000*Short USD Valero Energy Corp. Call 39 22/06/2013 (9) (6 435) 35 100*Short USD Valero Energy Corp. Call 42 22/06/2013 (9) (4 095) 37 800*Long USD Valero Energy Corp. Put 28 22/06/2013 30 135 –Long USD Valero Energy Corp. Put 34 22/06/2013 9 194 –Long USD Valero Energy Corp. Put 38 22/06/2013 9 639 –Short USD Verizon Communications, Inc. Call 42 20/07/2013 (25) (17 750) 105 000*Short USD Verizon Communications, Inc. Call 45 20/07/2013 (29) (12 296) 130 500*Short USD Verizon Communications, Inc. Call 43 20/07/2013 (5) (3 050) 21 500*Long USD Verizon Communications, Inc. Put 38 20/07/2013 8 104 –Short EUR Vivendi (JPMorgan Chase Bank NA) Call 16 17/05/2013 (4 200) (4 046) 86 291*Long EUR Vivendi (JPMorgan Chase Bank NA) Put 12 17/05/2013 4 200 67 –Short USD Williams, Inc. Call 34 18/05/2013 (63) (24 507) 214 200*Long USD Williams, Inc. Put 28 18/05/2013 63 252 –Short GBP Xstrata (JPMorgan Chase Bank NA) Call 1 100 19/04/2013 (11 000) (2 211) 18 373 253*Total Options (1 150 843) 28 858 144
* The commitment on short call positions is unlimited.
JPMorgan Chase Bank N.A. and Merrill Lynch Professional Clearing are the counterparties to these options.
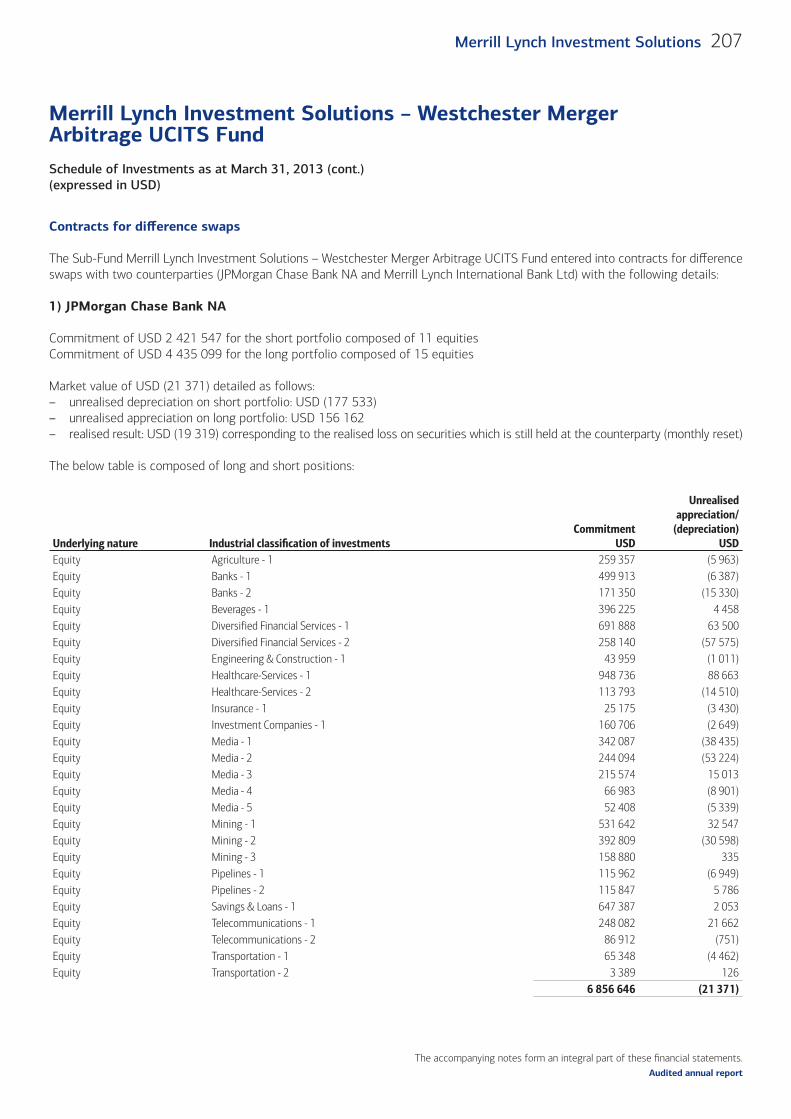
The accompanying notes form an integral part of these fi nancial statements.
Schedule of Investments as at March 31, 2013 (cont.)(expressed in USD)
Merrill Lynch Investment Solutions – Westchester Merger Arbitrage UCITS Fund
207Merrill Lynch Investment Solutions
Audited annual report
Contracts for diff erence swaps
The Sub-Fund Merrill Lynch Investment Solutions – Westchester Merger Arbitrage UCITS Fund entered into contracts for diff erence swaps with two counterparties (JPMorgan Chase Bank NA and Merrill Lynch International Bank Ltd) with the following details:
1) JPMorgan Chase Bank NA
Commitment of USD 2 421 547 for the short portfolio composed of 11 equitiesCommitment of USD 4 435 099 for the long portfolio composed of 15 equities
Market value of USD (21 371) detailed as follows:– unrealised depreciation on short portfolio: USD (177 533)– unrealised appreciation on long portfolio: USD 156 162– realised result: USD (19 319) corresponding to the realised loss on securities which is still held at the counterparty (monthly reset)
The below table is composed of long and short positions:
Underlying nature Industrial classifi cation of investments Commitment
USD
Unrealised appreciation/
(depreciation)USD
Equity Agriculture - 1 259 357 (5 963)Equity Banks - 1 499 913 (6 387)Equity Banks - 2 171 350 (15 330)Equity Beverages - 1 396 225 4 458 Equity Diversified Financial Services - 1 691 888 63 500 Equity Diversified Financial Services - 2 258 140 (57 575)Equity Engineering & Construction - 1 43 959 (1 011)Equity Healthcare-Services - 1 948 736 88 663 Equity Healthcare-Services - 2 113 793 (14 510)Equity Insurance - 1 25 175 (3 430)Equity Investment Companies - 1 160 706 (2 649)Equity Media - 1 342 087 (38 435)Equity Media - 2 244 094 (53 224)Equity Media - 3 215 574 15 013 Equity Media - 4 66 983 (8 901)Equity Media - 5 52 408 (5 339)Equity Mining - 1 531 642 32 547 Equity Mining - 2 392 809 (30 598)Equity Mining - 3 158 880 335 Equity Pipelines - 1 115 962 (6 949)Equity Pipelines - 2 115 847 5 786 Equity Savings & Loans - 1 647 387 2 053 Equity Telecommunications - 1 248 082 21 662 Equity Telecommunications - 2 86 912 (751)Equity Transportation - 1 65 348 (4 462)Equity Transportation - 2 3 389 126
6 856 646 (21 371)
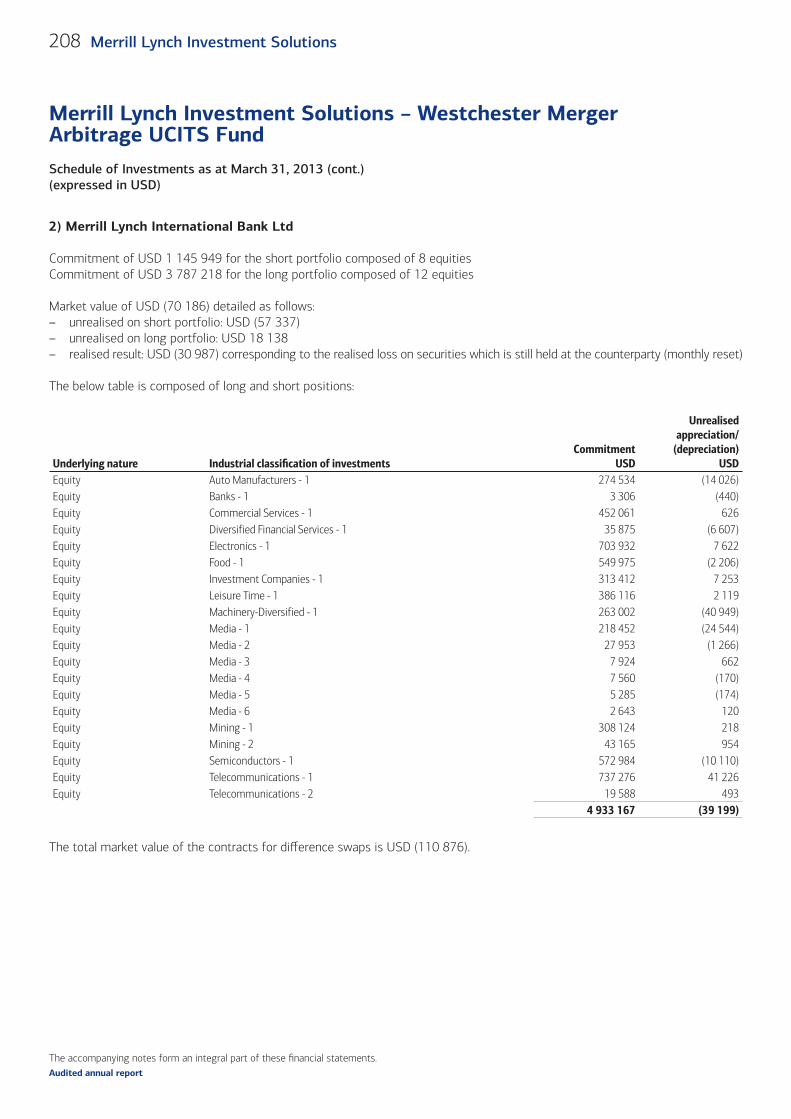
The accompanying notes form an integral part of these fi nancial statements.
Schedule of Investments as at March 31, 2013 (cont.)(expressed in USD)
Merrill Lynch Investment Solutions – Westchester Merger Arbitrage UCITS Fund
208 Merrill Lynch Investment Solutions
Audited annual report
2) Merrill Lynch International Bank Ltd
Commitment of USD 1 145 949 for the short portfolio composed of 8 equitiesCommitment of USD 3 787 218 for the long portfolio composed of 12 equities
Market value of USD (70 186) detailed as follows:– unrealised on short portfolio: USD (57 337)– unrealised on long portfolio: USD 18 138– realised result: USD (30 987) corresponding to the realised loss on securities which is still held at the counterparty (monthly reset)
The below table is composed of long and short positions:
Underlying nature Industrial classifi cation of investments Commitment
USD
Unrealised appreciation/
(depreciation)USD
Equity Auto Manufacturers - 1 274 534 (14 026)Equity Banks - 1 3 306 (440)Equity Commercial Services - 1 452 061 626 Equity Diversified Financial Services - 1 35 875 (6 607)Equity Electronics - 1 703 932 7 622 Equity Food - 1 549 975 (2 206)Equity Investment Companies - 1 313 412 7 253 Equity Leisure Time - 1 386 116 2 119 Equity Machinery-Diversified - 1 263 002 (40 949)Equity Media - 1 218 452 (24 544)Equity Media - 2 27 953 (1 266)Equity Media - 3 7 924 662 Equity Media - 4 7 560 (170)Equity Media - 5 5 285 (174)Equity Media - 6 2 643 120 Equity Mining - 1 308 124 218 Equity Mining - 2 43 165 954 Equity Semiconductors - 1 572 984 (10 110)Equity Telecommunications - 1 737 276 41 226 Equity Telecommunications - 2 19 588 493
4 933 167 (39 199)
The total market value of the contracts for diff erence swaps is USD (110 876).
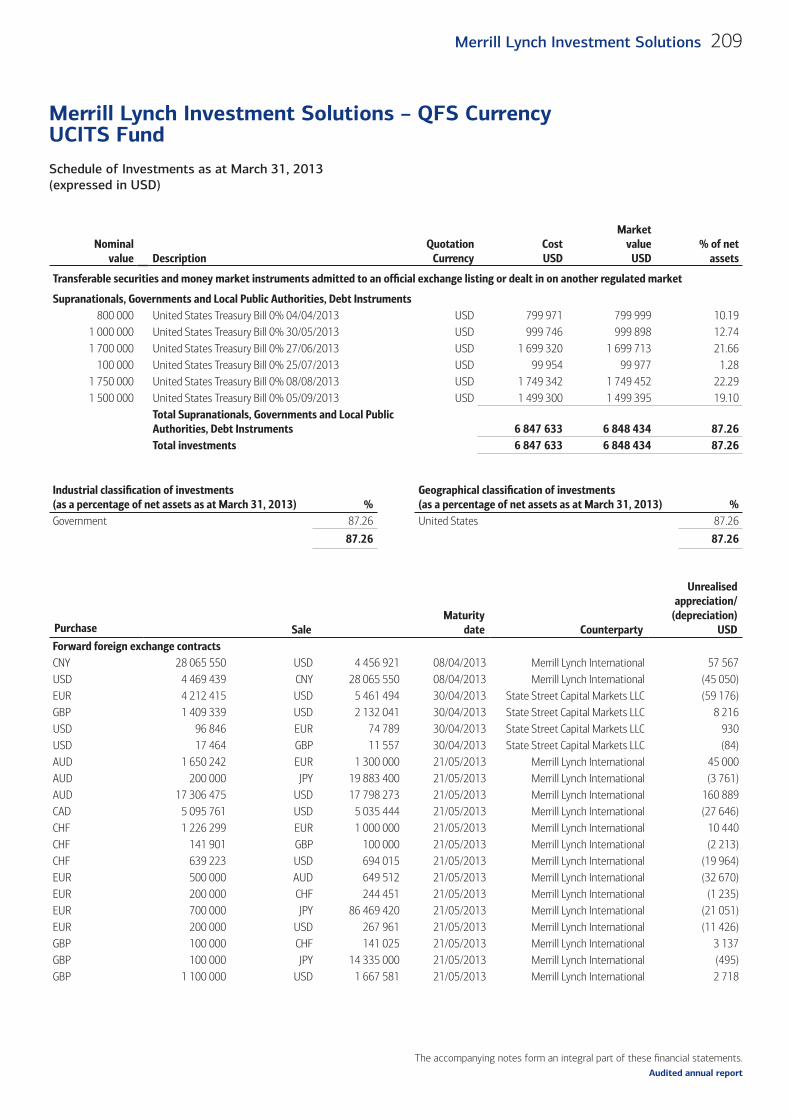
The accompanying notes form an integral part of these fi nancial statements.
Schedule of Investments as at March 31, 2013 (expressed in USD)
Merrill Lynch Investment Solutions – QFS Currency UCITS Fund
209Merrill Lynch Investment Solutions
Audited annual report
Nominalvalue Description
QuotationCurrency
CostUSD
Marketvalue
USD% of net
assets
Transferable securities and money market instruments admitted to an offi cial exchange listing or dealt in on another regulated market
Supranationals, Governments and Local Public Authorities, Debt Instruments800 000 United States Treasury Bill 0% 04/04/2013 USD 799 971 799 999 10.19
1 000 000 United States Treasury Bill 0% 30/05/2013 USD 999 746 999 898 12.741 700 000 United States Treasury Bill 0% 27/06/2013 USD 1 699 320 1 699 713 21.66
100 000 United States Treasury Bill 0% 25/07/2013 USD 99 954 99 977 1.281 750 000 United States Treasury Bill 0% 08/08/2013 USD 1 749 342 1 749 452 22.291 500 000 United States Treasury Bill 0% 05/09/2013 USD 1 499 300 1 499 395 19.10
Total Supranationals, Governments and Local Public Authorities, Debt Instruments 6 847 633 6 848 434 87.26Total investments 6 847 633 6 848 434 87.26
Industrial classifi cation of investments(as a percentage of net assets as at March 31, 2013) %
Geographical classifi cation of investments(as a percentage of net assets as at March 31, 2013) %
Government 87.26 United States 87.26
87.26 87.26
Purchase SaleMaturity
date Counterparty
Unrealisedappreciation/
(depreciation)USD
Forward foreign exchange contracts (cont.)CNY 28 065 550 USD 4 456 921 08/04/2013 Merrill Lynch International 57 567 USD 4 469 439 CNY 28 065 550 08/04/2013 Merrill Lynch International (45 050)EUR 4 212 415 USD 5 461 494 30/04/2013 State Street Capital Markets LLC (59 176)GBP 1 409 339 USD 2 132 041 30/04/2013 State Street Capital Markets LLC 8 216 USD 96 846 EUR 74 789 30/04/2013 State Street Capital Markets LLC 930 USD 17 464 GBP 11 557 30/04/2013 State Street Capital Markets LLC (84)AUD 1 650 242 EUR 1 300 000 21/05/2013 Merrill Lynch International 45 000 AUD 200 000 JPY 19 883 400 21/05/2013 Merrill Lynch International (3 761)AUD 17 306 475 USD 17 798 273 21/05/2013 Merrill Lynch International 160 889 CAD 5 095 761 USD 5 035 444 21/05/2013 Merrill Lynch International (27 646)CHF 1 226 299 EUR 1 000 000 21/05/2013 Merrill Lynch International 10 440 CHF 141 901 GBP 100 000 21/05/2013 Merrill Lynch International (2 213)CHF 639 223 USD 694 015 21/05/2013 Merrill Lynch International (19 964)EUR 500 000 AUD 649 512 21/05/2013 Merrill Lynch International (32 670)EUR 200 000 CHF 244 451 21/05/2013 Merrill Lynch International (1 235)EUR 700 000 JPY 86 469 420 21/05/2013 Merrill Lynch International (21 051)EUR 200 000 USD 267 961 21/05/2013 Merrill Lynch International (11 426)GBP 100 000 CHF 141 025 21/05/2013 Merrill Lynch International 3 137 GBP 100 000 JPY 14 335 000 21/05/2013 Merrill Lynch International (495)GBP 1 100 000 USD 1 667 581 21/05/2013 Merrill Lynch International 2 718
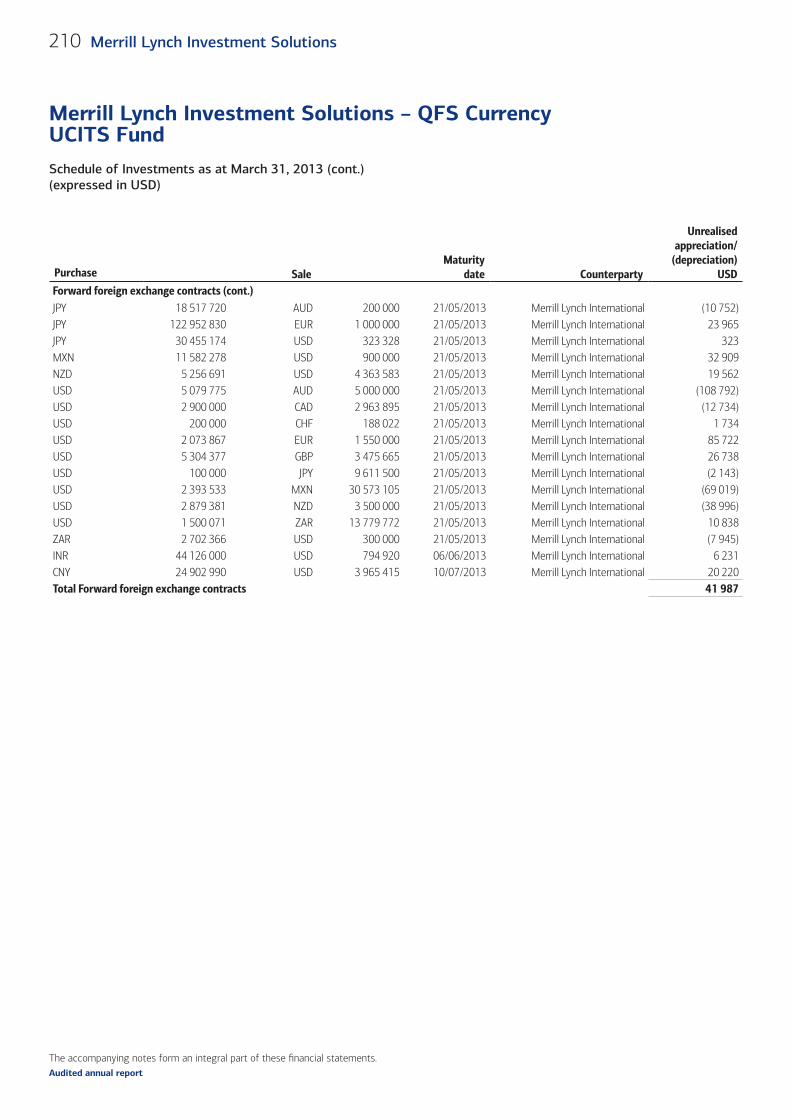
The accompanying notes form an integral part of these fi nancial statements.
Schedule of Investments as at March 31, 2013 (cont.)(expressed in USD)
Merrill Lynch Investment Solutions – QFS Currency UCITS Fund
210 Merrill Lynch Investment Solutions
Audited annual report
Purchase SaleMaturity
date Counterparty
Unrealisedappreciation/
(depreciation)USD
Forward foreign exchange contracts (cont.)JPY 18 517 720 AUD 200 000 21/05/2013 Merrill Lynch International (10 752)JPY 122 952 830 EUR 1 000 000 21/05/2013 Merrill Lynch International 23 965 JPY 30 455 174 USD 323 328 21/05/2013 Merrill Lynch International 323 MXN 11 582 278 USD 900 000 21/05/2013 Merrill Lynch International 32 909 NZD 5 256 691 USD 4 363 583 21/05/2013 Merrill Lynch International 19 562 USD 5 079 775 AUD 5 000 000 21/05/2013 Merrill Lynch International (108 792)USD 2 900 000 CAD 2 963 895 21/05/2013 Merrill Lynch International (12 734)USD 200 000 CHF 188 022 21/05/2013 Merrill Lynch International 1 734 USD 2 073 867 EUR 1 550 000 21/05/2013 Merrill Lynch International 85 722 USD 5 304 377 GBP 3 475 665 21/05/2013 Merrill Lynch International 26 738 USD 100 000 JPY 9 611 500 21/05/2013 Merrill Lynch International (2 143)USD 2 393 533 MXN 30 573 105 21/05/2013 Merrill Lynch International (69 019)USD 2 879 381 NZD 3 500 000 21/05/2013 Merrill Lynch International (38 996)USD 1 500 071 ZAR 13 779 772 21/05/2013 Merrill Lynch International 10 838 ZAR 2 702 366 USD 300 000 21/05/2013 Merrill Lynch International (7 945)INR 44 126 000 USD 794 920 06/06/2013 Merrill Lynch International 6 231 CNY 24 902 990 USD 3 965 415 10/07/2013 Merrill Lynch International 20 220 Total Forward foreign exchange contracts 41 987
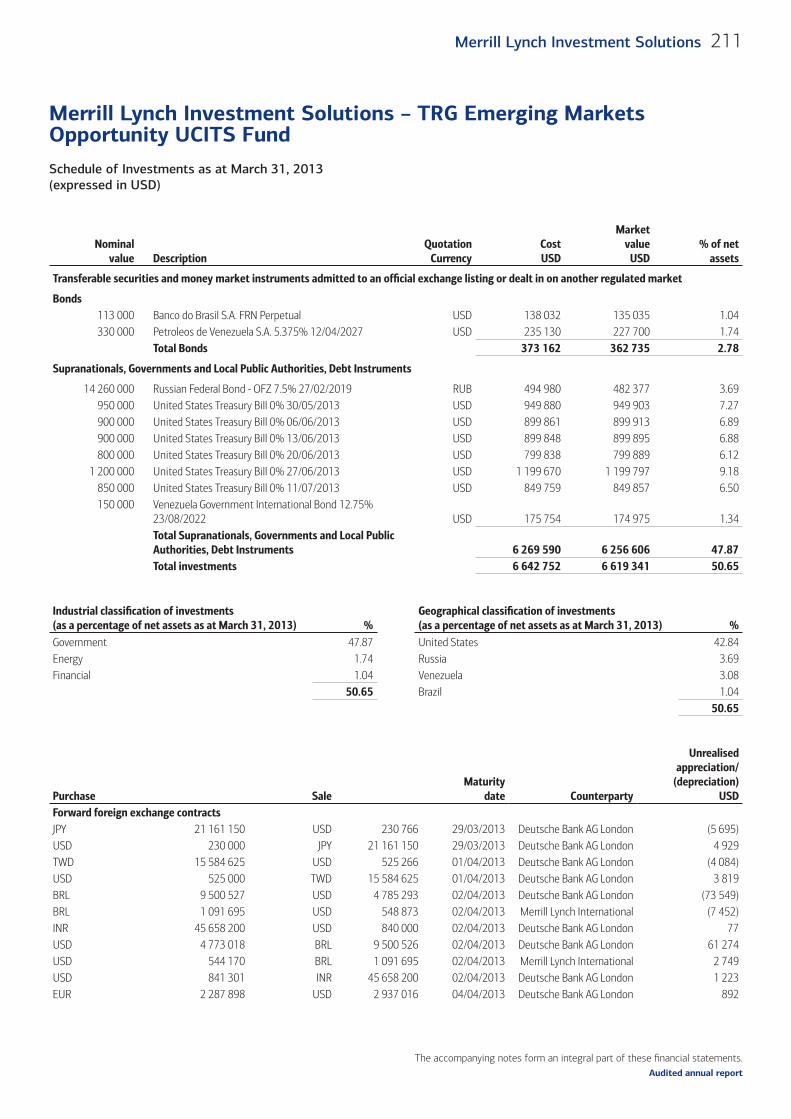
The accompanying notes form an integral part of these fi nancial statements.
Schedule of Investments as at March 31, 2013 (expressed in USD)
Merrill Lynch Investment Solutions – TRG Emerging Markets Opportunity UCITS Fund
211Merrill Lynch Investment Solutions
Audited annual report
Nominalvalue Description
QuotationCurrency
CostUSD
Marketvalue
USD% of net
assets
Transferable securities and money market instruments admitted to an offi cial exchange listing or dealt in on another regulated market
Bonds113 000 Banco do Brasil S.A. FRN Perpetual USD 138 032 135 035 1.04330 000 Petroleos de Venezuela S.A. 5.375% 12/04/2027 USD 235 130 227 700 1.74
Total Bonds 373 162 362 735 2.78
Supranationals, Governments and Local Public Authorities, Debt Instruments
14 260 000 Russian Federal Bond - OFZ 7.5% 27/02/2019 RUB 494 980 482 377 3.69950 000 United States Treasury Bill 0% 30/05/2013 USD 949 880 949 903 7.27900 000 United States Treasury Bill 0% 06/06/2013 USD 899 861 899 913 6.89900 000 United States Treasury Bill 0% 13/06/2013 USD 899 848 899 895 6.88800 000 United States Treasury Bill 0% 20/06/2013 USD 799 838 799 889 6.12
1 200 000 United States Treasury Bill 0% 27/06/2013 USD 1 199 670 1 199 797 9.18850 000 United States Treasury Bill 0% 11/07/2013 USD 849 759 849 857 6.50150 000 Venezuela Government International Bond 12.75%
23/08/2022 USD 175 754 174 975 1.34Total Supranationals, Governments and Local Public Authorities, Debt Instruments 6 269 590 6 256 606 47.87Total investments 6 642 752 6 619 341 50.65
Industrial classifi cation of investments (as a percentage of net assets as at March 31, 2013) %
Geographical classifi cation of investments(as a percentage of net assets as at March 31, 2013) %
Government 47.87 United States 42.84Energy 1.74 Russia 3.69Financial 1.04 Venezuela 3.08
50.65 Brazil 1.0450.65
Purchase SaleMaturity
date Counterparty
Unrealisedappreciation/
(depreciation)USD
Forward foreign exchange contracts (cont.)JPY 21 161 150 USD 230 766 29/03/2013 Deutsche Bank AG London (5 695)USD 230 000 JPY 21 161 150 29/03/2013 Deutsche Bank AG London 4 929 TWD 15 584 625 USD 525 266 01/04/2013 Deutsche Bank AG London (4 084)USD 525 000 TWD 15 584 625 01/04/2013 Deutsche Bank AG London 3 819 BRL 9 500 527 USD 4 785 293 02/04/2013 Deutsche Bank AG London (73 549)BRL 1 091 695 USD 548 873 02/04/2013 Merrill Lynch International (7 452)INR 45 658 200 USD 840 000 02/04/2013 Deutsche Bank AG London 77 USD 4 773 018 BRL 9 500 526 02/04/2013 Deutsche Bank AG London 61 274USD 544 170 BRL 1 091 695 02/04/2013 Merrill Lynch International 2 749USD 841 301 INR 45 658 200 02/04/2013 Deutsche Bank AG London 1 223 EUR 2 287 898 USD 2 937 016 04/04/2013 Deutsche Bank AG London 892
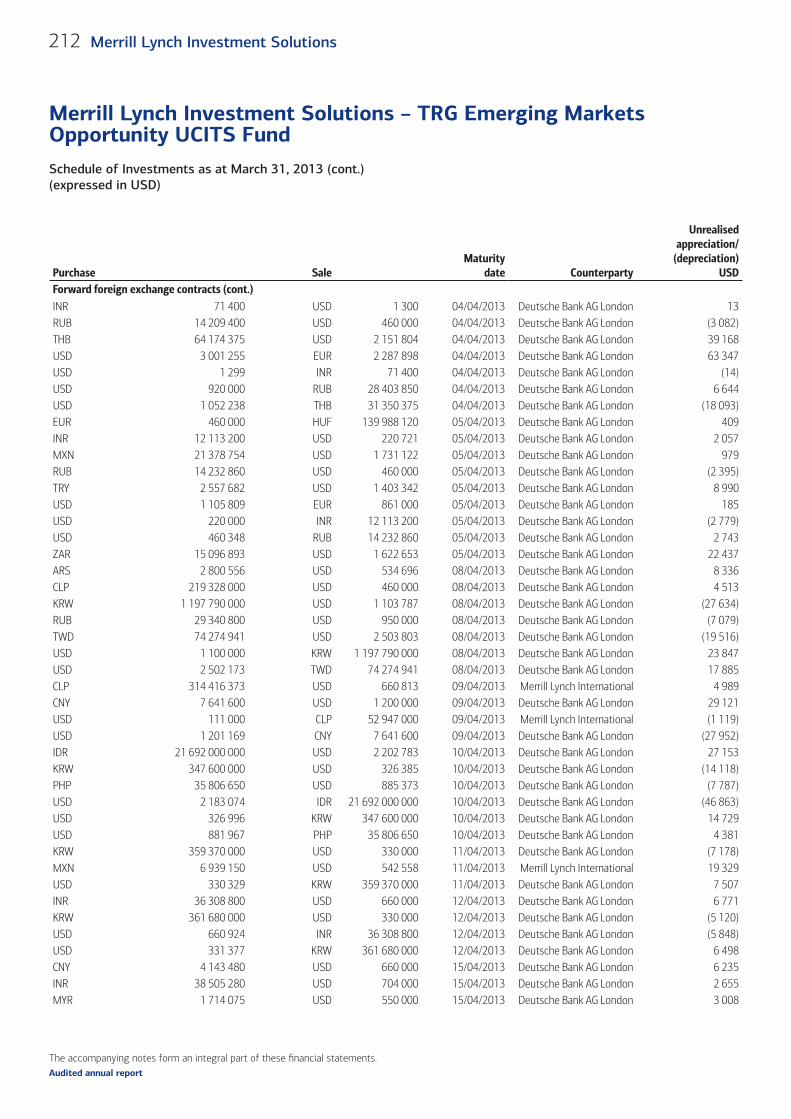
The accompanying notes form an integral part of these fi nancial statements.
Schedule of Investments as at March 31, 2013 (cont.)(expressed in USD)
Merrill Lynch Investment Solutions – TRG Emerging Markets Opportunity UCITS Fund
212 Merrill Lynch Investment Solutions
Audited annual report
Purchase SaleMaturity
date Counterparty
Unrealisedappreciation/
(depreciation)USD
Forward foreign exchange contracts (cont.)INR 71 400 USD 1 300 04/04/2013 Deutsche Bank AG London 13 RUB 14 209 400 USD 460 000 04/04/2013 Deutsche Bank AG London (3 082)THB 64 174 375 USD 2 151 804 04/04/2013 Deutsche Bank AG London 39 168 USD 3 001 255 EUR 2 287 898 04/04/2013 Deutsche Bank AG London 63 347 USD 1 299 INR 71 400 04/04/2013 Deutsche Bank AG London (14)USD 920 000 RUB 28 403 850 04/04/2013 Deutsche Bank AG London 6 644 USD 1 052 238 THB 31 350 375 04/04/2013 Deutsche Bank AG London (18 093)EUR 460 000 HUF 139 988 120 05/04/2013 Deutsche Bank AG London 409 INR 12 113 200 USD 220 721 05/04/2013 Deutsche Bank AG London 2 057 MXN 21 378 754 USD 1 731 122 05/04/2013 Deutsche Bank AG London 979 RUB 14 232 860 USD 460 000 05/04/2013 Deutsche Bank AG London (2 395)TRY 2 557 682 USD 1 403 342 05/04/2013 Deutsche Bank AG London 8 990 USD 1 105 809 EUR 861 000 05/04/2013 Deutsche Bank AG London 185 USD 220 000 INR 12 113 200 05/04/2013 Deutsche Bank AG London (2 779)USD 460 348 RUB 14 232 860 05/04/2013 Deutsche Bank AG London 2 743 ZAR 15 096 893 USD 1 622 653 05/04/2013 Deutsche Bank AG London 22 437 ARS 2 800 556 USD 534 696 08/04/2013 Deutsche Bank AG London 8 336 CLP 219 328 000 USD 460 000 08/04/2013 Deutsche Bank AG London 4 513 KRW 1 197 790 000 USD 1 103 787 08/04/2013 Deutsche Bank AG London (27 634)RUB 29 340 800 USD 950 000 08/04/2013 Deutsche Bank AG London (7 079)TWD 74 274 941 USD 2 503 803 08/04/2013 Deutsche Bank AG London (19 516)USD 1 100 000 KRW 1 197 790 000 08/04/2013 Deutsche Bank AG London 23 847 USD 2 502 173 TWD 74 274 941 08/04/2013 Deutsche Bank AG London 17 885 CLP 314 416 373 USD 660 813 09/04/2013 Merrill Lynch International 4 989 CNY 7 641 600 USD 1 200 000 09/04/2013 Deutsche Bank AG London 29 121 USD 111 000 CLP 52 947 000 09/04/2013 Merrill Lynch International (1 119)USD 1 201 169 CNY 7 641 600 09/04/2013 Deutsche Bank AG London (27 952)IDR 21 692 000 000 USD 2 202 783 10/04/2013 Deutsche Bank AG London 27 153 KRW 347 600 000 USD 326 385 10/04/2013 Deutsche Bank AG London (14 118)PHP 35 806 650 USD 885 373 10/04/2013 Deutsche Bank AG London (7 787)USD 2 183 074 IDR 21 692 000 000 10/04/2013 Deutsche Bank AG London (46 863)USD 326 996 KRW 347 600 000 10/04/2013 Deutsche Bank AG London 14 729 USD 881 967 PHP 35 806 650 10/04/2013 Deutsche Bank AG London 4 381 KRW 359 370 000 USD 330 000 11/04/2013 Deutsche Bank AG London (7 178)MXN 6 939 150 USD 542 558 11/04/2013 Merrill Lynch International 19 329 USD 330 329 KRW 359 370 000 11/04/2013 Deutsche Bank AG London 7 507 INR 36 308 800 USD 660 000 12/04/2013 Deutsche Bank AG London 6 771 KRW 361 680 000 USD 330 000 12/04/2013 Deutsche Bank AG London (5 120)USD 660 924 INR 36 308 800 12/04/2013 Deutsche Bank AG London (5 848)USD 331 377 KRW 361 680 000 12/04/2013 Deutsche Bank AG London 6 498 CNY 4 143 480 USD 660 000 15/04/2013 Deutsche Bank AG London 6 235 INR 38 505 280 USD 704 000 15/04/2013 Deutsche Bank AG London 2 655 MYR 1 714 075 USD 550 000 15/04/2013 Deutsche Bank AG London 3 008
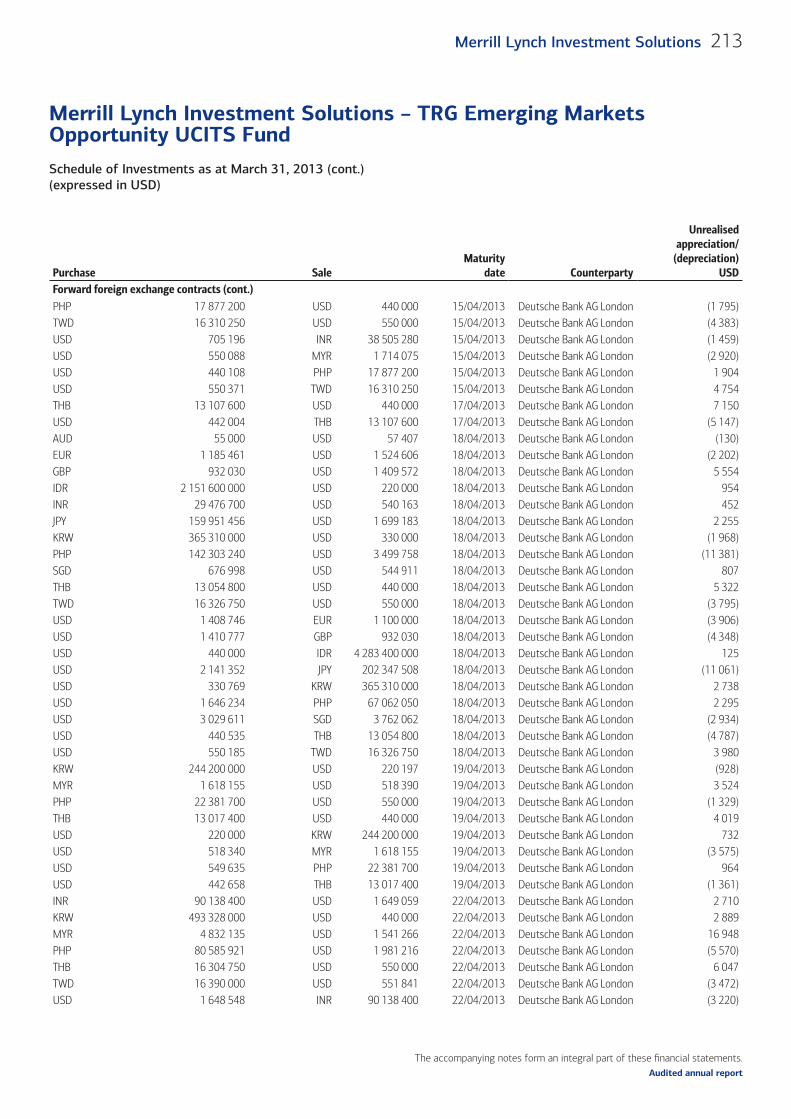
The accompanying notes form an integral part of these fi nancial statements.
Schedule of Investments as at March 31, 2013 (cont.)(expressed in USD)
Merrill Lynch Investment Solutions – TRG Emerging Markets Opportunity UCITS Fund
213Merrill Lynch Investment Solutions
Audited annual report
Purchase SaleMaturity
date Counterparty
Unrealisedappreciation/
(depreciation)USD
Forward foreign exchange contracts (cont.)PHP 17 877 200 USD 440 000 15/04/2013 Deutsche Bank AG London (1 795)TWD 16 310 250 USD 550 000 15/04/2013 Deutsche Bank AG London (4 383)USD 705 196 INR 38 505 280 15/04/2013 Deutsche Bank AG London (1 459)USD 550 088 MYR 1 714 075 15/04/2013 Deutsche Bank AG London (2 920)USD 440 108 PHP 17 877 200 15/04/2013 Deutsche Bank AG London 1 904 USD 550 371 TWD 16 310 250 15/04/2013 Deutsche Bank AG London 4 754 THB 13 107 600 USD 440 000 17/04/2013 Deutsche Bank AG London 7 150 USD 442 004 THB 13 107 600 17/04/2013 Deutsche Bank AG London (5 147)AUD 55 000 USD 57 407 18/04/2013 Deutsche Bank AG London (130)EUR 1 185 461 USD 1 524 606 18/04/2013 Deutsche Bank AG London (2 202)GBP 932 030 USD 1 409 572 18/04/2013 Deutsche Bank AG London 5 554 IDR 2 151 600 000 USD 220 000 18/04/2013 Deutsche Bank AG London 954 INR 29 476 700 USD 540 163 18/04/2013 Deutsche Bank AG London 452 JPY 159 951 456 USD 1 699 183 18/04/2013 Deutsche Bank AG London 2 255 KRW 365 310 000 USD 330 000 18/04/2013 Deutsche Bank AG London (1 968)PHP 142 303 240 USD 3 499 758 18/04/2013 Deutsche Bank AG London (11 381)SGD 676 998 USD 544 911 18/04/2013 Deutsche Bank AG London 807 THB 13 054 800 USD 440 000 18/04/2013 Deutsche Bank AG London 5 322 TWD 16 326 750 USD 550 000 18/04/2013 Deutsche Bank AG London (3 795)USD 1 408 746 EUR 1 100 000 18/04/2013 Deutsche Bank AG London (3 906)USD 1 410 777 GBP 932 030 18/04/2013 Deutsche Bank AG London (4 348)USD 440 000 IDR 4 283 400 000 18/04/2013 Deutsche Bank AG London 125 USD 2 141 352 JPY 202 347 508 18/04/2013 Deutsche Bank AG London (11 061)USD 330 769 KRW 365 310 000 18/04/2013 Deutsche Bank AG London 2 738 USD 1 646 234 PHP 67 062 050 18/04/2013 Deutsche Bank AG London 2 295 USD 3 029 611 SGD 3 762 062 18/04/2013 Deutsche Bank AG London (2 934)USD 440 535 THB 13 054 800 18/04/2013 Deutsche Bank AG London (4 787)USD 550 185 TWD 16 326 750 18/04/2013 Deutsche Bank AG London 3 980 KRW 244 200 000 USD 220 197 19/04/2013 Deutsche Bank AG London (928)MYR 1 618 155 USD 518 390 19/04/2013 Deutsche Bank AG London 3 524 PHP 22 381 700 USD 550 000 19/04/2013 Deutsche Bank AG London (1 329)THB 13 017 400 USD 440 000 19/04/2013 Deutsche Bank AG London 4 019 USD 220 000 KRW 244 200 000 19/04/2013 Deutsche Bank AG London 732 USD 518 340 MYR 1 618 155 19/04/2013 Deutsche Bank AG London (3 575)USD 549 635 PHP 22 381 700 19/04/2013 Deutsche Bank AG London 964 USD 442 658 THB 13 017 400 19/04/2013 Deutsche Bank AG London (1 361)INR 90 138 400 USD 1 649 059 22/04/2013 Deutsche Bank AG London 2 710 KRW 493 328 000 USD 440 000 22/04/2013 Deutsche Bank AG London 2 889 MYR 4 832 135 USD 1 541 266 22/04/2013 Deutsche Bank AG London 16 948 PHP 80 585 921 USD 1 981 216 22/04/2013 Deutsche Bank AG London (5 570)THB 16 304 750 USD 550 000 22/04/2013 Deutsche Bank AG London 6 047 TWD 16 390 000 USD 551 841 22/04/2013 Deutsche Bank AG London (3 472)USD 1 648 548 INR 90 138 400 22/04/2013 Deutsche Bank AG London (3 220)
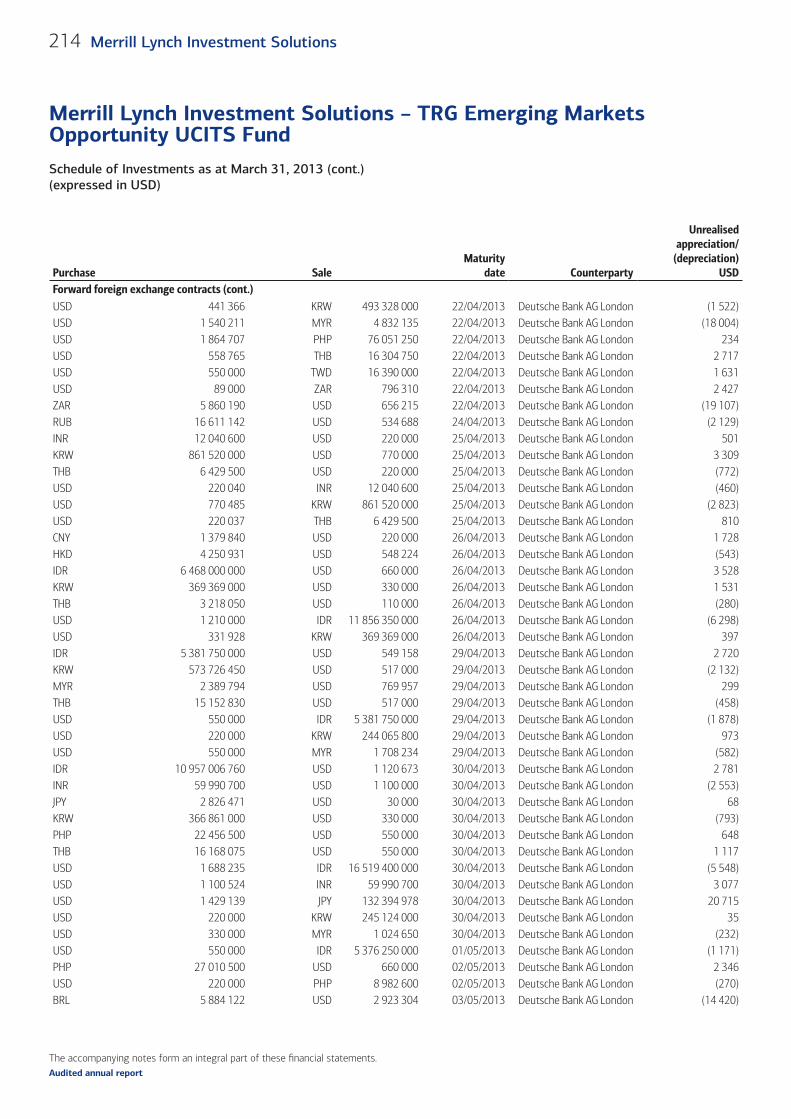
The accompanying notes form an integral part of these fi nancial statements.
Schedule of Investments as at March 31, 2013 (cont.)(expressed in USD)
Merrill Lynch Investment Solutions – TRG Emerging Markets Opportunity UCITS Fund
214 Merrill Lynch Investment Solutions
Audited annual report
Purchase SaleMaturity
date Counterparty
Unrealisedappreciation/
(depreciation)USD
Forward foreign exchange contracts (cont.)USD 441 366 KRW 493 328 000 22/04/2013 Deutsche Bank AG London (1 522)USD 1 540 211 MYR 4 832 135 22/04/2013 Deutsche Bank AG London (18 004)USD 1 864 707 PHP 76 051 250 22/04/2013 Deutsche Bank AG London 234 USD 558 765 THB 16 304 750 22/04/2013 Deutsche Bank AG London 2 717 USD 550 000 TWD 16 390 000 22/04/2013 Deutsche Bank AG London 1 631 USD 89 000 ZAR 796 310 22/04/2013 Deutsche Bank AG London 2 427 ZAR 5 860 190 USD 656 215 22/04/2013 Deutsche Bank AG London (19 107)RUB 16 611 142 USD 534 688 24/04/2013 Deutsche Bank AG London (2 129)INR 12 040 600 USD 220 000 25/04/2013 Deutsche Bank AG London 501 KRW 861 520 000 USD 770 000 25/04/2013 Deutsche Bank AG London 3 309 THB 6 429 500 USD 220 000 25/04/2013 Deutsche Bank AG London (772)USD 220 040 INR 12 040 600 25/04/2013 Deutsche Bank AG London (460)USD 770 485 KRW 861 520 000 25/04/2013 Deutsche Bank AG London (2 823)USD 220 037 THB 6 429 500 25/04/2013 Deutsche Bank AG London 810 CNY 1 379 840 USD 220 000 26/04/2013 Deutsche Bank AG London 1 728 HKD 4 250 931 USD 548 224 26/04/2013 Deutsche Bank AG London (543)IDR 6 468 000 000 USD 660 000 26/04/2013 Deutsche Bank AG London 3 528 KRW 369 369 000 USD 330 000 26/04/2013 Deutsche Bank AG London 1 531 THB 3 218 050 USD 110 000 26/04/2013 Deutsche Bank AG London (280)USD 1 210 000 IDR 11 856 350 000 26/04/2013 Deutsche Bank AG London (6 298)USD 331 928 KRW 369 369 000 26/04/2013 Deutsche Bank AG London 397 IDR 5 381 750 000 USD 549 158 29/04/2013 Deutsche Bank AG London 2 720 KRW 573 726 450 USD 517 000 29/04/2013 Deutsche Bank AG London (2 132)MYR 2 389 794 USD 769 957 29/04/2013 Deutsche Bank AG London 299 THB 15 152 830 USD 517 000 29/04/2013 Deutsche Bank AG London (458)USD 550 000 IDR 5 381 750 000 29/04/2013 Deutsche Bank AG London (1 878)USD 220 000 KRW 244 065 800 29/04/2013 Deutsche Bank AG London 973 USD 550 000 MYR 1 708 234 29/04/2013 Deutsche Bank AG London (582)IDR 10 957 006 760 USD 1 120 673 30/04/2013 Deutsche Bank AG London 2 781 INR 59 990 700 USD 1 100 000 30/04/2013 Deutsche Bank AG London (2 553)JPY 2 826 471 USD 30 000 30/04/2013 Deutsche Bank AG London 68 KRW 366 861 000 USD 330 000 30/04/2013 Deutsche Bank AG London (793)PHP 22 456 500 USD 550 000 30/04/2013 Deutsche Bank AG London 648 THB 16 168 075 USD 550 000 30/04/2013 Deutsche Bank AG London 1 117 USD 1 688 235 IDR 16 519 400 000 30/04/2013 Deutsche Bank AG London (5 548)USD 1 100 524 INR 59 990 700 30/04/2013 Deutsche Bank AG London 3 077 USD 1 429 139 JPY 132 394 978 30/04/2013 Deutsche Bank AG London 20 715 USD 220 000 KRW 245 124 000 30/04/2013 Deutsche Bank AG London 35 USD 330 000 MYR 1 024 650 30/04/2013 Deutsche Bank AG London (232)USD 550 000 IDR 5 376 250 000 01/05/2013 Deutsche Bank AG London (1 171)PHP 27 010 500 USD 660 000 02/05/2013 Deutsche Bank AG London 2 346 USD 220 000 PHP 8 982 600 02/05/2013 Deutsche Bank AG London (270)BRL 5 884 122 USD 2 923 304 03/05/2013 Deutsche Bank AG London (14 420)
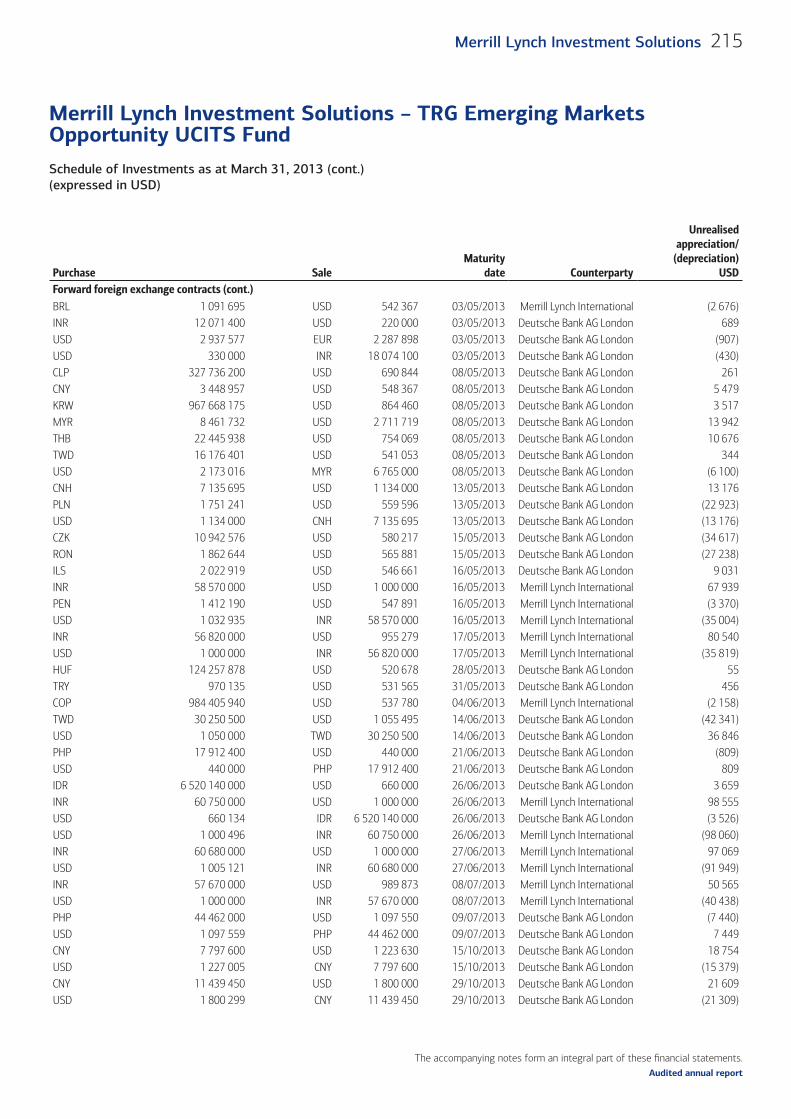
The accompanying notes form an integral part of these fi nancial statements.
Schedule of Investments as at March 31, 2013 (cont.)(expressed in USD)
Merrill Lynch Investment Solutions – TRG Emerging Markets Opportunity UCITS Fund
215Merrill Lynch Investment Solutions
Audited annual report
Purchase SaleMaturity
date Counterparty
Unrealisedappreciation/
(depreciation)USD
Forward foreign exchange contracts (cont.)BRL 1 091 695 USD 542 367 03/05/2013 Merrill Lynch International (2 676)INR 12 071 400 USD 220 000 03/05/2013 Deutsche Bank AG London 689 USD 2 937 577 EUR 2 287 898 03/05/2013 Deutsche Bank AG London (907)USD 330 000 INR 18 074 100 03/05/2013 Deutsche Bank AG London (430)CLP 327 736 200 USD 690 844 08/05/2013 Deutsche Bank AG London 261 CNY 3 448 957 USD 548 367 08/05/2013 Deutsche Bank AG London 5 479 KRW 967 668 175 USD 864 460 08/05/2013 Deutsche Bank AG London 3 517 MYR 8 461 732 USD 2 711 719 08/05/2013 Deutsche Bank AG London 13 942 THB 22 445 938 USD 754 069 08/05/2013 Deutsche Bank AG London 10 676 TWD 16 176 401 USD 541 053 08/05/2013 Deutsche Bank AG London 344 USD 2 173 016 MYR 6 765 000 08/05/2013 Deutsche Bank AG London (6 100)CNH 7 135 695 USD 1 134 000 13/05/2013 Deutsche Bank AG London 13 176 PLN 1 751 241 USD 559 596 13/05/2013 Deutsche Bank AG London (22 923)USD 1 134 000 CNH 7 135 695 13/05/2013 Deutsche Bank AG London (13 176)CZK 10 942 576 USD 580 217 15/05/2013 Deutsche Bank AG London (34 617)RON 1 862 644 USD 565 881 15/05/2013 Deutsche Bank AG London (27 238)ILS 2 022 919 USD 546 661 16/05/2013 Deutsche Bank AG London 9 031 INR 58 570 000 USD 1 000 000 16/05/2013 Merrill Lynch International 67 939 PEN 1 412 190 USD 547 891 16/05/2013 Merrill Lynch International (3 370)USD 1 032 935 INR 58 570 000 16/05/2013 Merrill Lynch International (35 004)INR 56 820 000 USD 955 279 17/05/2013 Merrill Lynch International 80 540 USD 1 000 000 INR 56 820 000 17/05/2013 Merrill Lynch International (35 819)HUF 124 257 878 USD 520 678 28/05/2013 Deutsche Bank AG London 55 TRY 970 135 USD 531 565 31/05/2013 Deutsche Bank AG London 456 COP 984 405 940 USD 537 780 04/06/2013 Merrill Lynch International (2 158)TWD 30 250 500 USD 1 055 495 14/06/2013 Deutsche Bank AG London (42 341)USD 1 050 000 TWD 30 250 500 14/06/2013 Deutsche Bank AG London 36 846 PHP 17 912 400 USD 440 000 21/06/2013 Deutsche Bank AG London (809)USD 440 000 PHP 17 912 400 21/06/2013 Deutsche Bank AG London 809 IDR 6 520 140 000 USD 660 000 26/06/2013 Deutsche Bank AG London 3 659 INR 60 750 000 USD 1 000 000 26/06/2013 Merrill Lynch International 98 555 USD 660 134 IDR 6 520 140 000 26/06/2013 Deutsche Bank AG London (3 526)USD 1 000 496 INR 60 750 000 26/06/2013 Merrill Lynch International (98 060)INR 60 680 000 USD 1 000 000 27/06/2013 Merrill Lynch International 97 069 USD 1 005 121 INR 60 680 000 27/06/2013 Merrill Lynch International (91 949)INR 57 670 000 USD 989 873 08/07/2013 Merrill Lynch International 50 565 USD 1 000 000 INR 57 670 000 08/07/2013 Merrill Lynch International (40 438)PHP 44 462 000 USD 1 097 550 09/07/2013 Deutsche Bank AG London (7 440)USD 1 097 559 PHP 44 462 000 09/07/2013 Deutsche Bank AG London 7 449 CNY 7 797 600 USD 1 223 630 15/10/2013 Deutsche Bank AG London 18 754 USD 1 227 005 CNY 7 797 600 15/10/2013 Deutsche Bank AG London (15 379)CNY 11 439 450 USD 1 800 000 29/10/2013 Deutsche Bank AG London 21 609 USD 1 800 299 CNY 11 439 450 29/10/2013 Deutsche Bank AG London (21 309)
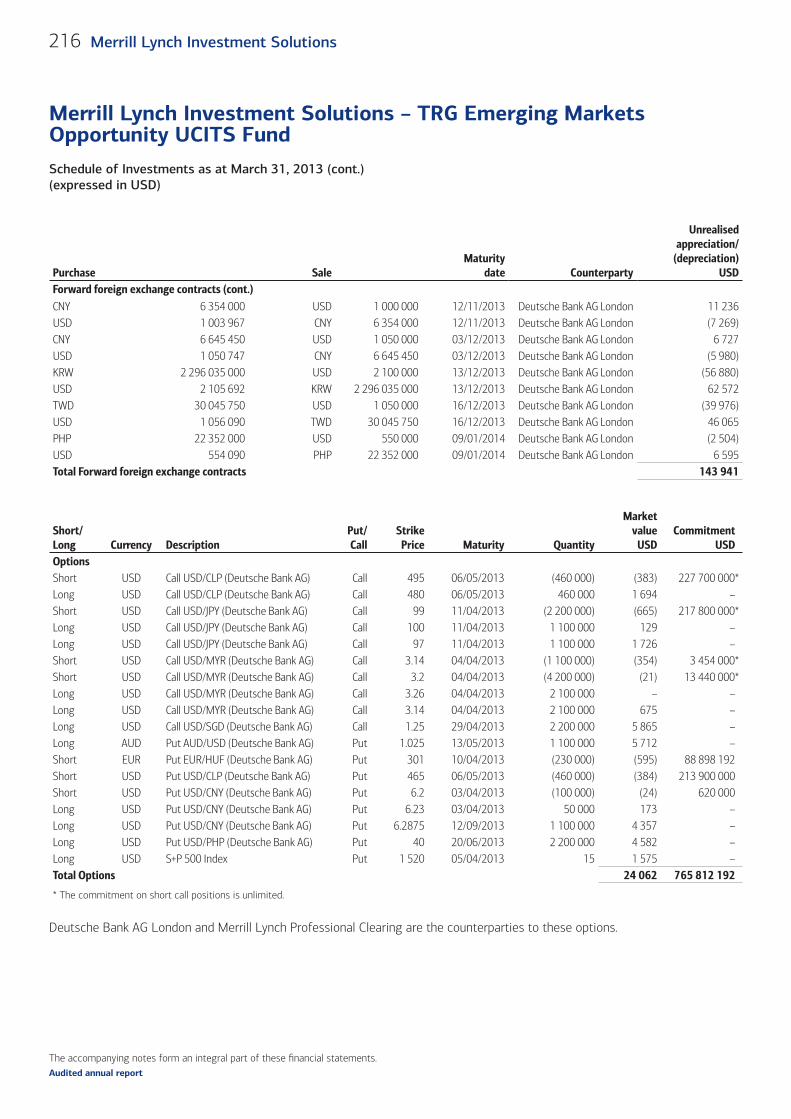
The accompanying notes form an integral part of these fi nancial statements.
Schedule of Investments as at March 31, 2013 (cont.)(expressed in USD)
Merrill Lynch Investment Solutions – TRG Emerging Markets Opportunity UCITS Fund
216 Merrill Lynch Investment Solutions
Audited annual report
Purchase SaleMaturity
date Counterparty
Unrealisedappreciation/
(depreciation)USD
Forward foreign exchange contracts (cont.)CNY 6 354 000 USD 1 000 000 12/11/2013 Deutsche Bank AG London 11 236 USD 1 003 967 CNY 6 354 000 12/11/2013 Deutsche Bank AG London (7 269)CNY 6 645 450 USD 1 050 000 03/12/2013 Deutsche Bank AG London 6 727 USD 1 050 747 CNY 6 645 450 03/12/2013 Deutsche Bank AG London (5 980)KRW 2 296 035 000 USD 2 100 000 13/12/2013 Deutsche Bank AG London (56 880)USD 2 105 692 KRW 2 296 035 000 13/12/2013 Deutsche Bank AG London 62 572 TWD 30 045 750 USD 1 050 000 16/12/2013 Deutsche Bank AG London (39 976)USD 1 056 090 TWD 30 045 750 16/12/2013 Deutsche Bank AG London 46 065 PHP 22 352 000 USD 550 000 09/01/2014 Deutsche Bank AG London (2 504)USD 554 090 PHP 22 352 000 09/01/2014 Deutsche Bank AG London 6 595 Total Forward foreign exchange contracts 143 941
Short/Long Currency Description
Put/Call
StrikePrice Maturity Quantity
Marketvalue
USDCommitment
USDOptionsShort USD Call USD/CLP (Deutsche Bank AG) Call 495 06/05/2013 (460 000) (383) 227 700 000*Long USD Call USD/CLP (Deutsche Bank AG) Call 480 06/05/2013 460 000 1 694 –Short USD Call USD/JPY (Deutsche Bank AG) Call 99 11/04/2013 (2 200 000) (665) 217 800 000*Long USD Call USD/JPY (Deutsche Bank AG) Call 100 11/04/2013 1 100 000 129 –Long USD Call USD/JPY (Deutsche Bank AG) Call 97 11/04/2013 1 100 000 1 726 –Short USD Call USD/MYR (Deutsche Bank AG) Call 3.14 04/04/2013 (1 100 000) (354) 3 454 000*Short USD Call USD/MYR (Deutsche Bank AG) Call 3.2 04/04/2013 (4 200 000) (21) 13 440 000*Long USD Call USD/MYR (Deutsche Bank AG) Call 3.26 04/04/2013 2 100 000 – –Long USD Call USD/MYR (Deutsche Bank AG) Call 3.14 04/04/2013 2 100 000 675 –Long USD Call USD/SGD (Deutsche Bank AG) Call 1.25 29/04/2013 2 200 000 5 865 –Long AUD Put AUD/USD (Deutsche Bank AG) Put 1.025 13/05/2013 1 100 000 5 712 –Short EUR Put EUR/HUF (Deutsche Bank AG) Put 301 10/04/2013 (230 000) (595) 88 898 192Short USD Put USD/CLP (Deutsche Bank AG) Put 465 06/05/2013 (460 000) (384) 213 900 000Short USD Put USD/CNY (Deutsche Bank AG) Put 6.2 03/04/2013 (100 000) (24) 620 000Long USD Put USD/CNY (Deutsche Bank AG) Put 6.23 03/04/2013 50 000 173 –Long USD Put USD/CNY (Deutsche Bank AG) Put 6.2875 12/09/2013 1 100 000 4 357 –Long USD Put USD/PHP (Deutsche Bank AG) Put 40 20/06/2013 2 200 000 4 582 –Long USD S+P 500 Index Put 1 520 05/04/2013 15 1 575 –Total Options 24 062 765 812 192
* The commitment on short call positions is unlimited.
Deutsche Bank AG London and Merrill Lynch Professional Clearing are the counterparties to these options.
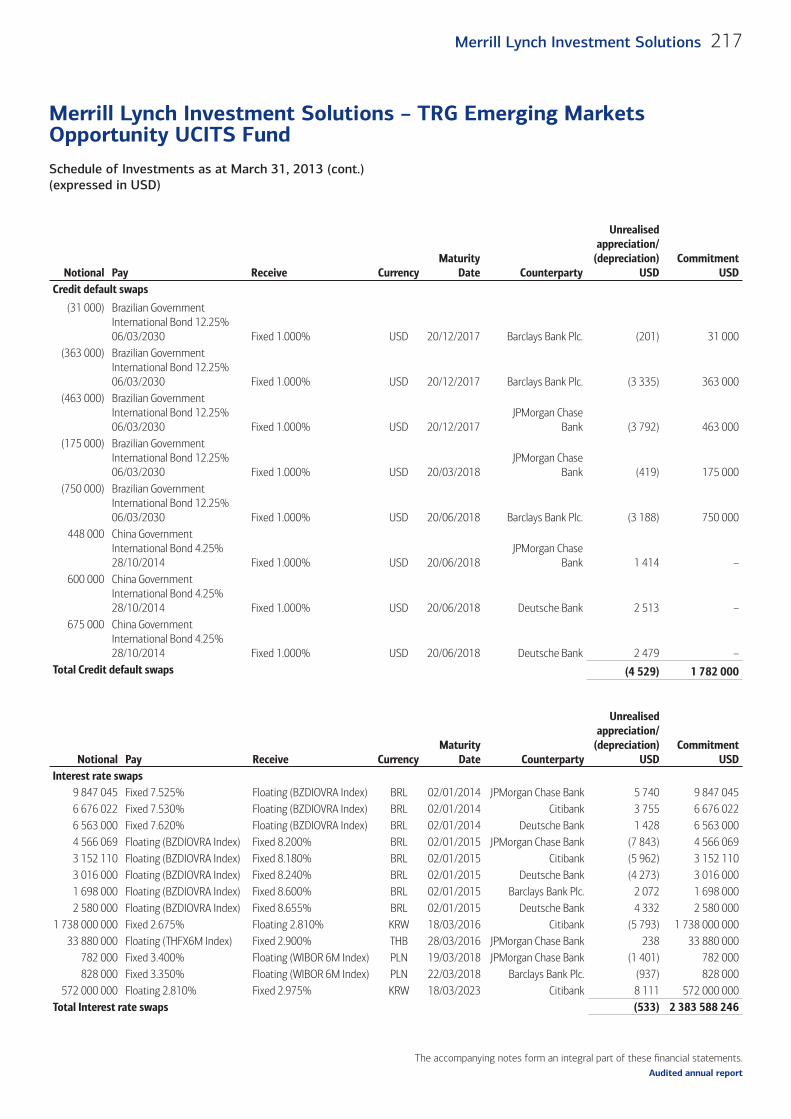
The accompanying notes form an integral part of these fi nancial statements.
Schedule of Investments as at March 31, 2013 (cont.)(expressed in USD)
Merrill Lynch Investment Solutions – TRG Emerging Markets Opportunity UCITS Fund
217Merrill Lynch Investment Solutions
Audited annual report
Notional Pay Receive CurrencyMaturity
Date Counterparty
Unrealisedappreciation/
(depreciation)USD
Commitment USD
Credit default swaps
(31 000) Brazilian Government International Bond 12.25% 06/03/2030 Fixed 1.000% USD 20/12/2017 Barclays Bank Plc. (201) 31 000
(363 000) Brazilian Government International Bond 12.25% 06/03/2030 Fixed 1.000% USD 20/12/2017 Barclays Bank Plc. (3 335) 363 000
(463 000) Brazilian Government International Bond 12.25% 06/03/2030 Fixed 1.000% USD 20/12/2017
JPMorgan Chase Bank (3 792) 463 000
(175 000) Brazilian Government International Bond 12.25% 06/03/2030 Fixed 1.000% USD 20/03/2018
JPMorgan Chase Bank (419) 175 000
(750 000) Brazilian Government International Bond 12.25% 06/03/2030 Fixed 1.000% USD 20/06/2018 Barclays Bank Plc. (3 188) 750 000
448 000 China Government International Bond 4.25% 28/10/2014 Fixed 1.000% USD 20/06/2018
JPMorgan Chase Bank 1 414 –
600 000 China Government International Bond 4.25% 28/10/2014 Fixed 1.000% USD 20/06/2018 Deutsche Bank 2 513 –
675 000 China Government International Bond 4.25% 28/10/2014 Fixed 1.000% USD 20/06/2018 Deutsche Bank 2 479 –
Total Credit default swaps (4 529) 1 782 000
Notional Pay Receive CurrencyMaturity
Date Counterparty
Unrealisedappreciation/
(depreciation)USD
CommitmentUSD
Interest rate swaps9 847 045 Fixed 7.525% Floating (BZDIOVRA Index) BRL 02/01/2014 JPMorgan Chase Bank 5 740 9 847 0456 676 022 Fixed 7.530% Floating (BZDIOVRA Index) BRL 02/01/2014 Citibank 3 755 6 676 0226 563 000 Fixed 7.620% Floating (BZDIOVRA Index) BRL 02/01/2014 Deutsche Bank 1 428 6 563 0004 566 069 Floating (BZDIOVRA Index) Fixed 8.200% BRL 02/01/2015 JPMorgan Chase Bank (7 843) 4 566 0693 152 110 Floating (BZDIOVRA Index) Fixed 8.180% BRL 02/01/2015 Citibank (5 962) 3 152 1103 016 000 Floating (BZDIOVRA Index) Fixed 8.240% BRL 02/01/2015 Deutsche Bank (4 273) 3 016 0001 698 000 Floating (BZDIOVRA Index) Fixed 8.600% BRL 02/01/2015 Barclays Bank Plc. 2 072 1 698 0002 580 000 Floating (BZDIOVRA Index) Fixed 8.655% BRL 02/01/2015 Deutsche Bank 4 332 2 580 000
1 738 000 000 Fixed 2.675% Floating 2.810% KRW 18/03/2016 Citibank (5 793) 1 738 000 00033 880 000 Floating (THFX6M Index) Fixed 2.900% THB 28/03/2016 JPMorgan Chase Bank 238 33 880 000
782 000 Fixed 3.400% Floating (WIBOR 6M Index) PLN 19/03/2018 JPMorgan Chase Bank (1 401) 782 000828 000 Fixed 3.350% Floating (WIBOR 6M Index) PLN 22/03/2018 Barclays Bank Plc. (937) 828 000
572 000 000 Floating 2.810% Fixed 2.975% KRW 18/03/2023 Citibank 8 111 572 000 000Total Interest rate swaps (533) 2 383 588 246
The accompanying notes form an integral part of these fi nancial statements.
Schedule of Investments as at March 31, 2013 (cont.)(expressed in USD)
Merrill Lynch Investment Solutions – TRG Emerging Markets Opportunity UCITS Fund
218 Merrill Lynch Investment Solutions
Audited annual report
Contracts for diff erence swaps
The Sub-Fund Merrill Lynch Investment Solutions – TRG Emerging Markets Opportunity UCITS Fund entered into contracts for diff erence swaps with one counterparty (Merrill Lynch International Bank Ltd) with the following details:
1) Merrill Lynch International Bank Ltd
No commitment*
Market value of USD (59) detailed as follows:– realised result: USD (59) corresponding to the realised loss on securities which is still held at the counterparty (monthly reset)
The total market value of the contracts for diff erence swaps is USD (59).
* No commitment as no portfolio held at year-end.
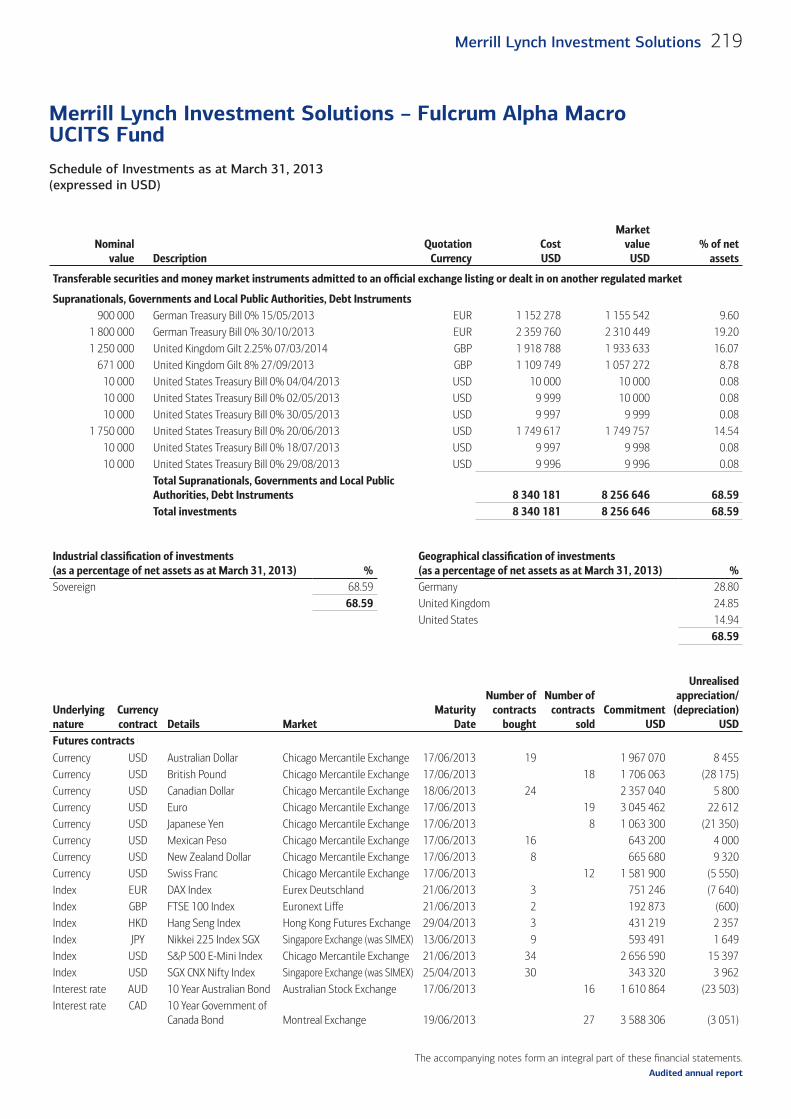
The accompanying notes form an integral part of these fi nancial statements.
Schedule of Investments as at March 31, 2013 (expressed in USD)
Merrill Lynch Investment Solutions – Fulcrum Alpha Macro UCITS Fund
219Merrill Lynch Investment Solutions
Audited annual report
Nominalvalue Description
QuotationCurrency
CostUSD
Marketvalue
USD% of net
assets
Transferable securities and money market instruments admitted to an offi cial exchange listing or dealt in on another regulated market
Supranationals, Governments and Local Public Authorities, Debt Instruments900 000 German Treasury Bill 0% 15/05/2013 EUR 1 152 278 1 155 542 9.60
1 800 000 German Treasury Bill 0% 30/10/2013 EUR 2 359 760 2 310 449 19.201 250 000 United Kingdom Gilt 2.25% 07/03/2014 GBP 1 918 788 1 933 633 16.07
671 000 United Kingdom Gilt 8% 27/09/2013 GBP 1 109 749 1 057 272 8.7810 000 United States Treasury Bill 0% 04/04/2013 USD 10 000 10 000 0.0810 000 United States Treasury Bill 0% 02/05/2013 USD 9 999 10 000 0.0810 000 United States Treasury Bill 0% 30/05/2013 USD 9 997 9 999 0.08
1 750 000 United States Treasury Bill 0% 20/06/2013 USD 1 749 617 1 749 757 14.5410 000 United States Treasury Bill 0% 18/07/2013 USD 9 997 9 998 0.0810 000 United States Treasury Bill 0% 29/08/2013 USD 9 996 9 996 0.08
Total Supranationals, Governments and Local Public Authorities, Debt Instruments 8 340 181 8 256 646 68.59Total investments 8 340 181 8 256 646 68.59
Industrial classifi cation of investments (as a percentage of net assets as at March 31, 2013) %
Geographical classifi cation of investments (as a percentage of net assets as at March 31, 2013) %
Sovereign 68.59 Germany 28.8068.59 United Kingdom 24.85
United States 14.9468.59
Underlyingnature
Currencycontract Details Market
MaturityDate
Number ofcontracts
bought
Number ofcontracts
soldCommitment
USD
Unrealisedappreciation/
(depreciation)USD
Futures contracts (cont.)Currency USD Australian Dollar Chicago Mercantile Exchange 17/06/2013 19 1 967 070 8 455Currency USD British Pound Chicago Mercantile Exchange 17/06/2013 18 1 706 063 (28 175)Currency USD Canadian Dollar Chicago Mercantile Exchange 18/06/2013 24 2 357 040 5 800Currency USD Euro Chicago Mercantile Exchange 17/06/2013 19 3 045 462 22 612Currency USD Japanese Yen Chicago Mercantile Exchange 17/06/2013 8 1 063 300 (21 350)Currency USD Mexican Peso Chicago Mercantile Exchange 17/06/2013 16 643 200 4 000Currency USD New Zealand Dollar Chicago Mercantile Exchange 17/06/2013 8 665 680 9 320Currency USD Swiss Franc Chicago Mercantile Exchange 17/06/2013 12 1 581 900 (5 550)Index EUR DAX Index Eurex Deutschland 21/06/2013 3 751 246 (7 640)Index GBP FTSE 100 Index Euronext Liffe 21/06/2013 2 192 873 (600)Index HKD Hang Seng Index Hong Kong Futures Exchange 29/04/2013 3 431 219 2 357Index JPY Nikkei 225 Index SGX Singapore Exchange (was SIMEX) 13/06/2013 9 593 491 1 649Index USD S&P 500 E-Mini Index Chicago Mercantile Exchange 21/06/2013 34 2 656 590 15 397Index USD SGX CNX Nifty Index Singapore Exchange (was SIMEX) 25/04/2013 30 343 320 3 962Interest rate AUD 10 Year Australian Bond Australian Stock Exchange 17/06/2013 16 1 610 864 (23 503)Interest rate CAD 10 Year Government of
Canada Bond Montreal Exchange 19/06/2013 27 3 588 306 (3 051)
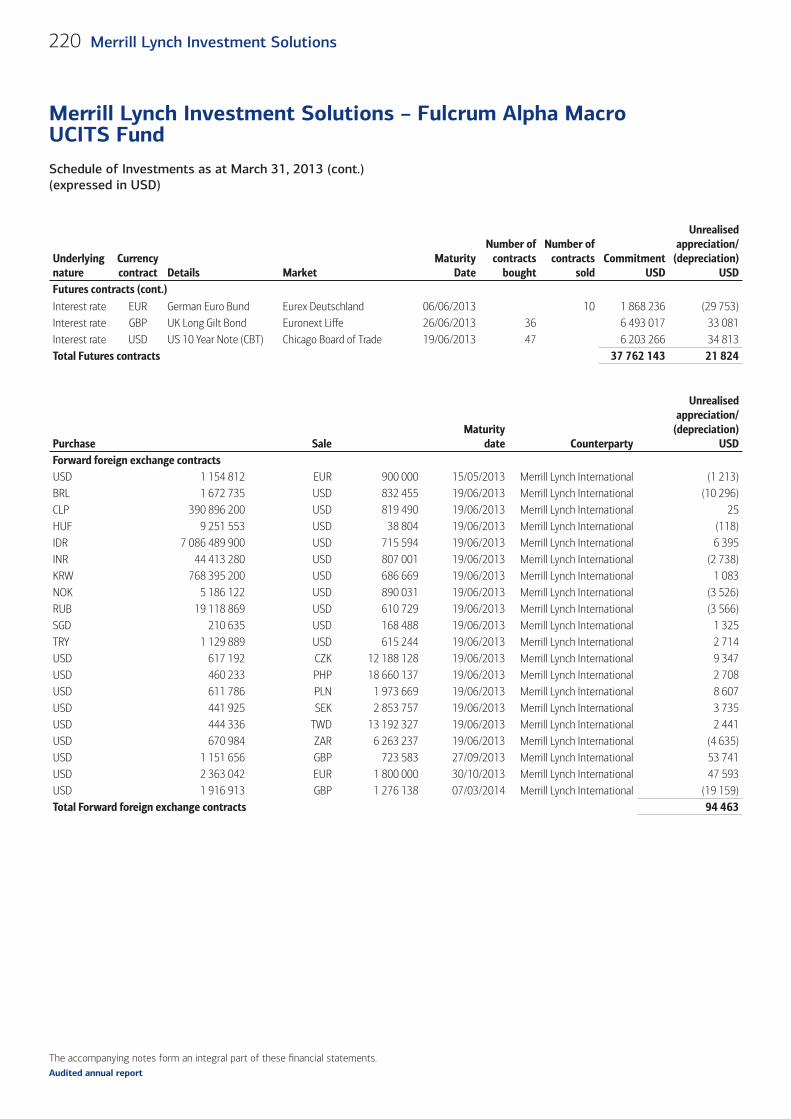
The accompanying notes form an integral part of these fi nancial statements.
Schedule of Investments as at March 31, 2013 (cont.)(expressed in USD)
Merrill Lynch Investment Solutions – Fulcrum Alpha Macro UCITS Fund
220 Merrill Lynch Investment Solutions
Audited annual report
Underlyingnature
Currencycontract Details Market
MaturityDate
Number ofcontracts
bought
Number ofcontracts
soldCommitment
USD
Unrealisedappreciation/
(depreciation)USD
Futures contracts (cont.)Interest rate EUR German Euro Bund Eurex Deutschland 06/06/2013 10 1 868 236 (29 753)Interest rate GBP UK Long Gilt Bond Euronext Liffe 26/06/2013 36 6 493 017 33 081Interest rate USD US 10 Year Note (CBT) Chicago Board of Trade 19/06/2013 47 6 203 266 34 813Total Futures contracts 37 762 143 21 824
Purchase SaleMaturity
date Counterparty
Unrealisedappreciation/
(depreciation)USD
Forward foreign exchange contractsUSD 1 154 812 EUR 900 000 15/05/2013 Merrill Lynch International (1 213)BRL 1 672 735 USD 832 455 19/06/2013 Merrill Lynch International (10 296)CLP 390 896 200 USD 819 490 19/06/2013 Merrill Lynch International 25HUF 9 251 553 USD 38 804 19/06/2013 Merrill Lynch International (118)IDR 7 086 489 900 USD 715 594 19/06/2013 Merrill Lynch International 6 395INR 44 413 280 USD 807 001 19/06/2013 Merrill Lynch International (2 738)KRW 768 395 200 USD 686 669 19/06/2013 Merrill Lynch International 1 083NOK 5 186 122 USD 890 031 19/06/2013 Merrill Lynch International (3 526)RUB 19 118 869 USD 610 729 19/06/2013 Merrill Lynch International (3 566)SGD 210 635 USD 168 488 19/06/2013 Merrill Lynch International 1 325TRY 1 129 889 USD 615 244 19/06/2013 Merrill Lynch International 2 714USD 617 192 CZK 12 188 128 19/06/2013 Merrill Lynch International 9 347USD 460 233 PHP 18 660 137 19/06/2013 Merrill Lynch International 2 708USD 611 786 PLN 1 973 669 19/06/2013 Merrill Lynch International 8 607USD 441 925 SEK 2 853 757 19/06/2013 Merrill Lynch International 3 735USD 444 336 TWD 13 192 327 19/06/2013 Merrill Lynch International 2 441USD 670 984 ZAR 6 263 237 19/06/2013 Merrill Lynch International (4 635)USD 1 151 656 GBP 723 583 27/09/2013 Merrill Lynch International 53 741USD 2 363 042 EUR 1 800 000 30/10/2013 Merrill Lynch International 47 593USD 1 916 913 GBP 1 276 138 07/03/2014 Merrill Lynch International (19 159)Total Forward foreign exchange contracts 94 463
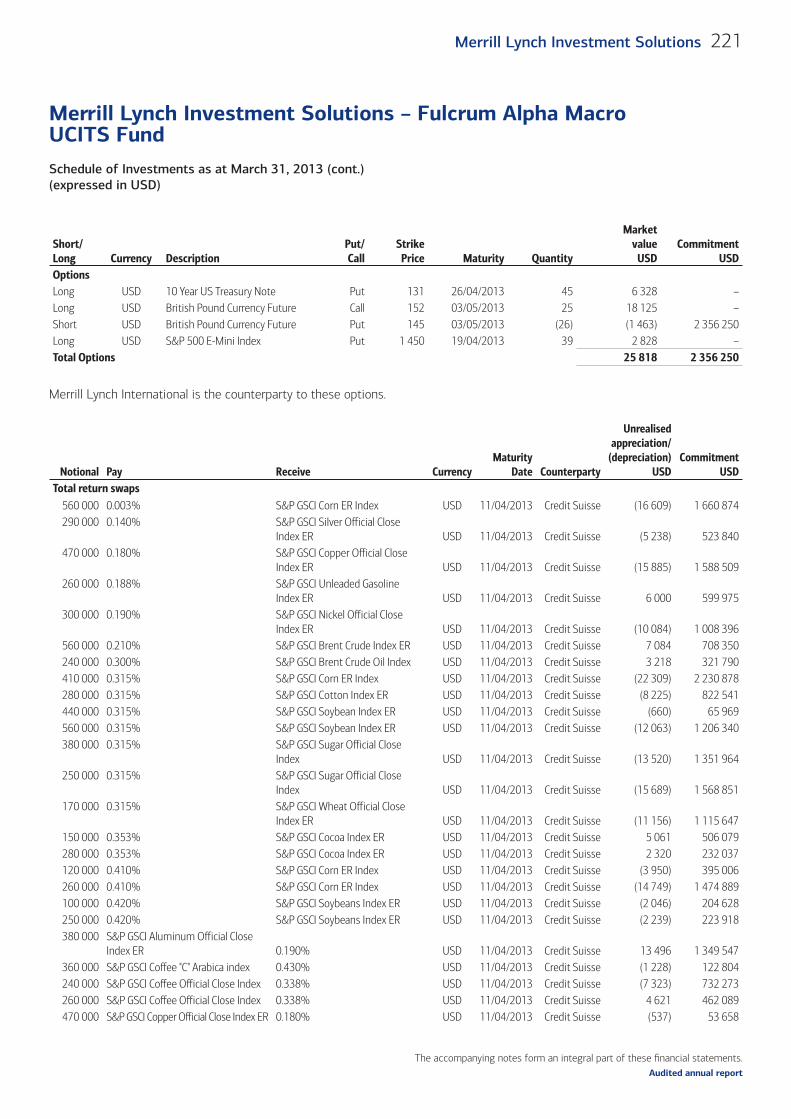
The accompanying notes form an integral part of these fi nancial statements.
Schedule of Investments as at March 31, 2013 (cont.)(expressed in USD)
Merrill Lynch Investment Solutions – Fulcrum Alpha Macro UCITS Fund
221Merrill Lynch Investment Solutions
Audited annual report
Short/Long Currency Description
Put/Call
StrikePrice Maturity Quantity
Marketvalue
USDCommitment
USDOptionsLong USD 10 Year US Treasury Note Put 131 26/04/2013 45 6 328 –Long USD British Pound Currency Future Call 152 03/05/2013 25 18 125 –Short USD British Pound Currency Future Put 145 03/05/2013 (26) (1 463) 2 356 250Long USD S&P 500 E-Mini Index Put 1 450 19/04/2013 39 2 828 –Total Options 25 818 2 356 250
Merrill Lynch International is the counterparty to these options.
Notional Pay Receive CurrencyMaturity
Date Counterparty
Unrealisedappreciation/
(depreciation)USD
CommitmentUSD
Total return swaps (cont.)560 000 0.003% S&P GSCI Corn ER Index USD 11/04/2013 Credit Suisse (16 609) 1 660 874290 000 0.140% S&P GSCI Silver Official Close
Index ER USD 11/04/2013 Credit Suisse (5 238) 523 840470 000 0.180% S&P GSCI Copper Official Close
Index ER USD 11/04/2013 Credit Suisse (15 885) 1 588 509260 000 0.188% S&P GSCI Unleaded Gasoline
Index ER USD 11/04/2013 Credit Suisse 6 000 599 975300 000 0.190% S&P GSCI Nickel Official Close
Index ER USD 11/04/2013 Credit Suisse (10 084) 1 008 396560 000 0.210% S&P GSCI Brent Crude Index ER USD 11/04/2013 Credit Suisse 7 084 708 350240 000 0.300% S&P GSCI Brent Crude Oil Index USD 11/04/2013 Credit Suisse 3 218 321 790410 000 0.315% S&P GSCI Corn ER Index USD 11/04/2013 Credit Suisse (22 309) 2 230 878280 000 0.315% S&P GSCI Cotton Index ER USD 11/04/2013 Credit Suisse (8 225) 822 541440 000 0.315% S&P GSCI Soybean Index ER USD 11/04/2013 Credit Suisse (660) 65 969560 000 0.315% S&P GSCI Soybean Index ER USD 11/04/2013 Credit Suisse (12 063) 1 206 340380 000 0.315% S&P GSCI Sugar Official Close
Index USD 11/04/2013 Credit Suisse (13 520) 1 351 964250 000 0.315% S&P GSCI Sugar Official Close
Index USD 11/04/2013 Credit Suisse (15 689) 1 568 851170 000 0.315% S&P GSCI Wheat Official Close
Index ER USD 11/04/2013 Credit Suisse (11 156) 1 115 647150 000 0.353% S&P GSCI Cocoa Index ER USD 11/04/2013 Credit Suisse 5 061 506 079280 000 0.353% S&P GSCI Cocoa Index ER USD 11/04/2013 Credit Suisse 2 320 232 037120 000 0.410% S&P GSCI Corn ER Index USD 11/04/2013 Credit Suisse (3 950) 395 006260 000 0.410% S&P GSCI Corn ER Index USD 11/04/2013 Credit Suisse (14 749) 1 474 889100 000 0.420% S&P GSCI Soybeans Index ER USD 11/04/2013 Credit Suisse (2 046) 204 628250 000 0.420% S&P GSCI Soybeans Index ER USD 11/04/2013 Credit Suisse (2 239) 223 918380 000 S&P GSCI Aluminum Official Close
Index ER 0.190% USD 11/04/2013 Credit Suisse 13 496 1 349 547360 000 S&P GSCI Coffee "C" Arabica index 0.430% USD 11/04/2013 Credit Suisse (1 228) 122 804240 000 S&P GSCI Coffee Official Close Index 0.338% USD 11/04/2013 Credit Suisse (7 323) 732 273260 000 S&P GSCI Coffee Official Close Index 0.338% USD 11/04/2013 Credit Suisse 4 621 462 089470 000 S&P GSCI Copper Official Close Index ER 0.180% USD 11/04/2013 Credit Suisse (537) 53 658
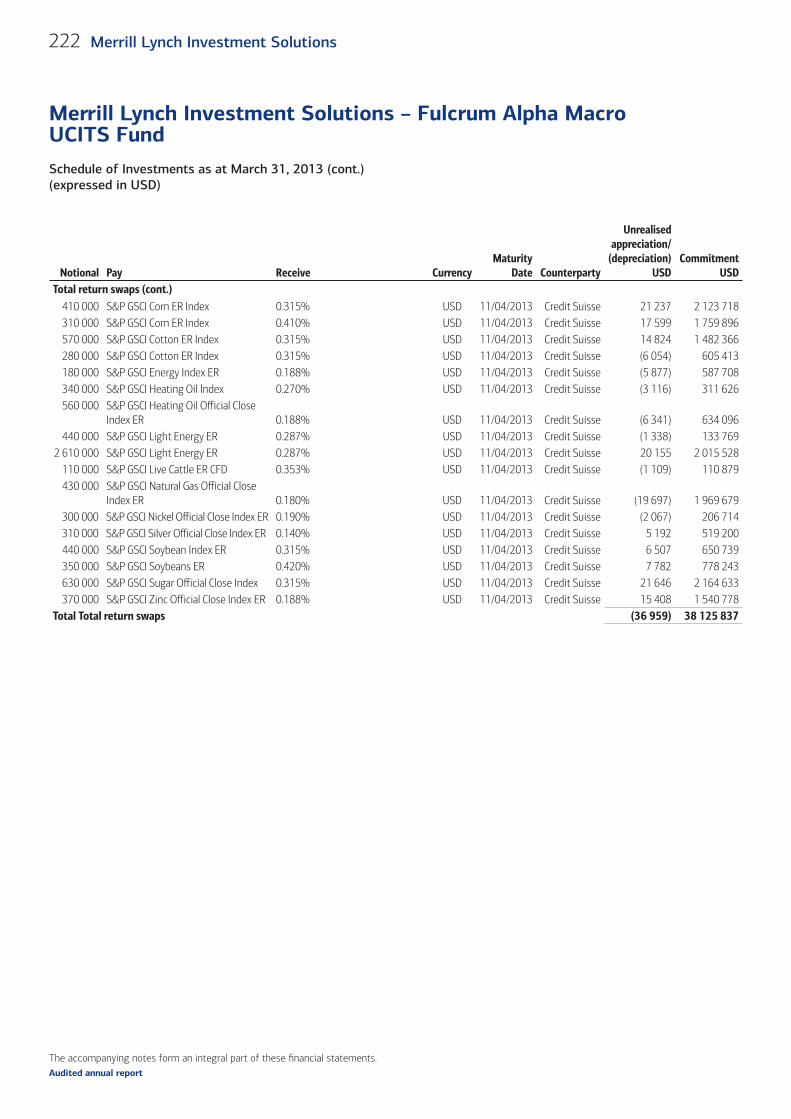
The accompanying notes form an integral part of these fi nancial statements.
Schedule of Investments as at March 31, 2013 (cont.)(expressed in USD)
Merrill Lynch Investment Solutions – Fulcrum Alpha Macro UCITS Fund
222 Merrill Lynch Investment Solutions
Audited annual report
Notional Pay Receive CurrencyMaturity
Date Counterparty
Unrealisedappreciation/
(depreciation)USD
CommitmentUSD
Total return swaps (cont.)410 000 S&P GSCI Corn ER Index 0.315% USD 11/04/2013 Credit Suisse 21 237 2 123 718310 000 S&P GSCI Corn ER Index 0.410% USD 11/04/2013 Credit Suisse 17 599 1 759 896570 000 S&P GSCI Cotton ER Index 0.315% USD 11/04/2013 Credit Suisse 14 824 1 482 366280 000 S&P GSCI Cotton ER Index 0.315% USD 11/04/2013 Credit Suisse (6 054) 605 413180 000 S&P GSCI Energy Index ER 0.188% USD 11/04/2013 Credit Suisse (5 877) 587 708340 000 S&P GSCI Heating Oil Index 0.270% USD 11/04/2013 Credit Suisse (3 116) 311 626560 000 S&P GSCI Heating Oil Official Close
Index ER 0.188% USD 11/04/2013 Credit Suisse (6 341) 634 096440 000 S&P GSCI Light Energy ER 0.287% USD 11/04/2013 Credit Suisse (1 338) 133 769
2 610 000 S&P GSCI Light Energy ER 0.287% USD 11/04/2013 Credit Suisse 20 155 2 015 528110 000 S&P GSCI Live Cattle ER CFD 0.353% USD 11/04/2013 Credit Suisse (1 109) 110 879430 000 S&P GSCI Natural Gas Official Close
Index ER 0.180% USD 11/04/2013 Credit Suisse (19 697) 1 969 679300 000 S&P GSCI Nickel Official Close Index ER 0.190% USD 11/04/2013 Credit Suisse (2 067) 206 714310 000 S&P GSCI Silver Official Close Index ER 0.140% USD 11/04/2013 Credit Suisse 5 192 519 200440 000 S&P GSCI Soybean Index ER 0.315% USD 11/04/2013 Credit Suisse 6 507 650 739350 000 S&P GSCI Soybeans ER 0.420% USD 11/04/2013 Credit Suisse 7 782 778 243630 000 S&P GSCI Sugar Official Close Index 0.315% USD 11/04/2013 Credit Suisse 21 646 2 164 633370 000 S&P GSCI Zinc Official Close Index ER 0.188% USD 11/04/2013 Credit Suisse 15 408 1 540 778
Total Total return swaps (36 959) 38 125 837
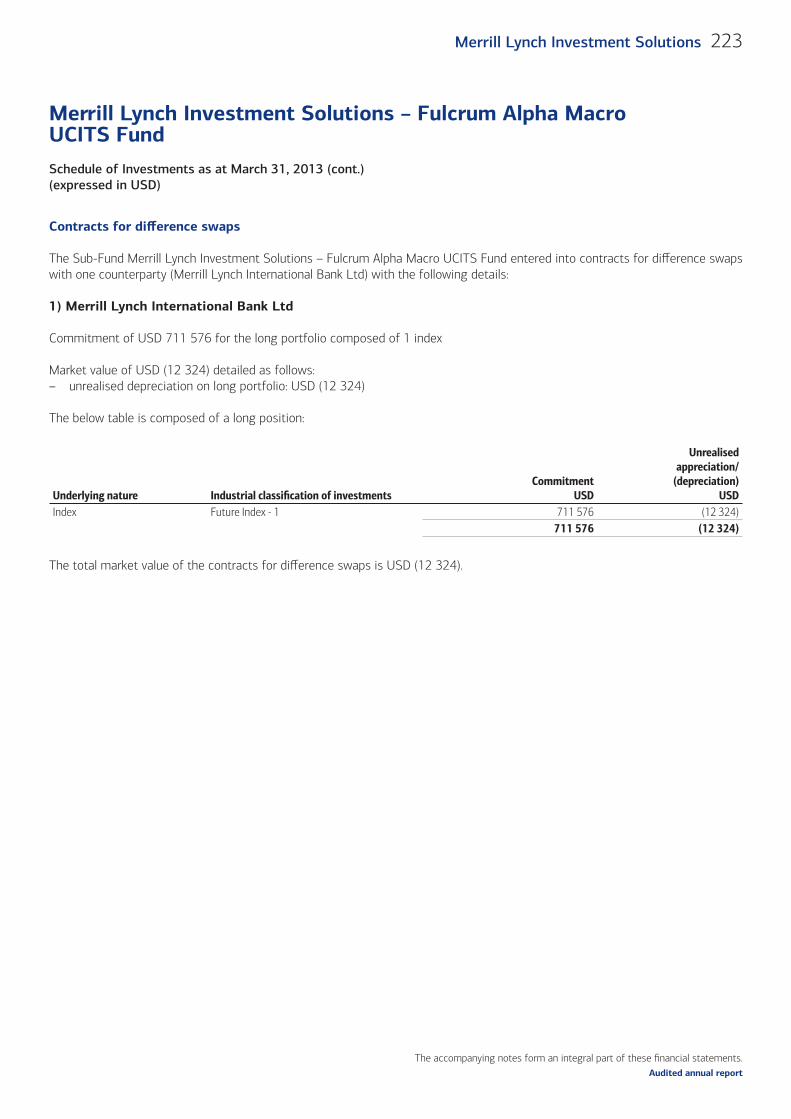
The accompanying notes form an integral part of these fi nancial statements.
Schedule of Investments as at March 31, 2013 (cont.)(expressed in USD)
Merrill Lynch Investment Solutions – Fulcrum Alpha Macro UCITS Fund
223Merrill Lynch Investment Solutions
Audited annual report
Contracts for diff erence swaps
The Sub-Fund Merrill Lynch Investment Solutions – Fulcrum Alpha Macro UCITS Fund entered into contracts for diff erence swaps with one counterparty (Merrill Lynch International Bank Ltd) with the following details:
1) Merrill Lynch International Bank Ltd
Commitment of USD 711 576 for the long portfolio composed of 1 index
Market value of USD (12 324) detailed as follows:– unrealised depreciation on long portfolio: USD (12 324)
The below table is composed of a long position:
Underlying nature Industrial classifi cation of investments Commitment
USD
Unrealised appreciation/
(depreciation)USD
Index Future Index - 1 711 576 (12 324)711 576 (12 324)
The total market value of the contracts for diff erence swaps is USD (12 324).
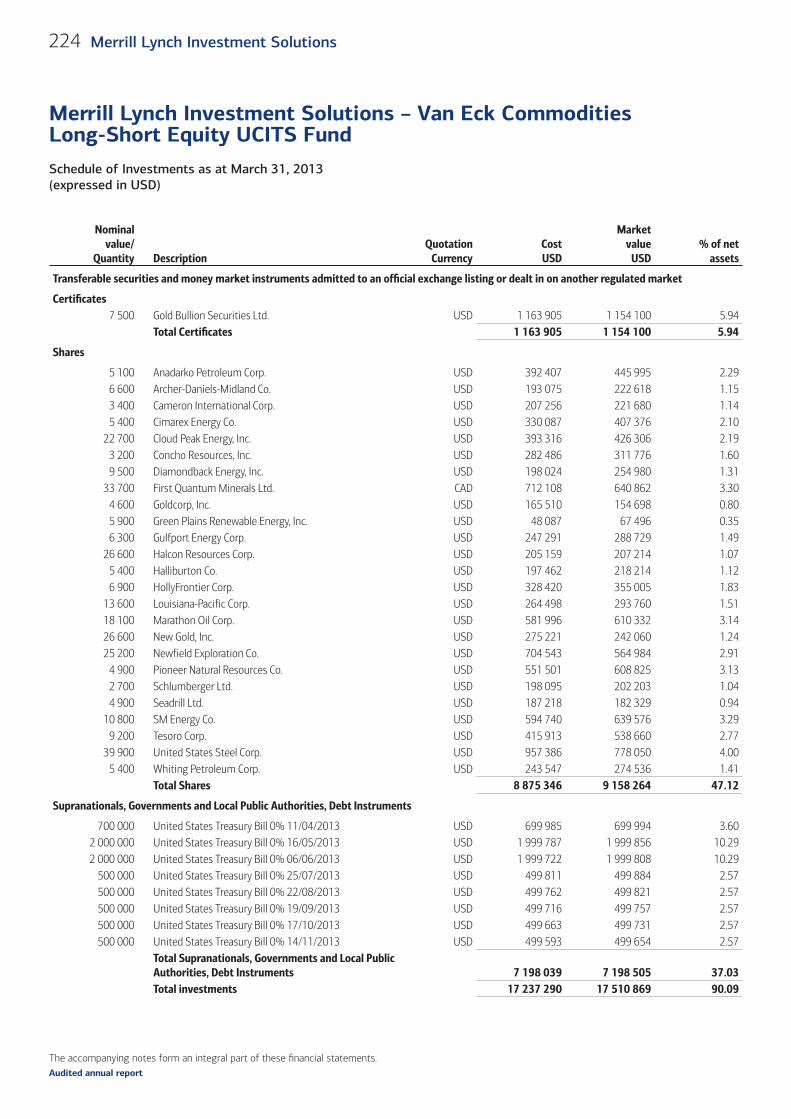
The accompanying notes form an integral part of these fi nancial statements.
Schedule of Investments as at March 31, 2013 (expressed in USD)
Merrill Lynch Investment Solutions – Van Eck Commodities Long-Short Equity UCITS Fund
224 Merrill Lynch Investment Solutions
Audited annual report
Nominalvalue/
Quantity DescriptionQuotation
CurrencyCostUSD
Marketvalue
USD% of net
assets
Transferable securities and money market instruments admitted to an offi cial exchange listing or dealt in on another regulated market
Certifi cates7 500 Gold Bullion Securities Ltd. USD 1 163 905 1 154 100 5.94
Total Certifi cates 1 163 905 1 154 100 5.94
Shares
5 100 Anadarko Petroleum Corp. USD 392 407 445 995 2.296 600 Archer-Daniels-Midland Co. USD 193 075 222 618 1.153 400 Cameron International Corp. USD 207 256 221 680 1.145 400 Cimarex Energy Co. USD 330 087 407 376 2.10
22 700 Cloud Peak Energy, Inc. USD 393 316 426 306 2.193 200 Concho Resources, Inc. USD 282 486 311 776 1.609 500 Diamondback Energy, Inc. USD 198 024 254 980 1.31
33 700 First Quantum Minerals Ltd. CAD 712 108 640 862 3.304 600 Goldcorp, Inc. USD 165 510 154 698 0.805 900 Green Plains Renewable Energy, Inc. USD 48 087 67 496 0.356 300 Gulfport Energy Corp. USD 247 291 288 729 1.49
26 600 Halcon Resources Corp. USD 205 159 207 214 1.075 400 Halliburton Co. USD 197 462 218 214 1.126 900 HollyFrontier Corp. USD 328 420 355 005 1.83
13 600 Louisiana-Pacific Corp. USD 264 498 293 760 1.5118 100 Marathon Oil Corp. USD 581 996 610 332 3.1426 600 New Gold, Inc. USD 275 221 242 060 1.2425 200 Newfield Exploration Co. USD 704 543 564 984 2.91
4 900 Pioneer Natural Resources Co. USD 551 501 608 825 3.132 700 Schlumberger Ltd. USD 198 095 202 203 1.044 900 Seadrill Ltd. USD 187 218 182 329 0.94
10 800 SM Energy Co. USD 594 740 639 576 3.299 200 Tesoro Corp. USD 415 913 538 660 2.77
39 900 United States Steel Corp. USD 957 386 778 050 4.005 400 Whiting Petroleum Corp. USD 243 547 274 536 1.41
Total Shares 8 875 346 9 158 264 47.12
Supranationals, Governments and Local Public Authorities, Debt Instruments
700 000 United States Treasury Bill 0% 11/04/2013 USD 699 985 699 994 3.602 000 000 United States Treasury Bill 0% 16/05/2013 USD 1 999 787 1 999 856 10.292 000 000 United States Treasury Bill 0% 06/06/2013 USD 1 999 722 1 999 808 10.29
500 000 United States Treasury Bill 0% 25/07/2013 USD 499 811 499 884 2.57500 000 United States Treasury Bill 0% 22/08/2013 USD 499 762 499 821 2.57500 000 United States Treasury Bill 0% 19/09/2013 USD 499 716 499 757 2.57500 000 United States Treasury Bill 0% 17/10/2013 USD 499 663 499 731 2.57500 000 United States Treasury Bill 0% 14/11/2013 USD 499 593 499 654 2.57
Total Supranationals, Governments and Local Public Authorities, Debt Instruments 7 198 039 7 198 505 37.03Total investments 17 237 290 17 510 869 90.09
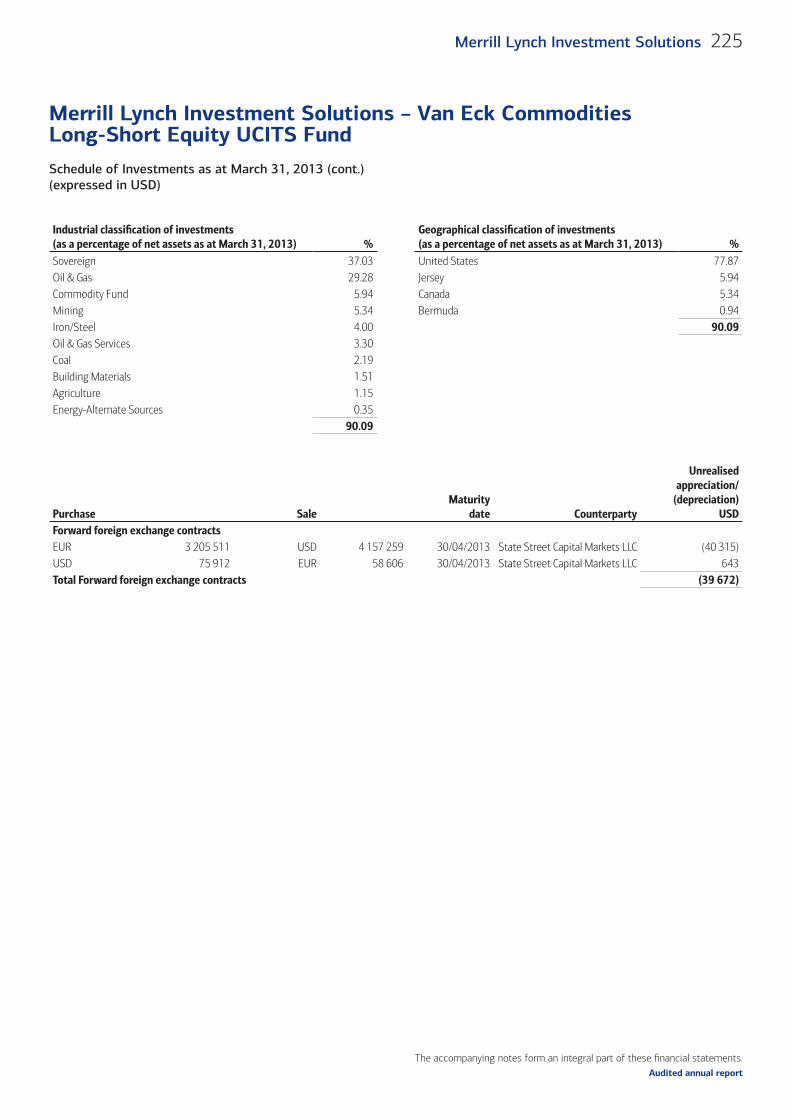
The accompanying notes form an integral part of these fi nancial statements.
Schedule of Investments as at March 31, 2013 (cont.)(expressed in USD)
Merrill Lynch Investment Solutions – Van Eck Commodities Long-Short Equity UCITS Fund
225Merrill Lynch Investment Solutions
Audited annual report
Industrial classifi cation of investments (as a percentage of net assets as at March 31, 2013) %
Geographical classifi cation of investments (as a percentage of net assets as at March 31, 2013) %
Sovereign 37.03 United States 77.87Oil & Gas 29.28 Jersey 5.94Commodity Fund 5.94 Canada 5.34Mining 5.34 Bermuda 0.94Iron/Steel 4.00 90.09Oil & Gas Services 3.30Coal 2.19Building Materials 1.51Agriculture 1.15Energy-Alternate Sources 0.35
90.09
Purchase SaleMaturity
date Counterparty
Unrealisedappreciation/
(depreciation)USD
Forward foreign exchange contractsEUR 3 205 511 USD 4 157 259 30/04/2013 State Street Capital Markets LLC (40 315)USD 75 912 EUR 58 606 30/04/2013 State Street Capital Markets LLC 643Total Forward foreign exchange contracts (39 672)
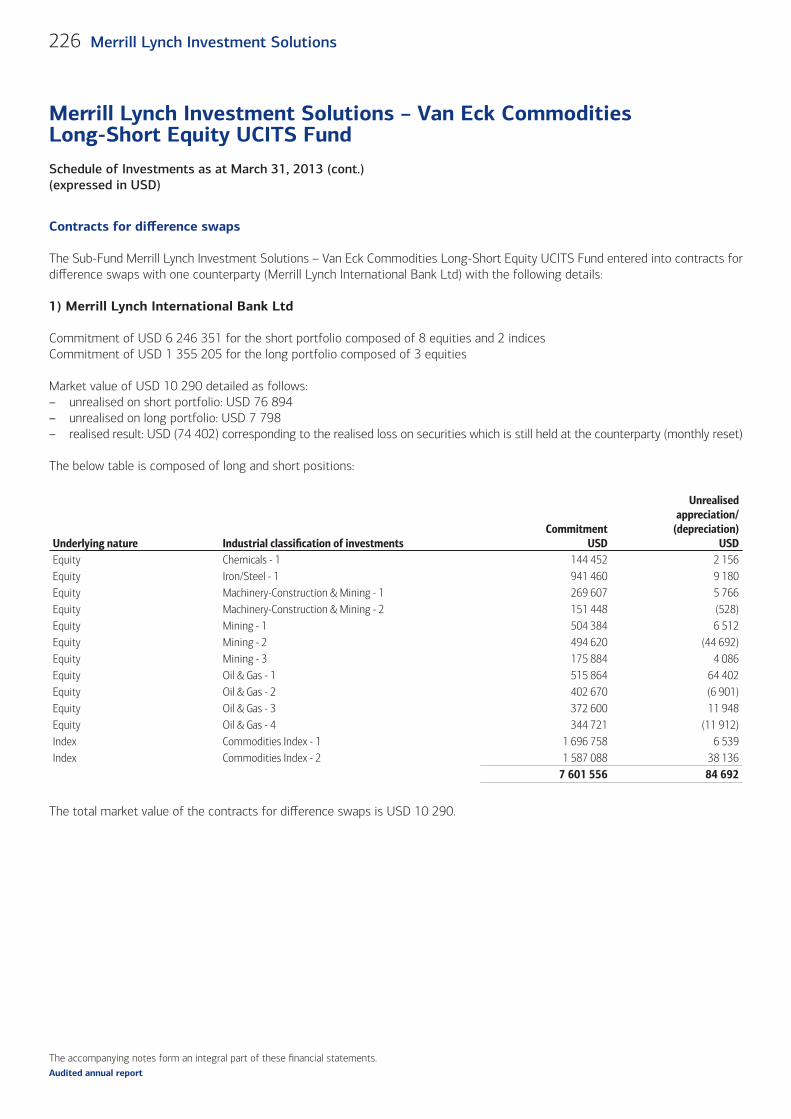
The accompanying notes form an integral part of these fi nancial statements.
Schedule of Investments as at March 31, 2013 (cont.)(expressed in USD)
Merrill Lynch Investment Solutions – Van Eck Commodities Long-Short Equity UCITS Fund
226 Merrill Lynch Investment Solutions
Audited annual report
Contracts for diff erence swaps
The Sub-Fund Merrill Lynch Investment Solutions – Van Eck Commodities Long-Short Equity UCITS Fund entered into contracts for diff erence swaps with one counterparty (Merrill Lynch International Bank Ltd) with the following details:
1) Merrill Lynch International Bank Ltd
Commitment of USD 6 246 351 for the short portfolio composed of 8 equities and 2 indicesCommitment of USD 1 355 205 for the long portfolio composed of 3 equities
Market value of USD 10 290 detailed as follows:– unrealised on short portfolio: USD 76 894– unrealised on long portfolio: USD 7 798– realised result: USD (74 402) corresponding to the realised loss on securities which is still held at the counterparty (monthly reset)
The below table is composed of long and short positions:
Underlying nature Industrial classifi cation of investments Commitment
USD
Unrealised appreciation/
(depreciation)USD
Equity Chemicals - 1 144 452 2 156Equity Iron/Steel - 1 941 460 9 180Equity Machinery-Construction & Mining - 1 269 607 5 766Equity Machinery-Construction & Mining - 2 151 448 (528)Equity Mining - 1 504 384 6 512Equity Mining - 2 494 620 (44 692)Equity Mining - 3 175 884 4 086Equity Oil & Gas - 1 515 864 64 402Equity Oil & Gas - 2 402 670 (6 901)Equity Oil & Gas - 3 372 600 11 948Equity Oil & Gas - 4 344 721 (11 912)Index Commodities Index - 1 1 696 758 6 539Index Commodities Index - 2 1 587 088 38 136
7 601 556 84 692
The total market value of the contracts for diff erence swaps is USD 10 290.
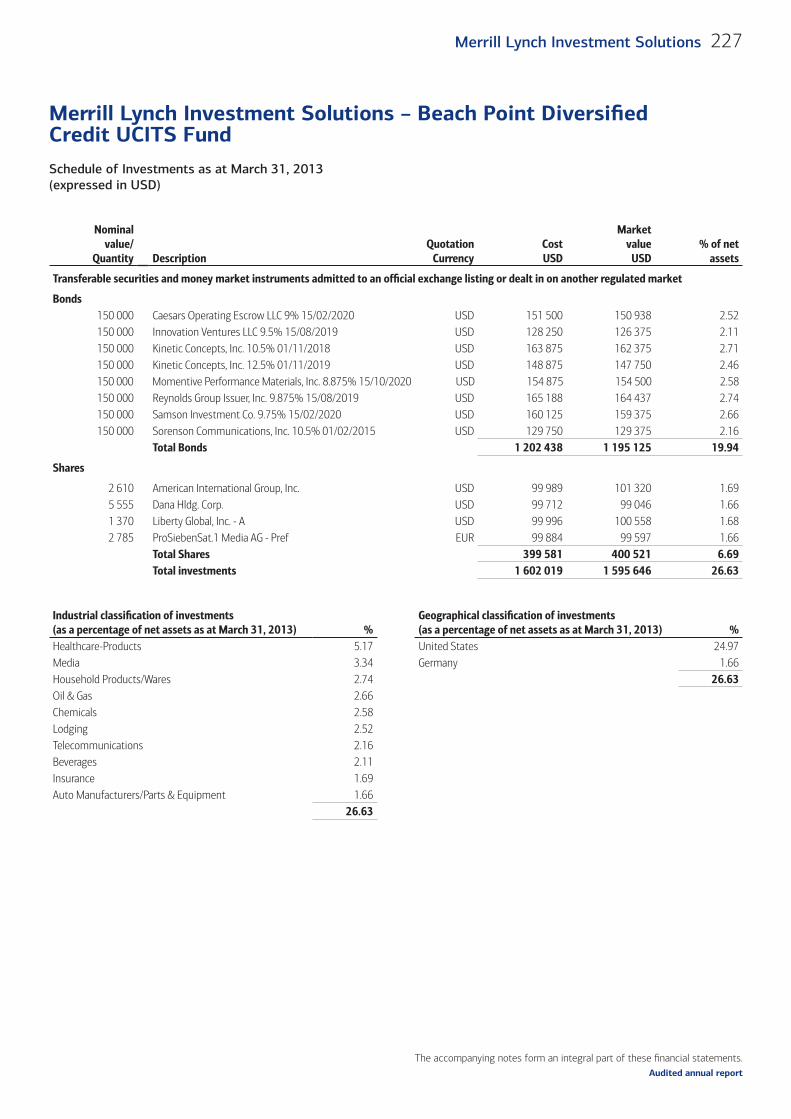
The accompanying notes form an integral part of these fi nancial statements.
Schedule of Investments as at March 31, 2013 (expressed in USD)
Merrill Lynch Investment Solutions – Beach Point Diversifi ed Credit UCITS Fund
227Merrill Lynch Investment Solutions
Audited annual report
Nominalvalue/
Quantity DescriptionQuotation
CurrencyCostUSD
Marketvalue
USD% of net
assets
Transferable securities and money market instruments admitted to an offi cial exchange listing or dealt in on another regulated market
Bonds150 000 Caesars Operating Escrow LLC 9% 15/02/2020 USD 151 500 150 938 2.52150 000 Innovation Ventures LLC 9.5% 15/08/2019 USD 128 250 126 375 2.11150 000 Kinetic Concepts, Inc. 10.5% 01/11/2018 USD 163 875 162 375 2.71150 000 Kinetic Concepts, Inc. 12.5% 01/11/2019 USD 148 875 147 750 2.46150 000 Momentive Performance Materials, Inc. 8.875% 15/10/2020 USD 154 875 154 500 2.58150 000 Reynolds Group Issuer, Inc. 9.875% 15/08/2019 USD 165 188 164 437 2.74150 000 Samson Investment Co. 9.75% 15/02/2020 USD 160 125 159 375 2.66150 000 Sorenson Communications, Inc. 10.5% 01/02/2015 USD 129 750 129 375 2.16
Total Bonds 1 202 438 1 195 125 19.94
Shares
2 610 American International Group, Inc. USD 99 989 101 320 1.695 555 Dana Hldg. Corp. USD 99 712 99 046 1.661 370 Liberty Global, Inc. - A USD 99 996 100 558 1.682 785 ProSiebenSat.1 Media AG - Pref EUR 99 884 99 597 1.66
Total Shares 399 581 400 521 6.69Total investments 1 602 019 1 595 646 26.63
Industrial classifi cation of investments(as a percentage of net assets as at March 31, 2013) %
Geographical classifi cation of investments(as a percentage of net assets as at March 31, 2013) %
Healthcare-Products 5.17 United States 24.97Media 3.34 Germany 1.66Household Products/Wares 2.74 26.63 Oil & Gas 2.66Chemicals 2.58Lodging 2.52Telecommunications 2.16Beverages 2.11Insurance 1.69Auto Manufacturers/Parts & Equipment 1.66
26.63

228 Merrill Lynch Investment Solutions
Audited annual report
Notes to the fi nancial statementsas at March 31, 2013Note 1 – Activity
Merrill Lynch Investment Solutions (the “SICAV”) has been incorporated on November 5, 2007 under Luxembourg laws as a “Société d’Investissement à Capital Variable” (SICAV) for an unlimited period of time. The SICAV is governed by the provisions of Part I and it fulfi ls the provisions of Article 27, of the Luxembourg Law of December 17, 2010 relating to undertakings for collective investment, as may be amended from time to time.
The Articles of Incorporation created on November 5, 2007 and amended on December 22, 2011 are deposited with the Register of Commerce and Companies of Luxembourg and have been published in the Memorial C, “Recueil des Sociétés et Associations” (the “Memorial”) on November 30, 2007. The SICAV is registered with the Register of Commerce and Companies of Luxembourg under the number B 133.445.
As at March 31, 2013, fi � een Sub-Funds are available to investors:
Sub-Funds Launch DateMerrill Lynch Investment Solutions – Marshall Wace TOPS UCITS Fund (Market Neutral) November 23, 2007Merrill Lynch Investment Solutions – York Event-Driven UCITS Fund July 29, 2009Merrill Lynch Investment Solutions – CCI Healthcare Long-Short UCITS Fund January 29, 2010Merrill Lynch Investment Solutions – Zweig-DiMenna US Long-Short Equity UCITS Fund October 29, 2010Merrill Lynch Investment Solutions – Theorema European Equity Long-Short UCITS Fund June 16, 2010Merrill Lynch Investment Solutions – York Asian Event-Driven UCITS Fund November 3, 2010Merrill Lynch Investment Solutions – Graham Capital Systematic Macro UCITS Fund November 15, 2010Merrill Lynch Investment Solutions – AQR Global Relative Value UCITS Fund December 1, 2010Merrill Lynch Investment Solutions – Och-Ziff European Multi-Strategy UCITS Fund February 22, 2011Merrill Lynch Investment Solutions – Westchester Merger Arbitrage UCITS Fund June 24, 2011Merrill Lynch Investment Solutions – QFS Currency UCITS Fund November 23, 2011Merrill Lynch Investment Solutions – TRG Emerging Markets Opportunity UCITS Fund December 16, 2011Merrill Lynch Investment Solutions – Fulcrum Alpha Macro UCITS Fund June 15, 2012Merrill Lynch Investment Solutions – Van Eck Commodities Long-Short Equity UCITS Fund December 19, 2012Merrill Lynch Investment Solutions – Beach Point Diversified Credit UCITS Fund March 25, 2013
Merrill Lynch Investment Solutions – GLG European Opportunity UCITS Fund was liquidated on May 21, 2012 and Merrill Lynch Investment Solutions – TT Financials UCITS Fund was liquidated on July 31, 2012.
On October 30, 2012 Merrill Lynch Investment Solutions – TRG Global Emerging Markets UCITS Fund changed its name to Merrill Lynch Investment Solutions – TRG Emerging Markets Opportunity UCITS Fund.
As at March 31, 2013, the following Classes of Shares have been issued:
Sub-Funds Classes of SharesMerrill Lynch Investment Solutions – Marshall Wace TOPS UCITS Fund (Market Neutral)
EUR A (acc), EUR A (inc), EUR B (acc), EUR C (acc), EUR G (acc), GBP A (inc), GBP B (acc), GBP B (inc), GBP C (acc), GBP C (inc), GBP G (acc), GBP Management (inc), USD A (acc), USD B (acc), USD C (acc), USD G (acc)
Merrill Lynch Investment Solutions – York Event-Driven UCITS Fund
CHF F (acc), EUR A (acc), EUR B (acc), EUR C (acc), EUR D (acc), EUR E (acc), EUR F (acc), EUR Z (acc), GBP A (acc), GBP A (inc), GBP B (acc), GBP B (inc), GBP C (inc), GBP D (acc), GBP E (acc), GBP F (acc), GBP Z (acc), USD A (acc), USD B (acc), USD C (acc),USD D (acc), USD E (acc), USD F (acc)
Merrill Lynch Investment Solutions – CCI Healthcare Long-Short UCITS Fund
EUR B (acc), EUR C (acc), EUR D (acc), EUR Z (acc), GBP B (acc), GBP B (inc), GBP C (acc), GBP C (inc), GBP Z (acc), USD B (acc), USD C (acc), USD D (acc)
Merrill Lynch Investment Solutions – Zweig-DiMenna US long-Short Equity UCITS Fund EUR B (acc), EUR D (acc), GBP C (acc), USD Management (acc)
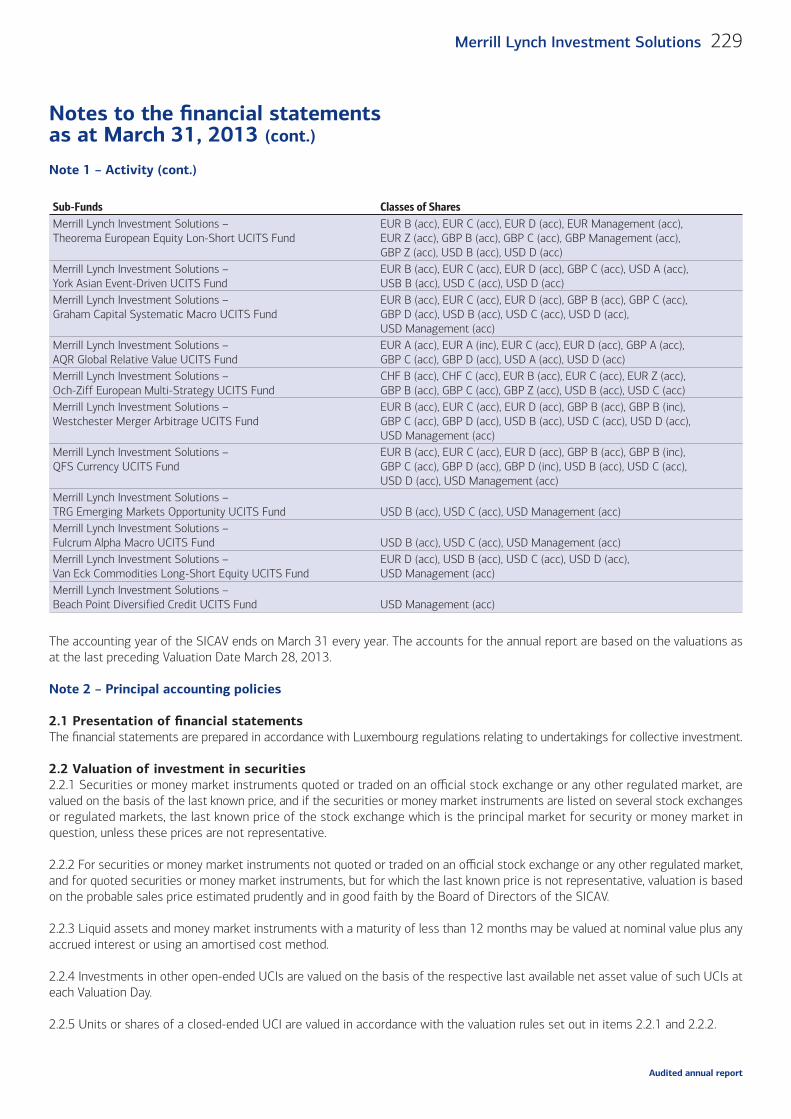
Notes to the fi nancial statementsas at March 31, 2013 (cont.)
229Merrill Lynch Investment Solutions
Audited annual report
Sub-Funds Classes of SharesMerrill Lynch Investment Solutions – Theorema European Equity Lon-Short UCITS Fund
EUR B (acc), EUR C (acc), EUR D (acc), EUR Management (acc), EUR Z (acc), GBP B (acc), GBP C (acc), GBP Management (acc), GBP Z (acc), USD B (acc), USD D (acc)
Merrill Lynch Investment Solutions – York Asian Event-Driven UCITS Fund
EUR B (acc), EUR C (acc), EUR D (acc), GBP C (acc), USD A (acc), USB B (acc), USD C (acc), USD D (acc)
Merrill Lynch Investment Solutions – Graham Capital Systematic Macro UCITS Fund
EUR B (acc), EUR C (acc), EUR D (acc), GBP B (acc), GBP C (acc), GBP D (acc), USD B (acc), USD C (acc), USD D (acc), USD Management (acc)
Merrill Lynch Investment Solutions – AQR Global Relative Value UCITS Fund
EUR A (acc), EUR A (inc), EUR C (acc), EUR D (acc), GBP A (acc), GBP C (acc), GBP D (acc), USD A (acc), USD D (acc)
Merrill Lynch Investment Solutions – Och-Ziff European Multi-Strategy UCITS Fund
CHF B (acc), CHF C (acc), EUR B (acc), EUR C (acc), EUR Z (acc), GBP B (acc), GBP C (acc), GBP Z (acc), USD B (acc), USD C (acc)
Merrill Lynch Investment Solutions – Westchester Merger Arbitrage UCITS Fund
EUR B (acc), EUR C (acc), EUR D (acc), GBP B (acc), GBP B (inc), GBP C (acc), GBP D (acc), USD B (acc), USD C (acc), USD D (acc), USD Management (acc)
Merrill Lynch Investment Solutions – QFS Currency UCITS Fund
EUR B (acc), EUR C (acc), EUR D (acc), GBP B (acc), GBP B (inc), GBP C (acc), GBP D (acc), GBP D (inc), USD B (acc), USD C (acc), USD D (acc), USD Management (acc)
Merrill Lynch Investment Solutions – TRG Emerging Markets Opportunity UCITS Fund USD B (acc), USD C (acc), USD Management (acc)Merrill Lynch Investment Solutions – Fulcrum Alpha Macro UCITS Fund USD B (acc), USD C (acc), USD Management (acc)Merrill Lynch Investment Solutions – Van Eck Commodities Long-Short Equity UCITS Fund
EUR D (acc), USD B (acc), USD C (acc), USD D (acc), USD Management (acc)
Merrill Lynch Investment Solutions – Beach Point Diversified Credit UCITS Fund USD Management (acc)
The accounting year of the SICAV ends on March 31 every year. The accounts for the annual report are based on the valuations as at the last preceding Valuation Date March 28, 2013.
Note 2 – Principal accounting policies
2.1 Presentation of fi nancial statementsThe fi nancial statements are prepared in accordance with Luxembourg regulations relating to undertakings for collective investment.
2.2 Valuation of investment in securities2.2.1 Securities or money market instruments quoted or traded on an offi cial stock exchange or any other regulated market, are valued on the basis of the last known price, and if the securities or money market instruments are listed on several stock exchanges or regulated markets, the last known price of the stock exchange which is the principal market for security or money market in question, unless these prices are not representative.
2.2.2 For securities or money market instruments not quoted or traded on an offi cial stock exchange or any other regulated market, and for quoted securities or money market instruments, but for which the last known price is not representative, valuation is based on the probable sales price estimated prudently and in good faith by the Board of Directors of the SICAV.
2.2.3 Liquid assets and money market instruments with a maturity of less than 12 months may be valued at nominal value plus any accrued interest or using an amortised cost method.
2.2.4 Investments in other open-ended UCIs are valued on the basis of the respective last available net asset value of such UCIs at each Valuation Day.
2.2.5 Units or shares of a closed-ended UCI are valued in accordance with the valuation rules set out in items 2.2.1 and 2.2.2.
Note 1 – Activity (cont.)
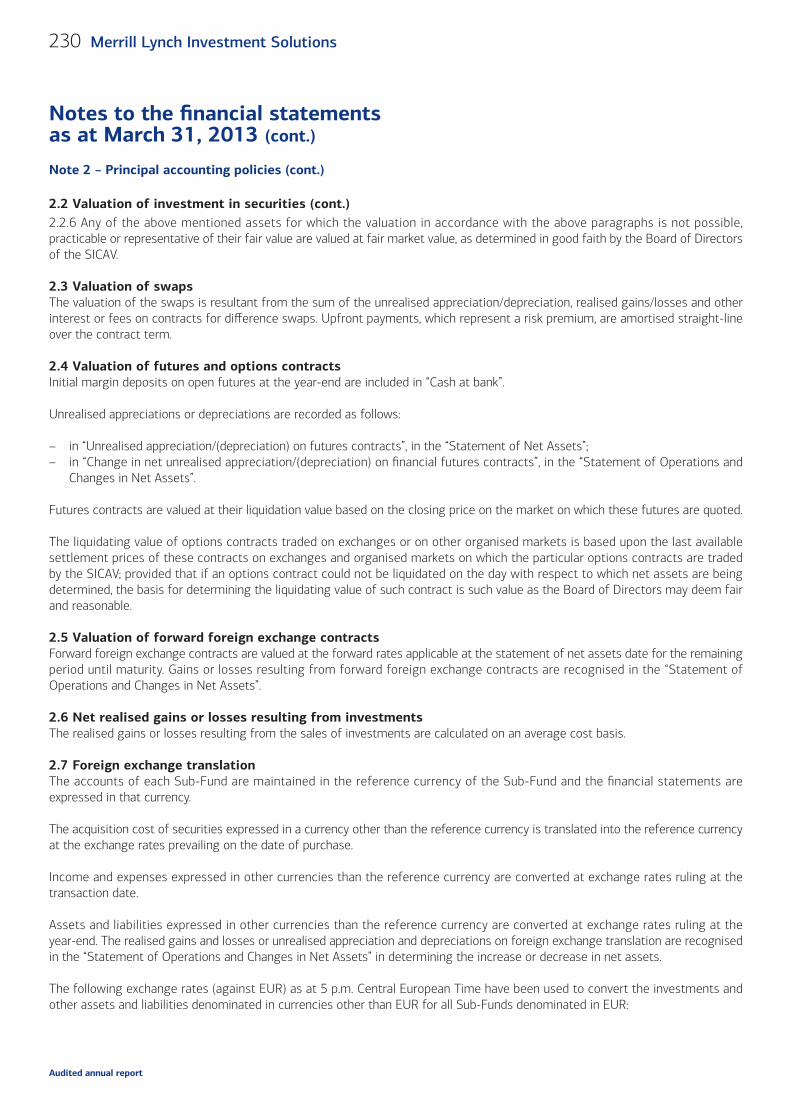
Notes to the fi nancial statementsas at March 31, 2013 (cont.)
230 Merrill Lynch Investment Solutions
Audited annual report
2.2.6 Any of the above mentioned assets for which the valuation in accordance with the above paragraphs is not possible, practicable or representative of their fair value are valued at fair market value, as determined in good faith by the Board of Directors of the SICAV.
2.3 Valuation of swapsThe valuation of the swaps is resultant from the sum of the unrealised appreciation/depreciation, realised gains/losses and other interest or fees on contracts for diff erence swaps. Upfront payments, which represent a risk premium, are amortised straight-line over the contract term.
2.4 Valuation of futures and options contractsInitial margin deposits on open futures at the year-end are included in “Cash at bank”.
Unrealised appreciations or depreciations are recorded as follows:
– in “Unrealised appreciation/(depreciation) on futures contracts”, in the “Statement of Net Assets”;– in “Change in net unrealised appreciation/(depreciation) on fi nancial futures contracts”, in the “Statement of Operations and
Changes in Net Assets”.
Futures contracts are valued at their liquidation value based on the closing price on the market on which these futures are quoted.
The liquidating value of options contracts traded on exchanges or on other organised markets is based upon the last available settlement prices of these contracts on exchanges and organised markets on which the particular options contracts are traded by the SICAV; provided that if an options contract could not be liquidated on the day with respect to which net assets are being determined, the basis for determining the liquidating value of such contract is such value as the Board of Directors may deem fair and reasonable.
2.5 Valuation of forward foreign exchange contractsForward foreign exchange contracts are valued at the forward rates applicable at the statement of net assets date for the remaining period until maturity. Gains or losses resulting from forward foreign exchange contracts are recognised in the “Statement of Operations and Changes in Net Assets”.
2.6 Net realised gains or losses resulting from investmentsThe realised gains or losses resulting from the sales of investments are calculated on an average cost basis.
2.7 Foreign exchange translationThe accounts of each Sub-Fund are maintained in the reference currency of the Sub-Fund and the fi nancial statements are expressed in that currency.
The acquisition cost of securities expressed in a currency other than the reference currency is translated into the reference currency at the exchange rates prevailing on the date of purchase.
Income and expenses expressed in other currencies than the reference currency are converted at exchange rates ruling at the transaction date.
Assets and liabilities expressed in other currencies than the reference currency are converted at exchange rates ruling at the year-end. The realised gains and losses or unrealised appreciation and depreciations on foreign exchange translation are recognised in the “Statement of Operations and Changes in Net Assets” in determining the increase or decrease in net assets.
The following exchange rates (against EUR) as at 5 p.m. Central European Time have been used to convert the investments and other assets and liabilities denominated in currencies other than EUR for all Sub-Funds denominated in EUR:
Note 2 – Principal accounting policies (cont.)
2.2 Valuation of investment in securities (cont.)
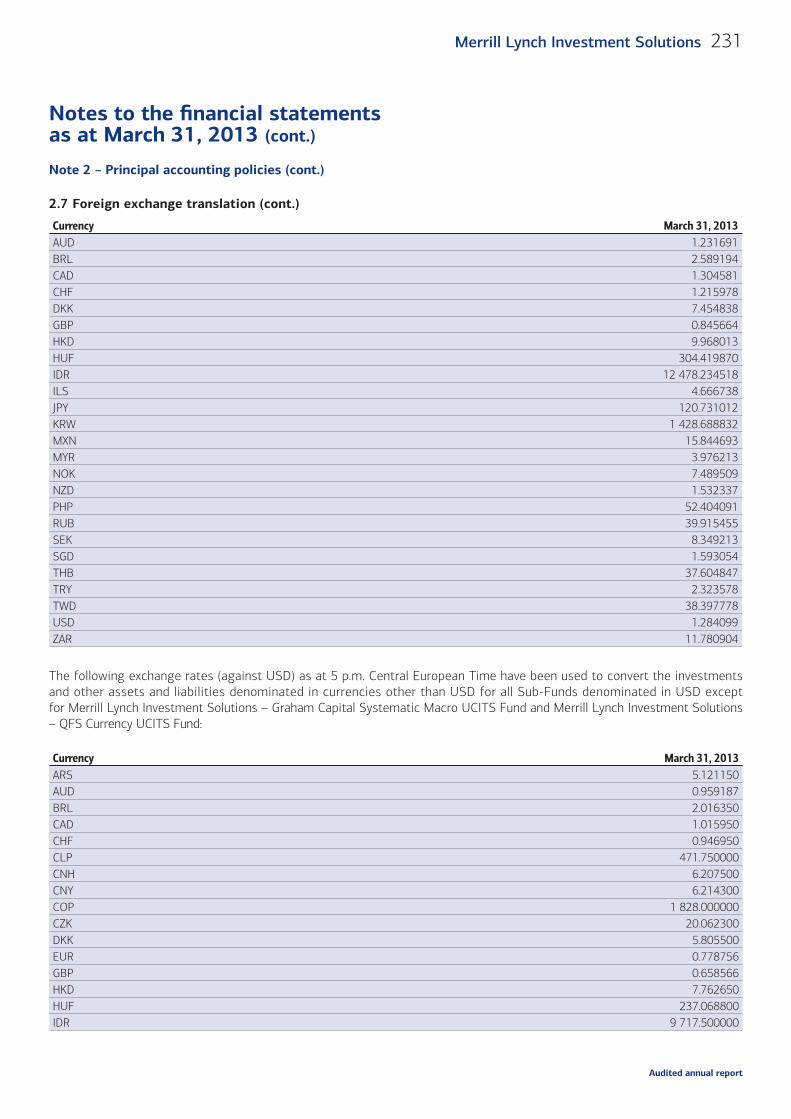
Notes to the fi nancial statementsas at March 31, 2013 (cont.)
231Merrill Lynch Investment Solutions
Audited annual report
Currency March 31, 2013AUD 1.231691BRL 2.589194CAD 1.304581CHF 1.215978DKK 7.454838GBP 0.845664HKD 9.968013HUF 304.419870IDR 12 478.234518ILS 4.666738JPY 120.731012KRW 1 428.688832MXN 15.844693MYR 3.976213NOK 7.489509NZD 1.532337PHP 52.404091RUB 39.915455SEK 8.349213SGD 1.593054THB 37.604847TRY 2.323578TWD 38.397778USD 1.284099ZAR 11.780904
The following exchange rates (against USD) as at 5 p.m. Central European Time have been used to convert the investments and other assets and liabilities denominated in currencies other than USD for all Sub-Funds denominated in USD except for Merrill Lynch Investment Solutions – Graham Capital Systematic Macro UCITS Fund and Merrill Lynch Investment Solutions – QFS Currency UCITS Fund:
Currency March 31, 2013ARS 5.121150AUD 0.959187BRL 2.016350CAD 1.015950CHF 0.946950CLP 471.750000CNH 6.207500CNY 6.214300COP 1 828.000000CZK 20.062300DKK 5.805500EUR 0.778756GBP 0.658566HKD 7.762650HUF 237.068800IDR 9 717.500000
Note 2 – Principal accounting policies (cont.)
2.7 Foreign exchange translation (cont.)
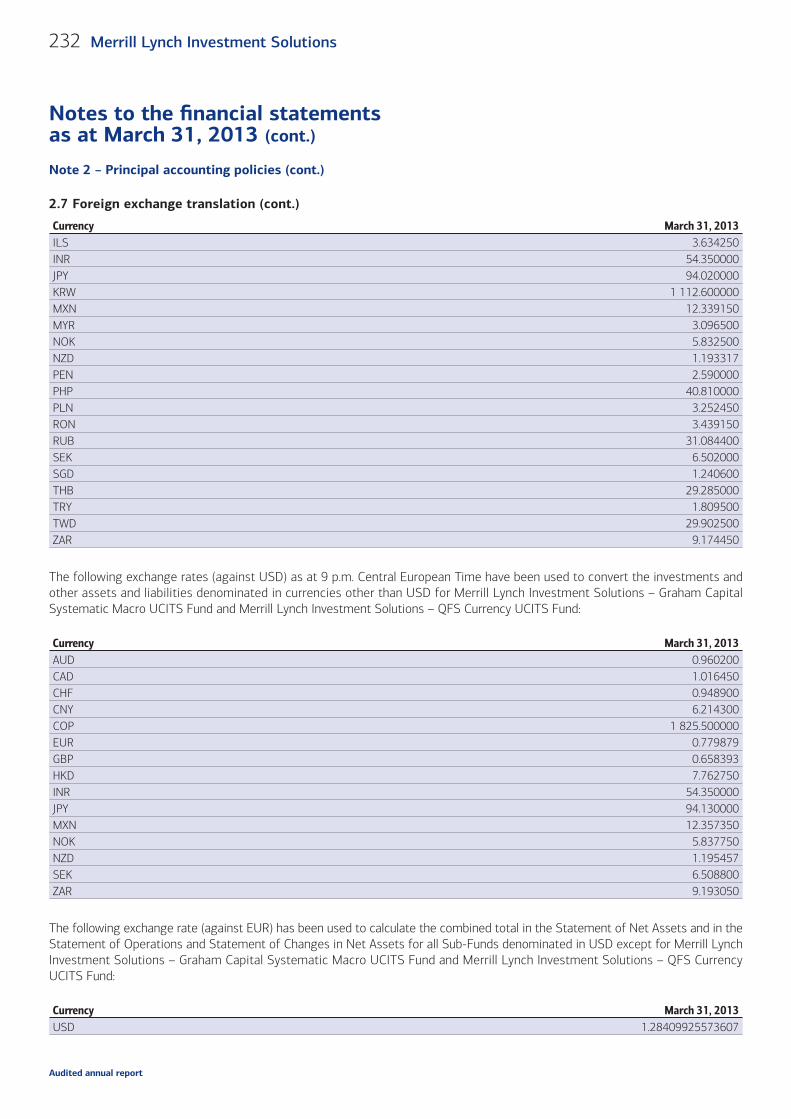
Notes to the fi nancial statementsas at March 31, 2013 (cont.)
232 Merrill Lynch Investment Solutions
Audited annual report
Currency March 31, 2013ILS 3.634250INR 54.350000JPY 94.020000KRW 1 112.600000MXN 12.339150MYR 3.096500NOK 5.832500NZD 1.193317PEN 2.590000PHP 40.810000PLN 3.252450RON 3.439150RUB 31.084400SEK 6.502000SGD 1.240600THB 29.285000TRY 1.809500TWD 29.902500ZAR 9.174450
The following exchange rates (against USD) as at 9 p.m. Central European Time have been used to convert the investments and other assets and liabilities denominated in currencies other than USD for Merrill Lynch Investment Solutions – Graham Capital Systematic Macro UCITS Fund and Merrill Lynch Investment Solutions – QFS Currency UCITS Fund:
Currency March 31, 2013AUD 0.960200CAD 1.016450CHF 0.948900CNY 6.214300COP 1 825.500000EUR 0.779879GBP 0.658393HKD 7.762750INR 54.350000JPY 94.130000MXN 12.357350NOK 5.837750NZD 1.195457SEK 6.508800ZAR 9.193050
The following exchange rate (against EUR) has been used to calculate the combined total in the Statement of Net Assets and in the Statement of Operations and Statement of Changes in Net Assets for all Sub-Funds denominated in USD except for Merrill Lynch Investment Solutions – Graham Capital Systematic Macro UCITS Fund and Merrill Lynch Investment Solutions – QFS Currency UCITS Fund:
Currency March 31, 2013USD 1.28409925573607
Note 2 – Principal accounting policies (cont.)
2.7 Foreign exchange translation (cont.)
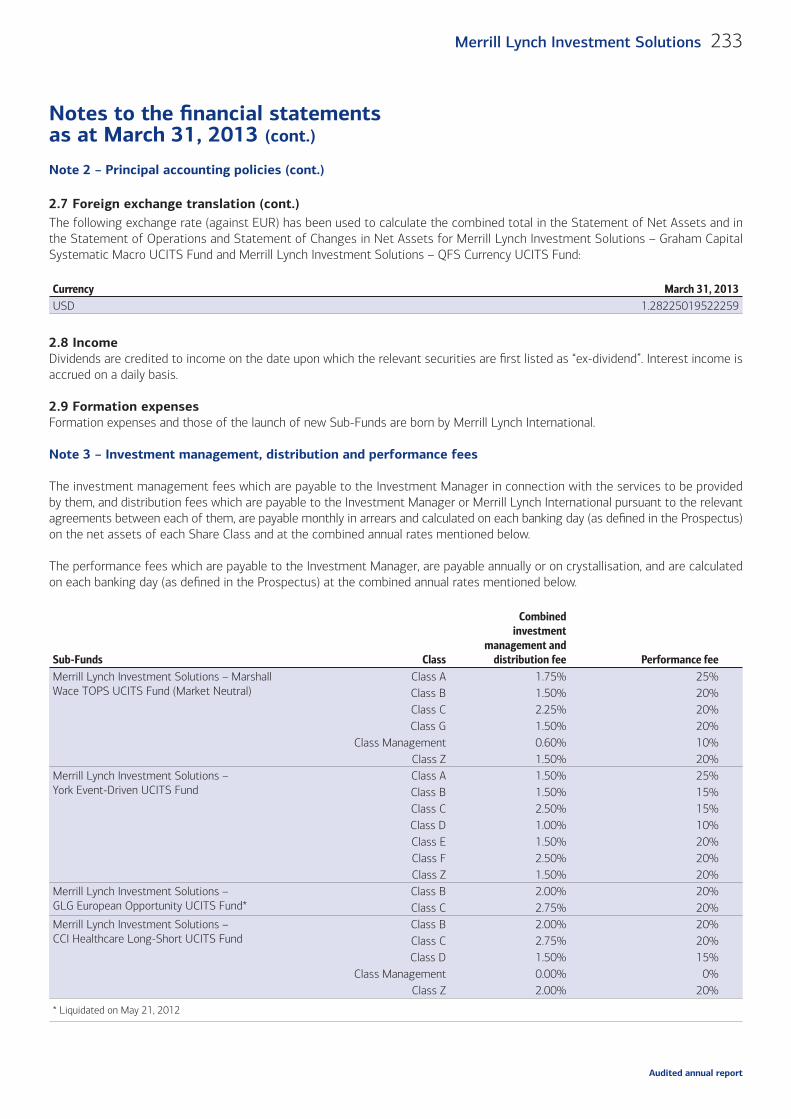
Notes to the fi nancial statementsas at March 31, 2013 (cont.)
233Merrill Lynch Investment Solutions
Audited annual report
Note 2 – Principal accounting policies (cont.)
The following exchange rate (against EUR) has been used to calculate the combined total in the Statement of Net Assets and in the Statement of Operations and Statement of Changes in Net Assets for Merrill Lynch Investment Solutions – Graham Capital Systematic Macro UCITS Fund and Merrill Lynch Investment Solutions – QFS Currency UCITS Fund:
Currency March 31, 2013USD 1.28225019522259
2.8 IncomeDividends are credited to income on the date upon which the relevant securities are fi rst listed as “ex-dividend”. Interest income is accrued on a daily basis.
2.9 Formation expensesFormation expenses and those of the launch of new Sub-Funds are born by Merrill Lynch International.
Note 3 – Investment management, distribution and performance fees
The investment management fees which are payable to the Investment Manager in connection with the services to be provided by them, and distribution fees which are payable to the Investment Manager or Merrill Lynch International pursuant to the relevant agreements between each of them, are payable monthly in arrears and calculated on each banking day (as defi ned in the Prospectus) on the net assets of each Share Class and at the combined annual rates mentioned below.
The performance fees which are payable to the Investment Manager, are payable annually or on crystallisation, and are calculated on each banking day (as defi ned in the Prospectus) at the combined annual rates mentioned below.
Sub-Funds Class
Combinedinvestment
management anddistribution fee Performance fee
Merrill Lynch Investment Solutions – Marshall Wace TOPS UCITS Fund (Market Neutral)
Class A 1.75% 25%Class B 1.50% 20%Class C 2.25% 20%Class G 1.50% 20%
Class Management 0.60% 10%Class Z 1.50% 20%
Merrill Lynch Investment Solutions – York Event-Driven UCITS Fund
Class A 1.50% 25%Class B 1.50% 15%Class C 2.50% 15%Class D 1.00% 10%Class E 1.50% 20%Class F 2.50% 20%Class Z 1.50% 20%
Merrill Lynch Investment Solutions – GLG European Opportunity UCITS Fund*
Class B 2.00% 20%Class C 2.75% 20%
Merrill Lynch Investment Solutions – CCI Healthcare Long-Short UCITS Fund
Class B 2.00% 20%Class C 2.75% 20%Class D 1.50% 15%
Class Management 0.00% 0%Class Z 2.00% 20%
* Liquidated on May 21, 2012
2.7 Foreign exchange translation (cont.)
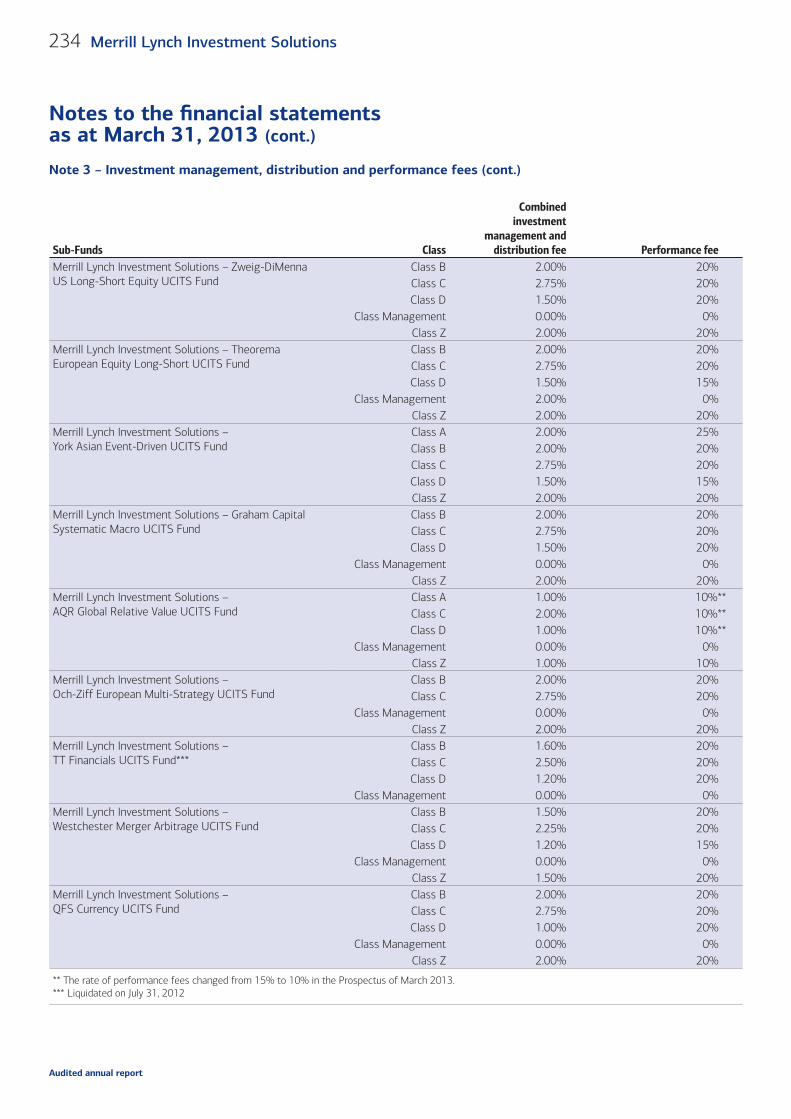
Notes to the fi nancial statementsas at March 31, 2013 (cont.)
234 Merrill Lynch Investment Solutions
Audited annual report
Sub-Funds Class
Combinedinvestment
management anddistribution fee Performance fee
Merrill Lynch Investment Solutions – Zweig-DiMenna US Long-Short Equity UCITS Fund
Class B 2.00% 20%Class C 2.75% 20%Class D 1.50% 20%
Class Management 0.00% 0%Class Z 2.00% 20%
Merrill Lynch Investment Solutions – Theorema European Equity Long-Short UCITS Fund
Class B 2.00% 20%Class C 2.75% 20%Class D 1.50% 15%
Class Management 2.00% 0%Class Z 2.00% 20%
Merrill Lynch Investment Solutions – York Asian Event-Driven UCITS Fund
Class A 2.00% 25%Class B 2.00% 20%Class C 2.75% 20%Class D 1.50% 15%Class Z 2.00% 20%
Merrill Lynch Investment Solutions – Graham Capital Systematic Macro UCITS Fund
Class B 2.00% 20%Class C 2.75% 20%Class D 1.50% 20%
Class Management 0.00% 0%Class Z 2.00% 20%
Merrill Lynch Investment Solutions – AQR Global Relative Value UCITS Fund
Class A 1.00% 10%**Class C 2.00% 10%**Class D 1.00% 10%**
Class Management 0.00% 0%Class Z 1.00% 10%
Merrill Lynch Investment Solutions – Och-Ziff European Multi-Strategy UCITS Fund
Class B 2.00% 20%Class C 2.75% 20%
Class Management 0.00% 0%Class Z 2.00% 20%
Merrill Lynch Investment Solutions – TT Financials UCITS Fund***
Class B 1.60% 20%Class C 2.50% 20%Class D 1.20% 20%
Class Management 0.00% 0%Merrill Lynch Investment Solutions – Westchester Merger Arbitrage UCITS Fund
Class B 1.50% 20%Class C 2.25% 20%Class D 1.20% 15%
Class Management 0.00% 0%Class Z 1.50% 20%
Merrill Lynch Investment Solutions – QFS Currency UCITS Fund
Class B 2.00% 20%Class C 2.75% 20%Class D 1.00% 20%
Class Management 0.00% 0%Class Z 2.00% 20%
** The rate of performance fees changed from 15% to 10% in the Prospectus of March 2013.*** Liquidated on July 31, 2012
Note 3 – Investment management, distribution and performance fees (cont.)
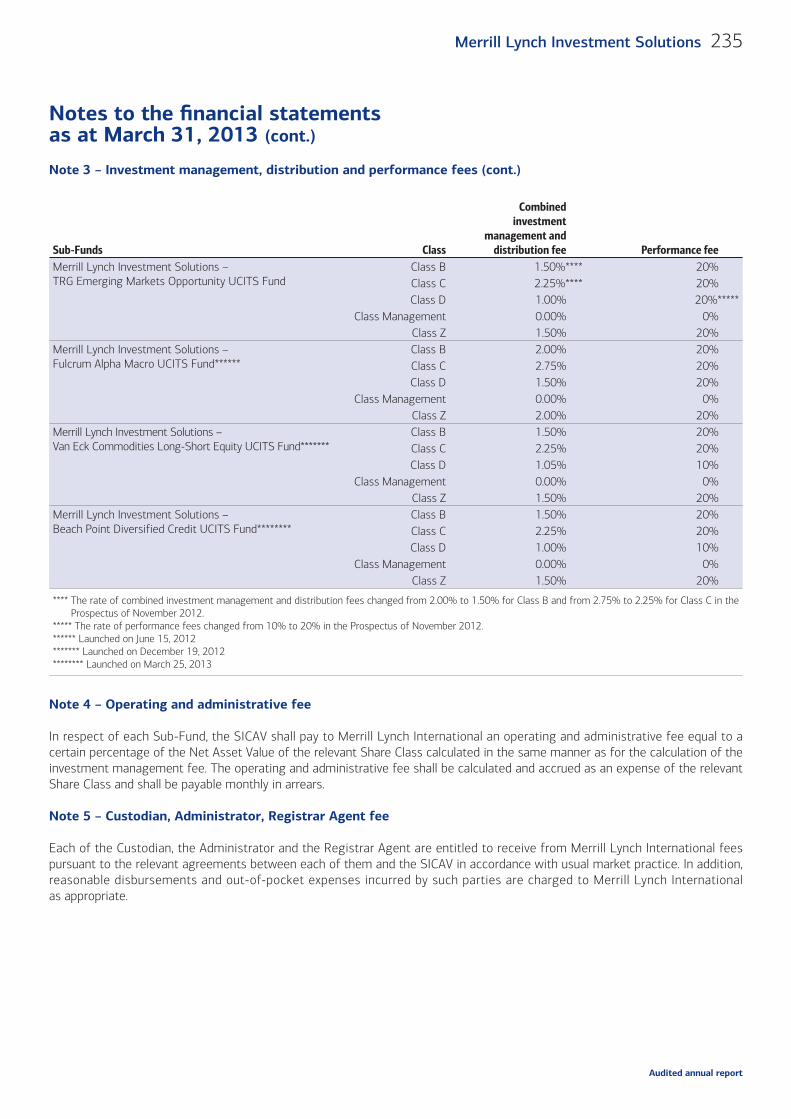
Notes to the fi nancial statementsas at March 31, 2013 (cont.)
235Merrill Lynch Investment Solutions
Audited annual report
Note 3 – Investment management, distribution and performance fees (cont.)
Sub-Funds Class
Combinedinvestment
management anddistribution fee Performance fee
Merrill Lynch Investment Solutions – TRG Emerging Markets Opportunity UCITS Fund
Class B 1.50%**** 20%Class C 2.25%**** 20%Class D 1.00% 20%*****
Class Management 0.00% 0%Class Z 1.50% 20%
Merrill Lynch Investment Solutions –Fulcrum Alpha Macro UCITS Fund******
Class B 2.00% 20%Class C 2.75% 20%Class D 1.50% 20%
Class Management 0.00% 0%Class Z 2.00% 20%
Merrill Lynch Investment Solutions – Van Eck Commodities Long-Short Equity UCITS Fund*******
Class B 1.50% 20%Class C 2.25% 20%Class D 1.05% 10%
Class Management 0.00% 0%Class Z 1.50% 20%
Merrill Lynch Investment Solutions – Beach Point Diversified Credit UCITS Fund********
Class B 1.50% 20%Class C 2.25% 20%Class D 1.00% 10%
Class Management 0.00% 0%Class Z 1.50% 20%
**** The rate of combined investment management and distribution fees changed from 2.00% to 1.50% for Class B and from 2.75% to 2.25% for Class C in the Prospectus of November 2012.
***** The rate of performance fees changed from 10% to 20% in the Prospectus of November 2012.****** Launched on June 15, 2012******* Launched on December 19, 2012******** Launched on March 25, 2013
Note 4 – Operating and administrative fee
In respect of each Sub-Fund, the SICAV shall pay to Merrill Lynch International an operating and administrative fee equal to a certain percentage of the Net Asset Value of the relevant Share Class calculated in the same manner as for the calculation of the investment management fee. The operating and administrative fee shall be calculated and accrued as an expense of the relevant Share Class and shall be payable monthly in arrears.
Note 5 – Custodian, Administrator, Registrar Agent fee
Each of the Custodian, the Administrator and the Registrar Agent are entitled to receive from Merrill Lynch International fees pursuant to the relevant agreements between each of them and the SICAV in accordance with usual market practice. In addition, reasonable disbursements and out-of-pocket expenses incurred by such parties are charged to Merrill Lynch International as appropriate.
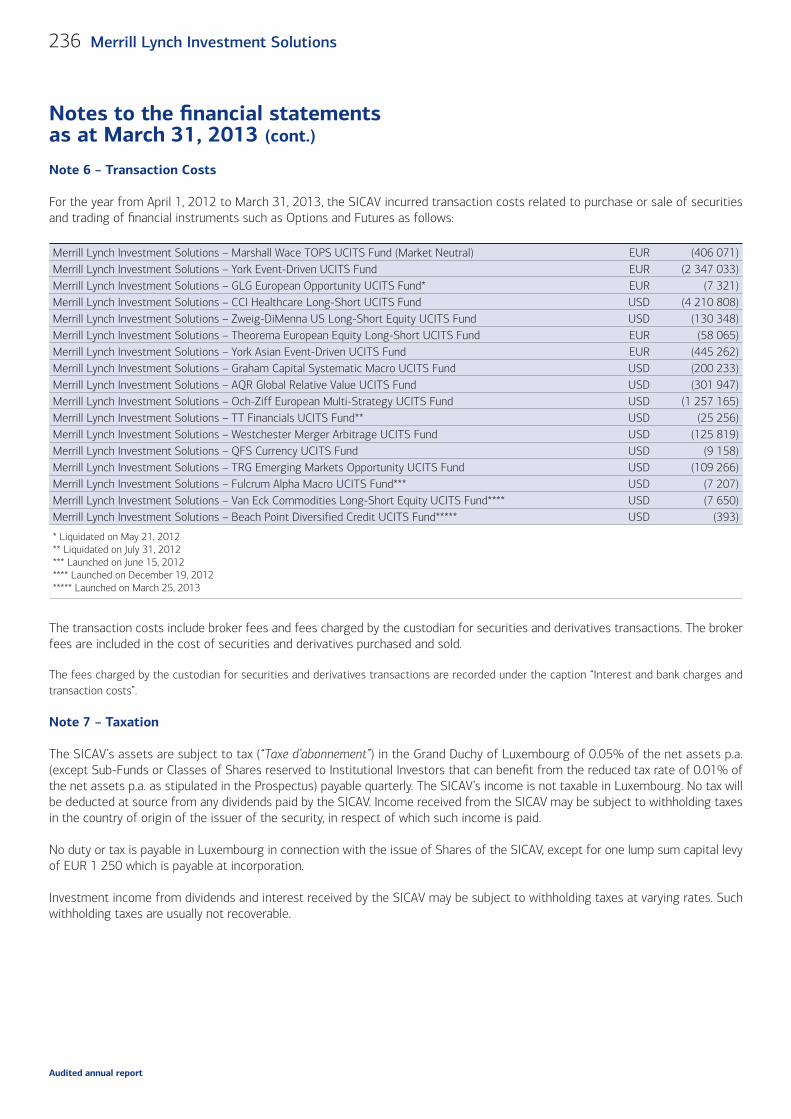
Notes to the fi nancial statementsas at March 31, 2013 (cont.)
236 Merrill Lynch Investment Solutions
Audited annual report
Note 6 – Transaction Costs
For the year from April 1, 2012 to March 31, 2013, the SICAV incurred transaction costs related to purchase or sale of securities and trading of fi nancial instruments such as Options and Futures as follows:
Merrill Lynch Investment Solutions – Marshall Wace TOPS UCITS Fund (Market Neutral) EUR (406 071)Merrill Lynch Investment Solutions – York Event-Driven UCITS Fund EUR (2 347 033)Merrill Lynch Investment Solutions – GLG European Opportunity UCITS Fund* EUR (7 321)Merrill Lynch Investment Solutions – CCI Healthcare Long-Short UCITS Fund USD (4 210 808)Merrill Lynch Investment Solutions – Zweig-DiMenna US Long-Short Equity UCITS Fund USD (130 348)Merrill Lynch Investment Solutions – Theorema European Equity Long-Short UCITS Fund EUR (58 065)Merrill Lynch Investment Solutions – York Asian Event-Driven UCITS Fund EUR (445 262)Merrill Lynch Investment Solutions – Graham Capital Systematic Macro UCITS Fund USD (200 233)Merrill Lynch Investment Solutions – AQR Global Relative Value UCITS Fund USD (301 947)Merrill Lynch Investment Solutions – Och-Ziff European Multi-Strategy UCITS Fund USD (1 257 165)Merrill Lynch Investment Solutions – TT Financials UCITS Fund** USD (25 256)Merrill Lynch Investment Solutions – Westchester Merger Arbitrage UCITS Fund USD (125 819)Merrill Lynch Investment Solutions – QFS Currency UCITS Fund USD (9 158)Merrill Lynch Investment Solutions – TRG Emerging Markets Opportunity UCITS Fund USD (109 266)Merrill Lynch Investment Solutions – Fulcrum Alpha Macro UCITS Fund*** USD (7 207)Merrill Lynch Investment Solutions – Van Eck Commodities Long-Short Equity UCITS Fund**** USD (7 650)Merrill Lynch Investment Solutions – Beach Point Diversified Credit UCITS Fund***** USD (393)
* Liquidated on May 21, 2012** Liquidated on July 31, 2012*** Launched on June 15, 2012**** Launched on December 19, 2012***** Launched on March 25, 2013
The transaction costs include broker fees and fees charged by the custodian for securities and derivatives transactions. The broker fees are included in the cost of securities and derivatives purchased and sold.
The fees charged by the custodian for securities and derivatives transactions are recorded under the caption “Interest and bank charges and transaction costs”.
Note 7 – Taxation
The SICAV’s assets are subject to tax (“Taxe d’abonnement”) in the Grand Duchy of Luxembourg of 0.05% of the net assets p.a. (except Sub-Funds or Classes of Shares reserved to Institutional Investors that can benefi t from the reduced tax rate of 0.01% of the net assets p.a. as stipulated in the Prospectus) payable quarterly. The SICAV’s income is not taxable in Luxembourg. No tax will be deducted at source from any dividends paid by the SICAV. Income received from the SICAV may be subject to withholding taxes in the country of origin of the issuer of the security, in respect of which such income is paid.
No duty or tax is payable in Luxembourg in connection with the issue of Shares of the SICAV, except for one lump sum capital levy of EUR 1 250 which is payable at incorporation.
Investment income from dividends and interest received by the SICAV may be subject to withholding taxes at varying rates. Such withholding taxes are usually not recoverable.
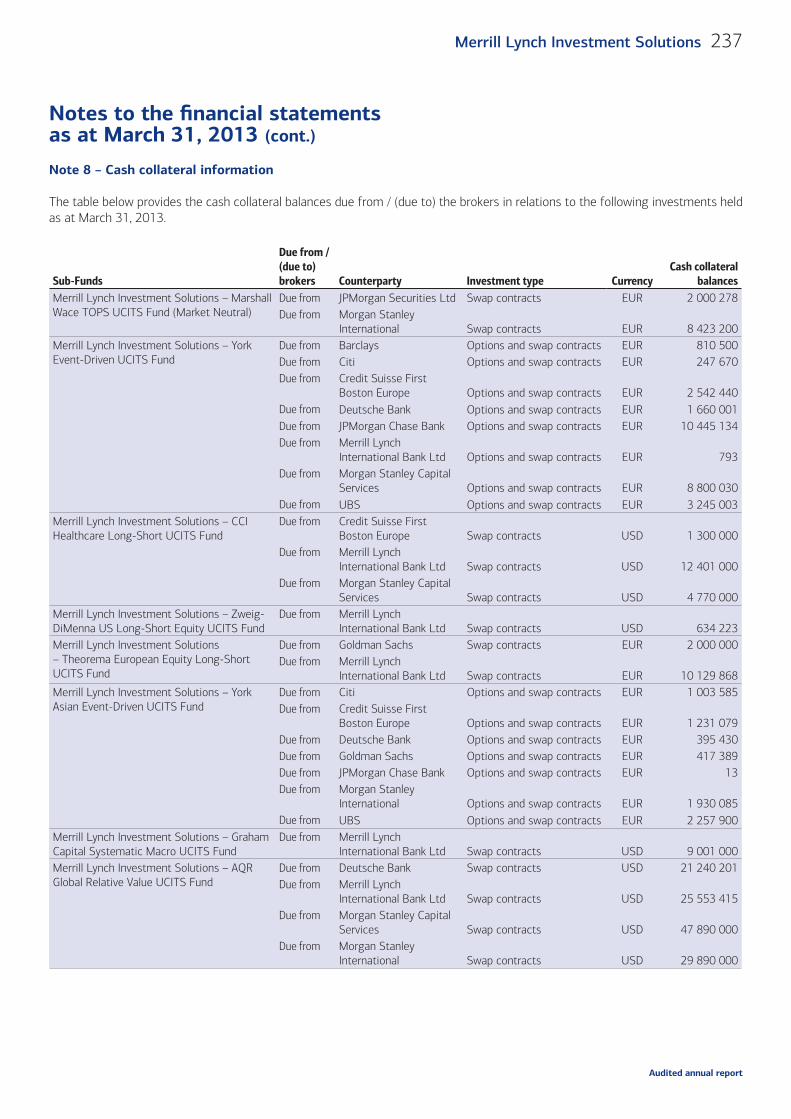
Notes to the fi nancial statementsas at March 31, 2013 (cont.)
237Merrill Lynch Investment Solutions
Audited annual report
Note 8 – Cash collateral information
The table below provides the cash collateral balances due from / (due to) the brokers in relations to the following investments held as at March 31, 2013.
Sub-Funds
Due from / (due to) brokers Counterparty Investment type Currency
Cash collateral balances
Merrill Lynch Investment Solutions – Marshall Wace TOPS UCITS Fund (Market Neutral)
Due from JPMorgan Securities Ltd Swap contracts EUR 2 000 278 Due from Morgan Stanley
International Swap contracts EUR 8 423 200 Merrill Lynch Investment Solutions – York Event-Driven UCITS Fund
Due from Barclays Options and swap contracts EUR 810 500 Due from Citi Options and swap contracts EUR 247 670 Due from Credit Suisse First
Boston Europe Options and swap contracts EUR 2 542 440 Due from Deutsche Bank Options and swap contracts EUR 1 660 001 Due from JPMorgan Chase Bank Options and swap contracts EUR 10 445 134 Due from Merrill Lynch
International Bank Ltd Options and swap contracts EUR 793 Due from Morgan Stanley Capital
Services Options and swap contracts EUR 8 800 030 Due from UBS Options and swap contracts EUR 3 245 003
Merrill Lynch Investment Solutions – CCI Healthcare Long-Short UCITS Fund
Due from Credit Suisse First Boston Europe Swap contracts USD 1 300 000
Due from Merrill Lynch International Bank Ltd Swap contracts USD 12 401 000
Due from Morgan Stanley Capital Services Swap contracts USD 4 770 000
Merrill Lynch Investment Solutions – Zweig-DiMenna US Long-Short Equity UCITS Fund
Due from Merrill Lynch International Bank Ltd Swap contracts USD 634 223
Merrill Lynch Investment Solutions – Theorema European Equity Long-Short UCITS Fund
Due from Goldman Sachs Swap contracts EUR 2 000 000 Due from Merrill Lynch
International Bank Ltd Swap contracts EUR 10 129 868 Merrill Lynch Investment Solutions – York Asian Event-Driven UCITS Fund
Due from Citi Options and swap contracts EUR 1 003 585 Due from Credit Suisse First
Boston Europe Options and swap contracts EUR 1 231 079 Due from Deutsche Bank Options and swap contracts EUR 395 430 Due from Goldman Sachs Options and swap contracts EUR 417 389 Due from JPMorgan Chase Bank Options and swap contracts EUR 13Due from Morgan Stanley
International Options and swap contracts EUR 1 930 085 Due from UBS Options and swap contracts EUR 2 257 900
Merrill Lynch Investment Solutions – Graham Capital Systematic Macro UCITS Fund
Due from Merrill Lynch International Bank Ltd Swap contracts USD 9 001 000
Merrill Lynch Investment Solutions – AQR Global Relative Value UCITS Fund
Due from Deutsche Bank Swap contracts USD 21 240 201 Due from Merrill Lynch
International Bank Ltd Swap contracts USD 25 553 415 Due from Morgan Stanley Capital
Services Swap contracts USD 47 890 000 Due from Morgan Stanley
International Swap contracts USD 29 890 000
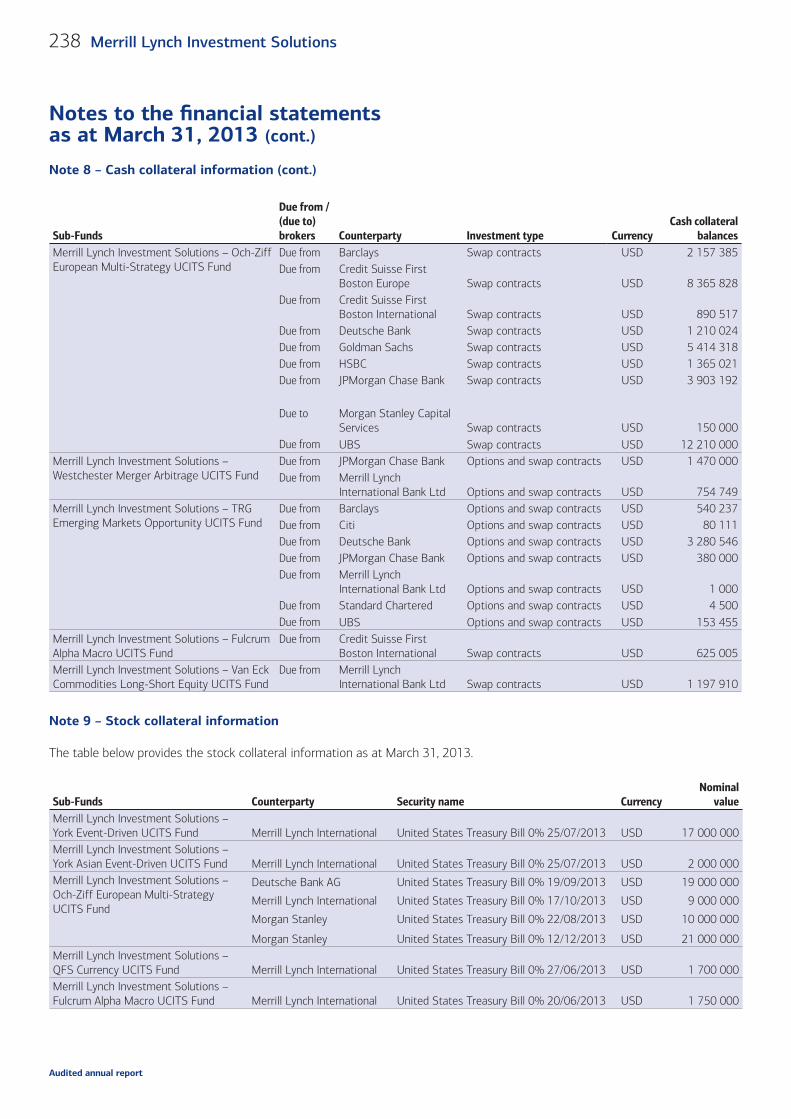
Notes to the fi nancial statementsas at March 31, 2013 (cont.)
238 Merrill Lynch Investment Solutions
Audited annual report
Sub-Funds
Due from / (due to) brokers Counterparty Investment type Currency
Cash collateral balances
Merrill Lynch Investment Solutions – Och-Ziff European Multi-Strategy UCITS Fund
Due from Barclays Swap contracts USD 2 157 385 Due from Credit Suisse First
Boston Europe Swap contracts USD 8 365 828 Due from Credit Suisse First
Boston International Swap contracts USD 890 517 Due from Deutsche Bank Swap contracts USD 1 210 024 Due from Goldman Sachs Swap contracts USD 5 414 318 Due from HSBC Swap contracts USD 1 365 021 Due from JPMorgan Chase Bank Swap contracts USD 3 903 192
Due to Morgan Stanley Capital Services Swap contracts USD 150 000
Due from UBS Swap contracts USD 12 210 000 Merrill Lynch Investment Solutions – Westchester Merger Arbitrage UCITS Fund
Due from JPMorgan Chase Bank Options and swap contracts USD 1 470 000 Due from Merrill Lynch
International Bank Ltd Options and swap contracts USD 754 749 Merrill Lynch Investment Solutions – TRG Emerging Markets Opportunity UCITS Fund
Due from Barclays Options and swap contracts USD 540 237 Due from Citi Options and swap contracts USD 80 111 Due from Deutsche Bank Options and swap contracts USD 3 280 546 Due from JPMorgan Chase Bank Options and swap contracts USD 380 000 Due from Merrill Lynch
International Bank Ltd Options and swap contracts USD 1 000 Due from Standard Chartered Options and swap contracts USD 4 500 Due from UBS Options and swap contracts USD 153 455
Merrill Lynch Investment Solutions – Fulcrum Alpha Macro UCITS Fund
Due from Credit Suisse First Boston International Swap contracts USD 625 005
Merrill Lynch Investment Solutions – Van Eck Commodities Long-Short Equity UCITS Fund
Due from Merrill Lynch International Bank Ltd Swap contracts USD 1 197 910
Note 9 – Stock collateral information
The table below provides the stock collateral information as at March 31, 2013.
Sub-Funds Counterparty Security name Currency Nominal
value Merrill Lynch Investment Solutions – York Event-Driven UCITS Fund Merrill Lynch International United States Treasury Bill 0% 25/07/2013 USD 17 000 000 Merrill Lynch Investment Solutions – York Asian Event-Driven UCITS Fund Merrill Lynch International United States Treasury Bill 0% 25/07/2013 USD 2 000 000 Merrill Lynch Investment Solutions – Och-Ziff European Multi-Strategy UCITS Fund
Deutsche Bank AG United States Treasury Bill 0% 19/09/2013 USD 19 000 000
Merrill Lynch International United States Treasury Bill 0% 17/10/2013 USD 9 000 000
Morgan Stanley United States Treasury Bill 0% 22/08/2013 USD 10 000 000
Morgan Stanley United States Treasury Bill 0% 12/12/2013 USD 21 000 000 Merrill Lynch Investment Solutions – QFS Currency UCITS Fund Merrill Lynch International United States Treasury Bill 0% 27/06/2013 USD 1 700 000 Merrill Lynch Investment Solutions – Fulcrum Alpha Macro UCITS Fund Merrill Lynch International United States Treasury Bill 0% 20/06/2013 USD 1 750 000
Note 8 – Cash collateral information (cont.)
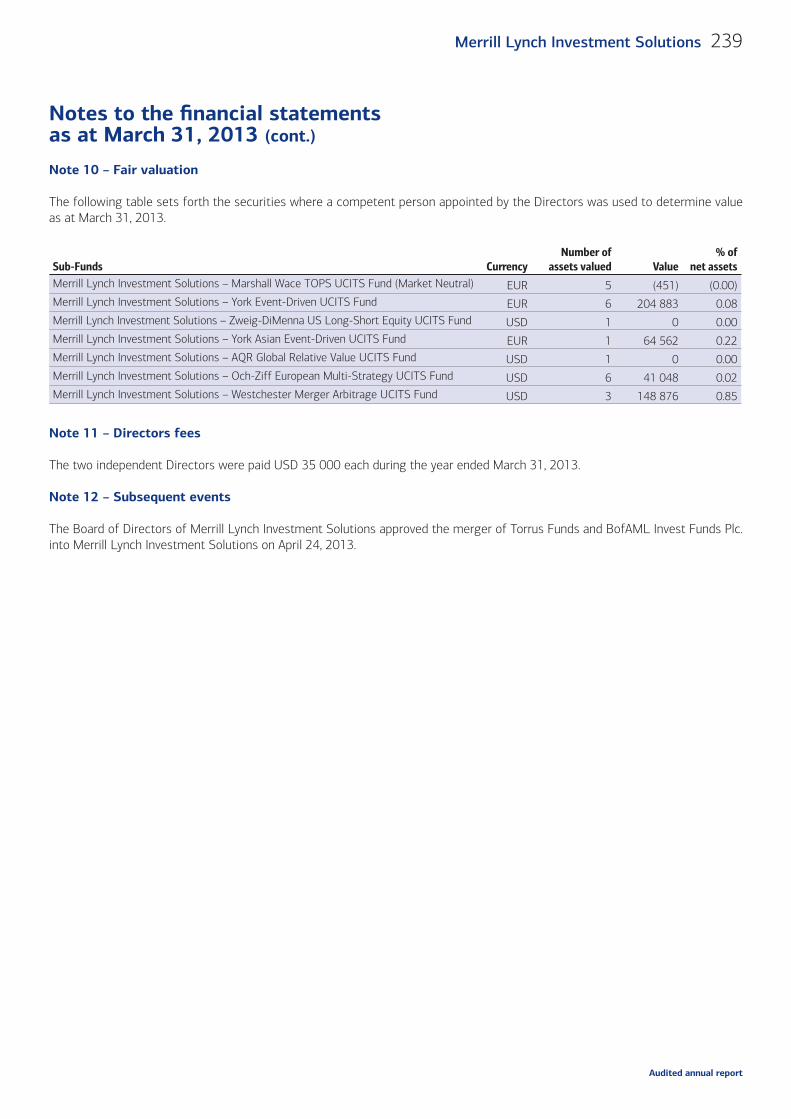
Notes to the fi nancial statementsas at March 31, 2013 (cont.)
239Merrill Lynch Investment Solutions
Audited annual report
Note 10 – Fair valuation
The following table sets forth the securities where a competent person appointed by the Directors was used to determine value as at March 31, 2013.
Sub-Funds CurrencyNumber of
assets valued Value% of
net assetsMerrill Lynch Investment Solutions – Marshall Wace TOPS UCITS Fund (Market Neutral) EUR 5 (451) (0.00)Merrill Lynch Investment Solutions – York Event-Driven UCITS Fund EUR 6 204 883 0.08 Merrill Lynch Investment Solutions – Zweig-DiMenna US Long-Short Equity UCITS Fund USD 1 0 0.00 Merrill Lynch Investment Solutions – York Asian Event-Driven UCITS Fund EUR 1 64 562 0.22 Merrill Lynch Investment Solutions – AQR Global Relative Value UCITS Fund USD 1 0 0.00 Merrill Lynch Investment Solutions – Och-Ziff European Multi-Strategy UCITS Fund USD 6 41 048 0.02 Merrill Lynch Investment Solutions – Westchester Merger Arbitrage UCITS Fund USD 3 148 876 0.85
Note 11 – Directors fees
The two independent Directors were paid USD 35 000 each during the year ended March 31, 2013.
Note 12 – Subsequent events
The Board of Directors of Merrill Lynch Investment Solutions approved the merger of Torrus Funds and BofAML Invest Funds Plc. into Merrill Lynch Investment Solutions on April 24, 2013.
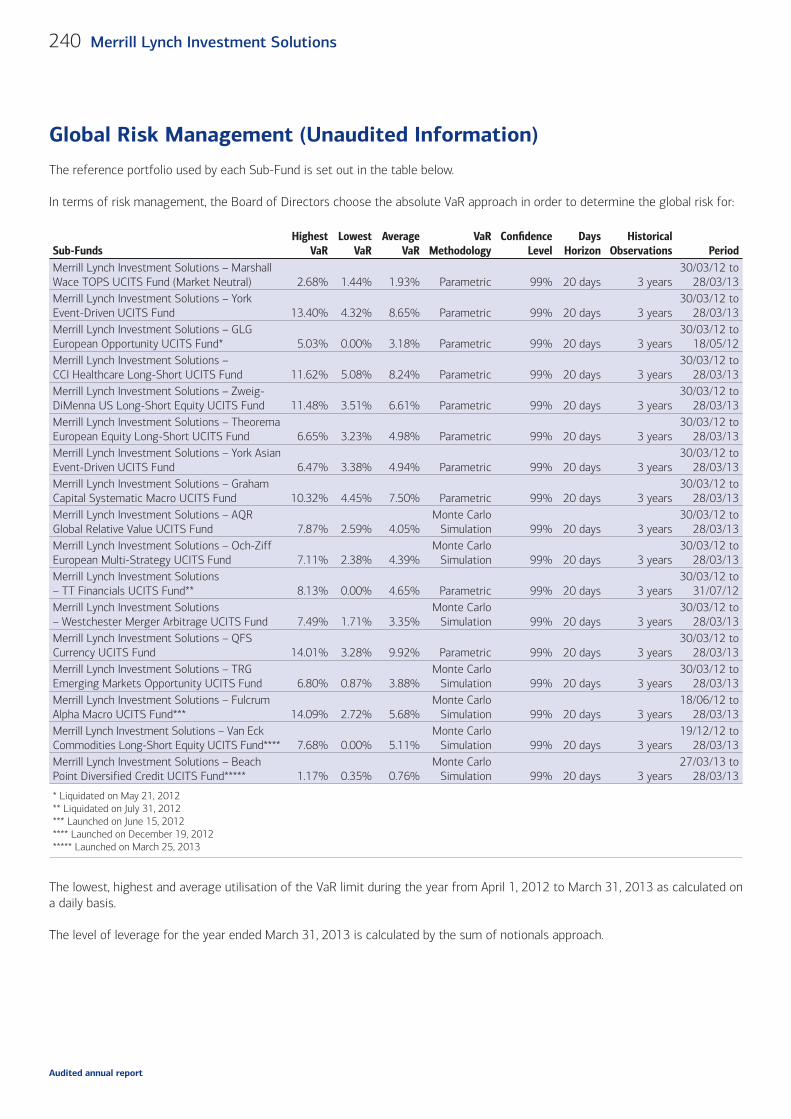
Audited annual report
240 Merrill Lynch Investment Solutions
Global Risk Management (Unaudited Information)The reference portfolio used by each Sub-Fund is set out in the table below.
In terms of risk management, the Board of Directors choose the absolute VaR approach in order to determine the global risk for:
Sub-FundsHighest
VaRLowest
VaRAverage
VaRVaR
MethodologyConfi dence
LevelDays
HorizonHistorical
Observations PeriodMerrill Lynch Investment Solutions – Marshall Wace TOPS UCITS Fund (Market Neutral) 2.68% 1.44% 1.93% Parametric 99% 20 days 3 years
30/03/12 to 28/03/13
Merrill Lynch Investment Solutions – York Event-Driven UCITS Fund 13.40% 4.32% 8.65% Parametric 99% 20 days 3 years
30/03/12 to 28/03/13
Merrill Lynch Investment Solutions – GLG European Opportunity UCITS Fund* 5.03% 0.00% 3.18% Parametric 99% 20 days 3 years
30/03/12 to 18/05/12
Merrill Lynch Investment Solutions – CCI Healthcare Long-Short UCITS Fund 11.62% 5.08% 8.24% Parametric 99% 20 days 3 years
30/03/12 to 28/03/13
Merrill Lynch Investment Solutions – Zweig-DiMenna US Long-Short Equity UCITS Fund 11.48% 3.51% 6.61% Parametric 99% 20 days 3 years
30/03/12 to 28/03/13
Merrill Lynch Investment Solutions – Theorema European Equity Long-Short UCITS Fund 6.65% 3.23% 4.98% Parametric 99% 20 days 3 years
30/03/12 to 28/03/13
Merrill Lynch Investment Solutions – York Asian Event-Driven UCITS Fund 6.47% 3.38% 4.94% Parametric 99% 20 days 3 years
30/03/12 to 28/03/13
Merrill Lynch Investment Solutions – Graham Capital Systematic Macro UCITS Fund 10.32% 4.45% 7.50% Parametric 99% 20 days 3 years
30/03/12 to 28/03/13
Merrill Lynch Investment Solutions – AQR Global Relative Value UCITS Fund 7.87% 2.59% 4.05%
Monte Carlo Simulation 99% 20 days 3 years
30/03/12 to 28/03/13
Merrill Lynch Investment Solutions – Och-Ziff European Multi-Strategy UCITS Fund 7.11% 2.38% 4.39%
Monte Carlo Simulation 99% 20 days 3 years
30/03/12 to 28/03/13
Merrill Lynch Investment Solutions – TT Financials UCITS Fund** 8.13% 0.00% 4.65% Parametric 99% 20 days 3 years
30/03/12 to 31/07/12
Merrill Lynch Investment Solutions – Westchester Merger Arbitrage UCITS Fund 7.49% 1.71% 3.35%
Monte Carlo Simulation 99% 20 days 3 years
30/03/12 to 28/03/13
Merrill Lynch Investment Solutions – QFS Currency UCITS Fund 14.01% 3.28% 9.92% Parametric 99% 20 days 3 years
30/03/12 to 28/03/13
Merrill Lynch Investment Solutions – TRG Emerging Markets Opportunity UCITS Fund 6.80% 0.87% 3.88%
Monte Carlo Simulation 99% 20 days 3 years
30/03/12 to 28/03/13
Merrill Lynch Investment Solutions – Fulcrum Alpha Macro UCITS Fund*** 14.09% 2.72% 5.68%
Monte Carlo Simulation 99% 20 days 3 years
18/06/12 to 28/03/13
Merrill Lynch Investment Solutions – Van Eck Commodities Long-Short Equity UCITS Fund**** 7.68% 0.00% 5.11%
Monte Carlo Simulation 99% 20 days 3 years
19/12/12 to 28/03/13
Merrill Lynch Investment Solutions – Beach Point Diversified Credit UCITS Fund***** 1.17% 0.35% 0.76%
Monte Carlo Simulation 99% 20 days 3 years
27/03/13 to 28/03/13
* Liquidated on May 21, 2012** Liquidated on July 31, 2012*** Launched on June 15, 2012**** Launched on December 19, 2012***** Launched on March 25, 2013
The lowest, highest and average utilisation of the VaR limit during the year from April 1, 2012 to March 31, 2013 as calculated on a daily basis.
The level of leverage for the year ended March 31, 2013 is calculated by the sum of notionals approach.
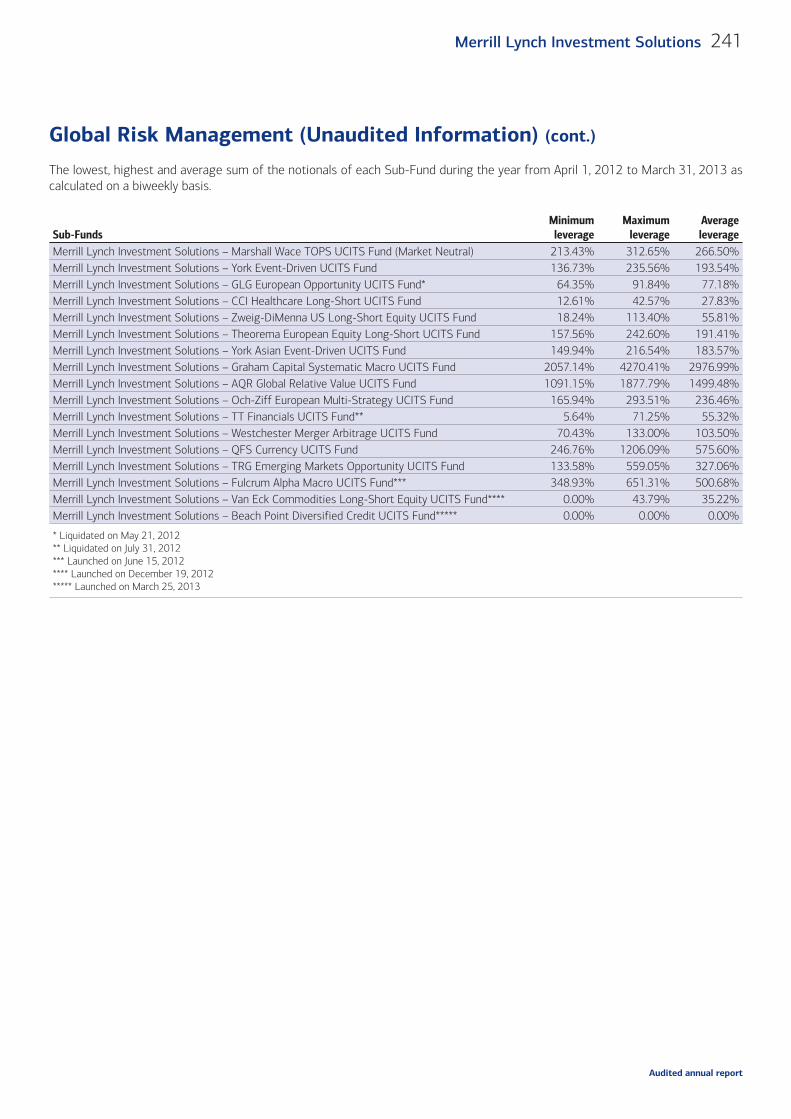
Audited annual report
241Merrill Lynch Investment Solutions
Global Risk Management (Unaudited Information) (cont.)
The lowest, highest and average sum of the notionals of each Sub-Fund during the year from April 1, 2012 to March 31, 2013 as calculated on a biweekly basis.
Sub-FundsMinimum
leverageMaximum
leverageAverage leverage
Merrill Lynch Investment Solutions – Marshall Wace TOPS UCITS Fund (Market Neutral) 213.43% 312.65% 266.50%Merrill Lynch Investment Solutions – York Event-Driven UCITS Fund 136.73% 235.56% 193.54%Merrill Lynch Investment Solutions – GLG European Opportunity UCITS Fund* 64.35% 91.84% 77.18%Merrill Lynch Investment Solutions – CCI Healthcare Long-Short UCITS Fund 12.61% 42.57% 27.83%Merrill Lynch Investment Solutions – Zweig-DiMenna US Long-Short Equity UCITS Fund 18.24% 113.40% 55.81%Merrill Lynch Investment Solutions – Theorema European Equity Long-Short UCITS Fund 157.56% 242.60% 191.41%Merrill Lynch Investment Solutions – York Asian Event-Driven UCITS Fund 149.94% 216.54% 183.57%Merrill Lynch Investment Solutions – Graham Capital Systematic Macro UCITS Fund 2057.14% 4270.41% 2976.99%Merrill Lynch Investment Solutions – AQR Global Relative Value UCITS Fund 1091.15% 1877.79% 1499.48%Merrill Lynch Investment Solutions – Och-Ziff European Multi-Strategy UCITS Fund 165.94% 293.51% 236.46%Merrill Lynch Investment Solutions – TT Financials UCITS Fund** 5.64% 71.25% 55.32%Merrill Lynch Investment Solutions – Westchester Merger Arbitrage UCITS Fund 70.43% 133.00% 103.50%Merrill Lynch Investment Solutions – QFS Currency UCITS Fund 246.76% 1206.09% 575.60%Merrill Lynch Investment Solutions – TRG Emerging Markets Opportunity UCITS Fund 133.58% 559.05% 327.06%Merrill Lynch Investment Solutions – Fulcrum Alpha Macro UCITS Fund*** 348.93% 651.31% 500.68%Merrill Lynch Investment Solutions – Van Eck Commodities Long-Short Equity UCITS Fund**** 0.00% 43.79% 35.22%Merrill Lynch Investment Solutions – Beach Point Diversified Credit UCITS Fund***** 0.00% 0.00% 0.00%
* Liquidated on May 21, 2012** Liquidated on July 31, 2012*** Launched on June 15, 2012**** Launched on December 19, 2012***** Launched on March 25, 2013


PRISMA 13/1143 MLIS AR ENG 0313