Merrill Lynch 2008 Global Energy Conference October 2,...
19
Merrill Lynch 2008 Global Energy Conference October 2, 2008
Transcript of Merrill Lynch 2008 Global Energy Conference October 2,...

Merrill Lynch 2008 Global Energy Conference
October 2, 2008

1
Forward Looking Statements
This presentation includes forward-looking information that is subject to a number of risks and uncertainties, many of which are beyond the Company’s control. All information, other than historical facts included in this presentation, regarding strategy, future operations, drilling plans, estimated reserves, future production, estimated capital expenditures, projected costs, the potential of drilling prospects and other plans and objectives of management is forward-looking information. All forward-looking statements speak only as of the date of this presentation. Although the Company believes that the plans, intentions and expectations reflected in or suggested by the forward-looking statements are reasonable, there is no assurance that these plans, intentions or expectations will be achieved. Actual results may differ materially from those anticipated due to many factors, including oil and natural gas prices, industry conditions, drilling results, uncertainties in estimating reserves, uncertainties in estimating future production from enhanced recovery operations, availability of drilling rigs, pipe and other services and equipment, availability of oil and natural gas transportation capacity, availability of capital resources and other factors listed in reports we have filed or may file with the Securities and Exchange Commission.
This presentation also includes information on reserves potentially recoverable through additional drilling or enhanced recovery operations. Non-proven estimates are generally not permitted to be disclosed in SEC filings and are subject to a substantial risk of not being realized.

2
Company Overview
Completed IPO in May 2007 (NYSE:CLR)~$7 billion market capitalizationFounded 1967 by Harold Hamm, Chairman & CEO 2nd largest oil producer in the Rockies
Organic growth strategy focused on unconventional resource playsL3 years reserve adds – 99% through the drill bit 2007 daily production 29,099 boepd > 2X 2004 level of 14,121 boepdFocus on hz drilling: >600 hz wells drilled82% of proved reserves / 76% of production from unconventional resources~1 million net undeveloped acres concentrated in unconventional resource plays
Strong financial results$245MM in 2Q08 EBITDAX – an increase of 125% over 2Q07Low leverage: $220MM of bank debt as of 6/30/08Oil and gas production 100% unhedged

3
$116
$285
$372$427
$470
2004 2005 2006 2007 1H 2008
59% CAGR
Investment in Asset Base
EBITDAX ($MM)
14,12119,751
24,70729,099 31,623
2004 2005 2006 2007 2Q 2008
27% CAGR
Production (Boepd)
Cash used in investing activities ($MM)
$184
$245
$30$130
$53
$21
$207
$13 Red River UnitsBakkenOther RockiesWoodfordOther Mid-ConGulf CoastLand & SeismicOther
2008 Capex by Region - $883MM
$73$134
$325
$483
$276
2004 2005 2006 2007 1H 2008*
88% CAGR
* Excludes $71MM for acquisitions.

4
Financial and Operating Summary
1 Excludes impact of price commodity derivative contracts covering period from August 2007 through April 2008.2 See page 30 of second quarter Form 10Q and earnings release for a reconciliation of net income to EBITDAX.3 Operating statistics per boe sold. Oil sales volumes are 35 Mbbls more than oil production volumes for 1H 2008; and 221 Mbbls and 21 Mbbls less than oil
production volumes for 2007 and 2006, respectively.
Years ended December 31, 2005
$52.45$6.93
15,63824,67419,751
$285,344
$50.19
7.322.222.43
$11.97
$38.22
2006$55.30$6.08
20,49325,27424,707
$372,115
$52.09
6.992.482.24
$11.71
$40.38
2007$63.55$5.87
23,83231,59929,099
$469,885
$58.32
7.353.131.92
$12.40
$45.92
Realized oil price ($/bbl)1
Realized natural gas price ($/Mcf)Oil production (boepd)Natural gas production (Mcfd)Total production (boepd)
EBITDAX ($000’s)2
Key Operational Statistics3
Average oil equivalent price1
Production expenseProduction taxG&A (ex non-cash equity compensation)Total cash costs
Cash margin
2004$38.85$5.06
10,10424,09314,121
$116,498
$36.45
8.492.392.02
$12.90
$23.55
1H 2008$104.43
$8.2524,08041,09830,930
$426,738
$92.34
8.835.382.46
$16.67
$75.67

5
Operational Overview
Red River Units 50%
Bakken Field 25%
Other Rockies 7%Mid-Continent 11%
Gulf Coast<1%
Total proved reserves (12/31/07) = 134.6 MMboe74% PDP / 77% oil / 12.7 R/P / Operate 93% of PV-10%
Unconventional82%
Red River Units 43%
Bakken Field 27%
Other Rockies 8%
Mid-Continent 14%
Gulf Coast2%
Avg. daily production (Q2 2008) = 31.6 Mboepd
Unconventional76%
1,306 net producing wells with >2,000 net drilling locations
Mid-ContinentProved reserves: 24.3 MMboe
Gulf CoastProved reserves: 0.3 MMboe
RockiesProved reserves: 110.0 MMboe
Proved Reserves by Geography
Production by Geography
Woodford 6%
Woodford 7%
Mid-ContinentProved reserves: 24.3 MMboe Gulf Coast
Proved reserves: 0.3 MMboe
RockiesProved reserves: 110.0 MMboe
Counties with acreage holdings are highlighted
Regional office
Headquarters

6
Key Drilling Projects
Development (36% 2008 D&C capex)Red River Units: 50% of proved reserves and 43% of productionMontana Bakken Shale: 20% of proved reserves and of 20% production
Impact plays (48% 2008 D&C capex)North Dakota Bakken Shale: 421,000 net acres Oklahoma Woodford Shale: 46,000 net acres
Estimated exit rate 43,000 boepd (36% increase over 2Q 2008)
13 operated drilling rigs at Jan. 200831 operated drillings currently, with 35 planned by year end
Red River Units
MT Bakken
ND Bakken
Arkoma Woodford
Counties with acreage holdings are highlighted
Regional officeHeadquarters
Development
Impact Plays

7
CLR Unconventional Resource Plays
~1,000,000 net acres in unconventional plays and growing
Shale Basin
Overthrust Belt
Marfa Woodford/Barnett – 67,000
Anadarko Woodford – 110,000 Atoka – 32,000
Lewis – 27,000
Arkoma Woodford – 46,000
Haynesville – 20,000
New Albany – 46,000
Marcellus, Rhinestreet, Huron – 88,000
Bakken – 577,000Red River – 77,000

8
Rocky Mountain Operations
MT Bakken
Red River Units
ND Bakken
9
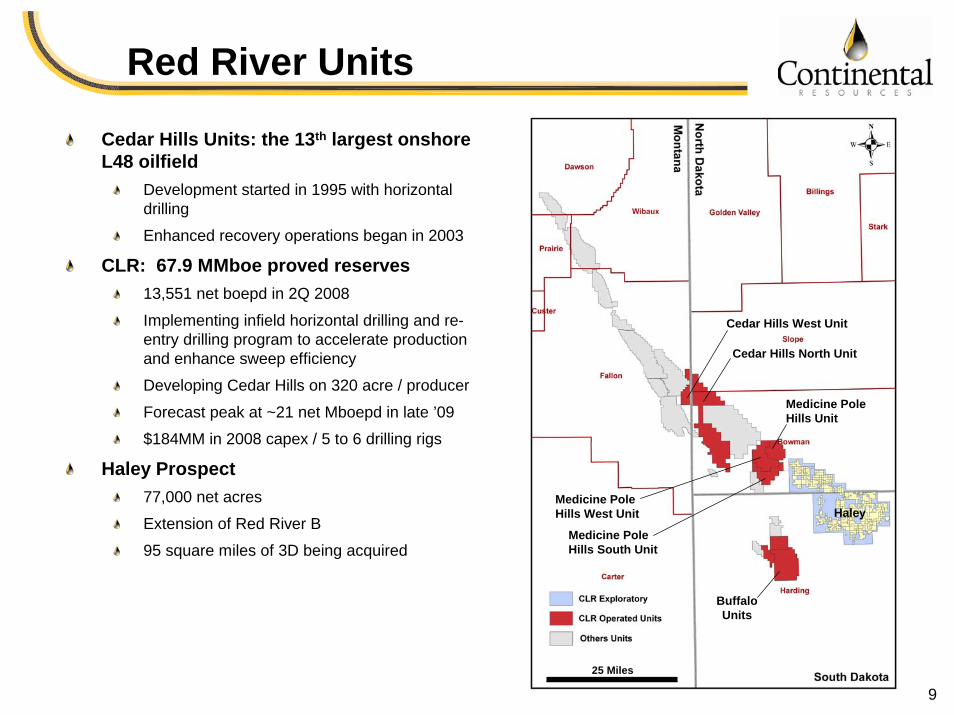
Red River Units
Cedar Hills Units: the 13th largest onshore L48 oilfield
Development started in 1995 with horizontal drilling
Enhanced recovery operations began in 2003
CLR: 67.9 MMboe proved reserves13,551 net boepd in 2Q 2008
Implementing infield horizontal drilling and re-entry drilling program to accelerate production and enhance sweep efficiency
Developing Cedar Hills on 320 acre / producer
Forecast peak at ~21 net Mboepd in late ’09
$184MM in 2008 capex / 5 to 6 drilling rigs
Haley Prospect77,000 net acres
Extension of Red River B
95 square miles of 3D being acquired
Cedar Hills North Unit
Cedar Hills West Unit
Buffalo Units
Medicine Pole Hills West Unit
Medicine Pole Hills South Unit
Medicine Pole Hills Unit
25 Miles25 Miles
Haley

10
Bakken Shale
Largest unconventional oil resource play in the L48 U.S.
~4B boe technologically recoverable reserves (USGS)Play is being developed through hz drilling and advanced fracture stimulation
CLR is largest leaseholder with 577,000 net acres
Currently have 13 operated rigs drilling, increasing to 16 by year end8,445 net boepd in 2Q 200870+ rigs operating
ConocoPhillipsEOG ResourcesHessMarathon
Montana
North
Dakota
Williston Basin
Montana
North
Dakota
CLR acreage Horizontal Bakken producer
Williston Basin
Outline of potential Bakken production

11
Richland County, MT Bakken
Joann 1-32H (83% WI)
Three Forks/Sanish test – late 3Q08 spud
Martin 1-27H (95% WI) –228 boepd
320-acre single lateral Bakken well
CLR acreage
640-acre tri-lateral Bakken well
Three Forks/Sanish test location
Melvin 3-3H (83% WI) – 405 boepdSwenseid 3-9H (95% WI) – 336 boepdArdelle 3-10H (95% WI) – 531 boepd
Staci 3-11H (95% WI) – 346 boepd
12
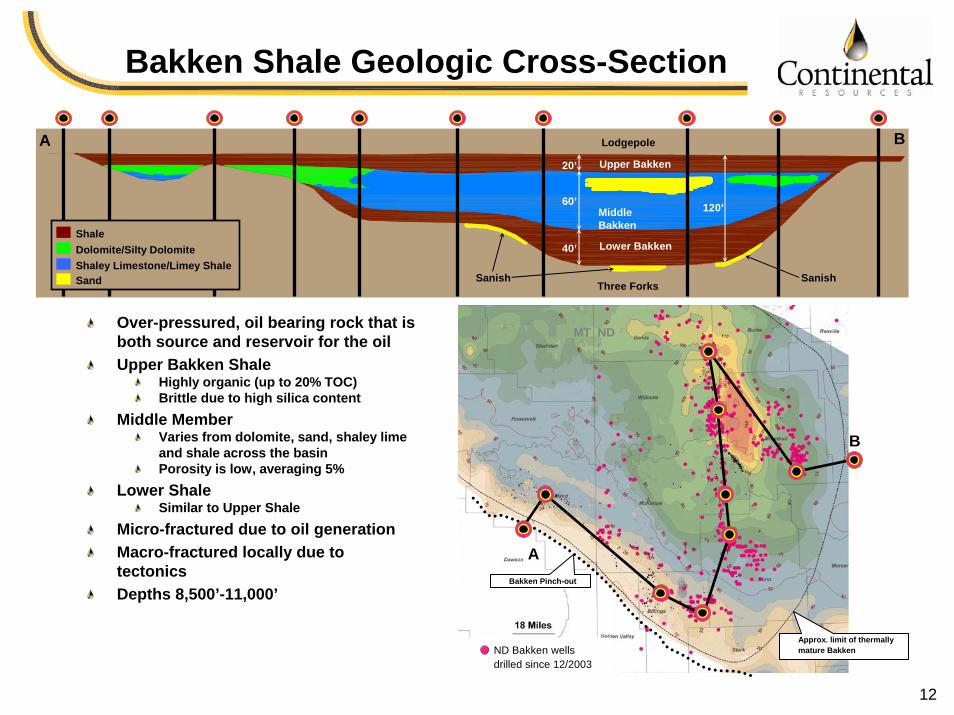
Bakken Shale Geologic Cross-Section
20’
60’
40’
120’
Upper Bakken
A
Three Forks
Lodgepole
Middle Bakken
Lower Bakken
B
Sanish Sanish
Dolomite/Silty DolomiteShaley Limestone/Limey ShaleSand
Shale
Over-pressured, oil bearing rock that is both source and reservoir for the oilUpper Bakken Shale
Highly organic (up to 20% TOC) Brittle due to high silica content
Middle MemberVaries from dolomite, sand, shaley lime and shale across the basinPorosity is low, averaging 5%
Lower ShaleSimilar to Upper Shale
Micro-fractured due to oil generationMacro-fractured locally due to tectonicsDepths 8,500’-11,000’
B
Approx. limit of thermally mature Bakken
MT ND
Bakken Pinch-out
A
ND Bakken wells drilled since 12/2003

13
ND Bakken – Recent Activity
THREE FORKS HORIZONTAL
CLR OPERATED
CLR NON-OPERATED
NO CLR INTEREST
First Three Forks/Sanish wells completed in 2Q08 (Bice 1-29H and Mathistad 1-35H)Expect to increase operated rig count from 10 currently to 12 by year end in ND Drilling program now primarily targeting TFS
6 of 10 rigs drilling TFS7 TFS wells in various stages of frac
Gross wells completedNet wells completedGross 7-day avg. IP
rate
2Q0833
8.7513 boepd
1Q0813
3.7455 boepd
New acreage

14
Three Forks/Sanish Wells
Northern 2/3s of ND Bakken acreage has 50’ or more separationGiven the low porosity/perm of the rock, our theory is that the TFS is a separate reservoir from the Middle Bakken
Exception: Areas where the interval thins
Exception: Areas where there is significant vertical fracturing due to tectonics
CLR-operated Three Forks/Sanish wells being drilled or completed.
CLR-operated Three Forks/Sanish wells in production.
Oscar 1-25HElveida 1-33HArvid 1-34H
Omar 1-1H –1,126 boepd
Morris 1-23HGale 1-32HMittelstadt 1-20HSkachenko 1-31HSloan 1-17H
Bice 1-29H –693 boepd
Ronholdt 1-16H –196 boepd
Mathistad 1-35H –1,260 boepd
Croff 1-2H – 1,001 boepd
Omlid 1-7HMaryann 1-15HKirkland 1-33HMerton 1-3H

15
Arkoma Woodford Shale
Unconventional gas resource play
40+ industry-operated rigs (Newfield, Antero, Devon) in the Arkoma Woodford
CLR: 46,000 net acresSignificant reserve and production growth potential$130MM in 2008 capex Increasing from 5 operated drilling rigs currently to 7 by year end Acquired 26 square miles of 3D in Salt Creek and acquiring 55 square miles in E. McAlesterCaney Shale upside
12 miles
SALT CREEK exploratory
EAST MCALESTER exploratory
ASHLANDdevelopment
Harden-Wolohon4-well Simul-frac
Avg. 3.5 MMcfd/well
Arlan 2-well Simul-frac
Avg. 6.8 MMcfd/well
Shaklee 2-well Simul-frac
Avg. 1.6 MMcfd/well
Blevins 1-1H – 8,114 Mcfd
Luna-Pratt (2)2-well Simul-fracs
Scheduled 3Q08
CLR Operated WOC CLR Operated Producer CLR 2008 Wells to be drilledWoodford Producer
CLR Acreage
Inset: CLR 2008 Wells WOC/TD
Inset: CLR 2008 Wells to be drilled
Inset: CLR 2008 Completed Wells
16
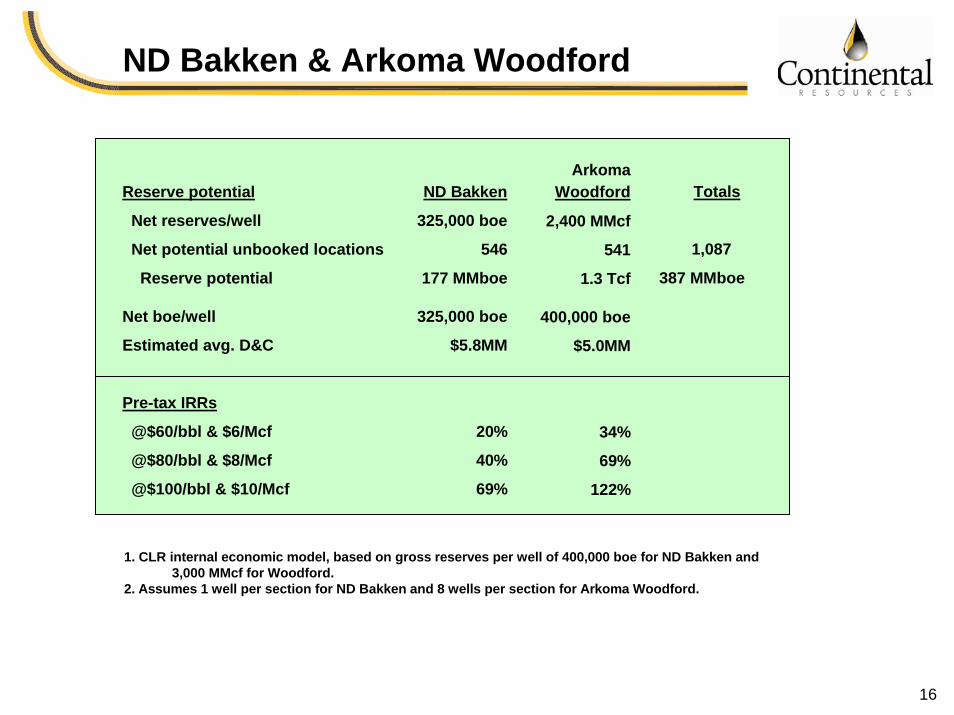
ND Bakken & Arkoma Woodford
1. CLR internal economic model, based on gross reserves per well of 400,000 boe for ND Bakken and 3,000 MMcf for Woodford.
2. Assumes 1 well per section for ND Bakken and 8 wells per section for Arkoma Woodford.
Reserve potential
Net reserves/well
Net potential unbooked locations
Reserve potential
Net boe/well
Estimated avg. D&C
Pre-tax IRRs
@$60/bbl & $6/Mcf
@$80/bbl & $8/Mcf
@$100/bbl & $10/Mcf
ND Bakken
325,000 boe
546
177 MMboe
325,000 boe
$5.8MM
20%
40%
69%
ArkomaWoodford
2,400 MMcf
541
1.3 Tcf
400,000 boe
$5.0MM
34%
69%
122%
Totals
1,087
387 MMboe

17
Trenton/Black River – Hillsdale Co., MI
Single largest field in Michigan --Albion-Scipio and Stony Point Field have produced ~190 MMboe.CLR: 47,000 net acres10 gross (6.8 net) wells drilled with 90% success rate as of July 2008Have applied for DEQ ruling on increased production allowable, with response expected Sept./Oct. 3D seismic being acquired in preparation for multi-well drilling program in 4Q
Albion-Scipio Field, discovered in 1956
5 Miles
Albion-Scipio Field
Stoney Point
Hog Heaven3-D 6.5 mi.
Chicago/Norad 3-D 20 mi. (processing)
Dog Leg 3-D3-D 4.5 mi.
Young 11-34 (testing)Pridgeon 3-3 (planned hz)
Lindemann 1-36 – testingClark 1-36 – 5 BOPD
McArthur 1-36 – 110 BOPDBoardman 1-1 – 200 BOPDAnspaugh 1-1 – 110 BOPD
Wessel 1-6 – 110 BOPDWessel 2-6A– 110 BOPD
Wessel 1-1 – dry hole
Kittyhawk 3-DFred Bear 3-D(proposed)
18
Summary
High quality, proved reserve base Crude oil-concentrated, long-lived, high operated %
Track record of low cost growth through the drill bitL3 years cash flow from operations $1,075MM vs. $942MM cash invested
Focused on horizontal drilling in unconventional resource plays
Low risk production growth in Red River Units ~7,500 boepd expected production growth over next 1+ years
Significant future production and reserve growth opportunities in several emerging plays
387 MMboe unbooked potential reserves in ND Bakken & Arkoma Woodford vs. 2007 year-end reserves of 135 MMboeLarge acreage position in other emerging shale plays, including Anadarko Woodford, Marcellus, Rhinestreet, Huron, Atoka, Haynesville and others
Low cash costs with one of the highest net operating marginsSignificant valuation and competitive advantage