
Merlon Income Strategy · some thoughts on Australian house prices and noted the premium at which...
34
Merlon Income Strategy Merlon Australian Share Income Fund Quarterly Report March 2018
Transcript of Merlon Income Strategy · some thoughts on Australian house prices and noted the premium at which...

Merlon Income Strategy
Merlon Australian Share Income Fund
Quarterly Report
March 2018

Contents
Some Thoughts on Asset Prices 3
Digital vs Traditional Media – A Global Trend 12
Market Outlook 24
Portfolio Positioning 25
March Quarter Portfolio Activity 28
March Quarter Market Review 29
March Performance Review 30

Page | 3
Some Thoughts on Asset Prices This time last year we outlined some thoughts on Australian house prices and noted the
premium at which dwellings in this country traded relative to historical averages. In this
paper we position this analysis within the context of global asset prices.
The issue of high asset prices is not isolated to Sydney houses. Other global cities have
experienced similar price appreciation and most asset classes – with the notable exception
of listed equities – are trading well above historic norms.
Figure 1: Current Valuation Multiples Relative to Post 1990 Averages
Source: Bloomberg, AMP, ABS, RBA, S&P Capital IQ, Merlon Analysis
Forecasting a widespread correction in asset prices is highly speculative in our view.
Similarly, while there is a loose correlation between market wide valuation multiples and
subsequent returns, we think forecasting long term returns is equally futile.
That said, it is clear to us that assets prices have benefitted from low interest rates and that
asset prices are vulnerable if expectations of low and stable inflation turn out to be wrong.
Of course, we could be worrying about nothing in which case listed equity valuations will
probably catch up to other assets. Either way, we think a portfolio tilt towards listed equities
is sensible in the current environment.
19%
52%
69%
22%31%
15%22%
-2% 0%
44%36%
Australian Property Fixed Income Equities
Analyst: Hamish Carlisle
Most asset classes are expensive relative to post 1990 averages…
A tilt towards listed equities is sensible in the current environment…

Page | 4
Figure 2: S&P 500 Valuation Multiples & Subsequent 10 Year Returns
Source: Robert Schiller, Bloomberg, Merlon Analysis, * 8 years & 2 months to February 2018
Interest Rates & Inflation – A Long Term Perspective A key driver of currently high valuation multiples appears to be the complacency among
many investors that interest rates will remain low for an extended period of time. The
corollary of this is that inflation expectations will remain low and stable for an extended
period of time. This is because perceived certainty about inflation creates perceived
certainty about a bond’s real return, making the bond a less risky investment.
Figure 3: Bond Yields
Source: Bloomberg, Merlon Analysis
Much of our value investing philosophy at a stock level is premised on the behavioural
tendency of investors to over-extrapolate short term trends too far into the future and ignore
the lessons of longer term historical periods. Investors come up with new rules for the new
world and are quick to dismiss tried and tested valuation frameworks.
1900
1910
1920
1930
1920
1950
1960
1970
1980
1990
2000
2010*
-10%
-5%
0%
5%
10%
15%
20%
5 10 15 20 25
10 Y
ear A
nnua
lised
Rea
l Ret
urn
Price to Trend Earnings Ratio at Start of Period
CurrentPE
0
5
10
15
20
Jan-
80
Jan-
82
Jan-
84
Jan-
86
Jan-
88
Jan-
90
Jan-
92
Jan-
94
Jan-
96
Jan-
98
Jan-
00
Jan-
02
Jan-
04
Jan-
06
Jan-
08
Jan-
10
Jan-
12
Jan-
14
Jan-
16
Jan-
18US 10 Year Treasury Yield AU 10 Year Treasury Yield
Forecasting long term returns and market timing is difficult…
Investors tend to over-extrapolate short term trends too far into the future…
Global growth is accelerating…
Page | 5
This is an example of what psychologists call the “availability heuristic”, or our tendency to
heavily weigh our judgements towards more recent information, making new opinions
biased toward that latest news.
When we discuss and consider individual company investments at Merlon we always view
current conditions within the context of the long term. This is always at least 10 years but
preferably longer, particularly when it comes to macroeconomic conditions. This helps us
avoid falling into the trap of placing two much weight on current conditions.
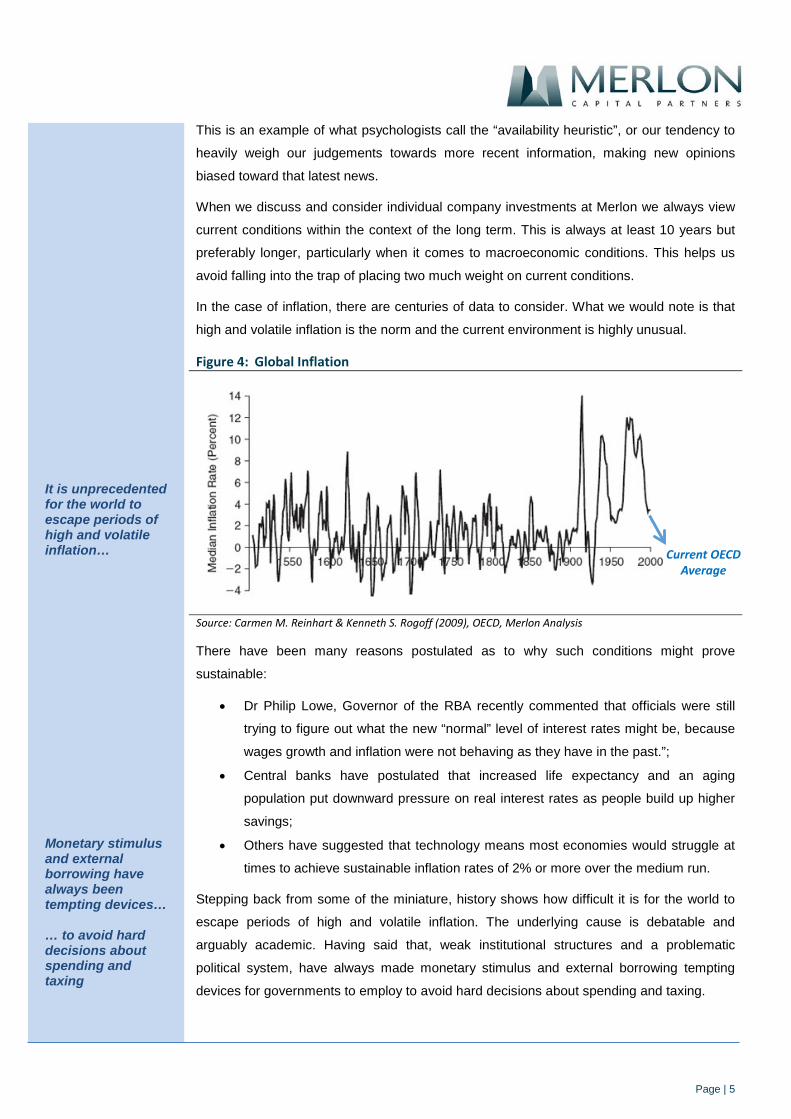
In the case of inflation, there are centuries of data to consider. What we would note is that
high and volatile inflation is the norm and the current environment is highly unusual.
Figure 4: Global Inflation
Source: Carmen M. Reinhart & Kenneth S. Rogoff (2009), OECD, Merlon Analysis
There have been many reasons postulated as to why such conditions might prove
sustainable:
• Dr Philip Lowe, Governor of the RBA recently commented that officials were still
trying to figure out what the new “normal” level of interest rates might be, because
wages growth and inflation were not behaving as they have in the past.”;
• Central banks have postulated that increased life expectancy and an aging
population put downward pressure on real interest rates as people build up higher
savings;
• Others have suggested that technology means most economies would struggle at
times to achieve sustainable inflation rates of 2% or more over the medium run.
Stepping back from some of the miniature, history shows how difficult it is for the world to
escape periods of high and volatile inflation. The underlying cause is debatable and
arguably academic. Having said that, weak institutional structures and a problematic
political system, have always made monetary stimulus and external borrowing tempting
devices for governments to employ to avoid hard decisions about spending and taxing.
Current OECDAverage
It is unprecedented for the world to escape periods of high and volatile inflation…
Monetary stimulus and external borrowing have always been tempting devices… … to avoid hard decisions about spending and taxing

Page | 6
Current Inflationary Pressures Turning to the current environment, it is worth noting that a number of factors that have
served to depress inflation in recent years appear to be receding. First, global economic
growth is synchronised and accelerating. In particular, business confidence is improving
which would typically be associated with higher demand for labour and capital goods. This
lift in demand may well flow through to higher prices.
Figure 5: Business Confidence
Source: OECD, Merlon Analysis
Second, there have two critical cyclical factors that have dulled CPI growth in the US in
recent periods being the falling oil price and the strong US dollar. Both these trends have
reversed. Additional deflationary impacts have also been felt from owners equivalent rent,
health and communications. Again, a normalisation of these components will lead to a
notable pick up in the rate of growth of the CPI.
Figure 6: Transitory Factors impacting the US CPI
Source: Federal Reserve, Merlon Analysis
90
92
94
96
98
100
102
104
1980
1981
1983
1985
1987
1989
1991
1992
1994
1996
1998
2000
2002
2003
2005
2007
2009
2011
2013
2014
2016
JPN CHN USA DEU
-60%
-40%
-20%
0%
20%
40%
60%
80%
100%
1980
1981
1983
1985
1987
1989
1991
1992
1994
1996
1998
2000
2002
2003
2005
2007
2009
2011
2013
2014
2016
WTI USD TWI
Global growth is accelerating…
Transitory factors that have dulled inflation are fading…
Page | 7
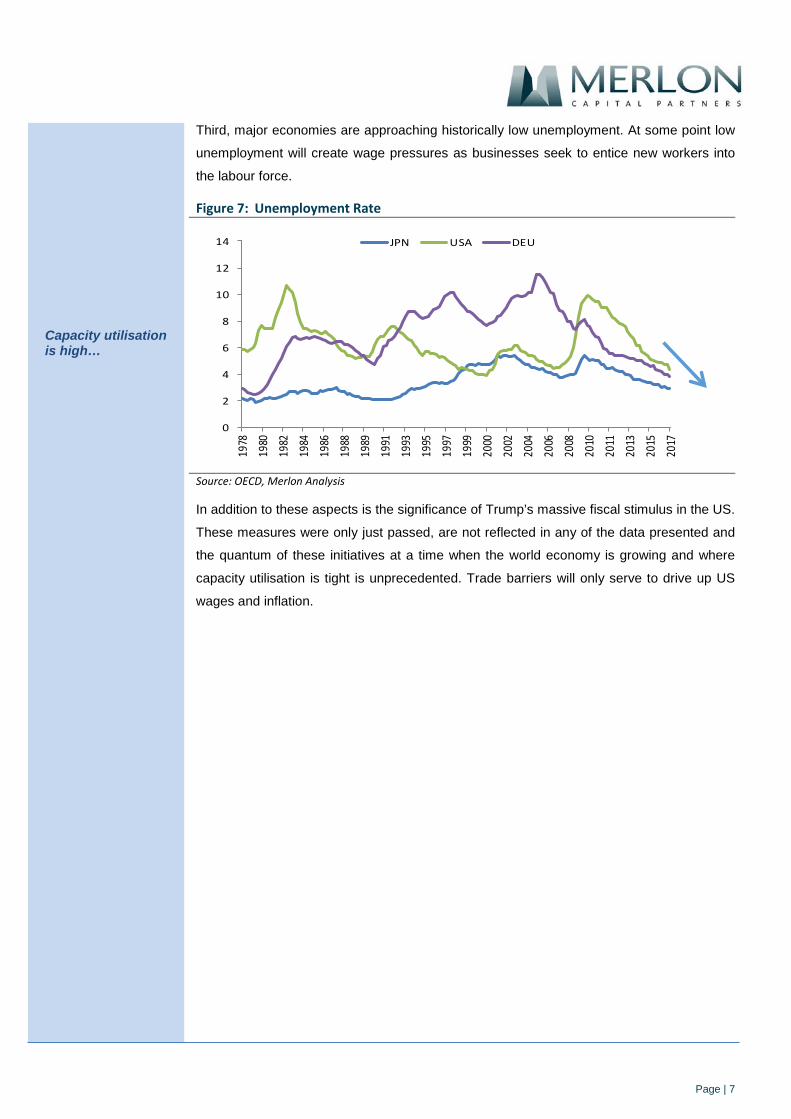
Third, major economies are approaching historically low unemployment. At some point low
unemployment will create wage pressures as businesses seek to entice new workers into
the labour force.
Figure 7: Unemployment Rate
Source: OECD, Merlon Analysis
In addition to these aspects is the significance of Trump’s massive fiscal stimulus in the US.
These measures were only just passed, are not reflected in any of the data presented and
the quantum of these initiatives at a time when the world economy is growing and where
capacity utilisation is tight is unprecedented. Trade barriers will only serve to drive up US
wages and inflation.
0
2
4
6
8
10
12
1419
7819
8019
8219
8419
8619
8819
8919
9119
9319
9519
9719
9920
0020
0220
0420
0620
0820
1020
1120
1320
1520
17
JPN USA DEU
Capacity utilisation is high…

Page | 8
Commercial Property could be More Expensive than Residential While there has been much focus on residential property in recent years, the rapid increase
in commercial property prices has been less well publicised. We note that while residential
property is passing hands at a price-to-rent ratio that is approximately 20% above its post
1990 average, commercial property is trading at around a 30% premium.
Figure 8: Price-to-Rent Ratios
Source: ABS, Bloomberg, AMP, Merlon Analysis
This commercial property price inflation has been most conspicuous in the “industrial”
category. This is particularly concerning to us given the lower lead times in adding supply in
this category and the often enormous incentives provided to new tenants, particularly
during economic downturns.
Figure 9: Price-to-Rent Ratios
Source: Bloomberg, AMP, Merlon Analysis
A final point to note about residential house prices is that Australia – and Sydney in
particular – is not that unusual when compared to other global cities with geographical
constraints to growth. In short, booming asset prices are a global phenomenon. If we go
down, we may all go down together.
0
10
20
30
40
0
5
10
15
20
25
Jan-
80
Jan-
82
Jan-
84
Jan-
86
Jan-
88
Jan-
90
Jan-
92
Jan-
94
Jan-
96
Jan-
98
Jan-
00
Jan-
02
Jan-
04
Jan-
06
Jan-
08
Jan-
10
Jan-
12
Jan-
14
Jan-
16
Jan-
18
Commercial Property (LHS) Residential Property (RHS)
0
5
10
15
20
25
Jan-
80
Jan-
82
Jan-
84
Jan-
86
Jan-
88
Jan-
90
Jan-
92
Jan-
94
Jan-
96
Jan-
98
Jan-
00
Jan-
02
Jan-
04
Jan-
06
Jan-
08
Jan-
10
Jan-
12
Jan-
14
Jan-
16
Jan-
18Composite Office Retail Industrial
Relative to recent history, commercial property is more expensive than residential property…
Industrial property prices are particularly concerning…
Page | 9
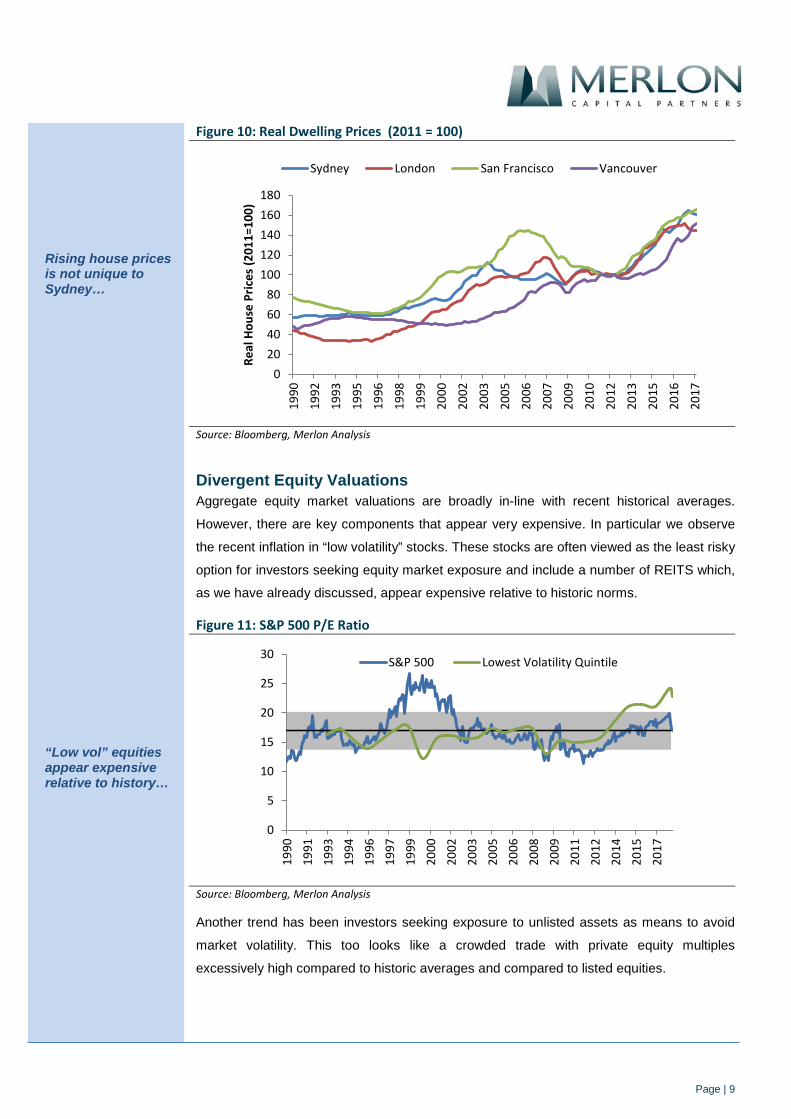
Figure 10: Real Dwelling Prices (2011 = 100)
Source: Bloomberg, Merlon Analysis
Divergent Equity Valuations Aggregate equity market valuations are broadly in-line with recent historical averages.
However, there are key components that appear very expensive. In particular we observe
the recent inflation in “low volatility” stocks. These stocks are often viewed as the least risky
option for investors seeking equity market exposure and include a number of REITS which,
as we have already discussed, appear expensive relative to historic norms.
Figure 11: S&P 500 P/E Ratio
Source: Bloomberg, Merlon Analysis
Another trend has been investors seeking exposure to unlisted assets as means to avoid
market volatility. This too looks like a crowded trade with private equity multiples
excessively high compared to historic averages and compared to listed equities.
020406080
100120140160180
1990
1992
1993
1995
1996
1998
1999
2000
2002
2003
2005
2006
2007
2009
2010
2012
2013
2015
2016
2017
Real
Hou
se P
rices
(201
1=10
0)
Sydney London San Francisco Vancouver
0
5
10
15
20
25
30
1990
1991
1993
1994
1996
1997
1999
2000
2002
2003
2005
2006
2008
2009
2011
2012
2014
2015
2017
S&P 500 Lowest Volatility Quintile
“Low vol” equities appear expensive relative to history…
Rising house prices is not unique to Sydney…

Page | 10
Figure 12: Average EBITDA Purchase Price Multiple for US LBO Transactions
Source: S&P Capital IQ, LSE Research, Merlon Analysis
This trend is arguably symptomatic of cheap funding with credit spreads at cyclically
depressed levels.
Figure 13: US High Yield Credit Spread – 10 Year
Source: Barclays, Merlon Analysis
0
2
4
6
8
10
12
1980
1982
1984
1986
1988
1990
1992
1994
1996
1998
2000
2002
2004
2006
2008
2010
2012
2014
2016
Q2
17
0
5
10
15
20
25
Jan-
87
Jan-
89
Jan-
91
Jan-
93
Jan-
95
Jan-
97
Jan-
99
Jan-
01
Jan-
03
Jan-
05
Jan-
07
Jan-
09
Jan-
11
Jan-
13
Jan-
15
Jan-
17
As do private equity transactions…
And corporate debt…

Page | 11
Merlon Perspective Since we founded Merlon in 2010 we have consistently valued businesses on the basis of
sustainable cash flows discounted at sustainable interest rates and sustainable risk
premiums. We do not subscribe to the view that inflation is permanently lower than it has
been in the past but even if we did we would not be positioning the portfolio differently as
we think it would imply the parts of the Australian equity market to which our portfolio is
exposed are absurdly undervalued compared to bonds, property and so-called “low vol”
equities.
Our approach has increasingly positioned us away from many of the sectors that have
benefitted from falling interest rates which has created a short-term headwind for our
investors. We think this will reverse in time, at least in a relative sense.
It is also worth noting that we manage risk by hedging the portfolio using derivatives rather
than simply avoiding “risky” stocks. This allows us to contain portfolio risk to around 80% of
the ASX200 but at the same time avoid over-exposing our investors to “low vol” segments
of the market that we think are relatively expensive.
Page | 12
Digital vs Traditional Media – A Global Trend It has been challenging few years for traditional media companies globally with share of the
advertising pie increasingly allocated to digital players such as Facebook and Google. And
Australia has not been immune from this trend.
That said, we think there are signs that the rate of change may be slowing as advertisers
become more sceptical about how digital dollars are being spent, more focused on long
term brand health and more focused on data transparency.
Further, both locally and globally, advertisers are experiencing deteriorating brand strength
and revenues, possibly due to an over-allocation to digital relative to traditional brand
marketing.
Figure 14: Traditional Media spend % of total Advertising Spending – Australia, UK, US
Source: Group M, Merlon Estimates
Currently, spend on digital advertising represents around 47% of overall ad spending in the
Australian market. This compares to digital ad spend of 57% in the UK, 36% in the United
States.
While it is likely that Australia’s digital share will continue to trend up over time, we do note
that both Australia and the UK are higher than other comparable markets, especially the
US.
20.0%
30.0%
40.0%
50.0%
60.0%
70.0%
80.0%
90.0%
100.0%
110.0%
Aus Traditional MediaShare
UK Traditional MediaShare
US Traditional MediaShare
Analyst: Joey Mui
Traditional media share of ad spend declining in all markets

Page | 13
Australian TV Declines Over-extended When we look specifically at Television, there have been some pronounced differences in
market share between these markets. Arguably some of Australia’s TV ad share decline
can be attributed to impact of Netflix’s entry in 2015. Industry feedback has pointed towards
overconfidence in digital marketing due to superior headline return on investment (ROI)
data. Linear television has suffered disproportionately from the view that it is an expensive
and “old-fashioned” medium that is inferior to the “data-rich”, short term ROI digital
mediums.
Figure 15: TV Market Share of Advertising Spending
Source: Group M, Merlon Estimates
That said, there is some evidence that media buying agencies have been incentivised to
“over-index” to digital mediums. This issue has attracted a lot of attention in the US since
2010 and since then agencies have been subject to much more stringent audits of the way
clients’ funds are disbursed.
To understand the trajectory, it is worth recapping the evolution of digital marketing in
Australia as this is poorly understood and the history is highly instructive in understanding
the future trajectory.
15%
20%
25%
30%
35%
40%
45%
50%
2002
2003
2004
2005
2006
2007
2008
2009
2010
2011
2012
2013
2014
2015
2016
2017
Aus TV % of Total Spend
US TV % of Total Spend
UK TV % of Total Spend
Significant drop in TV share vastly different
UK Netflix entry
Aus Netflix entry
Australian TV advertising has had a horrid two years…

Page | 14
The Early Days of Digital Up until 2010, the majority of digital advertising sales between publishers and advertisers
were no different to traditional media sales. Advertisers would approach media buyers who
would buy inventory on their behalf adding value through leveraging their purchasing power
to buy large blocks of advertising at discounted prices.
A key issue with the model was the long tail of small publishers that media buyers were
unable to access for their clients. This led to the creation of the first “ad networks” which
allowed smaller publishers to pool inventory and access the market.
Early on, mainstream publishers and their agencies had vested interests in dismissing ad
networks as delivering ad impressions that were less effective and less transparent than
traditional mediums. This has meant that for many years mainstream publishers were able
to achieve prices for their inventory well above what might otherwise have been the case.
The Rise of Real Time Bidding At the same time, the rapid growth and enormous success of search engine marketing was
driving a push for increased transparency and effectiveness across all mediums. Search
advertisers were able to specifically target outcomes whereas display advertisers appeared
quite nonselective and haphazard by comparison.
More advertising was being transacted through Real-Time Bidding (RTB) methods and so
campaigns needed to be adjusted in real time rather than annually or quarterly.
Figure 16: Composition of Digital Advertising Spending – Australia
Source: SMI, Merlon Analysis
0%
10%
20%
30%
40%
50%
60%
70%
80%
90%
100%
Mobile
Social
Ad Networks
Video
Search
Other Display
For many years, traditional publishers were able to achieve over-inflated prices for their inventory…
But real time ad-networks brought much more inventory to market…

Page | 15
The Rise of “Ad Networks” & Incentives to Overweight Digital As discussed earlier, mainstream publishers and their agencies initially had vested interests
in dismissing ad networks as delivering ad impressions that were less effective and less
transparent than traditional mediums.
However, as time went on large publishers began to embrace ad networks as a means to
monetising excess inventory. At the same time, more sophisticated advertisers were
benefitting from shifting spend away from mainstream publishers.
When compared to traditional media buying fees, ad networks were earning very high
margins. Major agency holding companies sought to capture a portion of that margin for
themselves and their clients by establishing “trading desks”.
Figure 17: Ad Networks & Advertising Value Chain
Source: Terence Kawaja Presentation, 2010
While the specific business models vary, there are a number of common features of agency
trading desks and approaches to marking up other products and services that make them
very different from the way media buying agencies have traditionally operated.
The ad-network model was bad for publishers…

Page | 16
Figure 18: Composition of “Ad Network” Spending – Australia (A$m)
Source: SMI, Merlon Analysis
Instead of buying on behalf of clients as they have historically done, through agency trading
desks, media buyers are now buying as principals and then repacking and selling “product”
to clients. The result is reduced transparency for clients.
In some cases, agencies can profit from the spread between their cost price and what they
resell to their clients even without bearing significant risk. In the US, this is referred to as
“media arbitrage”. The practice of buying ahead of clients and on-selling marked up media
inventory to them is akin to stockbrokers “front-running” clients in the share market, the
latter of which is illegal in most countries.
In US and Europe, this concern over transparency and arbitrage has been rising since 2014
and has contributed to reductions in the growth of arbitrage “pass-through” revenue
reported by global agencies. For now, Australian companies seem less focused on
enforcing transparency requirements with “trading-desk” spend continuing to expand over
the same period. (See Figure 18)
0
100
200
300
400
500
600
2007 2008 2009 2010 2011 2012 2013 2014 2015 2016 2017
Exchanges
Ad Networks
…and good for ad agencies

Page | 17
Figure 19: US Ad network/trading desk revenues under pressure post-2015
Source: SMI, Merlon Analysis
Regardless of whether these revenue models represent good value for advertisers, the
reality is agencies (or their holding companies) have a financial interest in certain outcomes
(i.e. more digital display advertising) and these interests are not always fully disclosed and
understood by all clients.
A pull-back from short termism? We agree that headline ROI and targeted reach of digital is an attractive proposition.
However, we believe the effectiveness of overall marketing spend is still dependent on an
allocation across mediums to meet both short and long term goals. We also think some
features of the agency model have led to over indexation of digital.
Where linear television’s share matures long term is debatable but we think it would be
foolish to assume free-to-air television has zero relevance in the “digital age” and equally
foolish to assume free-to-air businesses cannot adapt to the digital environment.
Simplistically, marketing activity can be divided into two components:
1. Sales Activation: Marketing that aims to generate short term sales uplift via
promotional campaigns. The advantage is that the impact of spending is immediately
measurable through sales activity during a campaign.
2. Brand Building: Marketing spend that is targeted to drive a longer term, more
emotional connection with a brand. This is essential not only for the target market
but also to develop brand awareness amongst future consumers and loyalty
amongst existing customers. Brand building and loyalty are not easily measured by
short term ROI metrics.
24%
25%
26%
27%
28%
29%
30%
31%
2013 2014 2015 2016 2017
AdNetwork/Adexchange %total digitalspend
Agencies have a financial interest in selling “packaged” digital media…
USA ahead of the curve on trading desk scrutiny…

Page | 18
Figure 20: Sales & Activation & Loyalty in Advertising
Source: Effectiveness in the digital era. 2016, Binet & Field IPA
As marketing budgets get tighter (and CEO tenures shorter), there is an incentive for
companies to reduce brand building spend in favour of sales activation via digital
marketing. This strategy can provide short-term sales uplift and strong ‘return on
investment’ but doesn’t do much in terms of brand building, acquisition of future customers
and building a platform for sustainable growth.
Given Merlon’s focus on assessing sustainable free-cash-flow, we play close attention to
both the level and composition of marketing expenditure. There are many examples of
companies that have underinvested in brand marketing only to find themselves struggling
for growth and then (often under a new CEO) “resetting” budgets at much higher levels.
Added to potential under-investment in brand are the increasingly conflicted business
models of agency “partners” who are incentivised to over allocate spending to packaged
digital “products” rather than simply negotiate the best possible deals with publishers as
has historically been the case.
Research and industry feedback rates television as the best medium for brand building due
to its mass appeal and the degree of trust relative to digital content. Brand building requires
a broad reach which has traditionally been the key advantage of television and
newspapers. With newspaper readership declining at an even faster pace, TV remains the
last medium with mass market reach available to advertisers.
TV best in class adjusted ROI On top of the increasingly opaque pricing of digital advertising, concerns about
effectiveness have also been raised, specifically the difficulty in assessing actual
viewership and retention. Given the positioning of digital display around content, it is difficult
to track whether eyeballs actually view advertising and whether this translates to real
audience outcomes. By sharing “pixel coverage” on the screen with other content this can
There has been less investment in brand building in recent years…

Page | 19
reduce the effectiveness of digital display advertising compared to television which
commands 100% of pixels during an advertisement.
“Independent” research by Ebiquity measured the impact of TV over 3 years compared to
other media mediums. It found that TV is best in class for ROI by measuring actual sales
instead of hypothetical customer reach per dollar spend. Of note, online display is the worst
medium despite agency “exchanges” being most active in this category at present.
Figure 21: Overall Efficiency: Media Channel ROI Indexed to TV
Source: Ebiquity
The study also found that TV continues to influence customers post-campaign for the
longest length of time relative to other mediums.
Figure 22: Average Retention Rate
Source: Ebiquity
We are well aware that funding for the Ebiquity study is provided by ThinkTV who are in
turn supported by Australia’s free-to-air TV networks. ThinkTV provide research and data
on television’s effectiveness as an advertising medium. However, there are studies in other
countries which have yielded broadly similar results. While the measurement of “ROI” is
TV has its merits…
And tends to provide more enduring outcomes…

Page | 20
often a subjective exercise, it is clear the past perception of TV’s ROI has been significantly
poorer than reality and the release of the Ebiquity statistics are supportive of improving
sentiment.
Signs of improvement Contrary to general market perception, free-to-air television’s share of ad spending has
stabilised and grown in the past 12 months. This stabilisation may be associated with the
provision of data and research by ThinkTV, which commenced in May 2016. This helps
marketing departments and advertising agencies justify a reallocation of funding towards
TV using evidence based metrics.
Figure 23: TV Market Share of Advertising Spending - Australia
Source: SMI, Merlon Analysis
We also believe that companies, both locally and globally are becoming more sceptical
about how their digital dollars are being spent and the lack of transparency in agency
pricing models. Based on our research, Australia is behind other markets from this
perspective.
Further, both locally and globally, advertisers are beginning to see the impact of the over-
allocation to digital on their brand strength and longer term sales trends. Global consumer
corporations, Unilever and Procter & Gamble, have been vocal in their reduction of digital
marketing due to lack of transparency and effective delivery. Increasing issues around
customer data privacy and potential brand damage from uncontrolled content are creating
concern amongst both brand owners and customers.
At the same time, television networks have not remained stagnant in the face of digital
platform competition. They have reduced costs and debt, and have invested in digital
BVOD (broadcaster video-on-demand) to meet the changing preferences of their
15%
20%
25%
30%
35%
40%
45%
0
50
100
150
200
250
Jan-
07
Aug-
07
Mar
-08
Oct
-08
May
-09
Dec-
09
Jul-1
0
Feb-
11
Sep-
11
Apr-
12
Nov
-12
Jun-
13
Jan-
14
Aug-
14
Mar
-15
Oct
-15
May
-16
Dec-
16
Jul-1
7
Feb-
18
TV Industry Share Ad Dollars
The TV market appears to have stabilised over the last 12 months…

Page | 21
audiences. There is enormous opportunity for free-to-air players to increase the rates they
charge if the can more actively target particular audiences.
Sports Rights Need to Share in Structural Decline Australian free to air television companies benefit greatly from anti-siphoning legislation of
major sporting events that effectively shuts out subscription businesses such as Foxtel and
Netflix from bidding for sporting events of ‘national interest’.
For years we have struggled with the game theory of why free-to-air broadcasters compete
so hard for sports rights given that they operate under this umbrella of protection. Given
Channel Ten’s lower audience share, Channel Seven’s AFL and debt commitments and
general commentary from the various players, we had expected a more rational approach
to bidding for sports rights.
To this end, we have been somewhat dismayed by Channel Nine bidding 50% more than
Channel Seven’s previous bid for the Australian Open and will continue to test our theory of
rational competitive behaviour.
Ratings Remain Difficult to Predict We remain cautious about trying to forecast TV ratings which are the primary driver
revenue share. While we believe there is a degree of mean regression in ratings over time,
it remains difficult to forecast future audience preferences and each networks ability to cater
for these preferences in an economical manner. On an individual stock basis, the potential
for a permanent fall in ratings share contributes to each stock’s downside risk but at a
portfolio level this is a zero sum game.
Other constraints such as financial leverage can limit TV players from competing for quality
content to help driving ratings. These have impacted both Nine and Ten in recent years and
present pose a risk to Seven who hold $725m of net debt.
Figure 24: Revenue Market Share of TV Advertising Dollars
Source: SMI, Merlon Analysis
0.0%
10.0%
20.0%
30.0%
40.0%
50.0%
60.0%
Jan-
07
Oct
-07
Jul-0
8
Apr-
09
Jan-
10
Oct
-10
Jul-1
1
Apr-
12
Jan-
13
Oct
-13
Jul-1
4
Apr-
15
Jan-
16
Oct
-16
Jul-1
7
Seven
Nine
TenTV network market shares can be volatile
We have struggled with why free-to-air broadcasters compete so hard for sports rights…

Page | 22
Listed Company Valuations Reflect Very Low Expectations Nevertheless, we believe that the improvement in data and potential upside from positive
industry developments are underappreciated by stock market investors. The spread in TV
stock EV/EBITDA’s relative to the overall share market remains wide and is even wider
when we consider these businesses’ relatively high conversion of EBITDA to free-cash-
flow, our preferred measure of value.
Figure 25: Headline Valuation Multiples
Source: Bloomberg, Merlon Analysis
Given the poor momentum of television in recent years and the ongoing headwind from
digital mediums, it is easy for the market to hold a negative view of the sector.
Fund positioning We acknowledge it is uncertain whether TV’s share of advertising spending represents a
cyclical pullback or a permanent stabilisation. However, we believe there are some
underlying drivers at play that could tilt advertisers back to the medium. The flight of
advertising dollars from Australian TV has been significantly more exuberant relative to
other developed markets and agencies have continued to gouge on “packaged” digital
products while their offshore counterparts have pulled back due to customer backlash.
As such, we think there is some likelihood the rate of decline moderates. TV operators are
actively defending their medium via evidence-based research which looks to be positive in
recent advertising spend share metrics.
Uncertainty can offer opportunity as many in the market are unwilling to invest in
companies with perceived structural challenges. We believe that at current prices,
expectations for further declines are more than priced in for television stocks that are
trading at a significant discounts to even the most bearish valuation scenarios.
0
5
10
15
20
25
ASX200 EV/EBITDA
SWM EV/EBITDA
NEC EV/EBITDA
TEN EV/EBITDA
SXL EV/EBITDA
PRT EV/EBITDA
Yet the TV stocks continue to trade at heavily discounted valuations…
Page | 23
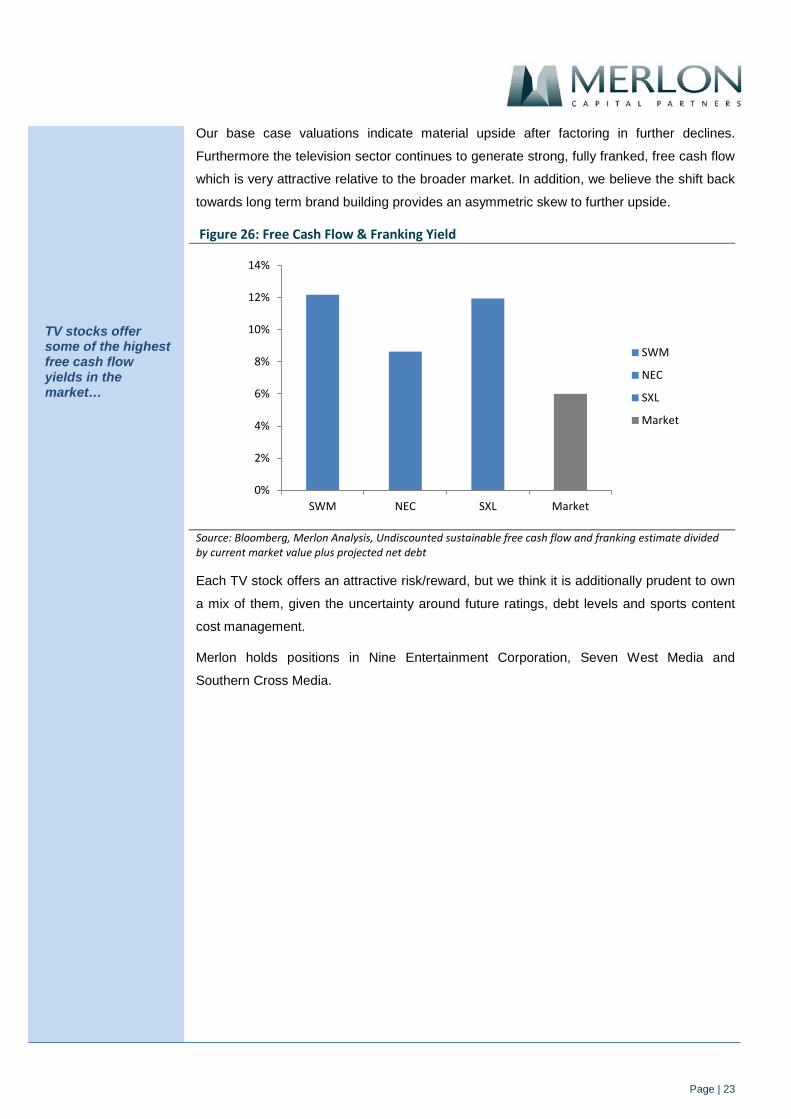
Our base case valuations indicate material upside after factoring in further declines.
Furthermore the television sector continues to generate strong, fully franked, free cash flow
which is very attractive relative to the broader market. In addition, we believe the shift back
towards long term brand building provides an asymmetric skew to further upside.
Figure 26: Free Cash Flow & Franking Yield
Source: Bloomberg, Merlon Analysis, Undiscounted sustainable free cash flow and franking estimate divided by current market value plus projected net debt
Each TV stock offers an attractive risk/reward, but we think it is additionally prudent to own
a mix of them, given the uncertainty around future ratings, debt levels and sports content
cost management.
Merlon holds positions in Nine Entertainment Corporation, Seven West Media and
Southern Cross Media.
0%
2%
4%
6%
8%
10%
12%
14%
SWM NEC SXL Market
SWM
NEC
SXL
Market
TV stocks offer some of the highest free cash flow yields in the market…

Page | 24
Market Outlook and Portfolio Positioning
Based on Merlon's bottom-up assessment of long-term cash-flow based value, discounted
at through-cycle discount rates, the market remains around 10% overvalued post the recent
pull-back (Figure 27). There continues to be a wide dispersion across sectors, with
resources, healthcare, property and infrastructure overvalued relative to other parts of the
market. In this quarterly report, we also reflect on asset prices more broadly and conclude
equities might well be the ‘least worst’ option if inflation and interest rates normalise as we
expect.
Figure 27: Merlon bottom up market valuation vs ASX200 level
Source: Merlon
Merlon's value portfolio comprises our best research ideas, based on our long-term
valuations and analyst conviction. The portfolio continues to offer 20% absolute upside
representing a 30% premium to the market. As seen in Figure 28, the Merlon portfolio is
looking attractive relative to the capitalisation-weighted index.
Figure 28: Expected return based on Merlon valuations
Source: Merlon
3000
3500
4000
4500
5000
5500
6000
6500Merlon Bottom-Up Index Level ASX200
Undervalued
Overvalued
-20%
-10%
0%
10%
20%
30%
40%
50%
60%
Mar-12 Mar-13 Mar-14 Mar-15 Mar-16 Mar-17 Mar-18
Merlon Portfolio ASX200
Neil Margolis
Market more than 10% overvalued using consistent bottom-up approach…
However our value portfolio is showing upside in absolute terms and relative to the market

Page | 25
We invest on the basis that, over time, inflation and by implication interest rates will revert
back to long term levels. This will put pressure on 'defensive yield' and ‘bond proxy’ names
to which the portfolio has relatively little exposure. Even if rates were to remain low, we
would expect this to lead to a re-rating of our investments given their strong cash flow
appeal.
The United States appears more progressed in the journey towards higher interest rates
than Australia with increasingly clear signs of wage pressures and inflation. The Federal
Reserve is likely to continue increasing interest rates over the next 12 to 18 months.
The divergent path of US and Australian interest rates coupled with our cautious outlook for
commodities (Some Thoughts on the Iron Ore Market) lead us to expect depreciation in the
Australian dollar. Our positions in Magellan Financial, News Corporation, QBE Insurance, Origin Energy and Clydesdale Bank should benefit against this backdrop.
A weaker Australian dollar will provide a necessary offset to housing construction activity
and house prices that, at some point, will also revert back to mid-cycle levels (Some
Thoughts on Australian House Prices). In conjunction with unprecedented strength in
household balance sheets driven by recent house price inflation, the potential flex in the
currency gives us some comfort that the outlook for the domestic economy, and by
implication the discretionary retailers and media companies, may not be as bad as what is
currently priced into the stocks. Further, after reviewing key differences between Australia
and other markets, we believe the impact of Amazon is being overplayed and continue to
see value in the discretionary consumer sector (Amazon Not Introducing Internet to
Australia).
Our non-benchmark approach means we are content holding no major banks when the
market is overly complacent about their risks and equally are happy to invest in them when
the market is overly concerned – as is the case now. While political risks, such as the Royal
Commission, cannot be ignored, we do not believe they will have a permanent impact on
industry returns and cash flow generation. However, we do expect credit growth to slow,
further loan repricing outside of a credit cycle to be limited and bad debts to rise towards
mid-cycle levels. All this leaves the banks as moderately undervalued in an expensive
market.
Portfolio Aligned to Value Philosophy and Fundamental Research
As we discuss above, there are clearly some macro themes built into the portfolio.
However, these are outcomes of a strategy to invest in companies that are under-valued
relative to their sustainable free cash flow and the franking credits they generate for their
owners. The market’s continued tendency to extrapolate short-term conditions too far into
the future; participants’ fear of forecasting a meaningful change in earnings power; and,
investors’ focus on nonsensical measures of corporate financial performance instead of
cash flow continue to present us with opportunities.
The Mandate invests in ‘unloved’ companies where sustainable cash flow is being under-appreciated
The outlook for the domestic economy is not as dire as many
fear

Page | 26
The portfolio reflects our best bottom-up fundamental views rather than macro or sector-
specific themes. These are usually companies that are under-earning on a three year view,
or where cash generation and franking are being under-appreciated by the market.
Figure 29: Top ten holdings (gross weights)
Source: Merlon
Our larger investments are typically in companies 'unloved' by the market but current prices
can be justified by the higher quality and more predictable parts of their businesses.
The supermarket operators, Woolworths and Wesfarmers, are generating good cash-
flows by competing rationally on convenience, range and value, not just price. We may
have seen the worst in terms of industry price deflation, with Aldi market share maturing
and Coles likely to be more rational as a separate listed entity. The Royal Commission
might constrain sales commissions to mortgage brokers, perversely favouring incumbent
retail banks with strong branch footprints such as Commonwealth Bank, Westpac and
Suncorp. We continue to see current retail bank returns as more sustainable than
consensus given the near doubling of mortgage capital in recent years and re-pricing linked
to regulatory handbrakes applied to investor lending. Caltex is shifting to lower capital
intensity within an improving industry structure; News Corporation is shifting from
advertising to digital subscriptions and has net cash on balance sheet; AMP is exiting its
capital intensive lower returning insurance segment and focusing on more cash generative
funds management and advice; QBE Insurance has valuation support assuming minimal
value outside of the domestic Australian and Lloyds businesses; and Magellan Financial generates strong and growing cash-flows with upside from performance fees, a debt-free
balance sheet and USD-denominated Funds Under Management (FUM).
0%
1%
2%
3%
4%
5%
WES CTX WOW WBC CBA SUN NWS AMP MFG QBE
The non-benchmark portfolio comprises only undervalued companies where we have conviction around market
misperceptions

Page | 27
Figure 30: Portfolio exposures by sector (gross weights)
Source: Merlon
Some of our research ideas with the most valuation upside do not appear in the top 10 in
terms of size as they are constrained by liquidity. These include, among others, Seven West Media, Southern Cross Media, Virtus Health and Sky TV New Zealand.
At quarter end, the hedge overlay was slightly above target at 33% reduction in market
exposure while the portfolio remained fully invested in our best value ideas for the purposes
of generating franked dividend income. The overlay is structural rather than tactical but
does offer protection in the event markets have risen ahead of fundamentals in the short-
term.
Figure 31: Portfolio Analyticsiv
Fund ASX200
Number of Equity Positions 29 200
Active Share 75% 0%
Merlon Valuation Upside 20% -11%
EV / EBITDA 9.1x 11.6x
Price / Earnings Ratio 14.7x 16.8x
Trailing Free Cash Flow Yield 5.3% 5.3%
Distribution Yield (inc franking) 7.0% 5.9%
Net Equity Exposure 67% 100%
Source: Merlon
-10%
0%
10%
20%
30%
40%Fundamental Equity Portfolio Hedge Overlay ASX200
The hedge overlay offers material
downside protection

Page | 28
March Quarter Portfolio Activity
During the quarter we introduced two new investments.
We re-initiated a small position in Spark Infrastructure, the most undervalued of the utility
and infrastructure companies in our view. Bond proxy stocks have underperformed more
generally as interest rates have begun normalising from record low levels, and we have had
no exposure for several years. With Spark, we are attracted to the larger contribution from
non-regulated earnings compared to Ausnet. From a free cash flow perspective, these
earnings are less capital intensive than the regulated business and support sustainable
returns above cost of capital. The two core monopoly assets (Victoria Power Networks and
SA Power Networks) do not face regulatory resets until 2020 and we value the Transgrid
investment well below what Spark actually paid in 2015.
We invested in Nine Entertainment Corporation, the free to air television and digital news
provider. Nine’s free to air television market has been affected by a structural shift in
audience numbers and advertising away from traditional media towards digital alternatives.
This structural decline has resulted in the company’s market value trading towards the
lower end of a sensible range of sustainable free cash flow scenarios. There is some
evidence advertisers are becoming more discerning about over-allocating spend towards
digital. This could support a better outcome for television’s share of the advertising pie
going forward and we explore this in more detail in this report. Also, we are of the view
television margins can be maintained based on more rational bidding for sports content
rights
We continued to invest in existing positions, Seven West Media, Southern Cross Media,
and Wesfarmers, and also added to bank positions; Bendigo Bank, Commonwealth Bank and Westpac, following material underperformance given our long-term cash-flow
based valuations have remained broadly stable.
We funded these investments by trimming our positions in Coca Cola Amatil, Harvey Norman, Navitas and Origin Energy, all of which had outperformed as market concerns
around their lower growth or higher risk profiles had dissipated.
We introduced new investments in Spark Infrastructure and Channel Nine
Funded by trimming positions with reduced valuation upside post
outperformance

Page | 29
Performancei (%) (after fees, inc. franking) Month Quarter FYTD Year 3 Years
(p.a.) 5 Years (p.a.)
7 Years (p.a.)
10 Years (p.a.)
Fund Total Return -2.8 -3.7 1.8 3.3 6.3 7.9 8.5 6.8
ASX200 -3.6 -3.4 5.4 4.0 5.2 9.2 8.8 6.9
Average Daily Exposure 68% 69% 68% 68% 69% 69% 70% 71%
Gross Distribution Yield 0.7 1.9 5.4 7.0 7.5 7.7 8.9 9.1
Past performance is not a reliable indicator of future performance. Total returns above are grossed up for franking credits. Gross Distribution Yield represents the income return of the fund inclusive of franking credits. Portfolio inception date is 30/09/05.
Figure 32: Rolling Seven Year Risk vs. Return (%p.a.)ii
Source: Merlon
March Quarter Market Review
The market posted its weakest quarter in 2 years, retreating 3.4% (including franking) in the
March quarter. US 10 years bonds climbed 33 basis points but the yield curve flattened
slightly with 2 year bonds rising by more. Interestingly, the US 10 year bond yield crossed
over its Australian equivalent for the first time since 1998 (see Figure 3 – Some Thoughts
on Asset Prices). Oil prices rose 7% (up 40% financial year to date) but bulk commodities
declined, with iron ore down 14% in the quarter. The AUD proved remarkably resilient.
According to RP Data, house prices declined 1% with Sydney 2% down over the quarter.
Healthcare and Consumer Staples were the best performing sectors, with Telcos worst
performing yet again. Banks continue to lag with intensifying political heat and rising short-
term funding costs. Real Estate Investment Trusts (REITs) & Infrastructure stocks also
lagged despite the VIX volatility index soaring 81%, with US long bond yields proving too
much of a headwind. Small caps continue to re-rate, with the ASX100 now trading at a
record 20% discount to ex-ASX100 stocks.
Cash
ASX200
Merlon Fund (net of fees)
0%
2%
4%
6%
8%
10%
0% 20% 40% 60% 80% 100%
Ann
ualis
ed R
etur
n
% of ASX200 Risk*

Page | 30
Portfolio Performance Review
The Fund fell 3.7% (net of fees and inclusive of franking) during the quarter, slightly behind
the market’s fall. The hedge overlay added 1.6% for the quarter, insulating the Fund from a
large proportion of the fall, however this did not offset underperformance from the
underlying share portfolio.
Coca Cola Amatil was the best performing holding after the sparkling volume decline rate
slowed and the impact of the NSW container deposit scheme was less than feared. JB Hi Fi outperformed on better than expected Christmas trading and a soft Amazon launch.
Vocus was not held and underperformed on a poor cash flow result, NBN competition, high
capital expenditure commitments and a sizeable debt burden. Tabcorp was not held and
underperformed with the core business missing expectations and the market beginning to
share our scepticism on Tatts merger synergies. Nine Entertainment Corporation
rounded out the top contributors, benefitting from ratings and share gains, as well as early
signs the overall television advertising market might be stabilising.
Fletcher Building was the biggest detractor after the company announced material
contract losses, renegotiation of debt covenants and a broad portfolio review under the new
CEO. Amaysim underperformed following an expectedly weak interim result amidst intense
competition in the mobile market. Bendigo Bank underperformed in-line with the bank
sector, together with share losses and a rise in bad debts, albeit still at relatively low levels.
Not holding A2 Milk and Flight Centre rounded out the five largest detractors for the
quarter in a relative sense.
Financial year to date, the Fund has substantially lagged the market’s 5.4% return. This
reflects 2.4% underperformance from the underlying share portfolio, with the hedge overlay
also detracting 0.5% given the positive Fund return overall.
On a seven year rolling basis, the Fund is only 0.3% behind the market’s 8.8% per annum
return (after fees and including excess franking) with a materially lower risk profile. Again,
this reflects very favourably on underlying stock selection which is 3.0% per annum above
the ASX200. The structurally lower risk profile is demonstrated by the daily average market
exposure of 70% and the seven year monthly beta of 0.70.
The Fund underperformed due to exposures to Fletcher Building, Amaysim & Bendigo
Bank

Page | 31
The additional performance information below is presented on a financial year basis and
should be read in conjunction with the summary performance table on page 29.
Additional Performance Detail: Sources of Return
FY Performancei (%) (inc. franking) FYTD18 2017 2016 2015 2014 2013 2012
7 Years (p.a.)
Underlying Share Portfolio 3.0 23.5 7.0 9.5 16.3 36.0 -3.4 11.7
Hedge Overlay -0.5 -5.6 -0.9 -1.7 -3.5 -9.3 2.6 -2.2
Fund Return (before fees) 2.5 17.9 6.1 7.8 12.8 26.7 -0.8 9.5
Fund Return (after fees) 1.8 16.8 5.1 6.8 11.8 25.6 -1.7 8.5
FY Performancei (%) (before fees, inc. franking) FYTD18 2017 2016 2015 2014 2013 2012
7 Years (p.a.)
Underlying Share Portfolio 3.0 23.5 7.0 9.5 16.3 36.0 -3.4 11.7
ASX200 5.4 15.5 2.2 7.2 18.9 24.3 -5.1 8.8
Excess Return -2.4 8.0 4.8 2.3 -2.7 11.7 1.7 3.0
FY Performancei (%) (after fees) FYTD18 2017 2016 2015 2014 2013 2012
7 Years (p.a.)
Income 4.0 6.2 5.9 5.6 5.8 7.8 7.6 6.9
Franking 1.4 1.6 2.1 1.9 1.7 2.3 2.5 2.1
Growth -3.6 9.0 -2.9 -0.7 4.3 15.5 -11.8 -0.5
Fund Return (after fees) 1.8 16.8 5.1 6.8 11.8 25.6 -1.7 8.5
FY Performancei (%) (after fees, inc. franking) FYTD18 2017 2016 2015 2014 2013 2012
7 Years (p.a.)
Fund Return (after fees) 1.8 16.8 5.1 6.8 11.8 25.6 -1.7 8.5
70% ASX200/30% Bank Bills 4.2 11.3 2.2 6.0 14.0 17.8 -2.1 7.1
Excess Return -2.4 5.5 2.9 0.8 -2.2 7.7 0.4 1.4

Page | 32
Monthly Distribution Detail: Cents per Unit
Jul Aug Sep Oct Nov Dec Jan Feb Mar Apr May Jun Total Franking
FY2013 0.50 0.50 0.50 0.50 0.50 0.50 0.50 0.50 0.50 0.50 0.50 1.29 6.79 2.26
FY2014 0.51 0.51 0.51 0.51 0.51 0.51 0.51 0.51 0.51 0.51 0.51 0.52 6.13 1.98
FY2015 0.52 0.52 0.52 0.52 0.52 0.52 0.52 0.52 0.52 0.52 0.52 0.52 6.24 2.20
FY2016 0.53 0.53 0.53 0.53 0.53 0.53 0.53 0.53 0.53 0.53 0.53 0.52 6.35 1.92
FY2017 0.53 0.53 0.53 0.53 0.53 0.53 0.53 0.53 0.53 0.53 0.53 0.53 6.36 2.02
FY2018 0.53 0.53 0.53 0.53 0.53 0.53 0.53 0.53 0.53 0.53 0.53 0.53 6.36 1.85
Highlighted data are estimates at the date of this report.
Figure 33: Monthly Income from $100,000 invested in July 2012iii
Source: Merlon, excludes bonus income in FY13
Iron Ore is Well Above Sustainable Levels
Some Thoughts on Australian House Prices
Value Investing - An Australian Perspective: Part I
Value Investing - An Australian Perspective: Part II
Value Investing - An Australian Perspective: Part III
Boral's High Priced Acquisition of Headwaters
Amazon Not Introducing Internet to Australia
The Case for Fairfax Media Over REA Group
Telstra Revisited
Oil: The Cycle Continues
$0
$250
$500
$750 Normal Declared
FY13$8,845
FY14$8,673
FY15$9,037
FY16$8,861
FY17$8,967
FY18(f)$8,791
Monthly income will be 0.53 cents per unit at least through to May 2018…
and the franking level is projected to be in the 70-80%
range

Page | 33
Fund Details
Fund size $ 537m Merlon FUM $ 1,600m
APIR Code HBC0011AU Distribution Frequency Monthly
ASX Code MLO02 Minimum Investment $ 10,000
Inception Date 30 September 2005 Buy / Sell Spread +/- 0.20%
About Merlon
Merlon Capital Partners is an Australian based fund manager established in May 2010. The business is majority
owned by its five principals, with strategic partner Fidante Partners Limited providing business and operational
support.
Merlon’s investment philosophy is based on:
Value: We believe that stocks trading below fair value will outperform through time. We measure value by
sustainable free cash flow yield. We view franking credits similarly to cash and take a medium to long term view.
Markets are mostly efficient: We focus on understanding why cheap stocks are cheap, to be a good investment
market concerns need to be priced in or invalid. We incorporate these aspects with a “conviction score”
About the Fund
The Merlon Australian Share Income Fund’s investment approach is to construct a portfolio of undervalued
companies, based on sustainable free cash flow, whilst using options to overlay downside protection on holdings with
poor short-term momentum characteristics. An outcome of the investment style is a higher level of tax-effective
income, paid monthly, along with the potential for capital growth over the medium-term.
Differentiating Features of the Fund
• Deep fundamental research with a track record of outperformance. This is where we spend the vast majority of
our time and ultimately how we expect to deliver superior risk-adjusted returns for investors.
• Portfolio diversification with no reference to index weights. The benchmark unaware approach to portfolio
construction is a key structural feature, especially given the concentrated nature of the ASX200 index.
• Downside protection through fundamental research and the hedge overlay. In addition to placing a heavy
emphasis on capital preservation through our fundamental research, we use derivatives to reduce the Fund’s
market exposure and risk by 30% whilst still retaining all of the dividends and franking credits from the portfolio.
• Sustainable income, paid monthly and majority franked. As the Fund’s name suggests, sustainable above-
market income is a key objective but it is an outcome of our investment approach.

Page | 34
Footnotes
i Performance (%) Average Daily Market Exposure is calculated as the daily net market exposure divided by the average net asset value of the Fund. Fund Franking : Month 0.2%, Qtr 0.6.%, FYTD 1.4%, Year 1.6%, 3 Years 1.7% p.a., 5 Years 1.8% p.a., 7 Years 2.1% p.a., 10 Years 2.2% p.a. ASX200 Franking: Month 0.2%, Qtr 0.5%, FYTD 1.2%, Year 1.5%, 3 Years 1.5% p.a., 5 Years 1.5% p.a., 7 Years 1.5% p.a.,10 Years 1.5% p.a.
ii Rolling Five Year Performance History Past performance is not a reliable indicator of future performance. Returns for the Fund and ASX200 grossed up for accrued franking credits and the Fund return is stated after fees as at the date of this report, assumes distributions are reinvested. % of ASX200 Risk represents the Fund’s statistical beta relative to the ASX200
iii Monthly Income from $100,000 invested in July 2012 Past performance is not a reliable indicator of future performance. Income returns exclude ‘bonus income’ from above-normal hedging gains of $849 in FY13 and assume no bonus income in FY18 estimate. Income includes franking credits of; $2,420 (FY13), $2,120 (FY14), $2,356 (FY15), $2,057 (FY16), $2,159 (FY17) and $1,981 (FY18 estimate).
ivPortfolio Analytics Source: Merlon, Active share is the sum of the absolute value of the differences of the weight of each holding in the portfolio versus the benchmark, and dividing by two. It is essentially stating how different the portfolio is from the benchmark. Net equity exposure represents the Fund’s net equity exposure after cash holding’s and hedging Beta measures the volatility of the fund compared with the market as a whole. EV / EBITDA equals a company's enterprise value (value of both equity and debt) divided by earnings before interest, tax, depreciation, and amortization, a commonly used valuation ratio that allows for comparisons without the effects of debt and taxation.
Disclaimer Any information contained in this publication is current as at the date of this report unless otherwise specified and is provided by Fidante Partners Ltd ABN 94 002 835 592 AFSL 234 668 (Fidante), the issuer of the Merlon Australian Share Income Fund ARSN 090 578 171 (Fund). Merlon Capital Partners Pty Ltd ABN 94 140 833 683, AFSL 343 753 is the Investment Manager for the Fund. Any information contained in this publication should be regarded as general information only and not financial advice. This publication has been prepared without taking account of any person’s objectives, financial situation or needs. Because of that, each person should, before acting on any such information, consider its appropriateness, having regard to their objectives, financial situation and needs. Each person should obtain a Product Disclosure Statement (PDS) relating to the product and consider the PDS before making any decision about the product. A copy of the PDS can be obtained from your financial planner, our Investor Services team on 133 566, or on our website: www.fidante.com.au. The information contained in this fact sheet is given in good faith and has been derived from sources believed to be accurate as at the date of issue. While all reasonable care has been taken to ensure that the information contained in this publication is complete and accurate, to the maximum extent permitted by law, neither Fidante nor the Investment Manager accepts any responsibility or liability for the accuracy or completeness of the information.