Merit Order of Energy Storages by 2030 The Impact of ... · 33 Key Issues Which system...
43
1 Merit Order of Energy Storages by 2030 The Impact of Technological Megatrends on Future Electricity Prices Berlin, November 27, 2012
-
Upload
duongkhuong -
Category
Documents
-
view
213 -
download
0
Transcript of Merit Order of Energy Storages by 2030 The Impact of ... · 33 Key Issues Which system...
1
Merit Order of Energy Storages by 2030
The Impact of Technological Megatrends on Future Electricity Prices
Berlin, November 27, 2012
2 2
Agenda
Project Structure
The Concept of the „Functional Energy Storage“
Technological Megatrends
Limitations in Price Fluctuations
3 3
Key Issues
Which system infrastructure is most favorable under
given framework conditions from a cost perspective for
the electricity supply system?
Which promotions have to be developed so that a
favorable system infrastructure can be established on
the market?
4
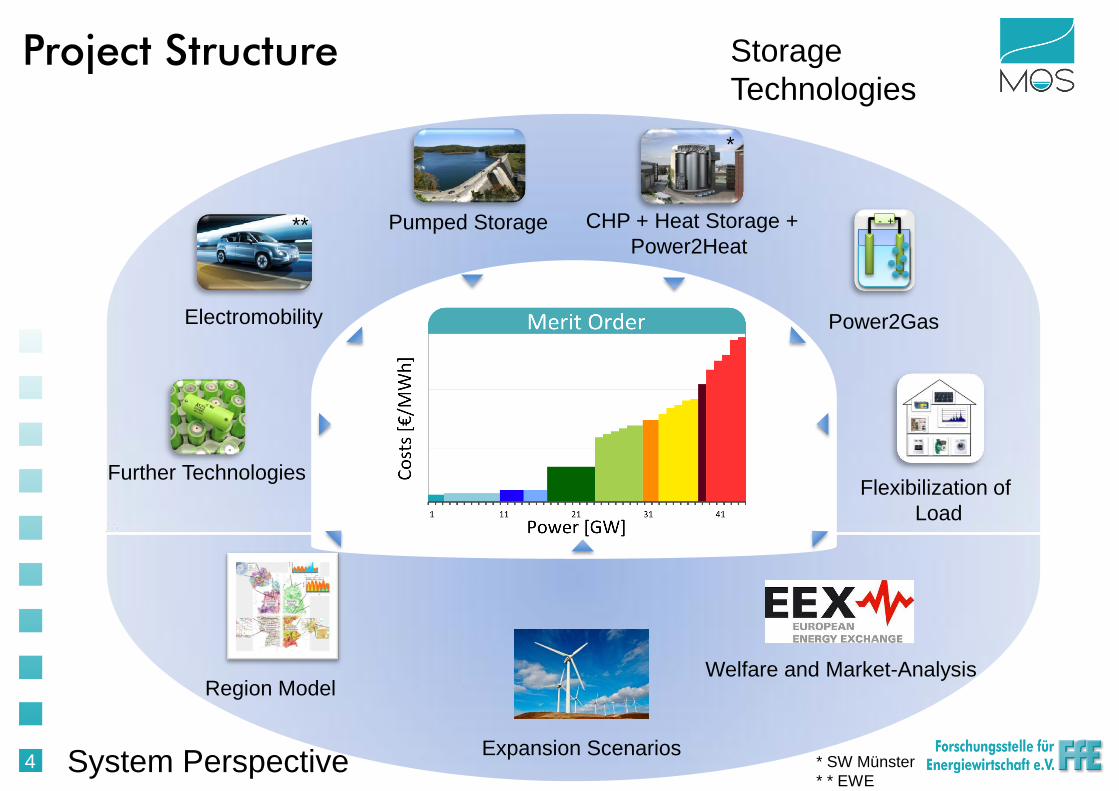
Project Structure
Electromobility
Pumped Storage CHP + Heat Storage +
Power2Heat
Flexibilization of
Load
+ -
Power2Gas
Further Technologies
Region Model
Expansion Scenarios
Welfare and Market-Analysis
Storage
Technologies
System Perspective
*
* SW Münster
* * EWE
**

5 5
Definition „Functional Energy Storage“
6 6
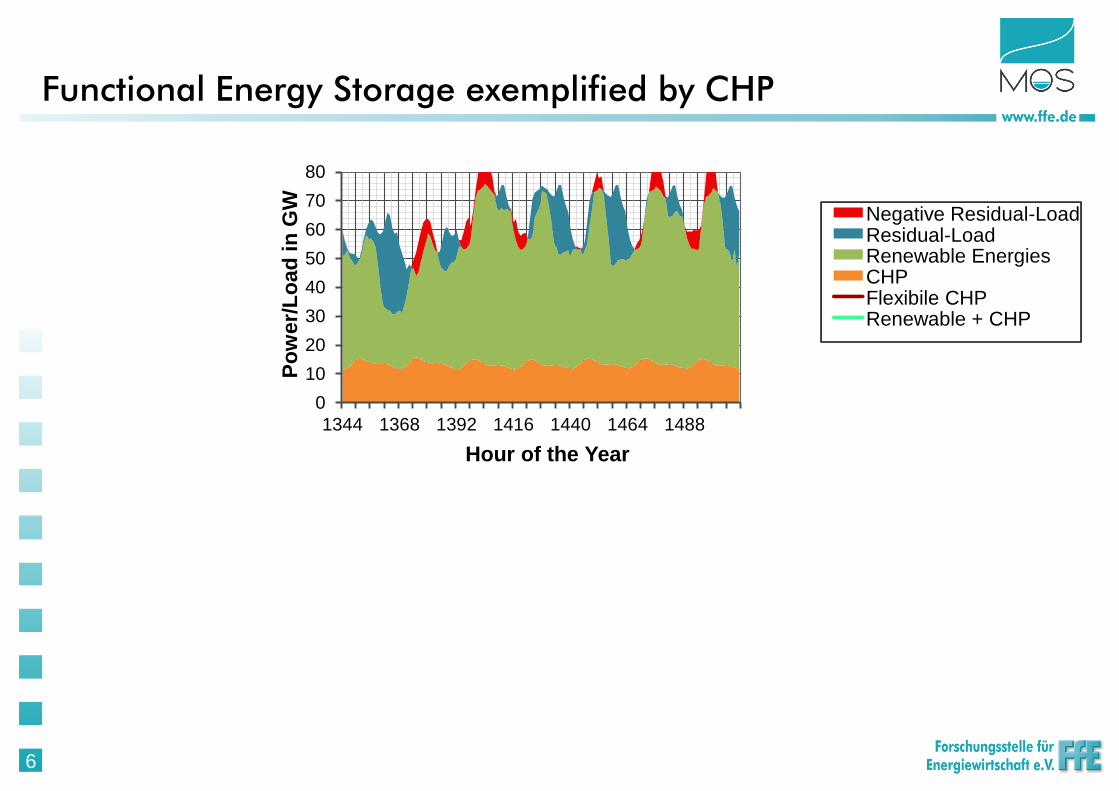
Functional Energy Storage exemplified by CHP
0
10
20
30
40
50
60
70
80
1344 1368 1392 1416 1440 1464 1488
Le
istu
ng
/La
st
in G
W
Stunde im Jahr
0
10
20
30
40
50
60
70
80
1344 1368 1392 1416 1440 1464 1488
Leis
tun
g/L
ast
in G
W
Stunde im Jahr
0
10
20
30
40
50
60
70
80
1344 1368 1392 1416 1440 1464 1488
Leis
tun
g/L
ast
in G
W
Stunde im Jahr
Negative Residual-Load Residual-Load Renewable Energies CHP Flexibile CHP Renewable + CHP
Hour of the Year
P
ow
er/
Lo
ad
in
GW

7 7
Functional Energy Storage exemplified by CHP
0
10
20
30
40
50
60
70
80
1344 1368 1392 1416 1440 1464 1488
Le
istu
ng
/La
st
in G
W
Stunde im Jahr
0
10
20
30
40
50
60
70
80
1344 1368 1392 1416 1440 1464 1488
Leis
tun
g/L
ast
in G
W
Stunde im Jahr
0
10
20
30
40
50
60
70
80
1344 1368 1392 1416 1440 1464 1488
Leis
tun
g/L
ast
in G
W
Stunde im Jahr
0
10
20
30
40
50
60
70
80
1344 1368 1392 1416 1440 1464 1488
Le
istu
ng
/La
st
in G
W
Stunde im Jahr
Negative Residual-Load Residual-Load Renewable Energies CHP Flexibile CHP Renewable + CHP
Hour of the Year
P
ow
er/
Lo
ad
in
GW
8 8
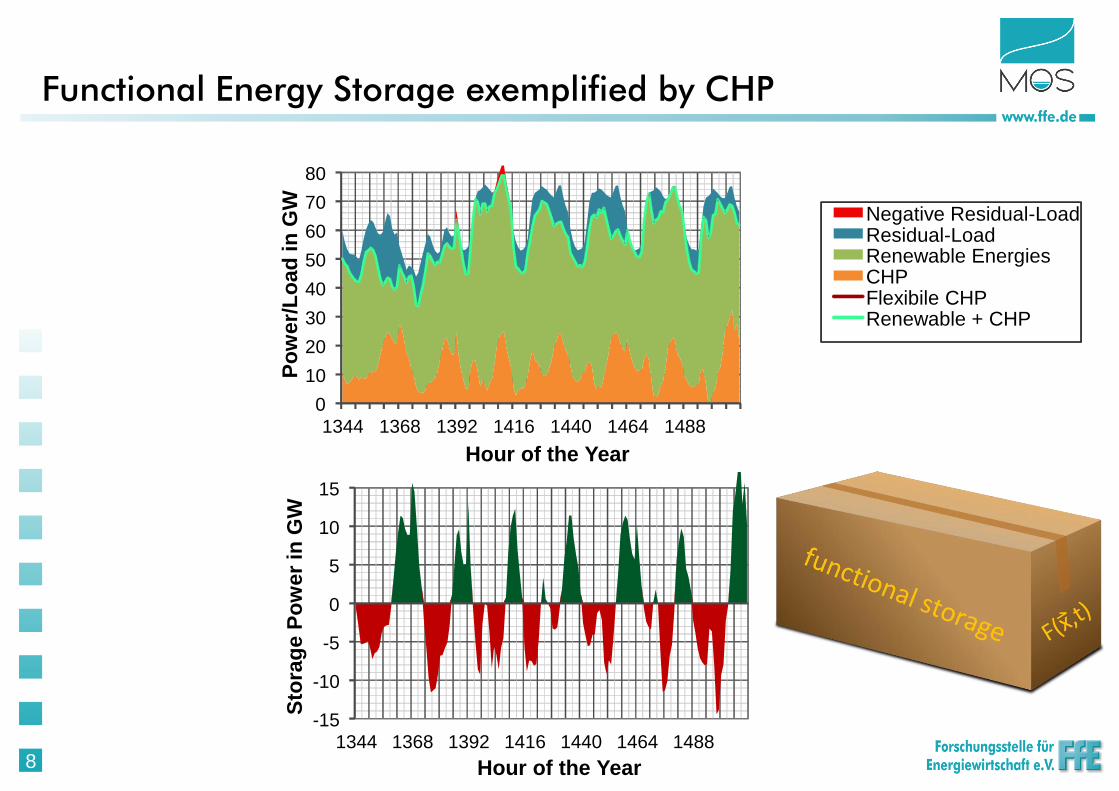
Functional Energy Storage exemplified by CHP
0
10
20
30
40
50
60
70
80
1344 1368 1392 1416 1440 1464 1488
Le
istu
ng
/La
st
in G
W
Stunde im Jahr
0
10
20
30
40
50
60
70
80
1344 1368 1392 1416 1440 1464 1488
Leis
tun
g/L
ast
in G
W
Stunde im Jahr
0
10
20
30
40
50
60
70
80
1344 1368 1392 1416 1440 1464 1488
Leis
tun
g/L
ast
in G
W
Stunde im Jahr
0
10
20
30
40
50
60
70
80
1344 1368 1392 1416 1440 1464 1488
Le
istu
ng
/La
st
in G
W
Stunde im Jahr
Negative Residual-Load Residual-Load Renewable Energies CHP Flexibile CHP Renewable + CHP
-15
-10
-5
0
5
10
15
1344 1368 1392 1416 1440 1464 1488
Sto
rag
e P
ow
er
in G
W
Hour of the Year
0
10
20
30
40
50
60
70
80
1344 1368 1392 1416 1440 1464 1488
Po
wer/
Lo
ad
in
GW
hour of the year Hour of the Year
P
ow
er/
Lo
ad
in
GW

9 9
Technological Megatrends
Power to Heat (P2H)
Electromobility
Power to Gas (P2G)
Flexibilization of Load

10 10
Technological Megatrends – Power to Heat*
*In combination with CHP
11 11
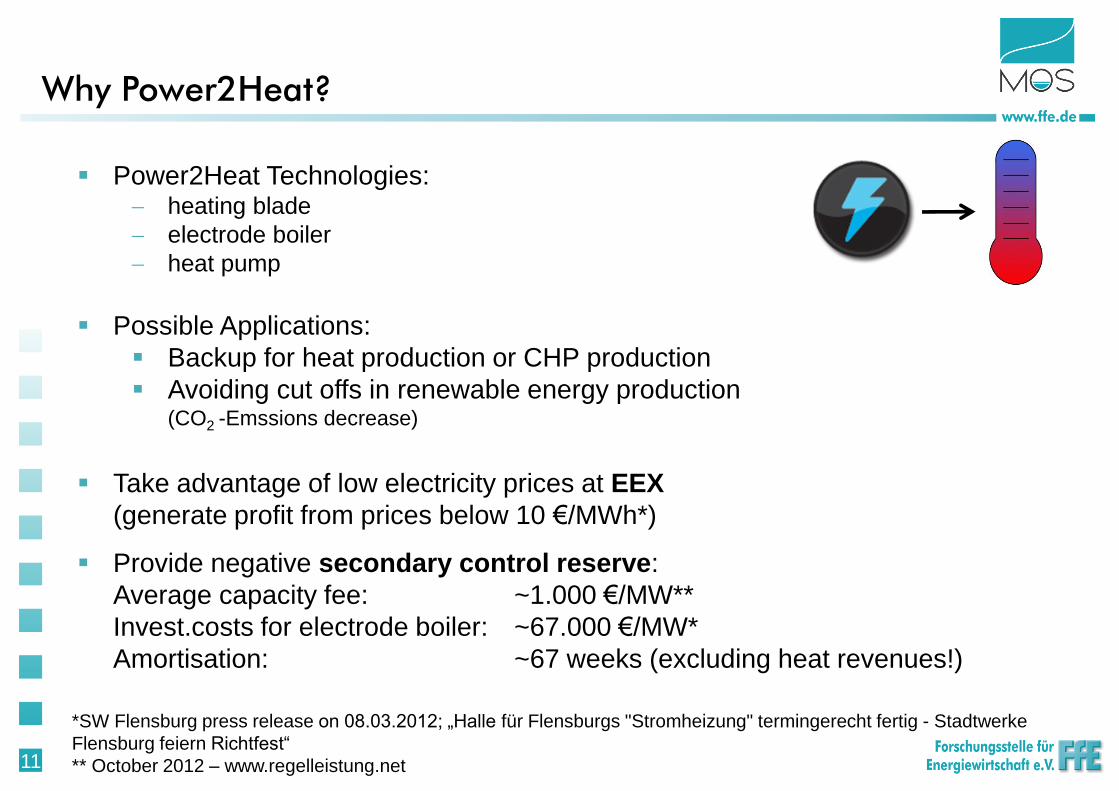
Why Power2Heat?
Power2Heat Technologies: heating blade
electrode boiler
heat pump
Possible Applications:
Backup for heat production or CHP production
Avoiding cut offs in renewable energy production (CO2 -Emssions decrease)
Take advantage of low electricity prices at EEX
(generate profit from prices below 10 €/MWh*)
Provide negative secondary control reserve:
Average capacity fee: ~1.000 €/MW**
Invest.costs for electrode boiler: ~67.000 €/MW*
Amortisation: ~67 weeks (excluding heat revenues!)
*SW Flensburg press release on 08.03.2012; „Halle für Flensburgs "Stromheizung" termingerecht fertig - Stadtwerke
Flensburg feiern Richtfest“
** October 2012 – www.regelleistung.net

12 12
Target: 25% of German electricity production by CHP until 2020
Measure: CHP Act since 2002
previous development and outlook:
significant measures are required in order to reach the
ambitious target
CHP – Political Target
year
CH
P e
l. g
en
era
tio
n a
s s
ha
re o
f
tota
l n
et e
lectr
icity g
en
era
tio
n
13 13
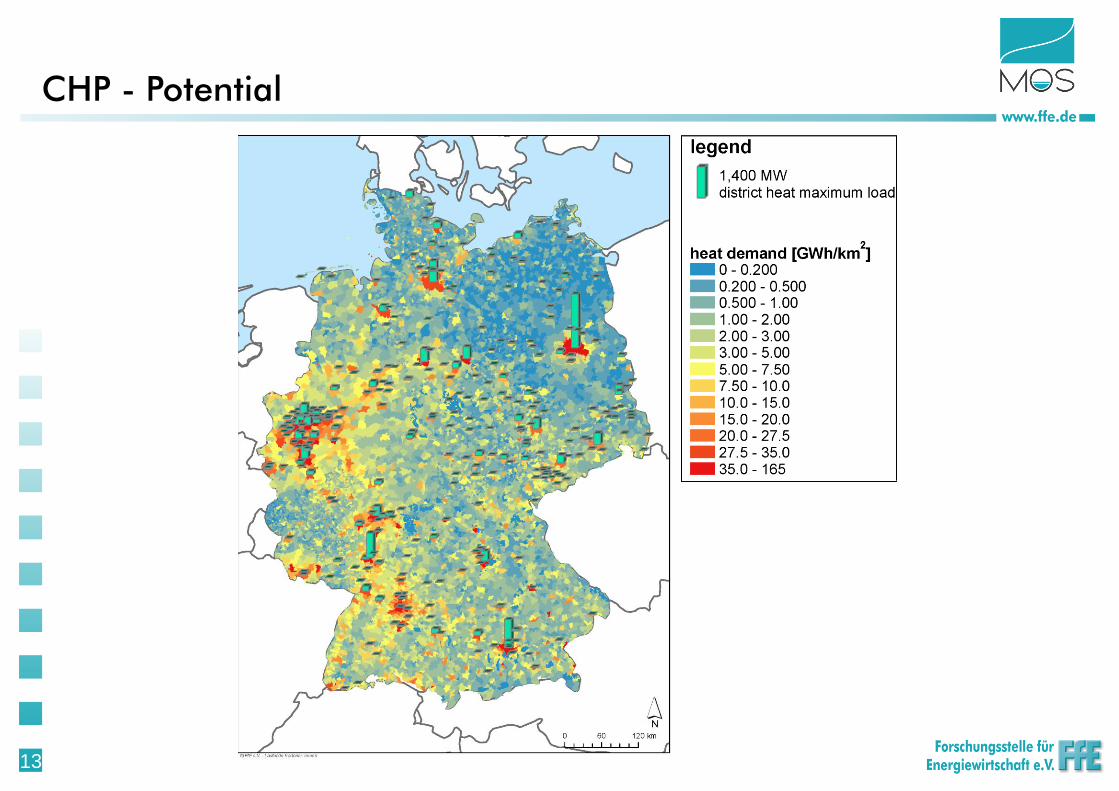
CHP - Potential

14 14
Power2Heat - Potential
Average secondary control reserve demand in 2011: ~2.000 MW
e-boiler
capacity
max. thermal load
(district heating)
share
SW Flensburg 30 MW 320 MW 9%
↓ ↓ ↓ ↓
Germany 2.700 MW 30.000 MW 9%
collapse of negative control reserve market?
15 15
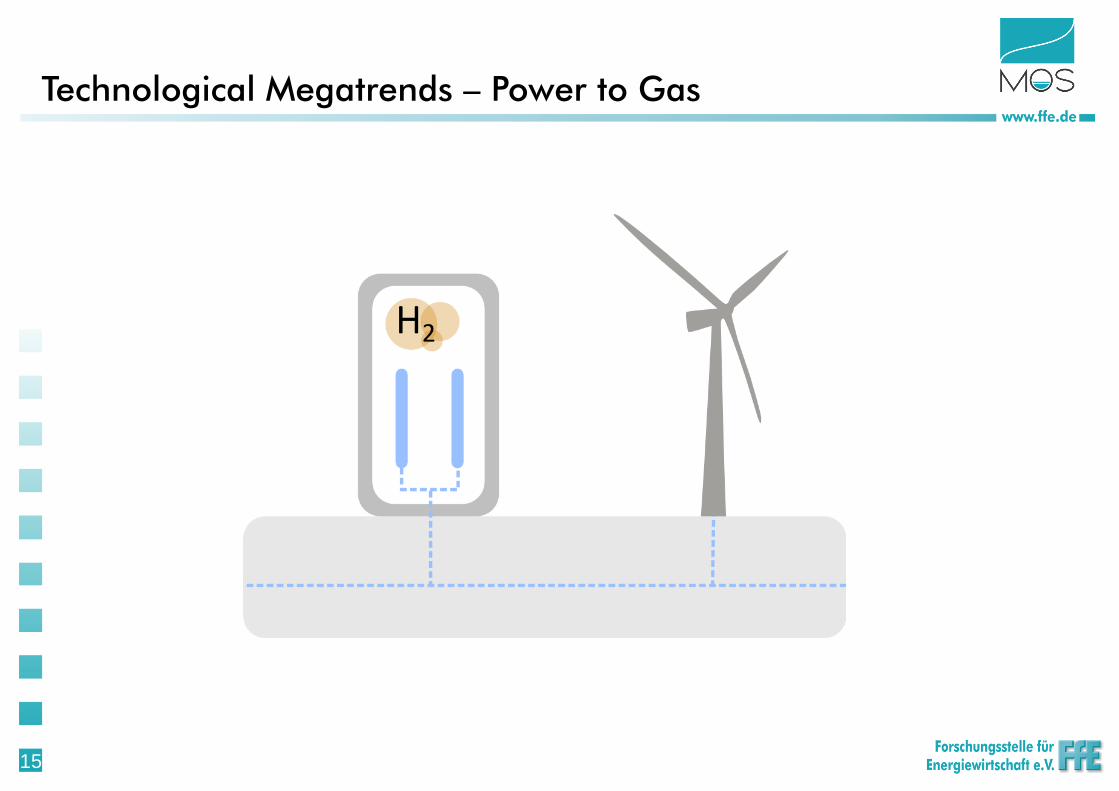
Technological Megatrends – Power to Gas

16 16
Source:
[1] Specht, Michael; Zuberbühler, Ulrich: Power-to-Gas (P2G®): Layout, operation and results of the 25 and 250 kWel research plants. Stuttgart: Zentrum für
Sonnenenergie- und Wasserstoff-Forschung (ZSW), 2012
Power-to-Gas – The Concept
[1]
Motivation:
With an increasing share of RES in the future long-term storage of energy in the order
of TWh might be necessary
transmission capacity of the gas grid > transmission capacity of the electricity grid
The Concept

17 17
Power-to-Gas – Efficiency
renewable energy
(wind and pv)
transformer
380 kV power supply line (500 km)
pumped-storage hydropower plant
power
transmission and
storage
100,0 %
95,0 %
90,3 %
72,2
%
Power Transmission and Storage
100,0 %
95,0 %
71,3 %
69,9
%
70,2 %
renewable energy
(wind and pv)
transformer and rectifier
electrolysis incl. add. components
compressor, storage, H2 transmission line
transport (500 km)
Power-to-Gas-H2
(power transmission
and storage)
Power-to-Gas H2
Source:
Müller-Syring, Gert; Henel, Marco: Power-to-Gas - Konzepte, Kosten, Potenziale. Leipzig: DBI GUT GmbH, 2011
100,0 %
95,0 %
71,3 %
56,1
%
renewable energy
(wind and pv)
transformer and rectifier
electrolysis incl. add. components
compressor, storage, H2 transmission line
transport (500 km)
Power-to-Gas-CH4
(power transmission and storage)
methanation
Power-to-Gas CH4
57,1 %
56,3 %
18 18
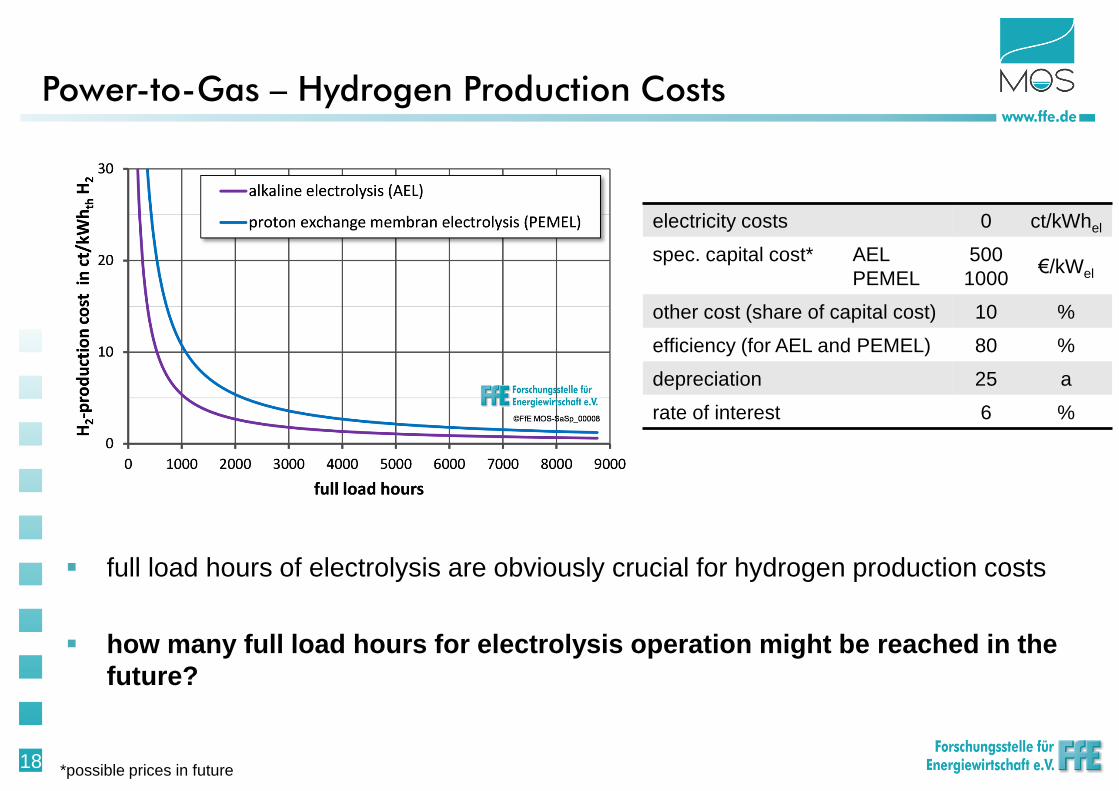
full load hours of electrolysis are obviously crucial for hydrogen production costs
how many full load hours for electrolysis operation might be reached in the
future?
Power-to-Gas – Hydrogen Production Costs
electricity costs 0 ct/kWhel
spec. capital cost*
AEL
PEMEL
500
1000 €/kWel
other cost (share of capital cost) 10 %
efficiency (for AEL and PEMEL) 80 %
depreciation 25 a
rate of interest 6 %
*possible prices in future
19 19
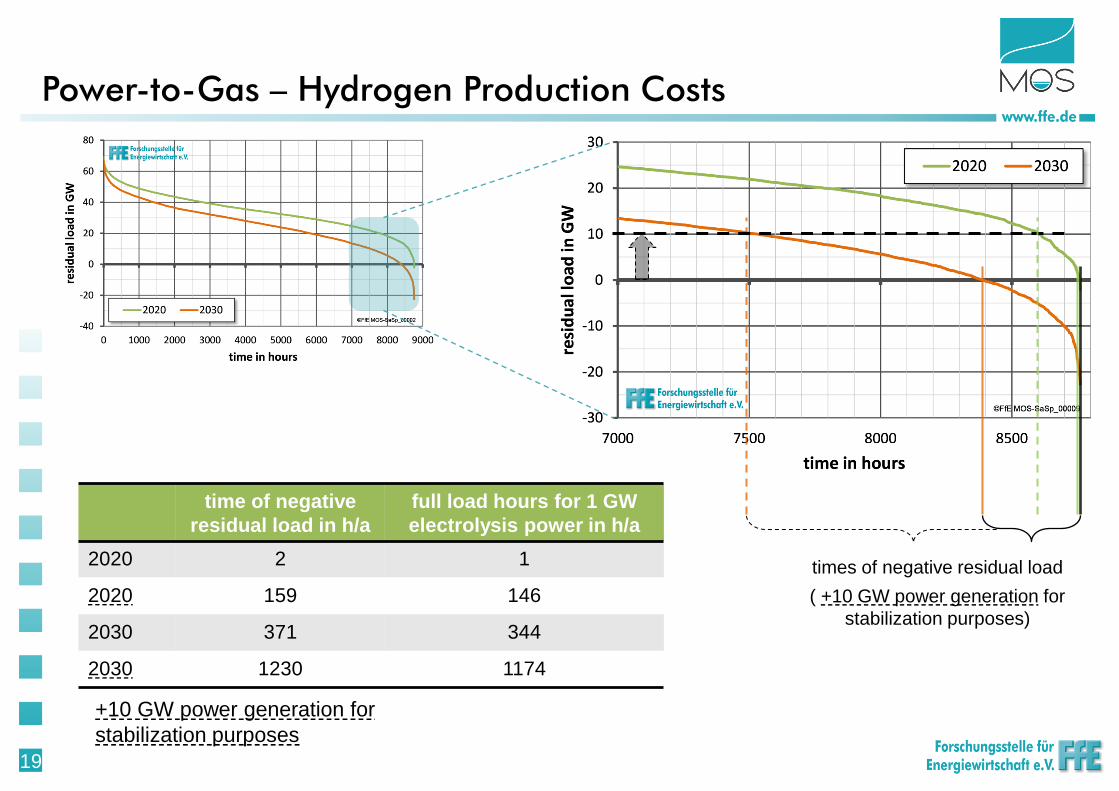
Power-to-Gas – Hydrogen Production Costs
times of negative residual load
time of negative
residual load in h/a
full load hours for 1 GW
electrolysis power in h/a
2020 2 1
2020 159 146
2030 371 344
2030 1230 1174
+10 GW power generation for
stabilization purposes
( +10 GW power generation for
stabilization purposes)
20 20
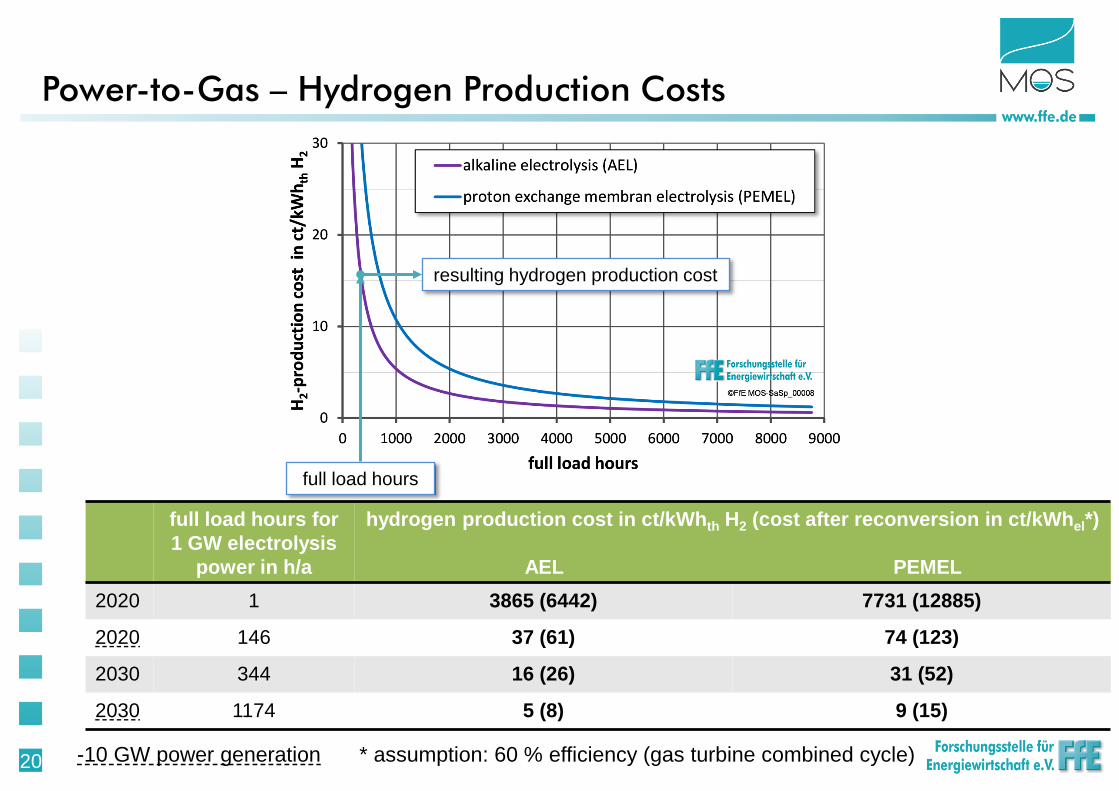
Power-to-Gas – Hydrogen Production Costs
full load hours for
1 GW electrolysis
power in h/a
hydrogen production cost in ct/kWhth H2 (cost after reconversion in ct/kWhel*)
AEL PEMEL
2020 1 3865 (6442) 7731 (12885)
2020 146 37 (61) 74 (123)
2030 344 16 (26) 31 (52)
2030 1174 5 (8) 9 (15)
-10 GW power generation
full load hours
resulting hydrogen production cost
* assumption: 60 % efficiency (gas turbine combined cycle)

21 21
Technological Megatrends - Electromobility
22 22
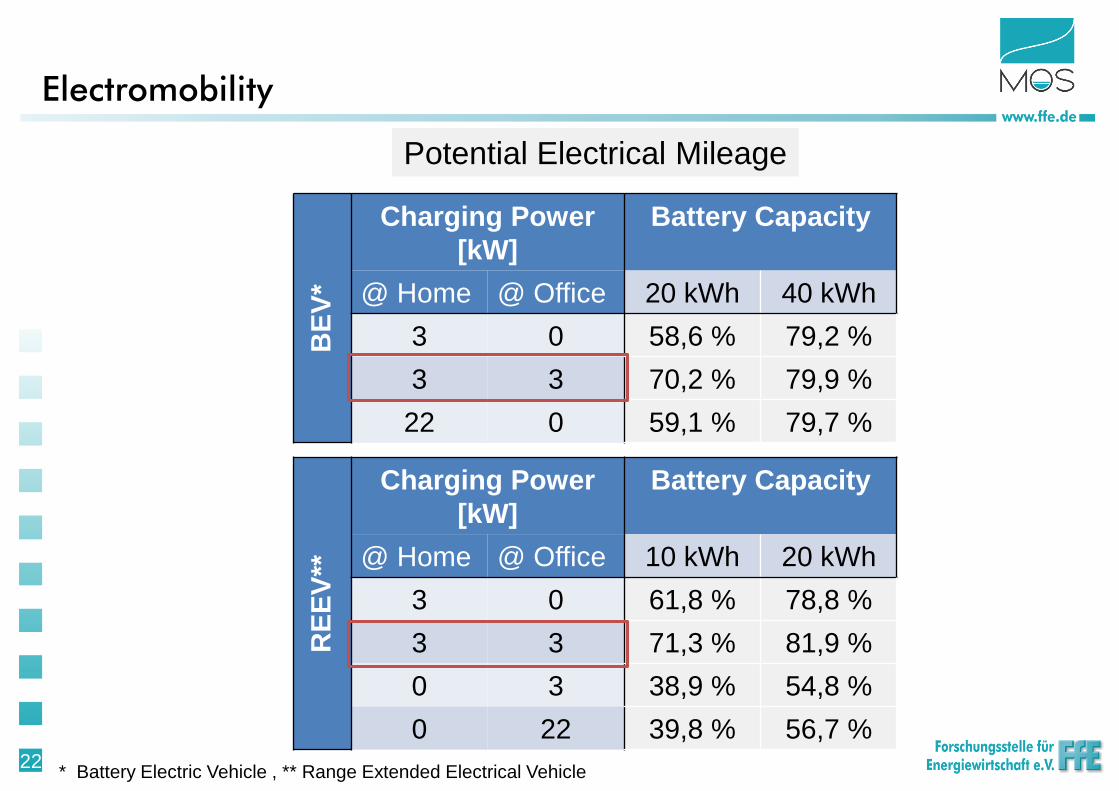
Electromobility
Potential Electrical Mileage
RE
EV
**
Charging Power
[kW]
Battery Capacity
@ Home @ Office 10 kWh 20 kWh
3 0 61,8 % 78,8 %
3 3 71,3 % 81,9 %
0 3 38,9 % 54,8 %
0 22 39,8 % 56,7 %
* Battery Electric Vehicle , ** Range Extended Electrical Vehicle
BE
V*
Charging Power
[kW]
Battery Capacity
@ Home @ Office 20 kWh 40 kWh
3 0 58,6 % 79,2 %
3 3 70,2 % 79,9 %
22 0 59,1 % 79,7 %

23 23
Electromobility
Usability Factors
average daily consumption: 8 – 10 kWh charging time about 3 to 4 hours
percentage of parking time: 90 – 95 %
@ home
park
ing p
robabili
ty w
ithin
15 m
inute
s
@ office
Ho
ur
of D
ay
Mo Tu We Th Fr Sa Su H
ou
r o
f D
ay
Mo Tu We Th Fr Sa Su
pa
rkin
g p
rob
ab
ility
with
in 1
5 m
inu
tes

24 24
2030 - 7. Mio EV‘s 2020 - 1. Mio EV‘s
*rsl = residual load
Electromobility

25 25
Technological Megatrends – Flexibilization of Load
26 26
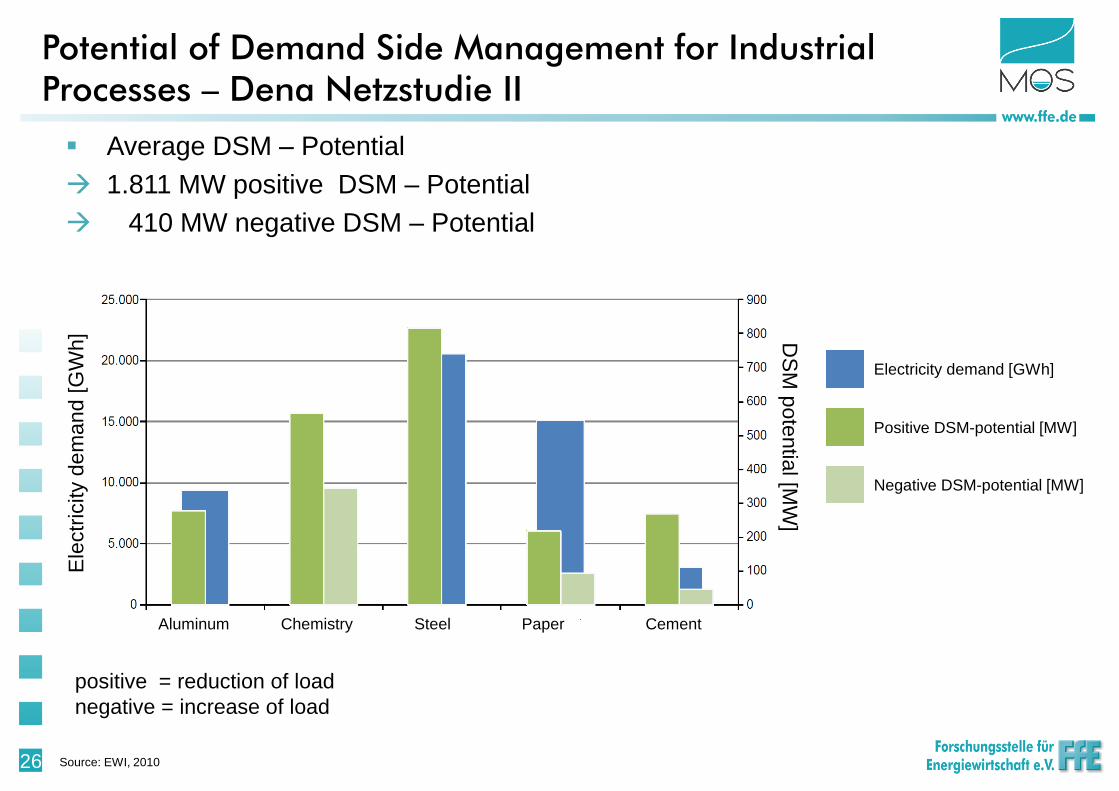
Potential of Demand Side Management for Industrial Processes – Dena Netzstudie II
Average DSM – Potential
1.811 MW positive DSM – Potential
410 MW negative DSM – Potential
Source: EWI, 2010
Electricity demand [GWh]
Positive DSM-potential [MW]
Negative DSM-potential [MW]
Ele
ctr
icity d
em
an
d [
GW
h] D
SM
pote
ntia
l [MW
]
Aluminum Chemistry Steel Paper Cement
positive = reduction of load
negative = increase of load
27 27
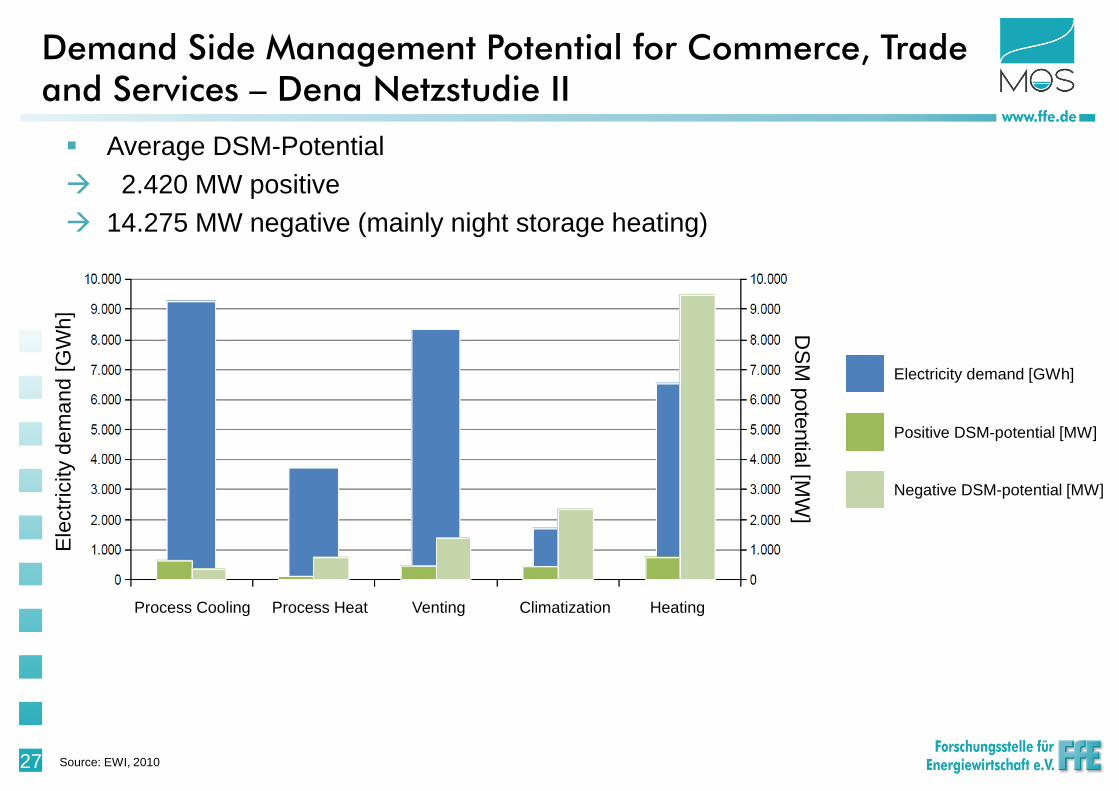
Demand Side Management Potential for Commerce, Trade and Services – Dena Netzstudie II
Average DSM-Potential
2.420 MW positive
14.275 MW negative (mainly night storage heating)
Source: EWI, 2010
Ele
ctr
icity d
em
an
d [
GW
h]
DS
M p
ote
ntia
l [MW
]
Process Cooling Process Heat Venting Climatization Heating
Electricity demand [GWh]
Positive DSM-potential [MW]
Negative DSM-potential [MW]

28 28
Demand Side Management for Industrial Processes
0
1.000
2.000
3.000
4.000
5.000
6.000
7.000
8.000
9.000
10.000
5 min 15 min 1 h 4 h
Te
ch
nic
al P
ote
nti
al o
f F
lex
ible
L
oa
d [
MW
]
residual sectors
glass sector
mechanical engineering
vehicle sector
metal processing
paper
chemistry
food
29 29
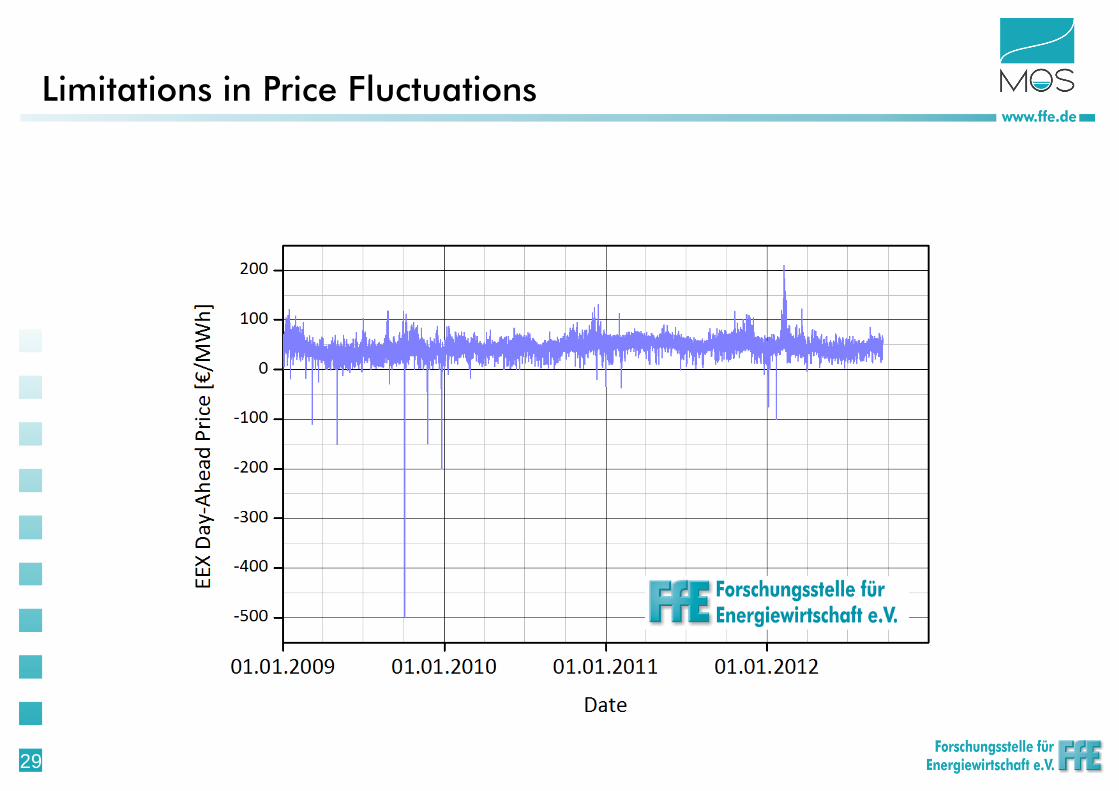
Limitations in Price Fluctuations
30 30
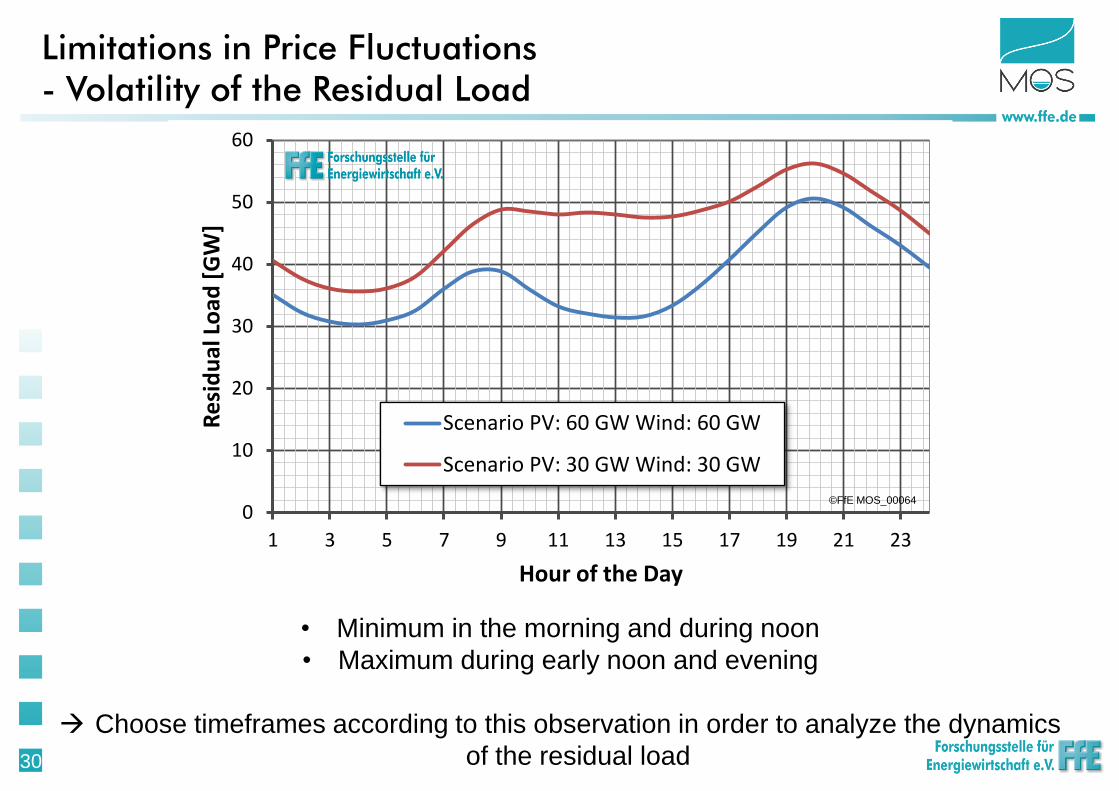
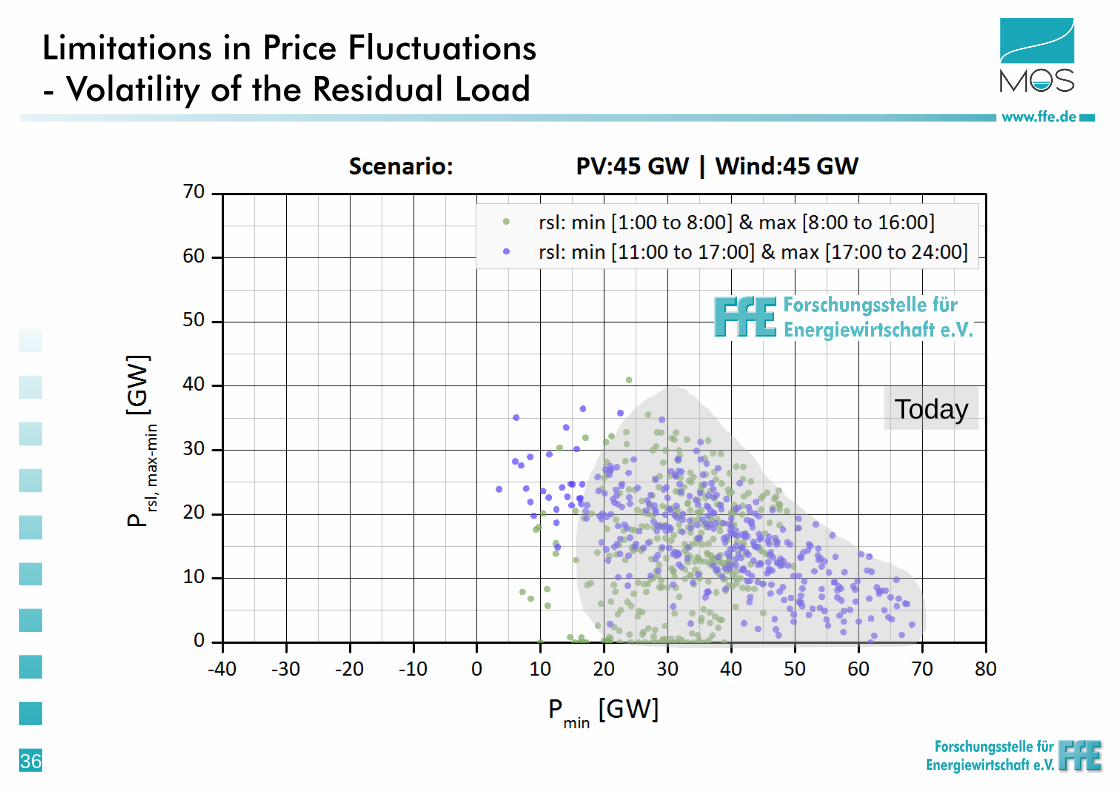
Limitations in Price Fluctuations - Volatility of the Residual Load
• Minimum in the morning and during noon
• Maximum during early noon and evening
Choose timeframes according to this observation in order to analyze the dynamics
of the residual load
0
10
20
30
40
50
60
1 3 5 7 9 11 13 15 17 19 21 23
Re
sid
ual
Lo
ad [
GW
]
Hour of the Day
Scenario PV: 60 GW Wind: 60 GW
Scenario PV: 30 GW Wind: 30 GW
©FfE MOS_00064
31 31
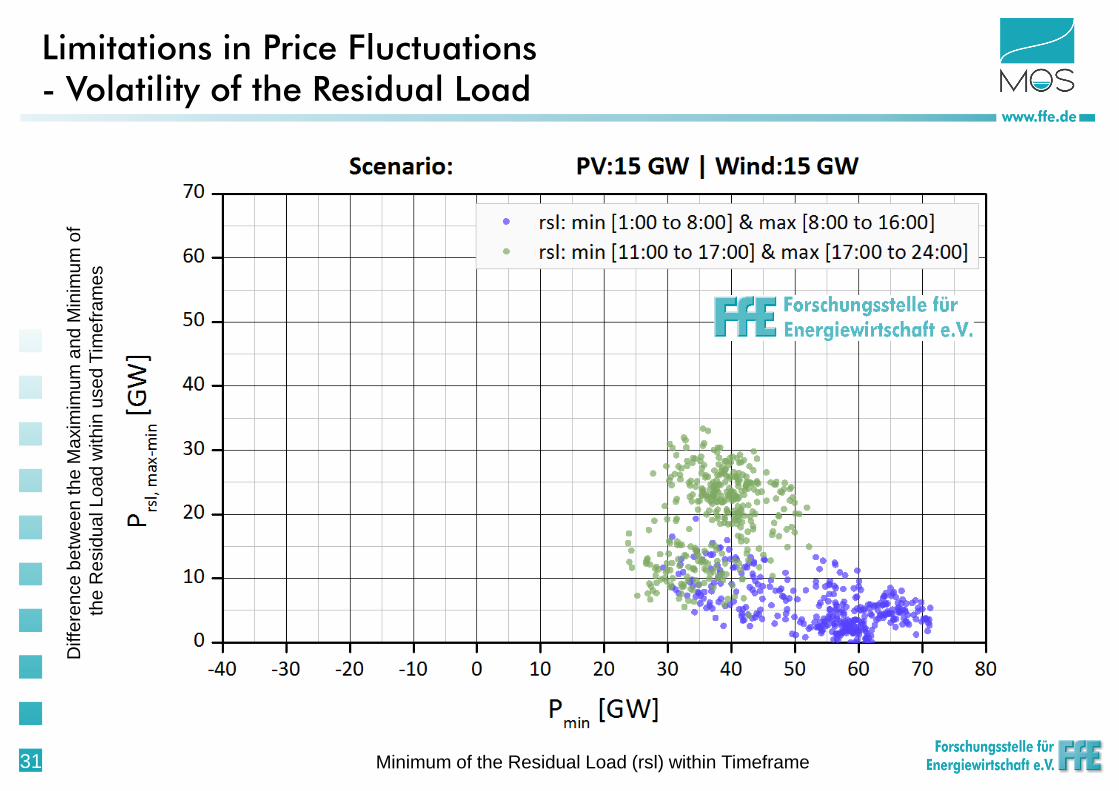
Limitations in Price Fluctuations - Volatility of the Residual Load
Minimum of the Residual Load (rsl) within Timeframe
Diffe
ren
ce
be
twe
en
th
e M
axim
imu
m a
nd
Min
imu
m o
f
the
Re
sid
ua
l L
oa
d w
ith
in u
se
d T
ime
fra
me
s
32 32
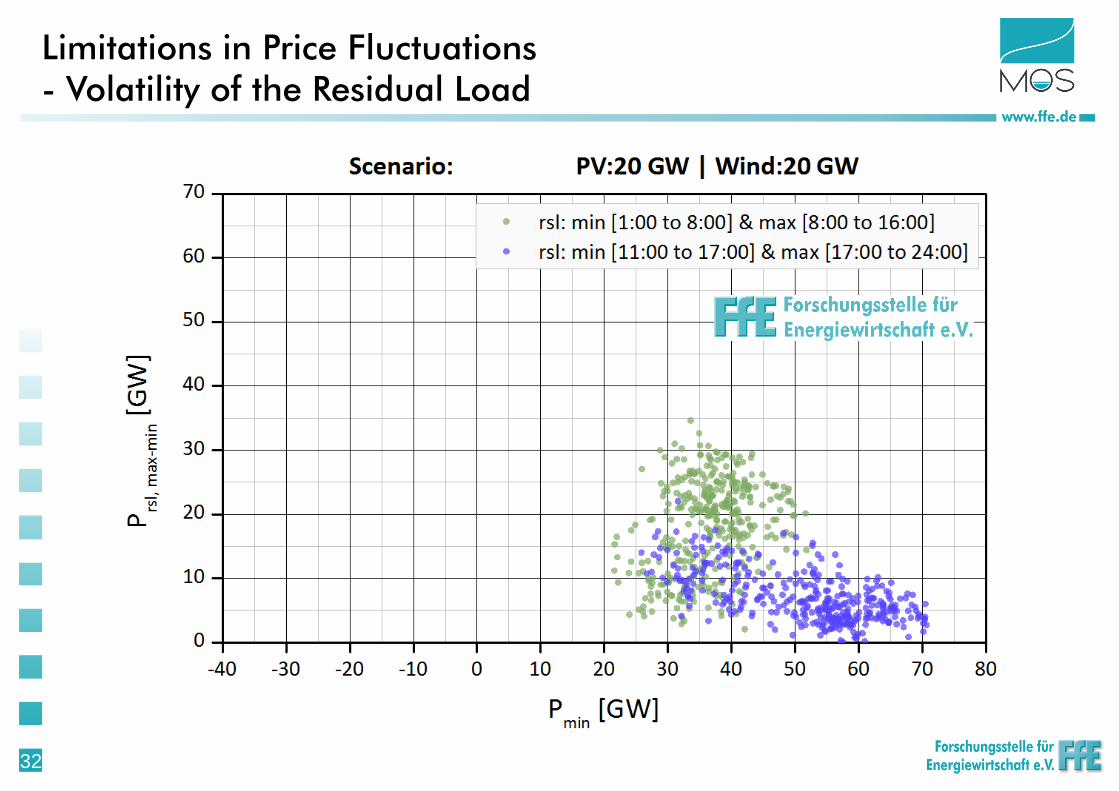
Limitations in Price Fluctuations - Volatility of the Residual Load

33 33
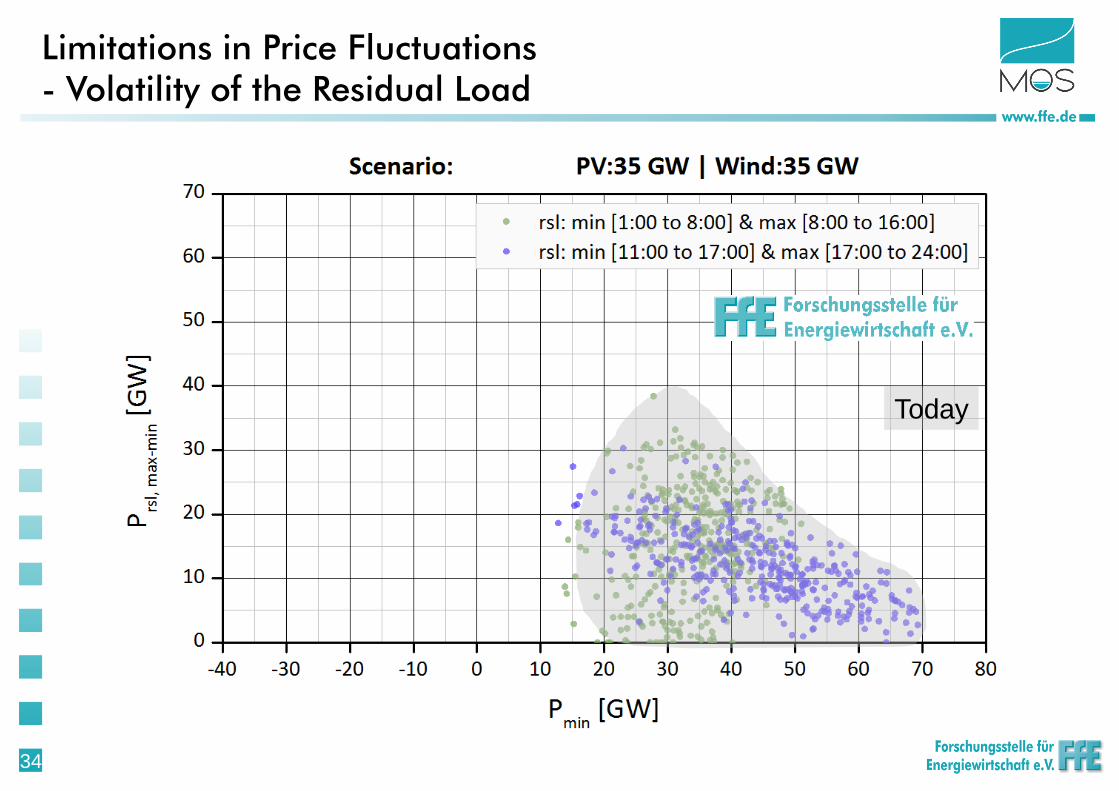
Today
Limitations in Price Fluctuations - Volatility of the Residual Load
34 34
Today
Limitations in Price Fluctuations - Volatility of the Residual Load

35 35
Today
Limitations in Price Fluctuations - Volatility of the Residual Load
36 36
Today
Limitations in Price Fluctuations - Volatility of the Residual Load
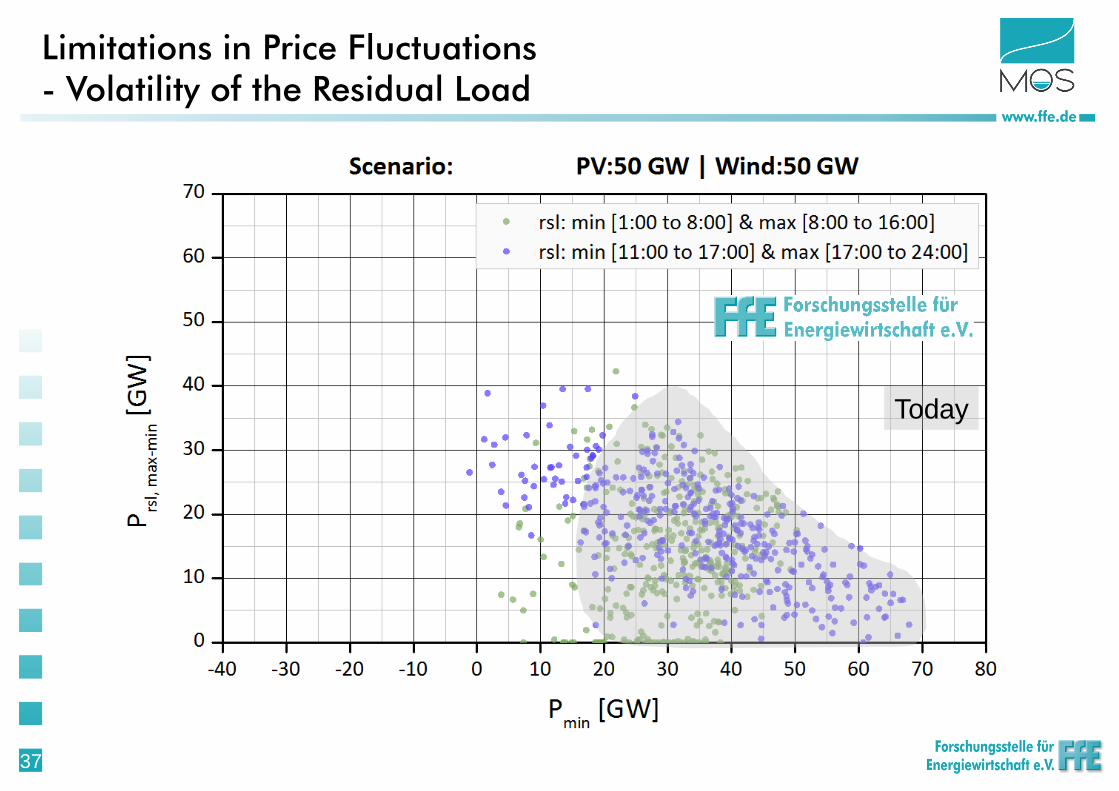
37 37
Today
Limitations in Price Fluctuations - Volatility of the Residual Load
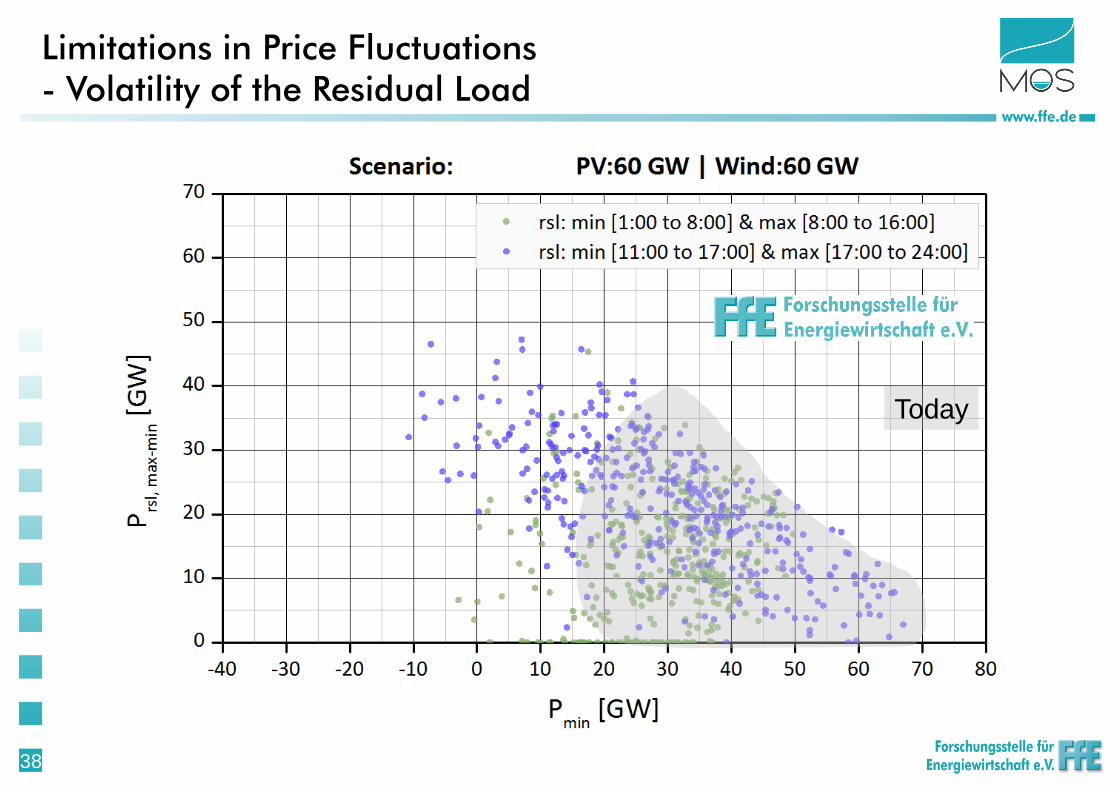
38 38
Today
Limitations in Price Fluctuations - Volatility of the Residual Load

39 39
Today
Limitations in Price Fluctuations - Volatility of the Residual Load
Power 2 Heat + 2 GW
Power 2 Gas + 0 – 2 GW
Electromobility + 0.5 – 2 GW
Flexibilization of Load +/- 1 – 2 GW
Pumped Hydro Storage +/- 2 - 3 GW
Increased Im-/Export capacities +/- 2 - 3 GW
…educated guessing on how storage technologies can influence the residual load
12 GW – possible shift
by storage technologies
40 40
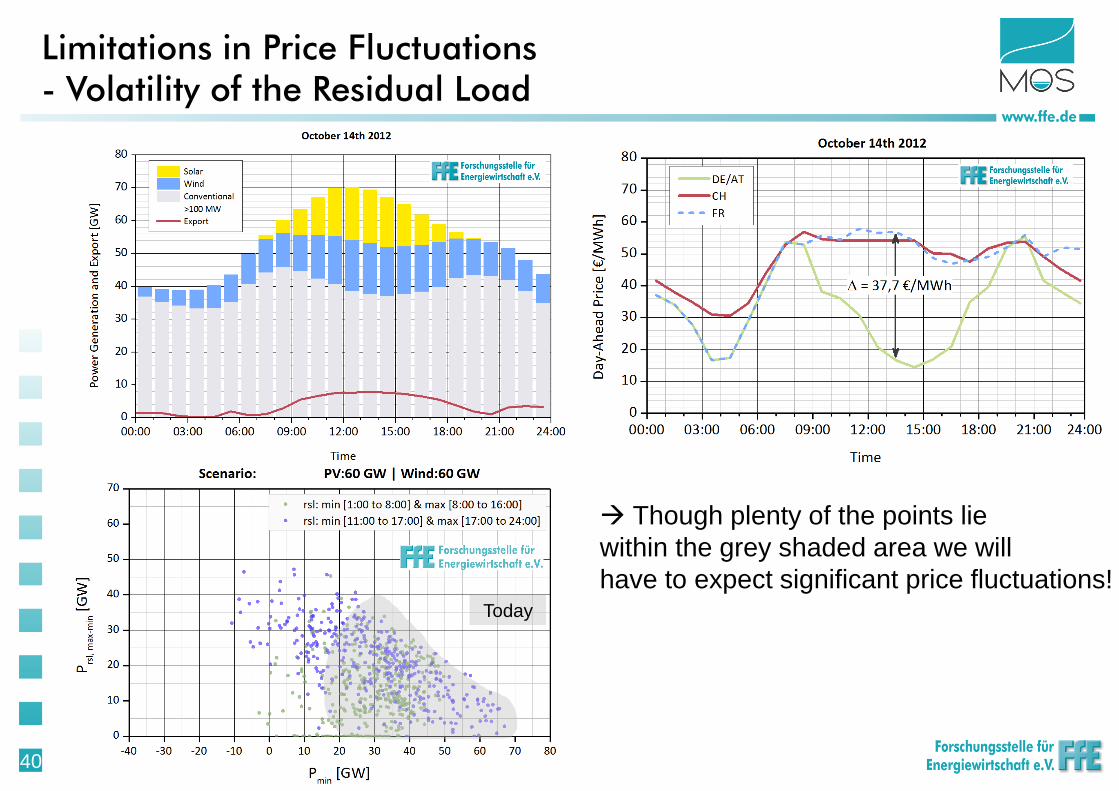
Limitations in Price Fluctuations - Volatility of the Residual Load
Though plenty of the points lie
within the grey shaded area we will
have to expect significant price fluctuations! Today

41 41
Limitations in Price Fluctuations - Conclusion
The expected increase of price fluctuations can be limited by
storage technologies to a certain extend
Downwards?
limited by marginal costs of emerging storage technologies
depending on available power and capacity
Upwards?
hard coal as well as gas prices
decharging capacity of storage technologies
Flexibilization of Load
Electromobility (depending on charging strategy)
42 42
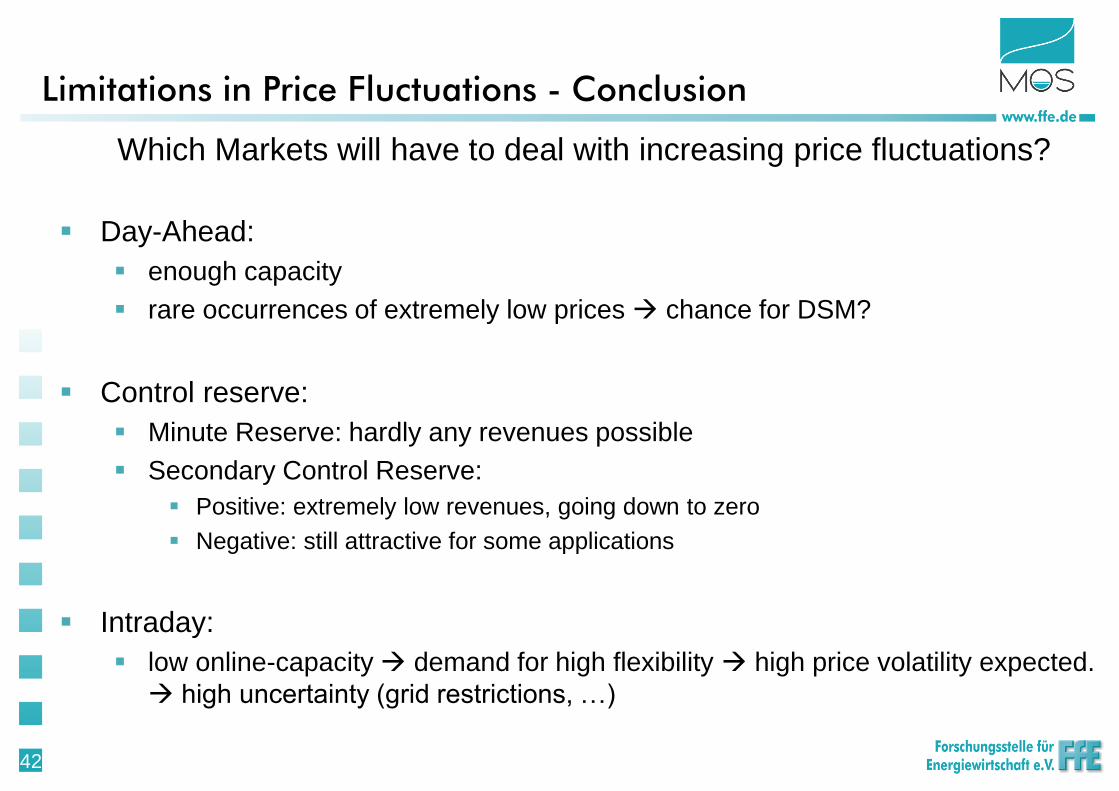
Limitations in Price Fluctuations - Conclusion
Which Markets will have to deal with increasing price fluctuations?
Day-Ahead:
enough capacity
rare occurrences of extremely low prices chance for DSM?
Control reserve:
Minute Reserve: hardly any revenues possible
Secondary Control Reserve:
Positive: extremely low revenues, going down to zero
Negative: still attractive for some applications
Intraday:
low online-capacity demand for high flexibility high price volatility expected.
high uncertainty (grid restrictions, …)
43 43
Thank you for your attention and the support of
Christoph Pellinger: [email protected] / +49-89-158-121-70