Merit and Justice: an experimental test
22
Merit and Justice: an experimental test * Aldo Rustichini b,c Alexander Vostroknutov d † b Department of Economics, University of Minnesota c Faculty of Economics, University of Cambridge d Department of Economics, Maastricht University February 2010 Abstract Merit and justice have a crucial role in ethical theory, and political phi- losophy. Some theories view as justice as allocation according to merit. Others view justice as holding criteria of its own and viewed as two oppo- site, independent values. We study experimentally their nature, and their relationship. In our experiment subjects play two games against the com- puter: a game of skill and a game of luck; after each game they observe the earnings of all subjects in the session. Each subject could reduce the winnings of one other person at a cost to himself. The majority of subjects used the option to subtract. The decision to subtract and the amount subtracted depend both on whether the game was skill or luck, and the distance between the earnings of the subject and those of others. For fixed distance, subjects subtract more in luck than in skill. In skill games the subtraction becomes more likely, and the amount larger, as the distance increases. The results show that individuals consider favorable outcomes in luck as undeserved, hence they feel more justified to subtract. They instead consider positive outcomes (their own and others’) in skill as signal of skill and effort, hence deserving merit; hence they feel more motivated to subtract. We conclude that merit is attributed if and only if effort or skill affect outcome, and inequality of outcomes is viewed differently depending on whether merit originates the difference or not. Thus, merit and justice are strongly linked in the perception of individuals, and they should be in the our concept of a good society. * We thank audience at several seminars and conferences, Gary Charness, Roberta Dessi, Ed Hopkins, Tatiana Kornienko, Edward Norton. The research was supported in part by the NSF grant SES 0924896 to AR. † Submitted for the Amartya Sen: New Directions in Welfare Economics special issue. Corresponding author: Aldo Rustichini, Department of Economics University of Min- nesota 1925 4th Street South 4-101 Hanson Hall Minneapolis, MN 55455-0462. tel: 612 625 4816 fax: 612 624 0209 email: [email protected]
Transcript of Merit and Justice: an experimental test
Merit and Justice: an experimental test ∗
Aldo Rustichinib,c Alexander Vostroknutovd †
bDepartment of Economics, University of MinnesotacFaculty of Economics, University of Cambridge
dDepartment of Economics, Maastricht University
February 2010
Abstract
Merit and justice have a crucial role in ethical theory, and political phi-losophy. Some theories view as justice as allocation according to merit.Others view justice as holding criteria of its own and viewed as two oppo-site, independent values. We study experimentally their nature, and theirrelationship. In our experiment subjects play two games against the com-puter: a game of skill and a game of luck; after each game they observethe earnings of all subjects in the session. Each subject could reduce thewinnings of one other person at a cost to himself.
The majority of subjects used the option to subtract. The decision tosubtract and the amount subtracted depend both on whether the gamewas skill or luck, and the distance between the earnings of the subject andthose of others. For fixed distance, subjects subtract more in luck than inskill. In skill games the subtraction becomes more likely, and the amountlarger, as the distance increases. The results show that individuals considerfavorable outcomes in luck as undeserved, hence they feel more justified tosubtract. They instead consider positive outcomes (their own and others’)in skill as signal of skill and effort, hence deserving merit; hence they feelmore motivated to subtract.
We conclude that merit is attributed if and only if effort or skill affectoutcome, and inequality of outcomes is viewed differently depending onwhether merit originates the difference or not. Thus, merit and justice arestrongly linked in the perception of individuals, and they should be in theour concept of a good society.
∗We thank audience at several seminars and conferences, Gary Charness, Roberta Dessi,Ed Hopkins, Tatiana Kornienko, Edward Norton. The research was supported in part by theNSF grant SES 0924896 to AR.†Submitted for the Amartya Sen: New Directions in Welfare Economics special
issue. Corresponding author: Aldo Rustichini, Department of Economics University of Min-nesota 1925 4th Street South 4-101 Hanson Hall Minneapolis, MN 55455-0462. tel: 612 6254816 fax: 612 624 0209 email: [email protected]

JEL classification: D830; C720; C900.Keywords: Merit, Justice, Desert.
2

1 Introduction
Homo faber suae quisque fortunaeAppius Cladius Caecus
The relationship between merit and justice has been a permanent themein the philosophical debate. But no consensus has been reached. At one oftwo extremes we have theories that identify justice and desert, going back toAristotele, 1 and later developed by John Locke and John Stuart Mill. Thecommon ground for these theories is that a system is just is it allocates rewardsaccording to merit.
At the other extreme, we have conceptual structures like Rawls’, which pro-ceeds from the idea of justice as fair allocations, and separates the foundationof justice from merit. A corollary of this general position is that income andwealth, and the goods things in life, should not be distributed according tomoral desert ([19], [20], II, 20). The proof of this corollary is clear: The princi-ple of rewarding according to merit would not have been chosen in the originalposition. 2 Moral desert as moral worth of character and actions is what isquestioned: Rawls recognizes that previous rules and agreements have to be re-spected. These agreements produce legitimate claims and earned entitlements,and the expectations produced by these agreements are legitimate. But they area replacement ([20], page 73) for moral desert.
This paper was stimulated by the analysis that Sen made of the conceptuallink between the merit and justice (in ([22]), which provides a very clear andforceful criticism of the adoption of reward criteria based on merit. Sen’s argu-ment proceeds from the consideration of two possible justifications for systemsthat reward merit. The first (action propriety) grounds this justification not onthe outcomes of the action, but on the propriety of the action itself. In AdamSmith’s view, an action is considered proper if we introspectively consider itappropriate for the situation, when we reproduce in us the affective responsethat the situation induces. Introspective evaluation requires viewing the situa-tion from the point of view of the other. When we apply this general criterion ofpropriety to merit, we conclude that an action deserves merit if in contemplatingit we feel prompted to reward. 3
The second (incentive) sees rewarding merit as a tool to motivate individualsto choose one action rather than another. The purpose of this tool, and a
1“Everyone agrees that justice [...] must be in accordance with some kind of merit”. [2]2In presenting this argument, Rawls explicitly reminds us of the dependence of merit on the
idea of good, and observes that lack of agreement on this deprives moral desert of legitimacy:“Having conflicting conceptions of the good, citizens cannot agree on a comprehensive doctrineto specify an idea of moral desert for political purposes.” ([20])
3“To us, therefore, that action must appear to deserve reward, which appears to be theproper and approved object of that sentiment, which most immediately and directly promptsus to reward, or to do good to another.” [23], II, I, 1.
1

measure of its success, is the outcome that this action produces. In this view,actions have no intrinsic positive quality, but only one derived from the outcomesthey produce. It is an instrumental view of merit. Sen notes that the incentiveview is currently the dominant one among the two proposed, particularly in theeconomics literature, and on that view he focuses his attention. In modern micro-economic theory, a formal statement of the justification of the incentive view isin the class of Principal Agent models that characterize optimal contracts as apayment depending on outcome. We note in passing that even in those modelsthe connection between incentives and merit is problematic. In the optimalcontract between a risk-averse agent and a risk-neutral principal who can onlyimperfectly observe the action of the agent, the principal’s payment dependson factors that are beyond the control of the agent. At equilibrium typicallythe action of the agent, although unobserved, is common knowledge to the twoparties: still, payment depends on outcome. Thus its variable part is entirelyand explicitly dependent on random events, rather than the merit of the agent:modern economic theory clearly shows how hard it is to implement an allocationmethod completely based on rewarding merit.
Sen offers the key insight that if the justification of merit is instrumentaland based on its ability to facilitate certain outcomes, then the desirability ofthose outcomes must enter into the evaluation of merit. 4 Here a tension arisesbetween merit and justice. If aversion to economic inequality is one of the criteriathat society shares, then the evaluation of a system that rewards merit cannotignore that such system is by its very nature likely to create inequality 5. Oncethe values of society are considered, the very concept that is proposed to justifya system based on reward becomes a reason to reject it.
We propose here to analyze these claims and to test them experimentally.Several hypotheses seem natural, and we review them before we present theexperimental design.
The first hypothesis concerns the relationship between justice and merit.A key element in the method proposed in [22] is the assumption that socialvalues are well defined and widely accepted, independently of the attitude tomerit; first among such values is the aversion to inequality. These values are themeasuring rod of the desirability of social tools, like the incentives provided byrewards for merit. However, if these social values are not defined independentlyof merit, then such measurement is difficult, and may be inconsistent. Forexample, suppose that the attitude to inequality in outcomes, its strength andintensity, depends in a crucial way on the perceived merit of these outcomes.Then this two steps process (first establish widely accepted values, then use
4“ The theory of merit, thus, needs to draw on other normative theories.” ([22], page 14).5”The contingent nature of merit also indicates that its relationship with economic inequality
would depend very much on whether an aversion to economic inequality is included in theobjective function of the society. If it is included, then merit for reward would have to bejudged in an inequality-sensitive way.” ([22], page 15)
2

them to evaluate the desirability of merit criteria) is hard because these criteriaare already used in the first step. The question we propose to test experimentallyis whether the perception of merit affects the attitude to inequality.
A second hypothesis focuses on the nature and motivation behind inequalityaversion. Recent studies ([5], [6], [7]) have suggested that emotions may havea functional role. Emotions like regret facilitate learning, forcing an individualto consider counterfactual outcomes (“What I would have received had I madea different choice”) in the evaluation of his past choices. Recent literature ineconomics has further developed this theme ([18]). An emotion like envy mayhave a similar functional explanation, forcing us to learn from the fortunes ofothers (“What I would have received had I done like he did” ([3]) to do a betteruse of our own abilities. Such interpretation of social comparison processes wasfirst proposed in social psychology by Festinger ([11], [12]); in this view, envy isthe social correspondent of regret. But this functional role is meaningful onlywhen the outcomes of others have merit. Clearly, there is much more to learnfrom the success of others when skill and effort are responsible for the outcome,instead of luck. We cannot learn to be lucky, but we can learn to better use ourskills if we see others performing better than we do.
A third hypothesis concerns the nature of merit, and its recognition. Justas regret and envy are emotions underlying a social preference that manifestsitself as aversion to inequality, a different emotion may underlie a desire for ourown merit to be recognized by others. Recognition of merit is a basic socialvalue, just as aversion to inequality; and as such should then be considered acriterion we apply when we measure success or failure of a society. Adam Smithanalyzes this extensively in the chapter “Of the love of praise, and of that ofPraiseworthiness.” [23]. People love praise: but “the love of praise seems, atleast in a great measure, to be derived from that of praiseworthiness”. Thetwo complement each other: “The love of praise is he desire of obtaining thefavorable sentiments of our brethren. The love of praiseworthiness is the desireof rendering ourselves the proper objects of those sentiments.” [TMS, III, 2].Love of praise is not vanity, precisely because it is aroused under the conditionthat it has to be considered deserved by he who enjoys it. It is the socialrecognition of a deserved merit.
We propose to test these basic conceptual assumption experimentally. Morespecifically, the hypothesis we test is that individual recognize merit, and revealthis in the attitudes they display towards differences in outcome for which thereis ground for merit (either because of the skill required or the effort employed init). To test this hypothesis, we need a behavioral measurement of this response,and two treatments that clearly separate the role of skill and effort on one handfrom the one of luck.
The behavior we measure is the willingness of subjects to reduce inequalityin outcomes, which they can do by subtracting money earned by others. Theseparation between merit (here equal, in a Michael Young ([30]) manner, to
3

the sum of IQ ad effort) and luck is achieved by using two tasks in which theoutcome is clearly dependent by skill and effort in one case and on simply luckin the other.
2 Experimental Design
In the experiment the subjects played two different games against the computer:a game of skill (S) and a game of luck (L). The games were described tosubjects as “Hare and Hounds” and “Guessing game”. The game of skill wasa board game with two players: the subject and the computer. To win againstthe computer the subject needed to use some logical and analytical skills. Inthe game of luck each subject had to guess a number between 0 and 100, andwon if the number was no more than ten units away from a second numberrandomly generated by a computer. Thus the score won by the subject wasentirely determined by chance. Both games were played consecutively for 10times. After each of the two games the subjects had a possibility to subtractmoney from one other participant in the experiment. They could also chooseto do nothing. If they choose to subtract money from somebody, that personwould then be paid less money at the end of the experiment. The subjects didnot know from whom they are subtracting money.
The experiment had two order treatments: SL and LS. In the SL treatmentsubjects played the game of skill first, then had a chance to subtract money.After this, they played the game of luck and then again had a chance to subtractmoney. In the LS treatment the order was reversed: first the game of luck wasplayed and then the game of skill (with subtractions after each game).
All sessions were conducted at the University of Minnesota. A total of 75subjects participated in the SL treatment in 5 groups of 13 to 16 people. InLS treatment there were 7 groups of 8 to 16 people with 93 subjects in to-tal. All subjects were undergraduate students taking classes at the University.Each session lasted approximately 45 minutes. Most of the subjects had neverparticipated in economics experiments before.
2.1 Game of Skill
The game of skill is the classic Hare and Hounds. 6 Subjects played in the roleof hounds and the computer played as hare. The hounds have to trap the hare,and the hare is trying to escape. The hare is trapped if no move is feasible whenits turn comes. The two players (subject and computer) alternate in moving.The subject can choose one and only one hound to move, and he can only moveto the right or vertically (up or down) by one cell. The hare can move by onecell in any direction. The hare is declared a winner when it passes to the left
6The game is available on line at www.mazeworks.com
4

of all three hounds, so that capture is impossible. Neither player can choose tomove a piece to an occupied position. To move a hound subject has to drag anddrop it to the cell where she wants to move it. Illegal moves are not allowedby the program. A detailed description of the rules of the game as they werepresented to subjects is reported in the Appendix 5.
Subjects had 20 minutes to play 10 games. They earned $1 for a gamewon, and nothing for a game lost. Subjects played at different pace: those whocompleted 10 games earlier than others were are allowed to continue playingwithout earning any more money. The original program has three levels ofdifficulty. In the experiment the level was set to intermediate. The computerselected the move following an artificial intelligence program, also described inwww.mazeworks.com.
2.2 Game of Luck
Subjects were asked to guess a number between 0 and 100 that was then ran-domly chosen by the computer. If subject’s guess was within a distance of 10units from the number chosen by the computer on either side, then the subjectearned $1. If it was further than that, the subject earns nothing (see Appendix5.2 for the exact instructions). The game was played 10 times.
2.3 Subtraction
After playing each game 10 times, subjects were told the amount of money theyhad won in that game. Then they were proposed a choice to subtract moneyfrom another subject, or choose not to do it (see [28] for the possibility given tosubjects to subtract money from others in an experimental environment).
Three possibilities were available. A subjects could subtract an amountfrom one of other subjects and pay for this. Else, he could choose to subtract$1 with probability 0.25 from one other subject and pay nothing. Finally, hecould choose to do nothing. In the first case, if subject decided to subtract,say, an amount of x dollars from somebody, he had to pay 0.1x dollars forit. Both amounts of money would be lost, and not transferred to anybody.A limit on subtractions was imposed so that no subject could lose more thanhe earned. Also, the subjects who decided to subtract money and pay for itcould spend more money in payments than they have. The detailed instructionsare reported in the Appendix 5.3. It was clear to the subjects that no partof the amount subtracted was paid to him or to anyone else. Subtraction wascompletely anonymous. The subject’s screen reported a list of amounts earnedby all other subjects in that session. If two subjects won the same amount twoentries with that amount would be presented. The option of no subtraction wasindicated by the item “nobody”, which appeared in random position in the list.Each subject lost the total amount subtracted in real dollars from him, and the
5

payment for the subtraction when he chose the costly option.
2.4 Treatments
The experiment had two order treatments: SL and LS. In the first treatmentthe order was: skill game, subtraction phase, display of current earnings, luckgame, subtraction phase, and finally display of total earnings for each subjectin the experiment. Thus, in SL treatment the first time subjects learned aboutthe subtraction phase was after they play skill game 10 times. The first timethey learned about the luck game was after the first subtraction phase. Whenluck game instructions were given, subjects were not told anything about whatwould happen afterwards, so their behavior was not influenced by the futuresubtraction phase. In the second treatment, the order was reversed: first theluck game was played, then the subtraction phase took place, then the currentwinnings were displayed, then the skill game, then second subtraction, then thedisplay of total earnings.
After the first subtraction phase in both treatments the subjects were shownthe amount of money that they won in the first game. This amount was equal tothe sum of the money earned playing the game minus the amount of money thatwas subtracted from them minus the payments for subtraction. Therefore, thesubjects could compute how much money they lost after the first game. At theend of the experiment subjects received a participation payment of $10 plus theirwinnings after both games net of subtractions and payments for subtractions.
3 Results
3.1 How much skill does the skill game require?
An essential component of the experiment is the different nature of the twogames. The game in which subjects have to guess a number is clearly a game ofluck, and the instructions clearly stated that the computer was going to pick thenumber randomly. The game of Hare and Hounds instead has some complexity,at least for unexperienced players like the subjects in the experiment.
To illustrate the complexity, consider the optimal strategy presented in [4],Chapter 21. In all trials of the experiment the initial position 7 was such thatthe hounds player (in our experiment, the subject) wins if he uses the optimalstrategy. This strategy however is complex. A way to describe is to first assign anumber between 0 and 3 to every cell, and then classify the position of the fouranimals on the board according to the sum of these values. The winning strategyconsists in keeping this sum equal to 3 at every move. It is highly unlikely thatsubjects understood this strategy and the underlying classification. No evidence
7The hounds were placed in three leftmost cells and the hare in the rightmost cell of thedisplay in www.mazeworks.com
6

of this is given in the debriefing notes at the end of the experiment. Instead,subjects displayed in their decisions and their statements some understandingof how to avoid the most obvious mistakes, and the ability to look ahead in thenext two or three moves of the hare.
We may conclude that the Hare and Hounds game was likely perceived bythe subjects as a game of skill for the entire set of ten rounds. There was also asufficient dispersion in the outcome: the mean of the distribution of the amountwon is 4.875 with standard error 0.153. The game was, within the limits of thetime and possible learning, neither too hard nor too easy.
3.2 Decision to Subtract
Subjects choose to subtract frequently: on average, 67.8 % of the times. Thefrequency is similar in the skill games (66.6 %) and in the luck games (69.1 %),and in a non-parametric test the difference between the two is not significant(Two-sample Wilcoxon-Mann-Whitney rank-sum test, z = 0.467 , p = 0.64). Butif we consider the effect of the social distance, measured by the difference betweenamount earned by the subjects and others, the picture changes completely.
Table 1 reports the effect of the logit estimate of the probability that asubjects subtracts money from someone else. The dependent variable is equalto 1 if the subject decides to subtract money from others, either with the costlyoption or with the zero-cost option. The independent variables are a measureof the distance between the amount earned by the subject and that earned byothers, the type of game (Skill or Luck) and the interaction between these twovariables. The distance between amounts earned is measured by the variableGap, which will be described in two steps. First, we define for each subject thedifference between the maximum score obtained by any subject, in that gameand session, and the score of the subject in the observation. Then we take themaximum difference in the session of the variable just defined. The variable Gapis the ratio of these two variables; so it is the normalization between 0 and 1of the difference between the maximum score and the score of the subject. Thevariable Skill is equal to 1 if the game is a game of skill, and 0 if the game isa game of Luck. Standard errors are adjusted for clusters in the identity of thesubject, since we have two observations for each subject (one for the Skill andone for the Luck game).
Place Table 1 here
Consider Model 3 in Table 1. The Gap variable has no direct significanteffect, but has significant effect when interacted with Skill. Everything else beingequal, subjects subtract less in a skill game: the coefficient of the variable Skillis negative and significant (coefficient = -1.26, z = -3, p = 0.003). However, theresponse to the Gap variable is stronger in the Skill game than in the Luck game:the coefficient of the interaction between the two is positive and significant,
7

(coefficient = 2.31, z = 3, p = 0.003). The results are virtually unchanged ifwe restrict the same analysis to observations where subjects are playing the firstgame (for example, when subjects play the skill game in the SL treatment), andhave no previous experience with the subtraction decision of others. The logitregression restricted to these observations has coefficient = -1.88 (z = -2.633, p= 0.009) for the Skill variable and coefficient = 3.52 (z = 2.95, p = 0.003) forthe interaction term. 8
The size of the interaction between the two variables Gap and Skill on theprobability of the subject subtracting money from some other subjects is esti-mated in Table 2. 9
Place Table 2 here
The interaction effect is large: the Gap variable adds an average of 48 % (or71 % when we only consider the first game) to the probability of subtractingin skill over the range of its value, while in luck games the effect is statisticallyzero. In other words, the probability of subtracting is approximately constantwith respect to Gap in the luck games. Instead, in skill games the probabilityincreases from values lower than in the luck games when the gap is small, tovalues that are higher when the gap is large. The two curves cross since theaverage probability is, as we have just seen, the same in the two games. Thecrossing is illustrated in the left panel of Figure 1.
Place Figure 1 here
The size of the interaction effect is different in the skill and luck games: thisis reported in the right panel of Figure 1. Note that on the horizontal axis wereport the probability of subtraction. The figure clearly displays two branches:a steep increasing one for the luck games, a flatter, decreasing one for skill. Thereason for this pattern is clear. As we have seen, the probability of subtractionin luck games is almost constant around its mean rate, so the correspondingbranch in the estimate of interaction effects is almost vertical.
Finally, an estimate of the logit regression of the gap variable, separately forthe Skill and Luck games, has a direct interpretation. In the Luck regression,the marginal effect of Gap is statistically zero (marginal effect = −0.11, z =-0.99, p-value = 0.322 ). In the Skill games the marginal effect is significant,positive and large (marginal effect = 0.393, z = 3.17, p-value = 0.002).
So far we have considered the decision to subtract or not. The analysis ofhow the amount subtracted depends on the Gap and Skill variables are similar.
8See Model 4 in the Table 19Since the model in non-linear (with a logit specification) we use the estimation of effect
size and significance with the method described in [1], [17]. The interaction, in a non-linearmodel, varies with the values of the two variables.
8

Table 3 reports the regression of the amount subtracted by subjects who arewilling to subtract at a cost.
Place Table 3 here
Subjects also had the option of subtracting 1 dollar with probability 25 %,at no cost. To include this second decision in the analysis we add to the amountsubtracted at a cost a 25 cents equal to the expected amount subtracted with theno-cost option. The results of the analysis for this second amount are reportedin Table 4.
Place Table 4 here
The model estimated on observations where subjects play the first gamehas good significance (F(3, 67) = 7.48, p-value < 0.0005 for the amount, andF(3, 67) = 7.37, p-value < 0.0005 for the expected amount). Subjects subtractapproximately 2.4 dollars per dollar-unit of gap (t = 2.49, p-value = 0.014) and2.5 dollars per dollar-unit of gap for the expected amount (t = 2.38, p-value =0.019). The variable Skill has a negative coefficient, as it had in the decision tosubtract, but not significant.
The total amount subtracted does not take into account the amount earnedby the subject from whom the money earned is subtracted. We will refer to thislatter subjects as the “target” subject. We want now to examine whether thefraction is also affected by the nature of the game. Table 5 reports the regressionof the fraction of the amount subtracted over the amount earned, over the gap,Skill, and Gap-Skill interaction variables.
Place Table 5 here
The same analysis when the amount subtracted is the expected amount (in-cluding the 25 cents expected value subtracted at no cost) is reported in Table6. Model 4 reports, in both Table 5 and Table 6, the analysis restricted to theobservations where subjects play for the first time.
Place Table 6 here
In both cases the interaction of Gap and Skill is significant and positive:when they decide the amount to subtract, subjects are more sensitive to thedistance of their outcome from the one of others when the game is a game ofskill, so when outcome is a signal of some hidden, important, quality. In thefirst game they play the coefficient is (t = 2.74, p value = 0.007 for the amount,and t = 2.49, p value = 0.003 for the expected amount)
9

Subjects could choose any of the others participants in the session as targetsof the subtraction. The only information they had to differentiate among theothers was given by the amount earned. Who among the other participants wasthe favorite target? Approximately half of the times, subjects who subtract, doso subtracting money from the top earner in the game. This is true in both games(49 over 112 in the skill game, and 50 over 116 in the luck game.) To estimatemore precisely what was affecting the choice of the target, we analyze the fractionof the amount subtracted by the subject over the total amount earned by thetarget, called Fraction Subtracted/Earned in tables 7 and 8. These tables reportan estimate of the effect of the amount earned by the target and by the subjecton the fraction of the amount subtracted by the subject over the total amountearned by the target.
Place Table 7 here
When we consider the first game, the amount earned by the target has apositive and significant effect (t = 3.44, p-value < 0.005).
Place Table 8 here
This effect of the amount earned by the target is even stronger on the fractionof expected amount (t = 3.59, p-value < 0.0005). The amount earned by thesubject has a negative and significant (t = -2.02, p-value = 0.045) effect, asone should expect because it reduces the distance between subject and target.In conclusion, the distance between the target and the subjects increases thefraction subtracted from the target.
4 Conclusions
The experimental test we run yielded several main results, which throw light onhow individuals perceive the nature of justice, moral desert, and their connection.
First: when they evaluate the differences in outcome, individuals take intoaccount the origin of the inequality, what caused it or affected it, and adjust theirevaluation accordingly. A difference in earnings entirely due to luck is regardedin a completely different way from one due to a combination of skill and effort.Individuals attach merit to an outcome when it is due to skill, and do not whenthey are due to luck. Thus, the concept of moral desert and justice are deeplyconnected, and one needs the other for a proper definition.
Second: when they evaluate policies providing remedy to inequality, individ-uals have a mixed attitude. We may see two principles in action that explaintheir behavior. These two principles can be clearly seen in the way in whichsubtraction behavior depends on the Gap in Figure 1. The first is the meritprinciple: personal responsibility for an outcome is the basis fr merit. In the
10

classical conceptualization of Kleinig ([15]), moral desert is a triadic property,linking a deserving subjects, a deserved object, and a basis, in virtue of whichthe object is deserved by the subject. A necessary condition for a basis of desertis usually taken to be personal responsibility of the subject: A subject deservesan object in virtue of some fact or event only if the subject is responsible forthat fact ([8], [10], [16]). Individuals do not deserve what comes to them withoutresponsibility, for example, if it is entirely due to chance. In the latter case it isacceptable to subtract earnings from them (for example, in the form of taxes, or,in our experiment, through direct subtraction). This principle however comesinto conflict with the signaling principle: a superior performance in a skill thatinvolves skill and effort is signal of a superior ability, while it is not when the taskis only based on chance ([25], [26], [27], [14], [24]). Hence a better performancein a skill task by someone else has a stronger, and negative affective impact onthe individual that observes that superior performance.
The interaction of these two principles explains the observed pattern of be-havior at the moment of subtraction. If an outcome is due to chance and luck,then reduction of inequality is justified: in fact, everything else being equal,individuals subtract more in skill than in luck games. If the outcome is due toskill (or effort) the negative impact of a the gap between the performance ofothers and of the individual who observes is proportional to the size of the gap,which is what we observe.
A final result provides support to the hypothesis that emotions responding tocomparisons of outcome among peers have a functional reason. Our results showthat the individuals are more sensitive to differences due to skill than to luck,as they should because the first is a useful signal, and the second is not. Thissuggests a final conclusive comment. Reducing inequality makes an importantsocial signal, filtered by emotions, less reliable. From this point of view, the no-tion of Homo Faber cited at the beginning acquires an important psychologicalsignificance. The notion was originally developed signified a recognition of thefact that human skill and effort, or merit, was the principal source of humanaccomplishments, instead of Luck. 10 Claiming the merit of human accomplish-ments away from the hands of Fortuna was also a way to claim that humanactions should be guided on the basis of moral desert. Homo Faber is an ethicalprinciple, not a descriptive statement.
10Sallust, in the Speech to Caesar that reports Appius’ original sentence, makes this shiftclear:
It was accounted true formerly that Fortune gave as gifts kingdoms and empires,as well as the other possessions which are eagerly coveted among mortal men; forthey were often found in the hands of the undeserving, as if given capriciously,and they did not remain unspoiled in anyone’s hands. But experience has shownthat to be true which Appius says in his verses, that every man is the architectof his own fortune.
11

Tables
Table 1: Decision to subtract. The dependent variable Subtraction is equal to1 if the subject subtracts score from someone. All Models are logit. Model 1, 2and 3 are run estimated over all observations. Model 4 only on those in whichsubject played the first game of the session.
Model1 Model2 Model3 Model4b/se b/se b/se b/se
didsubGap 0.567 0.566 –0.519 –0.964
(0.384) (0.384) (0.525) (0.717)Skill –0.108 –1.265*** –1.885***
(0.190) (0.421) (0.717)Gap × Skill 2.318*** 3.522***
(0.773) (1.196)constant 0.459* 0.514** 1.078*** 1.298***
(0.239) (0.245) (0.329) (0.485)
N 336 336 336 168
Table 2: Interaction effect: Cross partial derivative of Gap and Skill on theprobability of subtracting (see [17]), in the logit Model 3 (first three rows) andModel 4 (last three rows) of Table 1.
variable Mean Standard Deviation minimum maximum
interaction effect 0.484 0.061 0.369 0.551standard error 0.155 0.015 0.131 0.177z value 3.098 0.178 2.808 3.478
interaction effect 0.710 0.103 0.508 0.823standard error 0.227 0.036 0.170 0.278z value 3.162 0.506 2.632 4.390
12

Probability of Subtraction
Skill
Luck
.4.5
.6.7
.8P
roba
bilit
y of
Sub
tract
ing
0 .2 .4 .6 .8 1Gap
Luck
Skill
.3
.4
.5
.6
Inte
ract
ion
Effe
ct
.4 .5 .6 .7 .8Predicted Probability of Subtraction
Interaction Effects after Logit
Figure 1: Left Panel: Estimated probability of Subtraction. On the horizontal axis:Gap. On the vertical axis: probability of subtracting. Right Panel: Estimate of theinteraction effect. The interaction effect is between Gap and Skill; the underlying modelis a logit. On the horizontal axis: probability of subtracting; on the vertical axis: deltamethod estimate of the interaction effect. In Luck games the probability is close to aconstant function of the game variable, around the mean value (of 69.1 %). In skillgames, the probability of subtracting varies with the Gap variable, and covers a largerange.
13
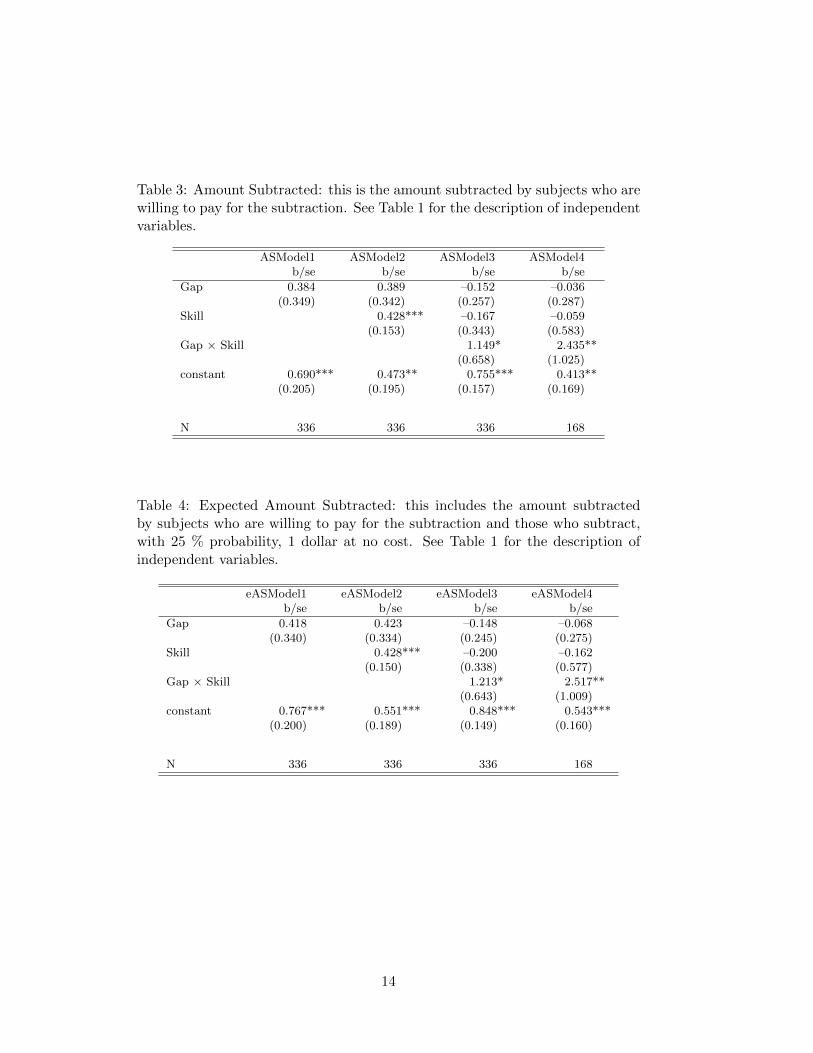
Table 3: Amount Subtracted: this is the amount subtracted by subjects who arewilling to pay for the subtraction. See Table 1 for the description of independentvariables.
ASModel1 ASModel2 ASModel3 ASModel4b/se b/se b/se b/se
Gap 0.384 0.389 –0.152 –0.036(0.349) (0.342) (0.257) (0.287)
Skill 0.428*** –0.167 –0.059(0.153) (0.343) (0.583)
Gap × Skill 1.149* 2.435**(0.658) (1.025)
constant 0.690*** 0.473** 0.755*** 0.413**(0.205) (0.195) (0.157) (0.169)
N 336 336 336 168
Table 4: Expected Amount Subtracted: this includes the amount subtractedby subjects who are willing to pay for the subtraction and those who subtract,with 25 % probability, 1 dollar at no cost. See Table 1 for the description ofindependent variables.
eASModel1 eASModel2 eASModel3 eASModel4b/se b/se b/se b/se
Gap 0.418 0.423 –0.148 –0.068(0.340) (0.334) (0.245) (0.275)
Skill 0.428*** –0.200 –0.162(0.150) (0.338) (0.577)
Gap × Skill 1.213* 2.517**(0.643) (1.009)
constant 0.767*** 0.551*** 0.848*** 0.543***(0.200) (0.189) (0.149) (0.160)
N 336 336 336 168
14

Table 5: Fraction of amount subtracted over amount earned by the target. SeeTable 1 for the description of independent variables.
fASModel1 fASModel2 fASModel3 fASModel4b/se b/se b/se b/se
Gap 0.014 0.014 –0.115 –0.073(0.063) (0.063) (0.079) (0.084)
Skill –0.037 –0.179*** –0.096(0.028) (0.064) (0.102)
Gap × Skill 0.274** 0.458***(0.115) (0.167)
constant 0.192*** 0.210*** 0.278*** 0.180***(0.040) (0.045) (0.055) (0.063)
N 336 336 336 168
Table 6: Fraction of expected amount subtracted over amount earned by thetarget. See Table 1 for the description of independent variables.
feASModel1 feASModel2 feASModel3 feASModel4b/se b/se b/se b/se
Gap 0.022 0.022 –0.110 –0.092(0.060) (0.060) (0.075) (0.082)
Skill –0.056** –0.201*** –0.148(0.027) (0.062) (0.100)
Gap × Skill 0.279** 0.489***(0.112) (0.164)
constant 0.217*** 0.245*** 0.313*** 0.237***(0.039) (0.043) (0.052) (0.060)
N 336 336 336 168
15

Table 7: Fraction of Amount Subtracted over the total amount earned by thetarget subject (Fraction Subtracted/Earned). The variable Rank target is theratio of the amount earned by the target over the range of the amounts earnedby all subjects. Amount target and Amount subject are the amounts earned bythe target subject and by the subject, respectively.
FFModel1 FFModel2 FFModel3 FFModel4b/se b/se b/se b/se
Rank target 0.262*** 0.233** 0.199* –0.159(0.047) (0.096) (0.104) (0.137)
Amount target 0.004 0.009 0.065***(0.011) (0.012) (0.019)
Amount subject –0.009 –0.014(0.008) (0.009)
constant 0.074*** 0.076*** 0.112** 0.162***(0.022) (0.024) (0.044) (0.050)
N 336 336 336 168
Table 8: Fraction of Amount Subtracted over the total amount earned by thetarget subject (Fraction Subtracted/Earned). See Table 8 for independent vari-ables.
eFFModel1 eFFModel2 eFFModel3 eFFModel4b/se b/se b/se b/se
Rank target 0.269*** 0.233** 0.182* –0.149(0.046) (0.092) (0.099) (0.130)
Amount target 0.005 0.012 0.064***(0.010) (0.011) (0.018)
Amount subject –0.014* –0.018**(0.007) (0.009)
constant 0.100*** 0.102*** 0.155*** 0.202***(0.023) (0.025) (0.043) (0.048)
N 336 336 336 168
16

5 Appendix
5.1 Subjects
There were five sessions run in SL treatment (three with 16 subjects, one with14, one with 13). There were 7 sessions run in the LS treatment (two with 16subjects, two with 15, one with 13, one with 10 and 8).
Before subjects played the game they were given a verbal presentation ofthe rules. The subjects could ask any questions about the rules of the game atthe time of the presentation. The game started once no further questions wereasked. The same experimenter presented the rules at all times. Subjects werealso instructed to maintain silence and not talk to each other during the play.The experiment was conducted using z-tree [13], LabView 6 and Java basedsoftware. The game of skill was realized as a Java applet. This was a modifiedversion of the original applet provided at www.mazeworks.com. The game ofluck was realized as part of the z-tree program.
5.2 Rules of the Game
This is the description of the rules taken from www.mazeworks.com:“On each turn, a single hound moves to a directly connected empty square
or octagon, followed by the hare’s similar move. The hounds may only movevertically or forward (to the right), not backward. The hare may move in anydirection. To move a piece, drag and drop it with the mouse. There are nocaptures. The hounds win by trapping the hare so that he is unable to move.The hare can win two ways. He can escape, which he does by moving past (tothe left of) all three hounds. Also, if the hounds move 10 times in a row withoutadvancing (i.e. they only move up and down) then the hounds are stalling andthe hare wins.”
These are the instructions given to subjects on the screens while they werechoosing: “In each period, a random number X between 0 and 100 is generated.Please choose a number Z between 0 and 100. Your profit in this period is $1 ifthe distance between Z and X is less than 10 and $0 otherwise.”
5.3 Instructions for subtraction
The following instructions were presented to subjects on their screens“Here you see the earnings of all subjects but yourself. You have a possibility
to subtract money from somebody else. You can do one of the three things: 1)Choose a subject from the list and enter positive amount to subtract; 2) Choosea subject from the list and enter zero amount to subtract; 3) Choose “nobody”from the list and enter zero amount to subtract. In case 1, you have to pay forsubtracting money: if you choose to subtract Y dollars, you lose 0.1 Y dollars.In case 2, $1 will be subtracted from the chosen subject with probability 25%
17

and you don’t pay anything. In case 3 nothing happens. Your earnings are nowis $4. Therefore in case 1 you can choose to subtract up to $40 dollars.”
18

References
[1] Ai, C. R. and Norton, E. C., (2003), Interaction term in logit and probitmodels, Economic Letters, 80, 1, 123-129
[2] Aristotle, Nicomachean Ethics, trans. Roger Crisp Cambridge, UK: Cam-bridge University Press, 2000[c.330BCE]), 1131a
[3] Bault, N., Coricelli, G., and Rustichini, A., (2008), Interdependent utilities:how social ranking affects choice behavior, PLoS ONE, 3, e3477.
[4] Berlekamp, E. R., Conway, J. H. and Guy, R. K., (2003), Winning Waysfor Your Mathematical Plays, A.K. Peters Ltd., Natick, MA.
[5] Camille, N., Coricelli, G., Sallet, J., Pradat-Diehl, P., Duhamel, J.R., andSirigu, A., (2004), The involvement of the orbitofrontal cortex in the expe-rience of regret, Science, 304, 1167-1170.
[6] Coricelli, G., Critchley, H.D., Joffily, M., O’Doherty, J.P., Sirigu, A., andDolan, R.J. (2005). Regret and its avoidance: a neuroimaging study ofchoice behavior. Nat Neurosci 8, 1255-1262.
[7] Coricelli, G., Dolan, R.J., and Sirigu, A., (2007), Brain, emotion and de-cision making: the paradigmatic example of regret, Trends in CognitiveSciences 11, 258-265.
[8] Cupit, G., (1996), Desert and Responsibility, Canadian Journal of Philos-ophy, 26, 83-100.
[9] Duesenberry, J. S., (1949), Income, savings, and the theory of consumerbehavior, Harvard University Press, Cambridge.
[10] Feldman, F., (1996), Responsibility as a Condition for Desert, Mind, 105,165-168.
[11] Festinger, L., A theory of social comparison processes, Human Relations, 7,117-140, 1954a.
[12] Festinger, L. Motivation leading to social behavior, Nebraska Symposium onMotivation, edited by Jones, M. R., Lincoln, University of Nevada Press,1954b.
[13] Fischbacher, U. (2007): z-Tree: Zurich Toolbox for Ready-made EconomicExperiments,” Experimental Economics, 10, 2, 171-178.
[14] Grafen, A., (1990), Biological signals as handicaps, Journal of TheoreticalBiology, 144, 517-546.
19

[15] Kleing, J., (1971), The Concept of Desert, American Philosophical Quar-terly, 8, 71-78.
[16] Miller, D., (1996), Two Cheers for Meritocracy, Journal of Political Philos-ophy, 4, 277-301.
[17] Norton, E. C., Wang, H. and Ai, C., (2004), Computing interaction effectsand standard errors in logit and probit models, The Stata Journal, 4, 2,154-167.
[18] Rayo, L. and Becker. G. S., (2007) Evolutionary efficiency and happiness,Journal of Political Economy, 115, 302-37.
[19] Rawls, J., (2001), Justice as fairness, A Restatement, Belknap Press, Har-vard University, Cambridge, MA.
[20] Rawls, J., (1971), A Theory of Justice, Harvard University, Cambridge,MA.
[21] Sallust, Speech to Caesar on the State, Loeb Classical Library, 1931 edition.
[22] Sen, A., (1999), Merit and Justice, in Meritocracy and Economic Inequality,Arrow, K., Bowles, S. and Durlauf, S., Princeton University Press, Prince-ton, NJ.
[23] Smith, A., (1759), Theory of Moral Sentiments, reprint of the 1817 edition,Boston, Wells and Lilly
[24] Spence, A.M., (1973) Job Market Signaling, Quarterly Journal of Eco-nomics, 87, 355-374.
[25] Zahavi, A., (1975), Mate selection - a selection for a handicap, Journal ofTheoretical Biology, 53, 205-214.
[26] Zahavi, A. (1977) The cost of honesty (Further remarks on the handicapprinciple). Journal of Theoretical Biology 67: 603-605.
[27] Zahavi, A. and Zahavi, A. (1997) The handicap principle: a missing pieceof Darwin’s puzzle, Oxford University Press. Oxford.
[28] Zizzo, D. J., and Oswald, A. J., (2001), Are people willing to pay to reduceothers’ incomes?, Annales d’Economie et de Statistique, 63, 39-62.
[29] Veblen, T. (1899), The theory of the leisure class, Macmillan, New York,1899.
[30] Young, M., (1958), The Rise of Meritocracy, 1870-2033 London, Thamesand Hudson.
20