Merging Auxiliary Data with NSDUH Data for Mental Health Research
34
MERGING AUXILIARY DATA WITH NSDUH DATA FOR MENTAL HEALTH RESEARCH DISCLAIMER SAMHSA provides links to other Internet sites as a service to its users and is not responsible for the availability or content of these external sites. SAMHSA, its employees, and contractors do not endorse, warrant, or guarantee the products, services, or information described or offered at these other Internet sites. Any reference to a commercial product, process, or service is not an endorsement or recommendation by SAMHSA, its employees, or contractors. For documents available from this server, the U.S. Government does not warrant or assume any legal liability or responsibility for the accuracy, completeness, or usefulness of any information, apparatus, product, or process disclosed. Substance Abuse and Mental Health Services Administration Center for Behavioral Health Statistics and Quality Rockville, Maryland 20857 June 2016
Transcript of Merging Auxiliary Data with NSDUH Data for Mental Health Research

MERGING AUXILIARY DATA WITH NSDUH DATA FOR MENTAL HEALTH
RESEARCH
DISCLAIMER
SAMHSA provides links to other Internet sites as a service to its users and is not responsible for the availability or content of these external sites. SAMHSA, its employees, and contractors do not endorse, warrant, or guarantee the products, services, or information described or offered at these other Internet sites. Any reference to a commercial product, process, or service is not an endorsement or recommendation by SAMHSA, its employees, or contractors. For documents available from this server, the U.S. Government does not warrant or assume any legal liability or responsibility for the accuracy, completeness, or usefulness of any information, apparatus, product, or process disclosed.
Substance Abuse and Mental Health Services Administration Center for Behavioral Health Statistics and Quality
Rockville, Maryland 20857
June 2016

This page intentionally left blank

MERGING AUXILIARY DATA WITH NSDUH DATA FOR MENTAL
HEALTH RESEARCH Contract No. HHSS283201000003C
RTI Project No. 0213757.004.107.008.002.017
RTI Authors:
Alexander J. Cowell, PhD Dan Liao, PhD Stephen A. Orme, MA
SAMHSA Author:
Jonaki Bose, MS
RTI Project Director:
David Hunter
SAMHSA Project Officer:
Peter Tice
For questions about this report, please email [email protected].
Prepared for Substance Abuse and Mental Health Services Administration, Rockville, Maryland
Prepared by RTI International, Research Triangle Park, North Carolina
June 9, 2016
Recommended Citation: Center for Behavioral Health Statistics and Quality. (2016). National Survey on Drug Use and Health: Merging Auxiliary Data with NSDUH Data for Mental Health Research. Substance Abuse and Mental Health Services Administration, Rockville, MD.

ii
Acknowledgments This report was prepared for the Center for Behavioral Health Statistics and Quality, Substance Abuse and Mental Health Services Administration (SAMHSA), U.S. Department of Health and Human Services, by RTI International (a registered trademark and a trade name of Research Triangle Institute). Contributors to this report include Sarra Hedden and Arthur Hughes at SAMHSA; Lisa Colpe at the National Institute of Mental Health; and Lance Couzens, Valerie Hoffman, Kathryn Spagnola, and Akhil Vaish at RTI.
iii
Table of Contents
Chapter Page
1. Introduction ......................................................................................................................... 1
2. Analytic Potential of Merging NSDUH Data with Auxiliary Data .................................... 3 2.1 Expanding Analytic Capabilities ............................................................................ 3 2.2 Performing Small Area Estimation ......................................................................... 4 2.3 Addressing a Coverage Gap .................................................................................... 4 2.4 Calibrating Sample Weights to Represent a Specific Subpopulation ..................... 5
3. Potential Sources of Auxiliary Data ................................................................................... 7
4. Considerations When Merging Auxiliary Data Sources with NSDUH Data ..................... 9 4.1 Stacking the Data .................................................................................................... 9 4.2 Linking the Data Using a Common Variable ......................................................... 9
4.2.1 Choosing Merging Variables ...................................................................... 9 4.2.2 Performing a Merge .................................................................................. 10
4.3 Probabilistic Matching .......................................................................................... 10 4.4 Additional Considerations in Preparing Data for Merging ................................... 11
4.4.1 Considerations in Using Select NSDUH Geographic Variables as Merging Variables .................................................................................... 11
4.4.2 Considerations for Merging Data to Calculate Substate Estimates and Perform Analysis ................................................................................ 12
5. Statistical Considerations for Analyzing Merged Data .................................................... 13 5.1 Overview ............................................................................................................... 13 5.2 Comparability of Datasets..................................................................................... 13 5.3 Changes in Data Collection Methods and Measures over Time ........................... 13 5.4 Producing State and Substate Estimates ............................................................... 14 5.5 Statistical Modeling with Hierarchical Data ......................................................... 14
6. Data Access ....................................................................................................................... 17
References ..................................................................................................................................... 19
Appendix
A Auxiliary Datasets ........................................................................................................... A-1

iv
This page intentionally left blank
1
1. Introduction The National Survey on Drug Use and Health (NSDUH), sponsored by the Substance
Abuse and Mental Health Services Administration (SAMHSA) and managed by the Center for Behavioral Health Statistics and Quality within SAMHSA, is a nationally representative survey of the U.S. civilian, noninstitutionalized population aged 12 or older. NSDUH is one of the federal government's primary sources of data on the prevalence of substance use and mental illness in the United States. NSDUH was first conducted in 1971 and has been fielded annually since 1990. Approximately 67,500 in-person interviews are conducted each year.
NSDUH contains a wealth of information and has been used in numerous analyses for many years. Many data sources can be combined with NSDUH to enrich analyses further. However, many of the variables that can be used to link to other data sources are considered sensitive because they could disclose the respondent's identity. Although these linking variables are not available on the public use file, they are available on the restricted-use file. SAMHSA allows users to analyze the restricted-use data using a data portal (http://www.samhsa.gov/samhda).
This report describes the analytic potential of merging NSDUH data with auxiliary data (Section 2), potential sources of auxiliary data (Section 3), considerations when merging NSDUH data with auxiliary data sources (Section 4), and statistical considerations when using merged data (Section 5). Section 6 summarizes how to access restricted-use NSDUH data.

2
This page intentionally left blank
3
2. Analytic Potential of Merging NSDUH Data with Auxiliary Data
This section describes some of the uses of data when data from the National Survey on Drug Use and Health (NSDUH) are merged with auxiliary data. Perhaps the most straightforward reason to perform a merge is to expand the variables for analysis beyond those available in NSDUH. Other reasons are to perform small area estimation (SAE), address coverage gaps, and produce estimates to represent specific subpopulations. SAE is a way to produce estimates for geographic areas within a state, such as a cluster of counties. A coverage gap refers to the population that NSDUH deliberately does not sample, such as children who are 11 years old or younger. Specific subpopulations are groups of people within the population sampled that may be of interest to the researcher, such as veterans.
2.1 Expanding Analytic Capabilities
Combining auxiliary data with NSDUH data provides insights that NSDUH data alone cannot provide. Although there are multiple ways to merge auxiliary data with NSDUH data, a common method is to use a geographic identifier that is in both datasets. To merge the datasets using a geographic identifier, a unit of observation in the auxiliary data should be at a geographic level that is found in NSDUH, such as state. Thus, if the unit of observation in the original auxiliary data source is an individual or a household, the researcher must aggregate the auxiliary data to the geographic level before performing the merge. For example, an auxiliary dataset that is a survey with individual responses would be collapsed to state of residence. The researcher can use the merged data to analyze variables from NSDUH at several levels, including at the individual level and state level. The following example, from Dunlap and colleagues (2016), illustrates the types of analyses that can be conducted after expanding the set of variables to analyze.
Example: The Association between Behavioral Health and the Recent Economic Recession
There is mixed evidence on the relationship between economic downturns and behavioral health. This example is an analytic study that assesses the degree of association between behavioral health measures and economic indicators. NSDUH contains data on behavioral health prevalence and treatment use, which provided the primary outcome measures for the study. The primary NSDUH measures used included serious psychological distress, substance use disorder, and behavioral health service utilization over a 3-year period. Additionally, NSDUH data provided demographic and socioeconomic data used in analysis to control for individual differences.
The primary merged data consisted of three economic indicators: (1) the state coincident index (SCI), which includes four measures of employment: nonfarm payroll employment, average hours worked in manufacturing, the unemployment rate, and wage and salary disbursements deflated by the consumer price index (U.S. city average) (Federal Reserve Bank of Philadelphia); (2) serious mortgage delinquency rates (National Delinquency Survey); and (3)
4
county unemployment rates (Bureau of Labor Statistics). Changes over time in the SCI were used to calculate the duration of the recession at the state level.
The study team merged auxiliary data at the state and county levels and by quarter or year with NSDUH data from 2008, 2009, and 2010. Multivariate analyses examined the relationship between state- and county-level economic conditions on individuals' behavioral health and use of treatment. Analyses were conducted at the individual level, with state and county variables merged with the individual record. The merged data allowed for analyses to control for individual and household characteristics simultaneously. Results suggested that individual-level socioeconomic characteristics and population-level macroeconomic conditions may affect behavioral health.
2.2 Performing Small Area Estimation
Most estimates available from NSDUH are design based, meaning they are produced using survey weights and account for the complex sample design. The NSDUH sample is designed to produce reliable national estimates annually. Using model-based SAE methods, reliable estimates can also be produced at more detailed geographic levels, such as the state and substate region levels. The Substance Abuse and Mental Health Services Administration (SAMHSA) produces state and substate estimates for 25 measures of substance use and mental illness. See SAMHSA (2014a) for the methodology on using SAE for producing substate estimates.
In SAE, auxiliary data are combined with NSDUH data, and statistical models are then used on the combined data to estimate summary statistics at the state and substate levels. Variables from the many auxiliary data sources include demographic and socioeconomic data from the American Community Survey; population projections from Nielsen Claritas (see http://www.nielsen.com/us/en.html); food stamp participation rates from the U.S. Census Bureau; Uniform Crime Reports arrest totals from the Federal Bureau of Investigation; per capita income from the Bureau of Economic Analysis; unemployment rates from the Bureau of Labor Statistics; mortality rates from the National Center for Health Statistics; treatment rates from the National Survey of Substance Abuse Treatment Services; and Block Grant awards, cost of services, and total taxable resources from SAMHSA (SAMHSA, 2014b). The auxiliary data are merged at various geographic levels, including block group, census tract, county, and state.
The statistical models are mixed models—comprising fixed and random effects—that predict the probability of a behavior (e.g., using marijuana in the past month). An important feature of the approach is that it uses a measure of variance that accounts for sampling variation and estimating bias. Design-based estimates are considered the benchmark for national estimates. For this reason, in the approach, small area estimates are calibrated so that when they are aggregated to the national level, each resulting national-level estimate matches the corresponding design-based national estimate.
2.3 Addressing a Coverage Gap
The coverage of some estimates in NSDUH is limited by the survey design and sampling frame. To overcome these types of obstacles, NSDUH data can be combined with data collected
5
using a different frame. For example, to extend mental health estimates to children aged 11 or younger, the auxiliary data might be from the National Survey of Children's Health (Child & Adolescent Health Measurement Initiative, 2013). Other examples of auxiliary datasets include mortality data from the National Center for Health Statistics (Centers for Disease Control and Prevention, 2013), which can be used to examine the link between suicide ideation measures in NSDUH and completed suicide measures in the auxiliary data, and offender data from the Bureau of Justice Statistics, which can be used to provide ranges of estimates of mental health among offender populations.
To use auxiliary data to address a coverage gap of NSDUH, the degree of overlap between the sampling frames of the auxiliary data and NSDUH should be assessed. If there is no overlap between the sampling frames, then the records from the two datasets can be treated as records collected from different strata in the survey estimation procedures. Combining NSDUH data with mortality data is an example of such a case.
If there is some overlap between the sampling frames, then more advanced techniques are required to compute estimates. Lohr (2011) summarizes the methodological approach for using data from multiple frames with U.S. household survey data. The author reviews point estimators and weight adjustments that can be used to analyze multiple-frame surveys with standard survey software and summarizes the construction of replicate weights for variance estimation.
2.4 Calibrating Sample Weights to Represent a Specific Subpopulation
The weights in NSDUH allow the researcher to readily calculate estimates at the national level and at the state level. To calculate estimates for specific subpopulations of interest, such as pregnant women, methods such as calibration weighting can be used to adjust the existing NSDUH weights and then apply those weights.
The target population for the 2012 NSDUH is the civilian, noninstitutionalized population aged 12 or older residing within the United States. For this reason, NSDUH includes person-level weights that are calibrated to the population control totals obtained from the U.S. Census Bureau. The calibration procedure uses multivariate models that include several demographic and state-level measures (Chen et al., 2014). However, these weights are not calibrated at a substate level or adjusted for some particular subpopulations, such as veterans and pregnant women.
Calibration weighting improves statistical estimation at a substate level or for specific subpopulations by adjusting the weighted subpopulation totals of a selected set of variables in NSDUH (known as calibration variables) to match their corresponding estimated subpopulation totals from the auxiliary data source. When calibrated weights are applied, estimates of variance must be adjusted appropriately to take the calibration procedure into account. This method can only be done using SUDAAN 11® (RTI International, 2013), either by specifying the population totals of the calibration variables (in PROC WTADJX) or by identifying the calibration variables in the estimation procedure (in PROC DESCRIPT).

6
This page intentionally left blank
7
3. Potential Sources of Auxiliary Data
Many auxiliary data sources can be merged with data from the National Survey on Drug Use and Health (NSDUH). The appropriate choice of the auxiliary dataset depends on the purpose of the analysis. This section briefly discusses some potential datasets that can be used in analyses addressing mental health and its treatment in conjunction with the NSDUH data. Table A.1 in Appendix A presents a select number of datasets that are national in scope and relevant to researching behavioral health outcomes. The auxiliary data include measures related to health care provision, general health outcomes, costs of health care, socioeconomic status, reported criminal activities, and education. The table summarizes the years to which the data apply, the population sampled, and—because geographic variables are often used to link datasets—available geographic measures.
These data sources are grouped in the table by whether the auxiliary dataset is designed to provide estimates at a subnational level (e.g., state, county) or whether such a level of estimate is limited or not available. Within this grouping, the data sources are sorted in alphabetical order. The table also notes if relevant data are available in only a restricted version of the dataset; this consideration is particularly important for variables that could be used to link datasets at the geographic level. Restricted versions of datasets are often available for research purposes but typically require researchers to complete data use applications and confidentiality agreements with the dataset's owner or managing agency.
Datasets with large samples are more likely to overlap geographic and population characteristics with NSDUH and thus provide reliable estimates at a substate level. The Area Health Resource Files, the American Community Survey, and Uniform Crime Reports are typically large enough to merge and analyze the resulting dataset at the county levels. Many of the datasets do not have a large enough sample and coverage area to support analysis below the state or national level. Note also that an auxiliary dataset limited to a particular county, state, or region can be merged with NSDUH data.

8
This page intentionally left blank
9
4. Considerations When Merging Auxiliary Data Sources with NSDUH Data
There are three main approaches to merging data from the National Survey on Drug Use and Health (NSDUH) with auxiliary data sources: (1) stacking the data; (2) linking the data using a common variable, such as a geographic identifier; (3) and probabilistic matching. This section discusses these approaches and some analytic and practical considerations when preparing data for merging.
4.1 Stacking the Data
A type of merged analytic dataset is where observations are appended from one dataset to those from another. This may be appropriate if the two datasets have different survey modes and sampling frames. For the appended data to be analytically useful, the analysis variables in the datasets being merged should have the same definitions and variable names, and the values of unique identifiers in each dataset must not be duplicated; that is, the only substantive difference between the auxiliary data and NSDUH should be the population covered.
4.2 Linking the Data Using a Common Variable
4.2.1 Choosing Merging Variables
A common way of merging two datasets is to use one or more common merging variables that are in both sources and defined the same way. NSDUH cannot be used to identify and link individual people reliably using, for example, social security numbers because those data are not collected on NSDUH. Rather, geographic variables can be used to perform a merge with the NSDUH data. The types of relationships examined with data that are merged using a geographic identifier would typically be between a respondent-level dependent variable from NSDUH and a geographic-level measure from the auxiliary data source that nests individual respondents from the auxiliary data.
State, county, and census tract variables are available in NSDUH and are likely to be defined the same way across any dataset that contains them. The following additional geographic variables in NSDUH can be used to merge NSDUH data with auxiliary data for research purposes:
• Census region
• Census division code
• Numeric state Federal Information Processing Standard (FIPS) code
• State name
• State abbreviation
• Metropolitan statistical area

10
• Core-based statistical area
• Numeric county FIPS code
• Tract
• Segment geographic centroid—latitude
• Segment geographic centroid—longitude
The sample segment is a NSDUH-specific construct and is central to the NSDUH sampling design. Every respondent within a given sample segment has the same state, county, and census tract. The U.S. Census Bureau commonly uses census tracts to present statistical data, and the measure is reasonably stable from one year to the next, with each tract typically containing about 4,000 people (U.S. Census Bureau, 2013b). NSDUH sample segments are constructed from census block groups, which are nested within census tracts. Census blocks are small geographic divisions, and a given block may not contain anybody at all. Thus, census tracts are more usable for inferring estimates about a population. Although one segment typically has only one census tract, the segment may span more than one tract for some respondents. In these cases, for data before 2014, the segment is assigned to the tract with the majority of dwelling units (majority census tract; starting in 2014, each dwelling unit is linked to its associated tract; Morton, Martin, Shook-Sa, Chromy, & Hirsch, 2013).
4.2.2 Performing a Merge
After choosing one or more merging variables, the researcher should also select the analytic variables of interest from the auxiliary data to merge with the NSDUH data and then collapse those analytic variables to the level of the merging variables. For example, a researcher may want to merge assault reports from the Uniform Crime Reports with NSDUH, using state as the merging variable. Collapsing at the level of the merging variable refers to obtaining for each state one or more statistical estimates expressing the number of assaults, such as the mean number of assaults. Both datasets are then sorted by state, and the mean number of assaults is then merged with NSDUH using state as the merging variable. The resulting merged data should have the same number of observations as the original NSDUH data (as long as NSDUH has no missing values) and the same number of variables as the original NSDUH data plus the selected set of analytic variables from the auxiliary data.
4.3 Probabilistic Matching
Merging geographic variables restricts the range of analyses that can be conducted because even if the auxiliary data are at the person level, they would have to be aggregated (e.g., to some geographic level) to perform the merge. An alternative and more sophisticated approach preserves the person-level detail in the auxiliary data. Probabilistic record linkage or probabilistic matching is a statistical process that estimates the probability that records from two or more datasets correspond to the same entity. For the purpose of using NSDUH, that entity would likely be a person. This method does not rely on unique identifiers—such as name, address, or social security number—to conduct the merge. Instead, to calculate the probabilities, the method requires that each of the datasets to be merged share a set of person-level characteristics, such as age, gender, and race/ethnicity. The researcher can define cut points on
11
the range of estimated probabilities that set thresholds identifying "definite" matches, "possible" matches, and "non" matches.
Medicaid claims data are one of many candidate auxiliary datasets that could be used to conduct probabilistic matching (Centers for Medicare & Medicaid Services [CMS], 2013a; 2013b). Medicaid is a government-funded insurance program for people with low incomes and accounts for approximately one third of mental health treatment in the United States (Substance Abuse and Mental Health Services Administration, 2013). The Medicaid Analytic eXtract (MAX) data from CMS contain billing records and are a uniquely detailed source of diagnosis, treatment utilization, and costs. Researchers could explore linking MAX data with NSDUH by probabilistic matching, where the match would be based on variables that both datasets have in common, including age, gender, race/ethnicity, and geographic location. Analyses would then allow researchers to examine the relationship between mental health measures from NSDUH and person-level measures from MAX, such as mental treatment utilization.
4.4 Additional Considerations in Preparing Data for Merging
4.4.1 Considerations in Using Select NSDUH Geographic Variables as Merging Variables
In addition to the list of geographic variables in Section 4.2, NSDUH contains three geographic variables that require additional information to be used to merge with auxiliary data and at least five variables that are ostensibly geographic variables but should not be used for research applications.
The three variables that require the researcher to obtain further information are an indicator of multiple tracts in a segment (for NSDUH data from 2013 and before), the area segment variable, and the state sampling region. Because it is binary, the indicator of multiple tracts in a segment is unlikely to be useful as a merging variable by itself and should be combined with other variables to perform a merge. Area segments are designed specifically for NSDUH, comprising one or more census blocks (see Section 4.2). Thus, to merge datasets using the area segment variable, the researcher would need to be able to map census blocks to segments, and this mapping may not be readily available. Similarly, to merge datasets by state sampling region, the researcher would need to know the mapping between census tracts and the sampling regions.
At least five variables in NSDUH appear to be geographic variables but should not be used to merge datasets: (1) city name, (2) the FIPS code for place, (3) full place name, (4) place name, and (5) Zone Improvement Plan (ZIP) Code. These variables were originally created for the purpose of administering the survey (e.g., locating respondents) and not for research. Most variables in NSDUH are collected directly from the respondents and then processed (i.e., edited, imputed, or recoded) as needed to help ensure data quality. However, the survey administrative variables are not subject to the same level of data editing and cleaning. Thus, city name, for example, may not correspond to a respondent's actual city of residence.
12
4.4.2 Considerations for Merging Data to Calculate Substate Estimates and Perform Analysis
To calculate substate estimates and perform analysis, the NSDUH and auxiliary data may need to be scrutinized to ensure that geographic definitions match. Over the course of many years, geographic entities such as counties may change substantially. Counties may be created, others cease to exist, and boundaries may change. The 2005-2012 NSDUH state, county, and census tract variables are based on 2000 census geographic definitions. The researcher should check that the corresponding definitions are the same for the auxiliary dataset. The list of county changes (additions and deletions) is available on the census website (e.g., U.S. Census Bureau, 2013a). The list of county changes can be used to revise the auxiliary data source to match the NSDUH file or impute for missing values in the auxiliary data.
The American Community Survey (ACS) has data at the census tract level and can help provide NSDUH estimates at the county or tract level. NSDUH and ACS data would be merged by state, county, and census tract. To perform the merge, the geographic definitions in the NSDUH and auxiliary data must be aligned, that is, based on the same census geographic definitions. The 2005-2009 (5-year) ACS file is based on 2000 census geographic definitions and thus can be merged onto current NSDUH files. The 2006-2010 ACS files, however, are based on 2010 census geographic definitions. Merging these files onto NSDUH files is not straightforward. NSDUH data must first be linked to the 2010 geographic definitions before 2010 census-based auxiliary data sources can be merged with NSDUH data. However, this issue applies mainly to producing county-level estimates. Because state, census region, and census division rarely change over time, the researcher needs to conduct only a brief review of the geographic variable definitions. Once merged, the resulting dataset can be used to calculate county or other substate region estimates and perform county-level analysis, much like the examples described in Section 2.

13
5. Statistical Considerations for Analyzing Merged Data
5.1 Overview
Before planning any analytical activities, the data source should be evaluated to see whether it is appropriate for the proposed analysis. When combining data sources, various factors in the data sources could affect the accuracy and comparability of the estimates, such as year(s) of data collected, sampling design, data collection mode (e.g., in-person interview vs. telephone or web survey), instrumentation, and operational definitions. This section raises several considerations for analyzing merged data. In addition to ensuring that the data to be merged are comparable in key ways, researchers will need to review data for changes in measures and data collection over time, be aware of issues specific to producing substate estimates, understand the limits of using statistical models with hierarchical data, and work to ensure that the confidentiality of National Survey on Drug Use and Health (NSDUH) respondents is protected.
5.2 Comparability of Datasets
When incorporating variables from different data sources in the same statistical model or comparing their estimates, it is important to consider and understand the methodological differences between the data sources and the potential impact of these differences on the measures and estimates. Several studies have compared NSDUH estimates with estimates from other studies and have evaluated the degree to which differences in estimates may be due to differences in survey methodology (Batts et al., 2014; Gfroerer, Wright, & Kopstein, 1997; Grucza, Abbacchi, Przybeck, & Gfroerer, 2007; Hennessy & Ginsberg, 2001; Hedden et al., 2012; Miller et al., 2004; Pemberton et al., 2013; Center for Behavioral Health Statistics and Quality [CBHSQ], 2012a; CBHSQ, 2012b, Appendix C). A common finding of these studies is that it is difficult to compare estimates between these studies because the goals and methods employed by the surveys are quite different. If estimates cannot be readily compared across datasets drawn from different surveys, then researchers should be cautious when merging datasets. The major methodological differences that will affect the ability to compare—and thus merge—data sources include differences in the populations covered, sampling methods, data collection modes, questionnaires, and estimation methods.
5.3 Changes in Data Collection Methods and Measures over Time
Because data collection methods and measures change over time, researchers should carefully examine the data and their documentation to identify any changes over time that may affect analytic findings. For example, in 2002, NSDUH experienced changes in data collection methods and sampling weights. To improve response rates, in 2002, NSDUH respondents received a $30 cash incentive (no incentives were provided to respondents before then). Also, sample weighting procedures were updated in that year to accommodate new population data from the 2000 decennial census. These changes mean that prevalence estimates up to and

14
including 2001 should not be compared with estimates from 2002 onward. The variables can be found by navigating from the Substance Abuse and Mental Health Data Archive website (permanent link: http://www.samhsa.gov/samhda).
5.4 Producing State and Substate Estimates
In 1999, the NSDUH sample was expanded to produce state-level estimates. The samples in each state were selected to represent proportionately the geography and demography of that state. The sum of the analysis weights was calibrated to certain state-level domains, but it was not calibrated to the census population counts at the substate level. Thus, researchers should take this into account when considering the level of estimation.
Additionally, the NSDUH sample does not include all counties, and only a few counties have a sufficient number of respondents and adequate coverage (where the sum of weights is close to the population totals) to yield publishable estimates. Statistical analysis of data with small sample sizes always yields poorly estimated results with a large degree of inferential uncertainty, resulting in large variance estimates. As noted in Section 2.2, model-based small area estimation (SAE) approaches can be applied to provide estimates for geographic regions with small sample sizes. To conduct this kind of analysis, researchers need some expertise in SAE and access to statistical software packages (e.g., SAS® [SAS Institute Inc., 2015], Stata®, and SUDAAN®).
An alternative approach is to make statistical inferences at the state level or at the substate region level to combine data collected from multiple years. In this case, the researcher should verify that all geographic regions are defined the same way for the years of data that are combined and that the coverage is adequate.
5.5 Statistical Modeling with Hierarchical Data
Hierarchical linear models (HLMs) and multilevel models (MLMs) are often applied to hierarchical data, which are data that are organized at more than one level. The units of analysis are usually individuals at a lower level (e.g., survey respondents) who are nested within aggregated units at a higher level (e.g., city, county). HLMs and MLMs are linear mixed models. Other terms for multilevel models are nested models, models with random coefficients, random-effects models, random parameter models, and split-plot designs. Researchers may want to apply HLMs, MLMs, or similar techniques to account for the hierarchical structure of the merged data.
One of the main purposes of merging auxiliary data with NSDUH data is to allow the researcher to examine the relationship between individual mental health measures in NSDUH and variables at a higher geographic level from the auxiliary data. The individuals would be naturally nested in a geographic area and would tend to be more similar to each other than to individuals from different geographic areas. In the example of merging economic indicators from external sources with NSDUH (see the example in Section 2.1), individuals are nested within the county or state in which the economic indicators are calculated. Their behavioral health and treatment use can be clustered by county or state. People in the same county may be more similar in this regard than when compared with the national population as a whole. The statistical model may need to account for this potential clustering. Failing to account for the clustering may

15
underestimate the sampling variance, leading to researchers potentially drawing the wrong conclusions when conducting tests of statistical significance. A more important advantage of the mixed models is that they allow researchers to investigate sources of variations within and across clusters. They also allow analysts to assess not only which variables predict individual differences but also which variables predict cluster-level differences (e.g., state-level differences). Various procedures in statistical software packages (e.g., Stata®) can be used to conduct mixed modeling while accommodating the complex survey design of NSDUH.
Care should be taken when applying mixed-model approaches to appropriately incorporate features of NSDUH's complex survey design. The main features of NSDUH include stratification, clustering, and unequal weights from the survey design. Appropriately accommodating unequal weights, for example, may require considerable project resources. A pseudo-likelihood approach to estimation in MLMs requires analysis weights corresponding to every level of the hierarchical data. However, the weights may not be available, or they may be available only at the individual level. Although some have proposed approximation approaches to retrieve these weights from the overall weights (Goldstein, 2003; Kovacevic & Rai, 2003), little is known regarding the performance of the approximations. Weighting procedures are performed in NSDUH to compensate for the nonresponse and coverage biases or to increase the efficiency of some estimates. Because these weighting procedures often use data that cut across clusters, it is difficult to model variance components appropriately. It is therefore advised that hierarchical models should be used with caution. If the researcher is interested only in obtaining coefficient parameters and not in variation within and across clusters, a simpler generalized estimation equation approach can be used instead.

16
This page intentionally left blank

17
6. Data Access This section describes how to access National Survey on Drug Use and Health (NSDUH)
restricted-use data via the Center for Behavioral Health Statistics and Quality (CBHSQ) data portal. Legal protections are provided under the Confidential Information Protection and Statistical Efficiency Act of 2002 (CIPSEA). CIPSEA requires that responses to NSDUH be used only for statistical purposes and not for any other purposes; it also dictates criminal penalties for those found in violation. The data portal and review process helps to ensure that the CIPSEA-required confidentiality is maintained while providing data to researchers. In addition to the data portal, there are other ways to analyze the restricted-use NSDUH files, not addressed in this report. See CBHSQ (2012c) for a review describing accessing public use and restricted-use files.
The data portal provides direct access to the NSDUH restricted-use data, which include additional variables, such as substate geographic variables. Access is limited to researchers authorized by the Substance Abuse and Mental Health Services Administration via a formal application process. The data portal is a virtual computing environment designed to provide access for authorized researchers to conduct approved research using restricted-use NSDUH data. Data portal access is provided only through approved computer locations and IP addresses at the authorized researcher's organization.
Researchers must complete a data portal application. Applications are reviewed and approved by CBHSQ. Once approved, researchers are required to sign a contract and nondisclosure affidavit that requires them to maintain the confidentiality of the data and not transfer the data out of the data portal. Through the signed contract, authorized researchers are designated as agents under CIPSEA. CIPSEA allows data that contain confidential information to be used for research purposes and, under certain restrictions, allows the results to be publicly disseminated. As part of the signed contract, researchers agree to site inspections and annual confidentiality training.
Geographic and other variables needed for a data merge may not necessarily be part of the default restricted-use dataset. Therefore, the authorized researcher must explicitly identify geographic variables needed for merging and analyses in their application. Once merging variables are identified, researchers must obtain approval for any auxiliary data they plan to use. To merge auxiliary data with NSDUH data, researchers submit and upload approved data to the secure computing environment, and the merge can then be conducted in the secure environment.
Output and results can be released from the data portal only after CBHSQ has conducted a disclosure review and has approved all results and output. CBHSQ carefully monitors the research project throughout its lifespan—from the researcher's application to access the data to the dissemination of results. To apply to access the restricted-use NSDUH data, the researcher must present an analysis plan that ensures that estimates cannot be used to identify an individual respondent. Once the estimates are calculated, CBHSQ staff will review the findings. Only after formal approval from CBHSQ can estimates be released to others (e.g., in a journal manuscript).

18
To help the researcher at the point of application and provide insight into how CBHSQ reviews findings, criteria such as the following can serve as broad guidelines to ensure that respondent identities are not disclosed and that confidentiality is maintained. If any one of these thresholds is not met, then the analysis plan may be rejected or CBHSQ may deny the release of estimates. Additionally, CBHSQ does not permit the publication of unweighted distributions.
• The sample size is sufficiently large and will be reported by rounding to the nearest 100.
• Any reported estimate of the number of people in a table cell is more than three.
• Estimates of proportions satisfy the following two criteria:
– They are not close to or equal to 100 percent or 0 percent for a given geographic location. Estimates with such extreme values indicate that all of the respondents in this location have or do not have certain characteristics and may pose a disclosure threat for these respondents.
– The denominators have at least 30 observations or cases or more.
Additional information on data access and disclosure issues can be found on the Substance Abuse and Mental Health Data Archive website (http://www.samhsa.gov/samhda).

19
References Batts, K., Pemberton, M., Bose, J., Weimer, B., Henderson, L., Penne, M., et al. (2014, April). CBHSQ Data Review: Comparing and evaluating substance use treatment utilization estimates from the National Survey on Drug Use and Health and other data sources. Retrieved from http://www.samhsa.gov/data/
Center for Behavioral Health Statistics and Quality (CBHSQ). (2012a). Comparing and evaluating youth substance use estimates from the National Survey on Drug Use and Health and other surveys (HHS Publication No. SMA 12-4727, Methodology Series M-9). Retrieved from http://www.samhsa.gov/data/
Center for Behavioral Health Statistics and Quality (CBHSQ). (2012b). Results from the 2010 National Survey on Drug Use and Health: Mental health findings (HHS Publication No. SMA 11-4667, NSDUH Series H-42). Retrieved from http://www.samhsa.gov/data/
Center for Behavioral Health Statistics and Quality (CBHSQ). (2012c). The NSDUH Report: Accessing national and state data from the National Survey on Drug Use and Health. Retrieved from http://www.samhsa.gov/data/
Centers for Medicare & Medicaid Services (CMS). (2013a). Identifiable data files. Retrieved August 8, 2013, from http://www.cms.gov/Research-Statistics-Data-and-Systems/Files-for-Order/IdentifiableDataFiles/index.html?redirect=/IdentifiableDataFiles/
Centers for Medicare & Medicaid Services (CMS). (2013b). Medicaid data sources—General information. Retrieved August 8, 2013, from http://www.cms.gov/Research-Statistics-Data-and-Systems/Computer-Data-and-Systems/MedicaidDataSourcesGenInfo/index.html?redirect=/medicaiddatasourcesgeninfo/
Centers for Disease Control and Prevention (CDC). (2013). National Vital Statistics System: Mortality data. Retrieved August 8, 2013, from http://www.cdc.gov/nchs/deaths.htm
Chen, P., Cribb, D., Dai, L., Gordek, H., Laufenberg, J., Sathe, N., & Westlake, M. (2014). Person-level sampling weight calibration. In 2012 National Survey on Drug Use and Health: Methodological resource book (Section 12, prepared for the Substance Abuse and Mental Health Services Administration, Contract No. HHSS283201000003C, Phase I, Deliverable No. 41, RTI/0212800.001.107.004). Retrieved from http://www.samhsa.gov/data/
Child & Adolescent Health Measurement Initiative. (2013). The National Survey of Children's Health. Retrieved August 8, 2013, from http://www.childhealthdata.org/learn/NSCH
Dunlap, L. J., Han, B., Dowd, W. N., Cowell, A. J., Forman-Hoffman, V., Davis, M. C., & Colpe, L. J. (2016). Behavioral health outcomes among adults: Associations with individual and community-level economic conditions. Psychiatric Services, 67(1), 71-77.

20
Gfroerer, J., Wright, D., & Kopstein, A. (1997). Prevalence of youth substance use: The impact of methodological differences between two national surveys. Drug and Alcohol Dependence, 47, 19-30.
Goldstein, H. (2003). Multilevel statistical models (3rd ed.). London: Arnold.
Grucza, R. A., Abbacchi, A. M., Przybeck, T. R., & Gfroerer, J. C. (2007). Discrepancies in estimates of prevalence and correlates of substance use and disorders between two national surveys. Addiction, 102(4), 623-629.
Hedden, S., Gfroerer, J., Barker, P., Smith, S., Pemberton, M. R., Saavedra, L. M., et al. (2012, March). CBHSQ Data Review: Comparison of NSDUH mental health data and methods with other data sources. Retrieved from http://www.samhsa.gov/data/
Hennessy, K. H., & Ginsberg, C. (Eds.). (2001). Substance use survey data collection methodologies and selected papers [Special issue]. Journal of Drug Issues, 31(3), 595-808.
Kovacevic, M. S., & Rai, S. N. (2003). A pseudo maximum likelihood approach to multilevel modelling of survey data. Communications in Statistics, Theory and Methods, 32, 103-121.
Lohr, S. (2011). Alternative survey sample designs: Sampling with multiple overlapping frames. Survey Methodology, 37(2), 197-213.
Miller, J. W., Gfroerer, J. C., Brewer, R. D., Naimi, T. S., Mokdad, A., & Giles, W. H. (2004). Prevalence of adult binge drinking: A comparison of two national surveys. American Journal of Preventive Medicine, 27, 197-204.
Morton, K. B., Martin, P. C., Shook-Sa, B. E., Chromy, J. R., & Hirsch, E. L. (2013). Sample design report. In 2012 National Survey on Drug Use and Health: Methodological resource book (Section 2, prepared for the Substance Abuse and Mental Health Services Administration, Contract No. HHSS283201000003C, Phase I, Deliverable No. 8, RTI/0212800.001.103). Retrieved from http://www.samhsa.gov/data/
Pemberton, M. R., Bose, J., Kilmer, G., Kroutil, L. A., Forman-Hoffman, V. L., & Gfroerer, J. C. (2013, September). CBHSQ Data Review: Comparison of NSDUH health and health care utilization estimates to other national data sources. Retrieved from http://www.samhsa.gov/data/
RTI International. (2013). SUDAAN®, Release 11.0.1 [computer software]. Research Triangle Park, NC: Author.
SAS Institute Inc. (2015). SAS/STAT® 14.1 [computer software]. Cary, NC: Author.
Substance Abuse and Mental Health Services Administration (SAMHSA). (2013). National expenditures for mental health services and substance abuse treatment, 1986-2009 (SMA-13-4740). Rockville, MD: Author.

21
Substance Abuse and Mental Health Services Administration (SAMHSA). (2014a). 2010-2012 National Surveys on Drug Use and Health: Guide to substate tables and summary of small area estimation methodology. Retrieved from http://www.samhsa.gov/data/sites/default/files/substate2k12-Methodology/NSDUHsubstateMethodology2012.htm
Substance Abuse and Mental Health Services Administration (SAMHSA). (2014b). Substate estimates of substance use and mental illness from the 2010-2012 National Surveys on Drug Use and Health: Results and detailed tables. Retrieved from http://archive.samhsa.gov/data/NSDUH/substate2k12/toc.aspx
U.S. Census Bureau. (2013a). Geographic boundary change notes. Retrieved August 6, 2013, from http://www.census.gov/geo/reference/boundary-changes.html
U.S. Census Bureau. (2013b). Geographic terms and concepts—Census tract. Retrieved August 6, 2013, from https://www.census.gov/geo/reference/gtc/gtc_ct.html

22
This page intentionally left blank

A-1
Appendix A: Auxiliary Datasets

A-2
Table A.1 Potential Sources of Auxiliary Data
Dataset Geographical
Variables Linking Variables with
NSDUH Years Data Collected Population National Datasets with Full Substate Coverage Area Resource File Region
State County
Region State
County
Annually Current: 2011-2012
Surveys doctors, health care providers, and health care facilities
American Community Survey Summary File: Region
Division State
County Tract
Public Use Microdata
Sample (PUMS): Region State
Summary File: Region
Division State
County Tract
PUMS: Region State
Annually: only the 5-year dataset includes all counties
and sufficient tracts to match NSDUH coverage
Current: 2011
Surveys representative sample of the U.S. population
U.S. Census Region Division
State County Tract
Block Group
Region Division
State County Tract
Every 10 years with annual estimated updates
Current: 2010
Surveys representative sample of the U.S. population
Uniform Crime Reports Region Division
State County
Region Division
State County
Annually Current: 2011-2012
Crimes/arrests reported by local law enforcement agencies; data available at smaller geographic regions will vary and may be limited to basic crime and arrest data
National Datasets with Limited Substate Coverage Behavioral Risk Factor
Surveillance System Region
Division State
Region Division
State
Annually Current: 2011
Surveys representative sample of the U.S. population
Bureau of Labor Statistics: Labor Force Data
Region Division
State County
Region Division
State County
Annually and monthly Current: 2013
Surveys representative sample of the U.S. population
(continued)

A-3
Table A.1 Potential Sources of Auxiliary Data (continued)
Dataset Geographical
Variables Linking Variables with
NSDUH Years Data Collected Population Bureau of Economic Analysis:
Income Region
Division State
County
Region Division
State County
Annually and monthly Current: 2013
Surveys representative sample of the U.S. population
Health and Retirement Study [Not publicly available] State
County
State County
Every 2 years Current: 2010-2012
Surveys representative sample of the population aged 50 years or older
Healthcare Cost and Utilization Project: Kids' Inpatient Database
State State Annually Current: 2009
Reports hospital information on youths and children aged 20 years or younger
Healthcare Cost and Utilization Project: Nationwide Inpatient Sample
State County
State County
Annually Current: 2010
Reports discharge data from 1,051 hospitals located in 45 states, approximating a 20% stratified sample of U.S. community hospitals
Healthcare Cost and Utilization Project: Nationwide Emergency Department Sample
Region Region Annually Current: 2010
Surveys a 20% stratified sample of U.S. hospital-based emergency departments covering 28 states
Healthcare Cost and Utilization Project: State Inpatient Databases
State
State
Annually Current: 2011
Surveys inpatient information from hospitals in 30 states
Health Tracking Household Survey
[Not publicly available] Region
Division State
County
Region Division
State County
Current: 2010 Surveys representative sample of the U.S. population
Health Tracking Physician Survey
Location of physician practice:
likely includes state and ZIP Code
State ZIP Code
Current: 2008 Surveys physicians in the United States who provide direct patient care for at least 20 hours per week, excluding federal employees and specialists in fields where the primary focus is not direct patient care
Medical Expenditure Panel Survey
[Some variables restricted]
Region Division
State
Region Division
State
Annually Current: 2011
Surveys representative sample of the U.S. population
(continued)

A-4
Table A.1 Potential Sources of Auxiliary Data (continued)
Dataset Geographical
Variables Linking Variables with
NSDUH Years Data Collected Population National Center for Education
Statistics: Early Childhood Longitudinal Study
[Not publicly available] ZIP Code tabulation
Tract
Tract Waves of data collected: 1998-1999, 1999-2000,
2001-2002, 2003-2004, and 2006-2007
Surveys representative sample of children in each cohort
National Center for Education Statistics: National Household Education Surveys Program
Not specified Not specified Every 2 years Current: 2007
Surveys representative sample of children aged 3 to 6 years (not in school) and children and youths through 12th grade
National Center for Education Statistics: The Common Core of Data
Not specified Not specified Annually Current: 2010-2011
Reports information on schools and school staff
National Center for Health Statistics: Mortality Data
State State Annual Reports information from death registries
National Crime Victimization Survey
Region [Not publicly available]
Division State
County County subdivision
Place Tract Block
Region Division
State County
Annually Current: 2011
Surveys representative sample of U.S. population
National Survey of Children's Health
State ZIP Codes may be available in the full restricted dataset
State 2003-2004, 2007-2008, 2010-2012
Surveys representative sample of children aged 0 to 17 years old
National Forensic Laboratory Information System
Region Others possible;
laboratory location may be included
Region Annually Current: 2012
Reports information from state and local laboratory systems, representing 288 individual laboratories
(continued)

A-5
Table A.1 Potential Sources of Auxiliary Data (continued)
Dataset Geographical
Variables Linking Variables with
NSDUH Years Data Collected Population National Health and Nutrition
Examination Survey [Not publicly available]
State County
State County
Annually Current: 2012
Surveys representative sample of the U.S. population
National Longitudinal Survey of Youth and the child/young adult supplement
[Not publicly available] Region
Division State
County
Region Division
State County
Baseline cohorts in 1979 and 1997
Surveys representative sample of the U.S. youth population at baseline
National Mental Health Services Survey
Region Division
State County
Region Division
State County
Current: 2010 Surveys mental health provider facilities
National Survey of Child and Adolescent Well-Being
[Not publicly available] Region
Division State
County
Region Division
State County
Baseline: 2008-2009 Wave 2: 2009-2011
Surveys sample of cases investigated/assessed by local child protective services agencies, and includes opened and unopened cases
National Vital Statistics System Region Division
State County
Region Division
State County
Annually Current: 2011
Surveys representative sample of the U.S. population
Panel Study of Income Dynamics
[Not publicly available] County
ZIP Code Tract Block
County ZIP Code
Tract
Every 2 years Current: 2009
Surveys representative sample of the U.S. population
Parity law information State State Current: 2012 Reports on state mental health policy information Rural-Urban Continuum Codes County County Current: 2003
Youth Risk Behavior Surveillance System (National)
State State Biannually Current: 2011
Surveys representative sample of students in 9th through 12th grade, including private schools
(continued)
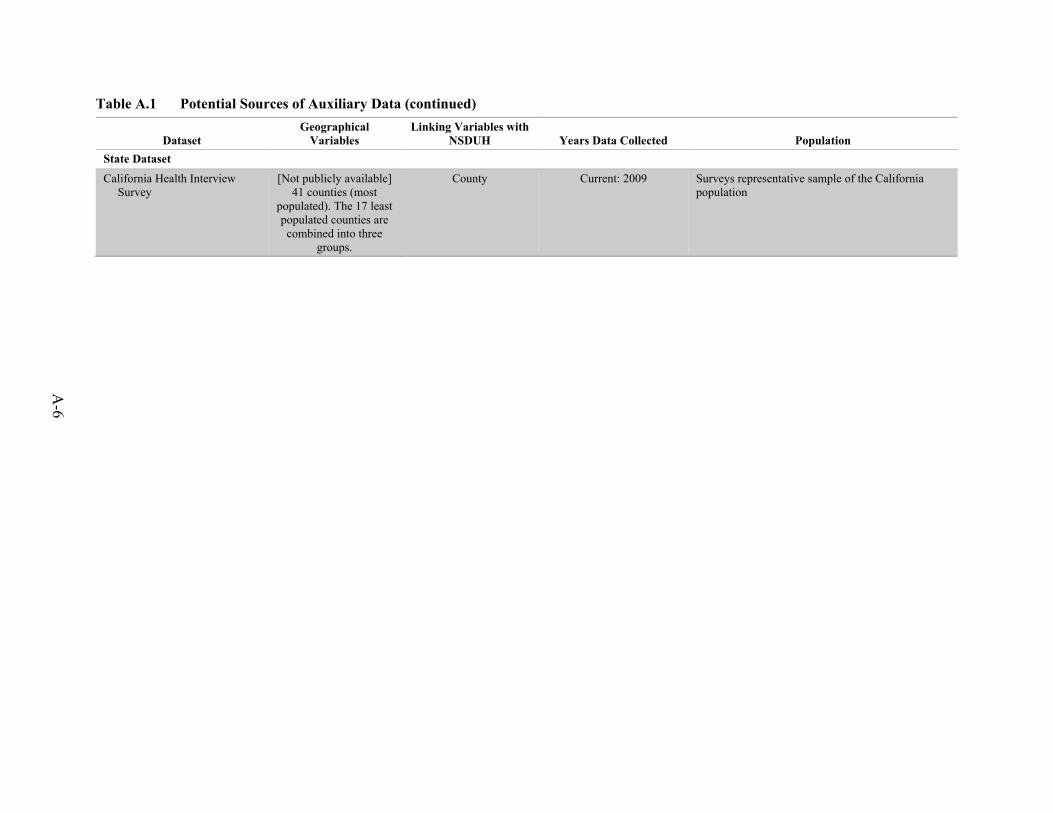
A-6
Table A.1 Potential Sources of Auxiliary Data (continued)
Dataset Geographical
Variables Linking Variables with
NSDUH Years Data Collected Population State Dataset California Health Interview
Survey [Not publicly available]
41 counties (most populated). The 17 least populated counties are combined into three
groups.
County Current: 2009 Surveys representative sample of the California population