Mercer Capital's Value Focus: Auto Dealer Industry | Year-End 2015
Upload
mercer-capitalCategory
view
75download
0
An Overview of the Medical Device Industry
Sujan Rajbhandary, CFA Mercer Capital [email protected] 901.685.2120
September 2016 © 2016 Mercer Capital // Business Valuation & Financial Advisory Services

Medical Device Industry Services Mercer Capital provides valuation services to start ups, larger public and private companies, and private equity and venture capital funds.
Mercer Capital’s expertise in the medical device industry spans the following segments:
• Cardiovascular
• Orthopedic & Spinal
• Biologics
• Dental
• Diagnostics Equipment
Our services include: • Purchase price allocations
• Impairment testing
• Portfolio valuation for LP reporting
• Transaction and valuation advisory
• Equity compensation valuation for 409a compliance
© 2016 Mercer Capital // Business Valuation & Financial Advisory Services // www.mercercapital.com 2
Sujan Rajbhandary, CFA [email protected] 901.685.2120
Travis W. Harms, CFA, CPA/ABV [email protected] 901.685.2120
Contact Us Medical Device Professionals
MERCER CAPITAL Memphis | Dallas | Nashville www.mercercapital.com

Lifecycle: Stages and Players

Year 0
Material discovery
Technological advancement, e.g. enhanced circuit density
Conceptualize application
Years 1 - 3
Prototype
Obtain patents and other IP protection
Animal trials
Years 4 - 10
Human trials
Sell product(s) to regulators
Years 10 – 20 and beyond
Secure reimbursement – sell to government / private insurers
Sell to customers – physician training
Achieve consumer adoption / satisfaction
Satisfice regulators, continuously
Incremental innovations
Lifecycle
© 2016 Mercer Capital // Business Valuation & Financial Advisory Services // www.mercercapital.com 4
Of Technology / Product / Platform
Discovery Early Development
Late Development Commercialization Maturity
Timeline shown is demonstrative, not definitive

Year 0
Research universities
Corporate labs
Physicians
Government and corporate funding
Years 1 - 3
Research universities or labs
CROs
Physicians
Venture capital (incl. CVC)
Years 4 - 10
Researchers
CROs
Venture capital (incl. CVC)
FDA
Years 10 – 20 and beyond
VCs exit
Clinicians – customers
Patients – consumers
Insurers – payers
Salespeople and other support
FDA
Lifecycle
© 2016 Mercer Capital // Business Valuation & Financial Advisory Services // www.mercercapital.com 5
Of Technology / Product / Platform
Discovery Early Development
Late Development Commercialization Maturity
Timeline shown is demonstrative, not definitive

Follow the Money: Price Feedback Loop?

Follow the Money
© 2016 Mercer Capital // Business Valuation & Financial Advisory Services // www.mercercapital.com
Purchasing Decision Largely Disconnected from Price
Consumers Patients
Investors Government
VC (incl. CVC) Physicians
Customers Physicians / Surgeons Hospitals
Researchers Universities
Labs Physicians
Device Manufacturers
Regulators FDA
Government
Payers Government
insurers Private insurers
7

Valuation is a Function of: Cash Flow, Growth, and Risk

Cash Flow, Growth, and Risk
© 2016 Mercer Capital // Business Valuation & Financial Advisory Services // www.mercercapital.com 9
Demand – Demographics is Destiny
0.0% 10.0% 20.0% 30.0% 40.0% 50.0% 60.0% 70.0% 80.0% 90.0% 100.0%
2060P
2012
1960
USPopulationDistributionbyAgeGroup0-17 18-44 45-64 65-84 85andOver
Data source: US Census Bureau
Cash Flow, Growth, and Risk
© 2016 Mercer Capital // Business Valuation & Financial Advisory Services // www.mercercapital.com 10
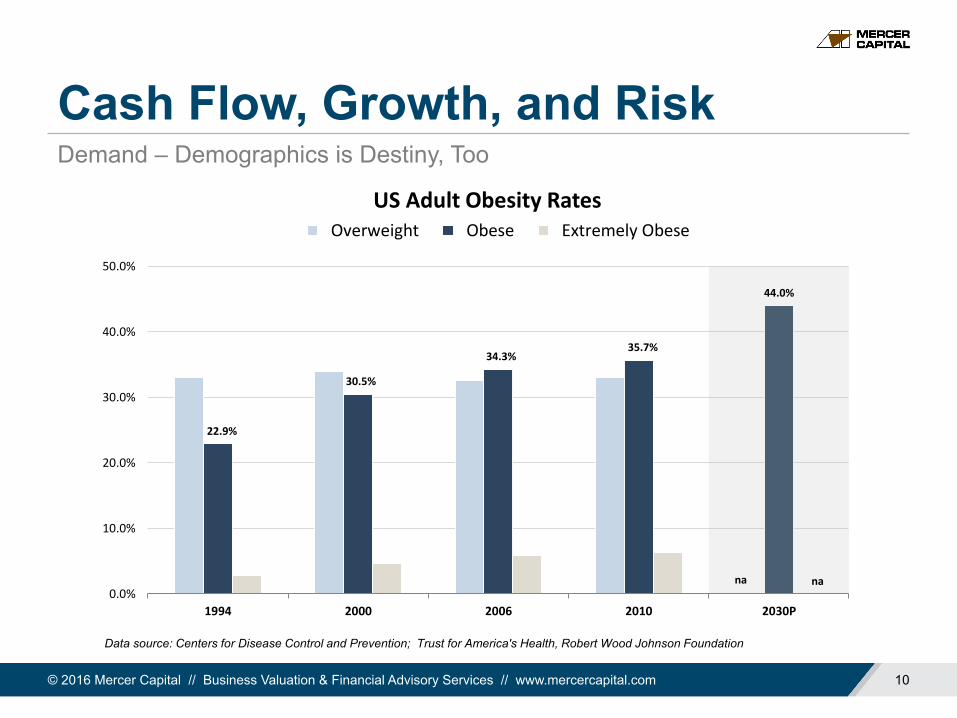
Demand – Demographics is Destiny, Too
na
22.9%
30.5%
34.3%35.7%
44.0%
na0.0%
10.0%
20.0%
30.0%
40.0%
50.0%
1994 2000 2006 2010 2030P
USAdultObesityRatesOverweight Obese ExtremelyObese
Data source: Centers for Disease Control and Prevention; Trust for America's Health, Robert Wood Johnson Foundation

Cash Flow, Growth, and Risk
© 2016 Mercer Capital // Business Valuation & Financial Advisory Services // www.mercercapital.com 11
Those who Pay, (Hope to) Get a Say
0%
20%
40%
60%
80%
100%
1965 2013 2024P
Payor Mix - Health Consumption ExpendituresMedicare / Medicaid Private Health Insurance Out-of-Pocket Other
Source: National Health Expenditures Accounts, Centers for Medicare & Medicaid Services [Amounts in current dollars]
$2.9 T $5.4 TTotal
Expenditures$37.2 B

Cash Flow, Growth, and Risk
© 2016 Mercer Capital // Business Valuation & Financial Advisory Services // www.mercercapital.com 12
People the World Over are Getting Richer – and Spending More on Healthcare Global Healthcare Expenditures
% of GDP Per Capita Growth, Ann. 2012 Payor Mix2012 2012 2005-12 Govt Private
Region*United States 18% $8,895 4% 46% 54%
Africa 6% $147 7% 52% 48%Americas ex US 7% $733 10% 58% 42%Eastern Mediterranean 5% $525 9% 53% 47%Europe 8% $2,349 5% 67% 33%South-East Asia 4% $129 11% 50% 50%West Pacific 7% $982 8% 72% 28%
Select CountriesAustralia 9% $6,014 10% 66% 34%Brazil 9% $1,056 15% 46% 54%Canada 11% $5,741 8% 70% 30%China 5% $322 22% 56% 44%France 12% $4,690 3% 77% 23%Germany 11% $4,683 4% 76% 24%India 4% $61 10% 33% 67%Israel 8% $2,289 6% 62% 38%Japan 10% $4,752 7% 82% 18%Mexico 6% $618 4% 52% 48%Norway 9% $9,055 5% 85% 15%Republic of Korea 8% $1,703 8% 54% 46%Russian Federation 6% $887 18% 61% 39%Singapore 5% $2,426 13% 38% 62%United Kingdom 9% $3,647 2% 83% 17%
*Expenditures (US Dollars) and share statistics shown are averages for the regions. Growth rates are medians for the regions
Source: Global Health Expenditures Database, World Health Organization

Cash Flow, Growth, and Risk
© 2016 Mercer Capital // Business Valuation & Financial Advisory Services // www.mercercapital.com 13
On the one hand
The process of selling new products to
regulators and insurers is long and arduous
On the other hand
These difficulties create substantial barriers to entry
Regulation Cuts Both Ways

Cash Flow, Growth, and Risk
© 2016 Mercer Capital // Business Valuation & Financial Advisory Services // www.mercercapital.com 14
Is Risk/Reward Getting Less Favorable for Early Investors?
0.0%
2.0%
4.0%
6.0%
8.0%
10.0%
12.0%
14.0%
16.0%
$0.0
$0.2
$0.4
$0.6
$0.8
$1.0
$1.2
$1.4
$1.6
Q1 1995
Q1 96 Q1 97 Q1 98 Q1 99 Q1 2000
Q1 01 Q1 02 Q1 03 Q1 04 Q1 2005
Q1 06 Q1 07 Q1 08 Q1 09 Q1 2010
Q1 11 Q1 12 Q1 13 Q1 14 Q1 2015
Q1 16
Billions Venture Capital Investments in Medical Devices
Medical Devices & Equipment Medical Device % of Total VC Investments

Industry Summary: Features, Snapshot, and M&A Trends
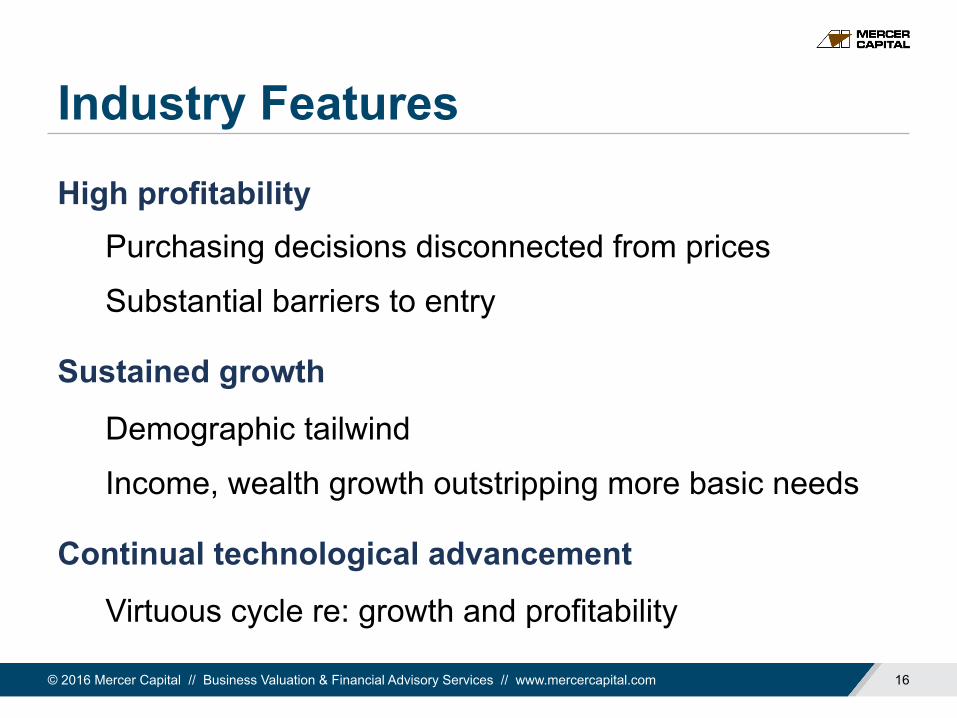
Industry Features
High profitability Purchasing decisions disconnected from prices
Substantial barriers to entry
Sustained growth
Demographic tailwind
Income, wealth growth outstripping more basic needs
Continual technological advancement
Virtuous cycle re: growth and profitability
© 2016 Mercer Capital // Business Valuation & Financial Advisory Services // www.mercercapital.com 16

Industry Snapshot
© 2016 Mercer Capital // Business Valuation & Financial Advisory Services // www.mercercapital.com 17
Public Medical Device Companies // Select Operating Metrics
Median measures for each group. | Data Source: Bloomberg; Mercer Capital Analysis
Gross Margin EBITDA Margin Operating Margin R&D / Revenue
Segment Q2 2016 Q1 2016 Q2 2016 Q1 2016 Q2 2016 Q1 2016 Q2 2016 Q1 2016
Large, Diversified 66.7% 66.0% 26.7% 26.3% 14.0% 13.6% 7.2% 7.2%
IVD & Life Sciences 55.0% 55.3% 15.0% 14.6% 10.3% 10.0% 9.1% 9.2%
Cardiovascular 66.1% 66.3% 18.8% 17.6% 8.4% 7.4% 12.4% 12.3%
Ortho, Implants & Prosthetics 69.5% 69.3% 17.3% 17.2% 8.2% 8.0% 7.0% 7.0%
Other 53.3% 53.6% 5.8% 4.4% -1.0% -0.9% 8.1% 8.2%
All Companies 58.1% 57.8% 16.3% 15.7% 8.2% 8.0% 7.9% 7.9%
Historical Rev Growth LT Fwd Op Earn Grwth Debt / EV Debt / EBITDA
Segment Quarterly Annual Q2 2016 Q1 2016 Q2 2016 Q1 2016 Q2 2016 Q1 2016
Large, Diversified 1.0% 2.5% 11.2% 11.4% 14.8% 18.4% 2.6 2.7
IVD & Life Sciences 2.1% 2.7% 12.5% 14.0% 5.5% 4.9% 1.5 1.4
Cardiovascular 2.7% 5.0% 17.5% 16.5% 9.1% 10.6% 1.0 0.8
Ortho, Implants & Prosthetics 1.9% 5.6% 14.1% 14.3% 20.3% 23.2% 2.7 2.7
Other 2.5% 5.3% 14.0% 13.1% 8.0% 6.2% 0.5 0.4
All Companies 2.4% 4.5% 13.6% 13.4% 10.4% 10.5% 1.3 1.4

Industry Trends
Consolidation
• Efficient sales channels – relatively small number of physicians responsible for much/all buying decisions
• Concentration of product families tends to give rise to complementary portfolios
• Potential for operating leverage – specialized selling process, low capital intensity, thin layer of administrative support
Acquisition of new technology
Direct selling vs. using stocking distributors
© 2016 Mercer Capital // Business Valuation & Financial Advisory Services // www.mercercapital.com 18
M&A Motivations

About Mercer Capital Mercer Capital is a national business valuation and financial advisory firm.
We offer a broad range of services, including corporate valuation, financial institution valuation, financial reporting valuation, gift and estate tax valuation, M&A advisory, fairness opinions, ESOP and ERISA valuation services, and litigation and expert testimony consulting.
We have provided thousands of valuation opinions for corporations of all sizes in a wide variety of industries. Our valuation opinions are well-reasoned and thoroughly documented, providing critical support for any potential engagement.
Our work has been reviewed and accepted by the major agencies of the federal government charged with regulating business transactions, as well as the largest accounting and law firms in the nation in connection with engagements involving their clients.
For over thirty years, Mercer Capital has been bringing uncommon professionalism, intellectual rigor, technical expertise, and superior client service to a broad range of public and private companies and financial institutions located throughout the world. Feel confident in our experience and expertise.
Mercer Capital Memphis | Dallas | Nashville 800.769.0967 // www.mercercapital.com
© 2016 Mercer Capital // Business Valuation & Financial Advisory Services // www.mercercapital.com 19

Mercer Capital’s Core Services Valuation & Financial Opinions
• Litigation Related Expert Witness Opinions
• Succession & Shareholder Planning
• Valuations for Corporate Tax Planning
• Valuations for Gift & Estate Tax Planning
• Fairness Opinions
• ESOP & ERISA Advisory Services
• Bankruptcy Related Valuation Services
• Valuations for Buy-Sell Agreements
Transaction Advisory Services • M&A and investment banking services
• Fairness Opinions
• Buy-sell Agreements & Private Company Transactions
• Strategic Assessments
© 2016 Mercer Capital // Business Valuation & Financial Advisory Services // www.mercercapital.com 20
Litigation Support Services • Statutory Fair Value
• Business Damages & Lost Profits
• Valuation, Labor & Contract Disputes
• Family Law & Divorce
• Tax Related Controversies
• Corporate Restructuring & Dissolution
• Initial Consultation & Analysis
• Testimony & Trial Support
Financial Reporting Valuation Services • Purchase Price Allocation Services
• Impairment Testing Services
• Portfolio Valuation Services
• Equity-Based Compensation Valuation Services