��Mercatus Working Paper The Housing Market Crash
44
WORKING PAPER THE HOUSING MARKET CRASH By Todd J. Zywicki and Gabriel Okloski No. 09-35 September 2009 The ideas presented in this research are the authors’ and do not represent official positions of the Mercatus Center at George Mason University.
Transcript of ��Mercatus Working Paper The Housing Market Crash

WORKING PAPERTHE HOUSING MARKET CRASH
By Todd J. Zywicki and Gabriel Okloski
No. 09-35September 2009
The ideas presented in this research are the authors’ and do not represent official positions of the Mercatus Center at George Mason University.
Mercatus Working Paper – The Housing Market Crash
By Todd J. Zywicki and Gabe Okloski
Introduction
Beginning in 2007 and continuing into 2008 and 2009, the residential real-estate
market was roiled by tumult unprecedented in recent American history. Widespread
foreclosures and a collapse in home prices in many areas of the country spawned an
ongoing global financial crisis. Although home prices have fallen precipitously in many
areas of the country and foreclosures have risen to all-time highs, the end of the crisis still
may not be in sight. The United States government has engineered a series of
unprecedented market interventions designed to stabilize the housing market and the
financial markets dependent on mortgage-backed securities.
Consumer borrowing secured by residential real estate grew substantially over the
past several years, due to a number of factors that tend to increase the value of housing by
increasing the willingness of purchasers to pay higher prices for the houses. Standard
economics thus provides a compelling explanation for much of the increase in household
mortgage obligations—low interest rates, high effective tax rates, and the increased
capital value of residential real estate. Other factors, moreover, are more difficult to
explain by fundamentals, such as the prevalence of a large number of speculative
investors in some of the major boom and bust markets.
This working paper focuses on underlying questions related to consumer behavior
and looks at the impact of these developments in the housing market on household
financial condition. Specifically, this paper looks at the factors that drove consumer
demand during the “bubble” market that later popped with such widespread effects. It

particularly investigates foreclosure as a rational decision on the part of consumers who
responded to various incentives put in place before the eventual fall of housing prices and
crash in the housing market.
The Rise and Fall of the Mortgage Market
In contrast to this relative stability in the overall housing and residential mortgage
market between 1980 and 2000, recent years have seen an unprecedented rise and
implosion of the residential mortgage market, especially the rapid development of the
subprime mortgage market. These events have given rise to major woes in the American
real-estate market and overall economy and have major implications for thinking about
consumer lending markets generally.
The mortgage market collapse can be studied from many different perspectives.
Many commentators have focused on the impact of mortgage lending crisis on the
financial side of the issue, such as the collapse of leading investment banks and
governmental efforts to stabilize the financial economy. The discussion in this working
paper, by contrast, will focus on the consumer side of the market, examining the real-
estate and mortgage market to determine what it can tell us about consumer behavior
more generally.
Homeownership and Economic Welfare
Homeownership can be a transformative life experience, both economically and
psychologically. Homeownership historically has been an important source of wealth for
American households and the primary method of wealth accumulation for low and
moderate-income people. 1 According to the 2004 Survey of Consumer Finances, a
family that owns a home on average has $624,900 in average wealth (median of
$184,400) and the average renter family has $54,100 ($4,000 median). The impact of
homeownership on increasing the wealth of lower-income families is especially
important, as low-income families generally do not own financial assets. In 2001, for
example, the average low-income homeowner (annual income is less than $20,000) had
nearly $73,000 in net wealth, compared with a similar renter with only $900 of net
wealth.2 In fact, homeownership has been such a potent vehicle for wealth accumulation
that the polarization of wealth between homeowners and renters has risen dramatically,
even as the wealth polarization among different income classes has decreased.3 Low-
income and even middle-class homeowners rely on homeownership for the majority of
their net worth—almost 80 percent of the wealth of low-income households is in
residential real estate.4 The richest quintile by income is the only income group that
holds stock wealth in equal value to their home equity. The bottom four quintiles
typically have home equity equal to at least twice the value of their stocks.5
In addition to improving the asset side of the household balance sheet,
homeownership also may be valuable to the liabilities side of the balance sheet. The
Federal Reserve’s financial obligations ratio calculates the percentage of household
1 Thomas P. Boehm & Alan Schlottmann, DEP’T OF HOUS. & URBAN DEV., Wealth Accumulation and Homeownership: Evidence for Low-Income Households 11–14 (2004), available at http://www.huduser.org/Publications/pdf/WealthAccumulationAndHomeownership.pdf. 2 Zhu Xiao Di, Housing Wealth and Household Net Wealth in the United States: A New Profile Based on the Recently Released 2001 SCF Data 10 (Harvard U., Joint Ctr. for Hous. Studies Working Paper No. W03-8, 2003). 3 See Conchita D’Ambrosio & Edward N. Wolff, Is Wealth Becoming More Polarized in the United States? 14–16 (Jerome Levy Economics Inst. of Bard College Working Paper No. 330, 2001), available at http://ssrn.com/abstract=276900. Wealth inequality appears to have increased over time, but wealth “polarization” is different from “inequality” in that polarization studies the clustering of homogeneous groups, such as homeowners, within a heterogeneous population. See id. at 2. Thus, it is a more useful tool for examining the effect on wealth of particular subsets, such as homeowners. 4 Di, supra note 2. 5 Id.
income dedicated to monthly payment obligations, including monthly rental payments on
homes, apartments, and automobiles, real-estate tax obligations, and the debt-service
burden, which includes monthly payments on mortgages, car payments, student loans,
and credit cards.6 The household financial obligations ratio (“FOR”) is substantially
higher for those households that rent compared to those that own their homes.7 Data
indicates that homeowners also save more than do non-homeowners.8 Although some of
this difference surely is attributable to the fact that homeowners generally have higher
incomes than renters, renters also are more likely to revolve credit card debt and to hold
student loan debt, both of which generally carry higher interest rates than mortgage debt.
In addition to these direct benefits, homeownership apparently has a number of
indirect benefits. For instance, homeownership is correlated with a substantial increase in
one’s propensity to vote, dramatic improvements in children’s life outcomes, and
improvements in labor-market outcomes. Homeownership also creates incentives to
improve property, generally increases life satisfaction, and is correlated with a reduction
in crime rates. 9 Recent research, however, questions the long-believed causal link
between homeownership and these other benefits, arguing instead that there is a selection
mechanism at work, i.e., that people with certain attributes tend to self-select into
homeownership, or that other factors (such as reduced mobility caused by
homeownership) explain the relationship between homeownership and observed positive
6 See FED. RES. BOARD, HOUSEHOLD DEBT SERVICE AND FINANCIAL OBLIGATIONS RATIOS (June 10, 2008), available at http://www.federalreserve.gov/Releases/housedebt/. 7 The Federal Reserve defines these measures as follows: “The household debt service ratio (DSR) is an estimate of the ratio of debt payments to disposable personal income. Debt payments consist of the estimated required payments on outstanding mortgage and consumer debt. The financial obligations ratio (FOR) adds automobile lease payments, rental payments on tenant-occupied property, homeowners' insurance, and property tax payments to the debt service ratio.” 8 Ed Gramlich, Subprime Mortgages: America’s Latest Boom and Bust 75–77 (2007). 9 See id. at 58–60; Christopher E. Herbert & Eric S. Belsky, DEP’T OF HOUS. & URBAN DEV., The Homeownership Experience of Low-Income and Minority Families: A Review and Synthesis of the Literature (Feb. 2006); Robert D. Dietz & Donald R. Haurin, The Social and Private Micro-Level Consequences of Homeownership, 54 J. URB. ECON. 401 (2003).
outcomes. 10 Thus, while there is a correlation between homeownership and many
personal and social benefits, that correlation may not be causal in nature. There are costs
to homeownership as well, notably increased sprawl and a less mobile labor force.11
Nonetheless, policymakers have long (and somewhat reasonably, based on prevailing
data) believed that the benefits of widespread homeownership outweigh the costs, and,
therefore, expanding homeownership rates historically has been a linchpin of American
financial and social policy.12
The Growth in Homeownership
Homeownership grew rapidly beginning in the mid-1990s and continued to rise until it
reached its peak in 2004, as seen in figure 1, below:
10 See discussion in Kristopher S. Gerardi & Paul S. Willen, Subprime Mortgages, Foreclosures, and Urban Neighborhoods, FED. RES. BANK OF BOSTON No. 08-6 (Dec. 22, 2008). 11 Fernando Ferreira, Joseph Gyourko & Joseph Tracy, Housing Busts and Household Mobility (Nat’l Bureau of Econ. Research Working Paper No. 13410, 2008), available at http://www.nber.org/papers/w14310; Robert D. Dietz & Donald R. Haurin, The Social and Private Micro-Level Consequences of Homeownership, 54 J. URB. ECON. 401, 405 (2003). 12 See Melissa B. Jacoby, Homeownership Risk Beyond a Subprime Crisis: The Role of Delinquency Management, 76 FORDHAM L. REV. 2261 (2008).
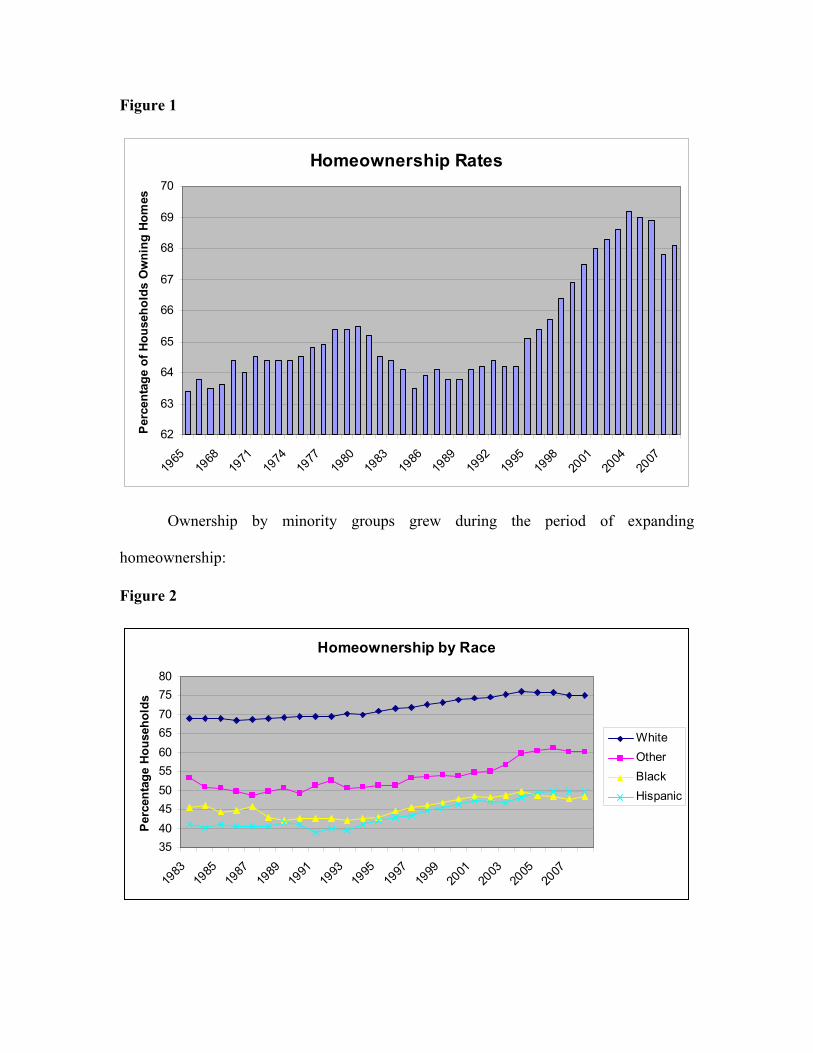
Figure 1
Homeownership Rates
62
63
64
65
66
67
68
69
70
1965
1968
1971
1974
1977
1980
1983
1986
1989
1992
1995
1998
2001
2004
2007
Perc
enta
ge o
f Hou
seho
lds
Ow
ning
Hom
es
Ownership by minority groups grew during the period of expanding
homeownership:
Figure 2
Homeownership by Race
35404550556065707580
1983
1985
1987
1989
1991
1993
1995
1997
1999
2001
2003
2005
2007
Perc
enta
ge H
ouse
hold
s
WhiteOtherBlackHispanic
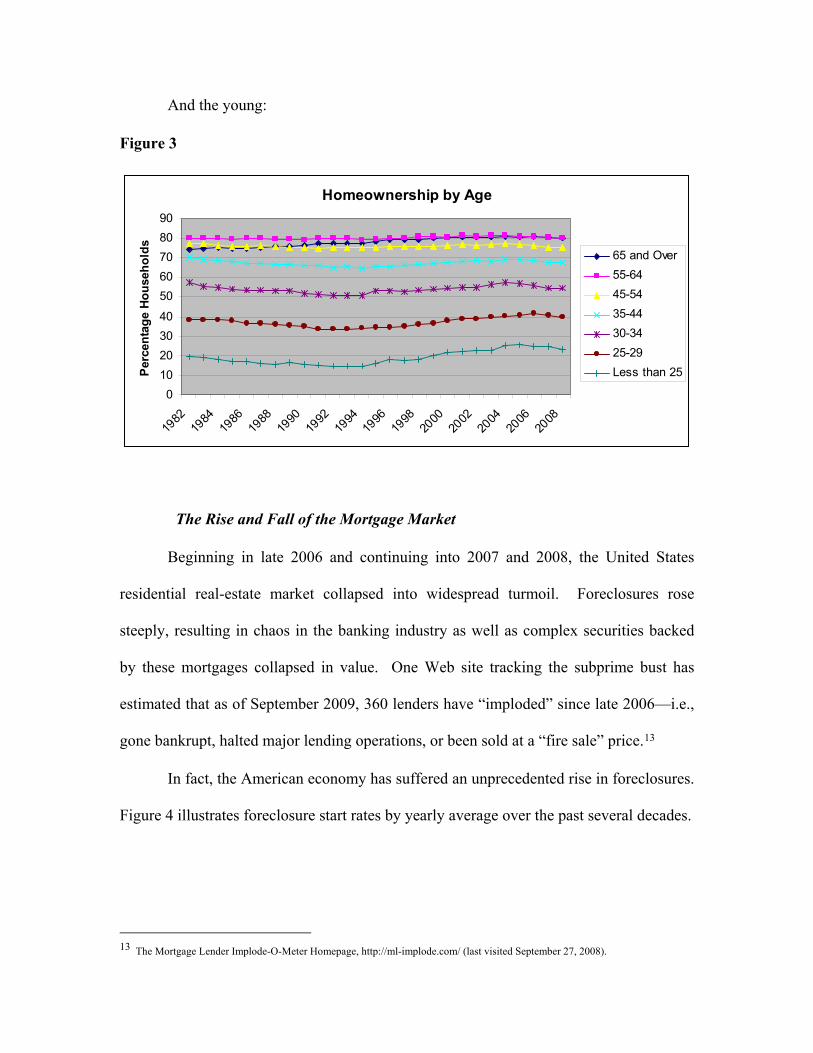
And the young:
Figure 3
Homeownership by Age
010203040
5060708090
1982
1984
1986
1988
1990
1992
1994
1996
1998
2000
2002
2004
2006
2008
Perc
enta
ge H
ouse
hold
s
65 and Over55-6445-5435-4430-3425-29Less than 25
The Rise and Fall of the Mortgage Market
Beginning in late 2006 and continuing into 2007 and 2008, the United States
residential real-estate market collapsed into widespread turmoil. Foreclosures rose
steeply, resulting in chaos in the banking industry as well as complex securities backed
by these mortgages collapsed in value. One Web site tracking the subprime bust has
estimated that as of September 2009, 360 lenders have “imploded” since late 2006—i.e.,
gone bankrupt, halted major lending operations, or been sold at a “fire sale” price.13
In fact, the American economy has suffered an unprecedented rise in foreclosures.
Figure 4 illustrates foreclosure start rates by yearly average over the past several decades.
13 The Mortgage Lender Implode-O-Meter Homepage, http://ml-implode.com/ (last visited September 27, 2008).

Figure 4
Foreclosures
0
0.2
0.4
0.6
0.8
1
1.2
1986
1988
1990
1992
1994
1996
1998
2000
2002
2004
2006
2008
The surge in foreclosures is often attributed to the growth of the subprime
segment of the market during the 1990s and 2000s and the extension of mortgages to
high-risk consumers who historically were locked out of the mortgage market. Congress,
the Department of Housing and Urban Development, and Fannie Mae and Freddie Mac
all encouraged more lending to higher-risk borrowers.14 Others have argued that this
growth in high-risk lending was spawned by the rise of securitization of mortgages by
Wall Street, which created an “originate to distribute” model of reckless lending.15
Whatever the inspiration for increased lending to higher-risk borrowers, to make these
loans possible mortgage originators developed a variety of novel lending products, such
as no or low downpayments, interest-only loans, reverse amortization, no- or low-
documentation loans, and loans with high loan-to-value (LTV) ratios. In turn, many of
14 Russell Roberts, House Government Stoked the Mania, WALL ST. J., Oct. 3, 2008; Peter J. Wallison & Charles W. Calomiris, The Last Trillion-Dollar Commitment: The Destruction of Fannie Mae and Freddie Mac, AM. ENTER. INST. FOR PUB. POLICY RESEARCH, Sept. 30, 2008, available at http://www.aei.org/docLib/20080930_Binder1.pdf. 15 On the other hand, those involved at every step in the loan process from origination to securitization to default insurance have suffered massive losses from the collapse of the subprime market thus it doubtful that this “originate to distribute” model explains much of the rise and fall of the subprime market. See Todd J. Zywicki and Joseph A. Adamson, The Law and Economics of Subprime Lending, 80 U. COLO. L. REV. 1 (2009).
them were securitized and sold throughout the United States and the world leading to
global economic problems. Additionally, there was a severe deterioration in underwriting
standards during the subprime boom and growth in more risky loan products.
While foreclosures (like bankruptcy) often result from forces outside the
household’s control (such as unemployment), many consumers act rationally and respond
to incentives in deciding whether to permit default and foreclosure. Changing the
incentives to default will have an effect on the propensity of borrowers to default and
permit foreclosure, which results from three basic factors: adverse “trigger” events,
mortgage payment shock, and negative home equity. Each of these three factors has
dovetailed to contribute to the extraordinary foreclosure rates that developed.
Adverse Trigger Events.
Foreclosure can be caused by adverse life “trigger” events, such as job loss,
divorce, illness, or some other factor that causes an unexpected dramatic drop in
household income or increase in expenses. Although many of these factors are chronic
and universal aspects of the human condition, others can cause foreclosure spikes in
particular places at particular times. Macroeconomic trends play a substantial role in
increased mortgage default and delinquency.
Delinquencies and foreclosures began to rise in Michigan, Ohio, and Indiana,16
before the rest of the country as a result of troubles in the American automotive industry
and resultant layoffs and plant closures. 17 Major natural disasters may also trigger
16 Where Subprime Delinquencies are Getting Worse, WALL ST. J. ONLINE, Mar. 29, 2007, at Map 2, available at http://online.wsj.com/public/resources/documents/info-subprimemap07-sort2.html (click “Map 2” header) (data provided by First American Loan Performance). 17 Chris Mayer, Karen Pence & Shane M. Sherlund, The Rise in Mortgage Defaults, 23 JOURNAL OF ECONOMIC PERSPECTIVES 27-50 (2009),, at 45.
geographical surges in foreclosure, as resulted in the areas of Louisiana and Mississippi
affected by hurricane Katrina in 2005 following the expiration of a temporary
moratorium period.18 Problems in local labor markets also exert downward pressures on
local home prices, making refinancing more difficult and reducing incentives to retain a
home in the face of financial pressures. Thus, the adverse trigger events theory of
foreclosures explains some element of regional and temporal variations in foreclosures
over time.
Yet foreclosures rates in states such as California and Florida are much higher
than in these economically hard-hit states.19 Adverse trigger events plainly cannot explain
the record levels of foreclosures of recent years. Indeed, during the time that foreclosures
skyrocketed, the economy remained relatively robust, with low unemployment and
modest but positive economic growth. Indeed, whereas the adverse trigger events theory
posits that rising foreclosures result from recession and a slowing economy, during the
recent foreclosure crisis that basic causal relationship has been reversed—the dramatic
rise in foreclosures has caused the subsequent financial crisis and recession.
Moreover, foreclosure and delinquency do not necessarily indicate the presence of
unaffordable loans, predatory loans, rising interest rates, or borrowers under duress,
especially with respect to subprime loans. Borrowers face a number of options with their
loans—timely repayment, prepayment, delinquency, or default followed by foreclosure.
Although the latter two options typically are assumed to be evidence of financial distress,
the reality is more complicated. There is some evidence that subprime borrowers use
their mortgages as a type of line of credit and choose to miss an occasional payment and
18 Id. 19 See National Association of Realtors Field Guide to Foreclosures, updated February 2009, available at http://www.realtor.org/library/library/fg329.
remain delinquent in order to smooth temporary financial problems.20 In fact, loans that
are delinquent over a long period of time typically terminate in prepayment rather than
eventual default. 21 This counterintuitive finding suggests that these homeowners are
likely using the opportunity to remain delinquent to take advantage of the “free rent” of
the delinquency period, using the opportunity to miss payments in order to smooth their
income and manage their finances and to simply take advantage of the opportunity to
delay and develop a solution to the problem.22
Mortgage Payment Shock.
Foreclosure can also result from an unexpected increase in a household’s monthly
payment obligations. In recent years, this resulted from the proliferation of adjustable-
rate and “hybrid” ARM loans that had an initial period of a fixed “teaser” rate followed
by adjustable rates for the duration of the loan. The easy-money policies followed by the
Federal Reserve in the wake of the September 11, 2001 terrorist attacks opened up a
substantial gap in market interest rates between short-term and long-term mortgages.
Subsequent tightening of Fed monetary policy closed this gap, triggering resets on
mortgage payments at higher rates. Borrowers who took ARMs initially were able to
qualify for much larger principle amounts than was possible at long-term interest rates.
Many of the states with the greatest percentage of ARMs (especially California and
Florida) also saw the fastest run-ups in housing prices—and now the highest foreclosure
rates.
20 Cutts & Van-Order, On the economics of subprime lending at 172. Even with penalties, the cost of credit through a delinquent mortgage is often lower than the alternatives a subprime borrower faces. 21 Michelle A. Danis & Anthony Pennington-Cross, A Dynamic Look at Subprime Loan Performance 13 (Fed. Res. Bank of St. Louis, Working Paper 2005-029A, May 2005), available at http://research.stlouisfed.org/wp/2005/2005-029.pdf. 22 Id.
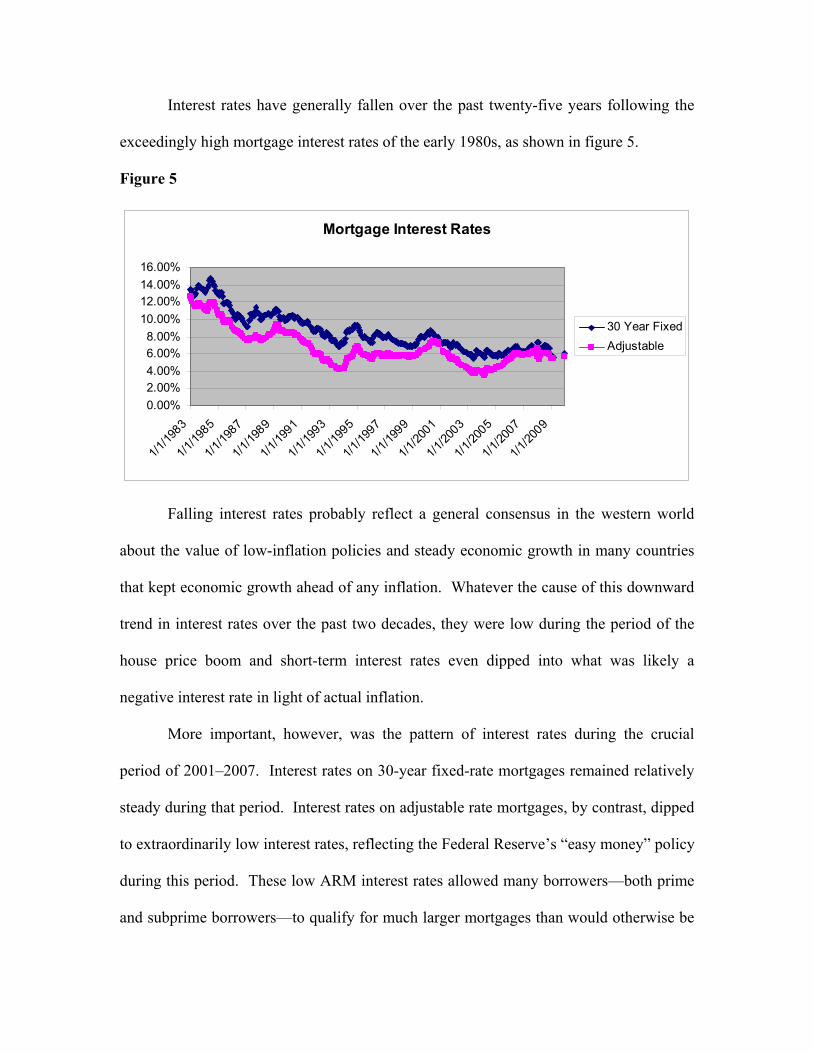
Interest rates have generally fallen over the past twenty-five years following the
exceedingly high mortgage interest rates of the early 1980s, as shown in figure 5.
Figure 5
Mortgage Interest Rates
0.00%2.00%4.00%6.00%8.00%
10.00%12.00%14.00%16.00%
1/1/19
83
1/1/19
85
1/1/19
87
1/1/19
89
1/1/19
91
1/1/19
93
1/1/19
95
1/1/19
97
1/1/19
99
1/1/20
01
1/1/20
03
1/1/20
05
1/1/20
07
1/1/20
09
30 Year FixedAdjustable
Falling interest rates probably reflect a general consensus in the western world
about the value of low-inflation policies and steady economic growth in many countries
that kept economic growth ahead of any inflation. Whatever the cause of this downward
trend in interest rates over the past two decades, they were low during the period of the
house price boom and short-term interest rates even dipped into what was likely a
negative interest rate in light of actual inflation.
More important, however, was the pattern of interest rates during the crucial
period of 2001–2007. Interest rates on 30-year fixed-rate mortgages remained relatively
steady during that period. Interest rates on adjustable rate mortgages, by contrast, dipped
to extraordinarily low interest rates, reflecting the Federal Reserve’s “easy money” policy
during this period. These low ARM interest rates allowed many borrowers—both prime
and subprime borrowers—to qualify for much larger mortgages than would otherwise be
the case. As can also be seen, however, beginning in 2004 the Federal Reserve began
raising interest rates, causing a dramatic rise in the ARM rate, until by 2006 the interest
rate on ARM and FRM mortgages had essentially converged.
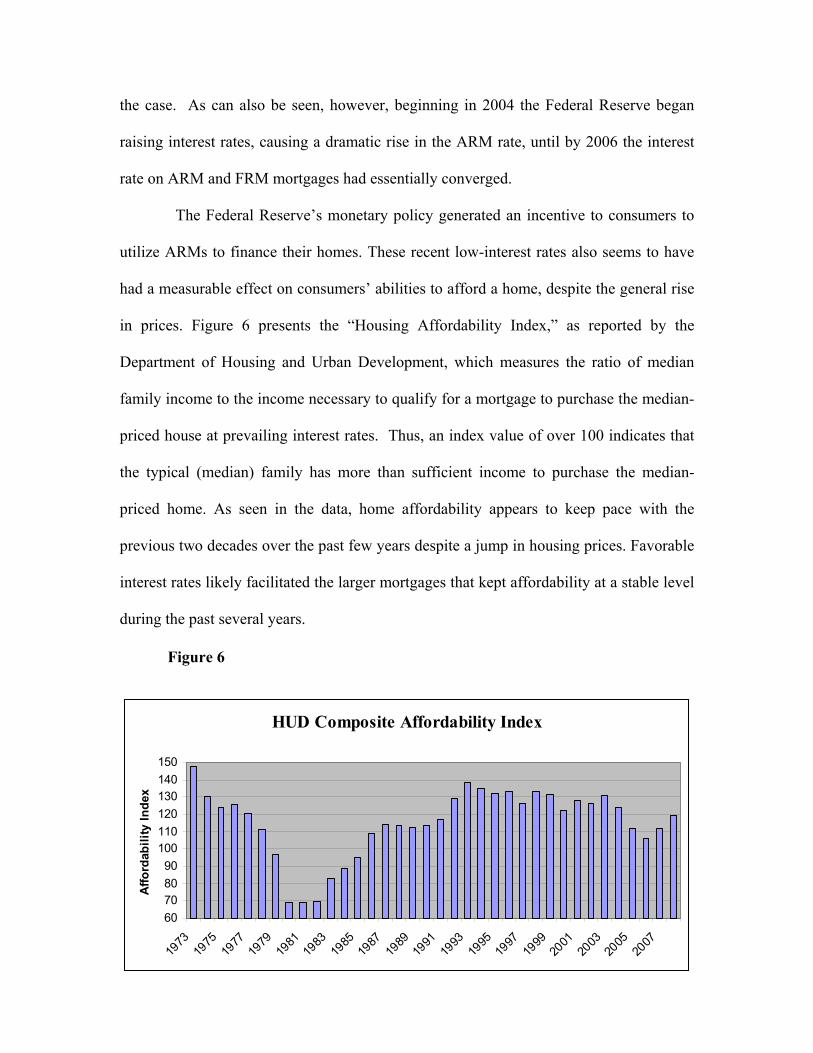
The Federal Reserve’s monetary policy generated an incentive to consumers to
utilize ARMs to finance their homes. These recent low-interest rates also seems to have
had a measurable effect on consumers’ abilities to afford a home, despite the general rise
in prices. Figure 6 presents the “Housing Affordability Index,” as reported by the
Department of Housing and Urban Development, which measures the ratio of median
family income to the income necessary to qualify for a mortgage to purchase the median-
priced house at prevailing interest rates. Thus, an index value of over 100 indicates that
the typical (median) family has more than sufficient income to purchase the median-
priced home. As seen in the data, home affordability appears to keep pace with the
previous two decades over the past few years despite a jump in housing prices. Favorable
interest rates likely facilitated the larger mortgages that kept affordability at a stable level
during the past several years.
Figure 6
HUD Composite Affordability Index
60708090
100110120130140150
1973
1975
1977
1979
1981
1983
1985
1987
1989
1991
1993
1995
1997
1999
2001
2003
2005
2007
Affo
rdab
ility
Inde
x

Despite relatively stable affordability during the recent rise in the housing market,
however, a large number of highly leveraged buyers became homeowners during this
time. Figure 7 shows data from the Federal Reserve on the mortgage debt service ratio—
the percentage of monthly income dedicated to mortgage debt service since 1980.
Figure 7
Mortgage DSR
0.040
0.045
0.050
0.055
0.060
0.065
0.070
0.075
0.080
0.085
1980
q1
1983
q1
1986
q1
1989
q1
1992
q1
1995
q1
1998
q1
2001
q1
2004
q1
2007
q1
Year
Prop
ortio
n of
Inco
me
The portion of disposable income, that is post-tax income, going to pay off
mortgage debt rises from 1980 to the early 1990s, after which it hovers around 6 percent
until a rise beginning in 2000. While the recent increase may be described in part by a
rising tax burden or the upward surge in the stock market, which left many homeowners
feeling wealthier and led them to convert stocks into larger mortgages, there is another
potential factor at play. Due to low-interest-rate loans and the increasing availability of
adjustable-rate mortgages, more financially marginal homeowners were likely entering
the market. Indeed, during the period that saw an increasing homeownership rate and
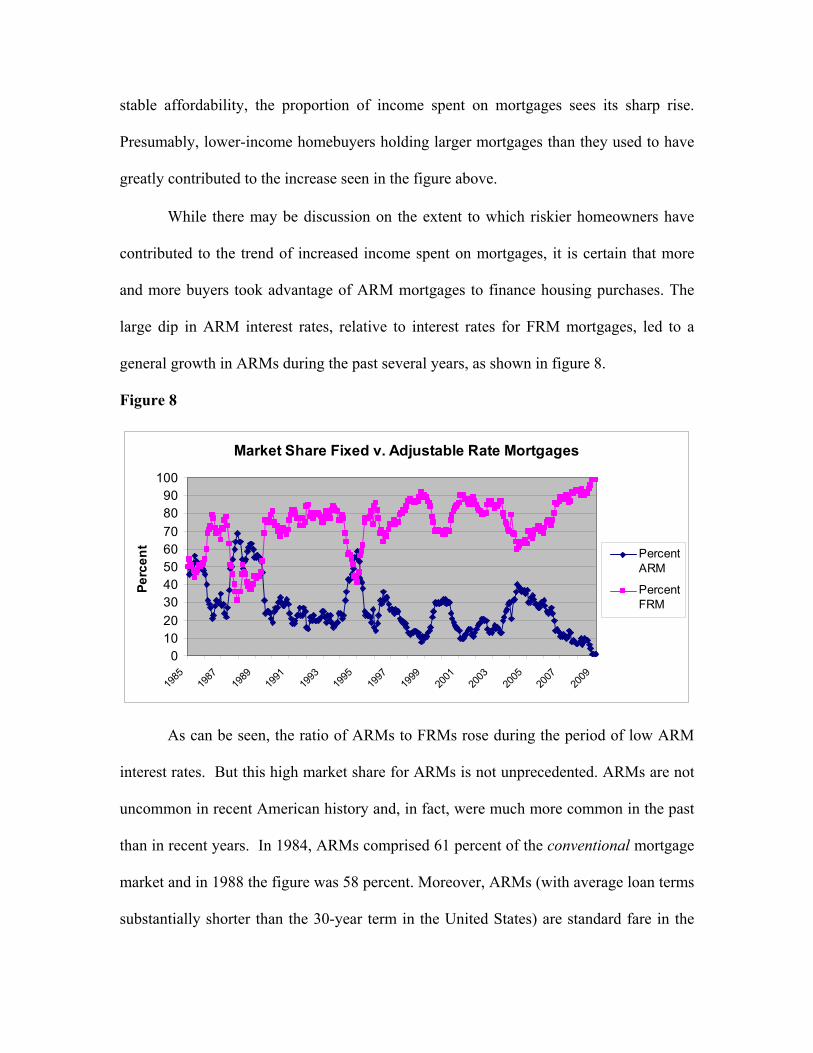
stable affordability, the proportion of income spent on mortgages sees its sharp rise.
Presumably, lower-income homebuyers holding larger mortgages than they used to have
greatly contributed to the increase seen in the figure above.
While there may be discussion on the extent to which riskier homeowners have
contributed to the trend of increased income spent on mortgages, it is certain that more
and more buyers took advantage of ARM mortgages to finance housing purchases. The
large dip in ARM interest rates, relative to interest rates for FRM mortgages, led to a
general growth in ARMs during the past several years, as shown in figure 8.
Figure 8
Market Share Fixed v. Adjustable Rate Mortgages
0102030405060708090
100
1985
1987
1989
1991
1993
1995
1997
1999
2001
2003
2005
2007
2009
Perc
ent
PercentARM
PercentFRM
As can be seen, the ratio of ARMs to FRMs rose during the period of low ARM
interest rates. But this high market share for ARMs is not unprecedented. ARMs are not
uncommon in recent American history and, in fact, were much more common in the past
than in recent years. In 1984, ARMs comprised 61 percent of the conventional mortgage
market and in 1988 the figure was 58 percent. Moreover, ARMs (with average loan terms
substantially shorter than the 30-year term in the United States) are standard fare in the
rest of the world and efforts to introduce the American 30-year fixed-rate mortgage have
generally failed. This suggests that ARMs are not inherently dangerous products.
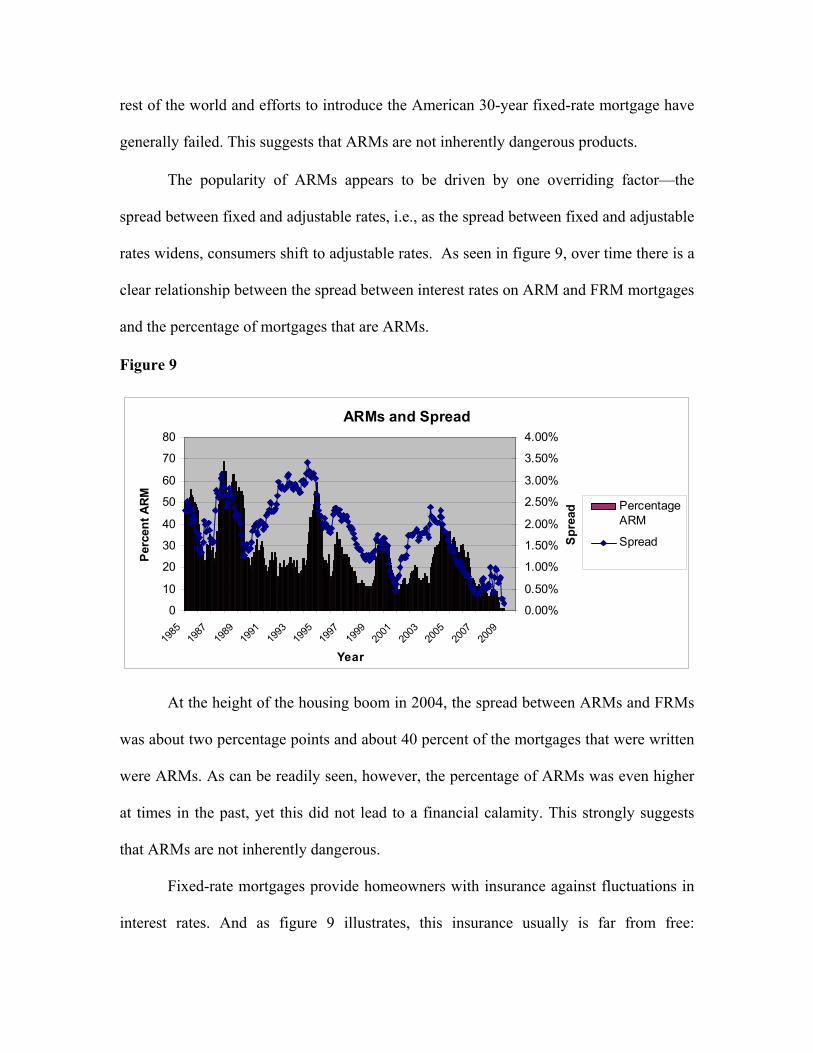
The popularity of ARMs appears to be driven by one overriding factor—the
spread between fixed and adjustable rates, i.e., as the spread between fixed and adjustable
rates widens, consumers shift to adjustable rates. As seen in figure 9, over time there is a
clear relationship between the spread between interest rates on ARM and FRM mortgages
and the percentage of mortgages that are ARMs.
Figure 9
ARMs and Spread
0
10
20
30
40
50
60
70
80
1985
1987
1989
1991
1993
1995
1997
1999
2001
2003
2005
2007
2009
Year
Perc
ent A
RM
0.00%
0.50%
1.00%
1.50%
2.00%
2.50%
3.00%
3.50%
4.00%
Spr
ead Percentage
ARM
Spread
At the height of the housing boom in 2004, the spread between ARMs and FRMs
was about two percentage points and about 40 percent of the mortgages that were written
were ARMs. As can be readily seen, however, the percentage of ARMs was even higher
at times in the past, yet this did not lead to a financial calamity. This strongly suggests
that ARMs are not inherently dangerous.
Fixed-rate mortgages provide homeowners with insurance against fluctuations in
interest rates. And as figure 9 illustrates, this insurance usually is far from free:
Borrowers pay about 100 basis points on average to avoid bearing this risk (and
sometimes more than 200 basis points). The risk of ARMs is that one’s mortgage interest
rate will rise if interest rates rise. But the equally obvious benefit of an ARM is that
one’s interest rate will fall if interest rates fall. Although adjustable-rate mortgages
appear unreasonably risky when interest rates rise, it must be recognized that they are
also equally beneficial when interest rates fall. For a fixed-rate borrower to benefit from
falling interest rates, she had to incur the substantial cost and hassle of refinancing the
mortgage as well as the uncertainty about whether interest rates would go still lower.
Because ARMs offer lower interest rates, they may also be especially attractive to
homeowners who plan to move within a few years and thus have little need to pay a
premium to buy “insurance” to hedge against long-term fluctuations in interest rates.
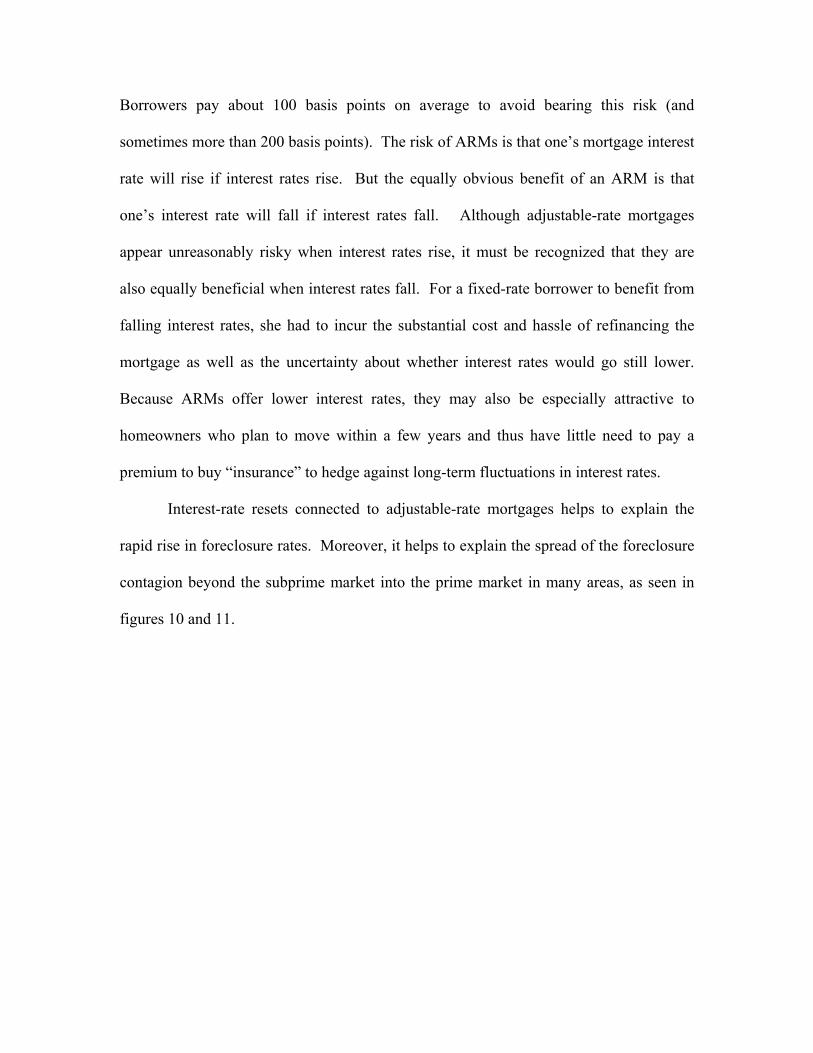
Interest-rate resets connected to adjustable-rate mortgages helps to explain the
rapid rise in foreclosure rates. Moreover, it helps to explain the spread of the foreclosure
contagion beyond the subprime market into the prime market in many areas, as seen in
figures 10 and 11.
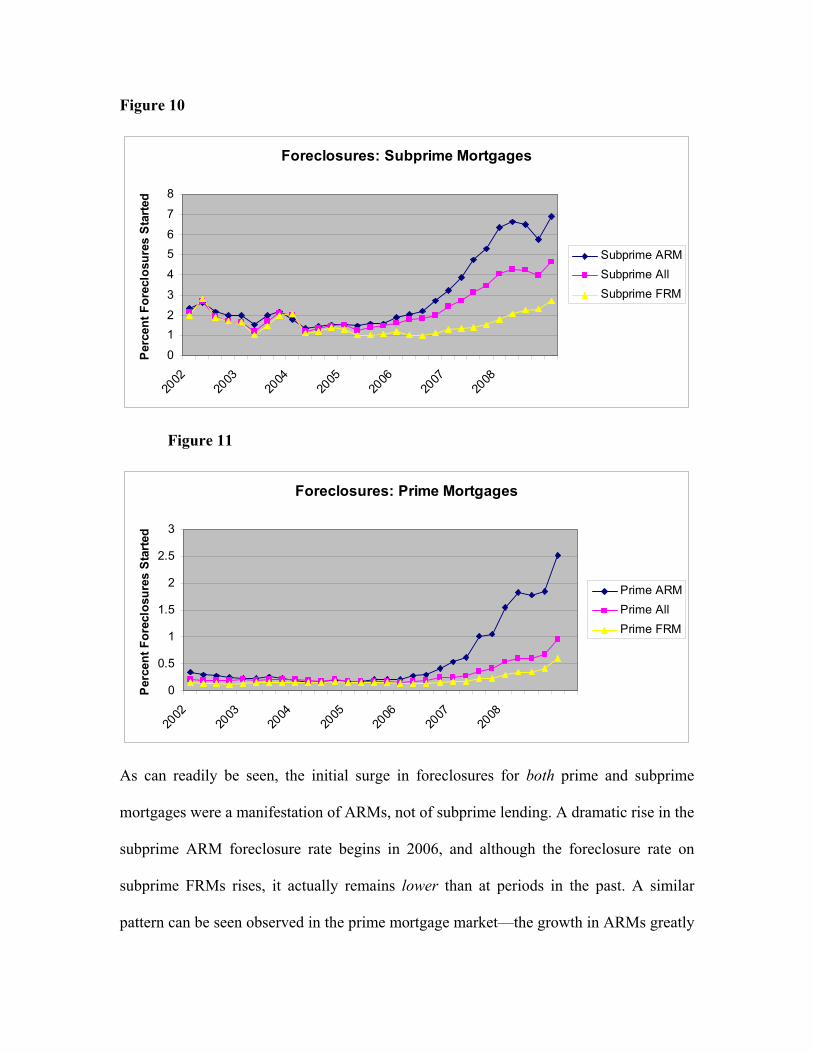
Figure 10
Foreclosures: Subprime Mortgages
0
12
3
4
56
7
8
2002
2003
2004
2005
2006
2007
2008
Per
cent
For
eclo
sure
s St
arte
d
Subprime ARMSubprime AllSubprime FRM
Figure 11
Foreclosures: Prime Mortgages
0
0.5
1
1.5
2
2.5
3
2002
2003
2004
2005
2006
2007
2008
Per
cent
For
eclo
sure
s St
arte
d
Prime ARMPrime AllPrime FRM
As can readily be seen, the initial surge in foreclosures for both prime and subprime
mortgages were a manifestation of ARMs, not of subprime lending. A dramatic rise in the
subprime ARM foreclosure rate begins in 2006, and although the foreclosure rate on
subprime FRMs rises, it actually remains lower than at periods in the past. A similar
pattern can be seen observed in the prime mortgage market—the growth in ARMs greatly
outpaces the growth in FRMs. In part this distinction in default rates reflects differential
sorting by lenders among subprime borrowers for fixed- and adjustable-rate mortgages as
subprime ARM borrowers have substantially lower FICO credit scores and higher
combined LTV ratios than subprime FRM borrowers.23 The difference, however, is not
huge and it is difficult to imagine that the characteristics of the borrowers alone rather
than the characteristics of the loans themselves explain the dramatically different
performance of these loans.
In short, the “payment shock” theory may have some validity in the current
climate although the mechanism of transmission is difficult to understand. The artificial
lowering of interest rates from 2001–2004 pushed down short-term interest rates,
allowing borrowers to qualify for larger mortgages than they otherwise could. But this
was a phenomenon that was not limited to the subprime market. On the other hand,
ARM-related payment shock does not provide a comprehensive explanation of all
foreclosures. One estimate of subprime loans facing foreclosure in the early wave of
foreclosures found that 36 percent were for hybrid loans (with an initial fixed period,
followed by adjustable rates for the duration of the loan), fixed-rate loans account for 31
percent, and adjustable-rate loans for 26 percent.24 Of those loans in foreclosure, the
overwhelming majority entered foreclosure before there was an upward reset of the
interest rate.25 Most defaults on subprime loans occur within the first 12 months of the
23 Mayer, Pence & Sherlund, The Rise in Mortgage Defaults, supra note 17 at 32. 24 James R. Barth et al., Mortgage Market Turmoil: The Role of Interest-Rate Resets, in SUBPRIME MORTGAGE DATA SERIES (Milken Inst.) (2007); C.L. Foote, K. Gerardi, L. Goette & P.S. Willen, Subprime Facts: What (We Think) We Know about the Subprime Crisis and What we Don’t, FED. RES. BANK BOSTON PUBLICLY POLICY DISCUSSION PAPER 08-02 (2007); Mayer, Pence & Sherlund, The Rise in Mortgage Defaults, supra note 17. 25 Barth at 18, available at http://www.ghb.co.th/en/Journal/Vol2/07.pdf. Of those subprime loans in foreclosure, 57 percent of 2/28 hybrids and 83 percent of 3/27 hybrids “had not yet undergone any upward reset of the interest rate.”
loan, well before any interest adjustment.26 Furthermore, after examining the evidence,
several economists from the Boston Federal Reserve flatly state, “Interest-rate resets are
not the main problem in the subprime market.”27
Economists generally conclude that of more importance to foreclosures is falling
house prices—the interest rate on a mortgage is largely irrelevant if the borrower can
refinance or sell out of the mortgage. It is only when the borrower is unable to sell or
refinance that the interest rate matters, thus adjustable rate or hybrid mortgages matter for
foreclosures only in a falling real-estate market. Mortgages with positive equity tend to
terminate in a prepayment of the mortgage (either as the result of a sale or refinance)
whereas those with negative equity tend to terminate in foreclosure.28
The relationship between ARMs and foreclosures appears to have been a
manifestation of the unique circumstances of the past several years rather than an
inherent problem of ARMs. The percentage of ARMs in the market have been much
higher at times in the past, yet they did not previously result in the surge of foreclosures
that have resulted in the most recent environment. In fact, adjustable-rate mortgages are
the norm in most of Europe and the rest of the world without the catastrophic events that
have transpired in the United States in recent years.29 The primary difference, it appears,
26 Mayer, Pence & Sherlund, The Rise in Mortgage Defaults, supra note 17 at 41; Shane Sherlund, The Past, Present, and Future of Subprime Mortgages, Federal Reserve Board (Sept. 2008); Kristopher Gerardi, Adam Hale Shapiro & Paul S. Willen, Subprime Outcomes: Risky Mortgages, Homeownership Experiences, and Foreclosures, Federal Reserve Bank of Boston Working Paper No. 07-15. Mayer, Pence, and Sherlund find a dramatic rise in “early payment defaults” well before any interest rate adjustment takes place.
27 Christopher L. Foote, Kristopher Gerardi, Lorenz Goette, and Paul S. Willen, Subprime Facts: What (We Think) We Know about the Subprime Crisis and What We Don’t, FED. RES. BANK OF BOSTON PUBLIC POLICY DISCUSSION PAPERS 2 (May 30, 2008). Other studies have confirmed this conclusion about the limited role of interest-rate resets in driving increased foreclosures when compared to falling house prices and deterioriating underwriting standards. See Patrick Bajari, Chenghuan Sean Chu & Minjung Park, An Empirical Model of Subprime Mortgage Default from 2000 to 2007, NBER WORKING PAPER 14625 (Dec. 2008) (finding that interest rate resets play a positive, but relatively minor role, in defaults). 28 Anthony Pennington-Cross, The Duration of Foreclosures in the Subprime Mortgage Market: A Competing Risks Model with Mixing 4-5 (Fed. Reserve Bank of St. Louis, Working Paper No. 2006-027A, 2006).
29 Richard K. Green & Susan M. Wachter, The American Mortgage in Historical and International Context, 19 J. ECON. PERSP., Fall 2005, at 93, 107–08 (2005). Most other countries also have shorter mortgage maturity payments combined with a final balloon payment in contrast to the 30-year fixed-rate self-amortizing mortgage that is standard in the United States.
is that in recent cases, the interest rates on ARMs were pushed artificially and
unsustainably low, thus the eventual interest-rate reset resulted in the interest rate on
ARMs rising back to the level of FRMs, rather than FRMs falling to the level of ARMs
(as was generally the case in the past). It appears that it is only when ARMs are
combined with a monetary policy that pushed short-term interest rates to unsustainably
low rates that ARMs became a problem.
Negative Home Equity
The decision to maintain homeownership or default and allow foreclosure can be
modeled as a financial option. Where the option is “in the money” (i.e., the home is
worth more than the amount owed) the homeowner can treat the house as a “call”
option—if the homeowner is unable or unwilling to make her monthly payments (perhaps
because she is moving) then she can either sell the home or refinance it and pay off the
underlying mortgage. Thus, the option to allow foreclosure is of low value to the
homeowner in a rising market because the homeowner can instead sell or refinance the
house and pocket the equity. But where the house has negative equity (often referred to
as “under water” or “upside down”), then the consumer has a put option—either she can
continue to pay the mortgage and retain ownership or exercise the “option” to default and
allow the lender to foreclose. If this option rises in value or becomes less expensive to
exercise, homeowners will become more likely to exercise it.
Under the option theory of foreclosure, therefore, the decision to allow default is
essentially a voluntary and rational response to the incentives created by the change in
value of the asset—the borrower could continue to service the loan but chooses not to.
Default and foreclosure result because the borrower strategically chooses the option of
foreclosure over the option of continued payment of the loan. Empirical studies
traditionally have tended to support the option theory of foreclosure.30 For instance, even
though interest rates generally rise uniformly across the country, the foreclosure rate is
lower for residential real estate where price appreciation has been higher.31 This suggests
that in deciding whether to default the primary consideration by homeowners is the
amount of equity that they have accrued in their property (which might be lost in the
event of a foreclosure) rather than “payment shock” resulting from an unexpected rise in
interest rates. Similarly, those who have drawn against accumulated home equity through
home-equity loans or junior liens exhibit a greater propensity to default than those who
have retained their equity.32
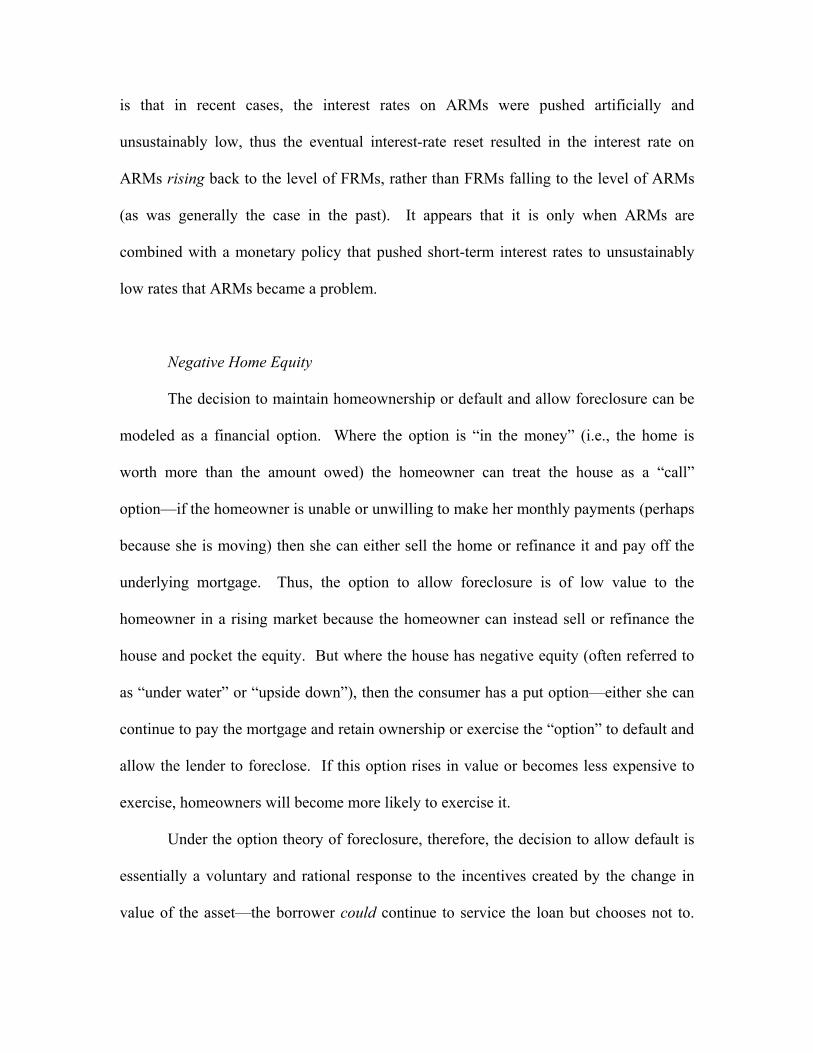
Falling real-estate prices helps to explain the rising foreclosure rate. There is a
very close relationship between the timing of the nationwide drop in housing prices and
the rise in the foreclosure rate. This striking relationship can be seen in figure 12 below
and seems to lend support to this option theory:
Figure 12
30 See Kerry D. Vandell, How Ruthless Is Mortgage Default? A Review and Synthesis of the Evidence, 6 J. HOUSING RES. 245 (1995); James B. Kau & Donald C. Keenan, An Overview of the Option-Theoretic Pricing of Mortgages, 6 J. HOUSING RES. 217 (1995); Patric H. Hendershott & Robert Van Order, Pricing Mortgages: An Interpretation of the Models and Results, 1 J. FIN. SERVICES RES. 19 (1987). 31 Mark Doms, Frederick Furlong & John Krainer, House Prices and Subprime Mortgaged Delinquencies 1–2 (FRBSF ECON. LETTER NO. 2007-14, 2007); Brent W. Ambrose, Charles A. Capone, Jr. & Yongheng Deng, Optimal Put Exercise: An Empirical Examination of Conditions for Mortgage Foreclosure, 23 J. REAL EST. FIN. & ECON. 213, 218 (2001) (higher default rates where home price appreciation slower); Kristopher Gerardi, Adam Hale Shapiro & Paul S. Willen, Subprime Outcomes: Risky Mortgages, Homeownership Experiences, and Foreclosures 2–3 (Fed. Res. Bank of Boston, Working Paper No. 07-15, 2008), available at http://www.bos.frb.org/economic/wp/wp2007/wp0715.pdf (concluding that dramatic rise in Massachusetts foreclosures in 2006-07 resulted from decline in house prices beginning in summer 2005); Ellen Schloemer, Wei Li, Keith Ernst & Kathleen Keest, Losing Ground: Foreclosures in the Subprime Market and Their Cost to Homeowners, CRL RES. REPORTS, (Ctr. for Responsible Lending, Durham, N.C.), Dec. 2006, at 1, 13. 32 See Michael LaCour-Little, Equity Dilution: An Alternative Perspective on Mortgage Default, 32 REAL ESTATE ECON. 359, 369 (2004).
Housing Prices and Foreclosure
0
0.2
0.4
0.6
0.8
1
1.2
2000
2001
2002
2003
2004
2005
2006
2007
2008
Year
Fore
clos
ures
Sta
rted
-4-3
-2-1
01
23
Qua
rter
ly A
ppre
ciat
ion
Foreclosures Started
Quarterly House PriceAppreciation
Source: OFHEO Home Price Index (Sales) and Mortgage Bankers Association
Another practice that increased the incentives for strategic default was the growth
of lending products that reduced certain homeowners’ equity investments in their loans,
such as low or no-downpayment loans, as well as certain lending products like interest-
only mortgages that meant that consumers accumulated no equity through their monthly
payments.33 Gerardi, et al., find that the most dramatic change in the subprime lending
market over the course of the housing boom was the dramatic growth in the number of
high loan-to-value (LTV) ratio loans in the latter stages of the boom.34 While housing
prices were rising, these loans performed exceedingly well, as borrowers could either sell
or refinance if they were unable or unwilling to make payments. When housing prices
turned down, however, high-LTV loans quickly went underwater, leaving homeowners
with strong incentives to permit foreclosure.
33 This latter factor may be of minimal importance, however, as 30 year conventional fixed mortgages provide for the payment of a much greater ratio of interest to principal at the beginning of the loan repayment term, thus equity accumulation is minimal for many years. 34 Kristopher Gerardi, et al., Making Sense of the Subprime Crisis, BROOKINGS PAPERS ON ECONOMIC ACTIVITY (Douglas W. Elmendorf, N. Gregory Mankiw, and Lawrence Summers eds, Fall 2008) at 9-10.
The positive experience with unconventional products in the early stage of the
boom, however, encouraged lenders to increasingly combine various unconventional
terms, a practice known as risk layering. As housing prices started to decline, the
combination of more than one unconventional term have proven particularly problematic
and likely to trigger foreclosure, with the interaction between different risk-layering
terms giving rise to a geometric increase in the propensity to default rather than being
merely additive.
One technique that led to this result was the growing popularity of “piggyback
loans.” With a piggyback loan, the borrower simultaneously takes out a first mortgage
and a junior-lien (piggyback) loan. The piggyback loan finances the portion of the
purchase price that is not being financed by the first mortgage.35 Piggyback loans often
were taken out so that the first-lien mortgage can meet the conforming loan size limits.36
Virtually nonexistent in 2000, by 2006 about 22 percent of mortgage loans for owner-
occupied houses also had piggyback second-lien mortgages attached.37
As noted above, a primary factor driving foreclosure is the presence or absence of
equity in the property. Thus, loans with little or no down payments (such as those with
high LTV or mortgages combined with piggyback loans) offer an unusually powerful
incentive to default if property values fall.38 Lower downpayments are correlated with
35 Id. 36 Id. at A85. 37 Robert B. Avery, Kenneth P. Brevoort & Glenn B. Canner, The 2006 HMDA Data, 93 FED. RESERVE BULLETIN A 73, at A85; see also EDWARD VINCENT MURPHY, CONGRESSIONAL RESEARCH SERVICE, ALTERNATIVE MORTGAGES: CAUSES AND POLICY IMPLICATIONS OF TROUBLED MORTGAGE RESETS IN THE SUBPRIME AND ALT-A MARKETS (2008), at 5. The apparent absence of piggyback loans before 2000, however, may overstate the distinction. Although the purchase-money lender did not traditionally provide a piggyback home equity loan, for many decades consumers who could not come up with a full 20% downpayment might borrow the needed amount from a consumer finance company (presumably on an unsecured basis). See PAUL MUOLO & MATHEW PADILLA, CHAIN OF BLAME: HOW WALL STREET CAUSED THE MORTGAGE AND CREDIT CRISIS 37 (2008). 38 In fact, LaCour-Little, et al., conclude that negative equity for homes in foreclosure are more often the result of post-purchase cash-out refinancing or home equity loans are more responsible for the presence of negative equity than housing price declines. See Michael LaCour-Little, Eric Rosenblatt & Vincent Yao, Do Borrowers Facing Foreclosure Have Negative Equity? 20 (July 11, 2008) (working paper, available at http://ssrn.com/abstract=1162398).

higher rates of default39 and lower LTV ratios are reflected in lower risk premiums in
interest rates.40 One study found that conventional mortgages with loan-to-value ratios at
origination of 91–95 percent were twice as likely to default as loans with LTVs of 81–90
percent and five times more likely to default than those with LTVs of 71–80 percent.41
A related factor in the general reduction in homeowner equity cushion was the
growing use of cash-out refinancing in recent years, especially in the later stages of the
housing boom. The United States is almost unique in the world in adopting a general
practice of permitting an almost unlimited right of mortgage prepayment and thus the
ability to refinance at almost any time. 42 Most commercial loans and subprime
mortgages, by contrast, prohibit or penalize prepayment for certain periods of time at the
outset of the mortgage.
From 2003 to 2006, the percentage of refinances that involved cash-out doubled
from under 40 percent to over 80 percent,43 and among subprime refinanced loans in the
2006–2007 period around 90 percent involved some cash out.44 The result of this cash-
out activity was similar to that of piggyback home-equity loans, namely to strip out
borrower’s equity cushions, thereby making it more likely that a subsequent fall in the
value of the home would bring the mortgage into negative equity and bring about
circumstances for a default and foreclosure.
Anecdotal reports in the current market also report a growing number of
“mortgage walkers” who are exercising their “put” option to voluntarily surrender their 39 See id. 40 See Gregory Elliehausen, Michael E. Staten & Jevgenijs Steinbuks, The Effect of Prepayment Penalties on the Pricing of Subprime Mortgages, 60 J. ECON. & BUS. 33, 34 (2008) (reviewing studies) 41 Robert B. Avery, Raphael W. Bostic, Paul S. Calem & Glenn B. Canner, Credit Risk, Credit Scoring, and the Performance of Home Mortgages, 82 FED. RES. BULL. 621, 624 (1996). 42 Green & Wachter, at 100-01. 43 Luci Ellis, The Housing Meltdown: Why did it happen in the United States? Bank for International Settlements Working Paper No. 259 (2008), at 22 and Fig. 9. 44 C J Mayer & Karen Pence, Subprime Mortgages: What, Where, and To Whom, NBER Working Paper no. 14083.
home to the lender, a practice known as “jingle mail” after the practice of the borrower
mailing her keys to the lender and surrendering the house. 45 As house prices fall,
mortgage walking has begun to spread beyond the subprime market. Kenneth Lewis of
Bank of America recently observed that while in the past, consumers would default only
after falling behind on car payments, credit cards, and other debts, there has been a
general change in social norms regarding mortgage default.46 Today, Bank of America
reports a growing number of borrowers who are current on their credit cards but
defaulting on their mortgages suggesting that “[a]t least a few cash-strapped borrowers
now believe bailing out on a house in one of the easier ways to get their finances back
under control.”47 This temptation is especially strong for those homeowners who put
little or nothing down or borrowed against their home equity.
The incentives to “walk” are especially strong in those states with antideficiency
laws that limit creditor’s remedies to foreclosure without the right to sue the borrower
personally for the deficiency. In a study of the neighboring provinces of Alberta and
British Columbia in Canada, Lawrence Jones found that “in a period of sizable house-
price declines, the prohibition of deficiency judgments can increase the incidence of
default by two or three times over a period of several years.”48 In fact, in Alberta (which
had an antideficiency law) 74 percent of those who deliberately defaulted had negative
equity; in British Columbia (which permitted deficiency suits) only one homeowner
defaulted with negative book equity.49 Moreover, if it is the case (as it appears to be) that
the propensity for default and foreclosure is a function in part of state laws regarding the 45 Nicole Gelinas, The Rise of the Mortgage “Walkers,” WALL ST. J., Feb. 8, 2008, at A17. 46 George Anders, Now, Even Borrowers With Good Credit Pose Risks, WALL ST. J., Dec. 19, 2007, at A2. 47 Id. 48 Lawrence D. Jones, Deficiency Judgments and the Exercise of the Default Option in Home Mortgage Loans, 36 J. L. & ECON. 115, 135 (1993). 49 Id. at 128–29. Jones states that the one defaulter in British Columbia reportedly left the country. Id. at 129.
collection of deficiency judgments and judicial foreclosure actions and that lenders have
already priced that risk ex ante in the loan, this raises questions about the propriety as a
matter of equity and efficiency of governmental “bail outs” for distressed borrowers and
lenders.
Even where the laws do not mandate that mortgages are nonrecourse, lenders
have exhibited willingness to voluntarily waive an action for deficiency.50 Although laws
vary among states, over a dozen states have some type of antideficiency laws that limit
creditors to seizure of the property in the event of default, with no right of recourse
against the borrower personally. Many of the states with antideficiency laws, such as
California and Arizona,51 are also among the states with the highest foreclosure rates.
Other high-foreclosure states, such as Nevada and Colorado, have laws that limit the
amount that lenders can recover from borrowers but do not bar deficiency judgments
completely. Antideficiency laws also appear to affect homeowners’ incentives to
maintain their property—homeowners in states that have antideficiency laws may be less
willing to invest in maintenance and improving their homes.52
What Happened?
The underlying cause of the housing boom and bust, and the subsequent rise in
foreclosures, thus seems to be largely explained by two fundamental factors. First,
artificially low short-term interest rates, relative to long-term interest rates that provided
50 There is also evidence that subprime lenders tend to foreclose much more slowly. See Dennis R. Capozza & Thomas A. Thomson, Subprime Transitions: Lingering or Malingering in Default?, 33 J. REAL ESTATE FIN. ECON. 241, 257 (2006). 51 See Michael T. Madison, Jeffry R. Dwyer & Steven W. Bender, 2 THE LAW OF REAL ESTATE FINANCING §12:69 (Dec. 2007), available in Westlaw REFINLAW § 12:69. 52 John Harding, Thomas J. Micelli & C.F. Sirmans, Deficiency Judgments and Borrower Maintenance: Theory and Evidence, 9 J. HOUSING ECON. 267, 271 (2000); see also John Harding, Thomas J. Micelli & C.F. Sirmans, Do Owners Take Better Care of Their Housing Than Renters?, 28 REAL ESTATE ECON. 663, 669–70 (2000).
incentives for consumers to switch from fixed-rate to adjustable-rate mortgages, allowed
borrowers to qualify for larger mortgages than would otherwise be the case, and resulted
in trouble for some borrowers who were unable to make their payments when short-term
interest rates rose. This household financial distress was exacerbated as the economy
dipped into recession, piling traditional causes of foreclosures (such as job loss), on top
of this distress caused by interest-rate adjustments. Second, a rapid, severe, and sustained
fall in house prices provided many consumers with an incentive to exercise their default
option and to allow foreclosure to go forward on their homes. This was exacerbated by a
variety of factors, including new mortgage lending practices that led to little or no equity
for many homeowners and certain states’ laws that provide great protection for borrowers
in the event of a foreclosure, such as antideficiency or non-recourse laws.
Basic economic theory, therefore, seems to explain most of the underlying
dynamics of rising foreclosure rates and bankruptcy filing rates by explaining the basic
decision-making of homeowners. On the other hand, this analysis does not address the
more fundamental questions, which are: Why did the housing price bubble develop as it
did, why did foreclosures rise so dramatically as house prices fell, and why did Wall
Street and the banking industry so badly misjudge the financial problems?
Conventional wisdom about the mortgage crisis provides several hypotheses, such
as the rise of securitization of mortgage debt or the role of government policies that
provided incentives for overinvestment in housing and reckless credit expansion to poor
risks. Although the causal mechanisms differ, these hypotheses share a common
similarity that they both interpret the fundamental cause of the mortgage crisis as
increased reckless lending to risky borrowers or loan terms that were excessively risky.
On closer examination, however, while these factors may have exacerbated the
underlying mortgage crisis, it is doubtful that they can explain the fundamental nature of
the housing boom and bust.
The Two Phases of the Mortgage Crisis
Before looking in some detail about the causes of the housing boom and bust, it is
important to consider an often-overlooked element of the crisis; namely, that there are
really two phases of the housing boom and mortgage crisis, one lasting from about 2001–
2004 and a second running from about 2005–2007. While loan performance during the
later phase (2005–2007) has been disastrous, loan performance during the earlier phase
was largely non-problematic, even those loans that contained particular terms that have
subsequently drawn criticism, such as hybrid mortgages, low-documentation loans, and
low-downpayment loans. Indeed, as will be developed more below, it is likely that the
disastrous collapse of the housing and mortgage markets came about precisely because
the strong performance of non-traditional loans in the first phase of the credit expansion
encouraged more aggressive loans in the second phase of the boom.
Empirical data provide a picture of the differences between these two periods of
the housing boom. A few key differences between the two phases of the housing boom
emerge when examining the data. The most important factor—to put the matter quite
simply—is that house prices were rising in many parts of the country in the early stages
of the mortgage boom. Second, the structure of the loans in the later phase of the housing
boom were substantially different from the first phase. In particular, in the first phase
many subprime borrowers were at least as risky as borrowers in the second phase;
moreover, many of the loans issued in the first phase included many of the features that
were later criticized, such as low-documentation, low-downpayment, or interest-only
loans. The difference in the second phase, however, was that loans increasingly
combined these various features, a practice known as “risk layering.” Of particular
concern was the increasing use of no-downpayment loans, often combined with interest-
only or negative amortization features.
House Prices and the Foreclosure Crisis
First, as suggested above, a primary distinction between the first period of the
housing boom (2001–2004) and the second (2005–-2007) was that house prices were
appreciating rapidly in many areas during the initial period but falling during the second
period. This meant that homeowners during the first period were accumulating equity in
their homes, enabling them to either sell or refinance if necessary. Moreover, this
appreciation in house prices meant that a steeper drop in house prices was necessary
before they were in a negative equity position and thereby tempted to default, an equity
buffer that was reinforced by the higher likelihood of having made a downpayment and
lower likelihood that they would have engaged in a cash-out refinance that would have
further depleted their equity cushion.
Refinances in the earlier stages of the housing boom also were more likely to have
been triggered by falling interest rates and thus cash-out refinances were less common
then at later times.53 But refinancings continued even as interest rates began to rise
beginning in 2005. But the nature of these refinancings changed from the earlier wave—
refinancing in the 2005–2007 period were much more likely to be cash-out refinancing,
53 Ellis, supra note 43.
suggesting that these homeowners were refinancing for different purposes but also that
they were depleting equity at a greater rate than earlier borrowers, leaving them with a
much higher combined loan-to-value ratio than earlier refinancers.
But this raises a question—did the causal relationship in the early stage of the
boom run from house prices to expansive lending practices or from expansive lending to
higher house prices? This is actually quite a complex question and available data
suggests that both elements are present. In general, however, it appears that in the earlier
stages of the boom, house-price appreciation was caused primarily by underlying
economic factors; in turn, this strong house-price appreciation led to an extraordinarily
strong performance record for all mortgages made during this time, including novel
subprime mortgages. But, in turn, this early record of success resulting from rising house
prices in the earlier stages of the boom fueled more aggressive and risky lending in the
later stages of the boom.
As suggested above, the early phase of the boom seems to have been fueled by a
variety of macroeconomic factors that led to a run-up in home prices in many markets.
Most importantly, extremely low short-term interest rates allowed many borrowers to
“stretch” to pay more for homes than otherwise would have been the case otherwise.
Thus, consumers could afford “more” home than they might otherwise. As noted above,
the HUD housing affordability index was at record highs during this period—thus, even
as housing prices were rising, they were more than offset by record-low interest rates.
In addition, a variety of other factors raised the return to home ownership and led
to increased house prices. Most notably, in 1997 the tax code was amended to permit
homeowners to pay no tax on any capital gains of up to $500,000 upon the sale of their
home. This led to a strong tax code preference for investments in housing relative to
other forms of investment and saving leading to household overinvestment in real
estate.54 By contrast, ordinary saving is “double-taxed” as income when first earned as
well as when interest is paid. And financial investments do not have this preferential
capital gains tax treatment. Moreover, the bursting of the dot-com bubble and the
struggles of the stock market in the immediate aftermath may have persuaded many
consumers that homeownership was a more reliable form of wealth accumulation than
financial assets.
To understand the difference between the earlier and later phases of the housing
boom and the different performance of the mortgages issued during those two vintages, it
is necessary to understand the nature of housing markets in the United States. There are
effectively three different types of housing markets and differences among these markets
help to explain the different performance patterns of mortgages from these two different
eras.55 Fundamentally, these housing markets are differentiated by underlying supply and
demand dynamics.
The first type of housing market is those markets with traditionally cyclical
markets that experience high but essentially predictable volatility, such as New York,
Washington, DC, and Boston. Because of zoning and other constraints on construction of
new homes, these markets have a highly inelastic supply of housing supply. Thus, when
housing demand rises or falls for exogenous reasons, prices fluctuate widely in these
markets. As explained above, extremely low interest rates and other governmental
policies dramatically increased demand for home ownership. Therefore, prices rose
54 Vernon Smith, The Clinton Housing Bubble, WALL ST. J., Dec. 18, 2007, at A20. 55 See Christopher Mayer & R. Glenn Hubbard, House Prices, Interest Rates and the Mortgage Market Meltdown (working paper,
Columbia Business School).

dramatically in these markets, a price appreciation that fundamentally reflected supply
and demand dynamics, although exaggerated by various other factors and the artificial
nature of the demand boost. As a result, although prices have fallen in these markets,
foreclosures have not risen as much, as the initial “bubble” was not as much a bubble as
an exaggerated response to fundamental supply and demand dynamics and as
homeowners expect for prices to rebound in the near future.
A second type of market is the “steady” markets that underwent a steady
appreciation in home prices over the past decade, with prices driven largely by
underlying supply and demand dynamics.56 Steady markets that have relatively modest
regulations and restraints on expansion of housing supply to meet demand growth and
thus have a relatively elastic housing supply. These markets, therefore, tend to respond to
increases in demand by a relatively rapid increase in supply. Thus, these markets did not
experience the same sort of house price bubble as many other markets—nor are they
experiencing the subsequent house-price collapse and the resulting foreclosure crisis.
These markets include cities such as Atlanta, Charlotte, Chicago, Denver, and Detroit.
But during the most recent housing boom a third type of market materialized—
cities with modest restrictions on building new supply, and in fact experienced a dramatic
growth in supply, but which nonetheless saw dramatic increases in home prices. These
markets can be characterized as “late-boom” markets and include cities such as Las
Vegas, Miami, Phoenix, and Tampa. 57 These markets began the housing boom
resembling the second type of cities—demand growth manifested itself in rapid increase
56 Id. 57 Presumably this list would also include areas like the distant suburbs of Northern Virginia and California that saw rapid
construction of new bedroom communities outside the traditional metropolitan areas and which experienced a very rapid boom and bust price cycle culminating in widespread foreclosures. In particular, many of these markets sprung up outside traditional cyclical markets, thereby adding a late-boom element to a traditional cyclical market (and perhaps exacerbating the price swings in both).
in supply, rather than a rapid increase in prices. But toward the end of the boom, these
markets also saw a dramatic run-up in prices as well. Unlike the traditionally volatile
markets, the price appreciation in these markets occurred toward the end of the boom,
rather than the beginning, even though this was the period when interest rates were rising
rather than falling. Moreover, this rapid price appreciation appears to lack plausible
grounding in underlying economic logic—prices were rising, even as both supply and
interest rates were rising as well.
The results have been catastrophic—the artificially high prices have collapsed, as
prices have come to reflect the supply and demand dynamics of the massive expansion of
new housing that was constructed during the boom. Prices have fallen toward their
equilibrium levels, and given the huge expansion of housing supply in those markets in
recent years, there is little expectation of a major price recovery in the near future.
Moreover, slowing of the economy has also slowed population immigration into these
markets (both legal and illegal). Thus, these markets have experienced dramatic drops in
home prices with little expectation of price recovery in the near future. Foreclosures
skyrocketed in these markets as home prices plunged.
The rapid house price appreciation in the “late-boom” cities closely matches the
timing of the second stage of the mortgage crisis. In fact, some commentators have
suggested that rather than the spread of subprime lending fueling the house-price boom in
many markets, the house-price boom fueled a rise in subprime lending as buyers rushed
in to gain a piece of the action.58 Such speculative motivation would be consistent with
the high penetration of adjustable-rate mortgages in the subprime market, which would
58 Mayer & Pence, for instance, find that areas with high house price appreciation saw a rise in the following year in subprime
mortgage originations. See Christopher J. Mayer & Karen M. Pence, Subprime Mortgages: What, Where, and to Whom? NBER Working Paper W14083 (2008) available at http://papers.ssrn.com/sol3/papers.cfm?abstract_id=1149330.

generally be preferred by less risk-averse borrowers and speculators with a short-term
time horizon.59 Finally, the possible presence of substantial speculation in these markets
is consistent with overheated activity in the real estate market in these cities being in
properties such as new condominiums and new suburban homes, that are standardized
products (in terms of style, quality, and neighborhood quality) that are amenable to rapid
flipping.
Although the story is oversimplified, a general picture begins to emerge. The first
phase of the housing price boom was driven principally by traditionally volatile markets
responding to the various incentives created by low interest rates and other policies that
promoted homeownership and home investment. During this phase of the boom, much
mortgage activity was to refinance for lower interest rates and many home equity loans
were to fund home improvements (often because consumers wanted to move to larger
homes but price appreciation precluded them from doing so, so they responded to the
provided incentives by increasing the value of their own home).60 Price appreciation in
these traditionally volatile markets roughly reflected some degree of underlying supply
and demand dynamics. Increased demand in other markets was channeled into new home
construction. Families in those markets responding to the same dynamics still had a
tendency to increase their investments in residential real estate and the subprime market
was born. Price appreciation relieved homeowners of the incentives to exercise their
option for foreclosure. Those who were overextended or suffered economic distress could
sell or refinance their home in a rising market, rather than exercising foreclosure.
59 Stan Liebowitz, Op-Ed, The Real Scandal, N.Y. POST, Feb. 5, 2008. 60 Alan Greenspan & James Kennedy, Sources and Uses of Equity Extracted from Homes (Div. of Research & Statistics &
Monetary Affairs, Fed. Reserve Bd., Fin. & Econ. Discussion Series, Working Paper No. 2007-20, 2007).
The timing of the excesses of the second half of the mortgage boom also
coincides with the artificial price bubble of the late-boom housing markets. Lenders
erroneously extrapolated the performance of higher-risk mortgage from the first phase of
the bubble to the dissimilar markets and borrowers of the second stage of the bubble.
Lenders underestimated the impact of risk layering—and especially the dangers of low-
downpayment, interest-only, and other mortgages that led to heightened borrower
incentives to default if home prices fell. And fell they did—as was inevitable in light of
the underlying supply and demand dynamics that underlay these markets.
Risk Layering
A second feature that distinguishes the late boom from the early boom is the
increased presence of risk layering in the later phases of the boom. Risk layering is the
practice of combining more than one risky term together in a given mortgage.
Many of the terms in loans that have drawn the most criticism, such as hybrid
mortgages or low-documentation loans, do not appear to be excessively risky—when
they appear in isolation. During the early part of the boom, there was little evidence to
suggest that hybrid, low-documentation, low-downpayment, and other exotic mortgage
terms were excessively risky, in large part due to the rising housing market, but also
because certain of these terms, in isolation, may simply not be that risky.
Consider, for instance, much-maligned “low documentation” loans, sometimes
referred to as “liar’s loans.” Low-documentation loans forego many of the formalities
associated with a typical loan, such as an appraisal, detailed income and assets review,
and a detailed loan application, in favor of a much simpler process based on a credit score
and simplified review process. Although low-documentation loans seem inherently risky,
they may be completely appropriate for refinance loans based on an established track
record of successfully making mortgage payments, a regular job, accumulated home
equity, and a house that has had home-price appreciation. They seem less sensible for
riskier purchase-money borrowers with riskier property and no equity. Even then, low-
documentation loans may be sound if the borrower has sufficient equity in the property at
the outset, such as an especially low loan-to-value ratio. In fact, during the first phase of
the housing boom, low-documentation subprime loans performed just as well as full-
documentation loans.61
In fact, it appears that non-traditional mortgages in the early phase of the boom
also tended to have offsetting features that lowered the risk, such as a lower loan-to-value
ratio than normal. The fact that apparently risky terms were generally confined to
appropriate contexts or were offset by alternative risk-reducing features of the loan, along
with the strong appreciation in house prices during this period, may account for the
surprisingly strong performance of loans with these terms in the early stage of the boom.
In the later stages of the boom, however, some of this restraint was abandoned.
Rather than offsetting riskier terms with other adjustments, lenders increasingly engage in
risk layering of loan terms, perhaps bolstered by the early sound performance of loans
with these terms present in isolation. Because low-documentation and low-downpayment
mortgages in isolation were found to have modest and manageable risk associated with
them, it might have been predicted that combining the two elements would increase risk,
but only modestly so. Instead, it appears that combining two such terms increased the
61 Kristopher Gerardi, et al., supra note 34.

risk of the resulting product dramatically—a risk that became explosive when combined
with plunging home prices.
Loans with high loan-to-value ratios combined with low documentation proved to
be especially prone to default.62 This was exacerbated by a substantial increase in loan-to-
value ratios in the later stages of the boom.63 The median combined LTV for subprime
purchase loans rose from 90 percent in 2003 to 100 percent in 2005, “implying that in the
final years of the mortgage boom more than half of the borrowers with subprime
mortgages put no money down when purchasing their homes.”64 Piggyback loans also
became more common during this time,65 although many of these loans were “silent
second” that were not disclosed to the originator of the first mortgage.66 The presence of
these silent seconds increased the risk of default and foreclosure to the senior lender, but
without the senior lender’s knowledge (and so without adjusting the risk premium).67
Loans with minimal downpayments, cash-out refinancing, and aggressive use of
home equity loans, became especially prone to default as the housing bubble has burst.
When home prices fall, these loans quickly turn into negative equity, providing borrowers
with a strong incentive to default. Interest-only and negative amortization loans create
similar incentives by minimizing equity accumulation, but loans with these features
appear to have been relatively rare in the subprime market although quite common in the
prime mortgage market.68 Although, subprime refinance borrowers had on average lower
62 Id. at 5. 63 Id. at 1. 64 Mayer, Pence & Sherlund, The Rise in Mortgage Defaults, supra note 17, at 31. 65Id.; see also Gerardi et al. supra note 34 at 10 (noting dramatic rise in number of mortgages with second liens). 66 Between 1999 and 2006 the percentage of subprime loans with silent seconds rose from 1 percent to over 25 percent and for
Alt-A loans the rates rose from 1 percent to nearly 40 percent of securitized Alt-A mortgages. 67 Empirical evidence has found that holding combined LTV constant, borrowers who reached that LTV through a home equity
loan are more likely to default than an identically-leveraged borrower who reached that LTV through a purchase or refinance loan, see Gerardi et. al., supra note 34.
68 Mayer, Pence & Sherlund, The Rise in Mortgage Defaults, supra note 17. Mayer, et al., find that 40 percent of Alt-A mortgages
FICO scores than purchase-money borrowers (19–35 points lower), average credit scores
were relatively constant over the duration of the housing boom.69 This suggests that the
risk of negative equity is more important than the risk profile of the borrower in
predicting whether the mortgage eventually would default.
Thus, the fundamental problem on this score may not have been excess “greed” or
recklessness of sophisticated lenders making inherently crazy loans. Instead, if there was
a flaw, it was likely that lenders extrapolated too aggressively from too small of a sample
of loans, especially in the subprime market. Had the initial ventures into the subprime
market turned out to have been a failure rather than a success, it is likely that the market
would have been nipped in the bud and would never have expanded. The pattern that thus
emerges is a somewhat surprising one—the seeds of the mortgage crisis were not
grounded in inherently risky lending to unusually risky borrowers.70 Instead, it appears
that lenders simply underestimated the likelihood of an extended and dramatic home
price collapse like that which actually occurred.71
This over-optimism by lenders was mirrored by over-optimism on the part of
many buyers that home prices would increase without interruption. Many otherwise-
homeowners essentially became de facto real estate market speculators through interest-
only and low-downpayment mortgages that resulted in borrowers with minimal equity
positions that seemed predicated on the assumption that housing prices would rise.72
Lenders underestimated that likelihood that so many borrowers would end up in such
had interest-only features, compared to 10 percent of subprime; 30 percent of Alt-A mortgages permitted negative amortization, subprime loans did not have these features.
69 Id., at 17. 70 As Gerardi et al., supra note 34, put it, “These results are consistent with the view that a factor other than underwriting changes
was primarily responsible for the increase in mortgage defaults.” 71 Gerardi et al., supra note 34, at 36. 72 See Monika Piazzesi & Martin Schneider, Momentum Traders in the Housing Market: Survey Evidence and a Search Model,
NBER Working Paper 14669 (Jan. 2009) (noting rise of “momentum traders” in the housing market in the later stages of the boom).

severe negative equity positions that would provide such strong incentives for so many
borrowers to allow foreclosure or simply walk away from their mortgages. This dramatic
increase in the default rate may have been either because homeowners as a group became
unusually responsive to home price declines or because home prices declined much more
than expected and homeowners responded as would have been predicted in such an
unlikely and catastrophic scenario—or both.
Securitization
Many commentators have charged that the rapid spread of securitization of
mortgage debt, especially subprime mortgages, explains the underlying mortgage crisis.
The basic story is that over time, securitization of mortgage debt, especially subprime
mortgages, rose dramatically. This is certainly true.73 From 2000–2005, for instance, the
volume of subprime mortgages securitized by Wall Street rose almost tenfold, from about
$56 billion annually to $508 billion and the percentage of subprime loans that were
securitized rose from about 50 percent to over 80 percent during that same time frame, a
time period that correlates with the expansion of the subprime market.
The link between securitization and risky mortgage underwriting, it is argued, is a
chain of agency cost relationships generated by securitization. 74 In particular,
securitization is said to have given rise to an “originate to distribute” model of mortgage
lending, where the originating lender does not bear the risk that the loan will fail. Thus,
mortgage brokers originate the loan, but resell it to the wholesale supplier of money,
73 Kathleen C. Engel & Patricia A. McCoy, Turning a Blind Eye: Wall Street Finance of Predatory Lending, 75 FORDHAM L. REV. 2039, 2045 (2007). Gary B. Gorton, The Subprime Panic 6 tbl.4 (Nat’l Bureau of Econ Re-search, Working Paper 14398 Oct. 2008), available at http://www.nber.org/papers/w14398.
74 Engel & McCoy, Christopher L. Peterson, Predatory Structured Finance, 28 CARDOZO L. REV. 2185, 2200–06 (2007)
which then in turn bundles the loans, subdivides them into tranches, and resells those
bundles to investors. It is argued that this creates a series of agency relationships, all of
whom have incentives to maximize loan volume and ignore heightened risk and
deteriorating underwriting standards so long as they can pass on these loans (and their
risk) to subsequent holders.
Plainly, there seems to be a correlation between the rise of securitization and the
subprime lending boom and housing price bubble. But it is doubtful that the growth of
securitization can provide a convincing causal explanation. First, securitization has been
a well-established model of lending for years in other consumer credit markets (such as
credit cards, auto loans, and prime mortgages). Scholars also have noted that other
countries have seen a dramatic rise in home prices and a deterioration of underwriting
standards, most notably England, even though securitization remains nonexistent. 75
Second, many of those who either sold or bought these securities were highly-
sophisticated investors such as Bear Stearns, Merrill Lynch, or Citibank, who were likely
well aware of the risks and protected against them. Furthermore, the investment banks
that supposedly orchestrated this Ponzi scheme are now either bankrupt or have been
merged into other financial institutions as a result of investing in securities backed by
subprime loans, a reality that is difficult to square with the purported incentives of the
originate-to-distribute model.
Other considerations contribute to skepticism about the role of securitization in
fueling the mortgage crisis. For instance, as noted above, the subprime mortgage boom
appears to have two distinct phases; securitization, however, grew steadily throughout
both periods. Thus, the incentives created by securitization were constant during this
75 Ellis, supra note 43, at 6-7.
period, suggesting that some factor other than securitization intervened between the first
and second periods to lead to the dramatically worse performance of the mortgages
originated in the second period. Thus, although the role of securitization in creating
agency costs is theoretically possible as a major cause of the subprime mess, it seems
doubtful that the incentives created by securitization was an important contributor to the
mortgage crisis—although, of course, simple errors and miscalculations are possible for
reasons unrelated to the incentives created by securitization.76
Conclusion
By observing consumer behaviors and homeowners’ responses to various
incentives during the mortgage crisis, observers can glean a picture of some of the
primary causes of the meltdown. Specifically, low short-term interest rates encouraged
consumers to switch from fixed-rate to adjustable-rate mortgages or hybrid mortgages
and also motivated purchases of real estate as a speculative activity. Keeping in mind the
structure of this borrowing and the little equity homeowners held in new properties, along
with various the reasons for consumer foreclosure, one can observe that a rapid decline in
housing prices presented a strong incentive for property owners to exercise their
foreclosure options.
This analysis also points out that there was likely no sharp decline in individuals’
abilities to afford their homes, nor is an inability of families to keep up with their
mortgage payments the culprit behind the current mess. Instead, the rise in foreclosures
that has had adverse affects throughout the credit markets and he economy has likely
76 Gerardi, et al.,supra note 34, also doubt the importance of securitization in explaining the subprime boom and bust suggesting
that there is no inherent link between them.

resulted from consumers’ rational responses to certain incentives that arose during the
two phases of the crisis. Certainly, the full implications of the events unfolding have yet
to be realized, however this general understanding of the mortgage meltdown can help
pinpoint some of the fundamental causes and shed more light on the future of the crisis.