Mentum Planet 5.4 Core
148
1
-
Upload
gio-zakradze -
Category
Documents
-
view
513 -
download
22
description
Mentum Planet 5.4 Core
Transcript of Mentum Planet 5.4 Core
1

2
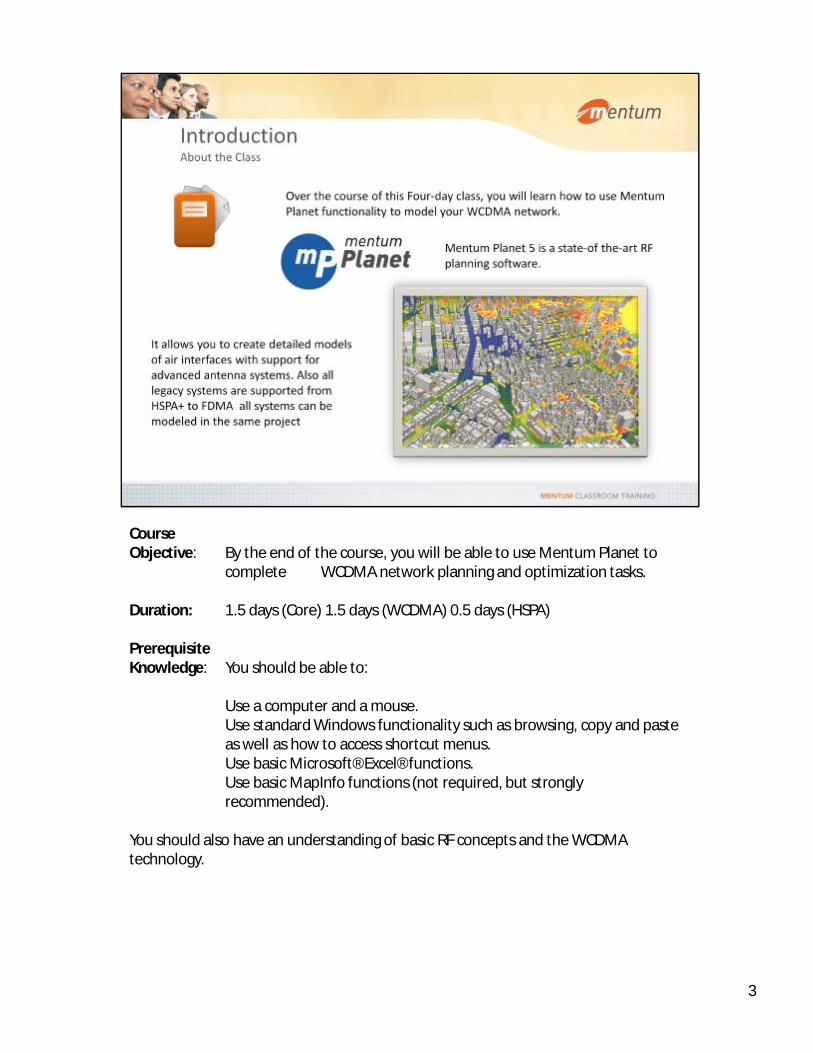
Course Course Objective: By the end of the course, you will be able to use Mentum Planet to
complete WCDMA network planning and optimization tasks.
Duration: 1.5 days (Core) 1.5 days (WCDMA) 0.5 days (HSPA)
Prerequisite Knowledge: You should be able to:
Use a computer and a mouse.Use standard Windows functionality such as browsing, copy and paste as well as how to access shortcut menus.Use basic Microsoft® Excel® functions.Use basic MapInfo functions (not required, but strongly recommended).
You should also have an understanding of basic RF concepts and the WCDMA technology.
3
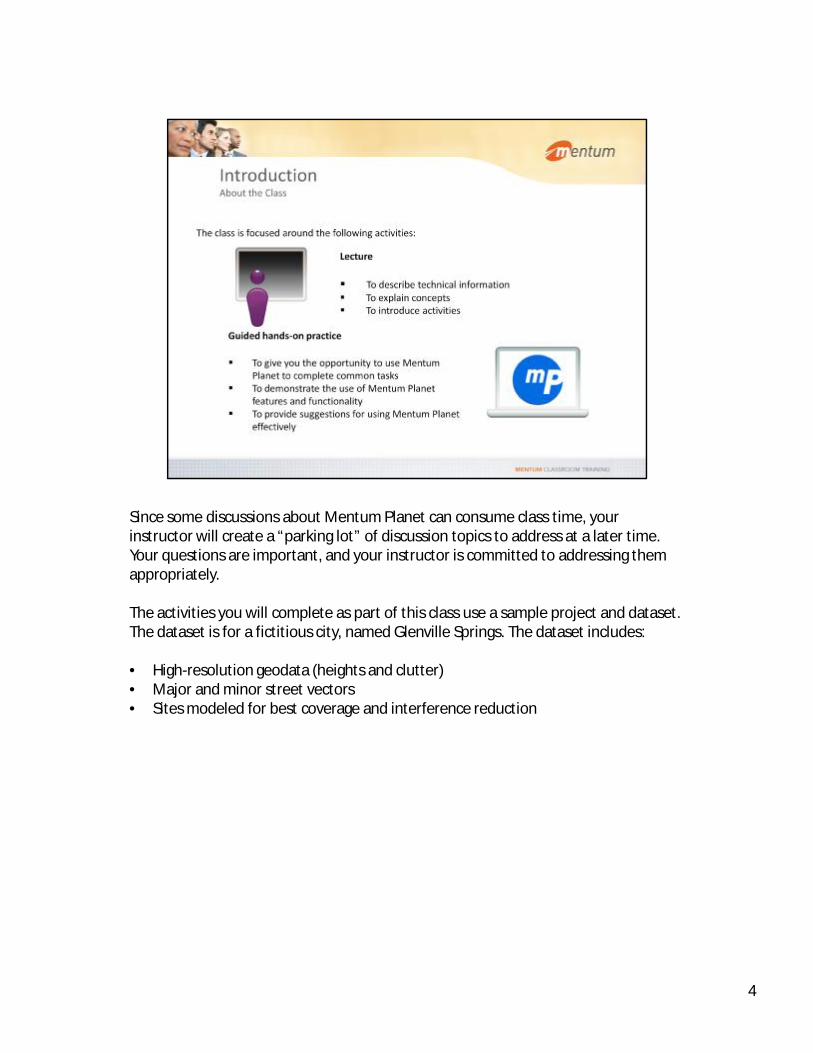
Since some discussions about Mentum Planet can consume class time, your instructor will create a “parking lot” of discussion topics to address at a later time. Since some discussions about Mentum Planet can consume class time, your instructor will create a “parking lot” of discussion topics to address at a later time. Your questions are important, and your instructor is committed to addressing them appropriately.
The activities you will complete as part of this class use a sample project and dataset. The dataset is for a fictitious city, named Glenville Springs. The dataset includes:
• High-resolution geodata (heights and clutter)• Major and minor street vectors• Sites modeled for best coverage and interference reduction
4

Your involvement in class is critical for you and others to benefit most from this course. Please maintain the appropriate classroom etiquette. Your involvement in class is critical for you and others to benefit most from this course. Please maintain the appropriate classroom etiquette.
5

Mentum Planet supports LTE including advanced LTE features such as:Mentum Planet supports LTE including advanced LTE features such as:
• LTE frame configurations• MCS C/(N+I) or Spectral efficiency curves• Mobility support (speed modeling) • LTE FDD/(TDD 5.2.1) duplex operations• LTE flexible bandwidth deployment • LTE interference coordination• LTE cyclic prefixes• LTE Automatic Physical Cell ID Planning• Tracking Area Code (TAC) support
It also supports static and Monte-Carlo simulations.
Mentum Planet includes the latest version of MapInfo Professional (version 11.0.1),which provides you with advanced GIS capabilities For information on new features of MapInfo Profession version 11, see the MapInfo Professional Release Note, which are available from the Pitney Bowes website at:http://www.pbinsight.com/support/productdocumentation/details/mapinfo-professional
6

Mentum Planet 5 is a next generation planning product, which boasts a new software architecture and which includes the following high-level enhancements:Mentum Planet 5 is a next generation planning product, which boasts a new software architecture and which includes the following high-level enhancements:
• Support for WiMAX FDD/TDD (both Fixed and Mobile) and LTE (FDD/TDD) networks—detailed modeling of OFDMA air-interfaces and support for Advanced Antenna Systems (AAS)
• Ease of use—redesigned user interfaces, easy-to-use tabular editors and new site management features
• Better scalability and stability—ability to handle larger networks within a single project
• Better performance—improved performance in user interfaces, data-related actions and import/export functions
• Future-proof platform—ready for on-going evolution of radio access networks including OFDM technologies and advanced antenna systems
• Open Planet APIs—open antenna format and API with support for advanced antennas; improved iecon performance, Prediction generation etc.
• MapInfo Professional 10—Mentum Planet 5 includes a MapInfo 10 OEM version with enhanced GIS functionalities.
Furthermore, Mentum Planet 5 is a multi-threaded, modeless application. Allowing for comparisons and ultra fast performance.
7
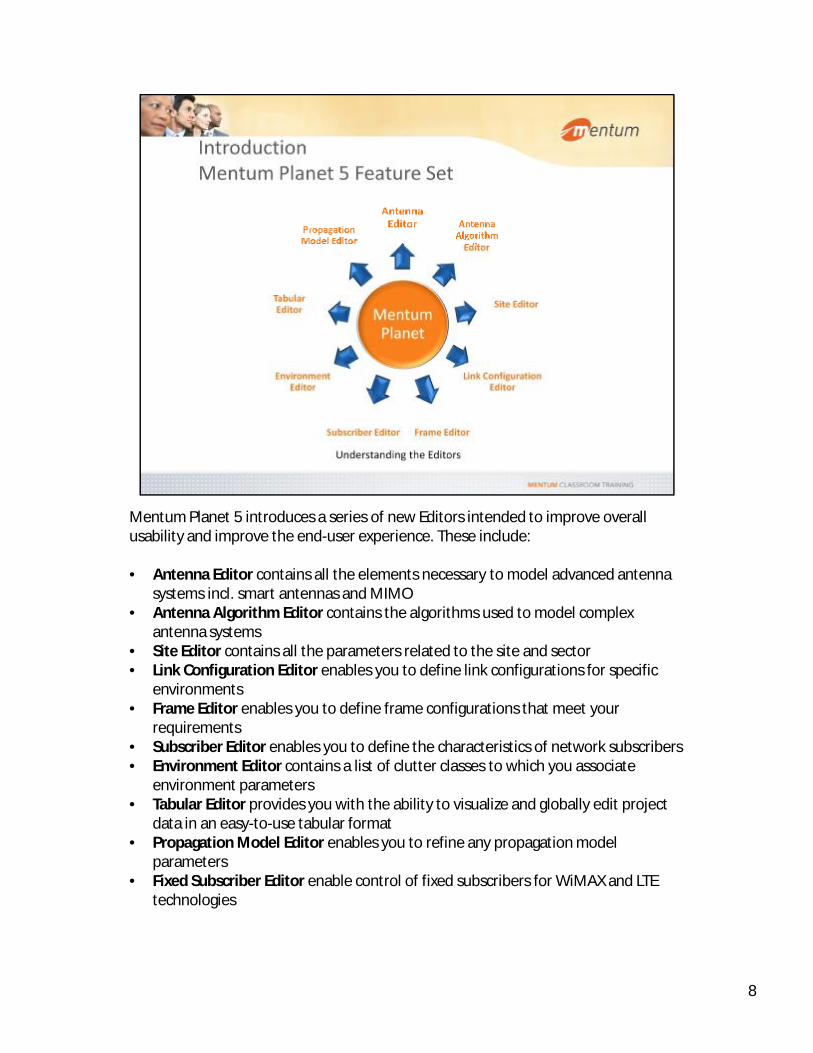
Mentum Planet 5 introduces a series of new Editors intended to improve overall usability and improve the end-user experience. These include:Mentum Planet 5 introduces a series of new Editors intended to improve overall usability and improve the end-user experience. These include:
• Antenna Editor contains all the elements necessary to model advanced antenna systems incl. smart antennas and MIMO
• Antenna Algorithm Editor contains the algorithms used to model complex antenna systems
• Site Editor contains all the parameters related to the site and sector• Link Configuration Editor enables you to define link configurations for specific
environments• Frame Editor enables you to define frame configurations that meet your
requirements• Subscriber Editor enables you to define the characteristics of network subscribers• Environment Editor contains a list of clutter classes to which you associate
environment parameters• Tabular Editor provides you with the ability to visualize and globally edit project
data in an easy-to-use tabular format• Propagation Model Editor enables you to refine any propagation model
parameters• Fixed Subscriber Editor enable control of fixed subscribers for WiMAX and LTE
technologies
8

The Start up page makes it easy to get started with quick access to Recent projects. There is also a possibility to open an exsisting project (Open project) or create a new The Start up page makes it easy to get started with quick access to Recent projects. There is also a possibility to open an exsisting project (Open project) or create a new project directly in the start page.In this page you will also find links to product information and to learning opportunities like webinars or hands-on training.The start up page is contineously updated with the latest news and events from Mentum
9

When you obtained your Mentum Planet license, you also gained access to multiple sources of help. You can find help about using Mentum Planet features from:When you obtained your Mentum Planet license, you also gained access to multiple sources of help. You can find help about using Mentum Planet features from:
• Mentum Planet User Guides, Application Notes, and Technical Notes• Context-sensitive online Help with access to the Customer Care Knowledge Base• Customer Care Self-Serve Portal• The Customer Care Centers, a staff of experts in Mentum Planet use.
The MapInfo Professional User Guide is also available in the MapInfo\Documentation folder. The MapInfo online Help system can be accessed by choosing Help Ü Help Topics ÜMapInfo.
MapInfo functionality, however, is not part of the Mentum Planet online Help system and must be searched separately.
10

When you obtained your Mentum Planet license, you also gained access to multiple sources of help. You can find help about using Mentum Planet features from:When you obtained your Mentum Planet license, you also gained access to multiple sources of help. You can find help about using Mentum Planet features from:
• Mentum Planet User Guides, Application Notes, and Technical Notes• Context-sensitive online Help with access to the Customer Care Knowledge Base• Customer Care Self-Serve Portal• The Customer Care Centers, a staff of experts in Mentum Planet use.
The MapInfo Professional User Guide is also available in the MapInfo\Documentation folder. The MapInfo online Help system can be accessed by choosing Help Ü Help Topics ÜMapInfo.
MapInfo functionality, however, is not part of the Mentum Planet online Help system and must be searched separately.
11

The workflow you follow will depend on your requirements and your work The workflow you follow will depend on your requirements and your work practices. The workflow illustrated is intended to be a general high-level workflow.
12

The MP501 class is part of the Mentum Planet curriculum and is intended to The MP501 class is part of the Mentum Planet curriculum and is intended to be followed by the MP503 class, which covers steps 11 to 20 of the workflow. Time permitting, the MP503 class will also cover how to customize Mentum Planet using extensions.
13

To create a new project, you can use the Project Wizard, which will lead you through the steps required to create a project. From the File menu, choose New project.To create a new project, you can use the Project Wizard, which will lead you through the steps required to create a project. From the File menu, choose New project.
14

You can customize your Mentum Planet user environment by defining the following You can customize your Mentum Planet user environment by defining the following preferences:
• General preferences enable you to determine how a project is displayed when Mentum Planet is first opened.
• Units allows you to define the units to be used across the project including height, distance, and coordinates.
• Project Explorer gives you access to performance settings as well as the ability to apply translucency.
• Data Manager permits you to define Data Manager profiles, which determine connectivity to the database.
• Project Wizard Defaults enable you to define the defaults to use when you create a new project. This includes the default project folder, the default global folder (where default antenna and curve files are stored). You can also specify the default geodata location. Geodata can be stored locally or remotely but the geodata folder must, at a minimum, contain a Heights folder and a Clutter folder. The primary heights file and primary clutter file are those that will be used when you generate analyses.
• Microwave allows you to define unit and geodata paths for microwave planning.• Miscellaneous allows you to define the pathloss lower limit. Masked pathloss
values stored in prediction view files will be lower or equal to the defined value. MS Excel version for use by Mentum Planet for Exporting and reporting tasks.
To define user preferences
Choose Edit Ü Preferences.
§ For more information, see the Planet User Guide.
15

You can specify project settings in order to configure the project to meet your You can specify project settings in order to configure the project to meet your requirements. Project settings include:
• General settings, which includes the project name and description as well as workspace settings.
• Geodata settings , which includes the geodata folder location as well as the primary height and clutter files. The geodata folder can be stored locally or remotely but must contain a Heights folder and a Clutter folder in order for the primary heights and clutter file lists to be populated.
• Coordinate System settings, which include the units for project and site data.• Folders settings, which include Bin, Signal Strength, and Prediction View settings.• Channel Models Use this tab to account for user mobility. • Advanced Options settings, which include additional layers, sharing permissions,
prediction thresholds and the environment grid.• Custom List settings, which create pre-defined lists that can use when adding
custom attributes to project elements (such as a site, sector, or antenna) on the Custom Data tab.
• Custom Data settings, which determine the requirements that dictate whether data entered is valid.
Color Profiles are defined using the command from the Edit menu.
To configure project settings
Choose Edit Ü Project Settings.
For more information, see the Planet User Guide.
16

The geodata folder can be local or remote but must contain a subfolder called “Heights”, where the elevation grids are saved and another called “Clutter”, where the clutter grid is saved. The Heights file is mandatory while the clutter file is optional (although the Clutter folder must be present even if empty).
Elevation files are numeric grids (*.grd) and clutter files are classified grids (*.grc).
The Network Coordinate System setting specifies how site data is displayed and used.
To save a workspace
1. To save a workspace, choose GISÜ Save Workspace.2. In the Project Settings dialog box, click the General tab.3. Click the Browse button and navigate to the .wor file.4. If you want Mentum Planet to save the display settings each time to save
the project, enable the Workspace Autosave check box.
For more information, see the Mentum Planet User Guide.
17

Mobile Speeds Allows the user to fully model mobility issues with networks by allowing speed based MSC to be defined and modeled with Monte Carlo simulations and through network analysis.
Channel models, which include the model name as well as an associated mobile speed value, are used when you define subscriber types in the Subscriber Settings dialog box.
18

In order to include more detailed information in a Mentum Planet project, you can In order to include more detailed information in a Mentum Planet project, you can now define local custom data attributes at the base station, site, sector, antenna, repeater, and carrier level.
19

In order to improve the appearance and readability of map layers, you can modify the default color schemes that Mentum Planet uses for numeric grids. Color profiles are In order to improve the appearance and readability of map layers, you can modify the default color schemes that Mentum Planet uses for numeric grids. Color profiles are grouped by the analysis type:
• Common• LTE FDD/TDD• WiMAX • GSM• CDMA2000• TDMA_FDMA etc.
Color profiles are only available if technology is enabled in the project.
To choose and assign color profiles
• Choose Edit Ü Color Profiles.
20

Network settings define the technology type, supported modulations and the carrier Network settings define the technology type, supported modulations and the carrier configuration settings that apply to your network as well as the spectrum definition. All network settings are grouped in the Network Settings dialog box. Mentum Planet fully supports multiple technologies within the same project technologies can be configured under network settings if valid licenses are available.
Mentum Planet supports sub-bands within a frequency banc (GSM, TDMA/FDMA, WCDMA, cdma2000 and LTE).
From the Network Settings dialog box, you can access the Frame Editor, (For LTE and WiMAX) where you can define frame configurations.
To define network settings
1. Choose EditÜ Network Settings.
For more information, see “Defining Network Settings” in the Mentum Planet User Guide.
21

You can define base station types in the network settings that encompass the You can define base station types in the network settings that encompass the modulations supported as well as the neighbor plan criteria.
Maximum Intra-Carrier Neighbors, define the maximum intra-carrier neighbors allowed in the neighbor planning process. This value is used when identifying same technology, same carrier neighbors.
Maximum Inter-Carrier Neighbors, define the maximum inter-carrier neighbors allowed in the neighbor planning process. This value is used when identifying same technology, different carrier neighbors.
22

Network settings define the technology type, supported modulations and the carrier configuration settings that apply to your network as well as the spectrum definition. All network settings are grouped in the Network Settings dialog box. Mentum Planet fully supports multiple technologies within the same project technologies can be configured under network settings if valid licenses are available.
Create Scrambling Code Regions and Triplets
Use the Create Scrambling Code Regions and Triplets to define a new region of scrambling code triplets.
Number of Regions—type in this box the number of regions for which you want to create scrambling code triplets.First—type in this box the first scrambling code to be included in scrambling code regions.
Last—type in this box the last scrambling code to be included in scrambling code regions.
Step—type in this box the gap between two consecutive scrambling codes that are part of the same triplet.
23

WCDMA Bearers are now configured at the network setting level (In Planet 4.5 they were part of the Subscriber Manager)
To define bearers
1. Choose EditÜ Network Settings2. Select the WCDMA node. Choose Bearers Tab Ü Edit
24

Using the Site Editor toolbar, you can:Using the Site Editor toolbar, you can:
§ add a new base station§ add a new sector to a base station§ add a new repeater system§ add a new antenna system§ delete a base station, sector, or antenna system§ locate a sector in the Map window§ open the Tabular Editor, where you can globally modify site settings.
You can have several base stations at one site, each using a specific technology (e.g., one LTE base station + one WCDMA and GSM base station) or using the same technology . A base station can have multiple physical sectors. Each sector can use one antenna system or multiple Antenna systems for true split sector or DAS configurations . Different technologies can also share the same antenna system in different bands with different antenna properties and patterns related to there respective bands.
You can open the Site Editor:
§ From the Project Explorer by right‐clicking on site name and choosing Edit or by double‐clicking the site name.
§ From the Map window by right-clicking a site, and selecting Edit.§ From the Mentum Planet toolbar by clicking the Edit Site button and
clicking on the site in the Map window. 25

Mentum Planet supports antenna systems, which include not only the antenna pattern but also the parameters related to advanced antenna systems. Because the pattern but also the parameters related to advanced antenna systems. Because the sector is now separate from the antenna system, you can easily specify the location of the antenna on the sector.
Each antenna system consists of an antenna (.paf) file, an azimuth, a tilt, a twist, a location, a height and band specific electrical parameters.
Planet supports Electrical Tilt, Electrical Beam-width and Electrical azimuth.
For multiband antennas you can specify different electrical characteristics if allowed by that antenna, one antenna can be “shared” between multiple sectors or technologies
You specify an antenna pattern, which by default becomes the antenna name. The name is composed of the elements defining the antenna system separated by colons (i.e., Azimuth:Tilt:Antenna File Name (Antenna ID)). In the example, 45:2:LSCP9012T2_8515-PCS (1).
You can enter exact coordinates (e.g., Long /Lat) or an offset to the site location (in meters) or you can directly get the coordinates from the map.
At the bottom of the dialog box, there is a tool strip where warnings are displayed (e.g., if the antennas are being used outside their operating bands).
26

In the Site Editor and on the Antennas node/tab General, you can use the SelectButton to list all of the antennas in the local Mentum Planet database to find the In the Site Editor and on the Antennas node/tab General, you can use the SelectButton to list all of the antennas in the local Mentum Planet database to find the antenna that best fits your needs.
27

Each sector has an assigned antenna system, which includes the antenna pattern and advanced antenna modeling parameters. The antenna patterns are displayed in and advanced antenna modeling parameters. The antenna patterns are displayed in the Project Data category of the Project Explorer. From the Antennas node, you can add a new antenna to your project, show unassigned antennas, sort antennas based on specific features, and view the antenna pattern.Using advanced antenna systems ensures accurate and reliable predictions and network analyses.
Mentum Planet supports advanced antenna systems including electrical tilt antennas, MIMO, and AAS through the use of a antenna format .paf. The new antenna format .pafx is a compressed antenna format to reduce files size
Previously supported antenna format can automatically be migrated to the new antenna format. Mentum Planet users may download antennas in the .pafx format from the Mentum Antenna Server directly within Mentum Planet. The new antenna format allows the support for:• multi-band antennas.• multi-beam antennas, used in single sector or multi-sector configurations.• electrical tilt, azimuth, beamwidth.• remote control units• explicit definition of antenna ports• polarizations, including cross-pole and quad-pole• a 3D antenna viewer
In the Antenna Editor there is an ability to define antenna ports and to select downlink and uplink ports.
28

29

Choosing and configuring the antennas correctly is essential in order to maximize the coverage and capacity of the network. By default, the Antennas node in the Project Choosing and configuring the antennas correctly is essential in order to maximize the coverage and capacity of the network. By default, the Antennas node in the Project Data category of the Project Explorer shows only antennas that are currently assigned to at least one sector.
When you have just added a new antenna, that antenna name may not be visible under the Antennas node because it is unassigned.
In order to see all your antennas, assigned and unassigned, right‐click the AntennaFiles (Project Data Category) and select Show Unassigned Antennas. The unassigned antennas will have a grayed‐out icon next to their name. By default, the antennas will be listed in alphabetical order under the Antennas node in your Project Explorer. However, you can sort them out differently, based on their electrical features, like frequency, horizontal beamwidth or gain, amongst others.
To sort antennas
1. In the Project Explorer, in the Project Data category, right-click the Antenna Filesnode and choose Group By Ü <antenna criteria>. For example, if the antenna criteria you choose is “Frequency”, the antennas will be grouped under different frequency ranges. The filter for unassigned antennas will also be applied.
30

Mentum Planet Online Antenna Server. Allows Antenna Vendors to publish antenna patterns so that they can be directly accessed by Planet users Mentum Planet Online Antenna Server. Allows Antenna Vendors to publish antenna patterns so that they can be directly accessed by Planet users
It is expected over time and as customers required them most if not all the antenna manufactures will move to populate the antenna server.
Although Mentum hosts the server we do not make the patterns or claim responsibility for what antenna vendors choose to publish there.
31

Mentum Planet supports many variants for DAS-style antenna systems:Mentum Planet supports many variants for DAS-style antenna systems:
• Repeater functionality for Fiber fed and Off-Air Repeaters
• Single sector multi-antenna (referred to as Quasi-omni) support, but in Planet 5 these can be locally non co-located for true local DAS system support.
• Links and power splitting can be independently assigned per antenna even different cable lengths.
• All variants are fully modeled in both Monte-Carlo simulations and static analysis.
32

Using the Site Editor toolbar, you can:• add a new base station• add a new sector to a base station• add a new repeater system• add a new antenna system• delete a base station, sector, or antenna system• locate a sector in the Map window• open the Tabular Editor, where you can globally modify site settings.
You can have several base stations at one site, each using a specific technology (e.g., one LTE base station + one WCDMA and GSM base station). A base station can have multiple physical sectors. Each sector can use one antenna system or multiple Antenna systems for true split sector or DAS configurations . Different technologies can also share the same antenna system in different bands with different antenna properties and patterns related to there respective bands.
You can open the Site Editor:• From the Project Explorer by right‐clicking on site name and choosing Edit
or by double‐clicking the site name.• From the Map window by right-clicking a site, and selecting Edit.• From the Mentum Planet toolbar by clicking the Edit Site button and
clicking on the site in the Map window.
33

For UL/DL channel element per carrier
CE used for x = total CE x * % dedicated CE for x, where
X = primary traffic OR soft HO
34

# of CE required for different UL/DL bearer is defined in network setting
E.g., for voice 12.2kbps, if Sector A = best server, Sector B =HO sector, thenFor 1x voice subscriber, Monte Carlo will add 1x CE each for sector A and sector B
At the end of Monte Carlo, some service/subscriber may be blocked due to lack of CE available
35

In the Site Editor, when you select a sector in the tree view, the antenna system associated with that sector is highlighted. This visual cue enables you to quickly determine if the sector is using the most appropriate antenna system.
On the General tab, you can specify flag conditions and add a sector to a group. You can also associate a sector display scheme with the sector in order to create a visually descriptive map of the sectors in your network based on display criteria you define.
As the sector display schemes are linked to the general sector parameters, they are retained and updated based on modifications you make to the site or sector display scheme. You can share sector display schemes with other users as they are submitted to Data Manager along with other site parameters.
Location area code (LAC), routing area code (RAC) and service area code (SAC) can be defined here for WCDMA and used to manage and identify the location of mobile terminals in the network. For GSM, except for LAC and RAC also the Color codes; Base Station Identity Code (BSIC) , Network Color Code (NCC) and Base Station Color Code (BCC) is defined here and the Tracking Area Code (TAC) is defined for LTE.
36

Before you can specify which flags and groups to associate with the sector on the Before you can specify which flags and groups to associate with the sector on the General tab in the Site Editor, you must have defined the flags and groups you want to use in your network.
A flag is a property that you can use to identify sectors as having certain characteristics (i.e., conditions). You can create multiple flags, and each flag can have multiple conditions, but you can assign only one condition per flag to a sector. The conditions of a flag should be a set of related but mutually exclusive values.
A group is a collection of sectors where a common characteristic links all the sectors in the group. You can create multiple groups in a project to optimize your network design. This enables you to easily analyze a particular area of the network or on a particular group of sectors.
For interference matrix generation, it is important to define groups and use them for all steps in the specific workflow.
37

To define flags and conditions
1. In the Project Explorer, in the Sites category, right-click the Flags node and choose New.
2. Define a meaningful name for the flag and click OK. The flag is displayed in the Project Explorer.
3. Right-click the newly created flag node and choose New Condition.4. Specify a name for the condition and click OK.
The condition is displayed beneath the flag node. To apply the condition, you enable the associated check box.
To define groups
1. In the Project Explorer, in the Sites category, right-click the Groups node and do one of the following:§ Choose New Ü Local to create a local group.§ Choose New Ü Shared to create a shared group.
(Shared groups are stored in Data Manager)
38

Project Explorer, Category Sites, right-click Queriesthe Sector Query Editor to define queries that enable you to perform actions on a Project Explorer, Category Sites, right-click Queriesthe Sector Query Editor to define queries that enable you to perform actions on a specific group of sites. You can use queries to identify and locate sites, or highlight sites that require further analysis. For example, you can use queries:
•to identify sectors that are at a specific point in the network life cycle.•to identify sectors where the PA power is less than expected.•to identify sectors within a defined interpolation distance.
The results of the query can be:
•visualized in the Map window in conjunction with analysis layer information•displayed in the Tabular Editor where you can modify site and sector parameters on a global scale•viewed in the Report Preview dialog box from which data can be exported to Excel for further analysis•used to create a new sector group
The resulting sector count is displayed on the status bar at the bottom of the Sector Query Editor dialog box.
39

On the Link tab, you specify the antenna system you want to associate with On the Link tab, you specify the antenna system you want to associate with the sector. This includes the antenna pattern.
Prediction criteria such as the propagation model, the distance, and the number of radials, is defined in the Predictions tabPrediction calculations are performed along radial lines originating at the site. The more radials you use, potentially the more accurate but slower the calculation. If you are planning on generating merged predictions, where survey values are merged with prediction results, you must have a license for the Measurement Data Package.
40

Link configurations track the gains and losses that occur as a signal travels. In other words, a link configuration calculates the radiated power for a sector based on the power output of the sector’s power amplifier (PA) plus or minus system gains and losses.
You associate a link configuration with each sector. You can do this globally using the Tabular Editor. If you want to view the link configuration defined for a sector, in the Site Editor, on the Link tab, click the View tab. You can view the link configuration settings but you cannot edit them in the Site Editor.
In WCDMA technologies we have to define Link Configuration for each carrier as they can be different based on the technology class but logically the main feeder is normally the same for all carriers and is set at the sector level
41

Link configurations track the gains and losses that occur as a signal travels. In other words, a link configuration calculates the radiated power for a sector based on the power output of the sector’s power amplifier (PA) plus or minus system gains and losses.
You associate a link configuration with each sector. You can do this globally using the Tabular Editor. If you want to view the link configuration defined for a sector, in the Site Editor, on the Link tab, click the View tab. You can view the link configuration settings but you cannot edit them in the Site Editor.
In WCDMA technologies we have to define Link Configuration for each carrier as they can be different based on the technology class (Rel99,HSDPA,HSPA etc.) but logically the main feeder is normally the same for all carriers and is set at the sector level
42

The Link Configuration Editor opens where you can specify a common set of link settings, which can be applied to sites, sector groups, or flags.The Link Configuration Editor opens where you can specify a common set of link settings, which can be applied to sites, sector groups, or flags.
To create a new link configuration
1. In the Project Explorer, in the Project Data category, right-click Link Configurations, and choose New.
The link configuration includes a Main Feeder in both up and down links which allows you to set a loss per meter for the main feeder. The feeder length is defined at the sector level and allows you to use link configurations multiple times with different feeder lengths.In Uplink, the link configuration also includes BTS noise figure.
43

When defining sector settings, you need to specify assigned carriers as defined from Network Settings. Can also specify the PN parameters for the sector.
Carrier AssignmentEnable the check box next to those carriers you want the sector to support. For those carriers you have enabled, you can provide a cell identification number. The carriers listed are those you defined in the Network Settings dialog box.
Status BarUse the status bar to view messages and warnings. For example, if a sector uses an antenna that does not support the band assigned to the sector, the warning "Some antennas are used outside their operating bands" is displayed in the status bar at the bottom of the dialog box.
44

For WCDMA: Each Carrier defined in the sector settings has its own parameter settings.
General Settings:-
•Code availability•Carrier specific Link configuration•HSPA Type Settings•General Powers as per assigned Link Configuration•Neighbor List
The Powers Information allows you to see all powers for PA and Pilot and the corresponding EiRP or ERP based on the assigned link configuration and antenna system
45

Max # traffic code = 512 – # CCH code
# R99 code = max # traffic code – 32*HS-DSCH codes
HSPA Capabilities
Activated Technology—choose from this list the carrier technology for the sector.16-QAM—enable this check box for 16-QAM modulation support on an HSPA or Rel 99 & HSPA carriers. This is useful when subscribers are close to the base station and when the channel conditions are good. Using a 16-QAM modulation results in higher data rates as more bits per symbol are supported than with a QPSK modulation.
64-QAM—enable this check box for 64-QAM modulation support on an HSPA or Rel 99 & HSPA carriers. This is useful when subscribers are close to the base station and when the channel conditions are good. Using a 64-QAM modulation results in higher data rates as more bits per symbol are supported than with a QPSK modulation.
Support DC-HSDPA—enable this check box for support of Dual-Cell HSDPA. Using DC-HSDPA can lead to better resource allocation and load balancing on the downlink. Only HSDPA terminal categories 21, 22, 23, and 24 support DC-HSDPA.
46

Implementation Tab, allows for general constraints and static analysis settings:-
Quality Parameters: define targets and limits for Monte Carlo simulations and static analysis
Sector Loading: noise and Power usage for use during Static Analyses
When defining implementation settings, it is important to keep in mind that the settings you specify will determine the quality of the service at the sector. This includes various quality thresholds such as the limit best server coverage parameter, the maximum uplink noise rise, and the maximum number of subscribers.
47

Scheduler gain curve (relative to round-robin scheduler) is a throughput enhancement at a cost of fairness in serving subscriber
48

Noise rise = 10*log10 [ ( I + N) / N ]
Where I = total UL interference (in-cell and out-of-cell)N = noise (thermal and non-system)
UL loading % = (1 – 1/UL noise rise) * 100%
49

How you define your power settings will determine the quality achieved across the network. Power settings include:
PA Power—type in this box the maximum power amplifier (PA) power output by the sector on this carrier.Total Power (EIRP)— the total power (EIRP) output by the sector on this carrier.
Control PowerCPICH—type in this box the control power to allocate to the CPICH server.SCH-P-CCPCH—type in this box the synchronization channel (SCH)/primary common control physical channel (P-CCPCH) power relative to the CPICH power.HS-SCCH—type in this box the power of the High Speed Shared Control Channel. This parameter is only visible if the sector is using a HSDPA or Rel 99 & HSDPA carrier.HSUPA Control Channels—type in this box the combined power required for the E-AGCH (E-DCH Absolute Grant Channel), E-RGCH (E-DCH Relative Grant Channel), and the E-HICH (E-DCH Hybrid ARQ Indicator Channel). These channels are taken into consideration when calculating the link configuration. This parameter is only visible if the sector is using a HSPA or Rel 99 & HSPA carrier.Other Common Control Channels—type in this box the power of other common channels.
Traffic Channel (DPCH) Power LimitsMaximum—type in this box the maximum service power (relative to the maximum CPICH power) for a single, dedicated physical channel (DPCH). This value provides the baseline maximum DPCH power.Minimum—type in this box the minimum service power (relative to the maximum CPICH Power) for a single, dedicated traffic channel. This value provides the baseline minimum DPCH power.
Other User Interference
Average PRACH Interference Power—type in this box the average random access channel interference power for the sector on this carrier.
The total power EiRP is calculated according to base station link budget and includes the PA power, the antenna gain, and other losses such as cable and connector losses (which are taken from the link configuration values of the sector).
For more information, see “Configuring and Placing Sites” in the WCDMA User Guide.
50

51

Neighbor ListDisplays a list of candidate neighbors and associated sector information including the site ID, the sector ID, the frequency band, the carrier ID, and the technology.
Black ListDisplays a list of neighbors that are part of the sector's black list. Sectors that are part of the black list are not available and will not be considered a candidate neighbor.
52

You can customize sector symbols by creating and applying sector display schemes based on sector properties. This provides you with a quick visual summary of the You can customize sector symbols by creating and applying sector display schemes based on sector properties. This provides you with a quick visual summary of the state of the sectors in your network.There is support for repeaters in the Sector Display Scheme
You apply sector display schemes on a sector level on the General tab in the Site Editor. You can use the Tabular Editor to apply a sector display scheme to many sectors. You can also create a site template, which includes a sector display scheme. The scheme will be applied when you create a new site.
Because sector display schemes are now linked to the general sector parameters, they are retained and updated based on modifications you make to the site or sector display scheme.
You can share sector display schemes with other users as they are submitted to Data Manager along with other site parameters.
53

Site templates store the settings defined in the Site Editor and make it easy to add sites with the same configuration at a later time. You can create as many site Site templates store the settings defined in the Site Editor and make it easy to add sites with the same configuration at a later time. You can create as many site templates as required for the purposes of your project. When you export a site template, you can view all the site and sector parameters in Excel.
To create a site template
1. In the Project Explorer, in the Sites category, right-click the site upon which you want to base the site template and choose Create Site Template Ü Local or Create Site Template Ü Shared (if you want the template to be stored in Data Manger and accessible to other users).
2. Type a descriptive name for the new template and click OK.
All site and sector parameters are saved to the site template and the template is added to the Site Templates node in the Project Explorer. If you have assigned a sector display scheme, this includes the sector display formatting.
You can create a new site template (local or shared) from an existing site. You can then use the site template, to place a new site.
54
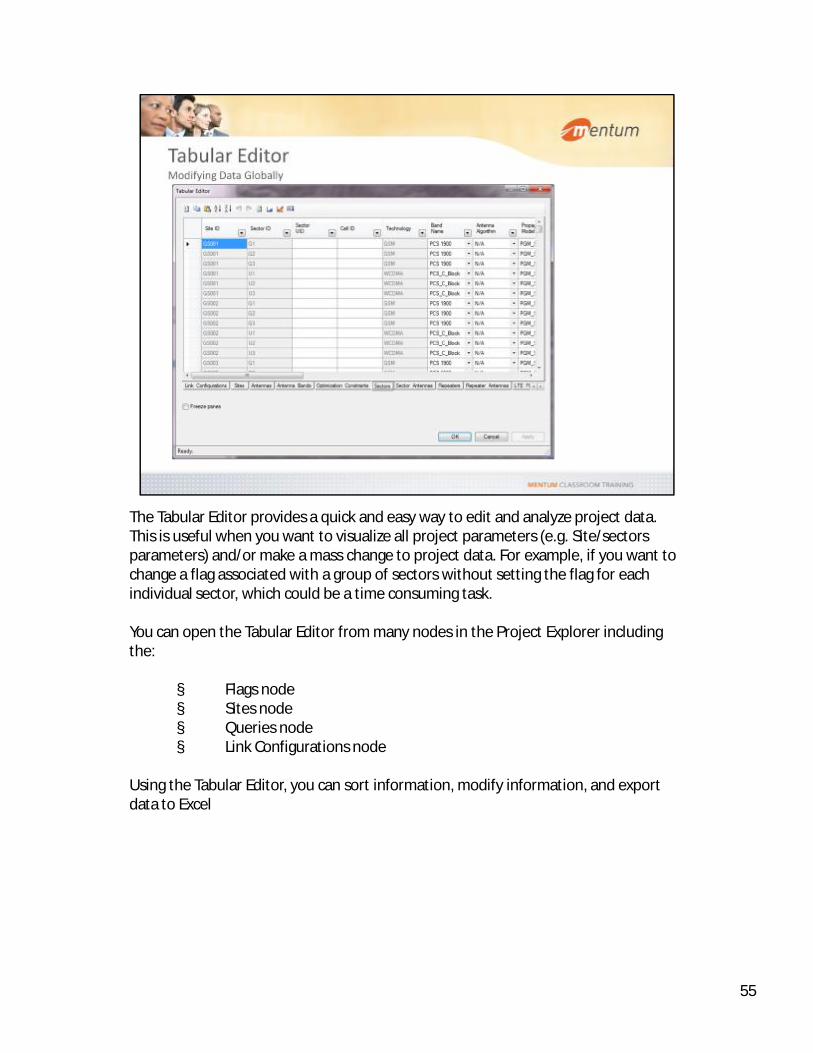
The Tabular Editor provides a quick and easy way to edit and analyze project data. This is useful when you want to visualize all project parameters (e.g. Site/sectors The Tabular Editor provides a quick and easy way to edit and analyze project data. This is useful when you want to visualize all project parameters (e.g. Site/sectors parameters) and/or make a mass change to project data. For example, if you want to change a flag associated with a group of sectors without setting the flag for each individual sector, which could be a time consuming task.
You can open the Tabular Editor from many nodes in the Project Explorer including the:
§ Flags node§ Sites node§ Queries node§ Link Configurations node
Using the Tabular Editor, you can sort information, modify information, and export data to Excel
55

The Tabular Editor provides a quick and easy way to edit and analyze project data. The Tabular Editor provides a quick and easy way to edit and analyze project data.
All project related data can be edited using the Tabular Editor:
Filters can be set on one tab and the filer will be respected in the corresponding data tabs within Tabular Editor.
56

There will be scenarios where you want to make significant project and site data changes that touch many elements of your project. Using the Tabular Editor is one There will be scenarios where you want to make significant project and site data changes that touch many elements of your project. Using the Tabular Editor is one way to do this. However, it does not offer advanced report, compare and analysis capabilities like in Excel. If these are the type of capabilities you require, you can use the Export Wizard to export project data to Microsoft Excel where you can view data in various different ways.
Before import, you have the possibility to see the deference between the current network settings and the settings from the file. There is a compare feature available to use.
Planet 5 supports exporting all project based data do ether CSV files or MS Excel both .xls and .xlsx (MS Excel 2007)
57

A site set is a collection of sites. When you create a project, a default site set is automatically created and is set as the active site set. A green arrow identifies the automatically created and is set as the active site set. A green arrow identifies the active site set and a plus sign indicates that the site set contains all sites.
Site data is stored in the site set and not in the MapInfo site table, which only contains the required information to graphically display sites and sectors in the Map window as well as additional site table columns you can use to query the site data using MapBasic functionality; however, you cannot update site data by modifying the .tab file.
You can create a subset of the site set in order to work on “what‐if” scenarios, or analyze changes you make to site data without changing the active site set. Only when you are satisfied with the changes, do you merge the new site parameters back into the active site set. The subset feature enables you to test different configurations without worrying that your changes will negatively impact coverage or capacity.
When select two site sets, it is possible to make a compare between each other to check the differences.
Site sets can be local or shared (i.e., stored in Data Manager).
To create a site subset
1. In the Project Explorer, in the Project Data category, right-click the site set for which you want to create a subset, and choose Copy Subset.
58

59

60

For more information, see Planet General Model technical NoteFor more information, see Planet General Model technical Note
Improved multi-resolution support in Mentum Planet 5.4.
61
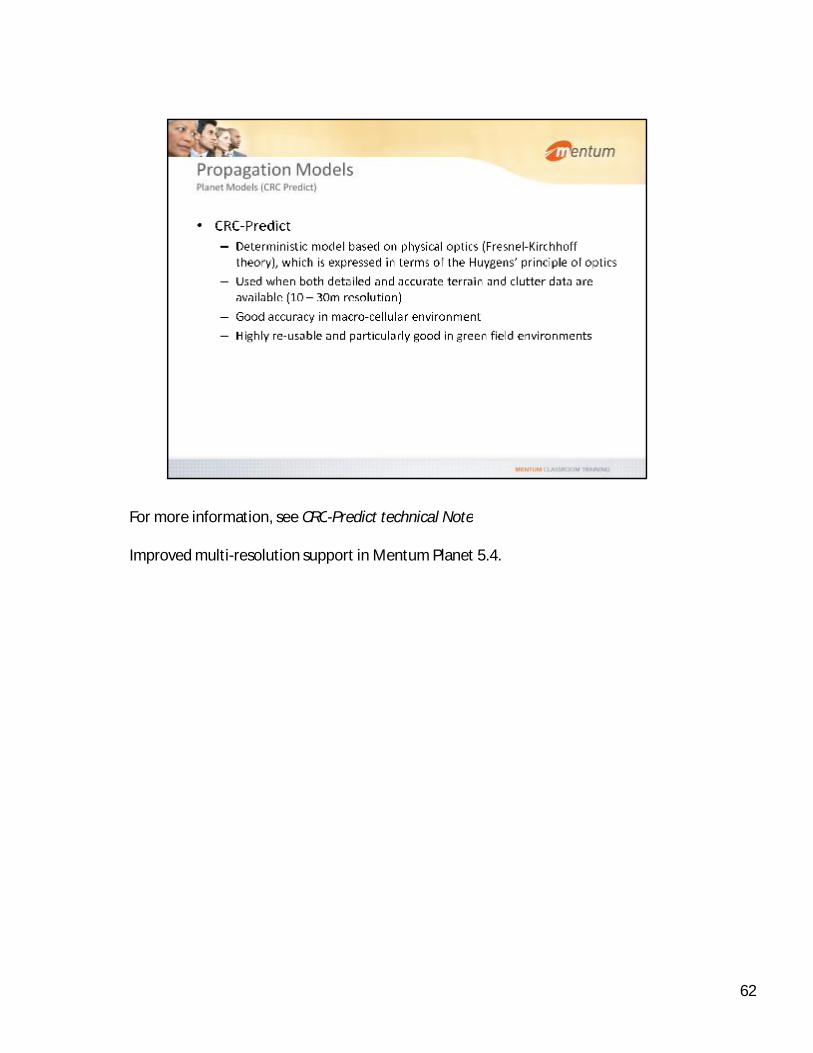
For more information, see CRC-Predict technical NoteFor more information, see CRC-Predict technical Note
Improved multi-resolution support in Mentum Planet 5.4.
62

For more information, see CRC-Predict technical NoteFor more information, see CRC-Predict technical Note
63

For more information, see Universal Model User GuideFor more information, see Universal Model User Guide
64
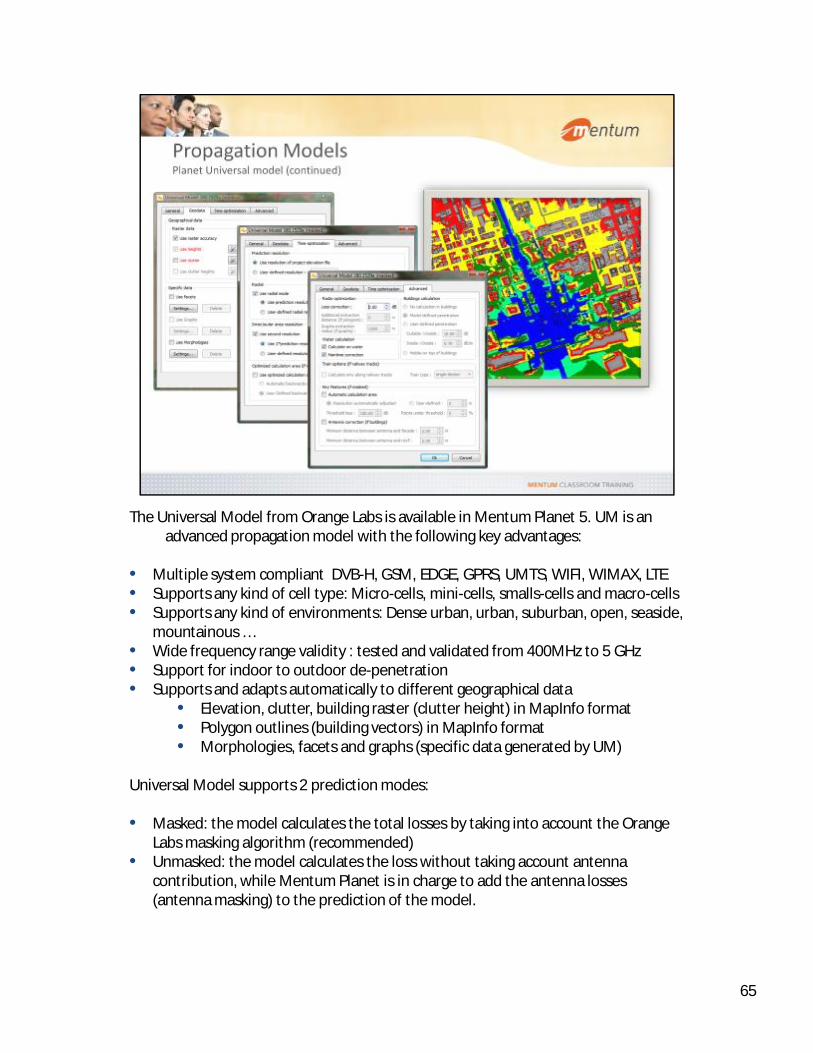
The Universal Model from Orange Labs is available in Mentum Planet 5. UM is an advanced propagation model with the following key advantages:
The Universal Model from Orange Labs is available in Mentum Planet 5. UM is an advanced propagation model with the following key advantages:
• Multiple system compliant DVB-H, GSM, EDGE, GPRS, UMTS, WIFI, WIMAX, LTE• Supports any kind of cell type: Micro-cells, mini-cells, smalls-cells and macro-cells• Supports any kind of environments: Dense urban, urban, suburban, open, seaside,
mountainous …• Wide frequency range validity : tested and validated from 400MHz to 5 GHz • Support for indoor to outdoor de-penetration• Supports and adapts automatically to different geographical data
• Elevation, clutter, building raster (clutter height) in MapInfo format• Polygon outlines (building vectors) in MapInfo format• Morphologies, facets and graphs (specific data generated by UM)
Universal Model supports 2 prediction modes:
• Masked: the model calculates the total losses by taking into account the Orange Labs masking algorithm (recommended)
• Unmasked: the model calculates the loss without taking account antenna contribution, while Mentum Planet is in charge to add the antenna losses (antenna masking) to the prediction of the model.
65

Propagation models simulate how radio waves travel through the environment from one point to another. To model the real-world behaviour of a network and account Propagation models simulate how radio waves travel through the environment from one point to another. To model the real-world behaviour of a network and account for how radio waves react to elevation changes and clutter (e.g., reflection, diffraction, and scattering), you must account for features in the environment such as the surface of the terrain (e.g., hilly or flat) and the presence of lakes. Ground cover such as buildings and trees must also be taken into consideration.
In order to accurately model the network, you must ensure that you choose a propagation model that is appropriate to the environment you are modeling. With Mentum Planet, you have the option of selecting one of several different propagation models:
• CRC-Predict• Planet General Model• Universal Model (optional, requires a specific license)• Q9
For more information, see the CRC-Predict Technical Note, the Planet General Model Technical Note, and the Universal Model User Guide located in the Help folder within the Mentum Planet installation folder.
66

Propagation models are organized in the Project Data category of the Project Explorer. The icons of propagation models that have been assigned to a sector are Propagation models are organized in the Project Data category of the Project Explorer. The icons of propagation models that have been assigned to a sector are displayed in color. The icons of propagation models that have not been assigned to a sector, but are located in the Model folder of the project, appear dimmed.
You can refine how a propagation model behaves by modifying the propagation model settings using the Propagation Model Editor. Once you have refined the model, you can apply the propagation model to an individual site or sector.
To create a propagation model
1. In the Project Explorer, in the Project Data category, expand the Propagation Models node.
2. Right-click the propagation model upon which you want to base your refined model and choose New.
3. Type a descriptive name for the new model and click OK4. The Propagation Model Editor opens. The tabs that are displayed depend on the
model.
67

68

General guidelines for model tuning1. Follow the recommended guidelines for collecting survey data. 2. Average survey data in order to remove Rayleigh fading.3. Filter survey data to get rid of inconsistent measurement points (e.g. Tunnels,
bridge, values below receiver sensitivity etc.)4. Ensure that the frequency of the input model used in model tuning is accurate
and the receiver height corresponds to measured data.5. Ensure that the clutter maps you use are accurate and up-to-date.6. Verify that the model uses clutter heights that are recommended or appropriate
for the model. 7. Ensure that ground types, if used, are appropriate. For example, moist ground
should be assigned to farmland.8. Create one model to cover all surveys with similar characteristics. For example,
for a given metropolitan area, start with one input propagation model. Tune one model for the sub-urban area. Using the same input model, tune a second model for very dense urban and downtown area. The tuned models will provide reasonably accurate predictions for topologies of similar clutter characteristics (such as neighboring regions). This approach can be fine tuned by subdividing the metropolitan area to more than two areas and generating corresponding models for each area.
69

In Mentum Planet, you use imported and filtered survey data to improve the accuracy of your prediction models. Mentum Planet uses the survey data to fine tune its In Mentum Planet, you use imported and filtered survey data to improve the accuracy of your prediction models. Mentum Planet uses the survey data to fine tune its calculations and display results that more closely emulate the conditions in the real world. A survey data file must follow a set structure: longitude, latitude, and signal strength.
Survey data is organized and grouped in the Operational Data category of the Project Explorer. If the survey data is in *.tab format and already contains survey points viewable in a Map window, you can open the file directly. Otherwise, there are three file types that Mentum Planet can import: Microsoft Excel (.xls and .xlsx), ASCII text (.txt), and Planet DMS. Once a survey is added to the project, the status of the survey is identified colored icons.
TEMS Route Reader 7.0 is integrated with Mentum Planet 5.4, in order to allow the import of native-format TEMS Investigations files.Mentum Planet also has support for WCDMA/HSPA JDSU AOD drive test format.
To import or add a survey
1. In the Project Explorer, in the Operational Data category, right-click Survey Data and choose Import.
70

Planet has very advanced feature set for model tuning and survey manipulationincludingPlanet has very advanced feature set for model tuning and survey manipulationincluding
• Survey manager• Statistical visualization• Survey filtering• Survey averaging
71
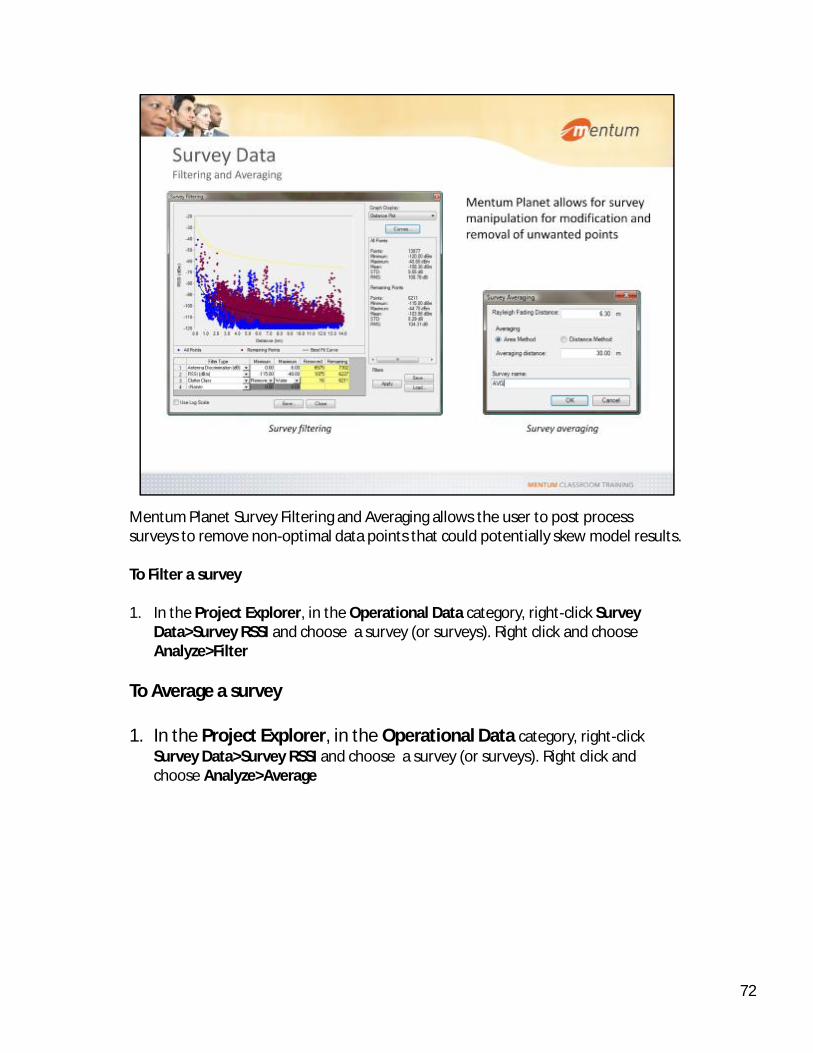
Mentum Planet Survey Filtering and Averaging allows the user to post process surveys to remove non-optimal data points that could potentially skew model results.Mentum Planet Survey Filtering and Averaging allows the user to post process surveys to remove non-optimal data points that could potentially skew model results.
To Filter a survey
1. In the Project Explorer, in the Operational Data category, right-click Survey Data>Survey RSSI and choose a survey (or surveys). Right click and choose Analyze>Filter
To Average a survey
1. In the Project Explorer, in the Operational Data category, right-click Survey Data>Survey RSSI and choose a survey (or surveys). Right click and choose Analyze>Average
72
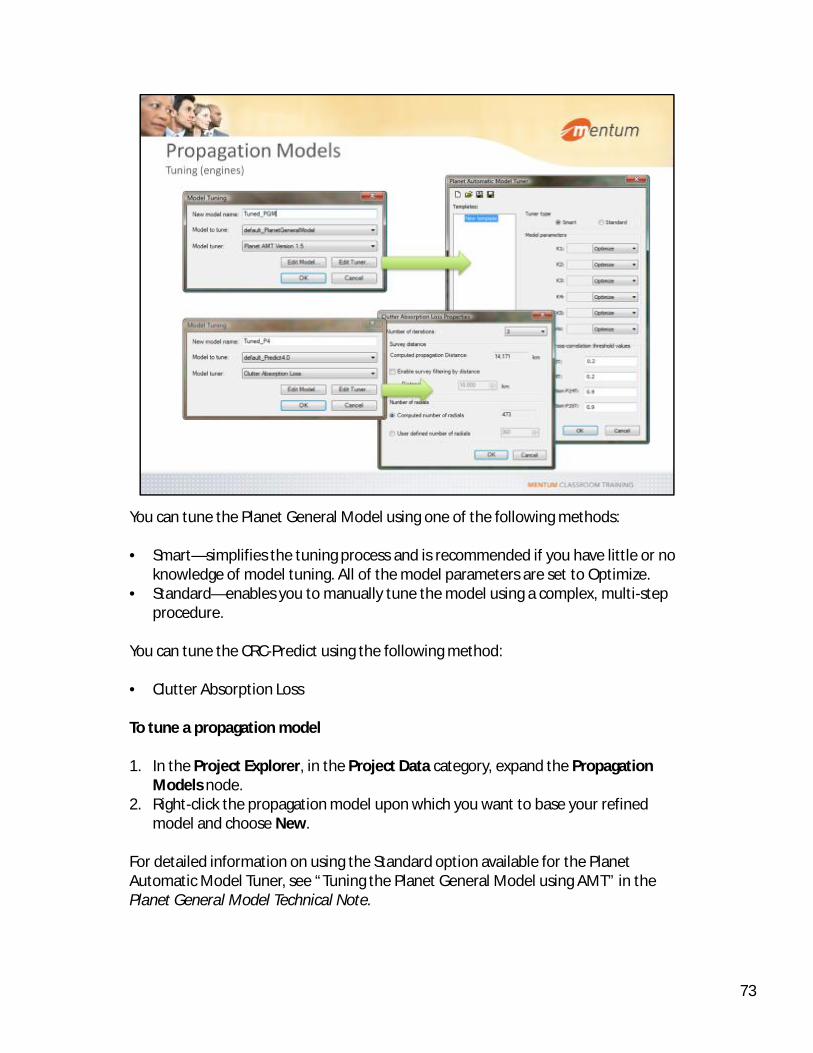
You can tune the Planet General Model using one of the following methods:You can tune the Planet General Model using one of the following methods:
• Smart—simplifies the tuning process and is recommended if you have little or no knowledge of model tuning. All of the model parameters are set to Optimize.
• Standard—enables you to manually tune the model using a complex, multi-step procedure.
You can tune the CRC-Predict using the following method:
• Clutter Absorption Loss
To tune a propagation model
1. In the Project Explorer, in the Project Data category, expand the Propagation Models node.
2. Right-click the propagation model upon which you want to base your refined model and choose New.
For detailed information on using the Standard option available for the Planet Automatic Model Tuner, see “Tuning the Planet General Model using AMT” in the Planet General Model Technical Note.
73

Mentum Planet has an extensive set of post model tuning tools to help validate Mentum Planet has an extensive set of post model tuning tools to help validate models and suitability of model assignments for existing and new sites based on survey data analysis
• Compare to Grid functions allow for basic survey to grid analysis.
• Mentum Planets Advanced Measurement Data Package allows for additional functionality within the Mentum Planet tool
• Compare to Model Prediction allows for extended reporting functionality over basic compare to grid. (As seen above)
• Merged Propagations using the Survey prediction Tool (SPT)• Propagation Model Analyses, a fully featured model performance analysis tool.
74

Mentum Planets Propagation Analysis Tool allows for extremely detailed model •Mentum Planets Propagation Analysis Tool allows for extremely detailed model analysis on a sector by sector basis (if survey data is available) including:
• Distance based performance• Clutter based performance• Per sector/Model performance• Pre survey/Model performance• Reporting and exporting functions
Thresholds can be set for all metrics as per the users specifications, the PMA is fully integrated in Mentum Planet 5.2 when the AMDP package is purchased.
For detailed information on using the Propagation Model Analysis Tool see “Generating Propagation Model Analyses” in the Mentum Planet User Guide.
75

Mentum Planets Propagation Analysis Tool Has advanced Reporting tools to allow for Mentum Planets Propagation Analysis Tool Has advanced Reporting tools to allow for very detailed reports on model specific performance metrics including:
• Survey Point distribution• Mean-RMS and Standard Deviation• Correlation• Quality
Reports can be run for any type:
• Survey, Distance or Clutter• Model, Distance or Clutter• Sector, Distance or Clutter• Sector/Survey, Distance-Clutter matrix
76

Predictions use a propagation model, terrain and clutter information, and general sector settings including the power, antenna, and azimuth to predict the signal Predictions use a propagation model, terrain and clutter information, and general sector settings including the power, antenna, and azimuth to predict the signal strength and path loss of a sector at any location where the signal exceeds the defined minimum level. You can generate predictions separately or as part of an analysis.
Prediction files can take up a lot of disk space. You can use the Prediction Manager to view a list of the predictions that have been generated for a project, and remove any files that you no longer require.
To open the Prediction Manager
1. Choose ToolsÜ Prediction Manager.
For more information, see “Generating Predictions” in the Mentum Planet User Guide.
77

78

When you generate predictions, Mentum Planet performs coverage and propagation calculations using the parameters you configured, and creates map layers to display When you generate predictions, Mentum Planet performs coverage and propagation calculations using the parameters you configured, and creates map layers to display the calculation results.
You can view prediction layers for individual sites or sectors from the Project Explorer. This is a fast and easy way to view predictions in the same Map window. You can display prediction layers for various powers depending on the technology of the sector.
To view predictions
1. In the Project Explorer, in the Sites category, expand the Sites node.2. Right-click a sector, choose View Predictions, and choose the type and power you
want to view.
79

As part of the enhancements brought by MapInfo’s latest version 11.0.1, Mentum Planet now includes an embedded Bing Maps Visualization option, allowing for As part of the enhancements brought by MapInfo’s latest version 11.0.1, Mentum Planet now includes an embedded Bing Maps Visualization option, allowing for instant viewing of a satellite photograph on the Map window. The feature supports two modes: aerial (only the map) and hybrid (with street names)When enabled, the photo will be shown as another layer under Mentum Planet’s Windows category or MapInfo’s Layer Control, from where it can be managed (e.g. moved, hidden, etc)
The resolution of the picture will change according to your zoom.
Mentum Planet also has the ability to display “Open Street Map Roads” and “Bing Roads” as MapInfo layers.
80

The user can display any grid (e.g. analysis layers, clutter, etc) on top of the aerial photograph by using the translucency feature and use the Grid Info feature to check The user can display any grid (e.g. analysis layers, clutter, etc) on top of the aerial photograph by using the translucency feature and use the Grid Info feature to check data anywhere around the screen.
Mentum Planet also supports export of layers to Google Earth using the Google Earth Link tool embedded within MapInfo.
81

82

Mentum Planet supports export to Google Earth functionalities, which allows you toexport network data (e.g. Site, sector and antenna information) as well as MapInfo Mentum Planet supports export to Google Earth functionalities, which allows you toexport network data (e.g. Site, sector and antenna information) as well as MapInfo grids (e.g. coverage layers)
83

Automatic Site Placement tool allows users to make fast nominal cell plans for greenfield-style rollouts or expansion-style rollouts. Automatic Site Placement tool allows users to make fast nominal cell plans for greenfield-style rollouts or expansion-style rollouts.
The tool uses simple radius methods for placing a grid of hexagons based on user input in a selected polygon area.
You have several choices in avoiding placement outside of the polygon, and in certain clutter classes i.e. avoid placing sites in clutter type “water”
It is specifically designed to quickly build clusters of sites with predetermined cell radius
You can chose to use site templates to build site and sectors at the centers defined
84

Data Manager provides for multi-user collaboration in a secure centralized data management environment where multiple users are accessing a project Data Manager provides for multi-user collaboration in a secure centralized data management environment where multiple users are accessing a project simultaneously. A version control system prevents users from overwriting one another’s changes. In order for site sets, attachments, groups, and site templates to be stored in Data Manager they must be located in the Shared folder in the Project Explorer.
When you update your project locally or submit changes to the project stored on the Data Manager Server, you will be required to resolve any conflicts that are found. A conflict occurs when a project item stored on your workstation differs from the same project item stored in Data Manager. You choose whether the Mentum Planet value (i.e., the local value) is kept or the value stored on the server is kept.
To connect to Data Manager
1. In Mentum Planet, choose DataÜ Data Manager.
For more information, see the Data Manager User Guide and the Data Manager Application Note located in the Help folder within the Mentum Planet installation folder.
85

Data Management in Mentum Planet is comprised of two distinct (and separate) elements:Data Management in Mentum Planet is comprised of two distinct (and separate) elements:
• The Data Manager client, which is installed as part of Mentum Planet• The Data Manager server, which is installed on a network server and which is
managed by the Data Manager Administrator
Implementing Mentum Planet data management provides the following advantages:
• Any number of users can work on a project simultaneously• You can get up-to-date project data from the server and then disconnect from the
server and continue working.• Project data can be held in a secure central location that is routinely backed up.
86

The Data Manager Server is installed on a corporate server and administer by the Data Manager Administrator. It is the Administrator who creates the project The Data Manager Server is installed on a corporate server and administer by the Data Manager Administrator. It is the Administrator who creates the project hierarchy, user profiles, and grants permissions to users. The Data Manager Server consists of the database (either SQL or Oracle) and a file server folder (where certain types of data are stored). All users must have read/write permission on the file server folder.
The Administrator works in the Data Manager Server Console. From this Console, the Administrator can perform a myriad of tasks including backing up the database and creating custom columns.
87

Data Manager is installed as part of Mentum Planet. Using Data Manager, multiple Mentum Planet users can perform the following tasks:Data Manager is installed as part of Mentum Planet. Using Data Manager, multiple Mentum Planet users can perform the following tasks:
• update their Mentum Planet projects with changes made by other users• lock or unlock project data (locking prevents other users from modifying the data
in Data Manager)• submit modified project data to Data Manager• filter the data shown in the Data Manager tree view to display only a subset• view details of individual project items, the lock status of items, and the date and
time of the last update• compare the values in the Mentum Planet project currently open and the values
stored in Data Manager
Data Manager clients work in the Data Manager dialog box.
88

89

90
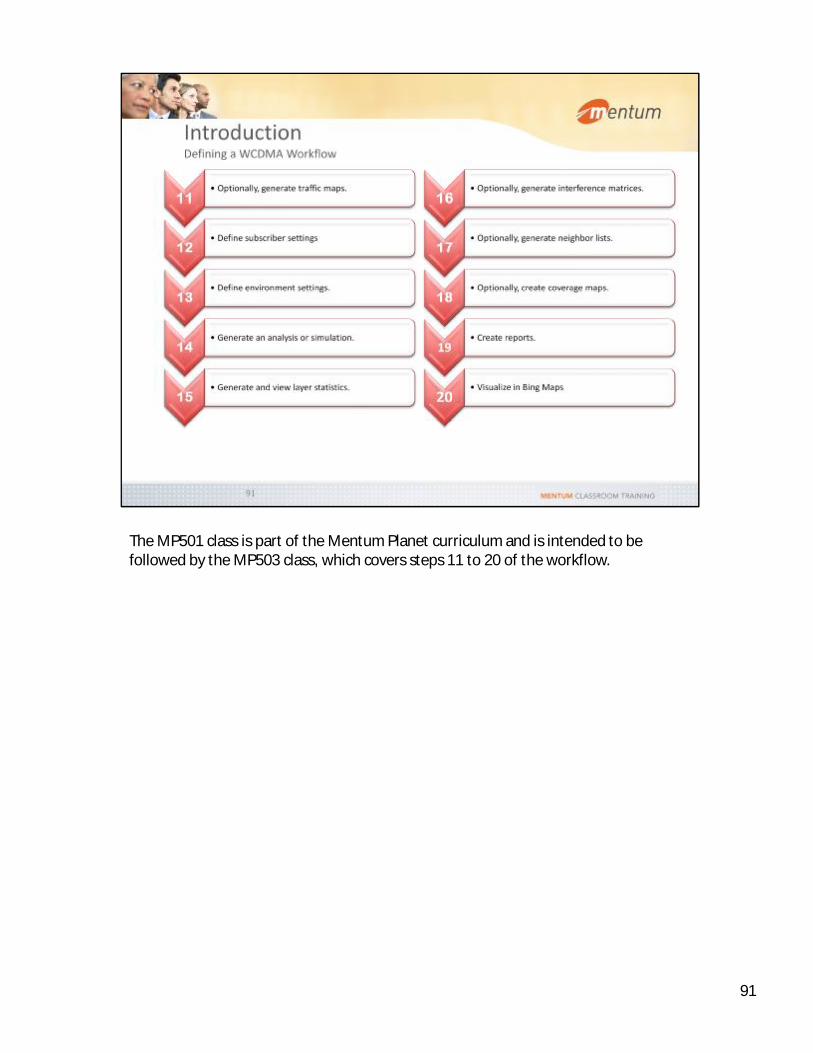
The MP501 class is part of the Mentum Planet curriculum and is intended to be followed by the MP503 class, which covers steps 11 to 20 of the workflow.
91

Mentum Planet includes the Network overlay tool which allows for users to build overlay networks of different technologies based on an existing dataset, i.e. WCDMAMentum Planet includes the Network overlay tool which allows for users to build overlay networks of different technologies based on an existing dataset, i.e. WCDMAfrom an existing GSM network. This can be useful for saving time and separating new network design from current infrastructure.
The Network Tool is accessed through the tool menu within Planet
MenuÜToolsÜNetwork overlay
The Tool is a wizard based tool that will guide you through importing the site data from previous versions of Planet including Planet 3.3 and Planet 4.5 as well as the current version for the 5.x platform.
92

Traffic maps provide data about the geographical distribution of subscriber traffic in a network. You can generate a traffic map from demographic data, such as population Traffic maps provide data about the geographical distribution of subscriber traffic in a network. You can generate a traffic map from demographic data, such as population census data, or from network data.
When planning a network, you can use demographic data to estimate subscriber numbers. The variation in subscriber density across the network coverage area is likely to be similar to the variation in population density. When optimizing an existing network, you can base your traffic map on network data that reflects the actual usage patterns in the network.
To create a traffic map
1. In the Project Explorer, in the Project Data category, right-click Traffic Maps and choose New.
For more information, see “Working with Traffic Maps” in the Mentum Planet User Guide.
93

Using the Network Data Import Wizard, you can import data collected from network switching equipment, which contains information about the network configuration Using the Network Data Import Wizard, you can import data collected from network switching equipment, which contains information about the network configuration and performance. Using network data gives you the opportunity to get an up-to-date picture of how the network is performing.
The Wizard takes you through the steps required to create a connection between the data gathered by the switches and the sectors in your project. You can bind network data on any field associated with a sector provided that the field is unique. Before you can create a traffic map from network data, you must generate signal strength predictions for the sectors specified in the network data.
You can display the network data in a Map window and generate a reports. Network Data can be used as an input to the sector display scheme engine in Mentum Planet to visualize the data graphically within the Map window.
Because subscribers use services differently in different places, you must create a traffic map for each service type. Traffic maps help the simulation tool determine where to place subscribers.
The following slides will show you one method for generating a traffic map.
94

Sector Display Schemes can be built for imported data to be visualized within the Planet interface.Sector Display Schemes can be built for imported data to be visualized within the Planet interface.
95

Network Data is available for most operators and can be used by Mentum Planet for traffic studies and loading for Monte Carlo Simulations many other methods and data sources can be used by Planet, the Traffic Map generation wizard is designed to guide the user in traffic map generation and the function is similar no mater what the input source to the data.
Traffic map generation is accessed via the Project explorer “Project Data” Category
Right Clicking on Traffic Map and choose New.
NOTE: Before generating a traffic map, ensure you have defined penetration losses in the Environment Editor. Signals considered in traffic map generation are attenuated using the defined penetration losses, the frequency band of the sector and the clutter class of each bin.
96

Options for Data source input include:-Regions VectorsExisting Classified Grid (MapInfo Grid file)Network imported data file (Excel or CSV)
WeightingWhen you merge a vector file with a clutter grid, you can include significant sources of traffic represented by vectors, such as major roads, in your clutter weighting.
Input Data UnitErlangs Subscribers Kbps (Kilobytes per second)
Output Data Unit Erlangs/km² Subscribers/km² Kbps/km²
97

Use Pre-Bound Network DataTraffic Data Column—choose from this list the column in the chosen pre-bound network data table that contains the traffic count data.
Traffic-Spreading AlgorithmBest Serving Coverage Grid—choose this option to define a classified grid that contains the BSC grid with which to generate a traffic map. On-The-Fly Best Server Coverage Grid Generation—choose this option to generate a best server coverage grid. The generated best server grid will be used to distribute traffic data.Sector Service Probabilities—choose this option to generate the traffic map using sector service probabilities.
98

Sector Service Probabilities algorithm is to delineate the area over which signal coverage probabilities are to be calculated by specifying the sectors to include in the traffic map generation and the thresholds to respect.
Use the Band Filtering section to choose the bands upon which you want to create a subset of sites.
99

If you choose to Apply Clutter Weighting you can also redistribute traffic values according to the type of clutter in each region. The result is a more realistic prediction of where your traffic loading will occur.
100

Resultant traffic maps can be used in Monte Carlo simulations and further analysis. Also as part of statistical analysis. Resultant traffic maps can be used in Monte Carlo simulations and further analysis. Also as part of statistical analysis.
101

When you generate a Monte Carlo analysis, Mentum Planet will spread subscribers within clutter classes using the environment settings you define in the Environment Editor. The clutter classes using the environment settings you define in the Environment Editor. The environment settings enable Mentum Planet to delineate what percentage of users are in vehicles, outdoors, indoors, or deep indoors within a particular clutter class.
When you generate a Network analysis, you need to define a specific environment type to be used between outdoor, vehicular, indoor or deep indoor. Mentum Planet will include the slow fading standard deviation, penetration loss and fast fading margin corresponding to the environment you have selected
By default, Mentum Planet will base the environment file on the primary (project) clutter file. You can, however, specify that environment settings be based on a user-defined clutter file. You do this in the Project Settings dialog box.
To specify a clutter file for environment settings
1. EditÜ Project Settings.2. Click the Advanced Options tab.3. In the Environment section, choose one of the following options:
• Use Primary Clutter Grid• Use User-Defined Grid
To define environment settings
1. Choose EditÜ Environments.
102

In order to create a realistic model of network performance, you need to have a good understanding of who your subscribers are, where they are located, and how they use the services available to them. You then need to translate these subscriber profiles into subscriber types that Mentum Planet can use to model subscribers and their use of network resources. To make this task easy for you, the characteristics of subscribers are defined using the nodes in the Subscriber Editor. Subscriber types are used in Monte Carlo simulations where in the first phase of the simulation Mentum Planet spreads subscribers across the analysis area.
Edit -> Subscriber Settings
For more information, see “Defining WCDMA Subscribers” in the WCDMA User Guide.
103

Subscriber Editor is a unified concept in Mentum Planet and is used for Monte Carlo Simulations and Static Analysis. Nominal analyses only require the definition of equipment types.
The nodes within the Subscriber Settings dialog box represent building blocks for subscriber types:• Equipment Types
• include the types of mobile equipment and antennas that are available in your network as well as the bearers available on each type of equipment.
• Services• relate to the applications that a subscriber uses and the level service required. This includes the activity factors used to calculate the effective amount of time that a subscriber uses a service as well as the quality of service requirements.
• Subscriber Types• consolidate the information from the other nodes in the Subscriber Editor into various combinations to represent the mix of subscribers in your network.
For each subscriber type, you must choose a subscriber equipment type and traffic map. You can define multiple usage types, each of which comprises weightings to spread subscribers within the four different environments, and a service type.
For more information about working with the subscriber settings, see the appropriate User Guide for the technology you are using.
104

Note: A subscriber equipment is considered as having no HSPA capability if no HSPA Note: A subscriber equipment is considered as having no HSPA capability if no HSPA bearer is enabled and therefore cannot be carried by HSPA carriers.
105

The definition of service includes QoS requirementThe definition of service includes QoS requirement
The bursty and asymmetric nature of packet data service can be characterized by properly setting input load and downlink/uplink activity factors
106

The traffic map and the input loads are used together to determine the number of active subscribers that are spread in each MC run. The total number active The traffic map and the input loads are used together to determine the number of active subscribers that are spread in each MC run. The total number active subscribers is determined by summing up the traffic density map over the analysis area when the erlang map is used. Basically, 1 erlang represents one active subscriber. The active subscribers are then spread to the analysis area by a Poisson Distribution. In a nutshell, the traffic density of a bin is passed to a random number generator that uses a Poisson Distribution to generate a random number of the users within the bin. This process is repeated for every bin in the analysis area which results in the so called “snapshot” of the system.
The Mentum Planet allows three types of traffic maps to be used by a subscriber type, an erlang map, a subscriber map or a throughput map. When the erlang map is used, the total number of active subscribers is obtained simply by summing the traffic map over the analysis area. When a subscriber or a throughput map is used, the total number of active subscribers is determined by converting the total subscribers or total throughput into total erlang, i.e.
Total erlang = (total number of subscribers) x (erlang per sub)Total erlang = (total throughput)/(throughput per sub) x (erlang per sub)
107

108

Most data services are not served by a constant data rate. The channel activity factor varies with the bearer data rate (that are used to support the service). The Most data services are not served by a constant data rate. The channel activity factor varies with the bearer data rate (that are used to support the service). The DL/UL activity factors in the Planet service settings should be defined according to the lowest DL/UL bearer service data rates that are allowed for the service.
For example, if a service’s minimum down link data rate is 5kbps, however, the lowest data rate bearer (defined in mobile equipment settings) to support the service is 9.6kbps, the activity factor should be specified with reference to the 9.6kbps bearer data rate. The analysis algorithm automatically scales the activity factors for higher data rate bearers based on the activity factor of the lowest data rate bearer.
109

Subscriber type usage weights: Mentum Planet defines four different environment types, outdoor, vehicular, indoor and deep indoor. The environment types can be enabled/disabled for individually for all clutter classes.
For example, if all 4 environment types are enabled for a clutter class named ‘dense urban’, and, if there is an active subscriber being spread to a ‘dense urban’ bin by a MC run, the subscriber could be in one of the environments. The actual environment type used to analyze the subscriber is selected by a random process according to the usage weights. For example, if the usage weights of the subscriber type indicate a value of ‘1’ for outdoor and indoor, and ‘0’ for other two environment types, the subscriber has 50% probability in the outdoor or indoor environment.
110

Using an area grid can help with analysis and statistics by targeting the area of interest.Using an area grid can help with analysis and statistics by targeting the area of interest.

Using the embedded MapInfo. GIS system allows for many enhancements within Mentum Planet.Using the embedded MapInfo. GIS system allows for many enhancements within Mentum Planet.

Planet includes an Areas Tool to create GRC files from MapInfo polygons in one simple operation.Planet includes an Areas Tool to create GRC files from MapInfo polygons in one simple operation.
These GRC files can be used to define areas of interest for simulation, analysis and statistics.
They are also used by some 3rd Party tools to define areas (Optimization region by Capesso for instance)

Monte Carlo Simulations allow for statistical analysis of theoretical networks, and are very useful during the primary stages of network development business cases through initial system design.
114

Unlike a network analysis, a Monte Carlo simulation takes all subscriber parameters into account when generating simulation layers. To do this, at each Monte Carlo run, Mentum account when generating simulation layers. To do this, at each Monte Carlo run, Mentum Planet:
§ Creates a random pattern of subscribers. The simulation places the subscribers at random locations using the traffic map densities, and determines the subscriber types from the definitions in the Subscriber Settings Editor.
§ Generates uplink analyses. This uses the random subscriber pattern to determine the number of subscribers that can be served, while taking into account the impact of each served subscriber on the network.
§ Generates downlink analyses. To do this, the simulation uses the best serving sector information determined in the uplink analysis. On the last run of the simulation, the simulation tool also generates two additional types of data:§ Operating points— These are the results of the simulation divided by
sector, carrier, and subscriber type. Mentum Planet averages these and uses them to create analysis layers.
§ Discrete subscriber information—Mentum Planet compiles snapshots of each subscriber’s status on each run of the simulation. When the simulation finishes, the coverage status of each subscriber is stored in a MapInfo table (*.tab).
To generate a Monte Carlo Simulation
1. In the Project Explorer, in the Monte Carlo Simulation category, right-click WCDMA Simulation, and choose New.
115

To generate a Monte Carlo SimulationTo generate a Monte Carlo Simulation
1. In the Monte Carlo Simulation Setup Wizard select the site/sectors that will be modeled in this Monte Carlo simulation
2. Click Next and Check which Subscriber Types are to be Simulated
116

To generate a Monte Carlo Simulation
1. In the Monte Carlo Simulation Setup Wizard select the Parameters required that will be modeled in this Monte Carlo simulation
•Simulation Area Use this panel to define the area over which the simulation is computed.The parameters on this tab are only available when defining simulation settings for a new WCDMA Monte Carlo Simulation.
•Use the Combined Area of Selected Predictions—choose this option to use the full area covered by the signal strength predictions of the sectors chosen for the simulation.•Use Simulation Bounds—choose this option to define the coordinates (latitude and longitude) of the simulation area.•Use an Analysis Grid—choose this option to limit the simulation area to the area covered by a classified grid (.grc). •Use An Area Grid—choose this option to limit the analysis area to the area covered by an area grid. Choose a predefined area grid from the list.
•Simulation Resolution—type in this box the bin size for the outputs generated by the simulation. The grid dimension (in bin units) varies inversely with bin size: the smaller the bin, the larger the grid file. The value you choose should be a compromise between the degree of resolution required for analysis, the processing time, and file size. The grid dimensions (in bin width and height) and the grid file size (in kilobytes) are displayed and updated as the bin size is adjusted.
1. Click Next Use the Final Step page to save simulation settings and generate outputs.
•Save Settings—choose this option to save the settings you have define for Monte Carlo simulation generation. You can generate the Monte Carlo simulation results at a later time by right-clicking on the simulation in the Monte Carlo Simulations category of the Project Explorer and choosing Generate.•Save Settings and Generate Output—choose this option to save the settings you have define for Monte Carlo simulation generation and generate outputs.
117

Visualization of Subscribers after generating a Monte Carlo Simulation Visualization of Subscribers after generating a Monte Carlo Simulation
• Visualize the subscribers based on any information e.g. Status/Type etc.• Create legends for subscribers • Select individual subscribers for full information
118

When Site/sectors information is present, reports can be used to create a specific sector display scheme to display the simulations data.When Site/sectors information is present, reports can be used to create a specific sector display scheme to display the simulations data.
As with imported Network data any numerical data from a simulation or statically generated values using the statistics tool can be made into Sector Display Schemes allowing any function, data internal or external to be represented as a display scheme, (these can also be used to re-color a best server layer).
119

After you have calculated layer statistics, you can examine the detailed statistics in the Report Preview. You can then export the statistics to Excel where you can use the After you have calculated layer statistics, you can examine the detailed statistics in the Report Preview. You can then export the statistics to Excel where you can use the advanced visualization features to create charts or further analyze the data. If the layer you are analyzing includes site and sector information, you can create a sector display scheme that will only be applied to sectors with statistical data.
You can also drill down on site information by clicking the hyperlink for the individual site. This opens the Site Editor where you can review site and sector parameters.
120

By generating and examining the outputs, you can estimate the coverage, quality, and capacity of your WCDMA network.
121

In Mentum Planet, you can generate a network analysis with nothing more than the equipment type and service defined in the subscriber settings. This decreases the time required to prepare for a network analysis and results in less time being required to generate the analysis layers; however, this type of analysis does not generate detailed subscriber information. The analysis runs only once and generates analysis layers automatically. Network analyses are useful when:
• You do not have the time to generate sometimes lengthy Monte Carlo simulations.
• You are looking for a simplified network analysis using equipment type settings that will give you a quick and easy overview of network performance.
• You are using uniform sector loading or sector loading information from the switch.
• You are creating scenario-based analyses with different network loading assumptions.
• You are focused on initial network coverage planning and interference analysis.
122

To streamline your workflow when you use the same settings for a number of analyses, you can define default analysis settings. To streamline your workflow when you use the same settings for a number of analyses, you can define default analysis settings.
To generate a Network Analysis
1. In the Project Explorer, in the Network Analysis category, right-click WCDMA Analysis, and choose New.
123

To generate a Network AnalysisTo generate a Network Analysis
1. In the Network Analysis Setup Wizard select the site/sectors that will be modeled in this Network Analysis
2. Click Next select the Frequency Band to be modeled3. Select which Equipment Type, Service and Environment is to be modeled (from
the Settings in Subscriber Editor)
Note: Mentum Planet 5.x no longer supports the concept of “nominal” subscriber and uses a subset of the information configured within Subscriber Editor
124

In the Network Analysis Setup Wizard select
• Best Server• Best EC Threshold
Type in this box a value to define the threshold for the CPICH -Best Ec Server analysis layer.The CPICH - Best Ec Server analysis layer displays the best server at each location where the Ec is above the Best Ec Threshold value.
• Nth Best Server For Delta Layer: choose from this list the number of the Nth Best Server for which to generate a grid. For example, if you want to produce grids of the fourth best server at all locations, choose “4”.
• Use Soft Handoff GainEnable this check box to use the soft handoff gain due to macro-diversity. When you use the soft handoff gain, the PA power of mobiles in handoff will be reduced. If cleared, the calculated handoff gain is not taken into account for the reverse link analysis for the mobile.
• Traffic Loading• Use the Loading Defined in Sector Settings
Choose this option to use the sector loading values defined on the Implementation tab in the Site Editor.
• Use Global LoadingChoose this option to define global loading values including the percentage of traffic on different active technology type.
• Use the Loading From the Monte Carlo SimulationChoose this option to use the cell loading values calculated in a Monte Carlo simulation.
• Generate CPICH Pollution Index LayerEnable this check box to generate the CPICH pollution index layer.
• Traffic MapChoose from this list a traffic map to use when generating the analysis.
• Other System InterferenceDisplays the interference grid that will be used during the analysis.
125

In the Network Analysis Setup Wizard select the Parameters required that will be modeled in this Monte Carlo simulation
In the Network Analysis Setup Wizard select the Parameters required that will be modeled in this Monte Carlo simulation
• Analysis Area Use this panel to define the area over which the analysis is computed.The parameters on this tab are only available when defining analysis settings for a new WCDMA Analysis.
• Use the Combined Area of Selected PredictionsChoose this option to use the full area covered by the signal strength predictions of the sectors chosen for the simulation.
• Use Simulation BoundsChoose this option to define the coordinates (latitude and longitude) of the simulation area.
• Use an Analysis GridChoose this option to limit the simulation area to the area covered by a classified grid (.grc).
• Use An Area GridChoose this option to limit the analysis area to the area covered by an area grid. Choose a predefined area grid from the list.
• Analysis Resolution—type in this box the bin size for the outputs generated by the analysis.
126

In the Network Analysis Setup Wizard selectIn the Network Analysis Setup Wizard select
Check Which Layers you would like to generate for this analysis
For more information, see “Generating WCDMA Analyses” in the WCDMA User Guide. For a description of all analysis layers available, see “WCDMA Analysis Layers” in the online Help.
Click Next Use the Final Step page to save analysis settings and generate outputs.
• Save SettingsChoose this option to save the settings you have define for network analysis generation. You can generate the Network Analysis results at a later time by right-clicking on the Analysis in the Network Analysis category of the Project Explorer and choosing Generate.
• Save Settings and Generate OutputChoose this option to save the settings you have define for Network Analysis generation and generate outputs.
127

To view network analysis resultsTo view network analysis results
1. In the Project Explorer, in the Network Analyses category, right-click an analysis layer and choose View.
For more information, see “Generating WCDMA2000Analyses” in the WCDMA User Guide. For a description of all analysis layers available, see “Common WCDMA2000 Analysis Layers” and “Carrier-Specific WCDMA2000 Analysis Layers” in the online Help.
128
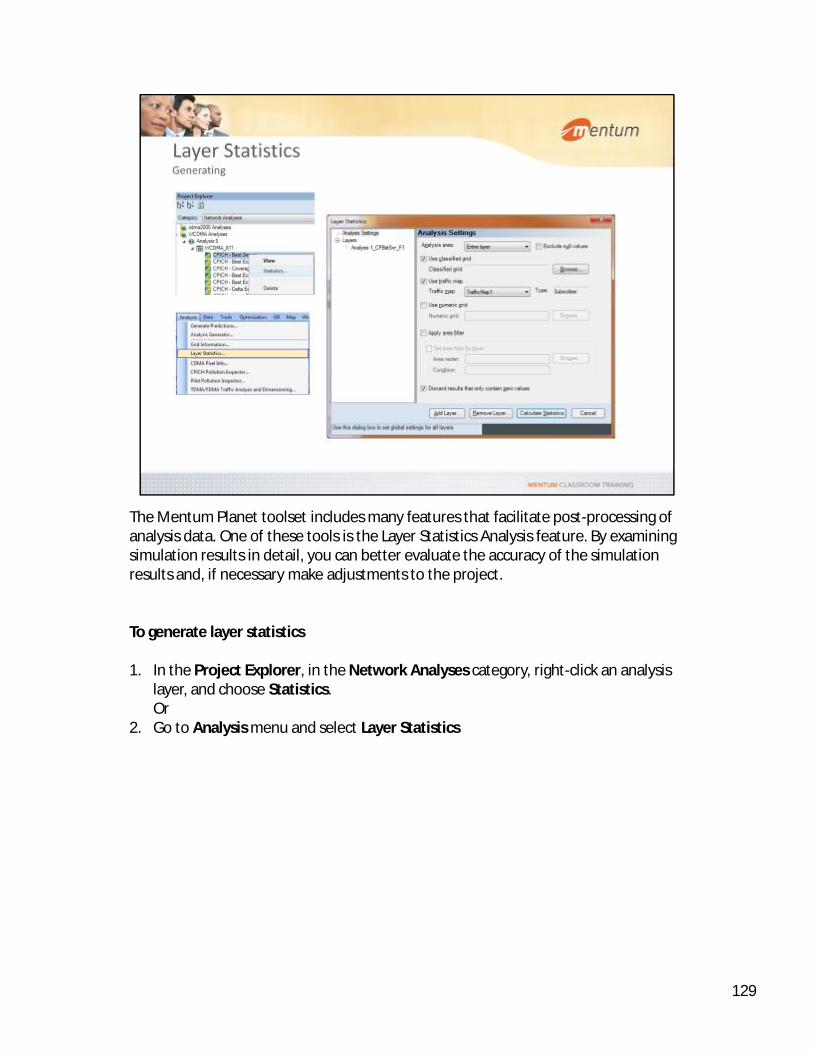
The Mentum Planet toolset includes many features that facilitate post-processing of analysis data. One of these tools is the Layer Statistics Analysis feature. By examining The Mentum Planet toolset includes many features that facilitate post-processing of analysis data. One of these tools is the Layer Statistics Analysis feature. By examining simulation results in detail, you can better evaluate the accuracy of the simulation results and, if necessary make adjustments to the project.
To generate layer statistics
1. In the Project Explorer, in the Network Analyses category, right-click an analysis layer, and choose Statistics. Or
2. Go to Analysis menu and select Layer Statistics
129

130

The Mentum Planet WCDMA Pixel Information Tool enables Tabular analysis of a The Mentum Planet WCDMA Pixel Information Tool enables Tabular analysis of a single pixel selected for the map window for any existing analysis
131

The Mentum Planet Pilot Pollution Inspector Tool enables Pilot Pollution analysis and help visualize the The Mentum Planet Pilot Pollution Inspector Tool enables Pilot Pollution analysis and help visualize the results within the map window .
CPICH pollution occurs when there is an excessive number of pilot signals with high power levels. CPICH pollution can create high levels of interference, resulting in dropped calls, poor voice quality, and poor data throughput.
The CPICH Pollution Inspector enables you to identify polluting sectors at specific locations, modify the appropriate sector settings, and then view the effects of your changes. The level of CPICH pollution is analyzed by comparing the powers of the pilot channels with the power of the best serving pilot channel, taking into account the active set (the set of pilots currently participating in the call) and the CPICH pollution margin.
Before you use the CPICH Pollution Inspector, you need to identify the areas that may be affected by CPICH pollution. For example, you can generate a Monte Carlo simulation and examine the CPICH-Delta Ec/Io layer from a Network analysis. You can also use drive test data or network data to identify potential problem areas. When you click a location in a Map window, the CPICH Pollution Inspector analyzes the location for CPICH pollution based on specific carrier, downlink loading, and subscriber settings. You can use settings from a network analysis or define these settings in the CPICH Pollution Inspector dialog box.For a specified location, the CPICH Pollution Inspector displays the following information in a graph window:• best serving sector • soft handover sectors • polluting sectors (if any)
Horizontal lines in the graph window indicate the threshold levels for the best serving, handover, and polluting sectors. You can define the number of polluting sectors that are displayed in the graph window, as well as the colors and pilot value (Ec/Io or Ec) used for the display. Additional location and sector information is displayed in the Analysis Info section
132

How a signal travels over the terrain and is attenuated by obstructions within the Fresnel zone can have important ramifications on the overall performance of your How a signal travels over the terrain and is attenuated by obstructions within the Fresnel zone can have important ramifications on the overall performance of your network. You can visualize the path the signal is taking using the Point-to-Point dialog box. You can customize the look and feel of the graph window displayed in the Point-to-Point Profile dialog box and display a legend if required.
Mentum Planet also supports 3D building models and/or clutter height.
133

The Automated Analysis Generation Tool allows a user to setup several Monte Carlo Simulations, and/or Network Analysis and then run them consecutively, allowing for The Automated Analysis Generation Tool allows a user to setup several Monte Carlo Simulations, and/or Network Analysis and then run them consecutively, allowing for instance the user to queue up several analysis then start them before leaving for the evening so that the analysis run over night.
134

To create an interference matrixTo create an interference matrix
1. In the Project Explorer, in the RF Tools category, right-click Interference Matrices, and choose New.
An interference matrix quantifies how a sector affects every other sector within its prediction distance, in terms of area and traffic. It can provide early visibility of problem areas and is a required input for some tools (e.g., neighbor lists).In Mentum Planet, you can only generate a histogram interference matrix, which is based on signal strength predictions (from the propagation model and/or drive test data). It compares C/I values on a bin by bin basis using the best server area that is independent of the current serving area. During the histogram generation process, a weighting value is assigned to non best serving areas.
Histogram interference matrices account for C/I only at the ground level and do not account for mobile use in buildings. Further, the histogram generation process approximates subscriber traffic locations, unless it is based on a traffic map.
For more information, see “Working with Interference Matrices” in the Mentum Planet User Guide.
135

View resultsView results
136

Mentum Planet allows for Neighbor relations handling and creation on one RAN or Multiple RANs Mentum Planet allows for Neighbor relations handling and creation on one RAN or Multiple RANs
Neighbors can be displayed in the map window or in tabular formats.
137

Each sector in a wireless network coordinates with its neighbors to maintain good quality coverage to mobile users. As a mobile user reaches the margins of coverage quality coverage to mobile users. As a mobile user reaches the margins of coverage within a sector, stronger signals become available from other sectors. Through handover, the network re-routes the user’s call to one of the neighbor sectors to maintain the connection.The Neighbor Plan Generator Wizard is used to create a new neighbor list.
Once you have generated a neighbor plan, you can view neighbor relationships graphically in the Map window.
The fundamental elements of the neighbor planning process are:Neighbor Listswhich are defined at the sector level and define which sectors are neighbors (in the Site Editor)
Black Listswhich are defined at the sector level and contain the list of neighboring sectors that are not available and will not be considered as part of the neighbor planning process.
Neighbor Planswhich are defined at the network level and encompass the neighbor lists for the sectors selected. A neighbor plan is a database of each sector's nearby sites and sectors along with the sites and sectors that are black-listed.
138

To create a neighbor planTo create a neighbor plan
1.In the Project Explorer, in the RF Tools category, right-click Neighbor Plan, and choose New.
For more information, see “Managing Neighbor Relationships” in the Mentum Planet User Guide.
139

140

141

142

The Mentum Planet toolset includes a Scrambling Code planning tool. You can choose to save the current plans and make new plans based on group planning or adhoc planning. Scrambling Code Planning are Distance or Interference Matrix based and optionally Neighbour Lists to improve Planning performance and quality
Mentum Planet supports:
•Adhoc Planning•Group Planning
To generate layer statistics
1. In the Project Explorer, in the RF Tools category, right-click an Scrambling Code Plans
143

Planets also has very advanced Raster engine analysis options using Grid Manager (Vertical Mapper form MapInfo.) there are many tasks that can be done with Grid Planets also has very advanced Raster engine analysis options using Grid Manager (Vertical Mapper form MapInfo.) there are many tasks that can be done with Grid Manager like:
Grid Calculator (allows you to perform mathematical functions on grids)Grid Queries (many SQL style queries can be run to extract specific information form a grid or multiple grids)Grid Maintenance Tools: Splicer, Trimmer, re-projection etc.
144

Sometimes, you need to modify the original grid in order for work to progress more efficiently. For example, if you have a grid that covers a geographically large city, but Sometimes, you need to modify the original grid in order for work to progress more efficiently. For example, if you have a grid that covers a geographically large city, but you need to generate a network analysis for only a small area of that city, you can trim the city grid, and create a new grid containing only the relevant area. This is useful when you want to focus an analysis on a particular area. Trimming a grid also reduces the size of a file and, therefore, the time it takes to open a project.
To trim a grid
1. Using the Polygon tool, draw a polygon around the area upon which you want to focus.
2. In the Map window, select the area.3. In the Grid Manager, choose ToolsÜ Trimmer.
For more information, see “Working with the Grid Manager, in the Grid Analysis User Guide.
145

Once you have generated network analysis grids, you can use the grid analysis tools available to obtain a more complete picture of what is happening in the network. For Once you have generated network analysis grids, you can use the grid analysis tools available to obtain a more complete picture of what is happening in the network. For example, you can use:• The Grid Info tool to query and return grid values from selected locations in the
grid file and view the results in a Grid Info dialog box• The Grid Manager Info feature
For more information, see “Working with the Grid Manager” in the Grid Analysis User Guide.
146
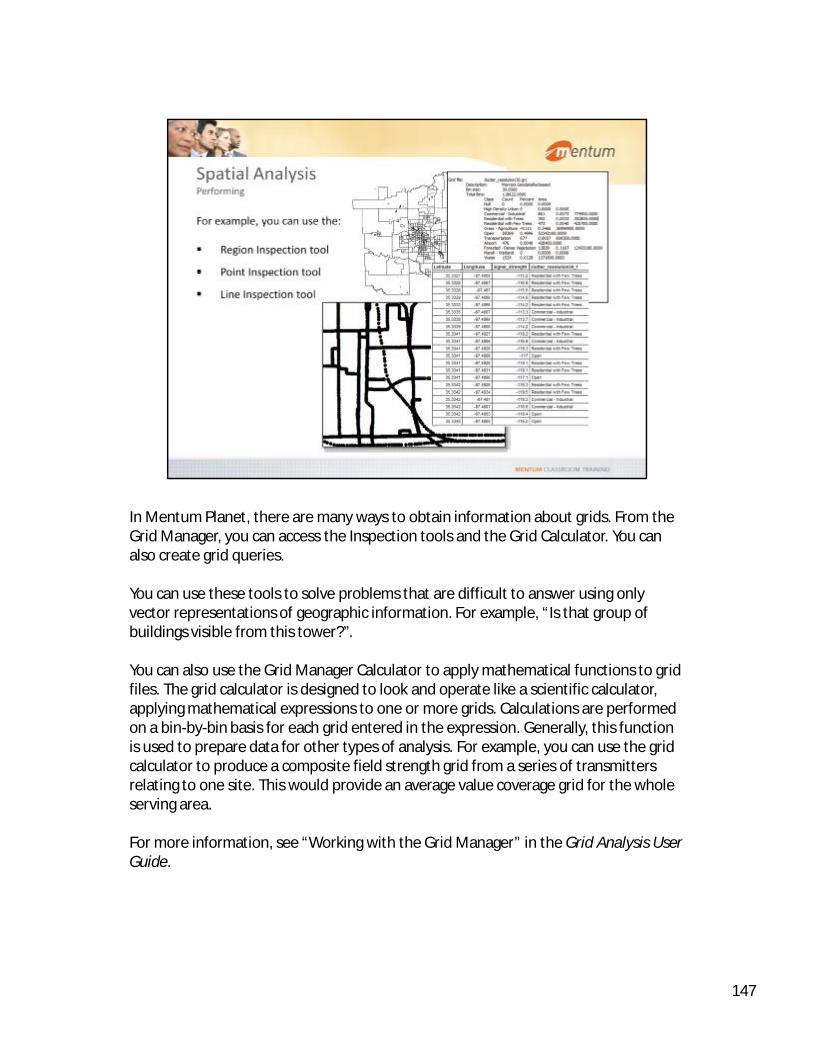
In Mentum Planet, there are many ways to obtain information about grids. From the Grid Manager, you can access the Inspection tools and the Grid Calculator. You can In Mentum Planet, there are many ways to obtain information about grids. From the Grid Manager, you can access the Inspection tools and the Grid Calculator. You can also create grid queries.
You can use these tools to solve problems that are difficult to answer using only vector representations of geographic information. For example, “Is that group of buildings visible from this tower?”.
You can also use the Grid Manager Calculator to apply mathematical functions to grid files. The grid calculator is designed to look and operate like a scientific calculator, applying mathematical expressions to one or more grids. Calculations are performed on a bin-by-bin basis for each grid entered in the expression. Generally, this function is used to prepare data for other types of analysis. For example, you can use the grid calculator to produce a composite field strength grid from a series of transmitters relating to one site. This would provide an average value coverage grid for the whole serving area.
For more information, see “Working with the Grid Manager” in the Grid Analysis User Guide.
147

Visualizing network coverage is key to understanding where problems exist in your network. Bringing this information together in a meaningful format is important Visualizing network coverage is key to understanding where problems exist in your network. Bringing this information together in a meaningful format is important because many groups within an organization are involved in network deployment and optimization. Mentum Planet enables you to produce many different types of maps, including coverage maps. Once you have generated output grids, you can organize the grids in a report, which you can print. To do this, you use the Layout features available in MapInfo Professional.
To create a print layout
1. Open each file that you want to include in the layout in the Map window.2. Choose Window Ü New Layout Window.3. In the New Window Layout dialog box, choose one of the frame options, and
click OK.
For more information, see “Generating Reports” in the Mentum Planet User Guide or “Opening a Map in a Layout Window” in the MapInfo Professional User Guide.
148


![28121-Ds Infovista Mentum Planet[1]](https://static.fdocuments.in/doc/165x107/55cf85d3550346484b91bbbd/28121-ds-infovista-mentum-planet1.jpg)