Mental and Behavioral Health Issue
32
MEDICAL SURVEILLANCE MONTHLY REPORT MSMR MSMR A publication of the Armed Forces Health Surveillance Division AUGUST 2021 Volume 28 Number 08 Mental and Behavioral Health Issue PAGE 2 Update: Mental health disorders and mental health problems, active component, U.S. Armed Forces, 2016–2020 PAGE 10 Brief report: Prevalence of screening positive for post-traumatic stress disorder among service members following combat-related injury Andrew J. MacGregor, PhD; Katheryne G. Perez, MPH; Cameron T. McCabe, PhD; Amber L. Dougherty, MPH; Sarah M. Jurick, PhD; Michael R. Galarneau, MS PAGE 14 Mental health disorders, behavioral health problems, fatigue and sleep outcomes in remotely piloted aircraft/manned aircraft pilots, and remotely piloted aircraft crew, U.S. Air Force, 1 October 2003–30 June 2019 John W. Kieffer, MD; Shauna Stahlman, PhD, MPH PAGE 22 Surveillance of mental and behavioral health care utilization and use of telehealth, active component, U.S. Armed Forces, 1 January 2019–30 September 2020 Leslie Clark, PhD, MS; Michael Fan, PhD; Shauna Stahlman, PhD, MPH
Transcript of Mental and Behavioral Health Issue
M E D I C A L S U R V E I L L A N C E M O N T H L Y R E P O R T
MSMRMSMR
A publication of the Armed Forces Health Surveillance Division
AUGUST 2021Volume 28Number 08
Mental and Behavioral Health Issue
P A G E 2 Update: Mental health disorders and mental health problems, active component, U.S. Armed Forces, 2016–2020
P A G E 1 0 Brief report: Prevalence of screening positive for post-traumatic stress disorder among service members following combat-related injuryAndrew J. MacGregor, PhD; Katheryne G. Perez, MPH; Cameron T. McCabe, PhD; Amber L. Dougherty, MPH; Sarah M. Jurick, PhD; Michael R. Galarneau, MS
P A G E 1 4 Mental health disorders, behavioral health problems, fatigue and sleep outcomes in remotely piloted aircraft/manned aircraft pilots, and remotely piloted aircraft crew, U.S. Air Force, 1 October 2003–30 June 2019John W. Kieffer, MD; Shauna Stahlman, PhD, MPH
P A G E 2 2 Surveillance of mental and behavioral health care utilization and use of telehealth, active component, U.S. Armed Forces, 1 January 2019–30 September 2020Leslie Clark, PhD, MS; Michael Fan, PhD; Shauna Stahlman, PhD, MPH

MSMR Vol. 28 No. 08 August 2021 Page 2
Mental health disorders have historically accounted for significant morbidity, health care utilization, disability, and attrition from military service. From 2016 through 2020, a total of 456,293 active component service members were diagnosed with at least 1 mental health disorder and 84,815 were diag-nosed with mental health problems related to family/support group prob-lems, maltreatment, lifestyle problems, substance abuse counseling, or social environment problems. Crude annual incidence rates of at least 1 mental health disorder decreased between 2016 and 2018, then increased in 2019 and decreased again in 2020. Most of the incident mental health disorder diag-noses were attributable to adjustment disorders, anxiety disorders, depres-sive disorders, “other” mental health disorders, alcohol-related disorders, and post-traumatic stress disorder. Similar to the last MSMR update, rates of incident mental health disorders were generally higher among female service members and Army members and declined with increasing age. Ongoing efforts to assist and treat service members should continue to promote help-seeking behavior to improve the psychological and emotional well-being of service members and reduce the burden of mental health disorders.
Update: Mental Health Disorders and Mental Health Problems, Active Component, U.S. Armed Forces, 2016–2020
W H A T A R E T H E N E W F I N D I N G S ?
Annual incidence rates of at least 1 mental health disorder decreased between 2016 and 2018, then increased in 2019 and decreased again in 2020. Patterns of incidence rates among demographic subgroups and the most commonly occurring types of mental health disorder diagnoses are similar to findings re-ported in previous MSMR reports.
W H A T I S T H E I M P A C T O N R E A D I N E S S A N D F O R C E H E A L T H P R O T E C T I O N ?
Although the incidence of mental health dis-orders remained relatively stable in the past 5 years, mental health disorders continue to af-fect a large number of service members and account for a significant burden of medical care. Ongoing efforts are needed to promote help-seeking behavior to improve the psycho-logical and emotional well-being of service members.
In 2020, mental health disorders accounted for the largest total num-ber of hospital bed days and the second
highest total number of medical encounters for members of the active component of the U.S. Armed Forces.1 Prior MSMR reports have documented the increasing incidence of post-traumatic stress disorder (PTSD), anxiety disorders, depressive disorders, adjustment disorders, and other mental health disorders from 2003 through 2011, followed by decreasing incidence through 2016 most notably for alcohol- and sub-stance-related disorders, personality disor-ders, and depressive disorders.2,3 Between 2007 and 2016, the highest incidence rates of mental health disorders diagnosed among active component service members were for adjustment disorders, depressive disorders, anxiety disorders, “other” men-tal health disorders, and alcohol-related disorders, respectively.3 In general, crude incidence rates of mental health disorders have been observed to be highest among service members in the Army, females, and in younger age groups.2,3
Psychosocial and behavioral health problems related to difficult life circum-stances (e.g., marital, family, other inter-personal relationships) are also important to consider for comprehensive surveillance of service members’ mental health; these are often documented using International Classification of Diseases, 9th Revision (ICD-9) V-codes and Z-codes in ICD-10. For example, 1 study found that ser-vice members who received mental health care (documented with V-coded diagno-ses) were at greater risk of attrition from military service than those treated for only physical health conditions but at less risk of attrition than those who received men-tal health disorder-specific diagnoses.4 In addition, many studies have focused on the impact of mental health disorders such as PTSD among military-serving parents and their associations with increased problems in the family environment.5 However, fam-ily problems can also have independent associations with adverse outcomes such as suicide or medical evacuation from over-seas deployments.6,7
This report summarizes the numbers, natures, and rates of incident mental health disorder diagnoses among active compo-nent U.S. service members over a 5-year surveillance period. It also summarizes the numbers, natures, and rates of incident “mental health problems” (documented with mental health-related V- or Z-codes in ICD-9 or ICD-10, respectively) among active component service members during the same period.
M E T H O D S
The surveillance period was 1 January 2016 through 31 December 2020. The sur-veillance population included all individ-uals who served in the active component of the Army, Navy, Air Force, or Marine Corps at any time during the surveillance period. All data used to determine inci-dent mental health disorder-specific diag-noses and mental health problems were derived from records routinely maintained

August 2021 Vol. 28 No. 08 MSMR Page 3
in the Defense Medical Surveillance Sys-tem (DMSS). These records document both ambulatory encounters and hospi-talizations of active component members of the U.S. Armed Forces in fixed military and civilian (if reimbursed through the Military Health System[MHS]) treatment facilities. Diagnoses were also derived from records of medical encounters of deployed service members that were documented in the Theater Medical Data Store (TMDS) in DMSS.
For surveillance purposes, “mental health disorders” were ascertained from records of medical encounters that included mental health disorder-specific diagnoses (ICD-9: 290–319; ICD-10: F01–F99 [Table 1]) in the first or second diagnostic posi-tion. It should be noted that although the MHS transitioned to ICD-10 on 1 Octo-ber 2015, ICD-9 codes were included in
this analysis because some TMDS encoun-ters still contain ICD-9 diagnoses and ICD-9 diagnoses were needed to identify and exclude prevalent cases documented in records from before 1 October 2015. Diagnoses of pervasive developmental dis-order (ICD-9: 299.*; ICD-10: F84.*), spe-cific delays in development (ICD-9: 315.*; ICD-10: F80.*–F82.*, F88–F89), mental retardation (ICD-9: 317.*–319.*; ICD-10: F70–F79), tobacco use disorder/nicotine dependence (ICD-9: 305.1; ICD-10: F17.*), and post-concussion syndrome (ICD-9: 310.2; ICD-10: F07.81) were excluded from the analysis. Diagnoses of “mental health problems” were ascertained from records of health care encounters that included V- or Z-coded diagnoses indicative of psy-chosocial or behavioral health issues in the first or second diagnostic position (Table 1). “Family/support group problems” included
family disruption, health problems within the family, bereavement, and other family problems; “maltreatment” included coun-seling and other encounters for victims or perpetrators of abuse; “lifestyle prob-lems” included lack of exercise, high-risk sexual behavior, sleep deprivation, and other psychological or physical stress; “sub-stance abuse counseling” included coun-seling encounters for substance use and abuse; and “social environment problems” included social maladjustment, social exclusion and rejection, target of (per-ceived) adverse discrimination and abuse, problems of adjustment to life cycle transi-tions, and other problems related to social environment.
Each incident diagnosis of a mental health disorder or a mental health prob-lem was defined by a hospitalization with an indicator diagnosis in the first or second
T A B L E 1 . Mental health categories and ICD-9/ICD-10 diagnostic codes
Diagnostic category ICD–9 codes ICD–10 codes Mental health disordersAdjustment disorders 309.* (excluding 309.81) F43.2*, F43.8, F43.9, F93.0, F94.8, F94.9Alcohol-related disorders 291.0, 291.81, 303.0*, 303.9*, 305.0* F10.1*, F10.2*
Substance-related disorders 304.*, 305.2*–305.9* F11.2*, F12.2*, F13.2*, F14.2*, F15.2*, F16.2*, F18.2*, F19.2*, F11.1*, F12.1* F13.1*, F14.1*, F15.1*, F16.1*, F18.1*, F19.1*
Anxiety disorders 300.0*, 300.2*, 300.3 F40.*, F41.*, F42.*Post-traumatic stress disorder 309.81 F43.1*Depressive disorders 296.2*, 296.3* (excluding 296.34), 296.9*, 300.4,
311F32.*, F33.*, F34, F34.1, F34.8, F34.9, F39, F348.1, F34.89
Bipolar disorder 296.0*, 296.1*, 296.4*, 296.5*, 296.6*, 296.7, 296.8* (except 296.82), 301.13
F30.*, F31.*, F34.0
Personality disorders 301.* (excluding 301.13, 301.50, 301.52) F21, F60.*
Schizophrenia 295.* F20*, F25*
Psychotic disorders (other psychoses) 293.81, 293.82, 297.0*, 298.0* F06.0, F06.2, F22–F24, F28, F29
Other mental health disorder Any other code between 290–319 (excluding 299.*, 305.1, 310.2, 315.*, 317.*–319.*)
Any other code between F01–F99 (excluding F07.81, F70–F79, F17.*, F80.*–F82.*, F84.*, F88–F89)
V- or Z-coded behavioral health disorderFamily/support group problems V61.0*, V61.3, V61.4*, V61.8, V61.9, V62.82 Z63.*Maltreatment related V61.11, V61.12, V61.21, V61.22, V62.83 Z69.*Lifestyle problems V49.85, V62.89, V69.*, V71.01, V71.02 Z72.*, Z73.*Substance abuse counseling V65.42 Z71.41, Z71.51, Z71.6Social environment problems V60.3, V62.4 Z60.*
aAn asterisk (*) indicates that any subsequent digit/character is included.ICD-9/ICD-10, International Classification of Diseases, 9th/10th revision.

MSMR Vol. 28 No. 08 August 2021 Page 4
diagnostic position; 2 outpatient or TMDS visits within 180 days documented with indicator diagnoses (from the same men-tal health disorder or mental health prob-lem–specific category) in the first or second diagnostic positions; or a single outpa-tient visit in a psychiatric or mental health care specialty setting (defined by Medical Expense and Performance Reporting Sys-tem [MEPRS] code beginning with “BF”) with an indicator diagnosis in the first or second diagnostic position. The case defi-nition for schizophrenia required either a single hospitalization with a diagnosis of schizophrenia in the first or second diag-nostic position or 4 outpatient or TMDS encounters with a diagnosis of schizophre-nia in the first or second diagnostic posi-tion. Schizophrenia cases who remained in the military for more than 2 years after becoming incident cases were excluded as these cases were assumed to have been misdiagnosed.
Service members who were diagnosed with 1 or more mental health disorders prior to the surveillance period (i.e., prev-alent cases) were not considered at risk of incident diagnoses of the same conditions
during the period. Service members who were diagnosed with more than 1 men-tal health disorder during the surveillance period were considered incident cases in each category in which they fulfilled the case-defining criteria. Service members could be incident cases only once in each mental health disorder-specific category. Only service members with no incident mental health disorder-specific diagnoses (ICD-9: 290–319; ICD-10: F01–F99) diag-nosed during or prior to the surveillance period were eligible for inclusion as cases of incident mental health problems (selected V- or Z-codes).
R E S U L T S
During the 5-year surveillance period, 456,293 active component service mem-bers were diagnosed with at least 1 men-tal health disorder; of these individuals, 199,945 (43.8%) were diagnosed with men-tal health disorders in more than 1 diag-nostic category (Table 2a). Overall, there were 785,229 incident diagnoses of mental health disorders in all diagnostic categories.
Annual numbers and rates of incident diag-noses of at least 1 mental health disorder decreased from 856.1 cases per 10,000 per-son-years (p-yrs) in 2016 to 818.0 cases per 100,000 p-yrs in 2018, peaked at 885.3 cases per 100,000 p-yrs in 2019, and then decreased to 839.2 cases per 100,000 p-yrs in 2020.
Over the entire period, 94.7% of all incident mental health disorder diagno-ses were attributable to adjustment disor-ders (n=242,068; 30.8%), anxiety disorders (n=131,153; 16.7%), depressive disorders (n=129,307; 16.5%), “other” mental health disorders (n=111,703; 14.2%); alcohol-related disorders (69,095; 8.8%), and PTSD (60,173; 7.7%) (Table 2a). In comparison, relatively few incident diagnoses were attributable to substance-related disorders (n=15,733; 2.0%), personality disorders (14,307; 1.8%), bipolar disorder (6,674; 0.8%), psychotic disorders (3,619; 0.5%), and schizophrenia (1,397; 0.2%).
It was common for individuals who were diagnosed with alcohol- or substance-related disorders to also be diagnosed with other mental health disorders dur-ing the period. Among individuals who
T A B L E 2 a . Incident diagnoses and rates of mental health disorders, active component, U.S. Armed Forces, 2016–2020Total (2016–2020) 2016 2017 2018 2019 2020
Categorya No. Rateb No. Rateb No. Rateb No. Rateb No. Rateb No. Rateb
Adjustment disorders 242,068 426.8 46,934 415.3 47,221 421.1 46,829 414.1 51,857 454.1 49,227 429.1Alcohol-related disorders 69,095 111.5 13,355 108.5 14,385 117.7 13,787 111.8 14,570 116.6 12,998 103.0Substance-related disorders 15,733 24.5 3,115 24.5 3,517 27.8 3,058 24.0 3,130 24.2 2,913 22.3Anxiety disorders 131,153 218.3 27,280 228.2 25,687 216.6 24,193 202.2 26,916 222.3 27,077 222.0Post-traumatic stress disorder 60,173 95.8 12,901 103.6 11,639 94.0 10,776 86.2 12,259 96.8 12,598 98.5Depressive disorders 129,307 214.2 25,423 212.3 25,623 215.3 24,485 203.6 27,799 228.3 25,977 211.6Bipolar disorder 6,674 10.4 1,324 10.4 1,347 10.6 1,264 9.9 1,313 10.1 1,426 10.9Personality disorders 14,307 22.3 3,070 24.1 2,978 23.6 2,559 20.1 2,970 23.0 2,730 20.9Schizophrenia 1,397 2.2 269 2.1 265 2.1 289 2.3 296 2.3 278 2.1Psychotic disorders 3,619 5.6 737 5.8 698 5.5 721 5.6 741 5.7 722 5.5Other mental health disorders 111,703 185.9 23,591 197.6 24,043 203.0 21,893 183.2 22,292 184.1 19,884 162.5
No. of individuals>1 type of mental health disorder diagnosis 199,945 310.4 33,890 264.8 33,685 265.2 31,796 248.3 34,821 268.2 32,729 249.5
Any mental health disorder diagnosisc 456,293 708.4 109,552 856.1 109,446 861.6 104,768 818.0 114,921 885.3 110,094 839.2
aAn individual may be a case within a category only once per lifetime.bRate per 10,000 person-years.cAt least 1 recorded mental health disorder diagnosis.No., number.

August 2021 Vol. 28 No. 08 MSMR Page 5
were diagnosed with alcohol-related dis-orders, 37.6% were also diagnosed with incident adjustment disorder and 27.6% with depressive disorder (data not shown). Among those diagnosed with substance-related disorders, 50.2% were diagnosed with alcohol-related disorders and 38.9% were diagnosed with adjustment disor-ders (data not shown). Adjustment disor-ders, depressive disorders, and personality disorders were also common co-occur-ring conditions. Among those diagnosed with personality disorders, 59.4% were also diagnosed with incident adjustment disorders and 51.9% were also diagnosed with incident depressive disorders (data not shown).
Crude annual rates of incident diag-noses of adjustment disorders, anxiety dis-orders, and depressive disorders followed a general pattern of decreasing or remaining stable from 2016 through 2018, increasing in 2019, and then decreasing or remaining stable in 2020 (Table 2a, Figure 1). Annual incidence of PTSD decreased during 2016 through 2018 but then increased through 2020. Rates of “other” mental health dis-orders decreased from 2017 through 2020. In contrast, crude annual incidence rates of diagnoses of alcohol-related disorders, sub-stance-related disorders, personality disor-ders, bipolar disorders, psychotic disorders, and schizophrenia remained relatively sta-ble through the surveillance period (Table 2a, Figure 1).
In general, overall rates of most inci-dent mental health disorder diagnoses were higher among female than male service members. Exceptions were for schizophre-nia, for which rates were similar between the sexes and alcohol- and substance-related disorders for which rates were higher among male service members (Fig-ure 2). Rates of most mental health disorder diagnoses declined with increasing age (Fig-ure 3). In particular, crude overall incidence rates of adjustment and psychotic disorders were higher among the youngest (less than 20 years old) service members, compared to any older age group. Rates of alcohol- and substance-related disorders, depressive disorders, bipolar disorders, personality disorders, and schizophrenia were highest among service members aged 20–24 years (Figure 3). In contrast, the rates of PTSD,
anxiety disorders, and “other” mental health disorders were highest among ser-vice members in their 40s and 50s.
Overall incidence rates of all mental health disorders were higher in the Army than in any of the other services except for personality disorders, which were higher in the Navy (Figure 4). Crude incidence rates
for alcohol-related disorders, personality disorders, schizophrenia, and other psy-chotic disorders were higher among those in motor transport occupations than any other category of occupation (Figure 5). In contrast, crude overall incidence rates of adjustment disorders, anxiety disor-ders, PTSD, depressive disorders, bipolar
F I G U R E 1 . Annual incidence rates of mental health disorder diagnoses, active component, U.S. Armed Forces 2016–2020
PTSD, post-traumatic stress disorder; p-yrs, person-years.
0
100
200
300
400
500
600
2016 2017 2018 2019 2020
Inci
dent
dia
gnos
es p
er 1
0,00
0 p-
yrs
Adjustment disorders Anxiety disordersDepressive disorders Alcohol-related disordersPTSD Substance-related disordersBipolar disorders Personality disordersSchizophrenia Psychotic disordersOther mental health disorders
F I G U R E 2 . Incidence rates of mental health disorder diagnoses, by category and sex, active component, U.S. Armed Forces, 2016–2020
P-yrs, person-years.
0
100
200
300
400
500
600
700
800
Adju
stm
ent d
isor
ders
Alco
hol-r
elat
ed d
isor
ders
Subs
tanc
e-re
late
ddi
sord
ers
Anxi
ety
diso
ders
Post
-trau
mat
ic s
tress
diso
rder
Dep
ress
ive
diso
rder
s
Bipo
lar d
isor
der
Pers
onal
ity d
isor
ders
Schi
zoph
reni
a
Oth
er p
sych
oses
Oth
er m
enta
l hea
lthdi
sord
ers
Inci
dent
dia
gnos
es p
er 1
0,00
0 p-
yrs Male
Female

MSMR Vol. 28 No. 08 August 2021 Page 6
disorders, and “other” mental health dis-orders were highest among those in health care occupations. There were some dif-ferences in rates of mental health disor-der diagnoses by time in service. Rates of adjustment disorders, psychotic disorders, and bipolar disorders were highest dur-ing the first 6 months of military service, whereas rates of PTSD and anxiety dis-orders were highest among those with at least 36 months of service (Figure 6). How-ever, rates of all other mental health dis-orders were highest between 12 and 36 months of service. Finally, rates of incident
anxiety disorders, PTSD, and “other” men-tal health disorders were higher among ser-vice members who had ever deployed to a U.S. Central Command (CENTCOM) area of responsibility (AOR) (data not shown).
During the surveillance period, there were 91,432 records documenting mental health problems related to family/support group problems, maltreatment, lifestyle problems, or substance abuse counsel-ing (documented with ICD-9 and ICD-10 V- and Z-codes, respectively) among 84,815 active component members who were never diagnosed with a mental health
disorder (ICD-9: 290–319; ICD-10: F01–F99) (Table 2b). During the period, one-third (33.7%) of all incident reports of these mental health problems were related to life-style problems; almost one-third (29.6%) were related to family/support group prob-lems; slightly more than one-fifth (21.7%) were related to social environment prob-lems; 11.3% were related to substance abuse counseling; and 3.7% were related to mal-treatment (i.e., counseling and encoun-ters for victims or perpetrators of abuse) (Table 2b).
Crude annual rates of any V- or Z-coded mental health problems were relatively stable from 2016 through 2018, increased in 2019, and then decreased slightly in 2020 (Figure 7). The increase between 2018 and 2019 was primar-ily driven by lifestyle problems and fam-ily/support group problems. Rates of substance abuse counseling decreased steadily from 2017 through 2020, whereas maltreatment-related problems decreased from 2016 to 2018 and then remained rela-tively stable in 2019 and 2020. Overall inci-dence of family/support group problems and maltreatment-related problems were higher among Army members, female ser-vice members, non-Hispanic Black service members, those aged 20–24 years, enlisted members, those in motor transport occu-pations, and those who were in service for 12–36 months (data not shown). Overall incidence of lifestyle problems had similar demographic patterns with the exception that incidence was higher among males compared to females (data not shown). Inci-dence of substance abuse counseling was highest among Air Force members, male service members, those aged 20–24 years, non-Hispanic Black service members, those in repair/engineering occupations, and those who were in service for 6–12 months (data not shown). Finally, overall incidence of social environment problems was highest among Army members, female service members, non-Hispanic Black ser-vice members, those less than 20 years of age, those in motor transport occupations, and those who were in service for less than 6 months (data not shown).
F I G U R E 3 . Incidence rates of mental health disorder diagnoses, by category and age group, active component, U.S. Armed Forces, 2016–2020
F I G U R E 4 . Incidence rates of mental health disorder diagnoses, by category and service, active component, U.S. Armed Forces, 2016–2020
P-yrs, person-years.
P-yrs, person-years.
0
100
200
300
400
500
600
700
Adju
stm
ent d
isor
ders
Alco
hol-r
elat
ed d
isor
ders
Subs
tanc
e-re
late
d di
sord
ers
Anxi
ety
diso
rder
s
Post
-trau
mat
ic s
tress
diso
rder
Dep
ress
ive
diso
rder
s
Bipo
lar d
isor
der
Pers
onal
ity d
isor
ders
Schi
zoph
reni
a
Oth
er p
sych
oses
Oth
er m
enta
l hea
lthdi
sord
ers
Inci
dent
dia
gnos
es p
er 1
0,00
0 p-
yrs <20
20–24 25–29 30–34 35–39 40–49 50+
0
100
200
300
400
500
600
Adju
stm
ent d
isor
ders
Alco
hol-r
elat
ed d
isor
ders
Subs
tanc
e-re
late
ddi
sord
ers
Anxi
ety
diso
rder
s
Post
-trau
mat
ic s
tress
diso
rder
Dep
ress
ive
diso
rder
s
Bipo
lar d
isor
der
Pers
onal
ity d
isor
ders
Schi
zoph
reni
a
Oth
er p
sych
oses
Oth
er m
enta
l hea
lthdi
sord
ers
Inci
dent
dia
gnos
es p
er 1
0,00
0 p-
yrs Army
NavyAir ForceMarine Corps

August 2021 Vol. 28 No. 08 MSMR Page 7
F I G U R E 5 . Incidence rates of mental health disorder diagnoses, by category and military occupation, active component, U.S. Armed Forces, 2016–2020
F I G U R E 6 . Incidence rates of mental health disorder diagnoses, by time in service, active component, U.S. Armed Forces, 2016–2020
aInfantry/artillery/combat engineering. P-yrs, person-years.
P-yrs, person-years.
0
100
200
300
400
500
600
700Ad
just
men
tdi
sord
ers
Alco
hol-r
elat
eddi
sord
ers
Subs
tanc
e-re
late
ddi
sord
ers
Anxi
ety
diso
rder
s
Post
-trau
mat
icst
ress
dis
orde
r
Dep
ress
ive
diso
rder
s
Bipo
lar d
isor
der
Pers
onal
itydi
sord
ers
Schi
zoph
reni
a
Oth
er p
sych
oses
Oth
er m
enta
lhe
alth
dis
orde
rs
Inci
dent
dia
gnos
es p
er 1
0,00
0 p-
yrs
Combat-relatedªMotor transportPilot/aircrewRepair/engineeringCommunications/intelligenceHealth careOther
0
100
200
300
400
500
600
700
Adju
stm
ent
diso
rder
s
Alco
hol-r
elat
eddi
sord
ers
Subs
tanc
e-re
late
ddi
sord
ers
Anxi
ety
diso
rder
s
Post
-trau
mat
icst
ress
dis
orde
r
Dep
ress
ive
diso
rder
s
Bipo
lar d
isor
der
Pers
onal
itydi
sord
ers
Schi
zoph
reni
a
Oth
er p
sych
oses
Oth
er m
enta
l hea
lthdi
sord
ers
Inci
dent
dia
gnos
es p
er 1
0,00
0 p-
yrs
<6 months
≥6–<12 months
≥12–<36 months
≥36 months
E D I T O R I A L C O M M E N T
This report provides an update on incident diagnoses for mental health dis-orders among active component service members of the U.S. Armed Forces. Simi-lar to previous MSMR reports, rates of most incident mental health disorders were gen-erally higher among female than male ser-vice members and among Army members, but rates declined with increasing age.2,3 In addition, adjustment disorders were the
most commonly diagnosed incident men-tal health disorder, and anxiety disorders, depressive disorders, alcohol-related dis-orders, and “other” mental health disor-ders were also relatively common.2,3 The data presented here demonstrate a con-tinuation of the trends in crude incidence of mental health disorders from 2007 to 2016, in which trends for many men-tal health disorder categories remained relatively stable during the 2016 to 2020 surveillance period. Of note, the drop in crude incidence of any mental health
disorder diagnoses from 2019 through 2020 was a reversal of an increasing trend observed between 2018 and 2019.
The relative stability in rates of inci-dent mental health disorder diagnoses observed during the surveillance period is likely related to reduced combat operations as well as prior and ongoing Department of Defense (DoD) anti-stigma campaigns. There was a significant reduction of U.S. Armed Forces in Iraq from 2011 through 2016, with an official end to combat opera-tions in Afghanistan at the end of 2014. In this report and in several previous studies, mental health disorders such as anxiety and PTSD have been found to be significantly higher among service members with histo-ries of deployment to a CENTCOM AOR, and the relative stability in mental health disorder diagnoses could be related to low and stable levels of deployment and combat exposure during this period.8,9 DoD anti-stigma campaigns such as the “Real War-riors” campaign launched in 2009, seek to encourage individuals to seek treatment and link service members and their families to care and other confidential resources.10
The decrease in incidence of mental health disorder diagnoses between 2019 and 2020 corresponds with the beginning of the coronavirus disease (COVID-19) pan-demic, which was declared an international pandemic on 11 March 2020. This decreas-ing trend is somewhat unexpected, given that multiple studies reported negative men-tal health impacts of the pandemic, includ-ing the Centers for Disease Control and Prevention (CDC) reports of increases in adverse mental health conditions associated with COVID-19.11,12 However, the decrease may instead be related to service members choosing to defer care due to the pandemic, which was a trend observed in the U.S. pop-ulation.13 This is of particular concern given that the number of active component sui-cide deaths have been increasing steadily over the past 5 years, and increased 10% between 2019 and 2020, from 350 to 385 deaths according to quarterly reports from the Defense Suicide Prevention Office.14 Therefore, the trends observed in the pres-ent study warrant further investigation to determine whether they are related to a true decrease in mental health disorders or changes in health care seeking behavior,

MSMR Vol. 28 No. 08 August 2021 Page 8
T A B L E 2 b. Incident diagnoses and rates of V- or Z-coded mental health visits, among those without a mental health disorder diagnoses, active component, U.S. Armed Forces, 2016–2020
Total (2016–2020) 2016 2017 2018 2019 2020
Categorya No. Rateb No. Rateb No. Rateb No. Rateb No. Rateb No. Rateb
Family/support group problems 27,054 43.4 4,554 37.0 4,612 37.6 5,040 40.6 6,241 49.6 6,607 51.9Maltreatment-related 3,356 5.2 849 6.7 658 5.2 590 4.6 612 4.7 647 5.0Lifestyle problems 30,790 49.6 5,144 42.0 5,731 46.9 5,707 46.2 7,644 60.9 6,564 51.8Substance abuse counseling 10,370 16.6 2,267 18.3 2,322 18.8 2,231 17.9 2,068 16.3 1,482 11.6Social environment problems 19,862 31.1 3,922 30.8 3,789 30.0 3,821 30.0 4,216 32.7 4,114 31.6
No. of individuals>1 type of V- or Z-coded diagnosis 81,339 126.3 1,160 9.1 1,072 8.4 1,205 9.4 1,492 11.5 1,358 10.4Any V- or Z-coded diagnosisc 84,815 131.7 15,505 121.2 15,983 125.8 16,124 125.9 19,209 148.0 17,994 137.2
aAn individual may be a case within a category only once per lifetime.bRate per 10,000 person-years.cAt least 1 reported mental health problem (V- or Z-coded diagnosis).No., number.
F I G U R E 7 . Annual incidence rates of V- or Z-coded mental health diagnoses, active compo-nent, U.S. Armed Forces, 2016–2020
P-yrs, person-years.
0
20
40
60
80
100
120
140
160
180
200
2016 2017 2018 2019 2020
Inci
dent
dia
gnos
es p
er 1
0,00
0 p-
yrs
Any V-/Z-coded diagnosisLifestyle problemsFamily/support groupSocial environment problemsSubstance abuse counselingMaltreatment-related
and whether service members are receiving needed mental health care services particu-larly during the pandemic.
Incidence of any V- or Z-coded mental health problem followed the same general trend as incident mental health disorder diagnosis rates, remaining relatively sta-ble but with an increase in 2019 followed by a decline in 2020. The reasons for this
trend may be related to the factors previ-ously described regarding trends in men-tal health disorder diagnoses. These mental health problems are important to monitor as they may serve as early indicators for mental health disorders and may also act as indicators for social determinants of men-tal health. In particular, the World Health Organization (WHO) has described social
determinants of mental health as a frame-work that requires understanding risk and protective factors of mental health at differ-ent levels including the individual, family, community, and society.15
There are significant limitations to this report that should be considered when interpreting the results. For example, inci-dent cases of mental health disorders and mental health problems were ascertained from ICD-9-/ICD-10-coded diagnoses that were reported on standardized administra-tive records of outpatient clinic visits and hospitalizations. Such records are not com-pletely reliable indicators of the numbers and types of mental health disorders and mental health problems that actually affect military members. For example, the num-bers reported here are underestimates to the extent that affected service members did not seek care or received care that is not routinely documented in records that were used for this analysis (e.g., private practitio-ner, counseling or advocacy support center, chaplains); that mental health disorders and mental health problems were not diagnosed or reported on standardized records of care; and/or that some indicator diagnoses were miscoded or incorrectly transcribed on the centrally transmitted records. On the other hand, some conditions may have been erro-neously diagnosed or miscoded as mental health disorders or mental health problems (e.g., screening visits). The accuracy of esti-mates of the numbers, natures, and rates of

August 2021 Vol. 28 No. 08 MSMR Page 9
illnesses and injuries of surveillance interest depend to a great extent on specifications of the surveillance case definitions that are used to identify cases. If case definitions with different specifications were used to identify cases of nominally the same conditions, the resultant estimates of numbers, rates, and trends might vary from those reported here. In addition, the analyses reported here sum-marize the experiences of individuals while they were serving in an active component of the U.S. military; as such, the results do not include mental health disorders and men-tal health problems that affected members of reserve components or veterans of recent military service who received care outside of the MHS.
Although the incidence of mental health disorders has remained relatively stable in the past 5 years, mental health dis-orders continue to affect a large number of service members and account for a signifi-cant burden of medical care. Ongoing efforts to assist and treat service members should continue to promote help-seeking behavior to improve the psychological and emotional well-being of service members in the U.S. Armed Forces.
R E F E R E N C E S
1. Armed Forces Health Surveillance Division. Absolute and relative morbidity burdens attributable to various illnesses and injuries, active component, U.S. Armed Forces, 2020. MSMR. 2021;28(6):2–9. 2. Armed Forces Health Surveillance Center. Mental disorders and mental health problems, ac-tive component, U.S. Armed Forces, 2000–2011. MSMR. 2012;19(6):11–17. 3. Stahlman, S and Oetting AA. Mental health disorders and mental health problems, active com-ponent, U.S. Armed Forces, 2007–2016. MSMR. 2018;25(3):2–11. 4. Garvey Wilson A, Messer S, Hoge C. U.S. mili-tary mental health care utilization and attrition prior to the wars in Iraq and Afghanistan. Soc Psychiatry Psychiatr Epidemiol. 2009;44(6):473–481. 5. Kritikos TK, Comer JS, He M, et al. Combat ex-perience and posttraumatic stress symptoms among military-serving parents: a meta-analytic examina-tion of associated offspring and family outcomes. J Abnorm Child Psychol. 2019;47(1):131–148.6. Skopp N, Trofimovich L, Grimes J, et al. Re-lations between suicide and traumatic brain injury, psychiatric diagnoses, and relationship problems, active component, U.S. Armed Forces, 2001–2009. MSMR. 2012; 19(2):7–11.7. Rupp BL, Ying S, and Stahlman S. Psychiatric medical evacuations in individuals with diagnosed pre-deployment family problems, active compo-nent, U.S. Armed Forces, 2002–2014. MSMR. 2018; 25(10):9–15. 8. Vasterling JJ, Proctor SP, Friedman MJ, et al. PTSD symptom increases in Iraq-deployed sol-
diers: Comparison with nondeployed soldiers and associations with baseline symptoms, deployment experiences, and postdeployment stress. J Traum Stress. 2010;23(1):41–51.9. Hoge CW, Auchterlonie JL, Milliken CS. Men-tal health problems, use of mental health services, and attrition from military service after returning from deployment to Iraq or Afghanistan. JAMA. 2006;295(9):1023–1032.10. Real Warriors Campaign. Accessed 31 July 2021. https://www.health.mil/Military-Health-Top-ics/Centers-of-Excellence/Psychological-Health-Center-of-Excellence/Real-Warriors-Campaign 11. Xiong J, Lipsitz O, Nasri F, et al. Impact of CO-VID-19 pandemic on mental health in the general population: A systematic review. J Affect Disord. 2020;277:55–64.12. Czeisler MÉ, Lane RI, Petrosky E, et al. Men-tal health, substance use, and suicidal ideation during the COVID-19 Pandemic - United States, June 24-30, 2020. MMWR Morb Mortal Wkly Rep. 2020;69(32):1049–1057.13. Czeisler MÉ, Marynak K, Clarke KEN, et al. De-lay or avoidance of medical care because of COV-ID-19-related concerns - United States, June 2020. MMWR Morb Mortal Wkly Rep. 2020;69(36):1250–1257.14. Department of Defense (DoD) Quarterly Sui-cide Report (QSR) 1st Quarter, CY 2021. Accessed 31 July 2021. https://www.dspo.mil/QSR/15. World Health Organization and Calouste Gulbenkian Foundation. Social determinants of mental health. Geneva, World Health Organiza-tion, 2014.

MSMR Vol. 28 No. 08 August 2021 Page 10
The post-9/11 conflicts in Iraq and Afghanistan resulted in the most U.S. military casualties since
Vietnam.1 Asymmetric warfare domi-nated the battlefield, commonly in the form of improvised explosive devices and other blast weaponry, which placed infantry and combat support personnel at risk of injury.2 As casualty numbers increased during these conflicts, so too did the survivability rate relative to pre-vious wars, most notably due to advances in personal protective equipment and field medical care.3 This led to a shift in resources towards long-term rehabili-tation of wounded service members to ameliorate physical and mental health sequelae.2,4
Post-traumatic stress disorder (PTSD) is frequently reported among military personnel, particularly those with combat-related injury.5,6 Koren et al.5 hypothesized multiple etiologies for the relationship between combat-related injury and PTSD, including increased levels of perceived threat to life and peritraumatic dissociation (i.e., feeling emotionally numb or separated from a traumatic event) among injured relative to non-injured personnel. An increased incidence of PTSD is associated with physical problems and chronic health conditions after combat-related injury.7,8 Moreover, assessment of PTSD follow-ing combat-related injury is essential for planning appropriate treatment protocols and improving long-term well-being.4,9
This report describes the prevalence of screening positive for PTSD and the association with injury severity and time since injury among U.S. military person-nel injured during combat operations.
M E T H O D S
Data were collected from the Wounded Warrior Recovery Project (WWRP), a lon-gitudinal examination of patient-reported outcomes among service members injured on deployment in post-9/11 conflicts.10 Participants in the WWRP are identified from the Expeditionary Medical Encoun-ter Database (EMED), a deployment health repository maintained by the Naval Health Research Center that includes clinical records of service members injured dur-ing overseas contingency operations since 2001. Records are collected throughout the continuum of care (i.e., from point of injury through rehabilitation).11 Individu-als who sustained an injury during com-bat operations after 1 September 2001 are eligible for the WWRP and approached via postal mail and email to provide informed consent to complete biannual assessments for 15 years. Recruitment for the WWRP began in November 2012 and is ongoing.
The present study utilized cross-sec-tional data for 3,847 WWRP participants collected between September 2018 and April 2020. WWRP measures and proce-dures were updated in late 2018 to remain consistent with current standards of mea-surement. Specifically, the PTSD screen-ing instrument was updated to the PTSD Checklist for the DSM-5 (PCL-5).12 The PCL-5 shows good psychometric proper-ties and has been used with military sam-ples.13,14 Scores on the PCL-5 were summed to create a total symptom severity score. A standard cutoff of 33 indicated a positive screen for PTSD. Injury dates, Injury Sever-ity Scores (ISS), and demographics for this study were obtained from the EMED. The ISS is a composite measure of overall injury severity that accounts for multiple injuries
to different body regions.15 Prevalence of screening positive for PTSD was calcu-lated and stratified by ISS (mild [ISS 1–3], moderate [ISS 4–8], or serious/severe [ISS 9+]) and time between injury and WWRP assessment in quartiles (0.4–7.3, 7.4–10.7, 10.8–13.0, or 13.1–17.8 years). Chi-square tests assessed differences by PTSD screen-ing status. An alpha level of 0.05 was con-sidered statistically significant. Analyses were performed in SAS/STAT software, version 9.4 (SAS Institute, Cary, NC).
R E S U L T S
The study population consisted mostly of young (<30 years old), non-Hispanic White, and male service members in the Army with mild ISSs (Table). Missing data were observed for sex (n = 4), race/ethnicity group (n = 325), and rank (n = 21). Approx-imately half completed a WWRP assess-ment more than 10.8 years after injury, and 38.7% screened positive for PTSD. Ser-vice members who screened positive for PTSD were more likely to be non-White (p <.001), non-Army (p <.001), and lower- to midlevel-enlisted (E1–E6; p <.001) with mild or moderate ISSs (p =.001)
Overall, the proportion of service members who screened positive for PTSD increased by time since injury quartile (Fig-ure); 35.9% of participants who completed an assessment 0.4–7.3 years after injury screened positive for PTSD, compared with 41.4% who completed the assessment 13.1–17.8 years after injury. Participants with serious/severe injuries had the lowest prevalence of screening positive for PTSD in all time since injury quartiles (30.8–38.0%), while those with moderate injuries had the highest prevalence in the final 2 quartiles (44.5%).
Brief Report Prevalence of Screening Positive for Post-Traumatic Stress Disorder Among Service Members Following Combat-Related InjuryAndrew J. MacGregor, PhD; Katheryne G. Perez, MPH; Cameron T. McCabe, PhD; Amber L. Dougherty, MPH; Sarah M. Jurick, PhD; Michael R. Galarneau, MS

August 2021 Vol. 28 No. 08 MSMR Page 11
E D I T O R I A L C O M M E N T
Approximately 39% of WWRP partici-pants screened positive for PTSD, which is higher than the 28% identified in a previous study using the same instrument among military personnel with high combat expo-sure.14 Another study among Marines and Soldiers returning from deployment identi-fied 12–13% PTSD positive using a 4-item PTSD screening instrument.16 In the pres-ent study, all service members had at least 1 potentially traumatic event (i.e., com-bat-related injury), which could explain the higher prevalence of participants who screened positive for PTSD relative to other studies.
The finding of increasing prevalence by time since injury suggests that PTSD may develop or persist several years after combat-related injury, and underscores the need for continual assessment. The higher prevalence of screening positive for PTSD in participants with mild or moderate com-bat-related injuries suggests that PTSD symptoms in these individuals may not have been as promptly or readily identified and treated as in those with serious/severe injuries. Further, service members with serious/severe injuries likely received more extensive care for physical ailments and may have been regularly assessed for men-tal health symptoms leading to earlier iden-tification, treatment, and resolution. Other aspects of serious/severe combat-related injuries, such as medications received dur-ing treatment in-theater, could also explain lower PTSD prevalence in this group.17
The results of this study highlight the importance of screening for PTSD after combat-related injury even after long peri-ods of time. Both the Post-Deployment Health Assessment and Periodic Health Assessment should continue to be used to identify and refer individuals at risk for PTSD. Given that service members may be averse to reporting mental health symptoms due to non-anonymity of these assessments,18 programs aimed at reduc-ing the stigma associated with mental health care in the military should be priori-tized.19 In addition, medical providers who treat combat-related injuries should rou-tinely screen service members for mental
T A B L E . Demographic, military, and injury characteristics of Wounded Warrior Recov-ery Project participants, by post-traumatic stress disorder (PTSD) screening outcome,a September 2018–April 2020
PTSD positive PTSD negative Total p-value
No. % No. % No. %
Total 1,490 100.0 2,357 100.0 3,847 100.0
Sexb
Male 1,422 95.6 2,250 95.5 3,672 95.6 .973
Female 66 4.4 105 4.5 171 4.5
Age group (years)
≤21 181 12.2 274 11.6 455 11.8 .844
21–24 507 34.0 790 33.5 1,297 33.7
25–29 376 25.2 609 25.8 985 25.6
30–34 213 14.3 324 13.8 537 14.0
35–39 115 7.7 180 7.6 295 7.7
40+ 98 6.6 180 7.6 278 7.2
Race/ethnicity groupb
Non-Hispanic White 985 73.2 1,762 81.0 2,747 78.0 <.001
Hispanic 156 11.6 176 8.1 332 9.4
Non-Hispanic Black 108 8.0 111 5.1 219 6.2
Asian/Pacific Islander 66 4.9 90 4.1 156 4.4
American Indian/Alaska Native 31 2.3 37 1.7 68 1.9
Service
Army 1,022 68.6 1,690 71.7 2,712 70.5 <.001
Marine Corps 410 27.5 560 23.8 970 25.2
Navy 45 3.0 56 2.4 101 2.6
Air Force 13 0.9 51 2.2 64 1.7
Rankb
E1–E3 390 26.3 499 21.3 889 23.2 <.001
E4–E6 906 61.2 1,291 55.1 2,197 57.4
E7–E9 114 7.7 180 7.7 294 7.7
Officer/warrant officer 71 4.8 375 16.0 446 11.7
Injury Severity Score
Mild (1–3) 800 53.7 1,237 52.5 2,037 53.0 .001
Moderate (4–8) 398 26.7 549 23.3 947 24.6
Serious/severe (9+) 292 19.6 571 24.2 863 22.4
Time since injury quartile (years)
0.4–7.3 347 23.3 620 26.3 967 25.1 .069
7.4–10.7 360 24.2 592 25.1 952 24.7
10.8–13.0 388 26.0 587 24.9 975 25.3
13.1–17.8 395 26.5 558 23.7 953 24.8
aPTSD positive was defined as a total score of 33 or higher on the PTSD Checklist for the DSM-5 (PCL-5).bMissing data observed among some study participants for sex (n = 4), race/ethnicity group (n = 325) and rank (n = 21).PTSD, post-traumatic stress disorder.

MSMR Vol. 28 No. 08 August 2021 Page 12
F I G U R E . Prevalence of screening positive for post-traumatic stress disorder (PTSD)a by Injury Severity Score (ISS) and time since injury, Wounded Warrior Recovery Project partici-pants, September 2018–April 2020
aPTSD positive was defined as a total score of 33 or higher on the PTSD Checklist for the DSM-5 (PCL-5).
25.0%
30.0%
35.0%
40.0%
45.0%
50.0%
0.4–7.3 7.4–10.7 10.8–13.0 13.1–17.8
Prev
alen
ce
Time since injury quartile (years)
Mild (ISS 1–3)Moderate (ISS 4–8)Serious/severe (ISS 9+)All
health concerns, as individuals present-ing for physical health complaints may be simultaneously experiencing psychological symptoms.20
There are some limitations that should be considered when interpreting the results of this study. This analysis examined time since injury in mutually exclusive groups, rather than repeated measures within indi-viduals, and thus trajectory of PTSD over time could not be elucidated. Similarly, the WWRP does not collect information related to history of PTSD prior to injury. Further, the specific role of injury on the development of PTSD cannot be clarified without a detailed accounting of other fac-tors (e.g., physical health, comorbidities, and life stressors) following combat-related injury.
In conclusion, service members and veterans with combat-related injuries are at risk of screening positive for PTSD even more than a decade after injury. This war-rants future research to explore the role of injury severity and factors associated with resiliency, persistence, and recovery.
Resources should be prioritized for early intervention and mitigation in this popula-tion during active service and post-military discharge.
Author Affiliations: Naval Health Research Center, San Diego, CA (Dr. MacGregor, Ms. Perez, Dr. McCabe, Ms. Dougherty, Dr. Jurick, and Mr. Galarneau); Axiom Resource Management Inc., San Diego, CA (Dr. Mac-Gregor); Leidos, Inc., San Diego, CA (Ms. Perez, Dr. McCabe, Ms. Dougherty, Dr. Jurick).
Disclaimer: The authors are military ser-vice members or employees of the U.S. Gov-ernment. This work was prepared as part of their official duties. Title 17, U.S.C. §105 provides that copyright protection under this title is not available for any work of the U.S. Government. Title 17, U.S.C. §101 defines a U.S. Government work as work prepared by a military service member or employee of the U.S. Government as part of that per-son’s official duties. This report was sup-ported by the U.S. Navy Bureau of Medicine
and Surgery under work unit no. 60808. The views expressed in this article are those of the authors and do not necessarily reflect the official policy or position of the Depart-ment of the Navy, Department of Defense, nor the U.S. Government. The study protocol was approved by the Naval Health Research Center Institutional Review Board in com-pliance with all applicable Federal regula-tions governing the protection of human subjects. Research data were derived from an approved Naval Health Research Center Institutional Review Board protocol, number NHRC.2009.0014.
R E F E R E N C E S
1. DeBruyne NF, Leland A; Congressional Re-search Service. American war and military op-erations casualties: lists and statistics. Accessed 1 June 2021. https://fas.org/sgp/crs/natsec/RL32492.pdf2. Greer N, Sayer N, Kramer M, Koeller E, Velas-quez T. Prevalence and epidemiology of combat blast injuries from the military cohort 2001–2014. Washington, DC: Department of Veterans Affairs; 2016. 3. Cannon JW, Holena DN, Geng Z, et al. Com-prehensive analysis of combat casualty outcomes in US service members from the beginning of World War II to the end of Operation Enduring Free-dom. J Trauma Acute Care Surg. 2020;89(Suppl 2):S8–S15. 4. Sayer NA, Cifu DX, McNamee S, et al. Reha-bilitation needs of combat-injured service members admitted to the VA Polytrauma Rehabilitation Cen-ters: the role of PM&R in the care of wounded war-riors. PM R. 2009;1(1):23–28.5. Koren D, Norman D, Cohen A, Berman J, Klein EM. Increased PTSD risk with combat-related in-jury: a matched comparison study of injured and uninjured soldiers experiencing the same combat events. Am J Psychiatry. 2005;162(2):276–282.6. Walker LE, Watrous J, Poltavskiy E, et al. Lon-gitudinal mental health outcomes of combat-injured service members. Brain Behav. 2021;11(5):e02088.7. Grieger TA, Cozza SJ, Ursano RJ, et al. Posttraumatic stress disorder and depres-sion in battle-injured soldiers. Am J Psychiatry. 2006;163(10):1777–1783.8. Watrous JR, McCabe CT, Jones G, et al. Low back pain, mental health symptoms, and quality of life among injured service members. Health Psy-chol. 2020;39(7):549–557.9. Woodruff SI, Galarneau MR, McCabe CT, Sack DI, Clouser MC. Health-related quality of life among US military personnel injured in combat: findings from the Wounded Warrior Recovery Project. Qual Life Res. 2018;27(5):1393–1402.10. Watrous JR, Dougherty AL, McCabe CT, Sack DI, Galarneau MR. The Wounded Warrior Recov-ery Project: a longitudinal examination of patient-reported outcomes among deployment-injured military personnel. Mil Med. 2019;184(3–4):84–89.11. Galarneau MR, Hancock WC, Konoske P, et al.

August 2021 Vol. 28 No. 08 MSMR Page 13
The Navy-Marine Corps Combat Trauma Registry. Mil Med. 2006;171(8):691–697.12. Weathers FW, Litz BT, Keane TM, Palmieri PA, Marx BP, Schnurr PP. The PTSD Checklist for DSM-5 (PCL-5) – Standard [Measurement in-strument]. National Center for PTSD Web site. Accessed 1 June 2021. https://www.ptsd.va.gov/professional/assessment/documents/PCL5_Stan-dard_form.PDF13. Blevins CA, Weathers FW, Davis MT, Witte TK, Domino JL. The posttraumatic stress disorder checklist for DSM-5 (PCL-5): development and initial psychometric evaluation. J Trauma Stress. 2015;28(6):489-–498.14. Hoge CW, Riviere LA, Wilk JE, Herrell RK, Weathers FW. The prevalence of post-traumatic
stress disorder (PTSD) in US combat soldiers: a head-to-head comparison of DSM-5 versus DSM-IV-TR symptom criteria with the PTSD checklist. Lancet Psychiatry. 2014;1(4):269–277. 15. Baker SP, O'Neill B, Haddon W Jr, Long WB. The injury severity score: a method for describing patients with multiple injuries and evaluating emer-gency care. J Trauma. 1974;14:187–96.16. Mustillo SA, Kysar-Moon A, Douglas SR, et al. Overview of depression, post-traumatic stress disorder, and alcohol misuse among active duty service members returning from Iraq and Af-ghanistan, self-report and diagnosis. Mil Med. 2015;180(4):419–27.17. Holbrook TL, Galarneau MR, Dye JL, Quinn K, Dougherty AL. Morphine use after combat injury in
Iraq and post-traumatic stress disorder. N Engl J Med. 2010;362(2):110–117.18. Warner CH, Appenzeller GN, Grieger T, et al. Importance of anonymity to encourage hon-est reporting in mental health screening af-ter combat deployment. Arch Gen Psychiatry. 2011;68(10):1065–1071.19. Ben-Zeev D, Corrigan PW, Britt TW, Langford L. Stigma of mental illness and service use in the military. J Ment Health. 2012;21(3):264–273.20. MacGregor AJ, Zouris JM, Watrous JR, et al. Multimorbidity and quality of life after blast-relat-ed injury among US military personnel: a cluster analysis of retrospective data. BMC Public Health. 2020;20(1):578.

MSMR Vol. 28 No. 08 August 2021 Page 14
Mental Health Disorders, Behavioral Health Problems, Fatigue and Sleep Outcomes in Remotely Piloted Aircraft/Manned Aircraft Pilots, and Remotely Piloted Aircraft Crew, U.S. Air Force, 1 October 2003–30 June 2019John W. Kieffer, MD (Maj, USAF); Shauna Stahlman, PhD, MPH
In the Department of Defense (DoD), the years from 2002 through 2010 saw an increase of nearly 45-fold (167 to 7,500)
in the quantity of unmanned aerial vehicles (UAVs).1 U.S. Air Force (USAF) remotely piloted aircraft (RPA) have increased from 21 in 2005 to a projected 318 in 2020.2 Oper-ational USAF members, like unmanned aerial vehicle (UAV) pilots and their crew members, face dynamic challenges unique to their occupations including mental and social stressors. Recent wars in Iraq and Afghanistan have precipitated a large bur-den of mental and behavioral health (MH/BH) conditions among U.S. military service members. Although the incidence of MH/BH conditions have decreased slightly since 2007 among all active component service members,3 it is important to conduct sur-veillance of trends of MH/BH conditions
in specific occupational groups which may be at greater risk of these conditions due to operational demands and stressors associ-ated with those occupations.4
The overall decreasing trend in MH/BH conditions among U.S. military per-sonnel may not apply to the RPA commu-nity (pilots and the crew [sensor operator and mission intelligence coordinator]). The observed small overall decline in incidence rates of MH/BH conditions may be partially due to decreased deployment activity in Iraq (Operation Iraqi Freedom/OIF, Oper-ation New Dawn/OND) and Afghanistan (Operation Enduring Freedom/OEF) in 2010 and 2014, respectively. However, such decreases in conventional deployed opera-tions may not apply to those RPA pilots and crew who work within a “deployed-in-garrison” setting that involves long hours,
U.S. Air Force (USAF) manned aircraft (MA) pilots and remotely piloted air-craft (RPA) pilots and their non-pilot crew form part of the forward-most contingent of airpower. Limited information exists on the incidence of men-tal health (MH) disorders, behavioral health (BH) problems, sleep disorders, and fatigue among these groups. Incidence rates and incidence rate ratios of these conditions were calculated among all active component USAF mem-bers during the period from 1 October 2003 to 30 June 2019. Compared to those in all other USAF occupations, RPA and MA pilots had statistically sig-nificantly lower risk of MH and BH outcomes while RPA crew shared a risk similar to other USAF members, although with higher risk of post-traumatic stress disorder and lower risk of substance- and alcohol-related disorders. This pattern was similar for fatigue outcomes except RPA crew had slightly higher risk. All 3 occupational groups had elevated risk for sleep disorders, and RPA pilots had 32% higher risk compared to those in all other USAF occupations. This study highlights that pilots have lower risk and/or report-ing tendency for MH disorders, BH problems, and fatigue, while sleep dis-orders are common among service members in all of these (RPA/MA pilot, RPA crew) occupations.
W H A T A R E T H E N E W F I N D I N G S ?
Adjusted incidence rate ratios of MH disorders, BH problems and fatigue were lower among RPA pilots and MA pilots, while fatigue was higher among RPA crew compared to other USAF occupations. All 3 groups had higher risk for sleep disorders compared to other USAF occupations.
W H A T I S T H E I M P A C T O N R E A D I N E S S A N D F O R C E H E A L T H P R O T E C T I O N ?
Understanding the burden of these outcomes is important for gauging the health of opera-tional USAF members and to help direct ac-tions to reduce and/or prevent the highest risk health concerns. This study can inform leader-ship’s prioritization of resources to maximize pilot and air crew health and readiness.
shift work, and exposure to traumatic real-time events.5 In fact, the main mission of RPA teams, Combat Air Patrols (CAPs), has increased from 5 CAPs in 2004 to 65 in 2014 and have remained at high levels.6 These CAP missions can and often do operate 24 hours a day every day of the year. Further-more, beyond elevated rates of MH disorder diagnoses, given their unique occupational setting, RPA teams may also be at greater risk of insomnia, fatigue, and occupational burnout.7 Over 6% of U.S. RPA pilots were noted to meet post-traumatic stress disorder (PTSD) symptom criteria.8 Other studies indicate that, in U.K. RPA pilots, the shift-work features of this occupation are among the greatest sources of stress and diminished functional ability.9
Like RPA pilots and crew, manned air-craft (MA) pilots are in a unique occupa-tion compared to many other USAF service members. MA pilots constitute only a frac-tion of the total USAF but perform a critical mission on the forefront of the operational force. Frequent deployment demands, sometimes reaching a 1:1 combat-to-dwell

August 2021 Vol. 28 No. 08 MSMR Page 15
ratio (the ratio of time deployed to time at home), may pose formidable demands on the MH of these aviators. Related conditions such as fatigue and sleep disorders are also historically common concerns among MA pilots.10
Studies on the incidence of MH/BH and fatigue-related conditions in USAF pilots and crew are limited. In a relevant prior study, Otto and Webber investigated rates of incident MH disorder diagnoses and BH outcomes among MA and RPA pilots in the USAF between 1 October 2003 and 31 December 2011.11 Their findings indicated similar rates of MH disorder diagnoses among MA pilots and their RPA pilot coun-terparts, both of whom had lower rates than those in other USAF occupations (as desig-nated by Air Force Specialty Code [AFSC]). Changes in the nature of USAF missions since the Otto and Webber study and the ability to include other diagnoses and out-comes (i.e., sleep disorders and fatigue) make the current study a more inclusive characterization of the health risks of this population.
This study describes the demographic and military characteristics of RPA pilots, RPA crew, and MA pilots as well as the inci-dence rates and rate ratios of MH/BH con-ditions, sleep disorders, and fatigue among these 3 groups of pilots and crew compared to service members in all other USAF occu-pations during the surveillance period.
M E T H O D S
The surveillance period was 1 October 2003 (the inception date for the RPA pilot AFSC) through 30 June 2019. The surveil-lance population included all active com-ponent (AC) Air Force members serving at any time from 1 October 2003 through 31 December 2018. Diagnoses were ascer-tained from administrative medical records maintained in the Defense Medical Surveil-lance System (DMSS) that document out-patient and inpatient encounters of active component service members. Such records reflect care in fixed military treatment facili-ties of the Military Health System (MHS) and in civilian health care settings where care is paid for by the MHS. Health care encounters of deployed service members
were obtained from the Theater Medical Data Store (TMDS).
This analysis included service mem-bers in 1 of 4 occupational groups (cate-gorized by AFSC): RPA pilots, MA pilots, RPA crew, and all other USAF occupations (Table 1). If service members served in mul-tiple AFSCs during their military career, they were assigned to the highest AFSC they had held, as designated by a ranking of the 4 AFSC groups (highest to lowest): RPA pilot, MA pilot, RPA crew, all other USAF. For example, if a service member had served as an RPA crew member, other USAF occu-pation, and an RPA pilot during the course of his/her career, then that person was des-ignated as an RPA pilot for the purposes of this study. Only MA pilots with a history of having deployed for at least 30 days to OEF, OIF, or OND were included in the analysis.
The follow-up period for RPA/MA pilots, RPA crew, or other USAF members began after completion of 30 days of service (person-time began at this point). They were censored from observation at separation from active duty or at the end of the surveil-lance period. Prevalent cases were excluded but an incident case in one outcome category
did not preclude persons from being inci-dent cases in another outcome category. For example, an incident case of PTSD would not preclude that same person from being counted as an incident case of depression.
There were 4 main categories of out-comes: MH disorders (acute stress disorder, adjustment disorders, alcohol-related dis-orders, anxiety disorders, depressive disor-ders, PTSD, sexual dysfunction not due to substance/physiologic condition, and sub-stance-related disorders), behavioral health problems (suicidal/homicidal ideation, fam-ily/support group problems, maltreatment-related, lifestyle problems, and substance abuse counseling), sleep disorders (exclud-ing sleep apnea and other physiologic etiolo-gies), and fatigue. To meet the case definition for a MH disorder, a person must have had either 1 hospitalization with a defining Inter-national Classification of Diseases, 9th Revi-sion (ICD-9)/International Classification of Diseases, 10th Revision (ICD-10) diagnosis code (Table 2) in the first or second diagnos-tic position or 2 or more outpatient or TMDS encounters occurring within 180 days (not on same day) or 1 outpatient encounter in a psychiatric or mental health care specialty
T A B L E 1 . Air Force Specialty Codes (AFSCs) used in categorizing service members into occupational groupsa
AFSC
RPA pilots 11U (RPA pilot-former MA pilot)12U (RPA pilot-former CSO field)18A (attack RPA pilot)18G (generalist RPA pilot)18R (reconnaissance RPA pilot)1U1 (enlisted RPA pilot)
MA pilotsb 11B (bomber pilot)11F (fighter pilot)11G (generalist pilot)11H (rescue pilot)11M (mobility pilot)11R (reconnaissance/surveillance/electronic warfare pilot)11S (special operations pilot)
RPA crew 1U0X (Sensor Operator)1N1X (Geospatial Intelligence)1N8X (Targeting Analyst)
All other USAF occupations All other AFSCs
aIf service members served in multiple AFSCs during their military career, they were assigned to the highest AFSC they had held, as designated by a ranking of the 4 AFSC groups (highest to lowest): RPA pilot–MA pilot–RPA crew–all other USAF.bMA pilots were those with a history of having deployed for at least 30 days to OEF, OIF or OND and also held one of these AFSCs.RPA, remotely piloted aircreaft; MA, manned aircraft; USAF, U.S. Air Force.

MSMR Vol. 28 No. 08 August 2021 Page 16
setting defined by Medical Expense and Performance Reporting System (MEPRS) code starting with “BF”, with a case-defin-ing diagnosis in the first or second diagnos-tic position. To meet the case definitions for a BH problem, sleep disorder, or fatigue, 1 encounter (inpatient or outpatient/TMDS) with the defining diagnosis in any diagnostic position was required. The case definitions used in this analysis are generally consistent with the AFHSD surveillance case defini-tions for mental heath conditions; however, a notable difference is the exclusion of ICD-10 code F10.11 which represents alcohol use disorders in remission.
Incidence rates (IRs) per 1,000 per-son-years (p-yrs) and adjusted incidence rate ratios (AIRRs) with their 95% confi-dence intervals (CIs) were calculated using all other USAF occupations as the reference
group. For the purposes of examining IRs over time, the IRs of MH disorders and BH problems were combined as 1 outcome and also broken down into specific categories. IRRs were calculated using a multivariable Poisson regression model that adjusted for age group, sex, race/ethnicity group, and number of deployments. Data analysis was carried out using SAS/STAT software, ver-sion 9.4 (2014, SAS Institute, Cary, NC) and R, version 3.6.2 (2019, R Core Team).
R E S U L T S
USAF members in service during the surveillance period included 2,687 RPA pilots, 13,384 MA pilots (with at least 1 deployment), 6,793 RPA crew, and 840,812 service members in other occupations
(Table 3). Several differences in demographic and military characteristics were apparent between these occupational groups. Both RPA and MA pilots were predominately male (94.0% and 94.5%, respectively) while RPA crew and other USAF were less so (71.5% and 78.7%, respectively). RPA pilots tended to be older (46.7% aged 30 years or older) than other occupational groups: MA pilots (26.5%); RPA crew (12.6%); and other USAF (19.1%). RPA and MA pilots were predominantly non-Hispanic White (82.7% and 86.6%, respectively) and RPA crew and other USAF less so (69.8% and 66.8%, respectively). More than one-third (35.3%) of MA pilots had 3 or more deployments followed by RPA pilots (18.8%), other USAF (4.5%), and RPA crew (2.6%).
Over the course of the surveillance period, crude (unadjusted) annual rates of
T A B L E 2 . Mental and behavioral health, sleep disorders and fatigue outcome categories ICD-9 and ICD-10 diagnostic codes
Outcome categories ICD-9a ICD-10a
Mental health disorders
Acute stress disorder 308.* F43.0
Adjustment disorders 309.* (except 309.81) F43.2*, F43.8, F43.9, F93.0, F94.8, F94.9
Anxiety disorders 300.0*, 300.2*, 300.3 F40*, F41*, F42*
Depressive disorders 296.2*, 296.3* (excluding 296.34), 296.9*, 300.4, 311
F32.*, F33.*, F34, F34.1, F34.8, F34.9, F39, F34.81, F34.89
Post-traumatic stress disorder 309.81 F43.1*Sexual dysfunction not due to a substance or known physiological condition
302.7* F52.*
Alcohol-related disorders 291.0 , 291.81, 303.0*, 305.0*, 303.9* F10.1* (except F10.11), F10.2*
Substance-related disorders 304*, 305.2*–305.9* F11.2*, F12.2*, F13.2*, F14.2*, F15.2*, F16.2*, F18.2*, F19.2*, F11.1*, F12.1*, F13.1*, F14.1*, F15.1*, F16.1*, F18.1*, F19.1*
Psychogenic asthenia 300.5 F48.8
Behavioral health problems
Homicidal and suicidal ideations V628.5, V628.4 R45.85*
V- or Z-coded behavioral health problems (family/support groups, maltreatment-related, lifestyle, substance abuse counseling)
V610*, V69*, V613, V6141, V6142, V6149, V618, V619, V6282, V6111, V6112, V6121, V6122, V6283, V4985, V624, V6289, V7101, V7102, V6542
Z63*, Z69*, Z72*, Z73*, Z714*, Z715*, Z716
Fatigue/Sleep disorders
Fatigue 780.71, 780.79, 780.52, 327.09, 327.10, 780.54, R53.8*
Sleep disorders 307.41–307.44, 307.46, 307.47, 307.49, 327.09, 327.10–327.15, 327.3*, 327.02, 780.50, 780.52, 780.54, 780.59
G47.00, G47.09, G47.10–G47.13, G47.19, G47.20–G47.29, G47.8, G47.9, F51, F51.0*, F51.1*, F51.3, F51.4, F51.5, F51.8, F51.9
aAn asterisk (*) indicates that any subsequent digit/character is included.ICD, International Classification of Diseases.

August 2021 Vol. 28 No. 08 MSMR Page 17
T A B L E 3 . Demographic and military characteristics, active component Air Force service members, by study group, October 2003– 30 June 2019
TotalCohort
RPA pilots Deployed MA pilots RPA crew All other USAFNo. % No. % No. % No. % No. %
Total 863,676 100.0 2,687 100.0 13,384 100.0 6,793 100.0 840,812 100.0Sex
Male 681,771 78.9 2,525 94.0 12,644 94.5 4,856 71.5 661,746 78.7Female 181,905 21.1 162 6.0 740 5.5 1,937 28.5 179,066 21.3
Age group (years)18–19 261,291 30.3 0 0.0 0 0.0 2,021 29.8 259,270 30.820–24 320,012 37.1 367 13.7 2,547 19.0 2,644 38.9 314,454 37.425–29 115,953 13.4 1,066 39.7 7,288 54.5 1,274 18.8 106,325 12.730–34 61,018 7.1 737 27.4 1,724 12.9 496 7.3 58,061 6.935–39 60,009 7.0 303 11.3 820 6.1 279 4.1 58,607 7.040+ 45,393 5.3 214 8.0 1,005 7.5 79 1.2 44,095 5.2
Race/ethnicity groupNon-Hispanic White 580,164 67.2 2,222 82.7 11,591 86.6 4,742 69.8 561,609 66.8Non-Hispanic Black 121,870 14.1 77 2.9 260 1.9 632 9.3 120,901 14.4Hispanic 81,382 9.4 184 6.9 559 4.2 701 10.3 79,938 9.5Other/unknown 80,260 9 204 8 974 7 718 11 78,364 9
Marital statusSingle, never married 557,754 64.6 884 32.9 5,657 42.3 4,615 67.9 546,598 65.0Married 278,106 32.2 1,709 63.6 7,479 55.9 1,979 29.1 266,939 31.8Other/unknown 27,816 3.2 94 3.5 248 1.9 199 2.9 27,275 3.2
Education levelHigh school or less 632,776 73.3 28 1.0 247 1.9 5,380 79.2 627,121 74.6Some College 46,050 5.3 13 0.5 12 0.1 734 10.8 45,291 5.4College or more 117,121 13.6 2,549 94.9 12,643 94.5 375 5.5 101,554 12.1Unknown 67,729 7.8 97 3.6 482 3.6 304 4.5 66,846 8.0
Rank/gradeJunior enlisted (E1–E4) 565,696 65.5 0 0.0 0 0.0 5,049 74.3 560,647 66.7Senior enlisted (E5–E9) 167,763 19.4 22 0.8 0 0.0 1,744 25.7 165,997 19.7Junior officer (O1–O3) 97,109 11.2 2,127 79.2 11,272 84.2 0 0.0 83,710 10.0Senior officer (O4–O10) 33,108 3.8 538 20.0 2,112 15.8 0 0.0 30,458 3.6
# of deployments0 608,143 70.4 1,126 41.9 0 0.0 5,035 74.1 601,982 71.61 140,307 16.3 612 22.8 5,034 37.6 1,142 16.8 133,519 15.92 71,800 8.3 443 16.5 3,624 27.1 443 6.5 67,290 8.03+ 43,426 5.0 506 18.8 4,726 35.3 173 2.6 38,021 4.5
Deployment length (months)None 608,143 70.4 1,126 41.9 0 0.0 5,035 74.1 601,982 71.6<6 79,312 9.2 488 18.2 4,235 31.6 611 9.0 73,978 8.86–12 109,242 12.7 598 22.3 4,918 36.8 795 11.7 102,931 12.213–18 42,609 4.9 313 11.7 2,529 18.9 242 3.6 39,525 4.719+ 24,370 2.8 162 6.0 1,702 12.7 110 1.6 22,396 2.7
Time in occupation (years)<1 97,745 11.3 159 5.9 182 1.4 413 6.1 96,991 11.51–5 353,623 40.9 1,423 53.0 2,877 21.5 3,120 45.9 346,203 41.26–10 236,497 27.4 893 33.2 6,148 45.9 2,526 37.2 226,930 27.011+ 175,811 20.4 212 7.9 4,177 31.2 734 10.8 170,688 20.3
RPA, remotely piloted aircraft; MA, manned aircraft; USAF, U.S. Air Force.

MSMR Vol. 28 No. 08 August 2021 Page 18
F I G U R E 1 . Unadjusted annual incidence rates of MH disorder or BH problem diagnoses, by occupational group, active component U.S. Air Force service members, 1 October 2003–30 June 2019
F I G U R E 2 . Unadjusted annual incidence rates of fatigue diagnoses, by occupational group, active component U.S. Air Force service members, 1 October 2003–30 June 2019
MH, mental health; BH, behavioral health; p-yrs, person-years; OIF, Operation Iraqi Freedom; OND, Operation New Dawn; OEF, Operation Enduring Freedom; OIR, Operation Inherent Resolve; OFS, Operation Freedom's Sentinel; RPA, remotely piloted aircraft; CPIP, Culture and Process Improvement Plan.
MH, mental health; BH, behavioral health; p-yrs, person-years; OIF, Operation Iraqi Freedom; OND, Operation New Dawn; OEF, Operation Enduring Freedom; OIR, Operation Inherent Resolve; OFS, Operation Freedom's Sentinel; RPA, remotely piloted aircraft; CPIP, Culture and Process Improvement Plan.
incident MH disorder and BH problem diag-noses were consistently higher among service members working as RPA crew and those in all other USAF occupations compared to RPA and MA pilots (Figure 1). Incidence rates of MH disorder and BH problem diagnoses among all other USAF occupations showed a pronounced and relatively steady increase over time from 49.2 per 1,000 p-yrs in 2003 to 76.9 per 1,000 p-yrs in 2019. Rates for RPA crew also increased over time, but with greater year-to-year fluctuations. Compared to all other USAF occupations and RPA crew, rates among MA pilots remained relatively low and the absolute increase in rates was relatively small over the period (3.8 per 1,000 p-yrs in 2003 to 12.5 per 1,000 p-yrs in 2019).
Patterns of rates of incident fatigue diagnoses over time were similar to those observed for MH disorder and BH problem diagnoses in that rates were consistently higher among RPA crew and those in all other USAF occupations compared to RPA and MA pilots (Figure 2). All occupational groups showed steady increases in fatigue incidence over the surveillance period. Crude annual rates of incident sleep dis-order diagnoses showed a different pattern by occupational group in which RPA crew and other USAF occupations demonstrated slight increases over the course of the sur-veillance period (Figure 3). In contrast, there were marked increases in the rates of sleep disorder diagnoses in both pilot groups beginning in 2010. Rates in these groups peaked in 2013 and again more dramatically in 2017 followed by declines through 2019.
Multivariable regression analysis using all other USAF occupations as the refer-ence group revealed that AIRRs for MH disorder or BH problem diagnoses were lowest among MA pilots (AIRR=0.31; 95% CI: 0.29–0.33) followed by RPA pilots (AIRR=0.44; 95% CI=0.38–0.50) (Figure 4). The adjusted incidence rate of this outcome category among RPA crew showed no dif-ference compared to the rate for those in all other USAF occupations (AIRR=0.97; 95% CI: 0.93–1.02). Fatigue diagnoses fol-lowed a similar pattern with MA pilots (AIRR=0.52; 95% CI: 0.49–0.56) and RPA pilots having lower risk (AIRR=0.61; 95% CI: 0.52–0.72) compared to those in all other USAF occupations, and RPA crew
Figure 1. Unadjusted annual incidence rates of MH disorder or BH problem diagnoses, by occupational group, active component U.S. Air Fo
MH, mental health; BH, behavioral health; p-yrs, person-years; OIF, Operation Iraqi Freedom; OND, Operation New Dawn; OEF, Operation Enduring Freedom; RPA, remotely piloted aircraft; CPIP, culture and process improvement plan.
0.0
10.0
20.0
30.0
40.0
50.0
60.0
70.0
80.0
90.0
100.0
2003 2004 2005 2006 2007 2008 2009 2010 2011 2012 2013 2014 2015 2016 2017 2018 2019
Inci
denc
e ra
te p
er 1
,000
p-y
rs
RPA crewAll other USAF occupationsRPA pilotsDeployed MA pilots
CPIP
OIF/OND end
RPA track
OEF ends/OFS begins
OIR beginsOND begins
OIF begins
0.0
5.0
10.0
15.0
20.0
25.0
30.0
35.0
2003 2004 2005 2006 2007 2008 2009 2010 2011 2012 2013 2014 2015 2016 2017 2018 2019
Inci
denc
e ra
te p
er 1
,000
p-y
rs
RPA crewAll other USAF occupationsRPA pilotsDeployed MA pilots
CPIP
OIF/OND end
RPA track
OEF ends/OFS begins
OIR beginsOND begins
OIF begins
showing mildly elevated risk (AIRR=1.10; 95% CI: 1.02–1.18). Sleep disorders dem-onstrated a different pattern in which all groups showed elevated risk compared to those in all other USAF occupations, with RPA pilots at highest risk: RPA pilots (AIRR=1.32; 95% CI: 1.21–1.43); MA
pilots (1.20; 95% CI: 1.16–1.24); and RPA crew (1.10; 95% CI: 1.04–1.16).
Analysis of AIRRs for specific MH dis-order and BH problem diagnoses by occu-pational group yielded patterns broadly similar to those observed for the overall outcome categories (Figure 5). Compared

August 2021 Vol. 28 No. 08 MSMR Page 19
F I G U R E 3 . Unadjusted annual incidence rates of sleep disorder diagnoses, by occupational group, active component U.S. Air Force service members, 1 October 2003–30 June 2019
F I G U R E 4 . Adjusted incidence rate ratiosa of mental health disorder or behavioral health problem, fatigue, and sleep disorder diagnoses, by occupational group, active component U.S. Air Force service members, 1 October 2003–30 June 2019
MH, mental health; BH, behavioral health; p-yrs, person-years; OIF, Operation Iraqi Freedom; OND, Operation New Dawn; OEF, Operation Enduring Freedom; OIR, Operation Inherent Resolve; OFS, Operation Freedom's Sentinel; RPA, remotely piloted aircraft; CPIP, Culture and Process Improvement Plan.
MH, mental health; BH, behavioral health; MA, manned aircraft; RPA, remotely piloted aircraft; AIRR, adjusted incidence rate ratio.aIRRs were adjusted for age group, sex, race/ethnicity group, and number of deployments. All other USAF occupa-tions was the reference group.
Figure 3. Unadjusted annual incidence rates of sleep disorder diagnoses, by occupational group, active component U.S. Air Force service m
MH, mental health; BH, behavioral health; p-yrs, person-years; OIF, Operation Iraqi Freedom; OND, Operation New Dawn; OEF, Operation Enduring Freedom; RPA, remotely piloted aircraft; CPIP, culture and process improvement plan.
0.0
20.0
40.0
60.0
80.0
100.0
120.0
140.0
160.0
2003 2004 2005 2006 2007 2008 2009 2010 2011 2012 2013 2014 2015 2016 2017 2018 2019
Inci
denc
e ra
te p
er 1
,000
p-y
rs
All other USAF occupationsRPA crewDeployed MA pilotsRPA pilots CPIP
OND begins
OIF begins
OIF/OND end
RPA track
OEF ends/OFS begins
OIR begins
0.0 0.2 0.4 0.6 0.8 1.0 1.2 1.4 1.6
RPA pilots
RPA crew
MA pilots
RPA pilots
RPA crew
MA pilots
RPA pilots
RPA crew
MA pilots
Slee
p di
sord
erFa
tigue
MH
dis
orde
r or
BH p
robl
em
AIRR
to those in all other USAF occupations, RPA and MA pilots were at lower risk of all of the specific conditions examined. Pat-terns of specific MH and BH conditions among RPA crew were more varied, how-ever, with RPA crew having significantly higher risk of PTSD (AIRR=1.32; 95% CI:
1.15–1.52), and other behavioral health problems (AIRR=1.06; 95% CI: 1.01–1.11) compared to those in all other USAF occu-pations, and significantly lower risk of alco-hol- (AIRR=0.78; 95% CI=0.68–0.90) and substance-related disorders (AIRR=0.61; 95% CI=0.42–0.90).
E D I T O R I A L C O M M E N T
This study found that MA pilots and RPA pilots had lower adjusted incidence rates of MH disorder and BH problem diagnoses compared to those of other USAF service members, and RPA crew did not have a sta-tistically significantly different adjusted inci-dence of these outcomes compared to USAF service members in other occupations. MA and RPA pilots had lower adjusted incidence rates of fatigue diagnoses while RPA crew had higher incidence than other USAF members. Interestingly, with regard to sleep disorder diagnoses, pilots of both types and RPA crew had higher adjusted incidence rates com-pared to those in all other USAF occupations.
Findings of lower incidence rates of MH/BH conditions among pilots com-pared to all other USAF members were not entirely unexpected; a previous study also reported a lower risk of MH/BH out-comes among USAF pilots compared to USAF members overall.11 Several explana-tions for these lower rates are conceivable. Flying duty, unsurprisingly, is the defining feature of the pilot occupation and is cen-trally important to pilots and their careers. Diagnosis of a MH disorder results in revo-cation of a pilot’s flying status until they are able to receive a waiver after successful treatment and resolution of the condition. However, even if a waiver is granted, there is often a period ranging from 3 months to 1 year during which the pilot is not allowed to perform flying duties.12 This threat of los-ing flying status and the potential harm to career may make seeking help for MH con-ditions less common among pilots and may partially explain these results. Another fac-tor, the so-called healthy flyer effect, may also contribute to the lower rates of inci-dent mental health disorder diagnoses and behavioral health problems observed in pilots. Mental and physical requirements to become a pilot are more stringent than for other USAF occupations which may screen out potential pilot candidates at higher risk of these outcomes. Since the creation of the RPA pilot AFSC in 2003, 2 notable changes have occurred within the pilot career field. In 2010, the USAF created an indepen-dent AFSC for RPA pilots. Additionally, the first enlisted RPA pilots also came into the USAF for the 2017–2018 fiscal year. In the context of these recent changes, this study’s

MSMR Vol. 28 No. 08 August 2021 Page 20
F I G U R E 5 . Adjusted incidence rate ratiosa for specified mental health disorder and behavioral health problem diagnoses, by occupational group, active component U.S. Air Force members, 1 October 2003–30 June 2019
RPA, remotely piloted aircraft; PTSD, post-traumatic stress disorder; MA, manned aircraft; AIRR, adjusted incidence rate ratio.aIRRs were adjusted for age group, sex, race/ethnicity group, and number of deployments. All other USAF occupations was the reference group.bOther behavioral health problems include V- or Z-coded behavioral health problems.
Figure 5. Adjusted incidence rate ratiosa for specified mental health disorder and behavioral health problem diagnoses, by occupational group, active component U.S. Air Force members, 1 October 2003–30 June 2019
0.00 0.20 0.40 0.60 0.80 1.00 1.20 1.40 1.60
Acute stress disorder
Adjustment disorders
Alcohol-related disorder
Anxiety disorders
Depressive disorders
PTSD
Sexual dysfunction
Substance-related disordersOther behavioral health problemsᵇ
Homicidal and suicidal ideations
Acute stress disorder
Adjustment disorders
Alcohol-related disorder
Anxiety disorders
Depressive disorders
PTSD
Sexual dysfunction
Substance-related disordersOther behavioral health problemsᵇ
Homicidal and suicidal ideations
Acute stress disorder
Adjustment disorders
Alcohol-related disorder
Anxiety disorders
Depressive disorders
PTSD
Sexual dysfunction
Substance-related disordersOther behavioral health problemsᵇ
Homicidal and suicidal ideations
RP
A pi
lots
MA
pilo
tsR
PA
crew
AIRRs
results were consistent with the previous study of pilots in 2013.11
RPA crew had similar incidence rates of MH/BH outcomes compared with other USAF personnel. This finding persisted even after adjusting for age group, sex, race/ethnicity group, and number of deploy-ments. The persistence of this finding is not
entirely unexpected given similar demo-graphic characteristics between RPA crew and the rest of the non-pilot USAF. How-ever, for several specific MH/BH outcomes, RPA crew did demonstrate a significant difference in incidence rates compared to those in all other USAF occupations. RPA crew had lower adjusted incidence rates
of substance- and alcohol-related disorder diagnoses but higher rates of PTSD and BH problems which is consistent with a study of RPA intelligence personnel between 2006 and 2010.13 It may be that interven-tions targeted for the RPA crew occupa-tional field could help reduce their elevated incidence of these 2 conditions.

August 2021 Vol. 28 No. 08 MSMR Page 21
Notably, all groups had elevated risk for sleep disorders compared to those in other USAF occupations. One possible explana-tion for the elevated incidence of sleep disor-ders among pilots may be that they feel more at ease reporting to medical professionals for a sleep-related complaint than for a potential underlying MH disorders or BH problems. This elevated risk of sleep disorders among RPA pilots, MA pilots, and RPA crew may be an accurate reflection of increased sleep-related complaints in pilots and crew com-pared to those in other USAF occupations. This elevated risk may be partly attributable to deployment and/or shift work which can disrupt normal sleep cycles. Sleep complaints could also be a proxy for MH disorders or BH problems. RPA pilot, MA pilot, and RPA crew occupations have features which elevate risk of related concerns such as burnout and exhaustion. This finding is consistent with prior studies of RPA and MA pilots and RPA crews.7,8,14
The higher risk of sleep disorders in pilots highlights the potential for adverse long-term outcomes such as burnout, early attrition, and poorer operational performance.14 Work is already underway to improve USAF service member sleep and reduce fatigue by the Air Force Research Laboratory 711th Human Per-formance Wing, where researchers are study-ing sleep with a focus on aircrew.15
The current study may inform other efforts such as the Culture and Process Improvement Plan (CPIP) which was devel-oped by USAF leadership in 2015 to improve morale among the RPA community. Heavy workloads combined with manning challenges spurred this effort along with the finding that the top concern among the RPA community was insufficient time outside of work duties.16 CPIP may have played a role in some of the trends observed in this study by encouraging service members to seek help for these condi-tions. Unadjusted incidence rates of fatigue in 2015 increased by over 60% among RPA pilots and rates of sleep disorders jumped by 100% in RPA pilots and by nearly 170% in MA pilots. Sleep disorder incidence rates continued to increase until 2018 when they began to fall back towards previous levels.
Several limitations are present in this study. First, the choice to only include MA pilots who have been deployed means that some MA pilots were excluded from the analysis and not considered for the outcomes of interest. The number of MA pilots who have never deployed is likely to be small, but there should be further investigation into the
extent of never-deployed pilots and whether they differ in these outcomes. A second limi-tation of this analysis is related to the classi-fication of exposure. Individuals were only allowed to contribute person-time (and out-comes) towards a single exposure group (RPA pilot, MA pilot, or RPA crew) regard-less of whether they served in other groups. Choosing this method aims to most closely represent the final career path of the mem-ber to reflect that RPA pilot and MA pilot are more likely to be the most recent AFSC category. This approach was taken given the difficulty of assigning outcomes occurring at different times in a member serving in more than 1 AFSC category. This choice would tend to result in bias towards increased inci-dence of outcomes assigned to RPA pilots and slightly less so MA pilots. However, except in the sleep outcome, the opposite trend was seen with MA and RPA pilots demonstrating lower incidence than other groups. Therefore, these findings may be slight overestimates of actual incidence. Finally, the low annual case counts for some occupational groups, partic-ularly during the first years of the surveillance period, likely contributed to the pronounced fluctuations in IR estimates observed.
In conclusion, this study provides a lon-gitudinal perspective on an expanded set of operationally-relevant outcomes among RPA/MA pilots and RPA crew. Future oper-ational health studies may explore whether under-reporting of MH/BH outcomes among pilots is a significant concern and may be able to examine methods of reducing sleep disorders among all air crew.
Author Affiliations: Uniformed Services Uni-versity of the Health Sciences, Bethesda, MD (Maj Kieffer); Armed Forces Health Surveil-lance Division (Dr. Stahlman).
Acknowledgements: Dr. Clara Ziadeh and Ms. Zheng Hu (Armed Forces Health Surveillance Division) were instrumental in performing data abstraction and statistical analysis.
Disclaimer: The contents, views or opinions expressed in this publication or presentation are those of the author(s) and do not neces-sarily reflect official policy or position of Uni-formed Services University of the Health Sciences, the Department of Defense (DoD), or Departments of the Army, Navy, or Air Force. Mention of trade names, commercial products, or organizations does not imply endorsement by the U.S. Government.
R E F E R E N C E S
1. Weatherington D. Current and Future Potential for Unmanned Aircraft Systems. 2010.2. Cancian M. U.S. Military Forces in FY 2020: Air Force. Cent Strateg Int Stud. 2019. Accessed 31 March 2020. https://www.csis.org/analysis/us-military-forces-fy-2020-air-force 3. Stahlman S, Oetting AA. Mental health dis-orders and mental health problems, active com-ponent, U.S. Armed Forces, 2007–2016. MSMR. 2018;25(3):2–11.4. Armed Forces Health Surveillance Branch. Absolute and relative morbidity burdens attrib-utable to various illnesses and injuries, active component, U.S. Armed Forces, 2018. MSMR. 2019;26(5):2–10.5. Bryan C, Goodman T, Chappelle W, Thompson W, Prince L. Occupational Stressors, Burnout, and Predictors of Suicide Ideation Among U.S. Air Force Remote Warriors. Mil Behav Heal. 2018;6(1):3–12.6. Hardison, Chaitra M., Aharoni E, Larson C, Tro-chlil S, Hou AC. Stress and Dissatisfaction in the Air Force’s Remotely Piloted Aircraft Community. Santa Monica, CA; 2017.7. Armour C, Ross J. The Health and Well-Be-ing of Military Drone Operators and Intelligence Analysts: A Systematic Review. Mil Psychol. 2017;29(2):83–98. 8. Chappelle W, Goodman T, Reardon L, Prince L. Combat and operational risk factors for post-traumatic stress disorder symptom criteria among U.S. Air Force remotely piloted aircraft “Drone” warfighters. J Anxiety Disord. 2019;62:86–93. 9. Phillips A, Sherwood D, Greenberg N, Jones N. Occupational stress in Remotely Piloted Air-craft System operators. Occup Med (Lond). 2019;69(4):244–250.10. Neville KJ, Bisson RU, French J, Boll PA, Storm WF. Subjective Fatigue of C-141 Aircrews during Operation Desert Storm. Hum Factors J Hum Fac-tors Ergon Soc. 1994;36(2):339–349. 11. Otto JL, Webber BJ. Mental health diagnoses and counseling among pilots of remotely piloted air-craft in the U.S. Air Force. MSMR. 2013;20(3):3–8.12. Department of the Air Force. USAF Medical Service. Aerospace Medicine Waiver Guide. Air Force Waiver Guide. 2 Dec 2020. Accessed 31 March 2020. https://www.afrl.af.mil/Portals/90/Doc-uments/711/USAFSAM/USAF-waiver-guide-201202.pdf?ver=CfL6CVKyrAbqyXS7A-OX_A%3D%3D13. Ostrowski, Kris Anthony, Psychological Health Outcomes Within USAF Remotely Piloted Aircraft Support Career Fields. Scholarly Commons. 2016; PhD Dissertations and Master's Theses. 203.14. Chappelle W, McDonald K, Prince L, Good-man T, Ray-Sannerud BN, Thompson W. Assess-ment of Occupational Burnout in U.S. Air Force Predator/Reaper “Drone” Operators. Mil Psychol. 2014;26(5–6):376–385. 15. Bedi S. Air Force studies fatigue, sleep to en-hance readiness. Air Force Surgeon General Pub-lic Affairs. Accessed 31 March 2020. https://www.af.mil/News/Article-Display/Article/2047256/air-force-studies-fatigue-sleep-to-enhance-readiness/ 16. Everstine BW. Don’t Fear the Reaper. Air Force Mag. 2016. Accessed 31 March 2020. https://www.airforcemag.com/article/dont-fear-the-reaper/.

MSMR Vol. 28 No. 08 August 2021 Page 22
Surveillance of Mental and Behavioral Health Care Utilization and Use of Telehealth, Active Component, U.S. Armed Forces, 1 January 2019–30 September 2020Leslie Clark, PhD, MS; Michael Fan, PhD; Shauna Stahlman, PhD, MPH
The World Health Organization declared the spread of coronavirus disease (COVID-19) an interna-
tional pandemic on March 11, 2020. Subse-quently, 2 national emergency declarations related to the pandemic were issued in the U.S. on March 13. Between 1 March and 31 May 2020, 42 U.S. states and territories issued mandatory stay-at-home orders as a mitigation strategy to reduce the spread of COVID-19.1 The resulting unprecedented and multi-dimensional disruptions to daily life contributed to social isolation, fear and worry about being infected with COVID-19, economic stress, and other factors which can affect mental and behavioral health (MH/BH).
Multiple studies have reported on the negative MH impacts of the pandemic. A systematic review revealed elevated rates of stressors and symptoms of anxiety and depression across 8 countries during the pandemic as compared to the prior year.2 In the U.S., the Centers for Disease Control
and Prevention (CDC) reported consider-able increases in symptoms of anxiety and depressive disorders between April and June of 20203,4 and elevated rates of suicidal ide-ation, substance abuse, and other adverse mental health conditions in June 20205 when compared to the previous year.
Concomitant with these negative con-sequences, the COVID-19 pandemic forced many health care institutions to embrace the use of telehealth to efficiently provide quality care to patients. Several large health care systems in the U.S. reported dramatic increases in the use of telehealth with com-mensurate declines for in-person medical care.6–8 In addition to the overall shift from in-person to telehealth medical services, health care systems reported increased use of telehealth specifically for mental health care. For example, the U.S. Department of Veterans Affairs experienced an increase of over 500% in telehealth visits for mental and behavioral health care between 11 March and 22 April 2020.9 Similar patterns for
This analysis of population-level health care utilization data evaluates changes in monthly counts and rates of medical encounters for mental and behavioral health (MH/BH) conditions and the proportion of care delivered via tele-health among active component military members of the U.S. Armed Forces during the first 6 months (March–September 2020) of the COVID-19 pan-demic. Comparisons are also made to the same time period in the previous year (2019). Telehealth usage increased during the early pandemic and was on average 25% higher during March–September 2020 as compared to the previous year. In contrast, MH/BH outpatient visit rates declined modestly between March and May 2020 before rebounding in June and remaining sta-ble through September 2020. The number of bed days attributable to MH/BH conditions also declined during March and April 2020 and was on average 30% lower during March–September 2020 as compared to the same period in the prior year. Continued surveillance is warranted to track MH/BH health care utilization during the later months of the pandemic to ensure that suf-ficient resources continue to be directed towards MH/BH care to support the health and readiness of active component service members.
W H A T A R E T H E N E W F I N D I N G S ?
During the first 6 months of the COVID-19 pandemic, health care utilization for mental and behavioral health generally declined dur-ing March and April but rebounded by June 2020. During the same period, telehealth us-age increased during the early pandemic and was on average 25% higher during the period between March and September 2020 as com-pared to the previous year.
W H A T I S T H E I M P A C T O N R E A D I N E S S A N D F O R C E H E A L T H P R O T E C T I O N ?
The finding that telehealth usage for MH/BH conditions increased (albeit modestly) during the early period of the pandemic, as well as its usage prior to the pandemic, demonstrates that the Military Health System (MHS) was prepared to deliver mental health services via telehealth and increase telehealth services to meet the needs of active component service members.
MH/BH visits and telehealth were observed among TRICARE beneficiaries during the COVID-19 pandemic as compared to the same time period in 2019.10
However, estimates of the magnitude of change in the utilization of MH/BH health care and telehealth use by active component members of the U.S. Armed Forces have not been published. This surveillance analysis of population-level health care utilization data evaluates changes in monthly counts and rates of medical encounters for MH/BH conditions among active component military members of the U.S. Armed Forces during the first 6 months (March–Septem-ber 2020) of the COVID-19 pandemic. This analysis also assesses and reports the pro-portion of MH/BH encounters delivered via telehealth during the surveillance period. Finally, counts and rates of MH/BH encoun-ters during the first 6 months of the pan-demic are compared to the same time period in the previous year (2019).

August 2021 Vol. 28 No. 08 MSMR Page 23
M E T H O D S
The surveillance period for this analy-sis was 1 January 2019 through 30 Septem-ber 2020. This retrospective surveillance analysis evaluated health care utilization for MH/BH conditions including outpa-tient encounters, hospitalizations, and telehealth usage for all active component service members in the U.S. Army, Navy, Air Force, and Marine Corps during the surveillance period. The data used in this analysis were derived from administrative medical records routinely maintained in the Defense Medical Surveillance System (DMSS) consisting of encounters rendered at military treatment facilities (MTFs) and civilian facilities if reimbursed through the Military Health System (MHS) worldwide.
For the surveillance period, monthly summaries of health care utilization for specific MH/BH conditions were quanti-fied using methods consistent with those used in the annual Medical Surveillance Monthly Report (MSMR) burden analy-sis.11 Standard surveillance case defini-tions developed by the Armed Forces Health Surveillance Division were used to identify International Classification of Diseases, 10th Revision (ICD-10) codes corresponding to the MH/BH conditions of interest (Table 1). All medical encoun-ters for active component service mem-bers with an ICD-10 code for a MH/BH condition of interest in the primary (first-listed) diagnostic position were identified. The specific MH/BH conditions evaluated for this analysis included the following: adjustment disorders, alcohol-related dis-orders, anxiety disorders, depressive disor-ders, substance-related disorders, suicidal ideation, psychosocial circumstances (e.g., problems related to family circumstances; problems related to other psychosocial cir-cumstances), and insomnia. ICD-10 code F10.11 was not included because this code represents alcohol abuse in remission. Although not specifically a MH/BH diag-nosis, insomnia was included in this anal-ysis as it is a common comorbidity with other MH/BH conditions and increases in the frequency of sleep problems have been reported during the COVID-19 pandemic.12
Telehealth encounters were defined as outpatient encounters that contained a Cur-rent Procedural Terminology (CPT) code for a telehealth encounter (i.e., health care delivered via telephone or video) or that were coded as a telehealth encounter in a DMSS variable identifying appointment type.
All medical encounters identified using the criteria specified above were included in this analysis and no sampling strategy was utilized. Because this analysis represents population-level data and the goal of the analysis was not to generalize these findings to other populations or time periods, no inferential statistics were employed.13
Counts of outpatient medical encoun-ters, the number of unique individuals receiving care, and the numbers of bed days were calculated and reported for each month of the surveillance period for MH/BH conditions overall and for each specific MH/BH condition assessed. Monthly MH/BH outpatient encounter rates were calcu-lated by dividing the number of outpatient encounters (including telehealth encoun-ters) in a given month by the number of service members serving at least 1 day dur-ing that month and reported as the number of encounters per 100 service members. The number of bed days attributable to insom-nia and psychological circumstances were not reported because there were few hospi-talizations for these conditions.
R E S U L T S
During January and February 2020 (the months prior to the declaration of the pandemic), the MH/BH outpatient visit rate and the number of bed days attribut-able to MH/BH conditions averaged 12 and 13% higher, respectively, than in the same period in the previous year. (Table 2, Figures 1a, 1b). In contrast, telehealth usage during this period was similar (approximately 1% lower) to the same period in 2019 (Table 2, Figure 1c). During March 2020, the MH/BH outpatient visit rate remained 6% higher than in 2019 (Table 2, Figure 1a). How-ever, the number of bed days attributable to MH/BH conditions during March 2020 (n=10,842) represented a 19% decrease from February 2020 and an 11% decrease compared to February 2019 (Table 2).
Between March and April 2020, the outpatient visit rate for MH/BH encounters declined by 15% to 10.6 visits per 100 ser-vice members; this outpatient visit rate was stable through May (Table 2, Figure 2). Dur-ing this same period, the percentage of out-patient encounters delivered via telehealth increased an additional 22%, after increas-ing 48% between February and March 2020.
By June 2020, the declining trend in health care utilization for MH/BH condi-tions reversed with an 11% increase in the
T A B L E 1 . Diagnostic ICD-10 codes used to identify medical encounters for mental and behavioral health disorders
Diagnostic category ICD-10 codes
Mental or Behavioral Health Disorder
Adjustment disorders F43.2*, F43.8, F43.9, F93.0, F94.8, F94.9
Alcohol-related disorders F10.1* (excludes F10.11), F10.2*
Anxiety disorders F40.*, F41.*, F42*
Depressive disorders F32.*, F33.*, F34, F34.1, F34.8, F34.9, F39, F34.81, F34.89
Insomnia F51.0*, G47.0*
Psychosocial Circumstances Z63*, Z65*Substance-related disorder F11.2*, F12.2*, F13.2*, F14.2*, F15.2*, F16.2*, F18.2*,
F19.2*, F11.1*, F13.1*, F14.1*, F15.1*, F16.1*, F18.1*, F19.1*
Suicidal ideation R45.851
An asterisk (*) indicates that any subsequent digit/character is included.ICD-10, International Classification of Disease, 10th Revision.

MSMR Vol. 28 No. 08 August 2021 Page 24
outpatient visit rate to 11.8 encounters per 100 service members (Table 2, Figure 2). Sim-ilarly, the number of bed days attributable to MH/BH conditions increased by 17% in June as compared to the prior month (Table 2). In contrast, from May through June 2020, telehealth usage declined by 14%.
During the remainder of the surveil-lance period (July–September 2020), the
outpatient visit rate was relatively stable and varied by 3% or less while the number of bed days attributable to MH/BH condi-tions declined in each remaining month of the surveillance period (Table 2, Figure 2). Overall, the number of bed days attribut-able to all MH/BH conditions in Septem-ber was 29% lower than in August and 46% lower than in September of the prior year.
Telehealth use for MH/BH conditions peaked in April 2020. Subsequently, tele-health use declined during May–August 2020 although telehealth use remained con-sistently higher every month between March and September 2020 than during the same period in the prior year (2019) (Figure 1c).
Generally, patterns of health care uti-lization for specific MH/BH conditions (e.g., adjustment disorders, anxiety disor-ders, depressive disorders) were similar to patterns identified in the summary of con-ditions overall (Tables 3–10 [See Appendix]). For example, all conditions included in this analysis except insomnia, psychosocial cir-cumstances, and suicidal ideation exhibited the same declines in outpatient visit rates during April and May 2020 and a rebound, or increase in outpatient visit rates, in June 2020. The 3 conditions that did not follow this pattern still showed a decline in outpa-tient visit rates in April but demonstrated an earlier rebound in outpatient visit rates in May instead of June 2020.
Similarly, while most specific MH/BH conditions demonstrated generally lower outpatient visit rates during June–Septem-ber 2020 as compared to the previous year, 3 conditions (adjustment disorders, anxiety disorders, psychosocial circumstances) had, on average, higher outpatient visit rates than
T A B L E 2 . Healthcare utilization attributable to all mental and behavioral health conditions, U.S. Armed Forces, January 2019– September 2020
No. outpatient encounters Outpatient visit ratea % telehealth Individuals affected Bed days
Year 2019 2020 2019 2020 2019 2020 2019 2020 2019 2020
Month
Jan 150,012 168,826 11.5 12.8 5.7 5.7 55,291 64,295 13,185 13,969
Feb 141,391 161,398 10.8 12.2 5.3 5.3 53,729 62,311 11,303 13,444
Mar 153,881 165,123 11.8 12.5 5.4 7.8 56,347 62,321 12,217 10,842
Apr 160,530 140,016 12.3 10.6 5.5 9.5 57,544 51,872 12,518 8,399
May 159,596 135,686 12.2 10.6 5.5 7.8 57,610 50,979 11,300 9,445
Jun 141,927 156,138 10.8 11.8 5.5 6.7 54,357 56,384 11,438 11,067
Jul 154,214 151,556 11.7 11.5 5.3 6.6 56,506 56,221 11,904 10,809
Aug 159,563 149,871 12.0 11.2 5.3 6.4 57,713 57,135 13,791 10,094
Sep 152,135 153,479 11.5 11.5 5.4 6.7 56,985 59,262 13,317 7,166
Oct 183,154 13.8 5.4 64,611 13,796
Nov 150,752 11.4 5.6 59,033 11,959
Dec 144,252 10.9 5.8 58,961 10,794aOutpatient visit rate is calculated as the number of encounters per 100 service members.
F I G U R E 1 a . Mental and behavioral health outpatient visit rates: 2019 vs 2020
9.5
10.0
10.5
11.0
11.5
12.0
12.5
13.0
Jan Feb Mar Apr May June Jul Aug Sep
Out
patie
nt v
isit
rate
per
100
ser
vice
mem
bers
2020 Outpatient visit rate
2019 Outpatient visit rate

August 2021 Vol. 28 No. 08 MSMR Page 25
the same period in 2019. Average visit rates were slightly elevated for adjustment disor-ders (5% higher) and psychosocial circum-stances (2% higher), while outpatient visit rates for anxiety disorders averaged 13% higher from June through September 2020 as compared to the same time period in 2019 (Tables 3, 5, 8).
Telehealth usage for 8 out of 10 spe-cific MH/BH conditions also followed a pat-tern in which the percentage of outpatient care delivered via telehealth increased in March and April 2020 but declined in May 2020. Exceptions to this trend were seen for anxiety disorders and suicidal ideation (Tables 5, 10). In March 2020, the percentage
of outpatient care delivered by telehealth related to anxiety disorders increased by 53%, but declined over the remainder of the surveillance period while telehealth use for suicidal ideation spiked in April 2020 and subsequently declined through September 2020.
E D I T O R I A L C O M M E N T
In this analysis of MH/BH health care utilization prior to and during the first 6 months of the pandemic, telehealth usage increased during the early pandemic and was on average 25% higher during March–September 2020 as compared to the previ-ous year. In contrast, MH/BH outpatient visit rates declined modestly between March and May 2020 before rebounding in June and remaining stable for the remain-der of the surveillance period. The number of bed days attributable to MH/BH condi-tions also declined during March and April 2020 and was on average 30% lower during March–September 2020 as compared to the same period in the prior year. The pattern of decreased health care utilization and increased telehealth usage was almost uni-versal across all conditions surveyed during March and April 2020, although for most MH/BH conditions, health care utilization had rebounded by June of that year.
Notably, even after health care utiliza-tion for mental and behavioral health con-ditions had begun to rebound in June 2020, outpatient visit rates for anxiety disorders, adjustment disorders, and psychosocial cir-cumstances were higher than rates during the previous year.
There are few published studies of population-level health care utilization data with which to compare these findings. Patel et al. reported similar trends in outpa-tient care delivery and telehealth usage in a large, commercially insured population and, like this MSMR analysis, also dem-onstrated pronounced declines in the rate of in-person outpatient visits beginning in March 2020.14 Patel et al. also documented increases in telehealth usage during the same period with marked increases in the rate of telehealth usage beginning dur-ing the week of March 17 (coinciding with
F I G U R E 1 b. The number of bed days attributable to mental and behavioral healthcare: 2019 vs 2020
F I G U R E 1 c . Percentages of mental and behavioral outpatient care delivered by telehealth: 2019 vs 2020
-
2,000
4,000
6,000
8,000
10,000
12,000
14,000
16,000
Jan Feb Mar Apr May June Jul Aug Sep
No.
of b
ed d
ays
2020 Bed days
2019 Bed days
0.0
1.0
2.0
3.0
4.0
5.0
6.0
7.0
8.0
9.0
10.0
Jan Feb Mar Apr May June Jul Aug Sep
Tele
heal
th p
erce
ntag
e
2020 Telehealth percentage2019 Telehealth percentage

MSMR Vol. 28 No. 08 August 2021 Page 26
the expansion of Medicare reimburse-ment for telehealth during the COVID-19 pandemic).14
Data from the CDC’s National Syn-dromic Surveillance System Program (which represents approximately 70% of U.S. emer-gency department [ED] visits) were used in a cross-sectional study of ED visits for men-tal health before and during the pandemic.13
This study reported declines in overall ED visit volume after the implementation of stay-at-home orders in March which per-sisted through October 2020. However, visit rates for mental health, suicide attempts, drug overdoses, intimate partner violence and child abuse were higher in mid-March-October 2020 as compared to the same period during the prior year.13
The finding that telehealth usage for MH/BH conditions increased (albeit mod-estly) during the early period of the pan-demic, as well as its usage prior to the pandemic, demonstrates that the Mili-tary Health System (MHS) was prepared to deliver mental health services via telehealth and to increase telehealth services when needed. In fact, a recent analysis of tele-health usage for all ambulatory encounters in 2020 reported telehealth accounted for 19.2% of ambulatory encounters in active component service members.16 This is likely a reflection of the Defense Health Agency's (DHA's) ongoing expansion and standard-ization of telehealth service capabilities.17 The
F I G U R E 2 . Monthly outpatient visit rates and the percentage of visits delivered via telehealth for all mental and behavioral health conditions, active component, U.S. Armed Forces, January–September 2020
0.0
1.0
2.0
3.0
4.0
5.0
6.0
7.0
8.0
9.0
10.0
9.5
10.0
10.5
11.0
11.5
12.0
12.5
13.0
Jan-20 Feb-20 Mar-20 Apr-20 May-20 Jun-20 Jul-20 Aug-20 Sep-20
% of visits delivered by telehealth (dashed line)
Out
patie
nt v
isit
rate
per
100
ser
vice
mem
bers
Outpatient visit rate
Percentage of visits delivered via telehealth
(sol
id li
ne)
TRICARE Health Plan already covered most mental health care when provided via tele-health prior to the pandemic. Regional con-tractors for TRICARE had also established a network of telemental health service provid-ers.18 In response to COVID-19, TRICARE also began reimbursement for audio-only care, loosened cross-state licensure require-ments, and began waiving copays and cost shares for telehealth services for the duration of the public health emergency.10 TRICARE also began allowing more providers to offer telemedicine services.18 In addition the MHS developed Health Protection Condition-linked guidance to standardize behavioral health operations during the COVID-19 response including support services for active component service members and their families.10
While many studies have reported increased levels of anxiety, depression, alco-hol and substance misuse, and suicidal ide-ation in response to the pandemic, many of these studies relied on self-report data col-lected via survey.3–5 In contrast, this analy-sis used health care claims data to quantify health care utilization for specific MH/BH conditions which were identified via ICD-10 codes listed in the primary diagnostic posi-tion. To be included in this analysis, a service member would have to seek medical care and have that medical care documented in the electronic health record by a medical pro-vider. Mental or behavioral health symptoms
which did not result in a health care encoun-ter would not be captured in this analysis and is a limitation of this analysis.
There are likely active component mem-bers who experienced symptoms of anxiety, depression or other mental and behavioral health issues who are not represented in this analysis because they chose not to seek care related to these symptoms. Service mem-bers may have been able to cope with their symptoms using resources other than medi-cal care (e.g., chaplain, family, community, or command support). Service members may also have chosen to defer care due to the pan-demic. An estimated 40.9% of adults in the U.S. have avoided medical care during the pandemic with 31.5% forgoing routine care.6
A significant strength of this study is the ability to include the entire population of interest in the analysis. The DMSS captures virtually 100% of health care encounters for active component service members and includes both direct care (provided at mili-tary treatment facilities) and outsourced care (paid for by TRICARE).
MH/BH conditions can negatively affect service member readiness. Offering alterna-tive methods to in-person care for these con-ditions, such as telehealth, facilitates access to care which can help mitigate adverse impacts to health, well being, and readiness. Contin-ued surveillance is warranted to track MH/BH health care utilization during the later months of the pandemic to ensure that sufficient resources continue to be directed towards MH/BH care to support the health and readi-ness of active component service members.
Acknowledgements: The authors thank Mai-sha Toussaint, PhD (U.S. Army Public Health Center) for contributions including concep-tual contributions during initial study design and critical review and feedback on the manuscript.
Disclaimer: The contents, views or opinions expressed in this publication or presentation are those of the author(s) and do not neces-sarily reflect official policy or position of the Defense Health Agency, the Department of Defense (DOD), or Departments of the Army, Navy, or Air Force. The mention of any non-federal entity and/or its products is not to be construed or interpreted, in any manner, as federal endorsement of that non-federal entity or its products.

August 2021 Vol. 28 No. 08 MSMR Page 27
R E F E R E N C E S
1. Moreland A, Herlihy C, Tynan MA, et al. Timing of state and territorial COVID-19 stay-at-home or-ders and changes in population movement – Unit-ed States, March 1–May 31, 2020. MMWR Morb Mortal Wkly Rep. 2020; 69(35): 1198–1203. 2. Xiong J, Lipsitz O, Nasri F, et al. Impact of CO-VID-19 pandemic on mental health in the general population: A systematic review. J Affect Disord. 2020 Dec 1;277:55–64. 3. CDC, National Center for Health Statistics. In-dicators of anxiety or depression based on report-ed frequency of symptoms during the last 7 days. Household Pulse Survey. Atlanta, GA: US Depart-ment of Health and Human Services, CDC, Nation-al Center for Health Statistics; 2020. https://www.cdc.gov/nchs/covid19/pulse/mental-health.htm4. CDC, National Center for Health Statistics. Early release of selected mental health estimates based on data from the January–June 2019 Na-tional Health Interview Survey. Atlanta, GA: US Department of Health and Human Services, CDC, National Center for Health Statistics; 2020. https://www.cdc.gov/nchs/data/nhis/earlyrelease/ERmen-talhealth-508.pdf5. Czeisler MÉ, Lane RI, Petrosky E, et al. Mental health, substance use, and suicidal ideation dur-ing the COVID-19 pandemic - United States, June
24–30, 2020. MMWR Morb Mortal Wkly Rep. 2020 Aug 14;69(32):1049–1057.6. Czeisler MÉ, Marynak K, Clarke KEN, et al. Delay or avoidance of medical care because of COVID-19-related concerns - United States, June 2020. MMWR Morb Mortal Wkly Rep. 2020 Sep 11;69(36):1250–1257.7. Hoyer C, Ebert A, Szabo K, Platten M, Meyer-Lindenberg A, Kranaster L. Decreased utilization of mental health emergency service during the CO-VID-19 pandemic. Eur Arch Psychiatry Clin Neuro-sci. 2020 Jun 9:1–3.8. Verma S. Early Impact of CMS Expansion of medicare telehealth during COVID-19. Health Af-fairs Blog. Published July 15, 2020. Accessed May 10, 2021. https://www.healthaffairs.org/do/10.1377/hblog20200715.454789/full 9. Connolly SL, Stolzmann KL, Heyworth L, Weaver KR, Bauer MS, Miller CJ. Rapid increase in telemental health within the Department of Vet-erans Affairs during the COVID-19 pandemic [pub-lished online ahead of print, 2020 Sep 14]. Telemed J E Health. 2020;10.10. Bradford C. Department of Defense (DoD) mental health response to the COVID-19 pan-demic. Oral presentation at: AMSUS The Society of Federal Health Professionals Annual Meeting; December, 2020; Virtual. 11. Armed Forces Health Surveillance Division. Absolute and relative morbidity burdens attribut-able to various illnesses and injuries, active com-
ponent, U.S. Armed Forces, 2020. MSMR. 2021; 28(5): 2–9.12. Mandelkorn U, Genzer S, Choshen-Hillel S, et al. Escalation of sleep disturbances amid the CO-VID-19 pandemic: a cross-sectional international study. J Clin Sleep Med. 2021;17(1):45–53. 13. Alexander N. What's more general than a whole population? Emerg Themes Epidemiol. 2015;12:11. 14. Patel SY, Mehrotra A, Huskamp HA, Uscher-Pines L, Ganguli I, Barnett ML. Trends in outpa-tient care delivery and telemedicine during the COVID-19 pandemic in the US. JAMA Intern Med. 2021;181(3):388–391.15. Holland KM, Jones C, Vivolo-Kantor AM, et al. Trends in US Emergency Department visits for mental health, overdose, and violence outcomes before and during the COVID-19 pandemic. JAMA Psychiatry. 2021;78(4):372–379.16. Armed Forces Health Surveillance Division. Ambulatory visits, active component, U.S. Armed Forces, 2020. MSMR. 2021; 28(5): 18–25.17. Defense Health Board. Modernization of the TRICARE benefit. Published 2020. Accessed Aug. 13, 2021. https://health.mil/Reference-Center/Re-ports/2020/11/05/Modernization-of-the-TRICARE-Benefit 18. Telemental Health Services. Accessed August 13, 2021. Updated 6/18/2020. https://tricare.mil/CoveredServices/IsItCovered/TelementalHealth
T A B L E 3 . Healthcare utilization attributable to adjustment disorder, U.S. Armed Forces, January 2019–September 2020
No. outpatient encounters Outpatient visit ratea % telehealth Individuals affected Bed days
Year 2019 2020 2019 2020 2019 2020 2019 2020 2019 2020
Month
Jan 40,561 47,246 3.1 3.6 4.4 4.6 20,089 24,164 2,965 4,149
Feb 38,285 45,045 2.9 3.4 4.2 4.4 19,542 23,280 2,519 3,444
Mar 41,447 46,798 3.2 3.5 4.3 6.5 20,575 23,294 2,869 2,950
Apr 43,175 39,990 3.3 3.0 4.3 8.0 20,966 19,140 3,005 1,885
May 42,411 37,901 3.2 2.9 4.4 6.4 20,879 18,645 2,906 2,421
Jun 38,042 44,214 2.9 3.4 4.3 5.5 19,669 20,914 2,927 2,840
Jul 41,823 43,802 3.2 3.3 4.2 5.4 20,727 21,022 3,055 2,994
Aug 43,937 42,885 3.3 3.2 4.4 5.2 21,426 21,262 3,901 2,857
Sep 42,627 44,355 3.2 3.3 4.4 5.6 21,215 22,002 3,548 2,881
Oct 51,480 3.9 4.4 24,328 3,989
Nov 41,645 3.1 4.7 21,860 3,062
Dec 39,565 3.0 5.0 21,812 2,589
aOutpatient visit rate is calculated as the number of outpatient visits per 100 service members.

MSMR Vol. 28 No. 08 August 2021 Page 28
T A B L E 4 . Healthcare utilization attributable to alcohol use disorders, U.S. Armed Forces, January 2019–September 2020
T A B L E 5 . Healthcare utilization attributable to anxiety disorders, U.S. Armed Forces, January 2019–September 2020
No. outpatient encounters Outpatient visit ratea % telehealth Individuals affected Bed days
Year 2019 2020 2019 2020 2019 2020 2019 2020 2019 2020
Month
Jan 28,981 31,028 2.2 2.3 4.5 5.0 6,838 7,680 4,246 3,320
Feb 28,176 30,770 2.2 2.3 3.9 4.0 6,754 7,491 3,497 3,903
Mar 30,989 31,096 2.4 2.4 4.0 7.6 7,114 7,612 3,951 2,946
Apr 32,680 26,682 2.5 2.0 4.4 10.2 7,239 6,853 4,033 2,876
May 33,005 26,638 2.5 2.0 4.4 8.1 7,444 6,828 3,435 3,575
Jun 28,856 29,571 2.2 2.2 4.2 6.4 7,078 7,054 3,103 3,097
Jul 30,854 28,494 2.3 2.2 4.0 6.4 7,112 6,853 3,357 3,026
Aug 31,157 27,554 2.4 2.1 4.2 6.1 7,180 6,803 3,133 2,816
Sep 28,839 28,005 2.2 2.1 4.2 6.3 7,045 6,963 3,320 1,339
Oct 34,982 2.6 4.3 7,675 3,865
Nov 28,959 2.2 4.2 7,253 3,527
Dec 27,864 2.1 4.6 7,249 3,750
aOutpatient visit rate is calculated as the number of visits per 100 service members.
No. outpatient encounters Outpatient visit ratea % telehealth Individuals affected Bed days
Year 2019 2020 2019 2020 2019 2020 2019 2020 2019 2020
Month
Jan 18,837 20,803 1.5 1.6 6.3 5.7 10,873 12,538 353 385
Feb 17,310 19,544 1.3 1.5 6.1 5.3 10,407 12,014 323 405
Mar 18,627 20,224 1.4 1.5 6.2 8.0 10,904 12,193 260 250
Apr 19,319 18,158 1.5 1.4 6.2 7.9 11,226 10,185 543 182
May 19,248 17,584 1.5 1.3 6.1 6.8 11,095 10,000 250 248
Jun 16,946 20,406 1.3 1.6 6.4 6.1 10,409 11,326 212 311
Jul 18,053 19,811 1.4 1.5 6.2 6.0 10,865 11,249 285 333
Aug 18,630 19,876 1.4 1.5 5.9 6.0 11,094 11,522 320 262
Sep 17,834 20,736 1.3 1.6 6.5 5.8 10,911 12,198 203 211
Oct 21,692 1.6 6.0 12,632 291
Nov 18,161 1.4 6.1 11,342 228
Dec 17,634 1.3 6.3 11,230 278
aOutpatient visit rate is calculated as the number of visits per 100 service members.
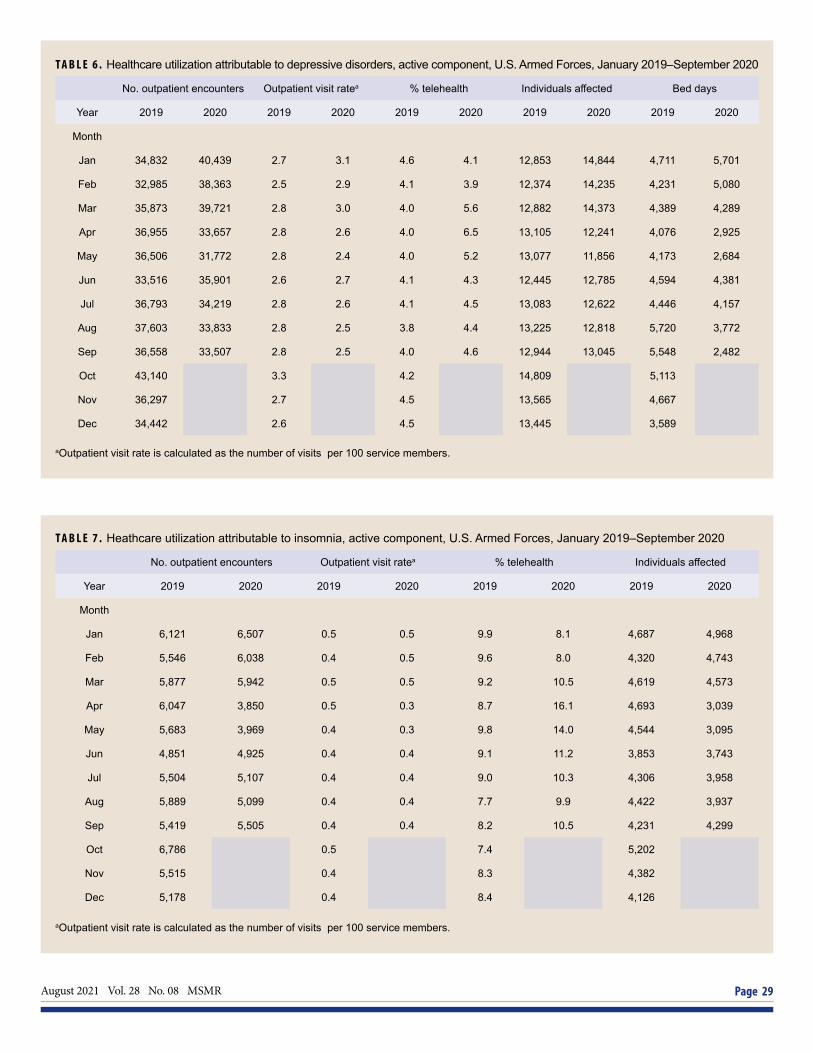
August 2021 Vol. 28 No. 08 MSMR Page 29
T A B L E 6 . Healthcare utilization attributable to depressive disorders, active component, U.S. Armed Forces, January 2019–September 2020
T A B L E 7 . Heathcare utilization attributable to insomnia, active component, U.S. Armed Forces, January 2019–September 2020
No. outpatient encounters Outpatient visit ratea % telehealth Individuals affected Bed days
Year 2019 2020 2019 2020 2019 2020 2019 2020 2019 2020
Month
Jan 34,832 40,439 2.7 3.1 4.6 4.1 12,853 14,844 4,711 5,701
Feb 32,985 38,363 2.5 2.9 4.1 3.9 12,374 14,235 4,231 5,080
Mar 35,873 39,721 2.8 3.0 4.0 5.6 12,882 14,373 4,389 4,289
Apr 36,955 33,657 2.8 2.6 4.0 6.5 13,105 12,241 4,076 2,925
May 36,506 31,772 2.8 2.4 4.0 5.2 13,077 11,856 4,173 2,684
Jun 33,516 35,901 2.6 2.7 4.1 4.3 12,445 12,785 4,594 4,381
Jul 36,793 34,219 2.8 2.6 4.1 4.5 13,083 12,622 4,446 4,157
Aug 37,603 33,833 2.8 2.5 3.8 4.4 13,225 12,818 5,720 3,772
Sep 36,558 33,507 2.8 2.5 4.0 4.6 12,944 13,045 5,548 2,482
Oct 43,140 3.3 4.2 14,809 5,113
Nov 36,297 2.7 4.5 13,565 4,667
Dec 34,442 2.6 4.5 13,445 3,589
aOutpatient visit rate is calculated as the number of visits per 100 service members.
No. outpatient encounters Outpatient visit ratea % telehealth Individuals affected
Year 2019 2020 2019 2020 2019 2020 2019 2020
Month
Jan 6,121 6,507 0.5 0.5 9.9 8.1 4,687 4,968
Feb 5,546 6,038 0.4 0.5 9.6 8.0 4,320 4,743
Mar 5,877 5,942 0.5 0.5 9.2 10.5 4,619 4,573
Apr 6,047 3,850 0.5 0.3 8.7 16.1 4,693 3,039
May 5,683 3,969 0.4 0.3 9.8 14.0 4,544 3,095
Jun 4,851 4,925 0.4 0.4 9.1 11.2 3,853 3,743
Jul 5,504 5,107 0.4 0.4 9.0 10.3 4,306 3,958
Aug 5,889 5,099 0.4 0.4 7.7 9.9 4,422 3,937
Sep 5,419 5,505 0.4 0.4 8.2 10.5 4,231 4,299
Oct 6,786 0.5 7.4 5,202
Nov 5,515 0.4 8.3 4,382
Dec 5,178 0.4 8.4 4,126
aOutpatient visit rate is calculated as the number of visits per 100 service members.

MSMR Vol. 28 No. 08 August 2021 Page 30
T A B L E 8 . Healthcare utilization attributable to psychosocial circumstances, active component, U.S. Armed Forces, January 2019– September 2020
T A B L E 9 . Healthcare utilization attributable to substance use disorders, active component, U.S. Armed Forces, January 2019– September 2020
No. outpatient encounters Outpatient visit ratea % telehealth Individuals affected
Year 2019 2020 2019 2020 2019 2020 2019 2020
Month
Jan 15,694 17,915 1.2 1.4 11.7 12.2 9,006 10,442
Feb 14,482 16,928 1.1 1.3 11.9 12.0 8,549 9,922
Mar 15,718 16,723 1.2 1.3 12.0 16.2 9,126 9,904
Apr 16,829 14,059 1.3 1.1 12.1 19.8 9,610 7,758
May 17,602 13,955 1.3 1.1 11.8 16.5 9,916 7,829
Jun 15,198 16,964 1.2 1.3 11.9 15.2 9,019 9,087
Jul 16,302 15,939 1.2 1.2 11.5 14.4 9,300 8,997
Aug 17,140 16,175 1.3 1.2 12.3 13.7 9,608 9,323
Sep 15,837 17,105 1.2 1.3 11.7 13.7 9,404 9,646
Oct 19,494 1.5 11.3 10,863
Nov 15,813 1.2 11.7 9,518
Dec 15,481 1.2 12.0 9,463
aOutpatient visit rate is calculated as the number of visits per 100 service members.
No. outpatient encounters Outpatient visit ratea % telehealth Individuals affected Bed days
Year 2019 2020 2019 2020 2019 2020 2019 2020 2019 2020
Month
Jan 2,210 1,903 0.2 0.1 6.2 6.9 583 522 548 237
Feb 2,087 1,729 0.2 0.1 6.0 6.4 550 524 513 320
Mar 2,517 1,835 0.2 0.1 6.2 8.0 640 554 577 195
Apr 2,747 1,586 0.2 0.1 6.3 9.8 654 457 498 389
May 2,553 1,691 0.2 0.1 6.2 7.3 641 488 314 189
Jun 2,033 1,667 0.2 0.1 5.7 8.2 591 499 425 215
Jul 2,187 1,443 0.2 0.1 6.0 7.8 585 451 546 140
Aug 2,269 1,478 0.2 0.1 5.2 7.1 552 432 551 203
Sep 1,970 1,341 0.2 0.1 5.8 10.1 506 443 500 75
Oct 2,220 0.2 5.5 558 389
Nov 1,768 0.1 4.3 501 337
Dec 1,706 0.1 5.3 500 463
aOutpatient visit rate is calculated as the number of visits per 100 service members.

August 2021 Vol. 28 No. 08 MSMR Page 31
T A B L E 1 0 . Healthcare utilization attributable to suicidal ideation, active component, U.S Armed Forces, January 2019–September 2020
No. outpatient encounters Outpatient visit ratea % telehealth Individuals affected Bed days
Year 2019 2020 2019 2020 2019 2020 2019 2020 2019 2020
Month
Jan 2,073 2,167 0.2 0.2 3.5 5.4 1,371 1,545 336 129
Feb 1,882 2,203 0.1 0.2 2.3 4.5 1,236 1,531 200 262
Mar 2,107 1,973 0.2 0.2 2.8 4.2 1,383 1,423 138 173
Apr 2,115 1,325 0.2 0.1 2.5 7.1 1,347 897 312 101
May 1,916 1,570 0.2 0.1 4.1 5.7 1,258 1,050 194 275
Jun 1,812 1,639 0.1 0.1 3.5 4.6 1,206 1,157 138 207
Jul 1,997 1,842 0.2 0.1 4.0 5.3 1,360 1,318 178 133
Aug 2,127 2,068 0.2 0.2 3.7 5.2 1,496 1,392 131 142
Sep 2,216 2,068 0.2 0.2 2.7 4.6 1,582 1,425 164 149
Oct 2,409 0.2 4.4 1,666 122
Nov 1,920 0.1 4.5 1,333 109
Dec 1,672 0.1 4.6 1,180 96
aOutpatient visit rate is calculated as the number of visits per 100 service members.

Medical Surveillance Monthly Report (MSMR)Armed Forces Health Surveillance Division11800 Tech Road, Suite 220 Silver Spring, MD 20904
Acting Chief, Armed Forces Health Surveillance DivisionJose L. Sanchez, MD, MPH
EditorFrancis L. O’Donnell, MD, MPH
Contributing EditorsLeslie L. Clark, PhD, MSShauna Stahlman, PhD, MPH
Writer/EditorValerie F. Williams, MA, MS
Managing/Production EditorDenise O. Daniele, MS
Data AnalysisAlexis A. Mcquistan, MPH
Layout/DesignDarrell Olson
Editorial Oversight CAPT Natalie Y. Wells, MD, MPH (USN)Mark V. Rubertone, MD, MPH
MEDICAL SURVEILLANCE MONTHLY REPORT (MSMR), in continuous publication since 1995, is produced by the Armed Forces Health Surveillance Division (AFHSD). AFHSD is a designated public health authority within the Defense Health Agency. The MSMR provides evidence-based estimates of the incidence, distribution, impact, and trends of illness and injuries among U.S. military members and associated populations. Most reports in the MSMR are based on summaries of medical administrative data that are routinely provided to the AFHSD and integrated into the Defense Medical Surveillance System for health surveillance purposes.
Archive: Past issues of the MSMR are available as downloadable PDF files at www.health.mil/MSMRArchives.
Online Subscriptions: Submit subscription requests at www.health.mil/MSMRSubscribe.
Editorial Inquiries: Call (301) 319-3240 or email dha.ncr.health-surv.mbx.msmr@ mail.mil.
Instructions for Authors: Information about article submissions is provided at www.health.mil/MSMRInstructions.
All material in the MSMR is in the public domain and may be used and reprinted without permission. Citation formats are available at www.health.mil/MSMR.
Opinions and assertions expressed in the MSMR should not be construed as reflecting official views, policies, or positions of the Department of Defense or the United States Government.
Follow us: www.facebook.com/AFHSDPAGE
http://twitter.com/AFHSDPAGE
ISSN 2158-0111 (print) ISSN 2152-8217 (online)