Mengchan Sun 2017 - COnnecting REpositories · de ojos personalizados. Las cataratas son el...
230
1 Mengchan Sun 2017
Transcript of Mengchan Sun 2017 - COnnecting REpositories · de ojos personalizados. Las cataratas son el...

1
Mengchan Sun
2017

Biometric measurements in the crystalline lens: Applications in cataract surgery
2

3
INSTITUTO DE OFTALMOBIOLOGÍA APLICADA
Programa de Doctorado en Ciencias de la Visión
TESIS DOCTORAL:
BIOMETRIC MEASUREMENTS IN THE
CRYSTALLINE LENS: APPLICATIONS IN
CATARACT SURGERY
Presentada por Mengchan Sun
para optar al grado de doctor por la Universidad de Valladolid
Dirigida por:
SUSANA MARCOS CELESTINO

Biometric measurements in the crystalline lens: Applications in cataract surgery
4

5

Biometric measurements in the crystalline lens: Applications in cataract surgery
6
The failures and reverses which await men - and one after
another sadden the brow of youth - add a dignity to the
prospect of human life, which no Arcadian success would do.
— Henry David Thoreau
尽管失败和挫折等待着人们,一次次地夺走青春的容颜,但却给人生的前景增添了
一份尊严,这是任何顺利的成功都不能做到的。
献给我的父母们(孙国平,张菊萍,郑俭,沈璐琳)和我的爱人(郑哲)
Instituto de Óptica "Daza de Valdés" (IO-CSIC) 2017
Cover designed by Mrs. Songli Zhang

Table of Contents
7
TABLE OF CONTENTS
BIOMETRIC MEASUREMENTS IN THE CRYSTALLINE
LENS: APPLICATIONS IN CATARACT SURGERY
CHAPTER 1 INTRODUCTION ................................................................... 15
RESUMEN ................................................................................................. 17
1.1 Motivation ............................................................................................ 19
1.2 The optics of the human eye ................................................................ 22
1.2.1 General structure and optical properties of normal young eyes ...................... 22
1.2.2 Cornea: surface shape ...................................................................................... 23
1.2.3 Crystalline lens: structure, refractive index, surface shape and lens volume .. 26
1.2.4 Iris, Pupil and Ocular biomechanics ................................................................ 30
1.2.5 Pupillary axis, Visual axis and Fovea .............................................................. 31
1.2.6 Refractive errors .............................................................................................. 33
1.2.7 Optical aberrations ........................................................................................... 34
1.3 The aging eye ....................................................................................... 37
1.3.1 Presbyopia: accommodation loss of the crystalline lens ................................. 37
1.3.2 Cataract: transparency loss of the crystalline lens and clinical solutions ........ 38
1.3.3 IOL power calculation ..................................................................................... 40
1.4 Ocular imaging techniques ................................................................... 42
1.4.1 Scheimpflug, ultrasonography, MRI, and Purkinje imaging system ............... 42
1.4.2 Optical Coherence Tomography (OCT) .......................................................... 43
1.4.3 Aberrometry .................................................................................................... 46
1.5 Customized eye modeling: linking geometry and aberrations ............. 49
1.5.1 Phakic eye: Compensation between corneal and internal aberrations ............. 49
1.5.2 Pseudophakic eye: contributing factors to optical degradation in eyes implanted
with IOLs .................................................................................................................. 51
1.6 Goals of this thesis and hypothesis ...................................................... 53
1.6.1 Goals of this Thesis ......................................................................................... 53
1.6.2 Hypothesis ....................................................................................................... 54
1.7. Structure of this thesis ......................................................................... 55

Biometric measurements in the crystalline lens: Applications in cataract surgery
8
CHAPTER 2 EXPERIMENTAL METHODS, COMPUTATIONAL TECHNIQUES
AND OTHER TYPES OF VALIDATION ........................................................ 57
RESUMEN ................................................................................................. 59
2.1 3D-Anterior segment spectral domain OCT ........................................ 61
2.1.1 Custom setup ................................................................................................... 61
2.1.2 Quantification tools ......................................................................................... 64
2.1.3 Purkinje-like OCT en-face reflection image to measure lens tilt and decentration
.................................................................................................................................. 69
2.2 Total aberration measurement: Laser Ray Tracing (LRT) ................... 73
2.2.1 LRT setup ........................................................................................................ 73
2.2.2 Control and analysis software.......................................................................... 75
2.3 Other techniques for validation ............................................................ 76
2.3.1 Pentacam: Scheimpflug camera for the validation of corneal topography ...... 76
2.3.2 Sensofar PLu2300: Non-contact profilometry for the validation of IOL
geometry ex-vivo ...................................................................................................... 77
2.3.3 Water-cell physical model eye for the validation of eye rotation, IOL tilt and
decentration .............................................................................................................. 78
2.3.4 Custom computer model eyes ......................................................................... 80
2.4 Optical quality metrics ......................................................................... 82
2.4.1 Spot diagrams .................................................................................................. 82
2.4.2 Zernike coefficients and RMS wavefront error ............................................... 83
2.4.3 Modulation transfer function, Strehl and visual Strehl.................................... 84
2.5 Ex vivo and in vivo measurements ....................................................... 86
2.5.1 Lens specimens, preparation and experimental protocol ................................. 86
2.5.2 Patients ............................................................................................................ 87
2.6 Virtual ray tracing calculations ............................................................ 88
2.6.1 Zemax routines ................................................................................................ 88
2.6.2 MATLAB routines .......................................................................................... 91
CHAPTER 3 INTRAOCULAR LENS ALIGNMENT FROM AN EN-FACE OCT
IMAGE PURKINJE-LIKE METHOD ............................................................ 97
RESUMEN ................................................................................................. 99
3.1 Introduction ........................................................................................ 101

Table of Contents
9
3.2 Materials and Methods ....................................................................... 103
3.2.1. Laboratory-Based SD-OCT System ............................................................. 103
3.2.2. Artificial eye ................................................................................................. 103
3.2.3. Patients ......................................................................................................... 103
3.2.4. OCT image processing ................................................................................. 103
3.2.5 Purkinje-like OCT method ............................................................................ 104
3.3 Results ................................................................................................ 105
3.3.1. Validation on a water-cell physical eye model ............................................. 105
3.3.2. IOL tilt and decentration in patients ............................................................. 105
3.4 Discussion ........................................................................................... 110
CHAPTER 4 OCT 3D SURFACE TOPOGRAPHY OF ISOLATED HUMAN
CRYSTALLINE LENSES ........................................................................... 113
RESUMEN ............................................................................................... 115
4.1 Introduction ........................................................................................ 117
4.2 Methods .............................................................................................. 118
4.2.1 Lens specimens and preparation .................................................................... 118
4.2.2 Experimental sOCT setup and experimental protocols ................................. 118
4.2.3 Lens surface elevations .................................................................................. 119
4.2.4 Lens orientation ............................................................................................. 119
4.2.5 Power vector analysis .................................................................................... 120
4.2.6 Correlation analysis ....................................................................................... 120
4.3 Results ................................................................................................ 121
4.3.1 Lens surface elevation maps .......................................................................... 121
4.3.2 Lens radii of curvature and asphericity: anterior/posterior lens relationships and
changes with age ..................................................................................................... 123
4.3.3 Changes of lens surface astigmatism and relative astigmatic angle with age124
4.3.4 Lens elevation high order Zernike terms: anterior and posterior lens
relationships ............................................................................................................ 127
4.3.5 Lens elevation high order Zernike terms: changes with age ......................... 128
4.3.6 Relative contribution of different Zernike terms to the lens surface elevations
................................................................................................................................ 129
4.4 Discussion ........................................................................................... 131

Biometric measurements in the crystalline lens: Applications in cataract surgery
10
CHAPTER 5 FULL 3D OCT-BASED PSEUDOPHAKIC CUSTOM COMPUTER
EYE MODEL ........................................................................................... 133
RESUMEN ............................................................................................... 135
5.1 Introduction ........................................................................................ 137
5.2 Methods .............................................................................................. 139
5.2.1 Patients, surgery and measurements .............................................................. 139
5.2.2 3D anterior segment OCT ............................................................................. 139
5.2.3 Ex vivo IOL geometry: non-contact profilometry ......................................... 141
5.2.4 Customized eye models ................................................................................. 141
5.2.5 Total aberration measurements: LRT ............................................................ 141
5.3 Results................................................................................................. 143
5.3.1 OCT-based anterior segment geometry in pseudophakic eyes ...................... 143
5.3.2 Comparing OCT-based IOL geometry in vivo with profilometry ex vivo ... 145
5.3.3 Ocular aberrations: LRT vs. Computer Ray Tracing on custom model eye . 145
5.3.4 Corneal/IOL compensation............................................................................ 148
5.3.5 Effect of IOL tilt and decentration on optical quality ................................... 149
5.4 Discussion ........................................................................................... 151
CHAPTER 6 OCT-BASED RAY TRACING ON PSEUDOPHAKIC EYES TO
IDENTIFY OPTIMAL IOL CENTRATION .................................................. 155
RESUMEN ............................................................................................... 157
6.1. Introduction ....................................................................................... 159
6.2. Methods ............................................................................................. 161
6.2.1. Patients, surgery and measurements ............................................................. 161
6.2.2. Laboratory setup: OCT, LRT and Experimental protocols .......................... 161
6.2.3. Purkinje-Like OCT Method.......................................................................... 161
6.2.4. Full OCT-based customized eye models ...................................................... 162
6.2.5. Estimation of optimal IOL decentration ....................................................... 162
6.3. Results................................................................................................ 164
6.3.1 Measured eye rotation, IOL tilt and decentration .......................................... 164
6.3.2 Change of optical quality with IOL decentration using computer eye models
with symmetric aspheric cornea ............................................................................. 164
6.3.3 Change of optical quality with IOL decentration using computer eye models
with real corneas ..................................................................................................... 165

Table of Contents
11
6.3.4. Maximum Visual Strehl and Optimal IOL decentration .............................. 167
6.3.5. Interactions of eye rotation, IOL tilt and IOL decentration and corneal
irregularities on astigmatism, trefoil and coma ...................................................... 169
6.3.6. Residual defocus and residual astigmatism .................................................. 171
6.4. Discussion .......................................................................................... 174
CHAPTER 7 CONCLUSIONS ................................................................... 175
RESUMEN ............................................................................................... 177
7.1 Achievements: .................................................................................... 179
7.2 Conclusions ........................................................................................ 180
7.3 Summary ............................................................................................. 183
7.4 Future work ........................................................................................ 184
CHAPTER 8 PUBLICATIONS AND ACTIVITIES DURING THE PHD PERIOD
............................................................................................................. 187
8.1 Publications ........................................................................................ 189
8.2 Talks and posters presented in the conferences ................................. 191
8.3 Visits and Stays in Research Institutions, Hospital and Companies .. 192
FIGURE LIST ......................................................................................... 193
TABLE LIST .......................................................................................... 201
BIBLIOGRAPHY ..................................................................................... 194
ACKNOWLEDGMENTS ............................................................................... 225

Biometric measurements in the crystalline lens: Applications in cataract surgery
12

List of Abbreviations
13
LIST OF ABBREVIATIONS
A A = Amplitude
ACD = Anterior Chamber Depth
A-scan US= A-scan
ultrasonography
A-G=Purkinje weighting coefficients
AL = Axial Length
A-IOL = Accommodative-IOL
B B-scan US= B-scan ultrasonography
BS = Beam Splitter
BST= Banc de Sang i Teixits
C CSF = Contrast Sensitivity Function
CSIC= Consejo Superior de
Investigaciones Científicas
CCD = Charge Couple Device
C = Curvature (=1/R)
D DoF = Depth-of-focus
DIA= the diameter of the lens at the
equatorial plane
D = Diopters
DDE= Dynamic Data exchange
DoF = Depth-of-Focus
DLP = Digital-Light-Processing
E ELP= Estimated Lens Position
ER= Eye Rotation
EPP= Equatorial plane position
equatorial plane
F FJD= Fundación Jiménez Díaz Hospital
FFT = Fast Fourier Transform
FWHM = full-width-half-maximum
FD-OCT = Fourier-Domain OCT
FC = Fiber Coupler
G GEO=geometric spot
GRIN=Gradient refractive index
H H = Horizontal
H-S = Hartmann-Shack
HOA= High order aberration
I I = Intensity
IOL=intraocular lens
IR = Infrared
IT= IOL Tilt
ID= IOL Decentration
ILT= intraocular lens thickness
ILP= intraocular lens position
ICRS = Intracorneal ring segment
K K = Conic constant
L L = Lens
LRT = Laser Ray Tracing
LOS= Line of sight
LCA = Longitudinal Chromatic
Aberration
LT= Lens thickness
LED = Light Emitting Diode
M M = Mirror
MTF = Modulation Transfer Fuction
MRI = Magnetic Resonance Imaging
M-IOL= multifocal IOL
N NDF = Neutral Density Filter
N = Nasal
NA = Numerical Aperture

Biometric measurements in the crystalline lens: Applications in cataract surgery
14
O OA= Optical axis
OCT = Optical Coherence Tomography
OS= Right eye
OD= Left eye
OPD= Optical path difference
OI = Optical Isolator
OSA= Optical Society of America
OTF = Optical Transfer Function
P PA= Pupillary axis
PI=reflection of Purkinje image from the
anterior corneal surface
PII=reflection of Purkinje image from the
posterior corneal surface
PIII=reflection of Purkinje image from the
anterior lens surface
PIV=reflection of Purkinje image from the
posterior lens surface
PSF = Point Spread Function
PPMA = Polymethyl-methacrilate
Wavefront Analysis
PC = Polarization Controller
Q Q = Q-value, asphericity
R ,R r = Radius
RMS = Root Mean Square
RNFL= Retinal Nerve Fiber Layer
S sOCT=Sprectral Optical Coherent
Tomography
SD= Standard deviation
SA= Surface area
SR = Strehl Ratio
SNR = Signal-to-Noise Ratio
SLD = Superluminiscent Diode
SD-OCT = Spectral-Domain OCT
SS-OCT = Swept-Source OCT
T TCA = Transverse Chromatic Aberration
T= Temporal
TD-OCT = Time-Domain OCT
V VOL= lens volume
VA= Visual axis
VA = Visual Acuity .vs = versus, compared to
V = Vertical
VS = Visual Strehl OTF
X X, Y, Z = CARTESIAN COORDINATES
= angle of rotation of the eye = angle of IOL tilt d = decentration =angle of the off-axis position of the
fovea = Wavelength
(x, y)W = Wave aberration in Cartesian
coordinates m
nZ= Zernike polynomial in Cartesian
coordinates
φ = phase (wavefront aberration)
f = Focal length n = refractive index s = seconds mm= milimeters
m = microns nm = nanometers
deg = degrees
, = Polar coordin
3D=Three dimensional

Chapter 1
Introduction
15
CHAPTER 1
INTRODUCTION

Biometric measurements in the crystalline lens: Applications in cataract surgery
16

Chapter 1
Introduction
17
RESUMEN
En la introducción de esta tesis, se lleva a cabo una revisión del conocimiento sobre la
óptica de la lente humana, el envejecimiento del ojo, técnicas de imagen ocular, modelado
de ojos personalizados. Las cataratas son el resultado de la opacificación del cristalino del
ojo con el envejecimiento, que impiden la visión clara, y son una de las principales causas
de baja visión en los países desarrollados y en desarrollo. La cirugía de cataratas involucra
el reemplazo del cristalino por una lente intraocula (IOL) artificial. Si bien las tecnologías
actuales, y en particular la selección de la la lente intraocularm, son seguras y eficaces para
la mayoría de los pacientes, existen amplias posibilidades de mejora. En particular, los
métodos actuales de cálculo de potencia de la IOL se basan en fórmulas regresivas, no se
adaptan a pacientes con geometrías corneales especiales, y no se adaptan bien a lentes con
geometría cada vez más sofisticada. Además de la pérdida de la transparencia del cristalino,
antes en la vida ocurre da una périda de la capacidad acomodativa como parte del proceso
de envejecimiento natural. El capítulo resume el estado del arte sobre el conocimiento del
cristalino, la acomodación y envejecimiento, así como de los distintos diseños de lentes
intraoculares en el mercado. Las IOLs actuales compensan los errores de refracción e
incluso la compensación de la aberración esférica corneal y, cada vez más, apuntan a imitar
la función de la lente en un ojo joven, incluyendo la optimización óptica e incluso el
alojamiento.
La medición precisa de la geometría del cristalino es crucial en la comprensión de sus
propiedades ópticas y de los cambios físicos con la acomodación y la presbicia. En los
últimos 20 años se han desarrollado múltiples tecnologías para la medición de la anatomía
y aberraciones oculares de los componentes ópticos del ojo, y se han adquirido importantes
conocimientos sobre su contribución a la degradación de la calidad de imagen. Las técnicas
avanzadas de imagen ocular implementadas en el Laboratorio de Óptica Visual y
Biophotonics incluyen sistemas de rayos láser para la medición de aberraciones oculares;
Un sistema de trazado de rayos láser y algoritmos de reconstrucción de la distribución del
índice de gradiente en la lente cristalina; Un sensor de frente de onda Hartmann-Shack para
medir aberraciones oculares; Un sistema de imagen de Purkinje para medir, in vivo, los
radios de curvatura de las superficies de las lentes anterior y posterior, y la inclinación y
descentración de las lentes cristalinas e intraoculares; Un sistema de imagen de segmento
anterior de Scheimpflug, con algoritmos de corrección de distorsión óptica y geométrica y
en particular, sistemas de tomografía de coherencia óptica de segmento anterior (OCT),
proporcionando información ocular 3D cuantitativa desde la córnea anterior a la lente
cristalina posterior / IOL.
Un objetivo principal de la cirugía moderna de la catarata / presbicia es lograr el resultado
refractivo postoperatorio deseado y las mejoras en la predictibilidad del resultado refractivo
se han debido a refinamientos en la técnica quirúrgica, particularmente pequeñas incisiones
y una posición postoperatoria de IOL más predecible. Esta tesis pretende mejorar las
actuales metodologías que relacionan propiedades geométricas y ópticas del ojo a través
del modelo de ojo computacional personalizado, cuantificar las alineaciones de la IOL
después de la cirugía, y predecir con exactitud las aberraciones oculares mediante el
modelado virtual del trazado de rayos, Estos datos permitirán seleccionar la lente óptima
para un paciente, así como el centrado óptico. Esta tesis hace uso de una técnica OCT
cuantitativa de desarrollo propio que permite la construcción de modelos de ojo específicos
para cada paciente con este propósito.

Biometric measurements in the crystalline lens: Applications in cataract surgery
18

Chapter 1
Introduction
19
1.1 Motivation
The human eye contains enough complexity to warrant specialized attention and care
beyond the duties of a general practitioner. According to the latest WHO assessment, 285
million patients in the world have a visual disability (including blindness and low vision),
and cataracts are responsible for 51% of world blindness, which represents about 20 million
people (2010). Cataracts are the clouding of the lens of the eye that prevents clear vision, a
process related to aging, and are also a leading cause of low vision in both developed and
developing countries. Although cataracts can be surgically removed, in many countries
barriers exist that prevent patients access to this surgery. In spite of the progress made in
surgical techniques in many countries during the last ten years, cataracts remain the leading
cause of visual impairment outside of developed countries (47.9%), while the visual
demands of patients in developed countries require a good optical quality for all distances.
Time tested, safe and effective technologies that could restore near normal vision to a large
majority of those affected are available. However, precise desirable levels of post-operative
visual outcomes may be difficult to define, and reliance simply on the numbers of cataract
operations performed would result in a state of undesired complacency.
The crystalline lens of the eye is an exquisite optical element, with aspheric shapes, a
gradient index structure and capability of reshaping to focus near and far objects at a young
age. With aging, the fine optical tuning between corneal and crystalline lens aberrations is
lost. Crystalline lenses experience a decrease in the amplitude of accommodation or lose
accommodative ability as part of the natural aging process. Accommodation is the process
by which the vertebrate eye changes optical power to maintain a clear image as its distance
varies. Further with age, the accommodation capacity is lost due to lens stiffening
(presbyopia) (Pascolini, Mariotti et al. 2004, Resnikoff, Pascolini et al. 2004, Resnikoff,
Pascolini et al. 2008). Converging or plus lenses for imaging near objects, which only work
in spectacles or contact lenses, is one of the management techniques of presbyopia.
However, changes in prescriptions are required every two to three years for presbyopia.
The lens becomes opaque, and it needs to be replaced by an intraocular lens (IOL). In the
middle of the 20th century, English ophthalmologist Sir Nicholas Harold Lloyd Ridley first
introduced an artificial IOL (Letocha and Pavlin 1999). A variety of different kinds of
surgical procedures have been considered for restoring accommodation to the presbyopic
eye such as accommodative intraocular lens (IOLs) implantation. IOLs compensate for
refractive errors and, increasingly, aim at mimicking the function of the lens in a young
eye, including optical tuning and even accommodation. More details about the aging eye
will be described in Section 1.3.
Accurate measurement of the lens geometry is crucial in the understanding of crystalline
lens optical properties and of the physical changes of the lens in accommodation and
presbyopia. The lenticular accommodative biometric data most widely available refer to
axial changes in the anterior segment. Anterior movement of the anterior crystalline lens
surface and an increase in lens thickness has been demonstrated in several studies (Garner
1983, Zadnik, Mutti et al. 1992, Beers and Van Der Heijde 1994, Dubbelman, van der
Heijde et al. 2001, Ostrin, Kasthurirangan et al. 2006, Bolz, Prinz et al. 2007). Corrected
Scheimpflug images showing a posterior accommodative movement of the posterior lens
surface is reported by (Dubbelman, Van der Heijde et al. 2005). In addition, the posterior

Biometric measurements in the crystalline lens: Applications in cataract surgery
20
lens surface is distorted by the refraction of the preceding optical surfaces and by the non-
homogeneous refractive index of the crystalline lens, known to have a gradient distribution
(GRIN) and the presence of GRIN in the lens plays a critical role in the crystalline lens
power (Pierscionek 1990). Furthermore, Kischkamp et al. reported lens tilt and decentration
for unaccommodated versus accommodated states, but was unable to find statistical
differences owning to the horizontal meridian, for an accommodative demand of 4 D
(Kirschkamp et al., 2004).The investigation of crystalline lenses will be valuable to the
design and evaluation of accommodation-restoration solutions for presbyopia, as well as
the predictability of intraocular lens implantation procedures, relies on accurate lens
measurement. However, most medical image techniques (MRI, ultrasonography,
videokeratoscopy, Scheimpflug etc.), are still limited by low resolution, or slower signal
acquisitions.
In the last 20 years, multiple technologies have been developed for the measurement of
anatomic information and correction of ocular aberrations, and important knowledge has
been gained on the contribution of the different components of the eye to the degradation
of image quality. Advanced ocular image techniques implemented at the Visual Optics and
Biophotonics Lab include laser ray tracing systems for the measurement of ocular
aberrations; a laser ray tracing system and reconstruction algorithms of the gradient index
distribution in the crystalline lens; a Hartmann-Shack wavefront sensor to measure ocular
aberrations; a Purkinje imaging system to measure, in vivo, the radii of curvature of the
anterior and posterior lens surfaces, and tilt and decentration of the crystalline and
intraocular lenses; a Scheimpflug anterior segment imaging system, with optical and
geometrical distortion correction algorithms and in particularly, anterior segment optical
coherence tomography systems (OCT), providing quantitative 3D ocular information from
the anterior cornea to the posterior crystalline lens/IOL, could help to overcome the limits
of low resolution and slow signal acquisitions. More recently quantitative custom-
developed spectral OCT (Birkenfeld, de Castro et al. 2014, Sun, Birkenfeld et al. 2014),
has been used to evaluate the geometry, surface topography and gradient refractive index
of the crystalline lens in vivo and ex vivo. The suitability of OCT, provided that it is
corrected for fan and optical distortion (Ortiz, Siedlecki et al. 2010), to quantify the
geometry of the crystalline lens has also been demonstrated in vivo in both young and old
eyes(Ortiz, Perez-Merino et al. 2012, Gambra, Ortiz et al. 2013) and eyes implanted with
intraocular lenses (Ortiz, Perez-Merino et al. 2013, Marcos, Ortiz et al. 2014). More
currently, Perez-Merino et al. presented radii of curvature, astigmatism and high-order
irregularities of the crystalline lens’ anterior and posterior surfaces in accommodating eyes
(Perez-Merino, Velasco-Ocana et al. 2015), and E. Martínez-Enriquez et al. studied lens
volume, equatorial diameter and equatorial lens position in young eyes as a function of
accommodation and in older cataract eyes as well (Martinez-Enriquez, Sun et al. 2016).
A major aim of modern cataract/presbyopia surgery is to achieve the desired postoperative
refractive outcome, and improvements in the predictability of the refractive outcome have
been due to refinements in surgical technique, particularly small incisions and a more
predictable postoperative IOL position (Landau and Laurell 1999, Olsen 2006), as well as
refinements in IOL power calculation formulas (Holladay, Prager et al. 1988, Retzlaff,
Sanders et al. 1990, Hoffer 1993, Zuberbuhler and Morrell 2007, Petermeier, Gekeler et al.
2009). However, the calculation of required IOL power is currently based on regression
Chapter 1
Introduction
21
formulas developed from the paraxial geometrical optics equations and/or statistical
analysis of retrospective cases and quantitative imaging is essential to measure the
structural properties of the ocular components and necessary to build patient-specific
computer eye models. Therefore, this thesis aims at improving upon the current
methodologies of linking geometrical and optical properties of the eye through customized
computer modeling, to monitor the IOL alignments after surgery, to accurately predict the
ocular aberrations by virtual ray tracing modeling, to identify the optimal IOL centration
by an optical metric, and to predict required IOL power and best IOL through customized
computer eye modeling using data from a 3D ocular biometry and geometry from a single
instrument- sOCT.
Quantitative OCT will allow building patient-specific eye models for selection of the IOL
design providing best optical quality. OCT-based computer eye-models have already
predicted optical aberrations in pseudophakic eyes (More detail will be described in
Chapter 5). The combination of high-resolution, high-speed OCT technologies with
quantification tools opens up the possibility of quantifying the geometry and structure of
the anterior segment of the eye, including the crystalline lens. Unlike the cornea, there are
few reports on the crystalline lens shape and its change with accommodation and aging,
and to our knowledge no one has investigated crystalline lens surface elevations in detail.
The quantification of the anterior segment and lens is particularly important in eyes where
the crystalline lens is to be replaced by an IOL, where it will be the key in the selection of
the optimal IOL for a specific patient. Full 3D biometry in eyes prior to cataract surgery
allows customizing the selection of the IOL to be implanted. Knowledge of the geometry
and function of the young crystalline lens serves as inspiration for new accommodating
intraocular lens designs (A. De La Hoz 2016).

Biometric measurements in the crystalline lens: Applications in cataract surgery
22
1.2 The optics of the human eye
1.2.1 General structure and optical properties of normal young eyes
The eye has been the subject of conflicting interpretations since antiquity. Many ancient
Assyrian, Greek and Roman philosophers and physicists believed in the idea of the active
eye and have tried to explain the visual process. Chinese ophthalmology was gradually
formed and developed in a clinical discipline under the fight against eye disease for
thousands of years. During the development of the Song and Yuan dynasties (AD 891-979),
Chinese ophthalmology gradually formed a theoretical system and treatment characteristics
of the discipline, which differentiated into specialized conditions. The independence of
ophthalmology and specialization in science also greatly promoted the development of
Chinese ophthalmology academically and technologically. In the 11th century, Egyptian
physicist Alhazen and Bukharan scientist Avicenna offered a more systematic critique of
the Galenic theory of the eye, which adhered to the Aristotelian theory. In the 17th century,
German Scientist Johannes Kepler proposed a full ray tracing model of the eye and
described the use of spherical lenses to correct myopic and hyperopic refractive errors. In
the early 19th century, English Scientist Thomas Young studied astigmatism, aberrations
and was the first to recognize loss of accommodation with age, and western ophthalmology
knowledge began to appear in Chinese medical books with the penetration of Western
medicine.
The principles of image formation by the eye are the same as those for manmade optical
systems. Light enters the eye through the cornea and is refracted by the cornea and lens.
The general structure (Figure 1.1(a)) consists of the cornea, iris, pupil, crystalline lens,
retina, macula, fovea and blood vessels. The cornea is transparent and approximately
spherical with an outer radius of curvature of about 8mm, contributing between 65-75% of
the eye's total focusing power. Behind the cornea is the anterior chamber, which is filled
with a slightly saline fluid of refractive index 1.336, known as the aqueous humour (Goel,
Picciani et al. 2010). At the rear of the anterior chamber is the crystalline lens. The pupil
plays an important optical function through the size of its aperture. The pupil size is varied
by the iris from a 2 mm to 8 mm diameter under very bright light and in darkness
respectively(Winn, Whitaker et al. 1994).The aperture stop is a very important component
of an optical system, affecting a wide range of optical processes. The temporal field of the
human eye is about 105o, while the nasal field is only about 60o due to both the nose and
the limited extent of the temporal retina. The use of two eyes provides better perception of
the external world than one eye alone, and binocular overlap is 120o (in Figure 1.1 (b)).

Chapter 1
Introduction
23
Figure 1.1 (a) The general layout of a normal young eye: cornea, iris, pupil, crystalline lens, retina,
macula, fovea and blood vessels; (b) The limitation of temporal and nasal field of vision (source:
Book: Optics of the Human eye).
The crystalline lens of the eye is about 3 mm inside the eye and is connected to the ciliary
body by suspensor ligaments called zonular fibers. The lens shape can be altered to change
its power when the eye needs to focus at different distances (accommodation). The posterior
chamber is between the iris, the ciliary body and the lens, and contains aqueous humour.
The inner layer of the eye is the retina, which is an extension of the central nervous system
and is connected to the brain by the optic nerve, and the vitreous chamber between the lens
and the retina. Bekerman et al. reported the normative data on eyeball diameters among
250 adults with healthy eyes. The eyeball size may vary from 21 mm to 27 mm (Bekerman,
Gottlieb et al. 2014) among individuals, with average values of anterior chamber depth (3.3
mm), lens thickness (3.5 mm), radii of curvature of lens surfaces (anterior:11 mm;
posterior: -6 mm) depending upon gender, accommodation and age, but those are known
to vary widely in the population.
1.2.2 Cornea: surface shape
The refracting components of the eye are the cornea and the lens. Those two elements are
transparent and have appropriate curvatures and refractive indices, with refraction taking
place at four surfaces-the anterior and posterior surfaces of the cornea and lens. Ideally,
when the eyes fixate on an object of interest, the image is sharply focused on the fovea. The
cornea is the eye’s outermost layer, which is a clear, dome-shaped surface. The cornea is a
highly organized group of cells, proteins and epithelium. Bowman's membrane, stroma,
Descemet membrane and endothelium are the five main corneal layers in human eyes
(shown in Figure 1.2). The epithelium protects the rest of the cornea and is coated with the
tear film, larger molecules and toxic substances. Bowman´s layer is around 10 μm thick
and consists mainly of randomly arranged collagen fibrils. The bulk of the cornea is formed
by the stroma, which in the human adult is approximately 500 μm thick centrally
(approximately 90% of corneal thickness) and is composed predominantly of flattened and
stacked collagenous lamellae (around 200 layers). Descemet´s membrane is the basement
of the endothelial cells. The endothelium is a single layer of cells, which are hexagonal and
fit together like a honeycomb.

Biometric measurements in the crystalline lens: Applications in cataract surgery
24
The cornea fulfills a dual role, acting as both the primary refractive element and as a
physical barrier to maintain ocular integrity. The cornea is a viscoelastic tissue that responds
to the presence of external and internal forces (Meek and Newton 1999, Roberts 2000,
Dupps and Wilson 2006, Elsheikh, Alhasso et al. 2008, Kling 2009, Meek and Knupp
2015). One of the most important properties of any optical system is the equivalent power.
The average power of the cornea is 40 diopters (D), which is 2/3rd of the power of the
whole eye. Although the anterior corneal surface is not smooth due to its cellular structure,
an optically smooth surface is achieved with a very thin tear film, which covers the cornea.
The posterior surface is more curved than the anterior surface, while the anterior surface
has a greater power (48D) than the posterior surface (-8D) owing to the low refractive index
difference between the cornea and aqueous humour. The refractive index of the cornea is
generally considered as homogeneous with an accepted value of 1.376. Some authors have
addressed the change of corneal refractive index with wavelength (Sivak and Mandelman
1982) or described the cornea as a gradient structure (Patel, Marshall et al. 1995, Barbero
2006).
Figure 1.2 Histological section of a human cornea (source: www. missionforvisionusa. org).
Pathologies that affect the normal shape of the cornea, such as keratitis, corneal
degeneration and dystrophy, congenital and abnormal corneal development, ect., degrade
corneal optical quality and consequently retinal image quality. The first studies proposed
by Ramsden in 1779 were performed on anterior corneal surfaces with keratometers, but
the device can only be applied to a very limited and central region of the cornea. Later in
the 19th century, Donders provided the first anterior corneal data of males and females.
Other authors, including Helmholtz, Javal and Schiotz, used different generations of
keratometers to characterize the anterior radius of the cornea (Sorsby, Benjamin et al. 1957,
P. H. Kiely 1982, Guillon, Lydon et al. 1986, Patel, Marshall et al. 1993, Lam, Jiang et al.
1997). More recently, Dubbelman et al. used a Scheimpflug camera, which had algorithms
to compensate for the refractive error of the anterior surface, to measure that shape of the
posterior corneal surface with respect to several meridians (Dubbelman, Weeber et al.
2002).
Dubbelman et al. reported that the average radius was 7.79±0.27 (SD) mm and 6.53±0.25
(SD) mm of the anterior and posterior corneal surfaces respectively. Both surfaces were
found to be flatter horizontally than vertically. The cylindrical component of the posterior
surface of 0.33 mm is twice that of the anterior surface (0.16 mm). Asphericity of corneal
surfaces influences higher order aberrations (HOA). In contrast to the anterior corneal

Chapter 1
Introduction
25
surface, the asphericity of the posterior corneal surface varied significantly between
meridians.
With age, the asphericity of both the anterior and the posterior corneal surface changes
significantly, which results in a slight peripheral thinning of the cornea, and the intersubject
variability in these values is very high (Dubbelman, van der Heijde et al. 2005). Modern
measurement of corneal curvature/power can be performed with a variety of instruments.
For example, the most common instruments found in optical biometry systems include
keratometers, the IOLMaster (Carl Zeiss AG, Jena, Germany) or Lenstar (Haag-Streit,
USA), corneal Videokeratography and Scheimpflug based corneal topography. More
recently, out laboratory has validated the use of Optical Coherence Tomography (OCT) as
a quantitive anterior and posterior corneal topographer (Ortiz, Siedlecki et al. 2009, Ortiz,
Siedlecki et al. 2009, Ortiz, Siedlecki et al. 2010, Ortiz, Siedlecki et al. 2011). Ray tracing
through OCT-based corneal surface elevations has allowed, among others, computation of
corneal aberrometry, showing high degrees of agreement with total aberrometry in an of
group keratoconic eyes pre- and post- implantation of intrastromal corneal ring segments
(Perez-Merino, Ortiz et al. 2014). Corneal irregularities in the elevation map and
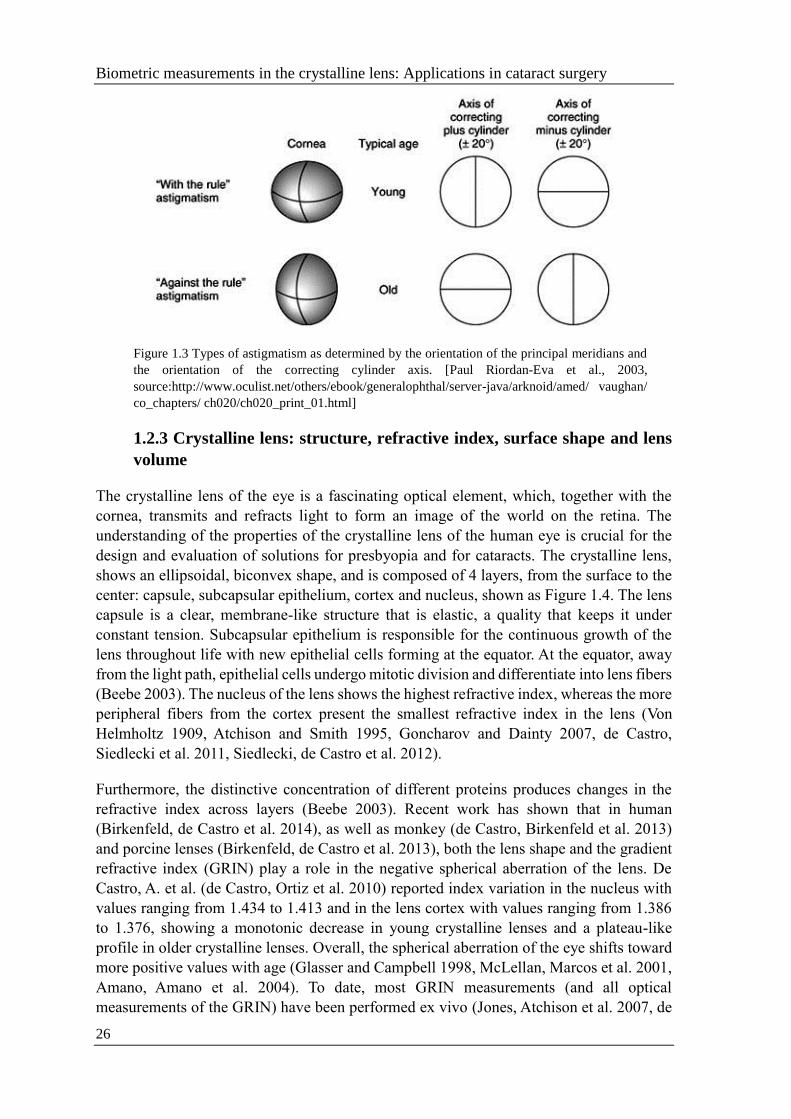
astigmatism are common. In astigmatism, the eye produces an image with multiple focal
points or lines. In regular astigmatism, there are two principal meridians, with constant
power and orientation across the pupillary aperture, resulting in two focal lines. The
astigmatism is then further defined according to the position of these focal lines with
respect to the retina. When the principal meridians are at right angles and their axes lie
within 20 degrees of the horizontal and vertical, the astigmatism is subdivided
into astigmatism with the rule, in which the greater refractive power is in the vertical
meridian; and astigmatism against the rule, in which the greater refractive power is in the
horizontal meridian. Astigmatism with the rule is more commonly found in younger
patients and astigmatism against the rule in older patients (Figure 1.3). Oblique
astigmatism is regular astigmatism in which the principal meridians do not lie within 20
degrees of the horizontal and vertical meridians. Corneal surface high order terms, which
some authors denominate as irregular astigmatism, are also frequent (Koh, Maeda et al.
2002, Kuroda, Fujikado et al. 2002, Maeda, Fujikado et al. 2002, Hayashi and Hayashi
2006). Interestingly, the posterior corneal surface appears to compensate for part of the
errors of the anterior cornea. In particular, the posterior cornea has been reported to
compensate around 3.5% of the coma of the anterior surface (Dubbelman, Sicam et al.
2007). There are also numerous reports of the compensation of the corneal astigmatism by
the astigmatism of the crystalline lens using corneal and refractive parameters (Kelly,
Mihashi et al. 2004, Lim, Gazzard et al. 2008, Park, Oh et al. 2013, Kotecha, Russell et al.
2014). More detail on astigmatism and optical aberration will be described in Section 1.2.6.
Axis misalignment of the anterior and posterior corneal astigmatism has been reported
before (Thibos and Horner 2001) as well as misalignments in the astigmatic axes of the
anterior and posterior crystalline lens surfaces (Kamiya, Shimizu et al. 2015). More detail
will be provided in the study of OCT 3D surface topography of isolated crystalline lenses
in Chapter 4.
Biometric measurements in the crystalline lens: Applications in cataract surgery
26
Figure 1.3 Types of astigmatism as determined by the orientation of the principal meridians and
the orientation of the correcting cylinder axis. [Paul Riordan-Eva et al., 2003,
source:http://www.oculist.net/others/ebook/generalophthal/server-java/arknoid/amed/ vaughan/
co_chapters/ ch020/ch020_print_01.html]
1.2.3 Crystalline lens: structure, refractive index, surface shape and lens
volume
The crystalline lens of the eye is a fascinating optical element, which, together with the
cornea, transmits and refracts light to form an image of the world on the retina. The
understanding of the properties of the crystalline lens of the human eye is crucial for the
design and evaluation of solutions for presbyopia and for cataracts. The crystalline lens,
shows an ellipsoidal, biconvex shape, and is composed of 4 layers, from the surface to the
center: capsule, subcapsular epithelium, cortex and nucleus, shown as Figure 1.4. The lens
capsule is a clear, membrane-like structure that is elastic, a quality that keeps it under
constant tension. Subcapsular epithelium is responsible for the continuous growth of the
lens throughout life with new epithelial cells forming at the equator. At the equator, away
from the light path, epithelial cells undergo mitotic division and differentiate into lens fibers
(Beebe 2003). The nucleus of the lens shows the highest refractive index, whereas the more
peripheral fibers from the cortex present the smallest refractive index in the lens (Von
Helmholtz 1909, Atchison and Smith 1995, Goncharov and Dainty 2007, de Castro,
Siedlecki et al. 2011, Siedlecki, de Castro et al. 2012).
Furthermore, the distinctive concentration of different proteins produces changes in the
refractive index across layers (Beebe 2003). Recent work has shown that in human
(Birkenfeld, de Castro et al. 2014), as well as monkey (de Castro, Birkenfeld et al. 2013)
and porcine lenses (Birkenfeld, de Castro et al. 2013), both the lens shape and the gradient
refractive index (GRIN) play a role in the negative spherical aberration of the lens. De
Castro, A. et al. (de Castro, Ortiz et al. 2010) reported index variation in the nucleus with
values ranging from 1.434 to 1.413 and in the lens cortex with values ranging from 1.386
to 1.376, showing a monotonic decrease in young crystalline lenses and a plateau-like
profile in older crystalline lenses. Overall, the spherical aberration of the eye shifts toward
more positive values with age (Glasser and Campbell 1998, McLellan, Marcos et al. 2001,
Amano, Amano et al. 2004). To date, most GRIN measurements (and all optical
measurements of the GRIN) have been performed ex vivo (Jones, Atchison et al. 2007, de

Chapter 1
Introduction
27
Castro, Siedlecki et al. 2011, Birkenfeld, de Castro et al. 2013). The use of an equivalent
index of refraction that represents the refractive property of the GRIN (i.e. which in
combination with the cornea and lens curvatures) predicts the eye’s spherical error is
frequent (Dubbelman, Van der Heijde et al. 2005, Uhlhorn, Borja et al. 2008, Birkenfeld,
de Castro et al. 2014). For a homogenous lens to have the same power, the bulk index would
have to be greater than the peak index in the gradient. Little refraction takes place at the
surface but instead the light curves as it passes through.
Figure 1.4 The structure of the Human Lens. Suture and Equator are anatomical terms in
ophthalmology. Suture means the seams of the lens. The suture patterns become more complex
as more layers of lens fibers are added to the outer portion of the lens. Equator means the edge of
the largest portion of the lens (similar to the equator on a globe) (source:
http://photobiology.info/Roberts.html)
In-vivo measurements of the crystalline lens radii of curvature typically come from
Purkinje (Garner and Yap 1997, Rosales, Dubbelman et al. 2006, Rosales and Marcos
2006), Sheimpflug (Cook, Koretz et al. 1994, Dubbelman and Van der Heijde 2001,
Dubbelman, van der Heijde et al. 2001, Koretz, Cook et al. 2001, Dubbelman, Van der
Heijde et al. 2003, Dubbelman, Van der Heijde et al. 2005, Rosales, Dubbelman et al. 2006),
Magnetic Resonance Imaging (MRI) (Atchison, Markwell et al. 2008, Hermans, Pouwels
et al. 2009, Kasthurirangan, Markwell et al. 2011, Sheppard, Evans et al. 2011), and Optical
Coherence Tomography (OCT) (Ortiz, Perez-Merino et al. 2012, Gambra, Ortiz et al. 2013,
Perez-Merino, Velasco-Ocana et al. 2015). Manns et al. reported, for the first time,
measurements of the lens asphericity ex vivo (Manns, Fernandez et al. 2004). Interaction
effects between the lens radii of curvature and asphericity in the lens profile fittings suggest
that those values should not be interpreted separately (Perez-Escudero, Dorronsoro et al.
2010). Dubbelman et al. showed that the asphericity of human lenses in vivo tends to
increase with age for both anterior and posterior surfaces(Dubbelman and Van der Heijde
2001). These results are in agreement with the report by Birkenfeld et al on ex vivo lenses
(Birkenfeld, de Castro et al. 2014). Due to its inaccessibility, the in vivo geometrical
parameters of the crystalline lens are limited in the literature. Rosales et al., (Rosales and
Marcos 2006, Rosales and Marcos 2009) using a distortion-corrected Scheimpflug camera,
reported averaged values of the crystalline lens radius for the anterior surface (11.1±1.1
mm) and for the posterior surface (6.1±0.5 mm). Dubbelman et al. (Dubbelman and Van
der Heijde 2001) described age-related expressions for the anterior and posterior crystalline

Biometric measurements in the crystalline lens: Applications in cataract surgery
28
lens surfaces respectively (R=12.9-0.057 x age, anterior; R=6.2-0.012 x age, posterior), and
reported an average conic constant value of -4 and -3 for the anterior and posterior lens,
respectively. Average lens thickness values range between 3.06 mm to 4.19 mm at 30 years
of age with a mean increase of 24 µm/year (Dubbelman and Van der Heijde 2001).
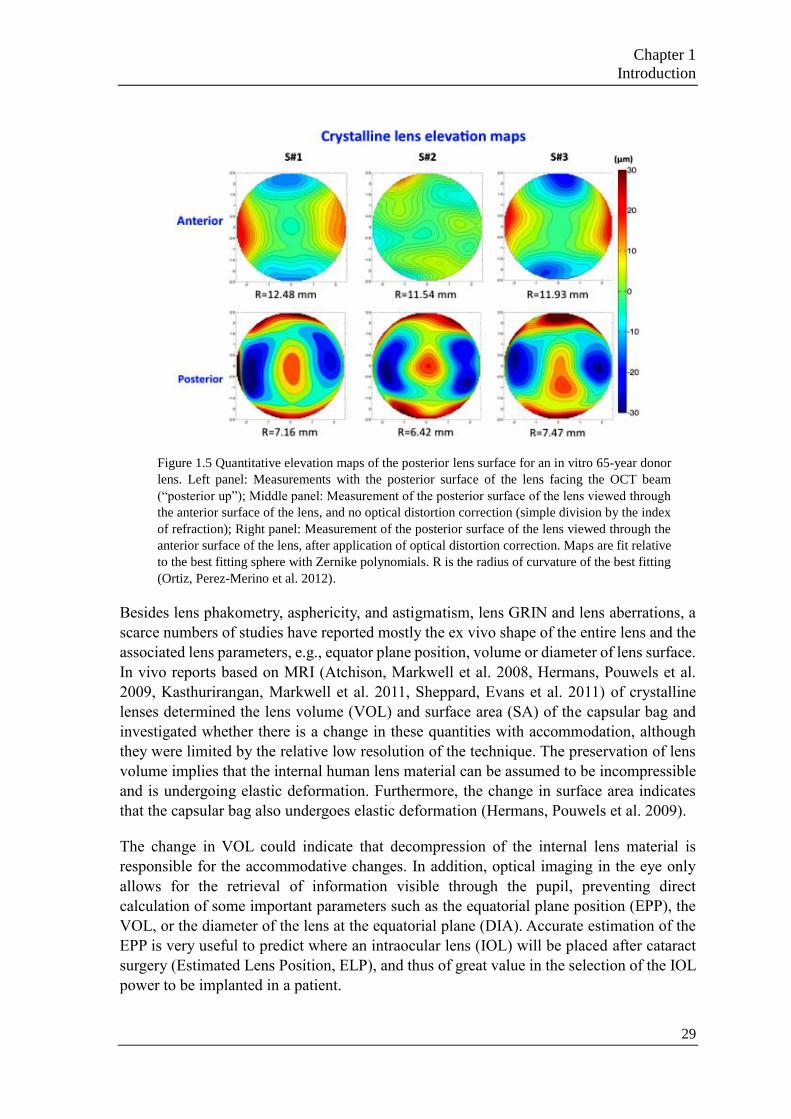
Ortiz et al., (Ortiz, Perez-Merino et al. 2012) quantified the crystalline lens geometrical
properties with distortion-corrected OCT, and reported the first in vivo 3D surface elevation
maps of the anterior and posterior lens surfaces as shown in Figure 1.5. These authors noted
that the axes of astigmatism in the anterior and posterior lens surfaces tended to be
orthogonal in the three subjects of their study. Data ex vivo and in vivo differ primarily
because the isolated lens appears in its maximally accommodated state, and therefore the
young lens shows large steepening ex vivo. Ex vivo, the anterior and posterior lens surface
radii of curvature tend to increase with age (up to or past the presbyopia onset) (Manns,
Fernandez et al. 2004, Birkenfeld, de Castro et al. 2014), while in vivo, both surfaces tend
to steepen with age (Dubbelman and Van der Heijde 2001).
Much of the knowledge on the optics of the crystalline lens comes from wavefront
aberration measurements. Hartmann-Shack measurements of the crystalline lens in rhesus
monkeys suggest the presence of high order aberrations beyond spherical aberration
(Roorda and Glasser 2004). Artal et al. measured the wavefront aberration of the crystalline
lens in vivo by neutralizing the contribution of the cornea with the use of goggles filled
with solution (Artal, Guirao et al. 2001). Several other works estimate the internal optics
obtained by subtraction of the corneal aberrations from the total aberrations (Artal, Guirao
et al. 2001, Barbero, Marcos et al. 2002). These studies confirm the previously reported
balance between the positive spherical aberration of the cornea and the negative spherical
aberration of the crystalline lens (Sivak and Kreuzer 1983). However, this methodology
does not permit identification of the relative contribution of irregular shape in the
crystalline lens and ocular misalignments to the lens wavefront aberration. In particular,
there is evidence that the balance between horizontal coma in the cornea and the crystalline
lens arises primarily from the eccentric position of the fovea, resulting in an angular
separation between the line of sight and the optical axis, known as angle lambda (Kelly,
Mihashi et al. 2004, Marcos and Rosales et al. 2008). Early attempts to measure the
astigmatism of the internal ocular surfaces involved the use of videokeratography, A-scan
ultrasonography, and autorefractometry along with multi-meridional phakometric
measurements of Purkinje images (Rosales and Marcos 2006). As noted in the literature
(Barry, Dunne et al. 2001), the ophthalmo-phakometric method was prone to considerable
accumulated experimental errors. However, the work reports some interesting findings,
such as predominance of inverse astigmatism (where the steeper meridian is in the
horizontal axis) in the posterior cornea and in the posterior lens surface, while the
astigmatism of the anterior surface of the lens was direct (where the steeper meridian is in
the vertical axis).
Chapter 1
Introduction
29
Figure 1.5 Quantitative elevation maps of the posterior lens surface for an in vitro 65-year donor
lens. Left panel: Measurements with the posterior surface of the lens facing the OCT beam
(“posterior up”); Middle panel: Measurement of the posterior surface of the lens viewed through
the anterior surface of the lens, and no optical distortion correction (simple division by the index
of refraction); Right panel: Measurement of the posterior surface of the lens viewed through the
anterior surface of the lens, after application of optical distortion correction. Maps are fit relative
to the best fitting sphere with Zernike polynomials. R is the radius of curvature of the best fitting
(Ortiz, Perez-Merino et al. 2012).
Besides lens phakometry, asphericity, and astigmatism, lens GRIN and lens aberrations, a
scarce numbers of studies have reported mostly the ex vivo shape of the entire lens and the
associated lens parameters, e.g., equator plane position, volume or diameter of lens surface.
In vivo reports based on MRI (Atchison, Markwell et al. 2008, Hermans, Pouwels et al.
2009, Kasthurirangan, Markwell et al. 2011, Sheppard, Evans et al. 2011) of crystalline
lenses determined the lens volume (VOL) and surface area (SA) of the capsular bag and
investigated whether there is a change in these quantities with accommodation, although
they were limited by the relative low resolution of the technique. The preservation of lens
volume implies that the internal human lens material can be assumed to be incompressible
and is undergoing elastic deformation. Furthermore, the change in surface area indicates
that the capsular bag also undergoes elastic deformation (Hermans, Pouwels et al. 2009).
The change in VOL could indicate that decompression of the internal lens material is
responsible for the accommodative changes. In addition, optical imaging in the eye only
allows for the retrieval of information visible through the pupil, preventing direct
calculation of some important parameters such as the equatorial plane position (EPP), the
VOL, or the diameter of the lens at the equatorial plane (DIA). Accurate estimation of the
EPP is very useful to predict where an intraocular lens (IOL) will be placed after cataract
surgery (Estimated Lens Position, ELP), and thus of great value in the selection of the IOL
power to be implanted in a patient.

Biometric measurements in the crystalline lens: Applications in cataract surgery
30
Figure 1.6 Lens model and definition of some parameters of interest. DIA: Diameter; PS: Pupil
size; ID: Diameter in the intersection; AL: Anterior lens; PL: Posterior lens; EPP: Equatorial plane
position; α: Diameter that defines the central portion of the lens; PROP: Proportion of the diameter
in the intersection. ρ: Part of the central portion taken to fit every lens side. (E. Martínez-Enriquez
2016)
1.2.4 Iris, Pupil and Ocular biomechanics
The iris is responsible for controlling the size of the pupil affected by the light
conditions. The peripheral edge of the iris (its root) is merged with the ciliary body and the
trabecular meshwork. The iris is 12-12.5 mm in diameter with a circumference of 36-37
mm. In infants, the pupil diameter is minimal (up to 2 mm), at a young age the pupil
diameter is maximal (about 8 mm), and in old age the pupil diameter decreases again which
is referred to as senile miosis. In optical terms, the pupil serves as an aperture stop in eye,
the main light-limiting aperture for on-axis objects. The iris also determines the depth of
field of the whole eye. The chief rays go through the centre of the entrance pupil and define
the centre of the blur in the presence of defocus. The size of the iris opening also has an
effect on image sharpness and depth of field, a narrow pupil size reduces the effective lens
opening surface for off-axis incident light in order to have a gradual decrease in light
intensity towards the image periphery lens opening surface (Atchison DA 2000). Under the
action of various eye muscles, the diameter of the pupil can be made narrower or wider. In
conjunction with the ciliary muscles, the sphincter papillae muscle and dilator papillae
control the size of the pupil. On the outer surface of the eye, except for the cornea, is the
sclera, which protects the more delicate internal components of the eye, such as the lens,
from external injuries and provides mechanical support to the retina.
This mechanism provides the eye with a continuously variable focusing system, which is
controlled by a defocusing signal from the retinal image. This physic-optical system relies
on the ability of the crystalline lens to deform elastically under zonular tension and to return
to its more curved shape when zonular tension is relaxed. Biomechanics of eye muscles
allow the eye to move extremely fast and engage in smooth pursuit to follow a moving
object. The eyes also converge and diverge as well—moving toward or away from each
other to maintain binocular vision with muscles and tissue that surround the eye to control
all of these movements.

Chapter 1
Introduction
31
1.2.5 Pupillary axis, Visual axis and Fovea
The optical surfaces of the eye are not rotationally symmetric. Consequently, the eye does
not have a uniquely defined, true optical axis. The optical axis (OA) (blue line in Figure
1.7) is approximated by the line that best passes through or near to the centers of curvature
of the four optical surfaces (anterior cornea, posterior cornea, anterior lens, posterior lens)
of the eye while the visual axis (VA) (green line in Figure 1.7) is defined by the line
connecting the fovea to the fixation target via the eye's nodal points. A line from the object
through the centre of the entrance pupil that reaches the fovea (chief ray) is called line of
sight (LOS) (orange line in Figure 1.7). The LOS defines the path of the principal ray
entering the fixating eye. The pupillary axis (PA) (brown line in Figure 1.7) is defined by
the line connecting the centre of the entrance pupil with the centre of curvature of the
anterior cornea, and it therefore intersects the anterior cornea perpendicularly.
In Figure 1.7, the angle α is formed at the first nodal point by the OA and VA, and
typically has an average temporal decentration of 5 degrees (i.e. the fovea is shifted from
the optical axis to the temporal retina) (Bradley. A and Thibos. 1995). VA is usual nasal to
OA in a range of 17 degrees (nasal object space) to 2 degrees (temporal object space) is
normal (Bradley. A and Thibos. 1995) and vertically α is declined 2 to 3 degrees (David A
Atchison 2000, Sheehan 2012).
The angle κ is the angle between the PA and VA, which is easily observed as a displacement
of the coaxially viewed corneal reflex from the pupil centre of a fixating eye. Hashemi et
al. (Hashemi, KhabazKhoob et al. 2010) determined the mean angle kappa, which was
5.46±1.33° in total; 5.41±1.32° (male) and 5.49±1.34° (female) (p=0.558), decreasing
significantly with age; 0.015°/year (p < 0.001).
The angle λ is the angle between PA and LOS, with average values of 1.4 degrees (Loper
1959) and 9 degrees (Noorden. 1985) in the vertical and horizontal direction respectively,
where the PA is temporal to the LOS in object space as conventionally defined (David A
Atchison 2000). Rosales et al. reported that the off-axis field angle that would produce the
measured shift of the first Purkinje image (More detail will be described in Section 2.1.3)
is obtained by virtually rotating the eye using Phillips’ linear equations. This angle is in
reference to the PA and can be treated as angle λ (between the LOS and PA) under the
assumption that pupil decentration is small (Mandell 1995), with an average value of 0.36
degrees in horizontal axis and 3.6 degrees in vertical axis (Rosales and Marcos 2007).

Biometric measurements in the crystalline lens: Applications in cataract surgery
32
Figure 1.7 Drawn definitions of optical axis, pupillary axis, line of sight, visual axis (Arbelaez,
Vidal et al. 2008)
Axes defined by fixation on a target are dependent on the target distance (which may be
finite or infinite) and the refractive state of the eye. Apart from typically being decentered
(to a much greater extent horizontally than vertically), the pupil is not static. Asymmetric
dilation and constriction cause actuations in the location of axes defined by the entrance

Chapter 1
Introduction
33
pupil center. Although the definitions of the visual axis and line of sight both contain the
fixation target as a reference point, the object distance of the fixation target is not required
to be infinite.
The optic nerve leaves the eye at the optic disc, which is a blind spot. The optic disc is
about 5 degrees wide and 7 degrees high and is located about 15 degrees nasally on the
fovea. The fovea is normally positioned below the optic nerve head, which might cause
asymmetry in the distribution of the Retinal Nerve Fiber Layer (RNFL) between the
superior and inferior retina (Hood, Raza et al. 2013), and in general, the fovea is displaced
temporally and slightly inferior to the intersection of the optical axis with the retina and
also with high intersubject variations in the position (James T. Schwiegerling 2013).
1.2.6 Refractive errors
The WHO estimates that 153 million people worldwide live with visual impairment due to
uncorrected refractive errors. Refractive error (in Figure 1.8) is as an error due to the
mismatch between the eye length and the optical power. Refractive errors usually can be
"corrected" with eyeglasses or contact lenses, or they can be permanently treated with
LASIK and other vision correction surgeries (also called refractive surgery). The most
common types of refractive errors are myopia, hyperopia, presbyopia, and astigmatism.
Myopia is a condition where the eye is longer or more powerful than normal and the rays
of light come to focus in front of the retina, causing vision to be blurred. Myopia can be
corrected, to allow a clear image of distant objects, by viewing through an appropriate
negative power lens. Hypermetropia or hyperopia means that the eye is shorter or less
powerful than normal and the rays of light come to focus behind the eye. Presbyopia leads
to difficulty in reading or seeing at arm's length and it is linked to aging and occurs almost
universally.
Astigmatism is caused by the front surface of the eye having two different radii of
curvature along the horizontal and vertical axes (being shaped more like a rugby ball rather
than a soccer ball), causing the rays of light to focus at different points. Astigmatism usually
causes vision to be blurred or distorted to some degree at all distances. Astigmatism usually
is caused by an irregularly shaped cornea as we mentioned in Section 1.2.2. The steepest
and flattest meridians of an eye with astigmatism are called the principal meridians. In some
cases, astigmatism is caused by the shape of the lens inside the eye. This is called lenticular
astigmatism, to differentiate it from the more common corneal astigmatism. The power of
the eye changes with meridian, due to one or more refracting surfaces having a toroidal
shape, usually, or surface decentration or tilting.

Biometric measurements in the crystalline lens: Applications in cataract surgery
34
Figure 1.8 Diagrams of refractive error (Normal Eye, Myopia, Hyperopia, and Astigmatism)
1.2.7 Optical aberrations
The human eye is far from being a perfect optical system, as the images produced by the
eye are affected by optical aberrations. Historically, measurements of aberrations in the
human eye were restricted to the assessment of defocus and astigmatism, i.e. low order
aberrations that can be corrected by conventional spectacles. In the 17th century, Johannes
Kepler described the use of spherical lenses to correct myopic and hyperopic refractive
errors with a full ray tracing model (Kepler 1604). In addition to the usual refractive errors,
the human eye suffers from high-order aberrations (HOA) like coma, trefoil, spherical
aberration and others, which can produce vision errors such as difficulty seeing at night,
glare, halos, blurring, starburst patterns or double vision (diplopia), shown in Figure 1.9. A
HOA is a distortion acquired by a wavefront of light when it passes through an eye with
irregularities in its refractive components (tear film, cornea, aqueous humor, crystalline
lens and vitreous humor). The reduction in pupil size acts as an influence to moderate higher
order aberration.
Visual field aberrations lead to rapidly increasing blur of the image with the angle of the
visual field, strongly limiting the focusing capability of incident light in the periphery of
the retina. It has not been until the last decades with the rapid increase of aberration
measurement technology that measurement of HOA has been possible. In addition to
aberrometry of the global eye, accurate measurement of the corneal shape has led to the
first detailed analysis of the optical contributions of the different ocular elements, which
opens a wide range of basic and clinical applications. One of the most useful applications
of these technologies occurs in corneal laser surgery and cataract surgery. Measurement of
the increase of aberrations induced by these surgeries has revealed issues that cannot be
accounted for using classical refraction measurements. Furthermore, these types of
measurements have opened the possibility of improving surgery by customization of laser

Chapter 1
Introduction
35
ablation algorithms in corneal surgery or by optimizing the design of the intraocular lenses
implanted in cataract surgery. Moreover, new technologies to correct eye aberrations have
arisen with two fundamental goals: the improvement of visual quality and the increase of
resolution of retinal imaging devices.
Figure 1.9 Perceived image with defocus, astigmatism, and high order aberration such as spherical
aberration, coma, trefoil and random aberration vs. light field display (source:
http://www.zdnet.com/article/researchers-eye-vision-correcting-displays-for-devices/)
Besides defocus, astigmatism is one of the most frequent, and important, aberrations of the
eye (Vitale, Ellwein et al. 2008), followed by coma (Howland and Howland 1977, Castejon-
Mochon, Lopez-Gil et al. 2002, Thibos, Hong et al. 2002). Apart from the natural
astigmatism and coma that can be present in an eye on-axis, astigmatism and coma
increases off-axis (Navarro, Moreno et al. 1998, Gustafsson, Terenius et al. 2001, Charman
2008). Off-axis aberrations become significant at large pupil diameters. Mathur et al.
(Mathur, Atchison et al. 2009) indicate that off-axis eye defocus tends to be myopic, with
the image field focusing away from the retina and toward the crystalline lens. Off-axis
defocus of the eye effectively induces random asymmetrical deviations in field curvature,
which may be noticeable and next to impossible to correct, either by crystalline lens
refocusing or accommodation. In addition, the common axial (or central) astigmatic human
eye also suffers from off-axis astigmatism, rapidly increasing with the distance from fovea
(called retinal eccentricity). At large incident angles, the wavefront transforms from
circular to strongly ellipsoidal, and the apparent field of view effectively shrinks due to
significant refraction angles of the chief ray at the cornea and lens. Most research data
indicate that off-axis astigmatism in the average eye tends to be larger on the nasal side of
the retina. Astigmatism here initially diminishes outside the fovea and well into the macula,
dropping to zero at about 8° and 14°temporally and nasally, respectively, due to the offset
of axial eye astigmatism with that caused by oblique incident rays. Off axis astigmatism
also changes with accommodation level, not only in magnitude but also in form, with the
field asymmetry, possibly by shifting from temporal to nasal dominance (Lee, Thompson
et al. 2010). The success of different correction alternatives for myopia relies on an
adequate knowledge of the optics of the myopic eye. Several studies show an increase of

Biometric measurements in the crystalline lens: Applications in cataract surgery
36
the amount of higher order aberrations in myopic eyes (Collins, Wildsoet et al. 1995, Goss,
Van Veen et al. 1997), while a certain degree of corneal/internal spherical aberration
balance seems to hold in a wide range of refractive errors from 0D to -16 D (Marcos,
Rosales et al. 2008). The increase of corneal spherical aberration relates with increased
corneal asphericity found in myopia (Carney, Mainstone et al. 1997). In the last few years
there has been an increased interest in the assessment of the optical quality of the normal
eye (Marcos, Burns et al. 2001, Castejon-Mochon, Lopez-Gil et al. 2002), as well as the
changes of optical quality under certain conditions such as aging (McLellan, Marcos et al.
2001), accommodation (He, Burns et al. 2000) and refractive errors (Llorente, Barbero et
al. 2004), particularly how the optical aberrations are modified after certain interventions
such as refractive surgery (Moreno-Barriuso, Merayo-Lloves et al. 2001), intraocular
surgery (Barbero, Marcos et al. 2003) and contact lenses (Dorronsoro, Barbero et al. 2003).

Chapter 1
Introduction
37
1.3 The aging eye
1.3.1 Presbyopia: accommodation loss of the crystalline lens
The anterior and bulk of the ciliary body contains the ciliary muscle that affects zonules in
the eye (Figure 1.10), enabling changes in lens shape for light focusing (Atchison 1995)
and in turn controls accommodation. For the elastic young crystalline lens without
presbyopia or cataracts, this dynamic process of contraction and relaxation of the ciliary
muscle adjusts the focusing power of the eye by changing the thickness of the eye’s natural
lens and shape via constriction and/or relaxation of the ciliary muscle, resulting in a change
of the optical power of the eye which provides a focused image of objects both near and
far. With aging, the human lens becomes thicker, relatively steeper, and looses the ability
to accommodate (Atchison 1995, Glasser and Campbell 1998, Michael and Bron 2011).
Presbyopia is an age-related eye condition affecting 100% of the population beyond 45
years, characterized by the stiffening of the crystalline lens, resulting in the loss of its ability
to accommodate near and far (Lewis 1983, Koretz, Cook et al. 1997, Glasser and Campbell
1999, Glasser, Croft et al. 2001, Spierer 2003, Strenk 2005). The accommodation capacity
is also lost with age as a natural part of the aging process (Pascolini, Mariotti et al. 2004,
Resnikoff, Pascolini et al. 2004, Resnikoff, Pascolini et al. 2008) due to lens stiffening. The
ocular changes undergone in presbyopia have been studied from physiological (Koretz,
Handelman et al. 1984, Koretz, Kaufman et al. 1989, Glasser and Campbell 1998, Glasser
and Campbell 1999, Koretz, Cook et al. 2001, Koretz, Cook et al. 2002, Moffat, Atchison
et al. 2002, Strenk, Strenk et al. 2004, Dubbelman, Van der Heijde et al. 2005,
Kasthurirangan 2007), anatomical (Croft, Glasser et al. 2001, Glasser, Croft et al. 2001),
biomechanical (Burd, Judge et al. 1999, Judge and Burd 2002, Hermans, Dubbelman et al.
2006, Weeber and van der Heijde 2007), and biochemical approaches (Bron, Vrensen et al.
2000, McGinty and Truscott 2006) although there is ample consensus that stiffness in the
lens is the cause for presbyopia, some authors have also invoked age-related changes in the
ciliary muscle and capsular bag (Kaufman, Bito et al. 1982, Glasser, Croft et al. 2001, Croft,
McDonald et al. 2009).
Figure 1.10 A quarter section through the anterior segment

Biometric measurements in the crystalline lens: Applications in cataract surgery
38
To relieve the symptoms of presbyopia, it is necessary to understand the accommodative
anatomy, the mechanism of accommodation and the causes of presbyopia. A variety of
surgical procedures have been considered for restoring accommodation to the presbyopic
eye or at least to produce some visual functionality at near and far distances. Non-surgical
treatments may come in the form of alternating vision (near spectacles or progressive
spectacles), mono-vision (correcting an eye for far and the other for near) or simultaneous
vision (multifocal contact lenses, corneal inlays, presbyLASIK or multifocal IOLs). Other
treatments with dubious effectivity include surgical scleral expansion or femtosecond laser
lens treatment. Accommodating IOLs aim at restoring dynamic accommodation, being
provided with a mechanism to change their optical power activated by the forces of the
ciliary muscle. Several general designs are being considered: single element IOLs that rely
on a forward shift of the optic, dual optic IOLs that rely on an increased separation between
the two optical elements either laterally or axially, and IOLs which permit a change in
surface curvature to produce an increase in optical power in response to ciliary muscle
contraction (Glasser 2008). Of those, only a single optic IOL, the Crystalens by B&L, is
FDA approved, although its results have been questioned (Marcos, Ortiz et al. 2014).
Improved solutions of presbyopia, for example in the form of accommodative IOLs, require
a profound understanding of the natural crystalline lens properties and their contribution to
accommodation. Furthermore, new refractive products and, more specifically, new IOL
options hold promise for a customized intervention, adapted to the patient’s needs, but
critically rely on a good tuning with respect to other elements in the eye. There is an
increasing number of IOLs aimed at modifying the patient’s wave aberrations, targeting
correction of both refractive error and some HOA (i.e. spherical aberration, such as in
aspheric IOLs, or aiming at the increase of depth-of-focus in presbyopic-correction IOLs).
The ultimate goal in IOL development is to restore the active change in power of the eye
that occurs during accommodation in the young eye. More types of IOLs will be introduced
in Section 1.5.2.
1.3.2 Cataract: transparency loss of the crystalline lens and clinical
solutions
The Crystalline lens is mostly made of water and protein, with the protein arranged in a
precise way that keeps the lens clear and lets light pass through it. As we age, some of the
protein may clump together and start to cloud a small area of the lens (Benedek 1971). Over
time, it may grow larger and cloud more of the lens, making it harder to see. This clouding
of the lens, the cataract, creates vision loss, not allowing the image to focus properly on the
retina. There are three main types of Cataracts: Subcapsular cataract, which occurs at the
back of the lens and is more prevalent in cases of diabetes or with high doses of steroid
medications; Nuclear cataracts form deep in the central zone (nucleus) of the lens, which
are associated with aging (Michael and Bron 2011); Cortical cataracts are characterized by
white, wedge-like opacities that start in the periphery of the lens and spread to the lens
cortex, which is the part of the lens that surrounds the central nucleus (Truscott and Zhu
2010).
The first cataract surgery was performed in the 5th century BC in Egypt. The removal of
cataracts by surgery was also introduced into China from India, and flourished in the Sui

Chapter 1
Introduction
39
(AD 581-618) and Tang dynasties (AD 618-907) (Deshpande 1999, Deshpande 2000).
Cataract surgery can generally be distinguished by three techniques: Extra capsular
cataract extraction (ECCE), Intracapsular cataract extraction (ICCE) and
Phacoemulsification. The first extracapsular extraction of a cataract was performed by
French surgeon Jacques Daviel in Paris in 1748 (Era. 2008). ICCE was developed a short
time later in 1752-1753, but it is difficult to recover sight after ICCE, regardless of whether
or not an IOL is implanted, particularly because of the size of the incision required. When
removing cataracts from eyes, ICCE additionally removes capsular barriers and intraocular
lens implantation is limited to the iris support, angle support, or sulcus support design.
ICCE is seldom used today because more advanced techniques are available.
The most significant change in cataract surgery marked by the modern era was the
introduction of phacoemulsification surgery in 1967 by Dr. Charles Kelman (Linebarger,
Hardten et al. 1999). Since then, cataract surgery with IOL implantation has become a
routine surgical procedure. With modern techniques, complications are uncommon and
increasing emphasis is being placed on refractive outcomes. The key to reducing incision
size lies in the development of the Phacoemulsification extraction technique and the
foldable IOL. Today, Phacoemulsification cataract extraction (shown in Figure 1.11) allows
most of the capsule to be preserved and a foldable IOL can be inserted into the capsular
bag without widening the corneal incision, which means that incisions are typically less
than 3.5 mm, are configured to self-seal without the need for sutures and do not induce
significant astigmatism (Long and Monica 1996). Phacoemulsification with in-the-bag
implantation combined with modern surgical technologies has resulted in a refined surgical
procedure, which is highly repetitive and highly replicated worldwide. An increase in visual
acuity is the primary aim of cataract extraction when the crystalline lens is removed in
cataract surgery with increasing patient expectations and the ability of surgeons to control
astigmatism induction using small-incision techniques and/or toric IOLs, the refractive
outcome has become increasingly important (Kershner 1997, Kohnen and Koch 1998,
Koch and Kohnen 1999, Mamalis 2003).
Figure 1.11 The modern technique of Phacoemulsification which consists in the emulsification
(dissolve and aspire) of the crystalline lens inside the eye and the introduction of a foldable lens
through an average 2-mm incision.
Although the main goal of a cataract treatment was originally to eliminate scattering, IOLs
have evolved enormously, first to additionally correct for refractive errors, but more
recently, to compensate for HOA, particularly spherical aberration. Future IOL design is
intended to provide enhanced functionality, such as regulatory function, chromatic
aberration correction and monochromatic aberration correction.

Biometric measurements in the crystalline lens: Applications in cataract surgery
40
An excessive anterior capsule fibrosis/opacification (ACO) may result in significant
clinical problems and complications, such as checking the retinal periphery, which leads to
difficulty in diagnosing and treating retinal problems and also lead to fibrous contraction
of the capsule, capsulorhexis phimosis, and IOL decentration. The technical and surgical
advances have not been in general paralled by a sophistication in the IOL power selection,
which remains still empirical and based on regressions from pooled data in patients.
1.3.3 IOL power calculation
In 1950s, Harold Ridley implanted the first IOL and formulas for calculation of IOL power
have been evolving since their inception. Fyoderov and co-workers first estimated the
optical power of an IOL using vergence formulas in 1967 in Russia (Fedorov SN 1967). In
the 1970s, several studies were conducted to establish and publish various theoretical
vergence formulas. The theoretical formulas have been subjected to minor and major
alterations in the variables with immersion A-scan since then in order to increase accuracy
(Hoffer 1993). In the 1980s, many ways were looked for to improve IOL calculations
because of inaccuracies using applanation ultrasound. This led to the development of
regression formulas, which soon coalesced into the SRK formula, which was developed by
Sanders, Retzlaff and Kraff. Though now replaced with the newer generation formula, it is
still useful for understanding the relation of the variables and A-constant to the IOL Power
(P). P = A–0.9 K–2.5AL. Later in 1990, Holladay improved the prediction of the estimated
lens position (ELP), where it can be assumed that size and position of the crystalline lens
have a significant predictive impact on postoperative ACD, and helped lead many back to
the use of theoretic formulas (Holladay, Prager et al. 1988). This led to the development of
the SRK/T formulas (a combination of a linear regression method and a theoretical eye
model) (Retzlaff, Sanders et al. 1990) by Retzlaff, the Hoffer Q formula (Hoffer 1993),
Olsen formula (Olsen T 2004) and the Haigis formula (Haigis W. 2004) in 2000. These can
be classified on the basis of their derivation (theoretical, regression analysis or
combination) or according to their evolution as per generations. The accuracy of the results
led to a standard of aiming for emmetropia in all cataract patients, so the calculation of IOL
power is not absolute due to the large number of individual variations in human eyes.
Theoretical formulas are determined by application of geometrical optics to the schematic
and reduced eyes using various constants by derivation.
Studies based on preoperative and postoperative ultrasound biometry show that over 50%
of errors in predicted refraction after IOL implantation can be attributed to axial length (AL
) measurement errors, around 40% to incorrect estimation of postoperative anterior
chamber depth (ACD) , and around 10% to corneal power (K) measurement errors (Olsen
1992). Therefore, AL measurement and calculation of IOL power by optical biometry
should be comparable or more accurate than those obtained using applanation ultrasound
in the normal population (Drexler, Findl et al. 1998, Findl, Kriechbaum et al. 2003, Findl
2005). More recent commercial optical instruments for AL measurement are the IOL master
(Zeiss Meditec Jena, Germany) with the advantages of laser optical biometry in a non-
contact technique, and Lenstar LS 900 (Haag-sreit Koeniz, Switzerland) with high accuracy
and repeatability. More information of ocular imaging techniques will be introduced in the
Section 1.4.

Chapter 1
Introduction
41
The assumed optical biometry, optimized IOL constants and the accuracy of predicted
postoperative IOL position are the limiting factors of modern IOL power calculation
formulas today. Several studies have proven that formula personalization definitely
improves formula accuracy in a clinically significant way. The customized pseudophakic
computer eye models based on ray tracing applied to IOL calculation utilizes a description
of the pseudophakic eye in which anterior and posterior corneal surfaces should ideally be
topographically measured. The use of customized eye models overcomes all the limitations
of the theoretical simple computations and allows understanding the contribution of each
factor to the optical quality and to perform this evaluation on an individual basis. More
information of customized eye model will be introduced in the Section 1.5.

Biometric measurements in the crystalline lens: Applications in cataract surgery
42
1.4 Ocular imaging techniques
Imaging of the eye is critical to improving the diagnosis, evaluating of management of eye
disease, and observing changes in anatomy and physiology. The technology and clinical
application of ocular imaging techniques, Scheimpflug imaging, ultrasonography, optical
coherence tomography, confocal scanning microscopy and MRI are introduced in the
following.
1.4.1 Scheimpflug, ultrasonography, MRI, and Purkinje imaging system
The Scheimpflug is configured to have the image, lens, and object plane intersect at one
point so that sections of the eye appear with a large depth of focus (Brown 1972, Koretz,
Handelman et al. 1984). The tilted film plane creates a significant variation in the
magnitude of light in different parts of the image by the use of strong slit-beam illumination
and a very sensitive film. Despite the large depth of focus of Scheimpflug imaging-based
systems, which are capable of capturing cross-sections of the human eye from the anterior
cornea to the posterior crystalline lens (particularly under full dilation) (Koretz, Handelman
et al. 1984), current commercial instruments are mostly used as corneal topographers and
pachymetry, discarding quantitative information that could be extracted on the crystalline
lens geometry. However, Scheimpflug images suffer from geometric distortion (caused by
tilt of the object plane with respect to the optical axis of the instrument) and optical
distortion (caused by refraction from the different ocular surfaces). Subsequent studies of
human accommodation and presbyopia using the Scheimpflug principle have provided a
wealth of information about these processes, as well as data about adult human lens
development and aging.
In ophthalmology, most A-scan and B-scan ultrasonography probes use a frequency of
approximately 10 million Hz (10 MHz), which allows for the restricted depth of penetration
of the sound into the ocular. The most common use of the A-scan ultrasonography (A-scan
US) is to determine eye length for calculation of intraocular lens power, and it also provides
distance measurements (e.g., anterior chamber depth, lens thickness). The horizontal and
vertical sweeps generally applied to pulse echo ultrasonics are proportional to time or
distance and amplitude or magnitude respectively. Thus the location and magnitude of
acoustical interfaces are indicated as the depth below the transducer. However, A-scan US
(Koretz, Kaufman et al. 1989, Beers and van der Heijde 1996, Garner and Smith 1997,
Koretz, Strenk et al. 2004) is unable in providing information about some ocular
components, such as crystalline lens shape and ciliary muscle orientation. Over the last 30
years, visualization is considered important to provide accurate prognosis for vision after
cataract surgery. B-scan ultrasonography has greatly advanced, which helps in evaluating
the posterior segment in the presence of opaque ocular media (Coleman, Jack et al. 1972)
(John A. 2001), providing good quality real-time imaging. However B-scan US requires a
high level of inter-operator variability (Chopdar 2014), which does not plague other forms
of imaging including optical coherence tomography, CT, and MRI, and is limited by low
sensitivity and specificity.
Standard magnetic resonance imaging (MRI) uses a magnetic field and pulses of radio
wave energy to make images of ocular in ophthalmic field without requiring any

Chapter 1
Introduction
43
assumptions concerning lens optical properties for dimensional measurements. Previous
research reported overall eye shape, extraocular muscle anatomy, crystalline lens shape,
refractive index distribution, and ciliary muscle anatomy using MRI for ocular imaging
(Strenk, Strenk et al. 2000, Atchison and Smith 2004, Strenk, Strenk et al. 2004, Jones,
Atchison et al. 2007, Atchison, Markwell et al. 2008, Demer, Clark et al. 2008,
Kasthurirangan, Markwell et al. 2008). We have previously described the dependence of
refractive index distribution of the crystalline lens on accommodation and age using MRI
(Jones et al., 2007; Kasthurirangan et al., 2008). However, MRI is a relatively time-
consuming technique which makes the images prone to motion artifacts and of lower
resolution compared to optical and ultrasound techniques.
Purkinje imaging relies on reflections from the anterior (PI) and posterior (PII, usually
not visible) corneal surfaces and from the anterior (PIII) and posterior (PIV) lens surfaces
with off-axis illumination to avoid overlapping of the images. Purkinje images have also
been used to measure phakometry (Crystalline lens radii of curvature), (Mutti, Zadnik et
al. 1992, Kirschkamp, Dunne et al. 2004, Dunne, Davies et al. 2005, Rosales, Dubbelman
et al. 2006, Rosales and Marcos 2006), as well as to assess IOL tilt and decentration
(Phillips, Perez-Emmanuelli et al. 1988, Auran, Koester et al. 1990, Tabernero, Piers et al.
2006, de Castro, Rosales et al. 2007, Rosales, De Castro et al. 2010) and Barry et al., (Barry,
Dunne et al. 2001) proposed a set of linear equations relating the position of PI, PIII, and
PIV as a function of linear combinations of eye rotation, IOL tilt, and IOL decentration.
Until recently most reports of IOL tilt and decentration were obtained by presenting to the
subject fixation targets at different eccentricities and determining the fixation angle that
produces an overlap of Purkinje reflections from the anterior and posterior lenses (Guyton,
Uozato et al. 1990).
1.4.2 Optical Coherence Tomography (OCT)
Optical Coherence Tomography (OCT) is a three dimensional imaging technique with
ultrahigh spatial resolution even in high scattering media and is one of the most rapidly
developing biomedical imaging modalities. It is based on measurements of the reflected
light from tissue discontinuities to create interference with a reference beam. The first
biological application of low-coherence interferometry was reported by Fercher et al. in
1988 for measuring the eye axial length (Fercher, Mengedoht et al. 1988). Further
developed in 1997 in Prof. James Fujimoto’s lab at MIT, OCT with micrometer resolution
and cross-sectional imaging capabilities has become a prominent biomedical tissue-
imaging technique and it is particularly suited to ophthalmic applications requiring
micrometer resolution and millimeter penetration depth (Tearney, Brezinski et al. 1997).
The most important OCT modalities include: Time-Domain OCT (TD-OCT) and Fourier-
domain OCT (FD-OCT). In Time-Domain OCT (Figure 1.12(a)), the autocorrelation of
the light field is measured directly by mechanical axial movement of a reference mirror,
which corresponds to the depth-scanning signal of the sample (Huang, Swanson et al. 1991,
Fercher, Hitzenberger et al. 1993, Swanson, Izatt et al. 1993, Izatt, Hee et al. 1994). Uhlhorn
et al. (Uhlhorn, Borja et al. 2008) developed a TD-OCT with a long imaging depth of 10
mm in air for in vitro crystalline lens imaging in sequence over time, but low acquisitions
speed is not suitable for in vivo dynamic studies with eye motion. Fourier-domain OCT

Biometric measurements in the crystalline lens: Applications in cataract surgery
44
is rapidly replacing the TD-OCT in most applications due to significant advantages in
sensitivity and imaging speed. In FD-OCT, a tomogram line is calculated by unevenly
sampled Fourier transformation of the recorded fringe pattern, as demonstrated in 1995 by
Fercher (Fercher 1995).
Both systems use a reference arm and an interferometer to detect echo time delays of light
as shown in Figure 1.12. The interferometer uses a beam splitter, dividing the light into a
measurement sample arm and a reference arm. The reference arm in TD-OCT is
mechanically scanned (by a moving mirror) in order to produce a varying time delay. In the
FD-OCT system, all echo delays are acquired simultaneously enabling a significant
increase in the speed of image acquisition.
Figure 1.12 Schematic representations of (a) TD-OCT and (b) FD-OCT. (Bezerra, Costa et al.
2009)
Two configurations have prevailed in Fourier domain systems: spectral domain OCT (SD-
OCT),which uses a grating to spatially disperse the interference spectrum across an array-
type detector (Ha Usler and Lindner 1998, Wojtkowski, Bajraszewski et al. 2003, Park,

Chapter 1
Introduction
45
Pierce et al. 2005), and swept source OCT (SS-OCT) where a narrow band laser is swept
across a broad spectrum, encoding the spectrum as a function of time (Chinn, Swanson et
al. 1997, Yun, Tearney et al. 2003, Choma 2005). FD-OCT employing wavelength tunable
lasers (swept source OCT) exhibits improved imaging speed and detection sensitivity in
comparison to traditional time domain detection techniques. (Choma, Sarunic et al. 2003,
de Boer, Cense et al. 2003, Leitgeb, Hitzenberger et al. 2003).
SD-OCT is a non-invasive, high-speed technique that allows the collection of 3D anterior
segment data in hundreds of milliseconds with high lateral resolution and axial resolution,
which presents several advantages over other techniques to evaluate ocular anterior
segment biometry. Another major step in the improvement of OCT imaging speed, which
led to obtaining a value of 15,000 A-scan/s, was shown in 2003 by Wojtkowski et al
(Baikoff 2006). Since then, several studies have reported different corneal parameters in
normal and keratoconic subjects using OCT: central corneal thickness (Li, Meisler et al.
2008, Rao, Kumar et al. 2011), geometry of anterior and posterior corneal surfaces and
corneal topography maps (Ortiz, Siedlecki et al. 2009, Ortiz, Siedlecki et al. 2010, Ortiz,
Siedlecki et al. 2011, McNabb, Kuo et al. 2013). However, quantitative geometrical
parameters can only be retrieved accurately upon correction of the fan distortion (or
scanning distortion) of the sample arm of the OCT instrument and optical path difference
(OPD) correction of the optical distortion (or refraction error) (Ortiz, Siedlecki et al. 2009,
Ortiz, Siedlecki et al. 2009, Ortiz, Siedlecki et al. 2010, Zhao, Kuo et al. 2010, Ortiz,
Siedlecki et al. 2011).
SS-OCT offers the required speed but the challenge of providing limited axial range if axial
resolution is not to be compromised. The first three publications to report on the potential
of swept lasers in OCT imaging were published in 1997 (Chinn, Swanson et al. 1997,
Golubovic, Bouma et al. 1997, Lexer, Hitzenberger et al. 1997). The SS-OCT (shown as
Figure 1.13(b)) is based on Wolf’s solution to the inverse scattering problem of the Spectral
Domain OCT, but instead of encoding the frequencies in space they are encoded in time
(shown as Figure 1.13(a)). This overcomes the main drawbacks of SD-OCT, which are the
sensitivity drop-off and the resolution imposed by the finite size of the pixels of the camera,
which removes the contribution of the higher frequencies. The high imaging speed of SS-
OCT allows high-resolution images to be obtained while reducing the negative effect of a
patient’s eye movements on scan quality and also allows the vitreous and the choroid to be
imaged simultaneously because of the deeper range afforded by SS-OCT.

Biometric measurements in the crystalline lens: Applications in cataract surgery
46
Figure 1.13 Block diagrams of the OCT methods with the use of Fourier-domain detection:
(a) SD-OCT, (b) SS-OCT. (Wojtkowski 2010)
1.4.3 Aberrometry
Many scientists throughout the history of physiological optics have attempted to measure
the optical aberrations of the human eye. One of the earliest quantitative aberrometers was
devised by Tscherning et al. (Tscherning 1894, Arnulf 1956, Howland 1960, Smirnov 1961,
Howland and Howland 1976, Howland and Howland 1977). Aberrometry techniques such
as Hartmann-Shack systems or Laser Ray Tracing (LRT) have become the most relevant
technologies to measure aberrations in the laboratory and in the clinic. Hartmann-Shack

Chapter 1
Introduction
47
wavefront sensors (H–S) consist of an array of lenslets of the same focal length focusing
onto a CCD camera, and are an objective ‘outgoing’ aberrometry technique (Hartmann
1900, Hartmann 1904, Shack 1971). The lenslet array creates spots in the sensor according
to the wavefront coming out of the eye, as shown in Figure 1.14. The transverse ray
aberration associated to each pixel can be determined from deviations from the focal points.
H-S samples the pupil with a high fill factor and high-speed (milliseconds) which are the
two main advantages over sequential techniques such as LRT.
Figure 1.14 Hartmann–Shack system in optometry: a laser creates a virtual light source in the
retina. The lenslet array creates spots in the sensor according to the wavefront coming out of the
eye. The local tilt of the wavefront across each lens can be calculated from the position of the
focal spot on the sensor. (Source: https://en.wikipedia.org/wiki/Shack%E2%80%93Hartmann
_wavefront_sensor)
There are two main differences between Hartmann-Shack (Figure 1.15(a)) and LRT (Figure
1.15(b)): H–S works in parallel with a fixed sampling pattern and measures the aberrations
in the outgoing (second-pass) aerial beam, while LRT is sequential with a highly flexible
sampling pattern and measures aberrations of the incoming beam (first-pass) at the retinal
surface.
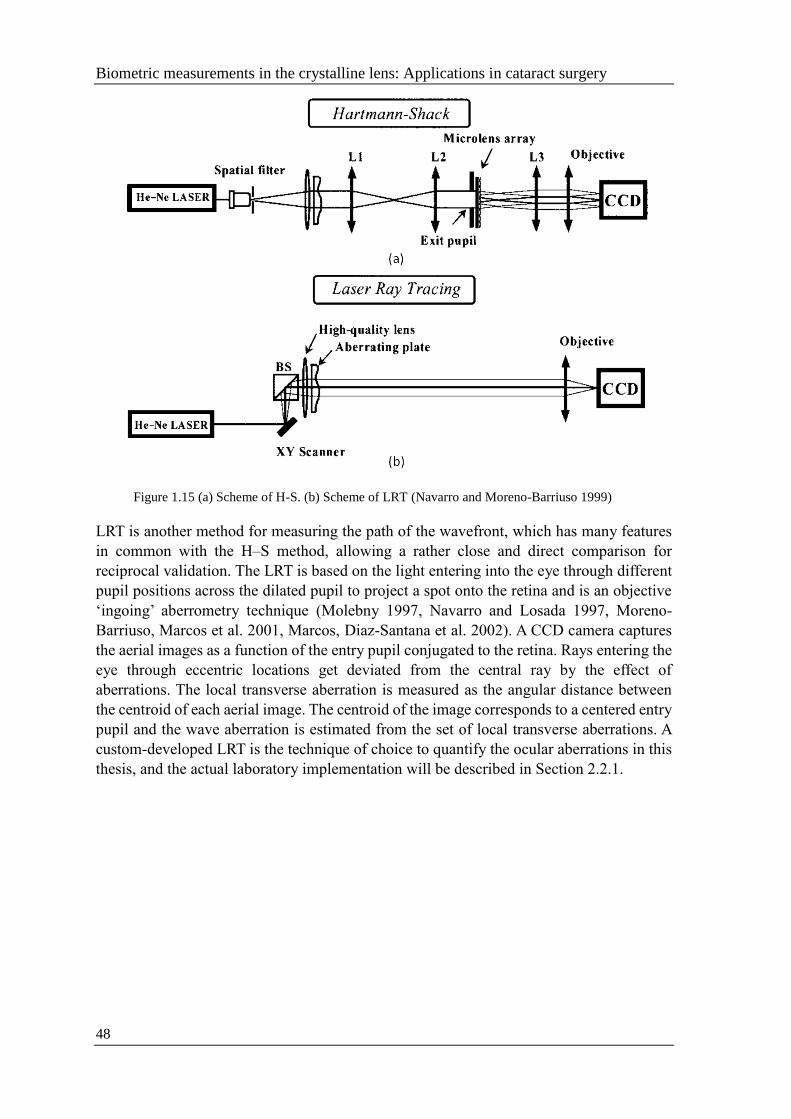
Biometric measurements in the crystalline lens: Applications in cataract surgery
48
Figure 1.15 (a) Scheme of H-S. (b) Scheme of LRT (Navarro and Moreno-Barriuso 1999)
LRT is another method for measuring the path of the wavefront, which has many features
in common with the H–S method, allowing a rather close and direct comparison for
reciprocal validation. The LRT is based on the light entering into the eye through different
pupil positions across the dilated pupil to project a spot onto the retina and is an objective
‘ingoing’ aberrometry technique (Molebny 1997, Navarro and Losada 1997, Moreno-
Barriuso, Marcos et al. 2001, Marcos, Diaz-Santana et al. 2002). A CCD camera captures
the aerial images as a function of the entry pupil conjugated to the retina. Rays entering the
eye through eccentric locations get deviated from the central ray by the effect of
aberrations. The local transverse aberration is measured as the angular distance between
the centroid of each aerial image. The centroid of the image corresponds to a centered entry
pupil and the wave aberration is estimated from the set of local transverse aberrations. A
custom-developed LRT is the technique of choice to quantify the ocular aberrations in this
thesis, and the actual laboratory implementation will be described in Section 2.2.1.

Chapter 1
Introduction
49
1.5 Customized eye modeling: linking geometry and aberrations
1.5.1 Phakic eye: Compensation between corneal and internal aberrations
In order to understand the complex structure and optical properties of the Phakic eye,
simplified optical models of real eyes with constructional parameters, generally means of
population distributions, are used. These models vary in their complexity and thus
suitability for applications. In 1662, Descartes exploited the first wide-angle optical eye
model to understand the mapping of the visual hemisphere on the retinal surface. Then in
1652, Huygens developed the simplest of schematic eyes with one refracting surface at the
front of eye. Schematic eye models with one spherical corneal and two lens surfaces were
developed by Young (1801), Moser (1844), Listing (1851) and Tscherning (1898). Based
on the improvement of the techniques for measuring the eye curvatures and axial distances,
several eye models were proposed in the last century by Gullstrand (Gullstrand 1909)
(shown in Figure 1.16) and Le Grand (Le Grand 1956). However, these simple models
could not be used to fully understand the aberrations of each component. Then in 1997,
Liou Brennan (Liou and Brennan 1997) provided a model for calculating optical transfer
functions and predicting optical performance of the eye and Navarro reported a critical
review of the optical design of the human eye in 2009(Navarro 2009) .
Figure 1.16 Schematic of Gullstrand-Emsley eye model (cardinal points at reasonable location;
10.9 D accommodated forms; anterior lens surface moved 0.4mm with more curved anterior lens
surface).
A good optical model eye (schematic eye) summarizes and organizes the understanding of
the eye as an optical system, and it provides a conceptual framework for thinking about
how the retinal image is formed to launch investigations into the visual process. In the three
and four refracting surface models, the lack of a gradient index is compensated for by
increasing the surface power via an equivalent index that is higher than occurs anywhere
in the real lens.
Human eye models that incorporate a lens gradient index have been attempted since 1801,
first by Thomas Young. The first eye model with lens structure was Gullstrand’s extract eye
with 2 corneal and 4 lens surfaces, with nested and homogeneous shells with different
indexes on each surface. The refractive index of the outer cortex and inner nucleus were
1.386 and 1.406. With the development of computers, ray tracing through gradient lens
media has become commonplace, as demonstrated in Figure 1.17.

Biometric measurements in the crystalline lens: Applications in cataract surgery
50
Figure 1.17 Models of gradient index with internal optical structure (a) Gullstrand 1909 (b) Liou
& Brennan 1997 (c) Navarro et al. 2007 (d) Alberto et al. 2010 (Crystalline lens GRIN with age
function)
An increasing level of complexity occurs in optical model eyes as they better reflect the
structure of real eyes, and the complexity of optical models will accelerate by refinement
of measurement techniques and better technology. Among those surfaces and refractive
media, the majority of all are aspherical surfaces, irregular surfaces or GRIN lenses, and
average data of typical ocular dimensions have been used to construct schematic eyes. A
summary of the features that the models are based on and the average population data used
in each calculation is in Table 1.1
Table 1.1 Summary of the eye-models, number of surfaces in each model and average population
data used in each model (MERINO 2015)

Chapter 1
Introduction
51
1.5.2 Pseudophakic eye: contributing factors to optical degradation in eyes
implanted with IOLs
Pseudophakic eyes are simpler than phakic eye models as the refractive index of the IOL is
constant. The retinal image quality in a pseudophakic eye depends on the parameters of the
implanted IOL, in particular on its chromatic aberration. Previous computer eye models use
biometric information gathered from multiple devices (anterior cornea from Placido disk
topography; tilt and decentration from Purkinje imaging apparatus; anterior chamber depth
from slit lamp; axial length from low coherence interferometer), examples listed in Table
1.2. ZEMAX (Radiant ZEMAX; Focus software, Tucson, AZ), Code V (Optical Research
Associates, Pasadena, CA) and OSLO (Lambda Research Corporation, Littleton, MA) are
the most current ray tracing computational programs, which could assistant modeling and
optical optimization by integrating a merit function in order to approach the specific targets
(e.g. best focal position, optical quality metrics and automatic control parameters) by
Matlab (Mathworks, Natik, MA). More detail about Zemax routines will be described in
Section 2.4.1. More detail about Matlab routines will be described in Section 2.4.2.
There are several IOL designs and/or models available on the market: monofocal IOL
(spherical, aspherical), multifocal IOL with an apodized diffractive design that optimally
distributes light to distance, intermediate and near focal points, toric IOL that correct
astigmatism and accommodative IOL (curvature changes of the lens surfaces and/or axial
displacement). Aspheric IOLs are designed to correct spherical aberration and toric IOLs
are designed to fully correct astigmatism. Premium monofocal IOLs design have an ability
to accommodate like a Crystalline lens by a focusing process, which are called
accommodative IOLs. However, several recent clinical evaluations of patients with
accommodating IOLs (McLeod 2006, Ossma, Galvis et al. 2007, Sanders and Sanders
2007, Marcos, Ortiz et al. 2014) did not reveal the large axial shifts with either natural or
drug-induced accommodation, as well as tilt changes with respect to natural lens and
accommodative effort. OCT-based custom computer eye models in this thesis are also
applicable to the optimization of the IOL power calculation, using virtual ray tracing to
overcome many limitations of current IOL power selection techniques, and customized IOL
designs.
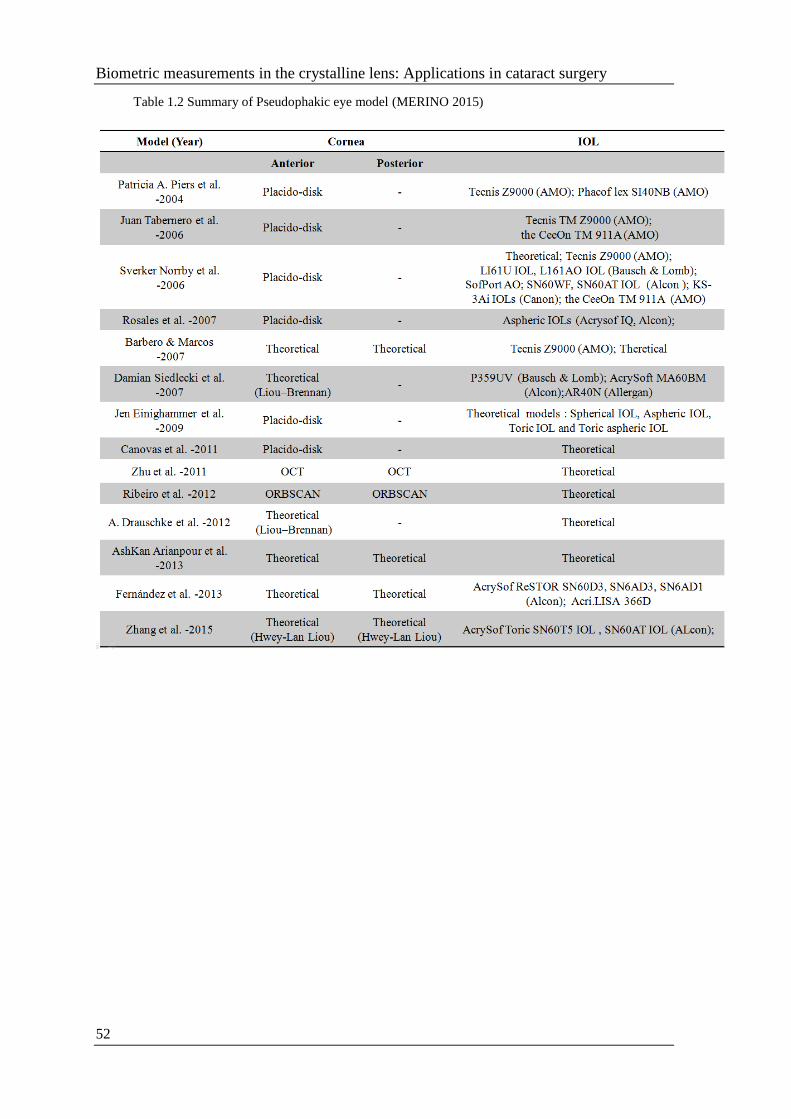
Biometric measurements in the crystalline lens: Applications in cataract surgery
52
Table 1.2 Summary of Pseudophakic eye model (MERINO 2015)

Chapter 1
Introduction
53
1.6 Goals of this thesis and hypothesis
1.6.1 Goals of this Thesis
To study the intraocular lens alignment from an en-face OCT imaging Purkinje-like
method. Measurement of implanted IOL alignment in cataract surgery patients is
important for understanding their optical performance. This thesis presents a
method to estimate misalignment (tilt and decentration) of IOLs based on en-face
OCT images showing Purkinje-like images that correspond to the specular
reflections from the corneal and IOL surfaces. Unlike in standard Purkinje imaging,
the tomographic nature of OCT allows unequivocal association of the reflection
with the corresponding surface. The methodology was demonstrated on an artificial
model eye and pseudophakic eyes.
To analyze Crystalline lens topography in vitro eyes of different ages and to
understand how OCT 3D surface topography of isolated human crystalline lenses
changes with age. This thesis presents radii of curvature, astigmatism and high-
order irregularities of the crystalline lens’ anterior and posterior lens surfaces.
Understanding the coordination of anterior and posterior lens surface geometries
and their topographical changes with age sheds light on the role of the lens in the
optical properties of the eye and the lens aging mechanism.
To simulate ocular aberrations on an individual level from full 3D OCT based
pseudophakic custom computer eye models and validate with experimental ocular
aberrations from LRT. This thesis shows that customized eye models in combination
with the actual measurements of ocular aberrations can be used to identify the
relative importance of each factor. The measurements of ocular aberrations in
pseudophakic eyes allow assessment of the overall optical performance and show
the capability of building computer eye models from information all obtained
simultaneously with the one instrument.
To analyze the effect on optical quality of IOL decentration and to identify optimal
IOL centration using OCT-based ray tracing on pseudophakic eyes. Quantitative
OCT proves an excellent technique for pre-operative 3D biometry and post-cataract
surgery evaluation. This thesis presents the evaluation of the contributing factors to
optical degradation in eyes implanted with IOLs and the impact of IOL
misalignment in particular. This thesis will be useful to investigate the potential for
OCT-based model eyes, to become the reference for ray tracing based IOL premium
centration selection (pre-operatively) and to understand mechanisms of operation
and functional outcomes of premium IOLs.

Biometric measurements in the crystalline lens: Applications in cataract surgery
54
1.6.2 Hypothesis
Our hypothesis is that knowledge of the IOL position will help us to better understand the
optical quality of the pseudophakic eye by measuring IOL tilt and decentration after
cataract surgery (with OCT based Purkinje-like imaging methods implemented and
validated in this thesis). Quantitative measurements of the crystalline lens based on Optical
Coherence Tomography will allow us to understand the sources of ocular aberrations. With
the aid of full OCT based customized computer eye models, we will be able to predict the
role of each factor to optical quality on individual leaver, and these advances will contribute
to customize IOL power calculation and improvement of cataract surgery.

Chapter 1
Introduction
55
1.7. Structure of this thesis
The body of this thesis is structured as follows:
Chapter 1 presents the background, motivation, goals and hypothesis of the thesis.
Chapter 2 describes the methods used throughout this thesis, including the SD-OCT (for
geometrical and aberration measurements of the anterior segment of the eye), the Laser Ray
Tracing (for ocular aberration measurements), other techniques for validation, the optical
quality metrics, ex vivo and in vivo measurements, and virtual ray tracing calculations.
Chapter 3 presents a method to estimate tilt and decentration of IOLs based on OCT
images. En-face OCT images show Purkinje-like images that correspond to the specular
reflections from the corneal and IOL surfaces. The locations of the Purkinje-like images
are linear combinations of IOL tilt, IOL decentration, and eye rotation. The weighting
coefficients depend on the individual anterior segment geometry, obtained from the same
OCT datasets. The methodology was demonstrated on an artificial model eye with set
amounts of lens tilt and decentration, and then on five pseudophakic eyes. Purkinje-based
methodology from anterior segment en-face OCT imaging will provide reliable
measurements of IOL tilt and decentration.
Chapter 4 uses quantitative 3D Optical Coherence Tomography to measure the surface
topography of 36 isolated human lenses and to evaluate the relationship between anterior
and posterior lens surface shape and their changes with age. The anterior surface RMS
spherical term, RMS coma and 3rd order RMS decrease significantly with age. In general,
there is a statistically significant correlation between the 3rd and 4th order terms of the
anterior and posterior surfaces. Understanding the coordination of anterior and posterior
lens surface geometries and their topographical changes with age sheds light on the role of
the lens in the optical properties of the eye and the lens aging mechanism.
Chapter 5 compares measured wave aberrations in pseudophakic eyes implanted with
aspheric IOLs with simulated aberrations from numerical ray tracing on customized
computer eye models. This study shows that full OCT-based pseudophakic custom
computer eye models allow for understanding the relative contribution of optical
geometrical and surgically-related factors to image quality, and are an excellent tool for
characterizing and improving cataract surgery.
Chapter 6 validates custom computer eye models built using quantitative all OCT-based
geometry to identify the intraocular lens (IOL) centration that would produce the best
optical quality using Visual Strehl (VS). OCT-based customized eye models accurately
predict optical quality in pseudophakic eyes implanted with state-of-the-art monofocal
IOLs. Zero IOL decentration does not produce optical quality. The best IOL decentration
can be obtained for each patient based on personalized models, and the achieved
improvement may be of clinical relevance.
Chapter 7 and 8 enumerate the conclusions of the thesis, future work and publications
written and activities performed during this PhD period.

Biometric measurements in the crystalline lens: Applications in cataract surgery
56

Chapter 2
Experimental methods, computational techniques and other types of validation
57
CHAPTER 2
EXPERIMENTAL METHODS,
COMPUTATIONAL
TECHNIQUES AND OTHER
TYPES OF VALIDATION

Biometric measurements in the crystalline lens: Applications in cataract surgery
58

Chapter 2
Experimental methods, computational techniques and other types of validation
59
RESUMEN
Este capítulo describe métodos experimentales, técnicas computacionales y otros tipos de
validación utilizados en este trabajo.
Este capítulo describe un nuevo desarrollo específico para estimar la inclinación y
descentración de la lente cristalina o lentes intraoculares. El método está inspirado en los
métodos de imagen de Purkinje implementados previamente en VioBio Lab, pero
aprovecha la naturaleza transversal de OCT que permite identificar de manera inequívoca
las reflexiones de cada superficie. El algoritmo personalizado de procesamiento de
imágenes escrito segmenta el borde de la pupila, encuentra el centro por ajuste de elipse y
las posiciones de las imágenes de tipo Purkinje, PI, PIII y PIV a partir de las imágenes OCT
en-face. El desalineamiento de la lente y la fovea se obtienen asumiendo relaciones líneales
entre aquéllos y las posiciones de las imágenes de Purkinje. El capítulo describe también
el sistema de OCT de desarrollo propio utilizado para la cuantificación de la geometría del
cristalino del ojo ex vivo y del segmento anterior en pacuentes pseudofáquicos in vivo.
Los datos de elevación basados en OCT de las superficies corneales anteriores y
posteriores, las distancias del segmento anterior, la geometría de la LIO, la alineación de la
LIO, el ángulo de rotación del ojo lambda λ y la longitud axial mediante interferometría de
baja coherencia fueron exportados a un sistema de diseño óptico (Zemax) donde se
simularon modelos computacionales de ojos pseudofáquicos. Estos modelos se utilizadon
para la estimación de coeficientes de ponderación en el método de Purkinje, la medida de
la inclinación y descentración, cálculos de aberraciones de alto orden y cálculo de la
posición lateral óptima de la IOL.
Otros métodos experimentales usados en la tesis y descritos en el capítulo incluyen la
profilometría de no contacto basada en microscopía confocal (sistema comercial de
Sensorfar) y el Trazado de Rayos por Laser previamente desarrollado en el laboratorio para
la medida de las aberraciones del ojo

Biometric measurements in the crystalline lens: Applications in cataract surgery
60

Chapter 2
Experimental methods, computational techniques and other types of validation
61
2.1 3D-Anterior segment spectral domain OCT
2.1.1 Custom setup
In a spectral domain OCT (SD-OCT) system, a spectral fringe pattern (channeled spectrum)
is recorded by a spectrometer with a line scan camera, and a tomogram line is calculated
by unevenly sampled Fourier transformation of the recorded fringe pattern. This technique
can perform imaging much faster without mechanical depth scanning and allow the
collection of 3D anterior segment data in hundreds of milliseconds with a high lateral and
axial resolution to evaluate ocular anterior segment biometry (from anterior cornea to the
posterior crystalline lens/IOL).
The customized SD-OCT system (Grulkowski, Gora et al. 2009) in the VioBio lab was
developed in collaboration with Nicolaus Copernicus University (Torun, Poland) (Figures
2.1 and 2.2 show a picture and the schematic layout of the system) and was provided in the
last years with several additional elements (Gambra, Ortiz et al. 2013) and custom-
developed processing routines (Ortiz, Siedlecki et al. 2010). The SD-OCT system includes
the main components (shown in Figure 2.2: light source; reference arm; sample arm
(including accommodation/fixation channel, scanning galvanic mirror, objective lens and
subjects); spectrometer (including condensing lens, grating, and line-scan camera).
The light source consists of a superluminescent diode (SLD) (λ0 = 840 nm, near Gaussian
emission bandwidth 50nm, Superlum, Ireland). The Laser beam is split into reference and
sample arms by a fiber mate to an 80:20 fiber coupler (FC) in order to avoid back reflected
light from the reference and sample arms returning to the SLD. The reference arm consists
of a collimating lens to produce a collimated beam with a polarization controller to optimize
detection performance, a neutral density filter to increase or decrease the power of light in
the reference arm, a converging lens and a reference mirror.
The additional beam splitter is placed in the sample arm which incorporates the fixation
channel for measuring purposes. In this channel, a Badal system composed of two
achromatic doublets of equal focal lengths of 150 mm, that form an afocal system of
magnification x1, and two flat mirrors, mounted on a motorized stage (VXM-1, Velmex)
which can be moved to change the optical path between the lenses. That allows
compensating spherical refractive errors. Vergence is changed with the Badal system from
-10D to 10D and compensate with trial lenses placed in the pupil plane. In all conditions,
the image remains in focus (in 1-D steps). For the fixation channel, the fixation stimulus
consists of a 20/25 white Snellen E-letter presented on a black background on a Digital-
Light-Processing (DLP) picoprojector (854x480 pixels, Picopix PPX2055/F7, Philips NV,
Amsterdam, Netherlands; 55 Lumens) subtending a 5-arcmin visual angle. Two neutral
density filters (ND 16) are placed after the picoprojector to produce an average luminance
of ~30cd/m2 in an otherwise dark environment.
To perform the measurements in vivo, the target is first aligned with the OCT axis and then
the target is moved along the horizontal and vertical meridians for measuring in the line of
sight using a script written in Matlab. The collimating lens produces a collimated beam on
the cornea. The horizontal and vertical scanning is produced by the galvanometer optical

Biometric measurements in the crystalline lens: Applications in cataract surgery
62
scanners (Cambridge Technology Inc., Bedford, Massachusetts), which are driven by an
analog input/output card (National Instruments, Austin, Texas), and an objective lens to
collimate the chief rays of the beams and to focus the irradiance impinging the sample. The
light reflected back by the reference and sample arm is recombined by the beam splitter
and it is led to the spectrometer.
A spectrometer consists of a condensing lens to collimate the light, a volume diffraction
grating to spatially separate the spectrum and a magnifier objective compose of two
converging lenses to focus the signal on the detector, a 12-bit line-scan CMOS camera with
4096 pixels (Basler sprint spL4096-140k; Basler AG, Germany), is used to measure the
interference fringes of the spectrum.
Figure 2.1 Photograph of the actual custom Spectral-Domain Optical Coherence Tomography
device at the VioBio lab (Instituto de Óptica, “Daza de Valdés”)

Chapter 2
Experimental methods, computational techniques and other types of validation
63
Figure 2.2 The schematic diagram of the custom SD-OCT set-up, components: Low coherence
broad band spectrum source; Collimating lens; Beam Splitter 1; Reference mirror; Beam splitter
2; Badal system; Picoprojector and external screen; Scanning galvanic mirror; Objective lens;
Condensing lens; Grating; Line-scan CMOS camera

Biometric measurements in the crystalline lens: Applications in cataract surgery
64
2.1.2 Quantification tools
When imaging even perfectly flat surfaces by means of 3D OCT devices, they become
curved due to fan distortion (shown in Figure 2.3). This distortion can be described as a
combination of at least two possible effects: (1) architecture of the scanning system, with
relatively significant influence by the spatial separation of the mirrors; (2) design, position
and alignment of the collimation lens in relation to the mirrors of the scanner. Furthermore,
optical distortion is an effect produced while imaging a sample embedded in a medium
different from vacuum (air), and therefore the rays are bended by the effect of refraction
from preceding surfaces. Apart from the strongest refractive effect at the air-anterior cornea
(or tear film) interface, the major effects of refraction in a normal eye will happen in the
posterior cornea-aqueous humor, aqueous humor-anterior lens, and posterior lens-vitreous
humor interfaces.
Due to these distortions, OCT images need to be corrected for quantification. Custom-
algorithms correct the OCT data from fan distortion (arising from the scanning architecture)
and optical distortion (due to the refraction in the optical surfaces) (Ortiz, Siedlecki et al.
2009, Ortiz, Siedlecki et al. 2009, Ortiz, Siedlecki et al. 2010, Ortiz, Siedlecki et al. 2011,
Ortiz, Perez-Merino et al. 2012, Ortiz, Perez-Merino et al. 2013, Perez-Merino, Velasco-
Ocana et al. 2015).
Figure 2.3 Map of residual fan distortion before (a) and after (b) correction, obtained from a flat
optical surface with the OCT system of the study. Reproduced from (Ortiz, Siedlecki et al. 2010,
Ortiz, Siedlecki et al. 2011); (c) Illustration of the effect of the 3D distortion correction on the
anterior segment surfaces (all surfaces are corrected axially from refractive index. Green:
corrected volumes; red: uncorrected volumes). Reproduced from (Ortiz, Siedlecki et al. 2009,
Perez-Merino, Velasco-Ocana et al. 2015).
Dedicated image processing routines allow the segmentation of the optical surfaces and
quantification of their geometry (Ortiz, Siedlecki et al. 2009, Ortiz, Siedlecki et al. 2009,
Ortiz, Siedlecki et al. 2010, Ortiz, Siedlecki et al. 2011, Ortiz, Perez-Merino et al. 2012,
Ortiz, Perez-Merino et al. 2012, Ortiz, Perez-Merino et al. 2013). Custom image processing

Chapter 2
Experimental methods, computational techniques and other types of validation
65
algorithms for geometrical characterization of the OCT images, described in detail in the
previous studies of our lab (Ortiz, Siedlecki et al. 2009, Ortiz, Siedlecki et al. 2009, Ortiz,
Siedlecki et al. 2010, Ortiz, Siedlecki et al. 2011, Ortiz, Perez-Merino et al. 2012, Ortiz,
Perez-Merino et al. 2012, Ortiz, Perez-Merino et al. 2013) are comprised of: image
denoising, statistical thresholding, volume clustering, multilayer segmentation, further
surface denoising, pupil centration, 3D merging and surface fitting by sphere/conicoids and
elevation/topographic maps (Zernike polynomial). Custom-developed image processing
algorithms are applied for automatic structure detection (more detail will be described in
Section 2.6.2).
The large amount of noise appearing in the OCT images produces low contrast data,
therefore improving the detection ratio by image denoising is necessary for quantification.
In order to reduce the noise and to enhance the contrast, the denoising filter is applied by
averaging the pixel information across multiple scales and orientations.
After denoising the OCT images, the signal is separated from the background, taking into
account the existing difference in statistics of the signal and the background. The algorithm
of statistical thresholding classifies every single pixel of the data by its maximum
likelihood of belonging to a certain class, and only those points belonging to classes
different from noise are considered. As a result of the overlapping statistics of the noise and
signal, randomly distributed noise is still present in the images after thresholding.
A volume clustering algorithm based on area or volume classification was developed,
which allows identifying a layer if there was continuity in at least one of the directions of
the tensor mask (which is 3D convolved with the tensor of data).
Based on the first derivative boundary region identification, an algorithm extracts the
position of the peaks of every A-scan and sorts those peaks by position and intensity for
multilayer segmentation with the classified volumes.
Even after the denoising algorithm and boundary detection algorithms, the segmented
surfaces are still noisy due to the OCT system adding noise during the detection process.
The noise can be described as a ripple in the smooth surface of the anterior segment of the
eye based on a Zernike description of the surface (more detail will be described later in the
surface fitting paragraph). The Zernike expansion is uniformly sampled over the area of
interest and then the finite-element ray-tracing algorithm is applied and used to obtain
smooth surfaces from noisy raw elevation maps, acting as a sort of low pass filter for
further surface denoising.
The pupil center is used as a reference across measurements (i.e. cornea, anterior and
posterior lens) to define the optical zone (effective area within the pupil, shown in Figure
2.4). The corneal image is inverted, since for efficiency in the OCT focus range it is
obtained on the opposite side of the Fourier transform.
Then, the merging 3D volumes of cornea/iris/anterior and iris/anterior/posterior lens are
merged by the pupil center reference with help of the specular reflections and rotated to
superimpose the characteristic vectors of the corresponding pupil plane. The pupil
centration could also be used as a reference for pre- and post-operative analysis of anterior

Biometric measurements in the crystalline lens: Applications in cataract surgery
66
segments. Therefore, the pupil coordinates in 3D along with the normal to the pupil plane
are used for merging. The specular reflections from corneal and lens/IOL surfaces are also
used as a fixed reference for further merging 3D volumes. Furthermore, the IOL tilt and
decentration could be calculated by those specular reflections based on Purkinje
methodology, which will be described in Section 2.1.3.
Figure 2.4 Illustration of pupil centration as reference across: A: anterior and posterior cornea,
iris; B: iris and anterior lens; C: pupil, anterior lens and posterior lens in effective area within the
pupil; D: merged volumes of anterior segments. Blue and red points present anterior and posterior
cornea surfaces respectively; Light blue and black points present anterior and posterior lens
surfaces respectively; Yellow, green and pink points present iris.
Once the surfaces were corrected for fan distortion and optical distortion as stated before,
they could be fit by standard functions: spherical, conicoidal and topographic/elevation
maps (Zernike polynomials). The same custom routines for surfaces fitting are also used
to fit the corneal elevation maps provided by other instruments (Scheimpflug) used for
reference (more detail will be described in Section 2.3.1), and crystalline lens topographies.
Sphere:
(x − x0)2 + (y − y0)
2 + (z − z0)2 = a2 (Eq.2.1)
Where surface data is (x0, y0, z0), and a is the radius of sphere surface.
Conicoids:
(x − x0)2 + (y − y0)
2 − 2(z − z0)R + (Q + 1)(z − z0)2 = 0 (Eq.2.2)
Where the surface data is (x0, y0, z0), R is the radius of the conicoids surface and Q is the
conic constant.

Chapter 2
Experimental methods, computational techniques and other types of validation
67
Topographic/elevation maps (Zernike polynomials):
Free-form surfaces, such as irregular ocular surfaces in the human eye, cannot be described
with simple surfaces. We use a Zernike polynomial representation of the surfaces following
subtraction of the best fitting sphere, as described in earlier studies by multiple authors
(Schwiegerling, Greivenkamp et al. 1995, Barbero, Marcos et al. 2002, Sicam, Coppens et
al. 2004, Turuwhenua 2007). Zernike polynomials are a set of orthogonal polynomials that
describe a wavefront for optical systems or description of any arbitrary surface shape over
the unit circle (Svechnikov, Chkhalo et al. 2015).
There are even m
nZ and odd m
nZ
Zernike polynomials in Figure 2.5. The even polynomials
are defined as ( , ) R ( )cos(m )m m
n nZ and the odd polynomials as
( , ) R ( )sin(m )m m
n nZ , where m and n are nonnegative integers with n ≥ m, is the
azimuthal angle and ρ is the radii distance 0≤ρ≤1. The radial polynomials m
nR are defined
as
22
0
( 1) (n )!( )
!( )!( )!2 2
n m
km n k
n
k
kR
n m n mk k k
(Eq.2.3)
Each polynomial describes a specific form of surface deviation. Their combined sum can
produce a large number of more complex surface shapes and can be used to obtain smooth
surfaces from noisy raw elevation maps, acting as a sort of low pass filter for noise. In
principle, by including a sufficient number of Zernike polynomials (commonly referred to
as terms), any topography map can be described to a desired degree of accuracy. Anterior
and posterior cornea, anterior and posterior crystalline lens and IOL elevation maps were
fit to a sixth-order polynomial expansion (with 28 terms), thus obtaining quantitative
information of the ocular anterior segment (corneal topography, thickness and radii;
anterior chamber depth; lens/IOL geometry, thickness, tilt and decentration).

Biometric measurements in the crystalline lens: Applications in cataract surgery
68
Figure 2.5 Coefficients of the Zernike polynomials up to the 6th radial order with 28 terms using
the Optical Society of America (OSA) standard (Thibos, Applegate et al. 2002)
Figure 2.6 Quantitative anterior and posterior cornea and crystalline lens topography, after full
distortion correction. Maps are Zernike fits to the elevation maps, relative to the best fitting
sphere. (Ortiz, Perez-Merino et al. 2012)

Chapter 2
Experimental methods, computational techniques and other types of validation
69
2.1.3 Purkinje-like OCT en-face reflection image to measure lens tilt and
decentration
A specific new development of this thesis has been a method to estimate the tilt and
decentration of the crystalline lens or intraocular lenses. The method is inspired by the
Purkinje imaging methods previously implemented at VioBio Lab (Rosales, Dubbelman et
al. 2006, Rosales and Marcos 2006, de Castro, Rosales et al. 2007, Rosales and Marcos
2007, Rosales, Wendt et al. 2008, Rosales and Marcos 2009), but takes advantage of the
cross-sectional nature of OCT which allows unmistakengly identifying reflections from
each surface. Purkinje images are reflections of the light from anterior and posterior corneal
surfaces (first and second Purkinje images, PI, PII) and from anterior and posterior
crystalline/intraocular lens surfaces (third and fourth Purkinje images, PIII, PIV). OCT
technology resembles the Purkinje method, since three spots are observed in the en-face
OCT images in Figure 2.8 (a). In contrast to the standard Purkinje method, the spots are not
formed by the entire area of the ocular surfaces. Instead, the OCT system collects the
scattered light reflected back from the tissue, and when the reflected ray direction coincides
with the OCT axis, a strong specular reflection is captured in the test arm of the OCT,
producing a bright spot in the en-face OCT images. Unlike in the standard Purkinje method,
which relies on the images in a single plane of focus, the tomographic information of the
OCT images allows one to relate each reflection with the corresponding surface, as well as
avoiding image overlapping. The Purkinje image analysis (estimation of coefficients in a
set of linear equations) requires assumption of an eye model. The assumption of a general
computer eye model results in a decrease in the accuracy of the tilt and decentration
estimates (Rosales and Marcos 2006). Instead, individual anatomical and biometrical
parameters are used, generally obtained from corneal topography or keratometry, optical
biometry, and Purkinje phakometry. These parameters can be retrieved from the same OCT
dataset (Ortiz, Perez-Merino et al. 2012, Ortiz, Perez-Merino et al. 2013).
The Purkinje-like analysis can be summarized in five steps:
Collection of a volumetric dataset
Generation of image intensity values in the axial direction [Figure 2.7(a)]
Pupil segmentation and identification of the positions of the specular reflexes on
the different surfaces (Purkinje-like images positions, PI, PIII, and PIV) [Figure
2.7(b)]
Estimation of weighting coefficients A-G that depend on the individual anterior
segment geometry
Calculation of eye rotation, lens tilt and decentration from Purkinje Formulas. The
surfaces PI, PIII, and PIV are easily identified by checking the corresponding OCT
B-Scan image [Figure 2.7(c)].

Biometric measurements in the crystalline lens: Applications in cataract surgery
70
Figure 2.7 (a) Three-dimensional (3D) optical coherence tomography (OCT) image; (b) en-face
OCT image showing the pupil merging, the locations of PI, PIII, and PIV in red and pupil center
in yellow; (c) PI (left), PIII (center), and PIV (right) in OCT B-Scan images.
To resolve the global coordinates of 3D OCT images, we placed a USAF 1951 as a target,
shown in Figure 2.8 (a), to scan by SD-OCT in our lab. The fundus view from the
customized SOCT Data Processing program, developed previously in VioBio, is mirror
symmetric to the target, shown in Figure 2.8 (b). The fundus OCT image is saved as a JPG
image automatically with the proportion of A- and B-scans from the SOCT Data Processing
program and batched B-scan from left to right with increasing image numbers, but it is
rotated 90 degrees counterclockwise, shown in Figure 2.8 (c). For the collection of a
volumetric dataset, a customized Matlab algorithm is developed to batch B-scan input to
represent OCT fundus images automatically as saved, to restore image authenticity by
rescaling the image from the proportion of A-and B-scans OCT image (300/50) setting
to be the size of measurement (15/7 mm) shown in Figure 2.8 (e), to rotate saved fundus
images 90 degrees clockwise as shown in Figure 2.8 (f), and to flip the horizontal axis, due
to the mirror symmetric scanning, to have real en-face OCT images, shown in Figure 2.8
(g).
The tilt and decentration nomenclature and sign conventions are illustrated in Figure 2.7(c).
IOL tilt is defined as the angle between the IOL axis and the pupillary axis, where the IOL
axis is the line joining the centers of curvature of the IOL and the pupillary axis joining the
center of curvature of the cornea and the pupil center. IOL decentration is defined as the
distance between the IOL center and the pupil center. According to the existing conventions
(Rosales and Marcos 2006), positive horizontal decentration stands for nasal decentration
(in right eyes) and temporal decentration (in left eyes), and vice versa for negative; and
positive vertical decentration for superior, and negative for inferior. Positive tilt around the
horizontal axis (tilt x) indicates that the superior edge of the lens is moved forward.
Negative tilt around the vertical axis (tilt y), in right eyes, indicates that the temporal edge
of the lens is moved forward, and, in left eyes, indicates that the nasal edge of the lens is
moved forward.

Chapter 2
Experimental methods, computational techniques and other types of validation
71
Figure 2.8 (a) USAF 1951; (b) OCT fundus image in SOCT data process program ; (c) OCT
fundus image rotated 90 deg counterclockwise saved as JPG image; (d) Rescaling the height and
width of JPG from 300 A-scans and 50 B-scans OCT image as taken during OCT
measuremnts15x7 mm measurement setting; (e) Image fundus rotation 90 degree clockwise and
flipping around horizontal axis to have real en-face OCT image;(f) The definition of global
coordinates of eye rotation, IOL tilt and decentration based on en-face OCT image; (g)
Nomenclature and sign conventions for eye rotation, IOL tilt and decentration looking into the
human eyes, as seen by the observer. The coordinate is the same as (Rosales and Marcos 2006).
The custom algorithm of image processing written in Matlab (Mathworks Inc., Natick, MA)
segments the pupil edge and finds the center by ellipse fitting. Their Purkinje-like image
positions, PI, PIII, and PIV are manually identified horizontal and vertical coordinates
relative to the center of the pupil, are saved automatically. The method for estimating IOL
alignment is based on that described in previous works (Phillips, Perez-Emmanuelli et al.
1988, Barry, Dunne et al. 2001, Rosales and Marcos 2006). This method assumes a linear
relationship between Purkinje-like image positions (PI, PIII, PIV) and rotation of the eye
(β), IOL tilt (α), and decentration (d):
PI E
PIII F A C d
PIV G B D d
=
=
=
(Eq.2.4)

Biometric measurements in the crystalline lens: Applications in cataract surgery
72
A computer eye model was created in ZEMAX (Radiant ZEMAX; Focus software, Tucson,
Arizona, USA) using biometrical information of anterior and posterior surfaces of the
cornea obtained from OCT measurements and the IOL geometry obtained from noncontact
profilometry (more detail will be described in the Zemax routines sections of Section 2.6.1
and Chapter 3). To calculate the position of the reflex on the different surfaces, routines
were written in ZEMAX to search the rays that, following reflection from a surface, exit
the eye parallel to the optical axis. While the standard Purkinje method studies the image
created by all the rays passing through the pupil, the spots visible in en-face OCT images
are created by a few rays. Weighting coefficients: A-G depend on the individual anterior
segment geometry to calculate these coefficients. No tilt and no decentration (α=0 and d
=0) were set in the computer eye model, and the Purkinje-like reflex positions were
estimated for different rotation angles. A linear fit of the displacement of the reflex provided
the value of the coefficients E, F, and G. The same procedure was repeated for A and B
(setting β=0 and d=0) and C and D (with β=0 and α=0) (Barry, Dunne et al. 2001).
Eye rotation (β), lens tilt (α) and decentration (d) were obtained from the inversion in
Eq.2.5, using the positions of the experimental reflexes (PI, PIII, and PIV).
(D F C F) C PIV D
d
PIRotation angles
E
PIIITilt angles
C B D A
PIII F ADecentration
C
(Eq.2.5)
Although the standard Purkinje images and the Purkinje-like reflections in OCT en-face
images are different, the deviations between the Purkinje images represented in the
computer eye model (using β, α and d calculated) with the en-face OCT Purkinje-like
images (for PI, PIII, and PIV) were always below 20 μm. Chapter 3 will present tilt and
decentration data in five eyes of four patients obtained using the Purkinje-like method
developed in this thesis.

Chapter 2
Experimental methods, computational techniques and other types of validation
73
2.2 Total aberration measurement: Laser Ray Tracing (LRT)
2.2.1 LRT setup
Total wave aberrations are measured using a custom Laser Ray Tracing setup, described in
detail in previous studies from VioBio (Barbero, Marcos et al. 2003, Dorronsoro, Barbero
et al. 2003, Llorente, Diaz-Santana et al. 2003, Llorente, Barbero et al. 2004). The LRT
consists of three channels: Illumination channel (incoming rays), Pupil and Retinal
channel (outgoing) and Fixation channel (shown in Figure 2.9 (b) the scheme of the
custom-LRT).
Two possible wavelengths could be selected between two diode lasers (green light: 532 nm,
Brimrose, Baltimore, MA, USA; infrared: 786 nm, Schäfter+Kirchhoff GmbH, Hamburg,
Germany) for the Illumination channel. The measurements reported in this thesis are only
IR. Maximum energy exposure is 7.6 µW. The laser beam samples the pupil in 37 samples
typically, although the sampling pattern and density can be changed. The XY scanner (mod.
6210, Cambridge Technologies, Lexington, USA) consists of two rotating mirrors that
deflected the incoming unexpanded laser pencil. That composes the sequential sample
pattern with collimating lenses (with focal lengths of 50.8 mm). The sampling pattern is
adjusted by software to fit the subject’s pupil.
In the Retinal channel (outgoing), the charge couple device (CCD) camera (8 bits, 60 Hz
(video), 646 × 485 pixels, pixel size: 7.4 µm × 7.4 µm, Model XC-55, Sony Corp., Tokyo,
Japan) records the corresponding aerial images of light reflected off the retina. In the Pupil
channel, the pupil camera captures the corresponding image of the eye´s pupil
simultaneously with the spots reflected back from the retina on the retinal CCD (12 bits,
30 frames per second with 2×2 binning, 1024×1024 pixels, pixel size: 14×14 µm, Model
1M15, Dalsa, Waterloo, Canada).
Prior to the measurement, the patient adjusts his/her subjective refraction using a Badal
system from -12D to +12D in the Fixation channel, while viewing a stimulus on a
minidisplay placed on a retinal conjugate plane. Ray aberrations are obtained by estimating
the deviations of the centroids of the retinal spots images corresponding to each entry pupil
location with respect to the reference (chief ray).

Biometric measurements in the crystalline lens: Applications in cataract surgery
74
Figure 2.9 (a) Custom Laser Ray Tracing setup at the VioBio lab (Instituto de Óptica, “Daza de
Valdés”). Retinal camera captured the light reflected back from the retina. Pupil camera captured
the corresponding image of the eye´s pupil simultaneously with the retinal spots on the retinal
CCD. (b) Scheme of the custom-LRT modified from (Perez-Merino, Birkenfeld et al. 2014) (red
solid line: illumination channel; dark blue dash line: Pupil and retinal channel.)

Chapter 2
Experimental methods, computational techniques and other types of validation
75
2.2.2 Control and analysis software
The control and analysis software of the LRT was previously developed in our group by
Lourdes Llorente and Carlos Dorronsora thesis. The control software was written in Visual
Basic (Microsoft Corp., USA, front panel shown in Figure 2.10 (a)) and combined with
Matlab (Mathworks, Natik, MA) scripts, which allowed changing the sampling pattern
easily, e.g. scanned pupil diameter, sampling arrangement and density, and synchronizing
the scanner, shutter and cameras for the calibrations and measurements.
The ocular aberrations are obtained from the set of aerial images by an analysis program
developed in Matlab (Mathworks, Natik, MA). As showing in Figure 2.10 (b), the departure
of rays from their ideal positions at the image plane is calculated (transverse aberration)
from each aerial image and corresponding centroid, and the wave aberration is then
estimated by fitting the transverse aberration corresponding to each sampled point to the
derivatives of the Zernike polynomials, using a least squares method (Cubalchini et al.
1979). Chapter 5 will present laser ray tracing aberrometry measurements on patients
implanted with IOLs.
Figure 2.10 (a) Snapshot of the control program developed by Carlos Dorronsoro (Top right and
bottom left are the pupil and retinal images, respectively); (b) Example of aerial images obtained
from LRT using green and IR light in Panels A and B. Panel C shows the corresponding spot
diagram. Crosses and circles represent green and IR illumination respectively. (Llorente, Diaz-
Santana et al. 2003)

Biometric measurements in the crystalline lens: Applications in cataract surgery
76
2.3 Other techniques for validation
2.3.1 Pentacam: Scheimpflug camera for the validation of corneal
topography
The Pentacam images the anterior segment of the eye by a rotating Scheimpflug camera
measurement. This rotating process allows for the rapid capture of images in different
meridians, and therefore three-dimensional elevations. A commercial Pentacam
Scheimpflug topographer (Oculus Optikgeräte GmbH, Wetzlar, Germany), as shown in
Figure 2.11(a), has been used to get corneal topographies. In this thesis, anterior and
posterior corneal elevation maps, which are introduced into customized computer eye
models, were obtained from 3D OCT, as described in Section 2.1.2 and in earlier
publications (Perez-Merino, Velasco-Ocana et al. 2015), and were fit by 6th order Zernike
polynomials. Quantitative information of anterior and posterior corneal topographies
provided by Pentacam commercial software in Figure 2.11(b), using conventional clinical
protocols (corneal reflex centration, 25 cross-sections, 50 semi-meridians, chin and
forehead rest stabilization) will be used for the validation of corneal topography.
Figure 2.11 (a) Commercial Pentacam Scheimpflug topographer (Oculus Optikgeräte GmbH,
Wetzlar, Germany) at the VioBio lab (Instituto de Óptica, “Daza de Valdés”) (b) interface of
commercial Pentacam Scheimplug topographer
Figure 2.12 shows OCT-based anterior and posterior corneal elevation maps in 3 eyes
showing a good correspondence with anterior and posterior corneal elevation maps
obtained with a commercial Scheimpflug topographers from a previous study (Ortiz,
Siedlecki et al. 2011). Discrepancies of radii of curvature from Scheimpflug topography
and sOCT were between 1 and 2%. Chapter 5 will report OCT-based anterior and posterior
corneal elevation in three eyes of two patients implanted with IOLs, and corneal maps from
Pentacam obtained on the same eyes using the same pupil reference for comparison.

Chapter 2
Experimental methods, computational techniques and other types of validation
77
Figure 2.12 Corneal elevation maps obtained in 4 eyes obtained from different instruments
(relative to the best fitting sphere). R = radii of curvature of the best fitting sphere (from fits to
sphere quadrics), modified from (Ortiz, Siedlecki et al. 2011).
2.3.2 Sensofar PLu2300: Non-contact profilometry for the validation of
IOL geometry ex-vivo
Profilometry and OCT are both efficient measuring instruments used to measure a surface's
profile to quantify its geometrical information. The geometry of the IOLs was characterized
ex vivo using microscopy-based noncontact profilometry (Sensofar, PLu2300, Barcelona,
Spain), as shown in Figure 2.13 (a), using a 100x microscope objective, in order to have
the values of reference. To ensure the accuracy of measurements, each surface measurement
is repeated at least five times and the IOL is rotated in different directions between
measurements to ensure that the measurement results are not entirely consistent. Repeated
measurements on these lenses revealed repeatability in the apex measurement of 5 µm.
Both anterior and posterior lens surface topographies were measured in a 5.5×5.5 mm range
(1840 points, with 0.1-μm nominal vertical precision (on rigid samples), and 0.11mm
horizontal precision). De-hydration effects on these IOLs with high water content (25-26%)
decrease the effective precision.
The IOL surface profiles were fitted to conicoids (Section 2.1.2, Eq.2.2) (Perez-Escudero,
Dorronsoro et al. 2010) using custom routines written in MATLAB. The profilometric data
processing comprises the flowing steps: (1) importing the raw data (shown as Figure 2.13
(b)), (2) noise removal, (3) removal of potential tilts of the mounted IOL in the profilometric
measurements (Perez-Escudero, Dorronsoro et al. 2010)(shown as Figure 2.13 (c)). Non-
contact profilometry was used in this thesis to obtain the geometry of the IOLs ex vivo
(anterior and posterior IOL radii of curvature and thickness).

Biometric measurements in the crystalline lens: Applications in cataract surgery
78
Figure 2.13 (a) Commercial non-contact profilometry (Sensofar, PLu2300, Barcelona, Spain) (b)
profilometry raw data with tilt and noise (c) quantified anterior and posterior surfaces of
intraocular lens with customized algorithm
2.3.3 Water-cell physical model eye for the validation of eye rotation, IOL
tilt and decentration
The cornea and IOL form a compound optical system, but they are not a centered optical
system, with the fovea tilted with respect to the optical axis. The IOL is both tilted and
decentered with respect to the pupillary axis to compensate for the aberration of the cornea,
so the results of this simulation result are to demonstrate key points for the further research.
The physical model eye in Figure 2.14 had been previously built at VioBio Lab (de Castro
et al., 2007) specifically for the validation of eye rotation, IOL tilt and decentration, where
nominal values could be set. The water-cell physical model with a PMMA contact lens
(AR3 Vision, Madrid, Spain) simulating a spherical cornea (7.80 mm and 6.48 mm anterior
and posterior radii of curvature, respectively, with 0.5 mm central thickness), with
parameters similar to the Gullstrand eye model and an IOL (aspheric biconvex IOL)
mounted on a XYZ micrometer stage and rotational stage was used for testing. The water-
cell eye model is similar to that reported in previous work (de Castro, Rosales et al. 2007,
Ortiz, Perez-Merino et al. 2013), except for the IOL. We used the same A-IOL type
(Crystalens AO 23.5 D) in the artificial eye that was implanted in the patients under test.
Radii of curvature, axial biometry, and refractive indices in the physical model eye can be
found in Table. 2.1. The thickness of the IOL (Crystalens AO 23.5 D) was measured using
the profilometry system mentioned in Section 2.3.1.
This artificial eye was used in validations of the tilt and decentration measurement method
developed in this thesis. Measurements were obtained for the artificial eye with the lens in
air (i.e., cell not filled in with water) and in water. The IOL was tilted inside the water-cell

Chapter 2
Experimental methods, computational techniques and other types of validation
79
eye from −5 to 5 degrees in 1-deg steps and decentered from −1.9 to 1.9 mm in 0.6- mm
steps.
Figure 2.14 (a) Photograph and (b) schematic diagram of the physical model eye developed for
this study. A PMMA contact lens simulates the cornea. The IOLs are positioned with an XYZ
micrometer stage and rotational stage (de Castro, Rosales et al. 2007).
Table 2.1 Radii of curvature, axial biometry, and refractive indices in the physical model eye

Biometric measurements in the crystalline lens: Applications in cataract surgery
80
2.3.4 Custom computer model eyes
OCT-based elevation data from both anterior and posterior corneal surfaces, anterior
segment distances, IOL geometry, IOL alignment, Eye rotation angle lambda λ and axial
length from IOLMaster (Carl Zeiss AG, Jena, Germany) were exported to ZEMAX, where
the custom model eyes were simulated. The elevation data obtained from OCT distortion-
corrected surfaces were fit to a Zernike polynomial expansion (up to 6th order) described
in Section 2.1.2 and Eq.2.3. The object (light source) was set at infinity. Refractive indices
of the cornea, aqueous humour, and vitreous humour were 1.376, 1.337 and 1.337
respectively at 555nm. Knowledge of the Abbe number of the IOL material allowed
extrapolating the index of refraction from the visible to other wavelengths (i.e., IR typically
used in wavefront sensing).
Abbe number ' '
( ) 1( )
F C
n
n n
= (Eq.2.6)
Where 'Fn and 'Cnare the refractive indices of the material at the wavelengths of the F’
and C’ spectral lines (486.1 nm and 656.3 nm respectively). Wave aberrations were
calculated in the pupil plane, placed at the Anterior Camber Depth (ACD) distance from
the posterior corneal surface, by tracing a rectangular array grid of 64×64 collimated rays,
with wavelength 555 nm, through the eye surfaces within the central 5-mm pupil diameter
area. Figure 2.15 illustrates the computation of aberrations from OCT data, i.e. ray tracing
calculation on OCT distortion-corrected corneal and IOL surfaces. Data was analyzed in
terms of Zernike coefficients and retinal image quality metrics (MTF and Visual Strehl)
(Applegate, Marsack et al. 2003, Cheng, Thibos et al. 2003, Guirao and Williams 2003,
Applegate, Marsack et al. 2006, Iskander 2006). More detail will be described in Section
2.4.3.
Custom computer model eyes were used in this thesis to simulate aberrations, allow
understanding the relative contribution of optical geometrical and surgically-related factors
to image quality, and improve selection of the IOL to be implanted, in particular, for the
calculation of IOL power with higher accuracy than regression-formulae.

Chapter 2
Experimental methods, computational techniques and other types of validation
81
Figure 2.15 Illustration of the computation of aberrations using quantitative OCT geometrical
data in a customized computer pseudophakic eye model

Biometric measurements in the crystalline lens: Applications in cataract surgery
82
2.4 Optical quality metrics
2.4.1 Spot diagrams
Since the advent of ray tracing computational programs software (such as ASAP (Breault
Research Organization, Inc., Tucson, AZ), ZEMAX (Radiant ZEMAX; Focus software,
Tucson, AZ), Code V (Optical Research Associates, Pasadena, CA) or OSLO (Lambda
Research Corporation, Littleton, MA)) , it is possible to trace very quickly a large number
of rays in the entry pupil of human eye, and the computed intersections of these rays with
the receiving ocular surfaces provide a 'spot diagram' which gives a good deal of evaluating
the image quality numerically.
The spot diagram is important in predicting the performance of lenses from an analysis of
their designs. The light rays can be traced by simulations in Zemax, as demonstrated in the
spot diagrams from Figure 2.16(a) or experimentally from Laser Ray Tracing
measurements, as shown in Figure 2.16(b). The geometric spot (GEO) radius for each field
point are the deviations from the reference point, and the reference points are defined as
either the chief rays at the primary wavelength, the centric of all rays traced or the middle
of the spot cluster. In other words, the GEO radius is the radius of the centric circule at the
reference point which encloses all the rays. The information of the spread of all rays can be
showed by the RMS spot radius, which depends upon each ray of light; while the GEO
radius only gives information related to the ray which is farthest from the reference point.
Figure 2.16 (a) Example of RMS radius and max GEO radius report of spot diagram from -14 to
14 degrees’ field angle around horizontal axis with three wavelengths (Blue, green and red present
the wavelengths of 486.1 nm, 587.6 nm and 656.3 nm, respectively) in Zemax; Circle in white is
Airy Disk; (b) Example of spots diagram images obtained from LRT at 543 nm wavelength

Chapter 2
Experimental methods, computational techniques and other types of validation
83
2.4.2 Zernike coefficients and RMS wavefront error
Aberrations are departures of the performance from the predictions of paraxial
approximations in an optical system, which leads to blurring of the image. The most
important aspect of aberration analysis is the optical path difference (OPD) between the
chief ray and other rays originating from the same object point at the focus location by
using Snell’s laws of refraction and Fermat’s principles in Figure 2.17(a). While the
wavefront aberration form (shown in Figure 2.17(b)) is more directly related to the physical
fundamentals determining image quality, ray aberration form (shown in Figure 2.17(c))
offers a more convenient graphical interface for the initial evolution of the optical quality
for the whole system.
Figure 2.17 (a) Optical Distance Errors; (b) Wavefront Error; (c) Ray Errors
The wave aberrations of a general optical system can be described mathematically by a
polynomial series. Zernike polynomial expansion, mentioned before in the section on
elevation based topography (Eq.2.3, in Section 2.1.2), has also become the standard for
representing wave aberration data because the polynomials form an orthogonal set over a
unit circle, and aberrations are usually in reference to circular pupils (Malacara 1990,
Mahajan 1994). This makes them suitable for accurately describing wave aberrations as
well as for data fitting.
Monochromatic aberrations include piston, tilt, astigmatism, defocus, coma, spherical
aberration (shown in Figure 2.18). Spherical aberration (arising from the asphericity of
the optical surfaces), coma (mainly associated to local irregularities, tilt and decentration
of ocular surfaces), and astigmatism (mainly produced by toricity of ocular surfaces and
tilt of the lens) are the three dominant aberrations which result from deviations in the
wavefront form from spherical, and spherical aberration is the only aberration independent
of the eye rotation, IOL tilt and decentration.
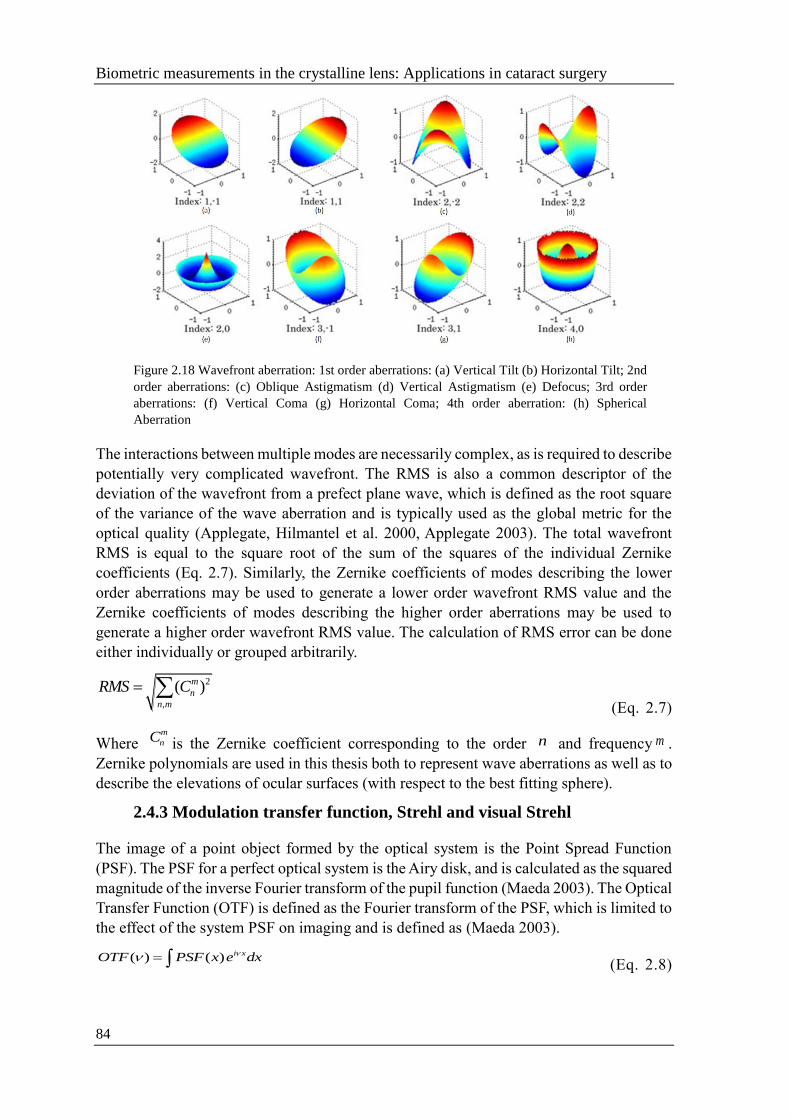
Biometric measurements in the crystalline lens: Applications in cataract surgery
84
Figure 2.18 Wavefront aberration: 1st order aberrations: (a) Vertical Tilt (b) Horizontal Tilt; 2nd
order aberrations: (c) Oblique Astigmatism (d) Vertical Astigmatism (e) Defocus; 3rd order
aberrations: (f) Vertical Coma (g) Horizontal Coma; 4th order aberration: (h) Spherical
Aberration
The interactions between multiple modes are necessarily complex, as is required to describe
potentially very complicated wavefront. The RMS is also a common descriptor of the
deviation of the wavefront from a prefect plane wave, which is defined as the root square
of the variance of the wave aberration and is typically used as the global metric for the
optical quality (Applegate, Hilmantel et al. 2000, Applegate 2003). The total wavefront
RMS is equal to the square root of the sum of the squares of the individual Zernike
coefficients (Eq. 2.7). Similarly, the Zernike coefficients of modes describing the lower
order aberrations may be used to generate a lower order wavefront RMS value and the
Zernike coefficients of modes describing the higher order aberrations may be used to
generate a higher order wavefront RMS value. The calculation of RMS error can be done
either individually or grouped arbitrarily.
2
,
( )m
n
n m
RMS C (Eq. 2.7)
Where m
nC is the Zernike coefficient corresponding to the order n and frequency m .
Zernike polynomials are used in this thesis both to represent wave aberrations as well as to
describe the elevations of ocular surfaces (with respect to the best fitting sphere).
2.4.3 Modulation transfer function, Strehl and visual Strehl
The image of a point object formed by the optical system is the Point Spread Function
(PSF). The PSF for a perfect optical system is the Airy disk, and is calculated as the squared
magnitude of the inverse Fourier transform of the pupil function (Maeda 2003). The Optical
Transfer Function (OTF) is defined as the Fourier transform of the PSF, which is limited to
the effect of the system PSF on imaging and is defined as (Maeda 2003).
( ) ( ) i xOTF PSF x e dx (Eq. 2.8)

Chapter 2
Experimental methods, computational techniques and other types of validation
85
Where x is the spatial coordinate in the image plane, and is spatial frequency. The
Modulation Transfer Function (MTF) is the modulus of the OTF, and represents the
decrease in the contrast as a function of the spatial frequency (Maeda 2003).
MTF OTF (Eq. 2.9)
With RMS wavefront errors, the generalized MTF can be assumed to also represent the
averaged contrast drop for a given RMS error for asymmetrical aberrations, like coma,
astigmatism and irregular high order wavefront of the actual system. Maeda et al. (Maeda
2003) generated PSFs and MTFs of wave aberration corresponding to each Zernike mode
up to the 6th order with a 4mm pupil size, and 0.53/0.2 wavelength RMS wavefront error
for PSF and MTF respectively (shown as Figure 2.19), to show how the various Zernike
modes affect the PSF and MTF relative to an unaberrated system.
The Strehl Ratio (SR) is a measure of the quality of optical image formation, originally
proposed by Karl Strehl (1864-1940), and describes the reduction in the peak power of the
point image basically. In the spatial domain, it can be calculated directly from the PSF. SR
is defined as the maximum value of the PSF in the presence of aberrations, normalized by
the maximum of the diffraction limited PSF (ranging from 0 to 1, with 1 defining a perfect
optical system) for the same pupil size. In the frequency domain, the SR is computed as the
volume under the MTF of an aberrated system normalized by the diffraction-limited MTF,
for the same pupil diameter.
(x, y)
(x, y)
aberrated
ideal
PSFStrehl Ratio
PSF
(Eq. 2.10)
As the Strehl Ratio includes in the calculation spatial frequencies of the MTF beyond those
relevant to the visual system, a new metric was introduced to adapt the definition to visual
optics (Visual Strehl ratio (VS)). VS has been shown to hold the highest correlation
variance against subjective acuity (Cheng, Thibos et al. 2003), and showed the highest
predictability (Buhren, Pesudovs et al. 2009). The Visual Strehl is computed as the volume
under the visual MTF, which is obtained by overlapping the MTF with the inverse of a
general neural transfer function and normalizing to the diffraction limit. The VS was based
on calculated OTF across all spatial frequencies. In this thesis, we have used VS as our
optical quality metric, considering high order aberration from 3rd order to 6th order
with/without Astigmatism. Depth of focus was also estimated with a range of ±1.5D with
0.125D defocus steps.
Biometric measurements in the crystalline lens: Applications in cataract surgery
86
2.5 Ex vivo and in vivo measurements
2.5.1 Lens specimens, preparation and experimental protocol
This thesis involved measurements on donor lenses (a total of 36 eyes) and on patients
before and after implantation of IOLs (a total of 11 eyes). Thirty-six isolated human
crystalline lenses from twenty-eight human donor eyes were obtained from the BST Eye
bank (Banc de Sang i Teixits, Barcelona, Spain). In all cases the cornea had been previously
removed by the eye bank for clinical use. All eyes were shipped in sealed vials at 4°C and
moisturized in preservation medium (DMEM/F-12, HEPES). Crystalline lenses with
evident cataract formation and lenses with obvious surface damage were exclusion from
the study. Methods for securing human tissue were in compliance with the Declaration of
Helsinki. The handling and experimental procedures, described in detail in a prior
publication (Birkenfeld, de Castro et al. 2014), have been approved by the institutional
Review Boards of BST and Consejo Superior de Investigaciones Científicas (CSIC). The
post-mortem time varied between 1 and 3 days at the time of the experiment. A typical
experimental session lasted 1-2 hours. Measurements on donor eyes are described in
Chapter 4.

Chapter 2
Experimental methods, computational techniques and other types of validation
87
2.5.2 Patients
Eleven cataract patients (fifteen eyes) were measured before and after cataract surgery (IOL
implantation) in this thesis. The age range is from 66 to 84 years old. Standard phaco-
emulsification intracapsular cataract surgery had been performed by a single surgeon at
Fundación Jiménez Díaz Hospital (FJD). The measurements performed on those patients
started with an aberrometery designed in the group, and all measurements in pre- and post-
operative patients were performed under mydriasis (phenylephrine 10%).
Total wave aberrations were measured using a custom-developed LRT system. We use a
commercial Scheimpflug image topographer Pentacam (Oculus, Germany) to get corneal
topography as a reference, and an IOLmaster (Carl Zeiss AG, Jena, Germany) to obtain the
axial length of the eye. Anterior segment geometry (cornea, iris and IOL) was measured
using a custom-developed SD-OCT. LRT measurements were done under foveal fixation,
and OCT measurements were done at with off-axis fixation that aligned the pupillary axis
with the optical axis of the instrument. Experimental protocols were approved by
Institutional Review Boards at FJD and CSIC. Patients signed informed consent after the
nature of the study had been explained to them. All protocols followed the tenets of the
Declaration of Helsinki. More detail could be found in Section 5.2.2.
Figure 2.19 Process steps of patients’ measurement: Aberrometry, Pentacam, IOLmaster and
Optical Coherence Tomography

Biometric measurements in the crystalline lens: Applications in cataract surgery
88
2.6 Virtual ray tracing calculations
2.6.1 Zemax routines
Sequential ray tracing was performed using commercial dedicated software ZEMAX
(Radiant ZEMAX; Focus software, Tucson, Arizona, USA). Several variables must be pre-
defined for the ray tracing: 1) Light/object source, the field angle of the ray entering the
optical system. 2) Position, shape type of image surface and coordinate break. 3) Stop
surface and size, which defines the entrance-exit pupil size and position. 4) Wavelength
used for the ray tracing.
Zemax based computations were used in this thesis for the following purposes:
-Build full 3D OCT-based custom pseudophakic computer eye models
The 3D Layout in Figure 2.20 shows visible light rays passing through the pupil in a
personalized computer eye model. Corneal Surfaces are OCT-based 6th order Zernike
Surface Sag on best fitting sphere and IOL surfaces are OCT-based geometry (aspheric
surfaces) with IOL tilt and decentration from Purkinje-like OCT method. OCT-based
biometry such as corneal thickness and anterior camber depth are also introduced into the
customized eye model, with axial length from the IOLMaster. The corresponding study will
be presented in Chapter 5.
Figure 2.20 Solid Model 3/4 draw section of full-OCT based customized eye model. Corneal
Surfaces: OCT-based 6th order Zernike Surface Sag on best fitting sphere; IOL Surfaces: OCT-
based geometry (aspheric surfaces); Biometry: OCT-based corneal thickness and ACD; axial
length from IOLMaster; Alignment: IOL tilt & decentration from Purkinje-like OCT; Angle
lambda from eye rotation.
-Estimation of weighting coefficients in Purkinje method tilt and decentration (see
Section 3.2.5)
Eye rotation, IOL tilt and decentration were calculated from Purkinje-like methodology
described in Section 2.1.3. Simulation routines were written in ZEMAX using biometrical
information of anterior and posterior surfaces of the cornea obtained from OCT
measurements and the IOL geometry obtained from noncontact profilometry (shown in

Chapter 2
Experimental methods, computational techniques and other types of validation
89
Figure 2.21): PI: Reflection from Cornea; PIII: Refracted through cornea, reflected at
anterior lens, refracted back through cornea; PIV: Refracted to back of lens, reflected by
posterior lens, refracted back to anterior cornea.
Figure 2.21 3D layouts of simulations in ZEMAX (a) PI (b) PIII (c) PIV
- Calculations of high order aberrations in custom pseudophakic eye models, and
comparison with high order aberration measurements.
The wave aberration is reconstructed from a finite number of rays. The accuracy of the
result depends on whether the sampling is sufficiently dense. Therefore, wave aberrations
were calculated by tracing a rectangular array of grid 64×64 collimated rays through the
eye surfaces within a central 5-mm pupil diameter area, at 555 nm. A complete ray tracing
procedure provides a discrete set of local measurements of the wave aberration. Zemax
uses a modal reconstruction with a standard least squares algorithm fitting to a Zernike
expansion in Zemax order, which will be transferred to OSA Zernike polynomial order. The
corresponding study will be presented in Chapter 5. (MATLAB algorithm of shifting
between Zemax order and OSA order will be described in Section 2.6.2).
- Calculation of optimal IOL lateral position
In order to identify optimal IOL centration, OCT-based ray tracing on a pseudophakic eye
model has been used to control an optical system's primary structure control off-axis
designated view, and estimated for the native tilt & decentration, with simulated
decentrations ranging from -1– 1mm in 0.1 mm steps for 5 mm pupil diameters in the
horizontal and vertical meridians with reference to the pupil center, as shown in Figure
2.22. The optical aberration of each simulation designated beam structure in terms of
aberration structure, usually with defocus, spherical aberration, RMS astigmatism, RMS
coma aberration, and other optical quality metrics in terms of VS as parameters. More detail
about Optical quality metrics will be explained in Section 2.4. The corresponding study
will be presented in Chapter 6.

Biometric measurements in the crystalline lens: Applications in cataract surgery
90
Figure 2.22 (a) Real IOL decentration in patient’s eye after cataract surgery (b) solid model ¾
draw sections of customized eye model with simulated decentrations ranging is from -1– 1mm in
0.1 mm steps for 5 mm pupil diameter along horizontal and vertical meridians, with reference to
the pupil center

Chapter 2
Experimental methods, computational techniques and other types of validation
91
2.6.2 MATLAB routines
MATLAB is a powerful numerical computing package with a large range of mathematics
and visualization tools, which is useful for post-processing Zemax simulations. As we
stated in Section 2.1.2 (Quantification tools of 3D anterior segment spectral domain OCT),
in order to produce automated image processing and analysis techniques that can overcome
the above mentioned limitations, a series of custom algorithms have been developed in the
VioBio lab before, which included algorithms for inputting data, denoising of raw data,
statistical thresholding, clustering, 3D merging, multilayer segmentation, pupil centering,
geometrical distance calculation, distortion corrections and surface fitting by Zernike terms
and quadrics (Ortiz, Siedlecki et al. 2010). Recently Eduardo et al. (E. Martínez-Enriquez
2016) improved the customized algorithm of quantitative anterior segment OCT and
developed dedicated algorithms to estimate lens volume (VOL), equatorial diameter (DIA)
and equatorial plane position (EPP) (shown in Figure 2.24).
Figure 2.23 Illustration of OCT automatic image processing (Ortiz, Siedlecki et al. 2010, E.
Martínez-Enriquez 2016)
The MATLAB software program also took exported data from the instrument and created
a suitable file for input into the Zemax program when corneal topography measurements
were performed. The .DAT file generated by the MATLAB function was imported to
Zemax and used to define a Zernike sag surface. The elevation data of the corneal was fit
with a Zernike polynomial expansion using 28 terms. Since Zemax order and OSA order
are different, Algorithm 1 allows switching between the orders:

Biometric measurements in the crystalline lens: Applications in cataract surgery
92
These .DAT files are imported into Zemax when creating personalized pseudophakic eye
models (see Chapter 5) to define the anterior and posterior corneal surface by Algorithm 2.
In order to analyze 3D-OCT surface topography of isolated human crystalline lenses,
Algorithm 3, 4 and 5 were written in MATLAB which allowed for the evaluation of surface
elevation with higher order terms, their relationships between anterior and posterior lens
surfaces, and potential changes with age, similar to previous analysis on corneal surface
topographies. To ensure optimal signal from both lens surfaces, each set of 3D images
consisted of two acquisitions at two different planes of focus which were merged to produce
a complete image of anterior surface, posterior surface, and the cuvette holding the lens,
using customized MATLAB programs. The images were merged using the cuvette as a
reference to produce a full 3D image of the crystalline lens. Custom algorithms merged the
images of the crystalline lens, obtaining images of both lens surfaces in two different planes
and the cuvette distorted by the lens, fan distortion and optical distortion (de Castro, Ortiz
et al. 2010), obtaining topographic lens surface elevation maps and lens alignment by
steepest meridian of the anterior surface (shown in Figure 2.25).

Chapter 2
Experimental methods, computational techniques and other types of validation
93
Figure 2.24 Illustrated algorithm of OCT 3D surface topography of isolated human crystalline
lenses

Biometric measurements in the crystalline lens: Applications in cataract surgery
94
As the step of pupil centering in OCT image processing, the apex of the lens was used as a
reference to center each surface. Lens surface elevation maps (obtained by subtraction of
the best fitting spheres from the segmented surfaces) were fitted to 6th order Zernike
polynomials with 28 terms in a 6 mm pupil diameter. Descriptive parameters of the surface
elevation maps include individual surface Zernike coefficients (up to 6th order), and the
RMS of combination of some terms (RMS astigmatism, RMS trefoil, RMS tetrafoil, RMS
spherical terms, RMS coma and RMS high order Astigmatism) for statistical analysis.
Dynamic Data exchange (DDE) is a method for MATLAB and Zemax to pass information
to each other. Taking advantage of the MATLAB mathematical and plotting libraries to
analyze Zemax is more effective and automatic. IOLs from the catalog could be implanted
into the computer eye model by updating Zemax editors with contents of server memory,
and also could change the IOL position from MATLAB (Algorithm 6 and 7). The Zemax
simulation is accessible to get the optical quality at the image surface as retina of human
eye by ray tracing, and MATLAB commands allow getting Zernike coefficients from
Zemax aberration report directly and saving those values into excel.

Chapter 2
Experimental methods, computational techniques and other types of validation
95
The PSF, MTF and OTF were computed using Fourier optics from Zernike coefficients
using routines written in MATLAB. The PSF for the corresponding levels of defocus was
generated using custom-developed routines written in MATLAB for 5-mm pupils. The
defocus term was set to 0, and to the value corresponding to the defocus setting shift (1.5D
to -1.5D with 0.125D as step) for any other condition. Optical quality was described in
terms of the Visual Strehl metric. Visual Strehl was computed as the volume under the
Visual MTF normalized to the diffraction limit. The VS was evaluated through focus
(considering HOAs with/without the astigmatic terms). The maximum value of the
through-focus Visual Strehl curve was obtained as the best corrected optical quality metric.
A Customized algorithm created in MATLAB calculated the VS across IOL decentrations
in the range of 2 mm with 0.1 as step, plot a table chart with a 12×12 square symbols to
present VS value of simulation coded by color (red means high value, and blue mean low
value). Based on the highest VS location, the optimal IOL position was defined.

Biometric measurements in the crystalline lens: Applications in cataract surgery
96
As we maintained in Section 2.1.3, the detection of Purkinje images PI, PIII and PIV and
pupil center in the pupillary images is performed with a customized algorithm using
MATLAB. It also allowed generation of image intensity values in the vertical axial
direction, to distinction of pupil edge for pupil segmentation and center finding by ellipse
fitting, the results of which were validated by clicking 15 points on the pupil edge manually,
then the positions of the specular reflexes in the different surfaces were marked by clicking
5 points manually (Purkinje-like images positions, PI, PIII, and PIV) and horizontal and
vertical position with reference to the center of the pupil were saved automatically.

Chapter 3
Intraocular lens alignment from an en-face OCT image Purkinje-like method
97
CHAPTER 3
INTRAOCULAR LENS
ALIGNMENT FROM AN EN-
FACE OCT IMAGE
PURKINJE-LIKE METHOD

Biometric measurements in the crystalline lens: Applications in cataract surgery
98
This chapter is based on the following publication:
M. Sun, A. de Castro, S. Ortiz, P. Perez-Merino, J. Birkenfeld and S. Marcos
(2014). "Intraocular lens alignment from an en-face optical coherence
tomography image Purkinje-like method." Optical Engineering 53(6):
061704-061704.
The contribution of Mengchan Sun to the study, in collaboration with other
coauthors, was the literature search, the design of the experiments and the data
acquisition (in collaboration with Alberto de Castro), the development of
specific routines (in collaboration with Sergio Ortiz and Alberto de Castro),
the simulations of Purkinje image and the analysis of the data.

Chapter 3
Intraocular lens alignment from an en-face OCT image Purkinje-like method
99
RESUMEN
Objetivos: El ojo humano es un sistema óptico no centrado, con la lente generalmente
inclinada y descentrada con respecto a otros ejes en el ojo. El desalineamiento de las lentes
intraoculares (IOL) implantadas en la cirugía de cataratas es particularmente relevante, ya
que puede tener un impacto en el rendimiento óptico de nuevos diseños de IOLs más
sofisticados. El capítulo presenta un nuevo método para medir la inclinación y la
descentración del cristalino on IOL basado en las posiciones de las llamadas imágenes de
Purkinje (reflexiones desde la superficie corneal anterior y superficies de las lentes anterior
y posterior), linealmente relacionadas con la IOL Inclinación y descentración. En el método
presentado se hace uso de imágenes OCT” en-face”, que muestran reflejos de Purkinje
similares, pero que, debido a la naturaleza tomográfica de la OCT, pueden ser
inequívocamente identificados y no enmascarados por potenciales superposiciones.
Métodos: La medición de lentes intraoculares (IOL) implantada en pacientes en cirugía de
catarata es importante para entender su rendimiento óptico. Presentamos un método para
estimar la inclinación y descentralización de las IOL a partir de imágenes de Tomografía
de Coherencia Óptica (OCT). Las imágenes en-face OCT muestran imágenes similares a
Purkinje que corresponden a las reflexiones especulares de las superficies corneal y de IOL.
A diferencia de la imagen de Purkinje estándar, la naturaleza tomográfica de OCT permite
una asociación inequívoca de la reflexión con la superficie correspondiente. Las
localizaciones del tipo Purkinje son combinaciones lineales de inclinación de IOL,
descentración de IOL y rotación de ojo. Los coeficientes de ponderación dependen de la
geometría del segmento anterior individual, obtenida a partir del mismo conjunto de datos
de OCT. La metodología se demuestra en un ojo modelo artificial con cantidades fijadas de
la inclinación y de la descentración de la lente, y en 5 ojos pseudofáquicos.
Resultados: La inclinación y descentración medidas en el ojo artificial difirieron en 3.7%
y 0.9%, respectivamente, de los valores nominales. En pacientes, la inclinación media de
la IOL y la descentralización de Purkinje fueron de 3.30±4.68 grados y 0.16±0.16 mm,
respectivamente, y difirieron en promedio de 0.5 grados y 0.09 mm, respectivamente, de
las mediciones directas en las imágenes OCT corregidas por distorsión.
Conclusiones: Junto con la biometría / geometría ocular, la alineación de la IOL se puede
incorporar en modelos de ojo computacionales personalizados para evaluar los factores que
contribuyen a la degradación óptica en pacientes implantados con IOL. La metodología
basada en Purkinje a partir de imágenes OCT en-face en el segmento anterior proporcionó,
por tanto, medidas fiables de la inclinación y descentración de la IOL.

Biometric measurements in the crystalline lens: Applications in cataract surgery
100

Chapter 3
Intraocular lens alignment from an en-face OCT image Purkinje-like method
101
3.1 Introduction
Cataracts are one of the major causes of vision loss in the aging population. The common
treatment for cataracts is the replacement of the natural lens by an intraocular lens (IOL).
In an intracapsular procedure, the IOL is inserted in the capsular bag, following
phacoemulsification and aspiration of the crystalline lens material, through a circular
window in the anterior capsule (capsulorhexis), with the lens haptics pressing against the
equatorial region of the capsular bag. The stability of the IOL in the capsular bag depends
on the material and design of the haptics. With state-of-the art monofocal IOLs, IOL tilt
and decentrations are generally of similar amounts to those of the natural crystalline lens
(de Castro, Rosales et al. 2007).
Originally, the main goal of a cataract treatment was to eliminate scattering, but IOLs have
evolved enormously, first to additionally correct for refractive errors, but more recently, to
compensate for HOA, particularly spherical aberration. Also, new IOL designs aim at
correcting presbyopia, either by expanding the depth-of-focus of the eye (multifocal IOLs,
M-IOLs) or by dynamically changing the refractive power (accommodating IOLs, A-
IOLs). With the increased sophistication of IOL designs, the impact of the IOL position
becomes more critical. The aimed correction of corneal HOA by aspheric IOLs may be
compromised by the introduction of other HOA by a tilted/decentered lens(Atchison 1991).
The performance of refractive M-IOLs (generally with concentric or segmented near/far
regions) is critically affected by misalignments of the IOL (Menapace, Findl et al. 2007).
Finally, tilts and decentrations occurring with the only FDA-approved A-IOL may also play
a role in its function(Marcos, Ortiz et al. 2013). Measurement of tilt and decentration of
IOLs in pseudophakic eyes is therefore important as an endpoint for treatment, particularly
with premium IOLs. On the other hand, in combination with biometric and anatomic ocular
data, knowledge of IOL and eye alignment is important in the development of customized
computer eye models, which give insights into the relative contribution of different factors
of optical performance with IOLs (Rosales and Marcos 2007, Rosales, Wendt et al. 2008).
Several methods have been presented to measure IOL tilt and decentration as maintained
in Section 1.4.1. Purkinje imaging relies on the acquisition of pupillary images containing
Purkinje images I, III and IV. The relative positions of PI, PIII and PIV with respect to the
pupil center are proportional to eye rotation, IOL tilt and IOL decentration. The Purkinje
imaging device is simple and the measurement typically robust, although it may be subject
to some limitations: difficulties in the association of the images to the corresponding
reflecting surfaces (some authors have solved this by projecting a semicircular ring of
LEDs, yielding relative inverted images for PI and PIV (Tabernero, Benito et al. 2006));
overlapping of the different Purkinje images (usually overcome by eccentric illumination
and image acquisitions at different eccentric fixations) (Rosales and Marcos 2006);
requirement of ocular geometrical and biometric information (normally obtained from
other instruments).
As maintained in Section 1.4.1, Scheimpflug imaging has also been used to estimate tilt
and decentration of IOLs by analysis of the orientation and shift of the lens in cross-
sectional images of the anterior segment of the eye (Coppens, van den Berg et al. 2005, de
Castro, Rosales et al. 2007). The 3D tilt and decentration can be obtained from sinusoidal
fitting of the 2D coordinates. While the method is direct (i.e. relies on the direct viewing of

Biometric measurements in the crystalline lens: Applications in cataract surgery
102
the lens), it is subject to several limitations: refraction distortion of the lens images and
relatively sparse meridional sampling. IOL tilt and (to a less extent) decentration from this
technique are in good agreement with Purkinje-based measurements (de Castro, Rosales et
al. 2007). The accuracy and precision of the Scheimpflug data were tested in measurements
in an artificial eye, with a discrepancy from nominal values of 0.24 deg, on average, for tilt
(0.28 deg for Purkinje-based tilt), and 0.23 mm, on average, for decentration (0.01 mm for
Purkinje-based decentration).
3D anterior segment spectral domain OCT provides accurate anterior and posterior corneal
topography and pachymetry (Ortiz, Siedlecki et al. 2010, Ortiz, Siedlecki et al. 2011),
anterior and posterior lens topography (Ortiz, Perez-Merino et al. 2012), pupilometry, and
anterior chamber depth (Ortiz, Perez-Merino et al. 2013) as maintained in Section 2.1.2.
In addition, the direct view of the lens also allowed estimates of tilt and decentration (Li,
Wang et al. 2013, Marcos, Ortiz et al. 2013, Ortiz, Perez-Merino et al. 2013, Wang, Dong
et al. 2013).
In this chapter, we developed Purkinje-based methodology from anterior segment en-face
OCT images. The technology resembles the Purkinje method, since three spots are observed
in the en-face OCT images. These spots originate from the reflections of light on the
anterior surface of the cornea and the anterior and posterior surfaces of the lens, although,
in contrast to the standard Purkinje method, the spots are not formed by the entire area of
the ocular surfaces. Instead, the OCT system collects the scattered light reflected back from
the tissue and, when the reflected ray direction coincides with the OCT axis, a strong
specular reflection is captured in the test arm of the OCT, producing a bright spot in the en-
face OCT images. Unlike in the standard Purkinje method, which relies on images in a
single plane of focus, the tomographic information of the OCT images relates each
reflection with the corresponding surface, as well as avoiding image overlapping.
The Purkinje image analysis (estimation of coefficients in a set of linear equations) requires
assumption of an eye model. Assumption of a general computer eye model results in a
decrease in the accuracy of the tilt and decentration estimates (Rosales and Marcos 2006).
Instead, individual anatomical and biometric parameters are used, generally obtained from
corneal topography or keratometry, optical biometry and Purkinje phakometry. These
parameters can be retrieved from the same OCT data set (Ortiz, Perez-Merino et al. 2012,
Ortiz, Perez-Merino et al. 2013). In Section 2.1.3, we introduced the measurement of IOL
tilt and decentrations from OCT images, using a Purkinje-based analysis. The method was
validated on an artificial model eye (with set values of lens tilt and decentration) and tested
in 5 pseudophakic eyes with implanted A-IOLs (where the en-face OCT Purkinje-based
estimates of IOL tilt and decentration were compared to direct estimates from distortion-
corrected 3D OCT images) in this chapter.

Chapter 3
Intraocular lens alignment from an en-face OCT image Purkinje-like method
103
3.2 Materials and Methods
3.2.1. Laboratory-Based SD-OCT System
The SD-OCT system used in the measurements has been described in detail in Section 2.1.
The lateral sampling resolution ranged between 0.04 and 0.2 mm. Dedicated image
processing routines allowed segmentation of the optical surfaces and quantification of their
geometry with distortion correction as maintained in Section 2.1.2 (Quantification tools).
3.2.2. Artificial eye
Detailed information of the water-cell physical model eye has been described in Section
2.3.3. The geometry of the A-IOL was characterized using microscopy-based non-contact
optical profilometry (Sensofar, PLμ2300, Barcelona, Spain), introduced before in Section
2.3.2. The profiles were fit with conics and potential tilts of the IOL were removed using
custom routines written in MATLAB (Mathworks, USA). The measurements were repeated
5 times and the mean values are shown in Section 2.3, Table 2.1.
The refractive index of the cornea at the OCT wavelength was calculated by dividing the
central optical path length obtained from the OCT images by the nominal geometrical
central thickness (n=1.486, group refractive index at 840 nm). The thickness of the IOL
(CrystalensAO 23.5D) was measured using the profilometry system, and its refractive
index was also calculated from the OCT images (n=1.427, group refractive index at 840
nm). Measurements were obtained for the artificial eye with the lens in air (i.e. cell not
filled with water) and in water. The IOL was tilted inside the water-cell eye from -5 deg to
5 deg in 1-deg steps and decentered from -1.9 to 1.9 mm in 0.6 mm-steps.
3.2.3. Patients
Images were collected in 5 eyes of 4 patients (74±2.3 years old) 90 days after IOL
implantation (Crystalens A-IOL, Bausch and Lomb). Biometric data on these patients has
been previously reported as part of a larger study aimed at characterizing performance of
these IOLs (Marcos, Ortiz et al. 2013). Only patients implanted with 23.5-D power IOLs
were selected (as this IOL was available for in vitro measurements). As we maintained in
Section 2.5.2, measurements in post-operative patients were performed under mydriasis
(phenylephrine 10%) with fixation on a reference E-letter target projected on a minidisplay
at optical infinity.
3.2.4. OCT image processing
The image processing algorithm for geometrical characterization of the OCT images,
described in detail in Section 2.1.2 (Quantification tools) is comprised of: image denoising;
statistical thresholding; volume clustering; multilayer automatic segmentation; pupil center
registration; 3D volume merging of the cornea and IOL images, obtained in two different
acquisitions; geometrical distances calculation; fan distortion correction; optical distortion
correction; surface fitting to spherical surfaces. In this study, a 3-mm diameter optical zone
is used with respect to the corresponding surface apex. Anterior segment biometry,
including central corneal thickness (CCT), anterior chamber depth (ACD), intraocular lens

Biometric measurements in the crystalline lens: Applications in cataract surgery
104
thickness (ILT), intraocular lens position (ILP), and IOL tilt (IT) were computed from the
corrected 3D OCT images. The refractive indices used in the calculations are reported in
Table 3.1.
Table 3.1 Radii of curvature, axial biometry, and refractive indices, in the physical model eye,
and the five patient eyes.
3.2.5 Purkinje-like OCT method
In Section 2.1.3, we described the measurement of lens tilt and decentration by Purkinje-
like OCT en-face reflection imaging. As a brief summary, the Purkinje-like analysis can be
summarized in five steps: collection of a volumetric data set; generation of image intensity
values in the axial direction; pupil segmentation and identification of the positions of the
specular reflexes on the different surfaces (Purkinje-like images positions: PI, PIII and
PIV). The reflexes PI, PIII, and PIV are easily identified by checking the corresponding
OCT B-scan image. Eye rotation (β), lens tilt (α) and decentration (d) were obtained from
Eq.2.4, using the positions of the experimental reflexes (PI, PIII, and PIV).

Chapter 3
Intraocular lens alignment from an en-face OCT image Purkinje-like method
105
3.3 Results
3.3.1. Validation on a water-cell physical eye model
The developed methodology was tested on the physical eye model described before. The
corresponding coefficients of Eq.2.4 were computed for the artificial eye (see Table 3.2.5.1
for both the model eye in air, and immersed in water).
Table 3.2 A-G coefficients in Eq.2.4for the physical model eye in air and water and the 5 eyes of
the study
* Range corresponding to different realizations (air and water) of the model eye
Figure 3.1 shows the experimental tilt and decentration measured in the physical model
eye, against the nominal set values of tilt and decentration, for the IOL in air (a, c) and
water (b, d). There is a high correspondence between the experimental and nominal values:
slope=1.007; r= 0.9902, p<0.0001 for IOL tilt in air; slope=1.037; r=0.9973, p<0.0001 for
IOL tilt in water; slope=0.991; r=0.9878; p<0.0001for IOL decentration in air; slope=0.993;
r= 0.9993; p<0.0001 for IOL decentration in water. The average difference between
nominal and experimental value was 0.254±0.170 deg for tilt, and 0.066±0.017 mm for
decentration.
3.3.2. IOL tilt and decentration in patients
Measurements were performed on 5 eyes of 4 patients, all implanted with a 23.5 D
Crystalens A-IOL. The biometric parameters necessary to build the computer eye model
were obtained from OCT (anterior and posterior corneal radius, corneal thickness, ACD)
(Marcos, Ortiz et al. 2013) and from non-contact profilometry (anterior and posterior IOL
radii of curvature and thickness). Table 3.1 shows the corresponding parameters for all 5
eyes. The two sets of coefficients for tilt and decentration correspond to two different
realizations of the artificial eye model (the anterior chamber depth was enlarged for IOL
tilt measurements to allow proper positioning of the holding platform inside the chamber).

Biometric measurements in the crystalline lens: Applications in cataract surgery
106
Figure 3.1 Experimental data vs. nominal data in the artificial eye model (a) IOL tilt (in air); (b)
IOL tilt (in water); (c) IOL decentration (in air); (d) IOL decentration (in water)
Figure 3.2 (a) IOL tilt and (b) IOL decentration in the 5 eyes studied. Solid symbols represent
data obtained using the Purkinje–like OCT-based method and open symbols represent data
obtained directly from distortion-corrected 3D OCT images (Ortiz, Perez-Merino et al. 2013).
Square, rhombus and round represent right eyes (OD) while triangle and rectangle represent left
eyes (OS). Each color (color online only) represents a different eye. Error bars stand for standard
deviations of repeated measurements.
IOL tilt is defined as the angle between the IOL axis and the pupillary axis, where the IOL
axis is the line joining the centers of curvature of the IOL, and the pupillary axis joining

Chapter 3
Intraocular lens alignment from an en-face OCT image Purkinje-like method
107
the center of curvature of the cornea and the pupil center. IOL decentration is defined as
the distance between the IOL center and the pupil center. According to existing
conventions(Rosales, Wendt et al. 2008): positive horizontal decentration stands for nasal
decentration (in right eyes) and temporal decentration (in left eyes), and vice versa for
negative; and positive vertical decentration for superior, and negative for inferior. Positive
tilt about the horizontal axis (Tilt x) indicates that the superior edge of the lens is moved
forward. Negative tilt around the vertical axis (Tilt y), in right eyes, indicates that the
temporal edge of the lens is moved forward, and, in left eyes, indicates that the nasal edge
of the lens is moved forward.
We did not find consistent mirror symmetry in the orientation of tilt or decentration in these
eyes (Figure 3.2). The average tilt about the x-axis was -0.14 deg in right eyes and -1.88
deg in left eyes (Purkinje-like), and -0.59 deg in right eyes and -2.02 deg in left eyes (OCT);
Average tilt about the y-axis was 2.15 deg in right eyes and 1.65 deg in left eyes (Purkinje-
like) and 2.93 deg in right eye and 2.14 deg in left eyes (OCT). Average decentration on
the horizontal axis was -0.10 mm in right eyes and 0.00 mm in left eyes (Purkinje-like),
and -0.10 mm in right eyes and 0.11 mm in left eyes (OCT); Average decentration on the
vertical axis was -0.08 mm. The average standard deviations for repeated measurements of
tilt were 0.47 deg (Purkinje-like) and 0.58 deg (OCT). The standard deviation for repeated
measurements of decentration was 0.04 mm (Purkinje-like) and 0.06 mm (OCT).
Figure 3.3 compares the coordinates of tilt (a, b) and decentration (c, d) measured with both
techniques. There was a high correlation between both estimates, particularly for tilt (slope:
1.18, r=0.95, p<0.012, for tilt around x-axis; slope: 0.92, r=0.98, p<0.004 for tilt around y-
axis), and slightly lower for decentration, not reaching statistical significance, (slope: 0.62,
r=0.67, p<0.22, for decentration on x-axis; slope: -0.35, r=-0.44, p<0.46 for decentration
on y-axis). Figure 3.4 shows a Bland-Altman plot for tilt measurements (a) and for
decentration measurements (b), i.e. the average of tilt/decentration coordinates from
Purkinje and OCT versus difference of tilt/decentration coordinates from both methods.
The average difference in tilt from both methods was -0.17 deg, with the 95% limits of
agreement going from -0.754 to 0.416 deg. All tilt coordinates from either method were
within the confidence interval, and 40% differed by less than 0.5 deg. The average
difference in decentration from both methods was -0.086 mm, with the 95% limits of
agreement going from -0.205 to 0.033 mm. All decentration coordinates from either method
were within the confidence interval, and 50% differed by less than 0.1 mm.

Biometric measurements in the crystalline lens: Applications in cataract surgery
108
Figure 3.3 Correlation between data obtained from Purkinje-like and OCT methods for IOL tilt
(a, b) and decentration (c, d) in all 5 eyes of the study.
While all estimates are obtained from the same image data set, the causes for the slight
discrepancies may arise from the 3D nature of the reference axes in OCT and the 2D nature
in Purkinje. The center of the pupil in the OCT images is given by lateral and axial
coordinates, which may result in slightly different pupillary axes. Besides, the pupil plane
itself may show some tilt, while the pupil edges in the Purkinje-like method are obtained
from the frontal projection (2D coordinates) in the en-face OCT images. We simulated the
Purkinje images of a computer 3D model eye built using the estimates for tilt, decentration,
and eye rotation obtained from the Purkinje-like method using ZEMAX and found that the
positions of the simulated PI, PIII and PIV were within 0.004 mm, 0.011 mm and 0.004
mm, respectively, from the experimental Purkinje images (see Figure 3.5 showing an
example from eye S# 8 OS).

Chapter 3
Intraocular lens alignment from an en-face OCT image Purkinje-like method
109
Figure 3.4 Bland-Altman plot-differences between Purkinje-like and OCT estimates of tilt (a) and
decentration (b). Horizontal lines represent the mean difference (-0.17 deg and -0.09 mm,
respectively) and 95% limits of agreement.
Figure 3.5 Experimental en-face OCT image (a) and simulated (b) PI, PIII and PIV, for S# 8 OS

Biometric measurements in the crystalline lens: Applications in cataract surgery
110
3.4 Discussion
We have developed and validated a new method of measurement of IOL tilt and IOL
decentration from en-face OCT anterior segment images showing Purkinje-like reflections
from the anterior cornea and anterior and posterior lens surfaces. The images are similar to
those obtained by standard Purkinje method images, which are specular reflections formed
at the ocular surfaces, and matched in position. The Purkinje-like reflex locations are
assumed to be linear combinations of eye rotation, lens tilt and decentration, with the
weighting coefficients dependent on the eye’s biometry (and easily derived by
computations on computer eye models), lens tilt and decentration. The method has been
tested in an artificial model with and without water, and showed accuracies similar to those
of standard Purkinje imaging methods.
The proposed methodology shares analysis with the standard Purkinje based method, where
pupil conjugate images are retrieved by the use of a CCD camera provided with a telecentric
lens. However, the availability of tomographic data from OCT allows for unequivocal
identification of the corresponding ocular surface producing the reflection, with no
limitations arising from potential overlapping of the Purkinje images (one of the main
drawbacks of the standard method). The dense lateral sampling of our spectral OCT
configuration prevents limitations produced by sparse meridional sampling (such as that
used in Scheimpflug instruments). Besides, the availability of geometrical and biometrical
information (corneal keratometry, lens phakometry, anterior chamber depth), required in
the Purkinje method and normally gathered from other instruments in the standard Purkinje
approach, can be retrieved from the same 3D OCT data set. Despite the high acquisition
rates of the OCT system, the collection of 3D en-face OCT images in our current
configuration is significantly slower (0.72 s) than the Purkinje method with a standard CCD
camera (30 Hz). This imposes limitations to the dynamic measurement of IOL tilt and
decentration, which may be of interest in some applications (Juan Tabernero 2012). High
acquisition rates are important to avoid potential errors imposed by eye motions. However,
it is conceivable to limit the acquisition of OCT cross-sections in selected regions, which
would considerably diminish acquisition times.
We have compared the tilts and decentrations measured directly from fan/optical distortion
corrected OCT images with those obtained from the en-face OCT Purkinje-like method,
and found, in general, high agreement between the data, particular for tilt. We have
identified slight differences in the definition of the pupillary axis as a potential source of
the discrepancies. However, using the appropriate references in a computer eye model
should result in the description of the same eye.
Measurements of tilt and decentration of IOLs, along with biometry and
anatomical parameters, are of great value for evaluating optical quality in patients after
cataract surgery, and also for understanding their relative role in optical degradation.
Furthermore, measurements of IOL tilt and decentration in patients will help to optimize
IOL and haptic design. Tilt and decentration are therefore critical parameters when building
customized computer eye models that can predict optical performance of IOLs (Tabernero,
Piers et al. 2006, Rosales and Marcos 2007). The quantitative 3D anatomical information
provided by OCT allows building these eye models with all geometrical and biometric

Chapter 3
Intraocular lens alignment from an en-face OCT image Purkinje-like method
111
information obtained from a single instrument. Anterior 3D OCT images allow direct
estimation of IOL tilt and decentration, but the analysis requires correction of both fan and
optical distortion (Ortiz, Siedlecki et al. 2010). However, the Purkinje method only requires
knowledge of axial biometry, anterior corneal radius of curvature, and IOL radii of
curvature, easily accessible following fan distortion correction of the images and from
geometrical data of the IOL.
The amounts of tilt and decentration found in this chapter (3.30±4.68 deg and 0.16±0.16
mm, respectively) are comparable with those found in prior literature (3.01±1.39 deg and
0.38±030 mm by (de Castro, Rosales et al. 2007); 4.30±2.67 deg and 0.45±0.0.26 mm by
(Wang, Woung et al. 1998); 3.73±1.18 deg and 0.45±0.23 mm by (Kim and Shyn 2001)) in
eyes implanted with standard monofocal IOLs. However, the lack of clear symmetry
between right and left eyes and, particularly, the large tilts found in some eyes (i.e. S#3
OD) are likely associated to the fact that A-IOLs with hinged haptics may experience larger
misalignments than standard monofocal IOLs (Marcos, Ortiz et al. 2013), among other
IOLs due to asymmetric fibrosis in the haptic region (Z-syndrome in Crystalens) (Yuen,
Trattler et al. 2008).
In summary, robust measurements of IOL tilt and decentration can be obtained from a
Purkinje-like analysis on a volumetric set of anterior segment OCT data. OCT-based
corneal topography data, IOL alignment and eye rotation data from the Purkinje method
and IOL geometry can be used in customized pseudophakic eye models allowing estimates
of the optical quality and the factors contributing to optical degradation in these eyes. The
Purkinje-like method allows characterization of the eye rotation, and lens tilt and
decentration, giving insights on the performance of implanted A-IOLs. These data, along
with biometric data obtained from OCT, can be easily transferred into computer eye models
for evaluation of the contributed factors to optical degradation in eyes implanted with IOLs
and the impact of IOL misalignment in particular.
In this chapter, we have described an OCT-based method to measure tilt and decentration
of the crystalline lens and IOLs implanted in cataract subject. On the other hand, OCT can
be used to assess the shape of the natural lens. In following chapters these technologies will
be applied to study lens topography and the impact of IOL tilt on the optical quality in eyes
implanted with IOLs.

Biometric measurements in the crystalline lens: Applications in cataract surgery
112

Chapter 4
OCT 3D surface topography of isolated human crystalline lens
113
CHAPTER 4
OCT 3D SURFACE
TOPOGRAPHY OF ISOLATED
HUMAN CRYSTALLINE
LENSES

Biometric measurements in the crystalline lens: Applications in cataract surgery
114
This chapter is based on the following publication:
M. Sun, J. Birkenfeld, A. de Castro, S. Ortiz and S. Marcos (2014). "OCT 3-
D surface topography of isolated human crystalline lenses." Biomed Opt
Express 5(10): 3547-3561.
The contribution of Mengchan Sun to the study, in collaboration with other
coauthors, was the literature search, the design of the experiments and the data
acquisition (in collaboration with Alberto de Castro), the development of
specific routines and the analysis and processing of the data. This work was
also presented at the 2014 Annual Meeting of the Association for Research in
Vision and Ophthalmology (ARVO) in Orlando (Florida, USA)

Chapter 4
OCT 3D surface topography of isolated human crystalline lens
115
RESUMEN
Objetivos: En este capítulo presentamos la medida de la topografía de superficies del
cristalino del ojo humanas aislado y una evaluación de la relación entre las formas de
superficie anterior y posterior del cristalino y sus cambios con la edad.
Métodos: La Tomografía de Coherencia Óptica Cuantitativa 3-D se utilizó para medir la
topografía superficial de 36 lentes humanas aisladas y para evaluar la relación entre la
forma de la superficie anterior y posterior del cristalino y sus cambios con la edad. Los
cristalinos se co, colocaron en una cubeta en un medio de conservación (DMEM / F-12,
HEPES, GIBCO, transparente). Las lentes se midieron con un sistema OCT de desarrollo
propio. Una imagen completa en 3D contiene 1668 A-scans y 60 B-scans en una región de
12 × 12 mm. La resolución axial del OCT es de 6.9 μm en el tejido. Todas las superficies
de la lente se ajustaron a los polinomios Zernike de orden 6. Los cambios en las superficies
del cristalino con la edad y la relación entre las superficies de las anterior y posterior se
estudiaron mediante regresiones lineales entre los parámetros que describen la forma de la
superficie (radios de curvatura, constantes cónicas, coeficientes polinomiales de Zernike y
RMS de alto orden) y la edad. Los niveles de significación estadística se ajustaron mediante
una corrección de Bonferroni, aplicada para evitar posibles errores de tipo 1 derivados de
comparaciones múltiples.
Resultados: El astigmatismo es la aberración superficial predominante en las superficies
anterior y posterior del cristalino (representando aproximadamente el 55% y el 63% de la
varianza, respectivamente), seguido de términos esféricos, coma, “trefoil” y “tetrafoil”. La
magnitud de astigmatismo de la superficie anterior y posterior no varía significativamente
con la edad. El ángulo relativo entre los ejes de astigmatismo superficial anterior y posterior
fue de 36.5 grados en promedio, con tendencia a disminuir con la edad, siendo mayor de
45 grados en 36.1% de los cristalinos. La RMS de aberración esférica, coma y aberraciones
de tercer orden de los mapas de elevavción anterior y posterior) disminuye
significativamente con la edad. También encontramos una correlación estadísticamente
significativa entre los términos de orden 3 y 4 de las superficies anterior y posterior del
cristalino.
Conclusiones: La comprensión de la coordinación de las geometrías de la superficies
anterior y posterior del cristalino y sus cambios topográficos con la edad arrojan luz sobre
el papel de la lente en las propiedades ópticas del ojo y el mecanismo de envejecimiento
del cristalino.

Biometric measurements in the crystalline lens: Applications in cataract surgery
116

Chapter 4
OCT 3D surface topography of isolated human crystalline lens
117
4.1 Introduction
The crystalline lens of the eye is a fascinating optical element which, together with the
cornea, transmits and refracts light to form an image of the world on the retina. The elastic
young crystalline lens changes shape via constriction and/or relaxation of the ciliary
muscle, resulting in a change of the optical power of the eye which provides a focused
image of objects both near and far. With aging, the human lens becomes thicker, relatively
steeper and loses the ability to accommodate as we maintained in Section 1.2.3. In addition,
the crystalline lens shows a gradient refractive index (GRIN) distribution, which also
changes with age. Recent work in the VioBio lab has shown that in human (Birkenfeld, de
Castro et al. 2014), as well as monkey (de Castro, Birkenfeld et al. 2013) and porcine lenses
(Birkenfeld, de Castro et al. 2013), both the lens shape and the GRIN play a role in the
negative spherical aberration of the lens. Despite its important contribution to the optical
quality of the eye, several aspects of the crystalline lens are not known. The lens surface
radii of curvature and their changes with age and accommodation have been extensively
measured both ex vivo and in vivo. Data ex vivo and in vivo differ primarily because the
isolated lens appears in its maximally accommodated state, and therefore the young lens
shows large steepening ex vivo. Ex vivo, the anterior and posterior lens surface radii of
curvature tend to increase with age while both surfaces tend to steepen with age in vivo.
(More detail about previous research can be found in Section 1.2.3)
Given its high accessibility, the corneal topography is well characterized. Corneal
irregularities in the elevation map and astigmatism are common. Interestingly, the posterior
corneal surface appears to compensate for part of the errors of the anterior cornea. In
particular, the posterior cornea has been reported to compensate around 3.5% of the coma
of the anterior surface (Dubbelman, Sicam et al. 2007). There are also numerous reports of
the compensation of the corneal astigmatism by the astigmatism of the crystalline lens using
corneal and refractive parameters as we maintained in Section 1.2.2. However, to our
knowledge, there is little information on possible compensation within the crystalline lens
itself, i.e. between the anterior and posterior surfaces or between its surfaces and its GRIN.
In this chapter, we have measured the elevation maps of the anterior and posterior lens
surfaces of 36 isolated human donor lenses of different ages with quantitative 3D OCT.
These ex vivo measurements allow direct access to the posterior surface of the lens, without
potential distortions produced by the GRIN of the lens. To our knowledge, this is the first
systematic study of the lens topography (including high order irregularities) and its change
with age. Knowledge of the full lens topography and its age-related changes is important
in the understanding of the relative contribution of the lens properties to the optical quality
of the eye, possible through the use of ray tracing on custom eye models, as well as in
investigating the changes undergone by the lens with aging. This information is particularly
relevant for the formation of correcting strategies in the eye, and specifically in cataract
surgery, in which an artificial intraocular lens replaces the crystalline lens of the eye. Novel
designs aim at finding inspiration from the natural young lens.

Biometric measurements in the crystalline lens: Applications in cataract surgery
118
4.2 Methods
4.2.1 Lens specimens and preparation
We introduced lens specimen preparation in Section 2.5.1. As a brief summary, 36 isolated
human crystalline lenses from 28 human donors were obtained from the BST Eye bank
(Banc de Sang i Teixits, Barcelona, Spain). The post-mortem time varied between 1 and 3
days at the time of the experiment. A typical experimental session lasted 1-2 hours.
All lenses were imaged in a cuvette and immersed in preservation medium. 3D OCT
imaging was performed with the anterior lens surface facing the OCT beam (anterior up
image), and care was taken that the lens did not appear tilted in the real-time OCT image.
The lens was then flipped around a predetermined horizontal axis (the same for all lenses)
to image it again, this time with the posterior surface facing the OCT beam (posterior up
image). The procedure is similar to that described in prior publications (Borja, Siedlecki et
al. 2010, de Castro, Ortiz et al. 2010). The lenses were imaged in 3D using the custom
developed OCT system described in Section 2.1.2. One set of OCT images contains 1668
A-Scans and 70 B-Scans on a 12×12 mm lateral range. The acquisition time for each OCT
image was 4.5s. Each set of 3D images consisted of two acquisitions at two different planes
of focus which were merged to produce a complete image of the anterior surface, posterior
surface and cuvette holding the lens, using customized Matlab programs (More detail
described in Section 2.6.2).
4.2.2 Experimental sOCT setup and experimental protocols
The crystalline lenses were placed in a cuvette filled with a preservation medium
(DMEM/F-12, HEPES, no phenol red, GIBCO) (Augusteyn, Rosen et al. 2006). The lenses
were measured with a custom developed OCT system, described in more detail in Section
2.1.1. One complete 3D image was composed by 1668 A-scans and 60 B-scans on a 12×12
mm region. The axial resolution was calculated to be 6.9 μm in tissue.
The lens was immersed in the cuvette and placed on a ring. Centration of the lens for image
acquisition was done using the visualization mode provided by the OCT, which displayed
on the computer screen every 0.5 seconds two perpendicular B-scans passing through the
OCT axis. The lens axis was aligned with the OCT scan axis so that a specular reflection
was seen from both surfaces of the lens. The lens was first imaged with the anterior surface
facing the OCT beam, and was then flipped around a predetermined axis and imaged again
with the posterior surface up. To produce a complete image of the crystalline lens, two
images were captured in each position, one with the OCT focused on the first visible surface
(anterior in the anterior-up image and posterior in the posterior-up image), and another with
the OCT focused on the second surface, with image showing the cuvette holding the lens
and the preservation media. The procedure was described in more detail elsewhere
(Birkenfeld, de Castro et al. 2014)

Chapter 4
OCT 3D surface topography of isolated human crystalline lens
119
4.2.3 Lens surface elevations
Only the first lens surface imaged in each condition was analyzed in terms of elevation:
anterior surface in anterior-up images and posterior in posterior-up images. The distortions
present in this surface arise from the scanning architecture of the OCT system (fan
distortion (Ortiz, Siedlecki et al. 2010) in Section 2.1.2) and the refractive index of the
preservation medium, were corrected. The other two surfaces visible in the OCT image
were the second surface of the lens (posterior in anterior-up images and anterior in
posterior-up images) and the cuvette. These two surfaces are also distorted by the unknown
optics of the crystalline lens. The second surface of the lens was not used in this chapter
but the image of the cuvette was used for alignment and to avoid possible rotations between
the anterior-up and posterior-up images produced while flipping the lens (Birkenfeld, de
Castro et al. 2014).
To obtain the shape of the lens surfaces, a surface segmentation MATLAB algorithm,
previously described in Section 2.6.2, was used. The segmented surfaces were fit to
biconical surfaces and spheres. The apex of the lens was used as a reference to center each
surface. As we maintained in Section 2.6.2, lens surface elevation maps (obtained by
subtraction of the best fitting spheres from the segmented surfaces) were fitted to 6th order
Zernike polynomials. All fittings were done for a 6-mm diameter optical zone. Descriptive
parameters of the lens surface geometries were radii of curvature and asphericities, and
descriptive parameters of the surface elevation maps included individual surface Zernike
coefficients (up to 6th order) and the RMS combination of some terms (RMS astigmatism,
RMS trefoil, RMS tetrafoil, RMS spherical terms, RMS coma and RMS 4th order
Astigmatism) or Zernike orders (from 2nd order to 6th order RMS). We studied the changes
of those parameters with age as well as relationships between the anterior and the posterior
surfaces.
4.2.4 Lens orientation
As the relative angle of the lens with respect to the cornea and the body is unknown, for
convention, all lenses were aligned such that the astigmatic axis of the anterior lens was on
the vertical meridian (direct astigmatism). The magnitude of astigmatism (C) of each lens
surface was computed using Eq. 4.1.
2 1
1 1( ) ( )
x y
C n nR R
(Eq.4.1)
Where xR , yR are the radii of curvature as obtained from the biconic fittings, and 1n and
2n are the refractive indices of the lens’ surrounding medium and the lens cortex,
respectively. A lack of reports of the index of refraction of the capsular bag prevented us
from using that value in the calculations. Instead, and in keeping with previous publications
(Dubbelman and Van der Heijde 2001, Borja, Manns et al. 2008), we used a surface
refractive index of 1.3709. The refractive index of aqueous was assumed to be equal to the
refractive index of water (1.332 at 635 nm). The angle α of astigmatism of each surface
was given by

Biometric measurements in the crystalline lens: Applications in cataract surgery
120
1 45
180
tan ( ) / 2J
J
(Eq.4.2)
Where 180J is the power at axis α = 0° = 180° and 45J is the power at axis α = 45° (Thibos
and Horner 2001). The image of the cuvette was used to align the anterior-up and posterior-
up images (Birkenfeld, de Castro et al. 2014). All OCT images were processed to obtain
the shape of the lens surfaces and the surface of the cuvette, using algorithms described in
detail in previous publications (de Castro, Siedlecki et al. 2011). We aligned the anterior
and posterior surfaces using the astigmatism vector of the cuvette segmented surface. This
adjustment guaranteed that the lens could be treated as a whole, and therefore a rotation of
the entire lens preserved the relative angle between anterior and posterior surface astigmatic
axes. The entire lens was rotated so that anterior = 90 deg for the anterior lens, while
keeping the astigmatism relative angle ( anterior - posterior ) constant.
Elevation maps and individual Zernike terms are provided following rotation according to
this convention (i.e. 2
2Z = 0 in all anterior lenses). Posterior elevation maps are shown by
flipping the horizontal coordinates (i.e. by moving the observation point to the back of the
lens). Since the used convention still leaves the vertical orientation as an unknown (i.e. the
lenses could be rotated 180 deg) and we cannot distinguish between right and left eyes, the
relative angles of astigmatism between the anterior and posterior surfaces are given in a 0-
90 deg range.
4.2.5 Power vector analysis
To illustrate the distribution of anterior and posterior astigmatism in the lens sample, we
present the magnitude of astigmatism and the relative angle between anterior and posterior
astigmatism in a power vector graph (Thibos and Horner 2001, Liu, Chou et al. 2011). The
length of the vectors represents the calculated magnitude of surface astigmatism (in
diopters), and the directions of the vectors correspond to the relative angle between the
anterior and posterior astigmatism axes. All vectors are represented in a polar coordinate
system. We studied the age-dependence of the magnitude of astigmatism of the anterior and
posterior surfaces as well as of the relative angle of astigmatism between those surfaces.
4.2.6 Correlation analysis
Changes in lens surfaces with age and the relationship between the anterior and posterior
lens surfaces were studied by linear regressions between the parameters describing the lens
surface shape (radii of curvature, conic constants, Zernike polynomial coefficients and high
order RMS) and age, and also between the descriptive parameters of the anterior and
posterior lens surfaces. The statistical significance levels were adjusted by a Bonferroni
correction, applied to avoid potential Type 1 errors arising from multiple comparisons. The
significance level was established at p<0.05 for radii of curvature and conic constants,
p<0.008 for RMS terms, p<0.01 for RMS orders and p<0.00017 for individual Zernike
terms.

Chapter 4
OCT 3D surface topography of isolated human crystalline lens
121
4.3 Results
4.3.1 Lens surface elevation maps
Figure 4.1 shows the two central raw OCT images that need to be merged to obtain a
complete anterior-up image of one of the crystalline lens, segmented 3D lens and cuvette
surfaces. The fan distortion and the optical distortion due to the DMEM are corrected, and
the shape of the cuvette is used to avoid rotations between anterior-up and posterior-up
imaging.
Figure 4.1 Upper panels: OCT images corresponding to the anterior-up position of one of the
crystalline lenses imaged, with (a) OCT focused on the anterior surface and (b) OCT focused on
the posterior surface and the image of the cuvette. The detected surfaces are marked in blue
(anterior surface), red (posterior surface) and green (cuvette). Lower panels: 3D OCT data from
images of the crystalline lens with (c) the anterior surface up and (d) the posterior surface up. The
blue and red points correspond to the segmented anterior and posterior surfaces of the lens,
respectively. The green points and the black points correspond to the cuvette imaged through the
lens, therefore distorted by the lens, and the cuvette without distortion respectively.
Figure 4.2 shows Zernike fittings of the anterior and posterior lens surface elevations
(relative to the best fitting sphere) for all lenses of the chapter, sorted by age. The first and
third columns show the astigmatic Zernike terms only, and the second and fourth columns
represent astigmatism and HOA (up to 6th order terms) of the anterior and posterior surfaces
respectively. Since, by convention, the lenses have been aligned such that the anterior lens’
steepest meridian is vertical, the anterior maps show only the 2
2Z astigmatic component.
In many cases the astigmatic axis of the posterior lens surface is rotated with respect to the
anterior lens surface. Astigmatism dominates in some, but not all eyes. In general, there is
a good correspondence between anterior and posterior lens surface maps. Also, a certain
degree of similarity occurs in the HOA maps of both eyes from the same donor, marked
with asterisks in the figure (lens#7&8, lens#11&12, lens#15&16, lens#17&18,
lens#23&24, lens #27&28, lens #35&36). For eye pairs from the same donor, the average
correlation coefficients for the high order Zernike between eyes are r = 0.78 (p = 0.002) for

Biometric measurements in the crystalline lens: Applications in cataract surgery
122
the anterior and r = 0.53 (p = 0.03) for the posterior lens surface, while the average
correlation coefficients when compared to eyes from other eyes are r = 0.10 and r = 0.17
for the anterior and posterior lens surfaces, respectively.
Figure 4.2 Lens surface elevation maps for all lenses, ordered by age. By convention, the maps
are aligned so that the steepest meridian of the anterior lens surface lies on the vertical axis.
Anterior and posterior images are shown as mirrored on the vertical axis. Asterisks indicate pairs
of lenses from the same donor.

Chapter 4
OCT 3D surface topography of isolated human crystalline lens
123
4.3.2 Lens radii of curvature and asphericity: anterior/posterior lens
relationships and changes with age
Figure 4.3 shows the radii of curvature of the steepest and flattest meridians ( sR and fR )
of the anterior and posterior lens surfaces as a function age, obtained from biconic fittings.
Per definition, the steepest meridian is aligned vertically on the anterior lens surface, and
the steepest and flattest meridians are orthogonal on both surfaces.
Similar to earlier reports of the average radii of curvature, both the radii of curvature in the
flattest and steepest meridians increase significantly with age (p≤ 0.003). The steepest and
flattest meridians change at a rate of 95µm/year and 94μm/year, respectively, in the anterior
lens, and 20μm/year and 19μm/year in the posterior lens.
Figure 4.3 (a) Radii of curvature of anterior and posterior lens surfaces at their corresponding
steepest meridian as a function of age (b) Radii of curvature of anterior and posterior lens surfaces
at their corresponding flattest meridian as a function of age. Data was obtained from fits to biconic
surfaces. Open circles represent data of the anterior lens surface and solid circles represent data
of the posterior lens surface.
We also studied the change in conic constant (k) with age. Figure 4.4 shows the conic
constants in the steepest and flattest meridians for the anterior and posterior lens surfaces
obtained from biconic fittings. Both anterior and posterior lens conic constants shift from
negative values towards more positive (or less negative) values with age, although the
change is not statistically significant.

Biometric measurements in the crystalline lens: Applications in cataract surgery
124
Figure 4.4 (a) Conic constants of anterior and posterior lens surfaces at their corresponding
steepest meridian as a function of age. (b) Conic constants of the posterior lens surfaces at their
corresponding flattest meridian as a function of age. Data was obtained from fits to biconic
surfaces. Open triangles represent data from the anterior lens surface and solid triangles represent
data from the posterior lens surface.
4.3.3 Changes of lens surface astigmatism and relative astigmatic angle
with age
The magnitude of lens surface astigmatism (calculated from sR and fR in Eq. 4.1) ranged
from 0.046 to 1.185 D (average: 0.563 ± 0.347 D) in the anterior lens and from 0.013 to
1.118 D (average: 0.553 ± 0.320 D) in the posterior lens. Figure 4.5 (a) shows the variation
of anterior and posterior lens surface astigmatism with age. For both lens surfaces, the
changes with age were not statistically significant (p = 0.29 and p = 0.23 for anterior and
posterior surfaces respectively). For 52.78% (anterior surface) and 41.67% (posterior
surface) of the lenses the magnitude of astigmatism was between 0.2 and 0.6 D. Figure 4.5
(b) shows the correlation of anterior and posterior lens surface astigmatism, which did not
reach statistical significance (p = 0.226).
Figure 4.6 shows the power vector analysis for anterior and posterior lens surface
astigmatism. By convention, the anterior lens astigmatism is aligned with the vertical
steepest meridian, as shown in Figure 4.6(a). This convention is adopted as a consequence
of the lack of information of the actual orientation of the lens in vivo (up, down, nasal,
temporal), resulting in a relative angle of astigmatism in a range between 0 and 90 deg (see
Figure 4.6(b)).
The relative angle between anterior and posterior astigmatism was on average 36.46 deg.
In 36.1% of the lenses the relative angle was > 45 deg. Figure 4.7 shows the change of the
relative angle of the astigmatic axis between the anterior and posterior lens surfaces with
age. The relative angle tends to decrease with age, although the correlation is low (r = 0.305,
p = 0.071). We did not find that the relative angle was correlated with the amount of
astigmatism of either surface (not shown).

Chapter 4
OCT 3D surface topography of isolated human crystalline lens
125
Figure 4.5 (a) Magnitude of lens surface astigmatism of the anterior and posterior lens surfaces
as a function of age. (b) Correlation of the magnitude of astigmatism between anterior and
posterior surfaces
Figure 4.6 (a) Anterior astigmatism power vector polar plot with the steepest meridian aligned at
90 deg, by convention; (b) Posterior astigmatism power vector polar plot. The angle (from the
vertical axis) represents the relative angle between the anterior and posterior astigmatic axis. Each
arrow represents one lens; the length of the vectors represents the magnitude of the corresponding
astigmatism in diopters.

Biometric measurements in the crystalline lens: Applications in cataract surgery
126
Figure 4.7 Relative angle between anterior and posterior lens surface astigmatic axis as a function
of age (Slope: −0.53 deg/year; r = 0.305; p = 0.071);

Chapter 4
OCT 3D surface topography of isolated human crystalline lens
127
4.3.4 Lens elevation high order Zernike terms: anterior and posterior lens
relationships
We tested the similarity of anterior and posterior lens topographies by evaluating the
correlation of the high order Zernike terms in the anterior and posterior lens surfaces. We
found that several high order Zernike terms were correlated in a statistically significant
manner in anterior and posterior lens surfaces. As an example, Figure 4.8 shows linear
regressions between anterior and posterior surfaces for vertical trefoil (3
3Z
), 3rd order RMS,
RMS Coma and 4th order RMS.
Figure 4.8 (a) Trefoil-v3
3Z
: Anterior vs. Posterior (Slope = 0.387, r = 0.467, p = 0.004) (b) RMS
3rd order terms: Anterior vs. Posterior (Slope = 0.019; r = 0.477, p = 0.003; (c) RMS Coma:
Anterior vs. Posterior (Slope = 0.387; r = 0.617, p = 0.0001) (d) 4 th order RMS: Anterior vs.
Posterior (Slope = 0.387; r = 0.423, p = 0.010.)

Biometric measurements in the crystalline lens: Applications in cataract surgery
128
4.3.5 Lens elevation high order Zernike terms: changes with age
Figure 4.9 shows several Zernike surface elevation terms (in terms of RMS) as a function
of age: (a) RMS coma (b) RMS spherical (c) 3rd order RMS, and (d) 5th order RMS, both
for the anterior and posterior lens surfaces. RMS coma (Figure 4.9 (a)) with age, with a
high degree of statistical significance, at a rate of 0.087μm/year and 0.123 μm /year for
anterior and posterior surface, respectively. RMS spherical (Figure 4.9 (b)) and 3rd order
RMS (Figure 4.9 (c)) decrease significantly with age for the anterior surface, but not for
the posterior surface (RMS spherical: slope = −0.175 μm /year for anterior surface, slope =
−0.05 μm /year for posterior surface; 3rd order RMS: slope = −0.083μm/year for anterior
surface). 5th and 6th order RMS do not show statistically significant changes with age. Table
4.1 (4th and 5th columns) shows the correlations with age for different RMS orders.
Table 4.1 Mean and standard deviation of the RMS of high-order Zernike coefficients for anterior
and posterior lens surfaces. The Pearson correlation coefficient and the p-value are shown for the
correlation with age of these parameters in each surface and between surfaces.
Chapter 4
OCT 3D surface topography of isolated human crystalline lens
129
4.3.6 Relative contribution of different Zernike terms to the lens surface
elevations
Figure 4.10 shows the average relative contribution of lower and higher order Zernike terms
of both surfaces. Relative contributions are accounted for in terms of variance (RMS2).
Astigmatism is the predominant term both in the anterior surface (54.96%) and in the
posterior surface (62.95%), followed by spherical (25.10%, 17.85%), coma (10.91%,
6.38%), trefoil (6.01%, 8.73%), tetrafoil (1.76%, 2.80%) and 4th order astigmatism (1.27%,
1.30%), for the anterior and posterior surface, respectively. We also studied the change of
these relative contributions with age (not shown) and found that for the anterior surface,
the two predominant terms, astigmatism and spherical, change with age. The relative
proportion of astigmatism increased with age at a rate of 0.702 /year (r = 0.427, p = 0.009),
while the percentage of spherical term decreased significantly with age at a rate of
−0.616/year (r = 0.474, p = 0.004). For the posterior surface, we only found a significant
change in the proportion of coma (slope = −0.307/year, r = 0.450, p = 0.006).
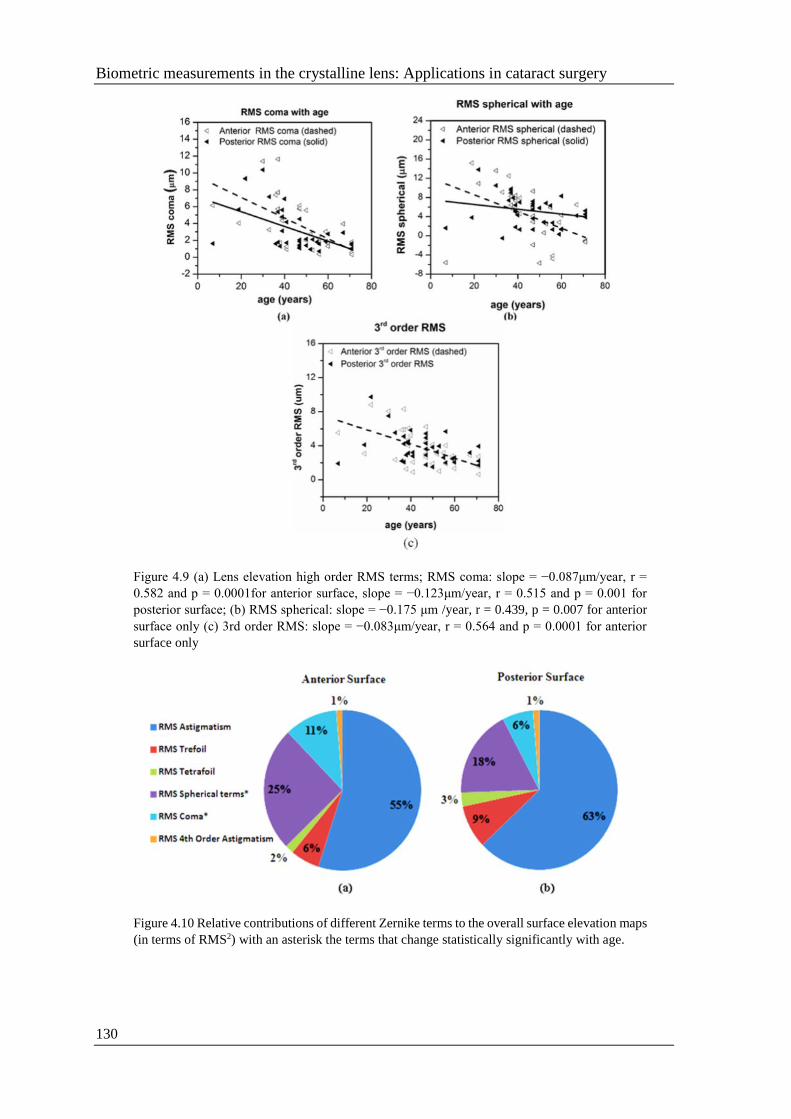
Biometric measurements in the crystalline lens: Applications in cataract surgery
130
Figure 4.9 (a) Lens elevation high order RMS terms; RMS coma: slope = −0.087μm/year, r =
0.582 and p = 0.0001for anterior surface, slope = −0.123μm/year, r = 0.515 and p = 0.001 for
posterior surface; (b) RMS spherical: slope = −0.175 μm /year, r = 0.439, p = 0.007 for anterior
surface only (c) 3rd order RMS: slope = −0.083μm/year, r = 0.564 and p = 0.0001 for anterior
surface only
Figure 4.10 Relative contributions of different Zernike terms to the overall surface elevation maps
(in terms of RMS2) with an asterisk the terms that change statistically significantly with age.

Chapter 4
OCT 3D surface topography of isolated human crystalline lens
131
4.4 Discussion
We have studied the 3D surface topography of 36 isolated human crystalline lenses
obtained using quantitative 3D OCT. The lens surface shape has been described with radii
of curvature, asphericity, and Zernike polynomials up to the 6th order. We have evaluated
the correlations between the anterior and posterior lens surface shape and their changes
with age. The anterior and posterior crystalline lens surfaces have been usually described
by the fitting parameters of conic functions (radius of curvature, and less frequently radius
of curvature and asphericity), using measurements normally obtained from single
meridians (Dubbelman and Van der Heijde 2001, Manns, Fernandez et al. 2004,
Dubbelman, Van der Heijde et al. 2005). However, the direct measurements of lens surface
elevations in 3D reveal that the human crystalline lens in fact shows non-spherically
symmetric surfaces. Our data shows the presence of astigmatism and, to a lesser extent,
other high order contributions (trefoil, spherical, coma and tetrafoil). Previous studies
comparing corneal and total astigmatism predicted the presence of astigmatism in the lens,
which in many cases, has a compensatory effect for corneal astigmatism (Artal, Guirao et
al. 2001, Kelly, Mihashi et al. 2004).
This chapter shows that both the anterior and posterior lens surfaces contribute to lens
astigmatism. The surface astigmatic power in our lens samples ranged from 0.046 to 1.185
D in the anterior lens surface, and from 0.013 to 1.118 D in the posterior lens surface.
However, the presence of a GRIN distribution may play a role in the overall astigmatism
of the lens. Whether GRIN has a compensatory role in lens astigmatism remains to be
investigated. OCT-based measurements of lens GRIN in multiple meridians in isolated
lenses (Birkenfeld, de Castro et al. 2014) will help to get insights on the contribution of
GRIN to astigmatism. We can only speculate on the factors contributing to lobular Zernike
surface terms such as trefoil and tetrafoil, which might be related to suture branching. In a
work by Gargallo et al. (Gargallo, Arines et al. 2013), lens aberrations in several species
with Y-suture branches were analyzed for their relationship with suture distribution. A high
degree of correlation between suture orientation and the axis of no rotationally symmetric
wavefront aberrations was found. In keeping with prior studies, we found changes in lens
shape with aging for both anterior and posterior lens surface. The increased steepness and
negative asphericity in isolated young lenses is consistent with the fact that isolated lenses
are maximally accommodated. The flattening (increased radius of curvature) and rounding
(shift of asphericity towards less negative values) with age of the anterior lens surface is
consistent with other studies in the literature using alternative techniques (Glasser and
Campbell 1999, Dubbelman and Van der Heijde 2001, Dubbelman, Van der Heijde et al.
2005, Borja, Manns et al. 2008).
We did not find a strong correlation between surface astigmatism and age, but there were
statistically significant correlations in the anterior lens surface for RMS 3rd and RMS 4th
order Zernike terms, RMS spherical, and RMS coma (p <0.008), which all decreased with
age. No significant correlation was found with age for surface tetrafoil and high order
lobular terms, in general. Although, if lobular terms are associated with the presence of lens
sutures, we would have expected an increase of the higher order terms with age, as the
number of suture branches increases with aging. However, it has been shown that the
formation of new branching structures is highly retarded at older ages (Kuszak, Zoltoski et

Biometric measurements in the crystalline lens: Applications in cataract surgery
132
al. 2004). Our OCT data did not provide a three-dimensional view of the lens branching,
although more refined imaging modalities revealing these structures could allow modeling
of the potential relationships between branching and trefoil and tetrafoil terms.
To our knowledge, this is the first comprehensive topographic study of the human lens with
aging. A previous study from our laboratory showed the ability to measure the crystalline
lens anterior and posterior surface elevation maps in vivo using sOCT, and demonstrated it
on three young human subjects in vivo. Besides the fully accommodated state of the
isolated lens and potential changes post-mortem, there may be other differences between
in vivo and ex vivo conditions. For example, the zonular tension in the un-accommodated
condition may cause further high order contributions to lens surface elevation in vivo
(besides the flattening of the lens). Also, the up-right orientation of the lens in vivo (as
opposed to the horizontal one in our ex vivo measurements) may create some changes
associated to gravity.
Two of the three eyes measured in vivo in earlier studies showed perpendicular astigmatism
axes in the anterior and posterior lens, whereas the astigmatic axes in this chapter tended
to differ on average by 36.46 deg. In 13 of the 36 lenses, the relative angle was >45 deg,
and 6 lenses had a relative angle >70 deg. The average relative angle was larger for younger
lenses (41.74 deg for lenses <50 years) than for older lenses (28.1 deg for lenses ≥50 years),
indicating a higher compensation of astigmatism between the lens surfaces at a younger
age.
Finally, the lack of a reference for the lenses ex vivo prevented analysis of the relative axis
of astigmatism with corneal astigmatism (and therefore evaluation of potential
compensatory effects between the surfaces of the cornea and lens and their changes with
aging) and possible changes in the anterior lens surface astigmatic axis with aging. For
example, it is well known that corneal astigmatism changes from with-the-rule to against-
the-rule astigmatism with aging (Hayashi, Masumoto et al. 1993, Gudmundsdottir,
Jonasson et al. 2000, Ho, Liou et al. 2010). Previous studies suggested that the astigmatism
axis of the anterior lens surface is vertical (Alvarez, Turner et al. 2003, Koch, Ali et al.
2012, Ortiz, Perez-Merino et al. 2012). We did not find a significant correlation between
anterior or posterior astigmatism axis and age. However, the tendency of the relative angle
to decrease with age could be interpreted as a decrease of the anterior by posterior
astigmatism balance with age.
Regardless of potential information provided by future in vivo studies of lens surface
topography and its changes with age, this chapter shows that astigmatism and high order
terms may be considered when trying to predict optical quality of a phakic eye at an
individual level, based on anatomical information. This information could be used in a ray
tracing analysis that incorporates data from cornea and lens GRIN distribution (Manns,
Fernandez et al. 2004, Marcos, Rosales et al. 2007, Acosta, Bueno et al. 2010, Ortiz and
Perez-Merino et al. 2012).In the following chapter, we will use geometrical and anatomical
information (including corneal and lens shape and lens tilt) to generate custom computer
eye models, which save as platform to understand the relative contributions of each factor
to optical quality and optimize lens selection.

Chapter 5
Full 3D OCT-based pseudophakic custom computer eye model
133
CHAPTER 5
FULL 3D OCT-BASED
PSEUDOPHAKIC CUSTOM
COMPUTER EYE MODEL

Biometric measurements in the crystalline lens: Applications in cataract surgery
134
This chapter is based on the following publication:
M. Sun, P. Pérez-Merino, E. Martinez-Enriquez, M. Velasco-Ocana and S.
Marcos (2016). "Full 3-D OCT-based pseudophakic custom computer eye
model." Biomedical Optics Express 7(3): 1074-1088.
The contribution of Mengchan Sun to the study, in collaboration with other
coauthors, was the literature search, the design of the experiments and the data
acquisition (in collaboration with Pablo Pérez-Merino), the development of
specific routines and processing of the data (in collaboration with Edurado
Martinez-Enriquez), and the building modeling and analysis the data. This
work was also presented at the 2014 Visual and Physiological Optics
conference (VPO) in Wroclaw (Poland).
Chapter 5
Full 3D OCT-based pseudophakic custom computer eye model
135
RESUMEN
Objetivos: Además de la medida y descripción de las aberraciones oculares, es
particularmente importante la comprensión de las fuentes de aberraciones ópticas a nivel
individual, en particular dado que minimizan la inducción de aberraciones en el tratamiento
quirúrgico o óptico. El modelo de ojo completamente personalizado basado en los datos
geométricos OCT 3D en un ojo implantado con IOL permitirá investigar la contribución
relativa del diseño de IOL y otros factores a la calidad óptica. Además, los ojos de los
modelos basados en OCT prometen convertirse en la referencia para la selección de
potencia de la IOL basada en el trazado de rayos (preoperatorio) y para la comprensión de
los mecanismos operativos y los resultados funcionales de las IOLs de alta calidad.
Métodos: Tres ojos de dos pacientes (64 y 78 años) implantados con IOLs se midieron tres
meses después de la cirugía de cataratas. Los datos de elevación basados en OCT de las
superficies corneales anteriores y posteriores, las distancias del segmento anterior, la
geometría de la IOL y los datos de alineación, el ángulo lambda (todos procedentes de
sOCT) y la longitud axial del IOLMaster se exportaron a ZEMAX, donde se construyeron
los ojos de los modelos personalizados. Las aberraciones de onda se calcularon en el plano
de la pupila mediante el trazado en una matriz de 64x64 rayos colimados a través de las
superficies oculares dentro de un área central de 5 mm de diámetro de la pupila, a 555 nm.
Los datos se analizaron en términos de términos de Zernike y la métrica de calidad de
imagen retinal Visual Strehl). Se compararon las aberraciones de onda medida medidas
usando un sistema de trazado de rayos por láser en ojos pseudofáquicos implantados con
lentes intraoculares asféricas (IOLs) con aberraciones simuladas de trazado de rayos
numéricos en modelos de ojo computacionales personalizados, construidos utilizando la
geometría ocular cuantitativa 3-D basada en OCT.
Resultados: Existe una correlación altamente estadísticamente significativa entre los
coeficientes de Zernike medidos por LRT y los simulados a partir de modelos
computacionales que incorporan todos los parámetros geométricos medidos (coeficiente de
correlación medio R=0.93±0.05 y p<0.0001). Las correlaciones, aunque estadísticamente
significativas, son menores entre coeficientes de Zernike de las aberraciones totales y de
las aberraciones de la superficie anterior de la córnea (coeficiente de correlación promedio
R=0.73±0.05 y p<0.0001), seguido de las aberraciones de toda la córnea
(anterior+posterior) (coeficiente de correlación medio R=0.88±0.03, p<0.0001); y muy
cercano a 1 entre las aberraciones totales medidas y las simuladas incluyendo cornea, IOL
y alineamiento (coeficiente de correlación medio R=0.94±0.04 y p<0.0001). La
discrepancia entre las aberraciones medidas y reales es inferior al 14.33% (0.15 μm) para
el astigmatismo, y menos del 21.43% (0.03 μm) para la aberración esférica. En promedio,
las discrepancias para RMS para astigmatismo y aberraciones de orden superior y RMS
para aberraciones de alto orden son sólo 0.12 μm y 0.08 μm, respectivamente.
Conclusiones: Este estudio muestra que los modelos de ojo computacionales
pseudofáquicos basados en OCT permiten entender la contribución relativa de los factores
ópticos geométricos y quirúrgicos a la calidad de la imagen y son una excelente herramienta
para caracterizar y mejorar la cirugía de cataratas.

Biometric measurements in the crystalline lens: Applications in cataract surgery
136

Chapter 5
Full 3D OCT-based pseudophakic custom computer eye model
137
5.1 Introduction
Ocular aberrometry (introduced in Section 1.4.3) has become a standard tool in research
and in the clinic to measure the optical quality of the eye, and its changes with aging
(McLellan, Marcos et al. 2001), and accommodation (Atchison, Collins et al. 1995, He,
Burns et al. 2000). In addition, ocular aberrometry is useful in surgical interventions (i.e.
LASIK (Moreno-Barriuso, Merayo-Lloves et al. 2001), intraocular lens (IOL) implantation
surgery (Barbero, Marcos et al. 2003, Marcos, Barbero et al. 2005), keratoconus and
Intracorneal Ring Segment (ICRS) implantation (Perez-Merino, Ortiz et al. 2014), etc...).
Furthermore, new refractive products and, more specifically, the availability of a large
number of IOL options hold promise for a customized intervention, adapted to the patient’s
needs. There is an increasing number of available IOLs aiming at modifying the patient’s
wave aberrations, targeting correction of both refractive error and some high order
aberrations (i.e. spherical aberration, such as in aspheric designs, or aiming at the increase
of depth-of-focus in presbyopic-correction IOLs). However, these efforts have not in
general been paralleled by a sophistication of the methods to select the most suitable IOL,
or to predict the optical quality outcomes. Generally, the methods to calculate the power of
the IOL to be implanted are based on paraxial regression formulae, based on population
averages (Olsen 2007). Furthermore, simulations of the optical performance of new IOL
designs either generally assume diffraction-limited optics in the eye, or simple eye models
(Holladay, Piers et al. 2002) that are based on average anatomic data across the population
and numerous simplifications (i.e. rotationally centered optics, symmetric optical surfaces,
etc...). The suitability of custom eye models to improve the predictability of the results of
cataract surgery has been acknowledged. Several authors have presented the use of non-
paraxial eye models for improved selection of IOL to be implanted, in particular for the
calculation of IOL power with higher accuracy than regression-formulae (Hoffmann, Wahl
et al. 2012, Minami, Kataoka et al. 2012, Olsen and Hoffmann 2014, Saiki, Negishi et al.
2014). Customized eye models have also been shown to accurately reproduce measured
high order aberrations, when constructed using the anatomical parameters of individual
patients (Tabernero, Piers et al. 2006, Rosales and Marcos 2007). These models are
instrumental in understanding the relative contribution of the patient’s corneal topography,
IOL design, IOL tilt and decentration, and foveal misalignment, and as well as platforms to
test what optical performance would have resulted if the eye had been implanted with a
different IOL design. Typically, the anatomical parameters of the eye used to build these
eye models are obtained from various instruments (Placido Disk, corneal elevation maps;
Purkinje imaging IOL tilt, decentration and foveal position; IOL design provided by the
manufacturer) (Tabernero, Piers et al. 2006, Rosales and Marcos 2007). Recently,
quantitative OCT imaging has shown to be a powerful technology to obtain quantitative 3D
optical biometry and geometry in individual eyes (Ortiz, Perez-Merino et al. 2013),
providing, from a single instrument, all the ocular anterior segment information needed to
build a custom pseudophakic model eye.
The quantitative OCT anterior segment imaging technique has been demonstrated to
provide accurate corneal topographies, crystalline lens topographies as we described in
Section 2.1.2 (Quantification tools), 3D optical biometry pre- and post-operative cataract
surgery (Ortiz, Perez-Merino et al. 2013) and tilt and decentration of IOL and/or crystalline
lens by Purkinje-like OCT en-face reflection image described in Section 2.1.3. In addition,

Biometric measurements in the crystalline lens: Applications in cataract surgery
138
previous work has shown that ray tracing through OCT-based corneal topographies allows
computation of corneal aberrometry, showing high degrees of agreement with total
aberrometry in a group of keratoconic eyes pre- and post- implantation of intrastromal
corneal ring segments (Perez-Merino, Ortiz et al. 2014). Also, 3D biometric quantitative
anterior segment OCT in patients with accommodating IOLs (Marcos, Ortiz et al. 2014)
shows good correspondence with certain aberration terms measured on the same eyes: i.e.
the observed axial shifts with accommodative demand are in good agreement with the
measured shifts in defocus, or the increased amounts of IOL tilt with the measured
increased coma (Marcos, Ortiz et al. 2014).
In this chapter we present a customized model eye fully based on 3D geometrical OCT data
in patients implanted with IOLs. Comparison of the geometry of IOL ex vivo samples to
the IOL geometry measured in vivo will serve as further support of the quantitative
potential of the 3D anterior segment OCT. Experimental measurements of ocular
aberrations on these eyes will be compared with estimates of ocular aberrations from
numerical ray tracing using a customized model eye from individual OCT measurements
of post-operative corneal topography, anterior chamber depth, IOL geometry, IOL tilt and
decentration and foveal misalignment. This study will allow validation of the accuracy of
OCT-based customized eye models to predict measured aberrations, and to investigate the
contribution of the different components to overall image quality in eyes with IOLs, thus
demonstrating the capability of quantitative 3D anterior segment OCT to assess
postoperative optical quality in pseudophakic eyes. These validations will be a first step
into investigating the potential for OCT-based model eyes to become the reference for ray
tracing based IOL selection (pre-operatively) and to understand mechanisms of operation
and optical outcomes of premium IOLs.

Chapter 5
Full 3D OCT-based pseudophakic custom computer eye model
139
5.2 Methods
5.2.1 Patients, surgery and measurements
Three eyes (2, OS; 1, OD) of two patients (64 and 78 years old) implanted with IOLs from
two different manufacturers (Akreos AO M160, Bausch and Lomb, Rochester, New York,
US; CT Asphina 409M, Zeiss, Jena, Germany) were measured three months after cataract
surgery. Standard phaco-emulsification intracapsular cataract surgery had been performed
by a single surgeon at Fundación Jiménez Díaz Hospital (FJD) with 2-mm corneal incisions
(temporal in OD and nasal in OS). Table 5.1 shows the patients’ clinical profile and details
on the implanted IOLs. Total wave aberrations were measured using a custom-developed
Laser Ray Tracing (LRT) system (Llorente, Barbero et al. 2004). Anterior segment
geometry (cornea, iris and IOL) was measured using a custom-developed spectral OCT
(sOCT) (Grulkowski, Gora et al. 2009). Measurements were done under mydriasis (2.5%
phenylephrine). LRT measurements were done under foveal fixation, and OCT
measurements were done at the off-axis fixation that aligns the pupillary axis with the
optical axis of the instrument. Experimental protocols were approved by Institutional
Review Boards at FJD and CSIC. Patients signed informed consent after the nature of the
study had been explained to them. All protocols followed the tenets of the Declaration of
Helsinki.
Table 5.1 Patients’ clinical profile and details on the implanted IOLs
5.2.2 3D anterior segment OCT
The sOCT system used in the measurements has been described in detail in Section 2.1.1.
The effective acquisition speed is 25000 A-Scans/s. The axial resolution given by the
coherence length of the OCT is 6.9 µm. The axial range is 7 mm in depth, resulting in a
theoretical pixel resolution of 3.4 µm. Measurements were collected in a 10 × 10 mm area,
and consisted of a collection of 50 B-scans composed by 300 A-scans. In this study, we
consecutively measured the cornea with decreasing acquisition times (from 2.0 s to 0.5 s)
and found that measurements below 0.8 seconds were stable, preventing the need for
distortion artifacts that we developed for that matter, in most cases (Ortiz, Siedlecki et al.
2011). In this study, we used a 0.6 s acquisition speed in a dense, regular and homogeneous
sampling which was deemed to provide an appropriate balance between resolution and
speed for repetitive measurements and did not require the implementation of motion
compensation by software (Ortiz, Siedlecki et al. 2011).
Measurements were obtained while the subject fixates on a minidisplay that projects a
20/20 Snellen E-letter stimulus. The stimulus is moved across the display to change the

Biometric measurements in the crystalline lens: Applications in cataract surgery
140
eye’s fixation angle, so that the optical axis of the instrument is aligned with the pupillary
axis (Perez-Merino, Velasco-Ocana et al. 2015) in Figure 5.1 (a). For foveal fixation the
iris appears asymmetrically tilted (Figure 5.1(b)), whereas for the selected fixation the iris
appears flat (Figure 5.1(c)) in the continuous horizontal and vertical cross-sectional views
of the anterior segment used during alignment. The off-axis position of the fovea (angle
lambda, λ) is calculated from the eye rotation between both alignments. Sets of 3D images
of the anterior segment were captured approximately 5 seconds after blinking.
Figure 5.1 (a) Example movement of 20/20 Snellen E-letter across the display to change the eye’s
fixation angle stimulus; Acquisition at two different foci (cornea and lens) (b) Vertical cross-
sectional scans of a patient’s cornea while fixating foveally, i.e. along the line of sight; (c) Vertical
cross-sectional scans of a patient’s cornea, while fixating eccentrically, i.e. pupilary axis aligned
with the OCT optical axis; (d) Vertical cross-sectional scans of the IOL implanted in the patient.
Typical image acquisitions are obtained with the alignment as in (c) and (d). The yellow line
indicates the iris plane, used for merging.
The automatic image processing tools for denoising, segmentation, clustering, merging,
and biometric and IOL alignment measurements have been described in detail before in
Section 2.6.2 (MATLAB routines). The quantification capabilities of the instrument have
been demonstrated with artificial model eyes with known dimensions, ex vivo and in vivo
measurements, and comparisons with other instruments (Scheimpflug, Purkinje imaging,
and non-contact profilometry) in Section 2.3 (Other techniques for validation).
Anterior and posterior corneal elevation maps, corneal thickness, and anterior chamber
depth were obtained from 3D OCT as described in earlier Section 2.1.2 (Quantification
Chapter 5
Full 3D OCT-based pseudophakic custom computer eye model
141
tools). Anterior and posterior corneal elevation maps were fit by 6th order Zernike
polynomials. For comparison, anterior and posterior corneal topographies were also
obtained from the Pentacam Scheimpflug topographer (Oculus, Inc., Lynnwood, WA)
maintained in Section 2.3.1. IOL tilt and decentration was obtained using the OCT-based
method described in Section 2.1.3.
5.2.3 Ex vivo IOL geometry: non-contact profilometry
The geometry of the IOLs (Akreos 20D, 21.5D, Bausch+Lomb; Asphina 20.5D, Zeiss) was
characterized ex vivo using microscopy-based noncontact profilometry (Sensofar,
PLu2300, Barcelona, Spain) with 0.1-μm nominal vertical precision (on rigid samples) as
maintained in Section 2.3.2. De-hydration effects on these IOLs with high water content
(25-26%) decrease the effective precision. Briefly, repeated measurements on these lenses
revealed repeatability in the apex measurement of 5 µm. Both anterior and posterior lens
surface topographies were measured in a 5.5×5.5 mm range (50x50 points, 0.11 mm steps).
The IOL surface profiles were fitted by conics with MATLAB algorithms.
5.2.4 Customized eye models
In Section 2.3.4, we introduced the customized computer eye models. As a brief summary,
OCT-based elevation data from both anterior and posterior corneal surfaces, anterior
segment distances, IOL geometry and alignment data, angle lambda (all coming from
sOCT), and axial length from the IOLMaster (Carl Zeiss AG, Jena, Germany) were
exported to ZEMAX (Radiant ZEMAX; Focus software, Tucson, AZ, USA), where the
custom model eyes were built. Refractive indices of the cornea, aqueous humour, vitreous
humour, Akreos IOLs and Asphina IOLs were 1.376, 1.337, 1.337, 1.458 and 1.460
respectively, at 555nm. Wave aberrations were calculated in the pupil plane by tracing an
array of 64x64 collimated rays through the eye surfaces within a central 5-mm pupil
diameter area, at 555 nm. Figure 2.15 illustrates the computation of aberrations from OCT
data, i.e. ray tracing calculation on OCT distortion-corrected corneal and IOL surfaces.
Data are analyzed in terms of Zernike terms and retinal image quality metrics (MTF and
Visual Strehl (Iskander 2006)).
5.2.5 Total aberration measurements: LRT
Total wave aberrations were measured using custom LRT, described in detail in Section
2.2. In brief, an infrared (785-nm) laser beam sampled 37 positions across the pupil
sequentially in a hexagonal sampling pattern while a charge couple device (CCD) camera
recorded the corresponding aerial images of light reflected off the retina. The sampling
pattern was adjusted by software to fit a 5-mm pupil centered at the pupil center. Prior to
the measurement, the patient adjusted his/her subjective refraction using a Badal optometer
while viewing a stimulus on a minidisplay placed on a retinal conjugate plane. Ray

Biometric measurements in the crystalline lens: Applications in cataract surgery
142
aberrations were obtained by estimating the deviations of the centroids of the retinal spots
images corresponding to each pupil entry location with respect to the reference (chief ray).
These deviations are proportional to the local derivatives of the wave aberrations.
Maximum energy exposure was 6.8 µW. All measurements were done under foveal fixation
of a Maltese cross. Wave aberrations were fitted by 6th order Zernike polynomial
expansions, with ordering and normalization following OSA standards (Thibos, Applegate
et al. 2002), and were described in terms of individual Zernike coefficients or RMS, which
was used to report the magnitude of HOA. Computations of the Modulation Transfer
Function (MTF) from the wave aberrations were performed using standard Fourier Optics.
RMS wavefront error and the MTF were used as optical quality metrics (More detail can
be found in Section 2.4.2 and 2.4.3).

Chapter 5
Full 3D OCT-based pseudophakic custom computer eye model
143
5.3 Results
5.3.1 OCT-based anterior segment geometry in pseudophakic eyes
Table 5.2 shows the anterior and posterior corneal shape (radii of curvature calculated from
the best-fit sphere over 6-mm diameter and some relevant Zernike terms from the
polynomial fitting to the corneal elevation maps) and biometry (3D OCT Corneal thickness,
and Anterior Chamber Depth).
Table 5.2 Individual OCT-based biometrical and geometrical data used in the computer model
eyes. Data are shown as average ± standard deviation of repeated measurements
Figure 5.2 shows OCT-based anterior and posterior corneal elevation maps in all 3 eyes,
centered at the pupil center, and for 6-mm pupil diameters. For comparison, corneal maps
from Pentacam obtained on the same eyes using the same pupil reference and analysis are
also shown. The RMS difference in corneal elevation between instruments is less than 0.04
mm and 0.06 mm, for anterior and posterior surfaces, respectively. In all eyes, astigmatism
appears to be the dominant term in the posterior corneal maps, with 19.6% average

Biometric measurements in the crystalline lens: Applications in cataract surgery
144
difference in magnitude and 6.5 deg difference in axis between OCT and Pentacam
topographies.
Figure 5.2 Anterior and posterior corneal topographic maps from Pentacam (upper panel) and
OCT (lower panel). OCT-based maps were used in the computer eye models. Data are for 6-mm
pupil.
Table 5.3 shows measurements of eye rotation and IOL tilt and decentration (horizontal and
vertical components) for each eye. The tilt and decentration nomenclature and sign
conventions correspond to those published in prior publications (for an illustration of the
convention see Figure 5.6 in Rosales et al. 2008 (Rosales, Wendt et al. 2008)).
Table 5.3 Eye rotation and IOL tilt and decentration data from OCT-based Purkinje-like methods.
Data are average±standard deviation of 5 repeated measurements. Rotation/tilt X stands for
rotation/tilt around the horizontal axis; Rotation/tilt Y stands for rotation/tilt around the vertical
axis. Decentration X/Y stands for horizontal /vertical decentration.

Chapter 5
Full 3D OCT-based pseudophakic custom computer eye model
145
5.3.2 Comparing OCT-based IOL geometry in vivo with profilometry ex
vivo
Comparison of the IOL geometry measured in vivo (OCT) and ex vivo (non-contact
profilometry) serves as a further validation of the accuracy of OCT (provided with
distortion correction algorithms and analysis tools). Table 5.4 compares the radii of
curvature and asphericity values for anterior and posterior IOL surfaces from profilometry
and OCT, and the estimated IOL power from these values, compared to the nominal IOL
power. The mean differences between the radii of curvature measured by profilometry ex
vivo and OCT in vivo are 0.40 ± 0.28 mm (96.83% agreement), and for the asphericity 2.17
± 1.64 (17.96%). The geometrical differences between techniques result in less than 0.44
D difference between the IOL power estimated from profilometry and OCT, and less than
0.22 D between the OCT based IOL power estimates in vivo and the nominal IOL power.
Table 5.4 Anterior and posterior radius of curvature (R), asphericity (Q) from profilometry and
OCT, and the IOL power estimated from profilometry and OCT. OCT-based data were used in
the computer eye models.
5.3.3 Ocular aberrations: LRT vs. Computer Ray Tracing on custom
model eye
Figure 5.3 shows examples of measured (first column) and simulated (column 2-5) wave
aberrations in three subjects (S#1 OD, S#2 OS, and S#3 OS) for (a) 2nd and higher order
aberrations excluding tilt and defocus and (b) 3rd and higher order aberrations, for 5- mm
pupil diameters. Anterior cornea stands for wave aberration of the eye with only the anterior
corneal surface; Cornea total stands for the wave aberration of the eye with a 2- surface
cornea, without the IOL; Cornea + IOL stands for the wave aberration of the eye with the
IOL assuming that the IOL is perfectly aligned with respect to the pupillary axis; Corneal
+ rot/dec IOL stands for the wave aberration of the eye with the IOL tilted and decentered
according to the measured tilts and decentrations.
The eyes are rotated according to angle λ in order to incorporate the line-of-sight
misalignment. In general, the corneal wave aberration map shows many of the relevant
features of the measured wave aberrations.

Biometric measurements in the crystalline lens: Applications in cataract surgery
146
Figure 5.3 Measured (LRT, 1st column) and Simulated (from OCT-based geometry/biometry, 2nd
−5th columns) wave aberration maps in three pseudophakic eyes. Simulated aberrations include
wave aberration maps for the anterior cornea alone (2nd column); anterior and posterior cornea
(3rd column); eye wave aberration with IOL assuming no tilt and decentration (4th column); eye
wave aberration with IOL with no tilt/decentration (5th column). (a) Wave aberration maps
including astigmatism (no tilt or defocus); (b) Wave aberrations for 3rd and higher order; Data
are for 5-mm pupil, and for foveal fixation, i.e.including eye rotation.
Figure 5.4 compares RMS wavefront error for different Zernike orders and terms for the
LRT-measured eye aberrations, for the cornea (anterior only or total cornea), for the total
eye assuming that the IOL is centered and for the total eye with the real tilt and decentration
with measured total aberrations. The discrepancy between the measured and real

Chapter 5
Full 3D OCT-based pseudophakic custom computer eye model
147
aberrations is less than 14.33% (0.15 µm) for astigmatism, and less than 21.43% (0.03 µm)
for spherical aberration. In contrast, the larger differences occur for trefoil (in Subjects 1
and 3), coma (in Subject 3) and tetrafoil (in all Subjects). On average, the discrepancies for
RMS for astigmatism and higher order aberrations and RMS for high order aberrations
alone are 0.12 µm and 0.08 µm, respectively.
Figure 5.4 (a) RMS Astigmatism; (b) RMS Spherical Aberration; (c) RMS Trefoil; (d) RMS
Coma; (e) RMS Tetrafoil, for anterior corneal RMS (blue bars), total corneal RMS (red bars),
simulated total eye RMS assuming centered IOL (green bars), simulated total eye RMS assuming
real IOL tilt/decentration (purple bars); and experimental (LRT) total eye aberration (light blue
bars).
Figure 5.5 shows the linear correlations between total measured and simulated Zernike
terms (astigmatism and high order aberrations) for the three eyes. There is a highly
statistically significant correlation between the LRT-measured Zernike coefficients and
those simulated from computer eyes model that incorporate all measured geometrical
parameters (average slope=0.82±0.12; average coefficient of correlation R=0.93±0.05;
p<0.0001). The correlations, although statistically significant, are lower between the LRT-
measured Zernike and the anterior corneal Zernike terms (average slope=0.69±0.21;

Biometric measurements in the crystalline lens: Applications in cataract surgery
148
average coefficient of correlation R=0.73±0.05; p<0.0001); the LRT-measured Zernike and
the entire (anterior+posterior) corneal Zernike terms (average slope=0.92±0.23; average
coefficient of correlation R=0.88±0.03; p<0.0001); and similar to the correlations between
LRT-measured Zernike terms and simulated total aberrations from computer eye models
assuming centered IOLs (average slope=0.87±0.1; averagecoefficient of correlation
R=0.94±0.04; p<0.0001). Incorporating posterior cornea and IOLs clearly improves the
correlation, however including IOL tilt and decentration has only a minor impact as also
reported by Rosales and Marcos (Rosales and Marcos 2007).
Figure 5.5 Linear correlations between measured and simulated Zernike coefficients (astigmatism
and 3rd and higher orders) in (a) S#1 OD; (b) S#2 OS; (c) S#3 OS; (d) combining data from the
three subjects (72 points). Data are for 5-mm pupil diameters.
5.3.4 Corneal/IOL compensation
Comparison of the corneal aberrations to total aberrations (Figure 5.4) allows evaluating
compensatory effects between optical elements for different terms. We did not find a
compensation of anterior corneal astigmatism by the posterior corneal astigmatism: in fact,
total corneal astigmatism was higher than anterior corneal astigmatism in all three eyes (by
24.56% on average). In contrast, the posterior cornea consistently partially compensated
anterior corneal spherical aberration (by 25.71%, on average) and coma (by 15.88%, on
average). Consistent with aspheric IOL designs (Marcos, Barbero et al. 2005, Marcos,
Rosales et al. 2008), the IOLs compensated spherical aberration (by 72.14%, according to
the simulations; and by 77.06%, by comparison of corneal and experimentally measured
total aberrations) and coma (by 63.88% / 56.97%, on average).

Chapter 5
Full 3D OCT-based pseudophakic custom computer eye model
149
5.3.5 Effect of IOL tilt and decentration on optical quality
The impact of the measured IOL tilt and decentration on optical aberrations appears to be
minor, as revealed by the small differences in the simulated aberrations with the IOL
aligned with the pupillary axis and those incorporating the real IOL tilt and decentration
(0.04 µm for astigmatism and 0.04 µm for coma, on average in Figure 5.4 (a) and (d)). In
fact, the presence of IOL tilt and decentration resulted in a slight decrease in the RMS in
all three eyes (by 10.84% in RMS for astigmatism and higher order terms, on average). To
further compare simulations and predictions, and analyze the effect of IOL tilt and
decentration on optical quality, we computed the corresponding MTFs (radial profiles) for
astigmatism and higher order terms (Figure 5.6 (a)) and 3rd and higher order aberrations
(Figure 5.6 (b)) from wave aberrations simulated with centered IOLs, as well as IOL with
real tilt/decentration and from LRT-measurement.
Figure 5.6 (a) MTFs (radial profiles) for astigmatism and higher order terms (b) MTFs (radial
profiles) for 3rd and higher order aberrations, for LRT (blue lines), IOL with no tilt/decentration
(green lines) and IOL with real tilt/decentration (purple lines). Data are for the three subjects, for
5-mm pupils.
The presence of IOL tilt/decentration improved optical quality (Visual Strehl) by 8.21% on
average (Figure 5.7).

Biometric measurements in the crystalline lens: Applications in cataract surgery
150
Figure 5.7 (a) Corresponding Visual Strehl with Astigmatism and 3rd and higher order aberration
(b) Corresponding Visual Strehl with 3rd and higher order aberration without Astigmatism (green
bars present Simulation with IOL centered, purple bars present simulation with IOL tilt and
decentration, blue bars present LRT).

Chapter 5
Full 3D OCT-based pseudophakic custom computer eye model
151
5.4 Discussion
We have presented a customized computer eye model, using individual geometrical data in
eyes with intraocular lenses obtained from quantitative 3D anterior segment OCT. The
model predicted the wave aberrations measured in the same eyes with LRT aberrometry
within 0.12 µm of accuracy (RMS for astigmatism and high order aberrations, for 5-mm
pupils).
The geometrical quantification capabilities of the OCT and its accuracy, presented in
previous works (Ortiz, Perez-Merino et al. 2013), allows exact ray tracing on computer eye
models using this geometrical information, provided that the refractive indices of the cornea
and intraocular media are known. Pseudophakic eyes are simpler than phakic eye models
as the refractive index of the IOL material is known from the specifications of the
manufacturer. Knowledge of the Abbe number of the IOL material would allow
extrapolating the index of refraction from the visible to other wavelengths (i.e., IR typically
used in wavefront sensing). Nevertheless, chromatic effects are primarily of impact on
defocus, and not high order aberrations (Perez-Merino, Dorronsoro et al. 2013, Vinas,
Dorronsoro et al. 2015), which explains the good correspondence between LRT and
simulated values, even if measurements were done in IR and simulations in green (i.e., the
wavelength for which the indices of refraction of the IOL materials were available). In
contrast, in phakic eyes the crystalline lens exhibits a patient/age-dependent Gradient Index
Distribution (de Castro, Birkenfeld et al. 2013, Birkenfeld, de Castro et al. 2014). Computer
eye models had been presented before (Tabernero, Piers et al. 2006, Rosales and Marcos
2007), using biometric information gathered from multiple devices (anterior cornea from
Placido disk topography; tilt and decentration from Purkinje imaging apparatus; anterior
chamber depth from slit lamp; axial length from low coherence interferometer). We found
an average coefficient of correlation between measured and simulated aberration to be R =
0.93. This compares with average coefficient of correlation R = 0.82 in Rosales and Marcos
(Rosales and Marcos 2007) and average coefficient of correlation R = 0.88 in Tabernero et
al. reports (Tabernero, Piers et al. 2006).
This chapter shows the capability of building computer eye models from information all
obtained simultaneously with the same OCT system. Although our system did not have
sufficient range to measure the axial length of the eye (and this information was obtained
using low coherence interferometer on another device), different methods have been
proposed to extend the range of the OCT to allow for axial length measurements. These
methods include a dual OCT system rapidly flipping between anterior and posterior
segment imaging and MEM-based swept source OCT (Grulkowski, Liu et al. 2012,
Ruggeri, Uhlhorn et al. 2012).
The measurement of ocular aberrations in pseudophakic eyes allows assessment of the
overall optical performance (Barbero, Marcos et al. 2003). Customized eye models in
combination with the actual measurements of ocular aberrations can be used to identify the
relative importance of each factor. Our results in eyes implanted with aspheric IOLs show
the compensation of part of the positive spherical aberration of the cornea with the IOL (by
66.43-85.89%). This is in agreement with the compensation reported with aspheric IOLs
from different manufacturers (i.e. the Acrysof IQ (Alcon) by 66%) (Marcos, Rosales et al.

Biometric measurements in the crystalline lens: Applications in cataract surgery
152
2008). Very interestingly, as shown by Marcos et al. (Marcos, Rosales et al. 2008), aspheric
IOLs also do appear to compensate for coma, particularly horizontal coma. We found a
coma compensation of 59.43% with Asphina, and Marcos et al. (Marcos, Rosales et al.
2008) a compensation of 87% with Acrysof and Tecnis Aspheric IOLs. This compensation
arises by a passive mechanism, from the combination of positive spherical aberration in the
cornea and negative internally, and eye rotation, producing coma of opposite signs in the
cornea and lens. Also in agreement with previous conclusions based on customized
computer eye models (Rosales and Marcos 2007), IOL tilt and decentration appear to play
a minor role in the optical quality of the eye.
Previous customized computer eye models revealed a major role of the cornea in the ocular
aberrations of the pseudophakic eyes, which also occurs in the three eyes of our study.
However, generally those computer models did not incorporate real posterior corneal
elevations (i.e. Rosales et al. (Rosales and Marcos 2007) used a typical spherical posterior
surface, Tabernero et al. (Tabernero, Piers et al. 2006)used a one-surfaced cornea). Several
authors found a compensatory role of the anterior corneal astigmatism by the posterior
cornea [14% in Dunne et al. (Dunne, Royston et al. 1991) and 31% in Dubbelman
(Dubbelman, Sicam et al. 2006)]. Age-dependent changes of the anterior corneal
astigmatism (i.e. astigmatism changes from with-the-rule to against-the-rule with age) may
alter this balance. We did not find a lower total corneal astigmatism than that of the anterior
cornea alone, suggesting no compensation in the three eyes of the study. Interestingly, the
astigmatic axes of the anterior and posterior cornea do not appear aligned in all cases
(Figure 5.3, relative angles ranging from 2.3 to 56.7 degree). Axis misalignment of the
anterior and posterior corneal astigmatism has been reported before (Kamiya, Shimizu et
al. 2015) as well as misalignments in the astigmatic axes of the anterior and posterior
crystalline lens surfaces (Birkenfeld, de Castro et al. 2013, Sun, Birkenfeld et al. 2014). We
did find consistent compensation by the posterior cornea of the anterior corneal spherical
aberration and of anterior coma. The large differences in trefoil and tetrafoil might be
explained by the larger fitting area of corneal surfaces in the 6-mm area while LRT was
obtained for 5-mm pupil diameters.
The capability of OCT-based computer eye customized models to predict the measured
aberrations post-operatively with a given implanted IOL opens the possibility to use those
models as platforms to evaluate pre-operatively potential results with other IOLs, to
optimize the selection of the IOL and to improve optical outcomes. Given the changes
induced by small-incision cataract surgery on corneal aberrations, the model could be
further refined by incorporating those induced aberrations to the pre-operative cornea to
better reflect the post-operative corneal elevation maps. Marcos et al. (Marcos, Rosales et
al. 2007) reported consistent significant changes in vertical astigmatism, trefoil and tetrafoil
in patients in post-operative corneas of patients with superior 3.2-mm incisions. Neglecting
intersubject and/or meridional variability in the corneal biomechanical response to the
incision, these values could be incorporated on the appropriate Zernike terms in the model.
Adjustments may be needed for different incision sizes for the clinical relevance of smaller
incision sizes and physiological pupil diameters in probably minor.
OCT-based custom computer eye models are also applicable to the optimization of the IOL
power calculation, using virtual ray tracing on these eyes. Ray tracing IOL power
Chapter 5
Full 3D OCT-based pseudophakic custom computer eye model
153
calculation overcomes many limitations of current IOL power selection techniques. These
are typically based on regression models obtained for a large patient population, as opposed
to the individualized approach based on customized eye models. Pre-operative
measurements of anterior and posterior corneal surfaces overcome the limitations of the
standard IOL power calculations which only make use of anterior corneal keratometry and
the so-called keratometric index. Future analysis of the pre-operative anterior segment
anatomy and crystalline lens from 3D OCT quantitative imaging will allow better
predictions of the estimated lens position. Similar to the comparisons between the measured
and simulated high order aberrations addressed in the current study, validations of the IOL
power selections will involve comparisons of measured and predicted aberrometric defocus
and/or refraction.
In summary, OCT-based customized computer eye models are excellent predictive tools of
the optical quality in pseudophakic eyes, allow understanding the factors that contribute to
optical degradation and hold promise to become a primary tool to optimize the selection of
the IOL to be implanted in a cataract procedure.
In the following chapters we will address in particular the contribution of IOL tilt and
decentration to optical quality in pseudophakic eyes and the selection of the optimal IOL,
based on the OCT-based computer model eyes developed in this chapter.

Biometric measurements in the crystalline lens: Applications in cataract surgery
154

Chapter 6
OCT-based ray tracing on pseudophakic eyes to identify optimal IOL centration
155
CHAPTER 6
OCT-BASED RAY TRACING
ON PSEUDOPHAKIC EYES TO
IDENTIFY OPTIMAL IOL
CENTRATION
Biometric measurements in the crystalline lens: Applications in cataract surgery
156
The contribution of Mengchan Sun to the study, in collaboration with other
coauthors, was the literature search, the design of the experiments and the data
acquisition (with Pablo Pérez-Merino), the development of specific routines
and processing of the data (with Edurado Martinez-Enriquez), and the
simulation design simulation and data analysis. This work was also presented
at the 2015 Annual Meeting of the Association for Research in Vision and
Ophthalmology (ARVO) in Denver (Colorado, USA).

Chapter 6
OCT-based ray tracing on pseudophakic eyes to identify optimal IOL centration
157
RESUMEN
Objetivos: La Tomografía de Coherencia Óptica Cuantitativa en 3D (OCT) proporciona
información anatómica completa para construir modelos de ojo personalizados para
identificar la posición lateral de la IOL que produciría la mejor calidad óptica.
Métodos: Se midieron 3 sujetos con IOL asféricas monofocales (Bausch y Lomb, US,
Alcon, US) 3 meses después de la cirugía de cataratas. Se midió la geometría del segmento
anterior cuantitativo en 3D (topografía corneal, profundidad de la cámara anterior,
inclinación y descentramiento de la IOL, posición de la fóvea) usando un OCT espectral y
las aberraciones mediante trazado de rayos láser, ambos de desarrollo propio y descritos en
el capítulo anterior. Las aberraciones oculares se estimaron mediante trazado de rayos
virtual en el programa ZEMAX, en un modelo de ojo personalizado al ojo del paciente. Se
calcularon las aberraciones de onda, y la calidad óptica correspondiente en términos de
Visual Strehl (VS), para pupilas de 3 mm, considerando el descentramiento real, y para
descentramientos horizontales y verticales de -1 a +1 mm en pasos de 0.2 mm, con respecto
del centro de la pupila. El descentramiento óptimo se estima como aquél que maximiza VS.
Resultados: El descentramiento lateral de la IOL produce variaciones en la VS. Las
diferencias medias entre el VS máximo y real (incluyendo astigmatismo) fueron 0.06, 0.01
y 0.08 (calidad óptica mejorada de 7.29%, 2.83% y 9.83%) de E#1 OD, E#2 OS y E#3 OS
respectivamente. Y 0.01, 0.02 y 0.05 (calidad óptica mejorada en 1.05%, 3.23% y 5.35%)
de E#1 OD, E#2 OS y E#3 OS, respectivamente, para aberraciones de alto orden solo. Las
posiciones óptimas de IOL (VS máximo incluyendo astigmatismo y HOA) en E#1 OD, E#2
OS y E#3 OS son (0.20, 0.40), (-0.20, -0.60) y (-0.80, 0.80) mm, y (0.20, 0.20), (-0.20, -
1.00) y (-0.60, 1.00) mm, respectivamente, para aberraciones de alto orden solo. La
diferencia entre la posición óptima de IOL) y posición IOL real de E#1 OD, E#2 OS y E#3
OS son 0.21, 0.81, 0.85 mm respectivamente en el eje horizontal y 0.28, 0.41 y 0.48 mm
en el eje vertical respectivamente (incluyendo astigmatismo) y son 0.21, 0.81 y 0.65 mm
en el eje horizontal respectivamente y 0.08, 0.81 y 0.68 mm en el eje vertical,
respectivamente (para aberraciones de alto orden)
Conclusiones: Los modelos oculares personalizados basados en OCT predicen la calidad
óptica de los ojos pseudofáquicos implantados con lentes intraoculares monofocales de
última generación. En ojos reales, una IOL totalmente alineada con el centro de la pupila
no produce la mejor calidad óptica. El descentramiento óptimo de la IOL puede obtenerse
para cada paciente basándose en modelos de ojo personalizados, y la mejora conseguida
puede ser de relevancia clínica.
.

Biometric measurements in the crystalline lens: Applications in cataract surgery
158

Chapter 6
OCT-based ray tracing on pseudophakic eyes to identify optimal IOL centration
159
6.1. Introduction
More than 6,000 cataract procedures/million people are performed yearly in developed
countries, and cataract surgery has benefited significantly from technological advances.
Advanced intraocular lens (IOL) designs aim at providing the best possible optical quality,
in accordance with the patient’s need (Atchison 1989, Atchison 1991, Holladay, Piers et al.
2002). As lenses become increasingly complex, knowledge of geometry and intraocular
positioning will become even more important (Wolffsohn and Davies 2007). Current
cataract surgeries most frequently involve implantation of posterior chamber IOLs within
the capsular bag; an approach, according to some authors, that makes it difficult to avoid
decentration (Taketani, Matuura et al. 2004). Studies using Purkinje imaging have observed
decentrations of the lens in the horizontal direction, generally with temporal decentrations
in left eyes and nasal decentrations in right eyes (Rosales and Marcos 2006). Vertical
decentrations (generally lower in magnitude) have also been reported in some patients (de
Castro, Rosales et al. 2007). The magnitude of decentrations varies across studies, likely in
part due to the different techniques used to asses lens decentrations, and the axis of
reference to which those are referred, with most reports ranging from 0.3 to 0.7mm
(Phillips, Perez-Emmanuelli et al. 1988, Ohara, Kato et al. 2006, Rosales, De Castro et al.
2010, Crnej, Hirnschall et al. 2011, Holladay, Calogero et al. 2017). While in some clinical
decentration is estimated from direct view of the lens through the cornea (Chang and
Waring 2014), several studies present technologies to measure IOL tilt and decentration
taking into account the refraction of the cornea and the non-centered nature of the optical
system of the eye. Dedicated technology for lens tilt and decentration measurements
include Purkinje imaging (Phillips, Perez-Emmanuelli et al. 1988, Guyton, Uozato et al.
1990, Nishi, Hirnschall et al. 2010), distortion-corrected Scheimpflug imaging (Rosales,
De Castro et al. 2010), quantitative anterior segment Optical Coherence Tomography
(Ortiz, Siedlecki et al. 2009, Marcos, Ortiz et al. 2014) and en-face OCT (Sun, de Castro et
al. 2014). Ray tracing analysis on computer eye models based on individual anatomical
information that includes IOL tilt and decentration allow evaluating the impact of IOL
alignment on the wave aberrations of the eye, and pontential impact on ocular astigmatism
an coma (Li, Wang et al. 2013) (Baumeister, Buhren et al. 2009).
Lens decentration may be associated with a failure to place the lens correctly in the capsular
bag during surgery (called subluxation), or it may develop in the postoperative period
because of external (e.g., trauma, eye rubbing) or internal forces (e.g., scarring, peripheral
anterior synechiae (PAS), capsular contraction, size disparity), more notably fibrotic
processes and capsular bag shrinkage (Tappin and Larkin 2000). This event may be the
result of a combination of a small capsular bag and a mechanically unstable haptic platform
or lens material (Kohnen 1998). In any case, in state-of-the-art lens platforms, the data
suggest that the lens decentrations are primarily driven by the decentrations of the natural
lens capsule in the eye, and that this is mostly preserved after surgery (Rosales and Marcos
2006, Rosales, Wendt et al. 2008, Rosales, De Castro et al. 2010, Marcos, Ortiz et al. 2014).
A notable exception was observed in patients implanted with the accommodating IOL
Crystalens, very likely associated with the hinge nature of the haptics and asymmetric
fibrosis in the haptic region (Zsyndrome in Crystalens) (Marcos, Ortiz et al. 2014).
Furthermore, Rosales and Marcos using custom model eyes (built by gathering biometric
information from multiple instruments, included IOL decentrations from multiple

Biometric measurements in the crystalline lens: Applications in cataract surgery
160
instruments) found that in a large proportion of patients (58.3% on 12 eyes of 7
pseudophakic patients) the actual IOL decentrations in fact improved optical quality with
respect to that of an IOL with no decentrations, suggesting favorable interactions between
lens decentrations and the off-axis position of the fovea (Rosales and Marcos 2007).
A remaining question is if this anatomical decentration is actually optimal or whether
optical quality could be further improved by an optimal position of the lens. Capsular
tension rings (CTRs) have been shown to play a role in the stability and positioning of IOLs
(Lee, Lee et al. 2001, Alio, Elkady et al. 2008), very likely preserving the natural
decentration of the capsular bag. However, it is technically conceivable to fine tune the
decentration of the IOL, if an optimal lateral positioning resulted in a visual benefit. For
example, a published patent reports the design of an IOL with asymmetric haptics, which
allowed the centration of the IOL optic with respect to the pupil in order to reduce
dsyphotopsia and/or the perception of dark shadows (Michael J. Simpson 2007). An
accurate orientation of the haptic along the meridian at which decentration is aimed could
be achieved through standard methods in implantation of rotational asymmetric multifocal
Intraocular lens (MIOL) (Venter, Pelouskova et al. 2013, Kretz, Khoramnia et al. 2016) or
toric lenses. Some commercial surgical microscopes, e.g. IOLcompass Pro (Leica
Microsystem, Wetzlar, Germany) and VERION™ Digital Marker (Alcon, Fort Worth,
Texas, United States), support ophthalmic surgeons in providing stable and accurate
guidance for intra-operative positioning of premium intraocular lenses (IOLs) throughout
the cataract surgical workflow.
In Chapter 3, we have presented an OCT-based method to measure tilt and decentration of
the lens in vivo. On the other hand, in Chapter 5, we have presented full OCT-based custom
eye models built using anatomical information from patients, which are able to predict with
great accuracy the measured aberrations of the eye, with >90% correspondence. In this
study we used these OCT-based custom eye models to investigate the changes in optical
quality in patients implanted with IOLs with IOL position, and in particular searched for
the lens position that optimized optical quality at the patient's level.

Chapter 6
OCT-based ray tracing on pseudophakic eyes to identify optimal IOL centration
161
6.2. Methods
6.2.1. Patients, surgery and measurements
Three eyes from two patients (64 and 78 years old) implanted with three types of IOLs
(Akreos AO M160, 20D, Bausch and Lomb, Rochester, New York, US; Acrysof IQ
SN60WF, 21.5D, Alcon, Texas, US; CT Asphina 409M, 20.5D, Zeiss, Jena, Germany) were
investigated. E#1 and E#3 are right and left eyes from subject 1. Standard phaco-
emulsification intra-capsular cataract surgery had been performed by a single surgeon at
Fundación Jiménez Díaz Hospital (FJD), with 2-mm corneal incisions (temporal in OD and
nasal in OS). Total wave aberrations were measured using a custom-developed Laser Ray
Tracing (LRT) system (Llorente, Barbero et al. 2004). Anterior segment geometry (cornea,
iris and IOL) was measured using a custom-developed spectral OCT (Ortiz, Siedlecki et al.
2009, Ortiz, Siedlecki et al. 2011, Ortiz, Perez-Merino et al. 2013). Measurements were
done under mydriasis (2.5% phenylephrine).
6.2.2. Laboratory setup: OCT, LRT and Experimental protocols
The sOCT system used in the measurements has been described in detail in Section 2.1.1.
Measurements were collected in a 10 × 10 mm area, and consisted of a collection of 50 B-
scans composed by 300 A-scans. Sets of 3D images of the anterior segment were captured
along the pupillary axis approximately 5 seconds after blinking. The off-axis position of
the fovea (angle lambda, λ) is calculated from the eye rotation between alignments of both
optical axis and pupillary axis. The automatic image processing tools for denoising,
segmentation, clustering, merging, and biometric and IOL alignment measurements have
been described in detail before in Section 2.6.2 (MATLAB routines). Anterior and posterior
corneal elevation maps, corneal thickness and anterior chamber depth were obtained from
3D OCT as described in Section 2.1.2 (Quantification tools).
Total wave aberrations, measured using custom-developed LRT at 785nm, were sampled
at 37 positions of a 3 mm pupil under foveal fixation with a maximum energy exposure of
6.8 µW, which has been described in detail in Section 2.4.2. Measurements were done under
mydriasis (1 drop 1% tropic amide) at three weeks after cataract surgery. Prior to the
measurement of total aberration, the patient adjusted his/her subjective refraction using a
Badal optometer in the LRT system while viewing a stimulus on a minidisplay on the retinal
conjugate plane.
6.2.3. Purkinje-Like OCT Method
IOL tilt and decentration was obtained by the Purkinje-like OCT method described in
Section 2.1.3. In brief, the Purkinje-like analysis can be summarized in five steps (Figure
2.7): (1) collection of a volumetric data set; (2) generation of image intensity values in the
axial direction; (3) pupil segmentation and identification of the positions of the specular
reflexes on the different surfaces (Purkinje-like images positions, PI, PIII and PIV). The
reflexes PI, PIII, and PIV are easily identified by checking the corresponding OCT B-scan
image. Eye rotation (β), lens tilt (α) and decentration (d) were obtained from the inversion
in Eq.2.4, using the positions of the experimental reflexes (PI, PIII and PIV).

Biometric measurements in the crystalline lens: Applications in cataract surgery
162
The tilt and decentration nomenclature and sign conventions are illustrated in Section 2.1.3,
which is the same as Rosales et al. 2008 (Rosales and Marcos 2006). As a brief summary,
positive horizontal decentration stands for nasal decentration (in ODs) and temporal
decentration (in OSs), and vice versa for negative; positive vertical decentration for
superior, and negative for inferior. Positive tilt/rotation around the horizontal axis
(tilt/rotation x) indicates that the superior edge of the lens is moved forward. Negative
tilt/rotation around the vertical axis (tilt/rotation y) (in ODs) indicates that the temporal
edge of the lens is moved forward, and (in OSs) indicates that the nasal edge of the lens is
moved forward, shown in Figure 2.8 (g).
6.2.4. Full OCT-based customized eye models
Custom computer eye models were created for each patient, as described in Section 2.3.4.
OCT-based elevation data from both anterior and posterior corneal surfaces, anterior
segment distances, IOL geometry and alignment data, angle lambda, and axial length from
the IOLMaster (Carl Zeiss AG, Jena, Germany) were exported to ZEMAX (Radiant
ZEMAX; Focus software, Tucson, AZ, USA), where the custom model eyes were built.
Refractive indices of cornea, aqueous humour, vitreous humour, Akreos IOLs and Asphina
IOLs were 1.376, 1.337, 1.337, 1.458 and 1.460 respectively, at 555nm. Wave aberrations
were calculated in the pupil plane by tracing an array of 64x64 collimated rays through the
eye surfaces within a central 5-mm pupil diameter area, at 555 nm. Figure 2.15 illustrates
the computation of aberrations from OCT data, i.e. ray tracing calculation on OCT
distortion-corrected corneal and IOL surfaces. Data are analyzed in terms of Zernike terms
and retinal image quality metrics using Visual Strehl (VS) (Iskander 2006). Wave
aberrations were calculated by tracing an array of 64 × 64 collimated rays through the eye
surfaces (anterior and posterior cornea, separated by corneal thickness, ACD, anterior and
posterior IOL, separated by IOL thickness) in the 3 mm pupil plane, placed at 3.47 mm
from the anterior corneal surface and retinal plane. Data are analyzed in terms of Zernike
terms and retina image quality was calculated from measured/simulated wave aberrations
in terms of Visual Strehl (VS), estimated for the native tilt & decentration.
6.2.5. Estimation of optimal IOL decentration
In order to identify optimal IOL centration, OCT-based ray tracing on a pseudophakic eye
model was performed with all anatomical input data from the patient (anterior and posterior
corneal elevation maps, IOL geometry, off-axis foveal angle, and IOL tilt), while
decentration was changed from -1 to +1 mm (in 0.2 mm steps) in a horizontal/vertical grid.
In selected cases as a control, computer eyes were also created using simpler anterior and
posterior corneal representations (aspheric surfaces), and setting tilt and/or eye rotation to
zero. Coordinate break surfaces were introduced into the model, which allowed specifying
the IOL location. Wave aberrations were calculated for every IOL position, assuming a 3-
mm pupil. Wave aberrations were fit with 6th order Zernike polynomial expansions
following OSA standards, and were described in terms of individual Zernike coefficients
or RMS wavefront errors. Also, the PSF, MTF and OTF were computed using Fourier
optics from the wave aberrations using routines written in MATLAB. Visual Strehl was
calculated for the corresponding wave aberrations (for 3-mm pupils) for every IOL
location. Also, VS was maximized through-focus (1.25D to -1.25D in 0.125D steps), to

Chapter 6
OCT-based ray tracing on pseudophakic eyes to identify optimal IOL centration
163
calculate residual defocus errors. The lateral IOL position producing the maximum VS was
taken as the optimal IOL position.
Figure 6.1 Illustration of estimation of the optical IOL position. (1) Custom model eye is created
with individual anatomical information; (2) Wave aberrations are computed for different IOL
decentrations 1 mm x 1 mm grid (0.2 mm steps); 8 sample wave aberrations are shown; (3) Visual
Strehl is calculated for every wave aberration (for 3-mm pupil diameter) and a VS pupillary map
is created;(4) Location producing the maximum VS is identified.

Biometric measurements in the crystalline lens: Applications in cataract surgery
164
6.3. Results
6.3.1 Measured eye rotation, IOL tilt and decentration
IOL tilt, decentration and eye rotation were estimated as described in Chapter 2, and given
in Table 6.1 for the 3 pseudophakic eyes of the study.
Table 6.1 show measurements of eye rotation, IOL tilt and decentration (horizontal
and vertical components) for each eye.
6.3.2 Change of optical quality with IOL decentration using computer eye
models with symmetric aspheric cornea
VS pupillary maps were obtained using aspheric fits to the patient’s anterior and posterior
corneas. Four conditions were tested: (1) Assuming no eye rotation (ER) and no IOL tilt
(IT); (2) Assuming the measured ER but no IT; (3) assuming no ER and the measured IT;
(4) Assuming the measured ER and IT. Values of measured ER and IT are shown in Table
6.1. Figure 6.2 shows the Visual Strehl (VS) pupillary maps for one eye (E#1 OD),
including: astigmatism and high order aberrations (maximized VS thru-focus), only high
order aberration (maximized VS thru-focus). For real ER and IT (last column), VS ranged
from 0.51 to 0.69 across IOL decentrations for astigmatism and HOA; from 0.52 to 0.78
for HOA.
Even for symmetric aspheric corneas, interactions occur between tilt, decentration and eye
rotation. In the absence of tilt and eye rotation, the optimal lateral position of the IOL
corresponds to the pupil center, but the presence of other ocular misalignments shift
substantially the best optimal IOL position. The large difference in the optimal lateral
position predicted considering astigmatism and HOA, or only high order aberrations
suggests important interactions between different aberration terms.

Chapter 6
OCT-based ray tracing on pseudophakic eyes to identify optimal IOL centration
165
Figure 6.2 the Visual Strehl (VS) pupillary maps for one eye (E#1 OD), including: astigmatism
and high order aberrations (in the first row) and only high order aberration (in the second row)
under four conditions (without eye rotation (ER) and IOL tilt (IT) in the first column; with ER
and without IT in the second column; without ER but with IT in third column; with ER and IT in
the fourth column)
6.3.3 Change of optical quality with IOL decentration using computer eye
models with real corneas
Figure 6.3 shows similar maps as in Figure 6.2 for one eye (E#1 OD) but now using anterior
and posterior elevation maps (fitted to 6th order polynomials). For real ER and IT (last
column), VS ranged from 0.32 to 0.81 across IOL decentrations for astigmatism and HOA;
from 0.68 to 0.86 for HOA.
Figure 6.3 the Visual Strehl (VS) pupillary maps for one eye (E#1 OD) using anterior and
posterior elevation maps (fitted to 6th order polynomials), including: astigmatism and high order
aberrations (in the first row) and only high order aberration (in the second row) under the same
conditions in Figure 6.2.
For real anterior and posterior corneal elevation maps, interactions also occur between tilt,
decentration and eye rotation. In the absence of tilt and eye rotation, the optimal lateral
position of the IOL does not correspond to the pupil center, and the presence of other ocular

Biometric measurements in the crystalline lens: Applications in cataract surgery
166
misalignments shift substantially the best optimal IOL position. The less difference in the
optimal lateral position predicted considering only HOA, or also astigmatism aberrations
suggest important interactions between different aberration terms compared to symmetric
aspheric corneas. The comparison of maximum Visual Strehl and optimal IOL decentration
between using symmetric and aspheric corneal and using real corneal elevations will be
analysis in section 6.3.4.
Figure 6.4 shows Visual Strehl (VS) of E#1 OD, E#2 OS and E#3 OS including astigmatism
and high order aberrations (HOA) in the first row and including HOA only in the second
row using anterior and posterior elevation maps (fitted to 6th order polynomials), with real
ER and real IT. The VS ranged from 0.41 to 0.50 (E#2 OS) and 0.34 to 0.84 (E#3 OS)
across IOL decentrations for astigmatism and HOA; from 0.46 to 0.49 (E#2 OS) and 0.54
to 0.84 (E#3 OS) for HOA. The real VS included astigmatism and HOA, of E#1 OD, E#2
OS and E#3 OS are 0.75, 0.49 and 0.75 respectively, with real IOL misalignment. The real
VS included HOA only, of E#1 OD, E#2 OS and E#3 OS are 0.85, 0.48 and 0.80
respectively, with real IOL misalignment.
Figure 6.4 Visual Strehl (VS) of E#1 OD, E#2 OS and E#3 OS including Astigmatism and high
order aberrations (HO) in the first row and including HOA only in the second row, with real ER
and real IT.
Across subjects, the optimal lateral position of the IOL does not correspond to the pupil
center and the presence of other ocular misalignments shift nasally the best optimal IOL
position. The less difference in the optimal lateral position predicted considering only high
order aberration, or also astigmatism suggest important interactions between different
aberration terms in the pair of eye (E#1 OD and E#3 OS) compared to E#2 OS. The
comparison of maximum Visual Strehl and optimal IOL decentration between using
symmetric and aspheric corneal and using real corneal elevations will be analysis in section
6.3.4.

Chapter 6
OCT-based ray tracing on pseudophakic eyes to identify optimal IOL centration
167
6.3.4. Maximum Visual Strehl and Optimal IOL decentration
Figure 6.5 (a) compares the maximum VS achieved by optimally placing the IOL, assuming
aspheric corneas (blue lines) or real corneal elevation maps (red lines), in comparison with
a perfect centered IOL, for subject E#1 (derived from the maps shown in Figure 6.2 and
6.3). In the absence of corneal irregularities, a very high VS (0.9) is achieved in the absence
of ER and IT, or in the presence of IT alone, for a practically centered IOL. However, in
presence of ER (or ER and IT), optimizing the position of the IOL can improve VS by
15.78%, considering HOA only, but not significantly considering astigmatism and HOA.
The presence of astigmatism and HOA in the cornea minimizes in general the impact of
ER. Optimizing IOL decentration improves VS by around 4.85% in all conditions with
respect to a perfectly centered IOL and by 7.29% (lines not shown in graph) with respect
to the real IOL decentration.
Figure 6.5 (b) shows the IOL position maximizing VS (for aspheric corneas, in blue and
for real surface elevation in red) for the different conditions considering astigmatism and
HOA (closed symbols) or HOA only (open symbols), in comparison with the real IOL
position (star symbol), for subject E#1. While in all cases the optimal IOL position is
decentered nasally, there is a large scatter across conditions. For the eye model most closely
representing the patient’s eye (real surface elevation; real IOL tilt; real eye rotation) the
coordinates of the IOL position optimizing retinal image quality (for astigmatism and
HOA) are 0.4 mm inferiorly and 0.2 mm nasally. The presence of high order irregularities
in the cornea results in large changes in the optimal position of the IOL, indicating that both
ocular surface misalignments and surface irregularities contribute to optical degradation.

Biometric measurements in the crystalline lens: Applications in cataract surgery
168
Figure 6.5 (a) the maximum VS achieved by optimally placing the IOL, assuming aspheric
corneas (blue lines) or real corneal elevation maps (red lines), in comparison with a perfect
centered IOL, for subject E#1). Solid lines/solid symbols represent the max VS, while dashed
lines/opened symbols represent the VS of centered IOL in the pupil center. Thicker lines/ symbols
represent VS including astigmatism and HOA, while thinner lines/smaller symbols represent VS
including HOA only. (b) Optimal IOL position (max VS) using aspherical and real corneal
elevation maps with four conditions. Square, diamond, circle and triangle symbols represent the
condition (without ER and IT) in the first column; with real ER and without IT in the second
column; without ER but with real IT in third column; with real ER and real IT in the fourth
column) respectively. Star symbol represent the real IOL position in E#1. The color codes are the
same in (a).
Figure 6.6 (a) shows the Maximum Visual Strehl (by optimizing IOL decentration), the
Visual Strehl with the real IOL decentration, and assuming a centered IOL, obtained from
patient specific eye models in all three patients, with their actual anterior and posterior
corneal topographies and real eye rotation and IOL tilt. Data shown include Astigmatism
and HOA (solid bars) and HOA only (shaded bars). The average deviations between max
and real VS (Astigmatism +HOA) were 0.06, 0.01 and 0.08 (improved optical quality by
7.29%, 2.83% and 9.83%) of E#1 OD, E#2 OS and E#3 OS respectively. The average
deviations between max and real VS (HOA only) were 0.01, 0.02 and 0.05 (improved
optical quality by 1.05%, 3.23% and 5.35%) of E#1 OD, E#2 OS and E#3 OS respectively.
Figure 6.6 (b) shows the optimal IOL position (squares) and real IOL positions (circles),
from estimations using astigmatism and HOA (closed) and HOA only (empty) for all three
subjects. The optimal IOL positions (max VS including astigmatism and HOA) of E#1 OD,
E#2 OS and E#3 OS are (0.20, 0.40), (-0.20, -0.60) and (-0.80, 0.80) mm, while the optimal
IOL positions (max VS including HOA only) are (0.20, 0.20), (-0.20, -1.00) and (-0.60,
1.00) mm, on x and y axis, respectively, The deviation between the optimal IOL position
of max VS (Astigmatism + HOA) and real IOL position of E#1 OD, E#2 OS and E#3 OS
are 0.21, 0.81, 0.85 mm on the horizontal axis respectively, and 0.28, 0.41 and 0.48 mm on
the vertical axis respectively. The deviation between the optimal IOL position of max VS
(HOA only) and real IOL position of E#1 OD, E#2 OS and E#3 OS are 0.21, 0.81 and 0.65
mm on the horizontal axis respectively, and 0.08, 0.81 and 0.68 mm on the vertical axis
respectively.

Chapter 6
OCT-based ray tracing on pseudophakic eyes to identify optimal IOL centration
169
Figure 6.6 (a) the Maximum Visual Strehl (by optimizing IOL decentration), the Visual Strehl
with the real IOL decentration, and assuming a centered IOL, obtained from patient specific eye
models in all three patients, with their actual anterior and posterior corneal topographies and real
eye rotation and IOL tilt. Data shown include Astigmatism and HOA (solid bars) and HOA only
(shaded bars). (b) The optimal IOL position (squares) and real IOL positions (circles), from
estimations using astigmatism and HOA (closed) and HOA only (empty) for all three subjects.
The stander deviations of real IOL positions are from measurements.
6.3.5. Interactions of eye rotation, IOL tilt and IOL decentration and
corneal irregularities on astigmatism, trefoil and coma
To further investigate interactive effects between misalignments and corneal irregularities
as well as to understand the Zernike terms playing major roles in the improvement upon
optimization, we evaluated RMS for astigmatism, coma and trefoil in similar conditions
than those evaluated in 6.3.4 on patient E#1 (no ER, no IT; Real ER, no IT; No ER, Real
IT; Real ER and Real IT), as shown in Figure 6.5. The optimization was performed either
considering astigmatism and HOA as well as HOA only.
As found in the VS analysis, aspheric corneas are more sensitive to the induction of
astigmatism and coma in the presence of ER, while real corneas show less astigmatism and
less coma for interactions of real ER and IOL tilt. According to Figure 6.6, with aspheric
corneas, we found that optimizing IOL position of max VS (Astigmatism + HOA)
improved the average RMS astigmatism (Figure 6.7 (a)) by 0.01 μm by IT compared with
zero IOL decentration, improved RMS coma by an average of 45.45% (0.01 μm), compared
to centered IOL position, and by 53.20% (0.01 μm) compared between the optimal IOL
position of max VS (HOA) and VS of a centered IOL shown in the Figure 6.7 (b). In the
Figure 6.7 (c), RMS trefoil decreased 22.6% (0.01 μm) by ER, 87.93% (0.01 μm) by IT,
and increased 65.84% (0.01 μm) compared between the optimal IOL position of max VS
(Astigmatism + HOA) and centered IOL position, and the average RMS trefoil decreased
90.9% (0.01 μm) by three conditions (ER, IT, and ER&IT) between max VS (HOA) and
VS of a centered IOL.
In the computer eye model using real corneal elevations, we found the optimal IOL of max
VS (Astigmatism + HOA) improved the average RMS astigmatism (Figure 6.7 (a)) by
50.82% (0.05 μm) with all conditions as compared to centered IOL position, and improved
the average RMS astigmatism by 25.74% (0.01 μm) with IT, as compared between the

Biometric measurements in the crystalline lens: Applications in cataract surgery
170
optimal IOL position of max VS (HOA) and centered IOL position. The optimal IOL
position of both max VS with/without astigmatism improved RMS coma by an average of
24.71% (0.01 μm), as compared centered IOL position. Spherical aberration (not shown)
did not change with the presence of ER, IT, nor across IOL decentration.
Figure 6.7 (a) RMS astigmatism; (b) RMS Coma and (c) RMS Trefoil changing with four
conditions (no ER, no IT; Real ER, no IT; No ER, Real IT; Real ER and Real IT). Double solid
line, single solid line and dashed line represent the max VS including astigmatism & HO, the max
VS including HOA only, and the VS of a centered IOL in the pupil center. The color codes are
the same in Figure 6.4.
According to Figure 6.7, we found the optimal IOL position of max VS (astigmatism +
HOA) improved the average RMS astigmatism (Figure 6.8 (a)) of E#1 OD and E#3 OS by
73.29% (0.03 μm), while the optimal IOL position of max VS (HOA) only improved RMS
astigmatism of E#3 OS by 26.82% (0.01μm), with real ER and real IT, as compared to the
centered IOL. The optimal IOL position of max VS (Astigmatism + HOA) improved RMS
coma (Figure 6.8 (b)) by an average of 27.59% (0.01 μm) in all subjects, while the optimal
IOL position of max VS (HOA) improved the average RMS coma of E#1 OD and E#3 OS
by 50.31% (0.01 μm), as compared to the centered IOL position. In Figure 6.8 (c), the
optimal IOL of max VS (Astigmatism + HOA) improved the average RMS trefoil by
16.48% (0.01μm) in E#2OS and E#3OS, while the optimal IOL of max VS (HOA)
improved the average RMS trefoil of all the subjects by 36.14% (0.01μm) as compared to
centered IOL position.
We found the optimal IOL position of max VS (astigmatism + HOA)/(HOA) improved the
average RMS astigmatism among the pair of eye (E#1 OD and E#3 OS) (Figure 6.8 (a)) by
73.52% (0.04 μm)/55.01% (0.01 μm) respectively, with real ER and real IT, compared to
the real IOL position. RMS coma (Figure 6.8 (b)) decreased by an average of 33.28% (0.01
μm)/ 38.46% (0.01 μm) among all subjects by the optimal IOL of max VS (astigmatism +

Chapter 6
OCT-based ray tracing on pseudophakic eyes to identify optimal IOL centration
171
HOA)/ (HOA), as compared to the real IOL position. Figure 6.8 (c) shows RMS trefoil
decreased by 34.42% (0.01μm) as average in all conditions by the optimal IOL position of
max VS (HOA), as compared to the real IOL position.
Figure 6.8 (a) RMS astigmatism; (b) RMS Coma and (c) RMS Trefoil with real ER and IT. Dark
solid bars represent the optimal IOL position of max VS including astigmatism & HOA, shade
bars represent the optimal IOL position of max VS including HOA only, light solid bars represent
the real IOL position in the three subjects, and lighter solid bars represent the IOL position
centered in the pupil center. The three eyes are coded as the same in Figure 6.5.
6.3.6. Residual defocus and residual astigmatism
Results shown in Figures 6.4 have been obtained by optimizing VS through focus at each
IOL position. Figure 6.9 showing VS pupillary maps with (i.e. equivalent to fine tuning the
IOL power at each location) in the first row and without through-focus optimization (i.e.
equivalent to keeping the IOL power constant) in the second row show that the optimal
IOL position is independent of focus optimization.
We found that the maximum residual defocus difference was 0.85±0.16D in full VS
pupillary map and that the difference in best focus for the real IOL position, centered IOL
position and optimized IOL position was 0.10±0.02D, 0.09±0.03D and 0.16±0.03D for
E#1OD, E#2OS and E#3OS respectively in Figure 6.9.

Biometric measurements in the crystalline lens: Applications in cataract surgery
172
Figure 6.9 Visual Strehl (VS) of high order aberration through focus (from 3rd order Zernike
terms with best focus) (in the first row) and without defocus (in second row) as a function of IOL
position. (a) E1; (b) E2; (c) E3;
Figure 6.10 the residual refractive error (the first row) and astigmatism power (the second row)
as a function of IOL positions of E#1 OD (the first column), E#2 OS (the second column) and
E#3 OS (the third column). (in D)
On the other hand, a comparison between the analysis for Astigmatism+ HOA and HOA
only allows understanding the induction/correction of astigmatism by proper positioning of
the IOL. The former assumes that astigmatism was not corrected by the implanted, and that
the IOL position optimization may minimize astigmatism. The latter assume that the
implanted IOL corrects for astigmatism at every location. We found that astigmatism

Chapter 6
OCT-based ray tracing on pseudophakic eyes to identify optimal IOL centration
173
changes by 0.69±0.13 D across the entire VS pupillary map (average maximum to
minimum across subjects), and that the difference in best focus for the real IOL position,
centered IOL position and optimized IOL position of max VS (Astigmatism + HOA) was
0.25±0.06D, 0.20±0.08D and 0.13±0.12D for E#1OD, E#2OS and E#3OS respectively in
Figure 6.9. The power of astigmatism reduced when IOL located in the optimal of max VS
including astigmatism and high order aberrations. Additionally, the optimal IOL position
of max VS (Astigmatism + HOA) improved the more optical quality compare to the
centered IOL position and the real IOL position.

Biometric measurements in the crystalline lens: Applications in cataract surgery
174
6.4. Discussion
Centration of surgical refractive procedures has been a matter of long debate, particularly
in corneal surgery. In cataract surgery, the centration of the IOL has also been subject of
numerous investigations. Some factors (e.g. incongruence between bag diameter and
overall IOL diameter, a large capsulorhexis, asymmetrical capsule coverage, IOL
placement in sulcus, and so on) may lead to large decentrations of high clinical relevance,
malposition of an IOL is one of the reported leading causes for removal, exchange or
repositioning of a posterior chamber IOL (Obstbaum and To 1989, Lyle and Jin 1992,
Auffarth, Wilcox et al. 1995, Carlson, Stewart et al. 1998, Mamalis, Brubaker et al. 2008).
On the other hand, investigations of the effects of IOL alignment on optical quality even in
uneventful cataract procedures have paralled the increased design sophistication of state-
of-the-art IOLs and have been enabled by new imaging technologies to accurate measure
IOL alignment. Furthermore, OCT-based customized eye models which incorporate
patient-specific information have been shown to accurately predict optical
aberrations/optical performance in pseudophakic eyes (Sun, Pérez-Merino et al. 2016). In
this chapter, we have used such models to understand the relative contributions of eye
rotation, IOL tilt, corneal geometry and IOL decentration on optical quality in
pseudophakic eyes. More specifically, we have demonstrated in three real eyes the
possibility for improving optical performance by optimization of the IOL centration. As
expected from the non-centered nature of the ocular components this optimal lateral
position is not collinear with the pupil center, and in general, is not coincident with the
actual IOL position. In some cases, we found the optimal IOL position of max VS including
astigmatism and high order aberrations is in fact rather decentered 0.8 mm.
We found that optimizing IOL decentration improved optical quality in real eyes by up to
9.83% (0.08) compared to the real IOL position (in E#3OS) and was better by 15.01%
(0.12) than if the IOL was centered at the pupil. The fact that real IOL decentrations
(ranging from -0.19 to 0.61) exceeded optical quality with respect to that of no IOL
decentration is in agreement with previous findings by Tabernero et al. (Tabernero, Piers et
al. 2006) and Rosales and Marcos (Rosales and Marcos 2006) who reported individual
performance of the IOL with decentration was better than that of a centered IOL, and by
Eppig et al. (Eppig, Scholz et al. 2009), who reported that the best MTF of Invent ZO IOL
and Aspira-aXa IOL are not in the zero decentration position.
Whether the relatively minor reported improvements potentially achieved by precise
positioning of the IOL are worth the required haptic design and surgical sophistication
remains to be seem. It is likely that a combination of customized IOL design, corrections
of chromatic and monochromatic aberrations, and a higher tuning of the IOL power
selection and astigmatism correction cooperate to further improvement of optical quality.
We found that the IOL lateral shifts and the potential improvements in optical quality are
highly subject dependent (ranging from 0.21 to 0.85 mm and 1.05% (0.01) to 9.83% (0.08)
VS, respectively in our sample). Undoubtedly, the use of patient specific eye models
allowing virtual ray tracing and evaluation of optical quality prior to IOL implantation will
be key in selection of IOL that optimizes retinal image quality, including optimal IOL
centration, and select the patient who will benefit from the improvements.

Chapter 7
Conclusions
175
CHAPTER 7
CONCLUSIONS

Biometric measurements in the crystalline lens: Applications in cataract surgery
176

Chapter 7
Conclusions
177
RESUMEN
En esta tesis, hemos desarrollado una nueva metodología para medir el desalineamiento
implantada de la IOL en pacientes con cirugía de cataratas a partir de imágenes de OCT
en-face del segmento anterior. También hemos cuantificado la forma y la topografía 3D del
cristalino del ojo in vivo, sus propiedades ópticas y sus cambios con la edad, que nos han
permitido entender las fuentes de aberraciones oculares, compensaciones entre las
superficies anterior y posterior del cristalino, y cambios estructurales con la edad., La
metodología de OCT cuantitativa y modelos de ojo personalizados en pacientes han sido
validados en pacientes operados de cirugía de cataratas, mediante comparaciones de las
aberraciones simuladas y medidas en los mismos pacientes, y han permitido comprender
la contribución relativa de los factores ópticos geométricos y quirúrgicos relacionados con
la calidad de la imagen, como la identificación del centrado óptimo de la IOL. Estos son
clave en los cálculos avanzados de la potencia de la IOL, la optimización de la selección
individual de IOL o diseño de IOLs personalizados que puedan proporcionar una solución
visual óptima al paciente.

Biometric measurements in the crystalline lens: Applications in cataract surgery
178

Chapter 7
Conclusions
179
7.1 Achievements:
The main accomplishments of this thesis are:
1. We have implemented a comprehensive set of techniques for 3D quantitative
biometry and IOL alignment based on OCT. An en-face OCT image Purkinje-like
method to measure implanted IOL alignment in cataract surgery patients has been
developed. With quantitative sOCT imaging of the pre- and post-operative anterior
segment of the eye, this achievement appears essential to understanding the
mechanisms by which current accommodative IOLs operate and advancing towards
new developments. The method was tested on an in vitro artificial eye with known
surface geometries at different orientations and demonstrated on an aging cataract
patient in vivo.
2. Quantitative OCT with dedicated image processing algorithms allows
quantification of the shape and topography of human lenses to study their optical
properties and changes with age, and estimation of human crystalline lens volume,
diameter and equatorial lens position, as validated from ex-vivo measurements.
Quantitative OCT allows investigation of the geometrical changes of the crystalline
lens with aging, contributing to the understanding of the optics and function of the
lens in the eye. This quantitative information is key, among other things, to
investigating the role of changes in the crystalline lens in presbyopia, and as
inspiration for accommodating intraocular lenses aiming at the restoration of
accommodation capacity. OCT lens imaging will increase accuracy in IOL power
selection and be key in implantation of emerging accommodating IOLs.
3. Full 3D OCT based pseudophakic custom computer eye models (with individual
data of corneal topography, IOL geometry, IOL tilt and decentration and eye
rotation) have been developed and validations with experimental ocular aberrations
from LRT have been achieved. The procedure includes the description of the surface
shape with Zernike coefficients and wavefront analysis. The high similarity
between optical and geometry-based predictions of high order aberrations in
pseudophakic patients indicated that fully OCT-based ray tracing models are
excellent platforms for optimizing IOL selection, and allow the understanding of
the relative contribution of optical geometrical and surgically-related factors to
image quality.
4. Full 3D OCT based pseudophakic custom computer eye models have been used to
understand the relative contributions of eye rotation, IOL tilt, corneal geometry and
IOL decentration on optical quality in pseudophakic eyes. We have demonstrated in
three real eyes the possibility for improving optical performance by optimization of
the IOL centration. We found that the IOL lateral shifts and the potential
improvements in optical quality are highly subject dependent. The use of patient
specific eye models allowing virtual ray tracing and evaluation of optical quality
prior to IOL implantation will be key in selection of IOL that optimizes retinal
image quality, including optimal IOL centration, and select the patient who will
benefit from the improvements.

Biometric measurements in the crystalline lens: Applications in cataract surgery
180
7.2 Conclusions
This thesis presents a method to estimate tilt and decentration of IOLs based on optical
coherence tomography (OCT) images. En-face OCT images show Purkinje-like images that
correspond to the specular reflections from the corneal and IOL surfaces. Measurements of
tilt and decentration of IOLs, along with the biometrical and anatomical parameters are of
great value to evaluate optical quality in patients after cataract surgery, and to provide
understanding of their relative role in optical degradation. The Purkinje-like method allows
characterization of eye rotation, lens tilt and decentration, giving insights on the
performance of implanted accommodative IOLs. The average amounts of tilt and
decentration found in this study are 3.30± 4.68 deg and 0.16±0.16 mm, respectively in eyes
implanted with standard monofocal IOLs. These data, along with the biometrical data
obtained from OCT, can be easily transferred into computer eye models for the evaluation
of the contributing factors to optical degradation in eyes implanted with IOLs and the
impact of IOL misalignment in particular.
Quantitative 3D OCT was used to measure surface topography of 36 isolated human lenses,
and to evaluate the relationship between anterior and posterior lens surface shape and their
changes with age. To our knowledge, this is the first comprehensive topographic study of
the human lens with aging. All lens surfaces were fitted to 6th order Zernike polynomials.
Astigmatism was the predominant surface aberration in anterior and posterior lens surfaces
(accounting for ~55% and ~63% of the variance respectively), followed by spherical terms,
coma, trefoil and tetrafoil. The amount of anterior and posterior surface astigmatism did
not vary significantly with age. In 13 of the 36 lenses the relative angle was >45 deg, and
6 lenses had a relative angle >70 deg. The average relative angle was larger for younger
lenses (41.74 deg for lenses <50 years) than for older lenses (28.1 deg for lenses ≥50 years),
indicating a higher compensation of astigmatism between the lens surfaces at a younger
age. The relative angle between anterior and posterior surface astigmatism axes was on
average 36.5 deg, tended to decrease with age, and was >45 deg in 36.1% lenses. The
anterior surface RMS spherical term, RMS coma and 3rd order RMS decreased significantly
with age. In general, there was a statistically significant correlation between the 3rd and 4th
order terms of the anterior and posterior surfaces. This study was helpful for understanding
the coordination of anterior and posterior lens surface geometries and their topographical
changes with age and sheds light into the role of the lens in the optical properties of the eye
and the lens aging mechanism.
Modeling the optics of an individual patient´s eye and predicting the resulting optical
performance addresses a current unmet need in visual optics. This thesis presents that full
OCT-based pseudophakic custom computer eye models allow understanding of the relative
contribution of optical geometrical and surgically-related factors to image quality, and are
an excellent tool for characterizing and improving cataract surgery. We compared measured
wave aberrations in pseudophakic eyes implanted with aspheric intraocular lenses (IOLs)
with simulated aberrations from numerical ray tracing on customized computer eye models,
built using quantitative 3D OCT-based patient-specific ocular geometry. Experimental and
simulated aberrations show high correlation (R=0.93; p<0.0001) and similarity (RMS for
high order aberrations discrepancies within 23.58%). These individual models have
allowed evaluation of the effect of corneal aberrations, lens geometry, lens misalignment
Chapter 7
Conclusions
181
and angle lambda on the optical quality of eyes with implanted aspheric IOLs. Aspheric
IOLs are able to correct the spherical aberration on average (although the exact amount of
correction depends on the amount of corneal spherical aberration and several other
biometric factors). Corneal aberrations play a major role in optical degradation in
pseudophakic patients. The capability of OCT-based computer eye customized models to
predict the measured aberrations post-operatively with a given implanted IOL opens the
possibility to use those models as platforms to evaluate pre-operatively potential results
with other IOLs, to optimize the selection of the IOL and improve optical outcomes.
OCT-based customized eye models which incorporate patient-specific information have
been shown to accurately predict optical aberrations/optical performance in pseudophakic
eyes. In this thesis, we have used such models to understand the relative contributions of
eye rotation, IOL tilt, corneal geometry and IOL decentration on optical quality in
pseudophakic eyes. More specifically, the three real eyes have been demonstrated the
possibility for improving optical performance by optimization of the IOL centration. As
expected from the non-centered nature of the ocular components this optimal lateral
position is not collinear with the pupil center, and in general, is not coincident with the
actual IOL position. In some cases, we found the optimal IOL position of max VS including
astigmatism and high order aberrations is in fact rather decentered 0.8 mm. The optimizing
IOL decentration improved optical quality in real eyes by up to 9.83% (0.08) compared to
the real IOL position (in E#3OS) and was better by 15.01% (0.12) than if the IOL was
centered at the pupil. Whether the relatively minor reported improvements potentially
achieved by precise positioning of the IOL are worth the required haptic design and surgical
sophistication remains to be seem. We found that the IOL lateral shifts and the potential
improvements in optical quality are highly subject dependent (ranging from 0.21 to 0.85
mm and 1.05% (0.01) to 9.83% (0.08) VS, respectively in our sample). Undoubtedly, the
use of patient specific eye models allowing virtual ray tracing and evaluation of optical
quality prior to IOL implantation will be key in selection of IOL that optimizes retinal
image quality, including optimal IOL centration, and select the patient who will benefit
from the improvements.
In summary, this thesis developed a Purkinje-like methodology to measure IOL tilt and
decentration in patients to help optimize IOL and haptic design. Quantifying the accurate
biometry from sOCT measured data was our first task during the whole PhD research.
Meanwhile, we built an aberration analysis model in Zemax to figure out the relationship
between the geometry changes and optical aberration changes by using around 20 patients
in our lab. Comparison between Profilometer and sOCT measurements in vitro should be
helpful to increase the accuracy of IOL surface geometry. Corneal aberrations tend to
increase after surgery, likely due to the incision effect. Total aberrations also increased by
a lack of balance of the spherical aberration of the corneal by the spherical aberration of
the intraocular lens. From clinic feedback, some factors (e.g. incongruence between bag
diameter and overall IOL diameter, a large capsulorhexis, asymmetrical capsule coverage,
IOL placement in sulcus, and so on) may lead to large decentrations of high clinical
relevance, malposition of an IOL is one of the reported leading causes for removal,
exchange or repositioning of a posterior chamber IOL. In order to identify optimal IOL
centration, OCT-based ray tracing on a pseudophakic eye model was performed with all
anatomical input data from the patient (anterior and posterior corneal elevation maps, IOL

Biometric measurements in the crystalline lens: Applications in cataract surgery
182
geometry, off-axis foveal angle, and IOL tilt), while decentration was changed from -1 to
+1 mm (in 0.2 mm steps) in a horizontal/vertical grid. Custom dynamic aberrometry in
combination with sOCT technologies will be used to link structure and function in
accommodation, both in young eyes and patients implanted with IOLs.

Chapter 7
Conclusions
183
7.3 Summary
In this thesis, we built new methodology to measure implanted IOL alignment in cataract
surgery patients. We also quantified the shape and 3D topography of human lenses, their
optical properties, and their changes with age and quantitative measurements of the
crystalline lens based from Optical Coherence Tomography allow understanding the
sources of ocular aberrations, predictions of the optical quality of the eye and improvement
of cataract surgery. We also performed a series of measurements of cataract surgery patients
and clinically viable measurements towards building full 3D OCT based pseudophakic
custom computer eye models and validations with experimental ocular aberrations from
LRT. Our researches help in understanding of the relative contribution of optical
geometrical and surgically-related factors to image quality, such as identification optimal
IOL centration using OCT-base ray tracing on pseudophakic eyes using analysis the optical
quality effect with IOL decentration. These are key in advanced IOL power calculations
and best individual IOL selection or customized IOL design based on the full-OCT based
computer eye model for presbyopia correction that can provide an optimal visual solution.

Biometric measurements in the crystalline lens: Applications in cataract surgery
184
7.4 Future work
The implications and possible future directions of the work presented in this thesis include:
We have presented a comprehensive topographic study of the ex-vivo human lens with
aging, which could be used in a ray tracing analysis for lens GRIN distribution. Further
studies on a larger population of different ages and/or refractive profiles of in-vivo
crystalline lens topography will allow insights on the role of the crystalline lens on the age-
dependent changes of the eye´s optics, myopia development, ocular astigmatism and
accommodation. This thesis presents that astigmatism and high order terms may be
considered when trying to predict optical quality of a phakic eye at an individual level,
based on anatomical information.
Combined measurements of wavefront aberrations and 3D corneal and crystalline lens
surface shape in vivo provided a deeper understanding of the relative contributions of
corneal and lens surfaces themselves to the aberrations and allowed realistic individual
simulations of ocular properties, such as ocular aberrations, by incorporating a patient´s
based eye biometry. This future work will allow evaluation of the contribution of individual
optical components (such as, corneal and crystalline lens surfaces, GRIN) and their
alignment to optical degradation. Furthermore, more realistic and advanced customized
computer eye models will potentially provide additional information including residual
postoperative refractive error, chromatic aberration, IOL manufacturing imperfections,
ocular pathology, and scatter of optical media.
The results of monitoring IOL misalignment can establish the basis for future research line
directions of dynamic changes of lens geometry and misalignment with accommodation,
in relationship with the dynamic changes of ocular aberrations, which would shed light
onto the mechanism of lenticular accommodation and presbyopia. Application of OCT
(direct visualization) and LRT aberrometry (objective accommodative response) in the
study of patients implanted with accommodative IOLs (A-IOL) will be essential to evaluate
the mechanism of action of the A-IOL and its final positioning in different accommodative
demands. The future application of this technique in the measurement of real crystalline
lens GRIN presents important implications in the study of the mechanisms of
accommodation and presbyopia.
OCT-based custom computer eye models will also be applicable to the optimization of the
IOL power calculation, using virtual ray tracing on these eyes. Ray tracing IOL power
calculation will overcome many limitations of current IOL power selection techniques.
These are typically based on regression models obtained for a large patient population, as
opposed to the individualized approach based on customized eye models. Pre-operative
measurements of anterior and posterior corneal surfaces will overcome the limitations of
the standard IOL power calculations which only make use of anterior corneal keratometry
and the so-called keratometric index. Clinical evaluation of the advanced IOL design is
required to verify accurate predictions of improved quality of vision and fewer
complications after cataract surgery. OCT-based customized computer eye models will be
excellent predictive tools of the optical quality in pseudophakic eyes, allow understanding
of the factors that contribute to optical degradation and hold promise to become a primary
Chapter 7
Conclusions
185
tool to optimize the selection of the IOL to be implanted in a cataract procedure. Similar to
the comparisons between the measured and simulated high order aberrations addressed in
the current study, validations of the IOL power selections will involve comparisons of
measured and predicted aberrometric defocus and/or refraction.
The future studies will allow improved understanding of the accommodation mechanism
by relating morphological changes in the crystalline lens with changes in the ocular
aberrations and accommodative response, addressing the basis for the fluctuations of
accommodation, and unraveling the influence of aberrations on the accommodation
dynamics. The conclusions will have impact on the mechanism of action and limitations of
current accommodative IOL designs, and optical and structural properties of eyes implanted
with A-IOLs as a function of accommodative demand from OCT and aberrometric
measurements by the future study of optical simulations of performance of A-IOLs from
customize eye modeling and mechanical and optical testing of new A-IOL prototypes.

Biometric measurements in the crystalline lens: Applications in cataract surgery
186

Chapter 8
Publications and activities during the PhD period
187
CHAPTER 8
PUBLICATIONS AND
ACTIVITIES DURING THE
PHD PERIOD

Biometric measurements in the crystalline lens: Applications in cataract surgery
188

Chapter 8
Publications and activities during the PhD period
189
8.1 Publications
1. M. Sun, P. Pérez-Merino, E. Martinez-Enriquez, M. Velasco-Ocana and S.
Marcos. "Full 3D OCT-based pseudophakic custom computer eye model."
Biomedical Optics Express 7(3): 1074-1088. (2016).
2. E. Martinez-Enriquez, P. Pérez-Merino, M. Sun, S. Durán-Poveda, I. Jiménez-
Alfaro, S. Marcos. "Full shape crystalline lens quantification from 3-D OCT
images and its application to predict the post-operative IOL position." ARVO
E-abstract 2686338 (2016).
3. S. Marcos, E. Martinez-Enriquez, M. Sun, P. Pérez-Merino, Velasco-Ocana M.,
"3D OCT ocular biometry." XXII Biennial Meeting of the International Society
for Eye Research ISER • Abstract: A-817-0005-00262. (2016)
4. E. Martinez-Enriquez, M. Sun, M. Velasco-Ocana, J. Birkenfeld, P. Pérez-
Merino, and S. Marcos. "Optical Coherence Tomography Based Estimates of
Crystalline Lens Volume, Equatorial Diameter, and Plane Position." Invest
Ophthalmol Vis Sci 57(9): OCT600-610 (2016).
5. S. Marcos, E. Martinez-Enriquez, P. Pérez-Merino, M. Velasco-Ocana, and
M. Sun, "Unraveling eye crystalline lens optics, structure and function," in
Latin America Optics and Photonics Conference, (Optical Society of America),
paper LTh2C.1. (2016)
6. S. Marcos, P. Pérez-Merino, E. Martinez-Enriquez, M. Sun, and M. Velasco,
"Advances in Anterior Segment OCT: Crystalline and Intraocular Lens
Applications," in Frontiers in Optics 2015, OSA Technical Digest (online)
(Optical Society of America), paper FM2F.1. (2015)
7. M. Sun, P. Pérez-Merino, S. Durán-Poveda, Ignacio Jiménez-Alfaro, S.
Marcos. "OCT-based ray tracing on pseudophakic eyes to identify optimal
IOL centration. " Invest. Ophthalmol. Vis. Sci.;56(7):2972. (2015)
8. M. Sun, J. Birkenfeld, A. de Castro, S. Ortiz and S. Marcos. "OCT 3D surface
topography of isolated human crystalline lenses." Biomed Opt Express 5(10):
3547-3561. (2014).
9. M. Sun, A. de Castro, S. Ortiz, P. Pérez-Merino, J. Birkenfeld and S. Marcos.
"Intraocular lens alignment from an en-face optical coherence tomography
image Purkinje-like method." Optical Engineering 53(6): 061704-061704.
(2014).
10. S. Marcos, S. Ortiz, P. Pérez-Merino, M. Velasco, M. Sun, J.Birkenfeld, S.
Durán-Poveda, I. Jimenez-Alfaro. "Three-dimensional biometry and alignment
in eyes implanted with Accommodative IOLs as a function of accommodative
demand. " Invest. Ophthalmol. Vis. Sci. ;54(15):382 (2013).

Biometric measurements in the crystalline lens: Applications in cataract surgery
190

Chapter 8
Publications and activities during the PhD period
191
8.2 Talks and posters presented in the conferences
1. “OCT-based ray tracing on pseudophakic eyes to identify optimal IOL
centration”, poster presentation, International OSA Network of Students
Conference, Valencia, Spain, September, 2015.
2. “OCT-based ray tracing to identify optimal IOL centration”, oral
presentation, 2nd IOSA Scientific Seminar series, Madrid, Spain, June,
2015.
3. "OCT-based ray tracing on pseudophakic eyes to identify optimal IOL
centration", poster presentation, The Association for Reasearch in Vision
and Ophthalmology, Denver, United States of America, May, 2015.
4. “Monitoring lens accommodations with imaging techniques”, oral and
poster presentations, 4th Optical and Adaptational Limits of Vision Annual
meeting, Murcia, Spain, January, 2015.
5. “Full OCT-based pseudophakic custom computer eye model”, oral
presentation, Visual and Physiological Optics conference, Wroclaw, Poland,
August, 2014.
6. "Monitoring lens accommodations with imaging technique", oral and poster
presentations, 3rd Optical and Adaptational Limits of Vision Annual
meeting, Stockholm, Sweden, May, 2014,
7. " OCT 3D surface topography of isolated human crystalline lenses", poster
presentation, The Association for Research in Vision and Ophthalmology,
Orlando, United States of America, May, 2014.
8. "Monitoring lens accommodations with imaging technique", oral
presentation, 2nd Optical and Adaptational Limits of Vision Annual
meeting, Santorini, Greece, July, 2013.
9. "Role of Ocular Aberrations on Accommodation Dynamics", oral
presentation, Mid-term review meeting, March, Brussels, Belgium, March,
2013.
10. "Monitoring lens accommodations with imaging technique", oral and poster
presentations, 1st Optical and Adaptational Limits of Vision Annual
meeting, Madrid, Spain, September, 2012.
11. "Monitoring lens accommodations with imaging technique", oral
presentation, Optical and Adaptational Limits of Vision, Tübingen,
Germany, March, 2012.

Biometric measurements in the crystalline lens: Applications in cataract surgery
192
8.3 Visits and Stays in Research Institutions, Hospital and
Companies
March 5th to 9th, 2012, at Institute for Ophthalmic Research, in Tübingen, Germany
1. Participating the training courses (Essentials of Project Management I+II,
Ethics in Reasearch, and the Craft of Scientific Presentations I+II)
2. Visiting Prof. Frank Schaeffel ’s Laboratory of University Hospital Tuebingen
in section of Neurobiology of the Eye Centre for Ophthalmology
May 29th to 30th, 2012, at Rodenstock GmbH in Munich, Germany
3. Getting insight into industrial research and development from basics to product
development of individual progressive addition lenses.
August 20th to 22th, 2012, at University College Dublin (UCD), Dublin, Ireland
4. Visiting Prof. Brain Vohnsen’s Laboratory of the Advanced Optical Imaging
group in School of Physics, Belfield Campus
July 7th to 17th, 2013, at University of Crete faculty of medicine in Heraklion, Crete,
Greece
5. Participating in preoperative examination of partients scheduled for cataract
extraction in the premises of University Hosptal of Heraklion
6. Visiting Prof. Ioannis Pallikaris and Prof. Harilaos Ginis’s Laboratory of
Optics and Imaging in the premises of Departement of Medicine
7. Visiting the Operating Room of the University hospital, observing operations
for cataract extraction with phacoemulsification and presbyopia correction.
May 19th to 21st and 26th to 27th, 2014, at KTH Royal Institute of Technology, in
Stockholm, Sweden
8. Participating the training courses (Statistic Course I+II, Intellectual Property
Rights, Personal Leadership, Managing Stress, Introduction into peer review
and Psychophysics)
9. Visiting Prof. Linda Lundstrom and Prof. Peter Unsbo’s Laboratory of
Applied Physics/ Biomedical and X-Ray Physics in AlboNova University
center
January 21st to 23th, 2015, at Universidad de Murcia, in Murcia, Spain
10. Visiting Prof. Pablo Artal’s Optics Laboratory at the University of Murcia in
the Research Center for Optics and Nanophysics

Figure and Table List
193
FIGURE LIST
Chapter 1
Figure 1.1 (a) The general layout of a normal young eye: cornea, iris, pupil, crystalline lens,
retina, macula, fovea and blood vessels; (b) The limitation of temporal and nasal field of
vision (source: Book: Optics of the Human eye). ................................................................ 23
Figure 1.2 Histological section of a human cornea (source: www. missionforvisionusa. org).
.............................................................................................................................................. 24
Figure 1.3 Types of astigmatism as determined by the orientation of the principal meridians
and the orientation of the correcting cylinder axis.[Paul Riordan-Eva et al., 2003,
source:http://www.oculist.net/others/ebook/generalophthal/server-java/arknoid/amed/
vaughan/ co_chapters/ ch020/ch020_print_01.html] ........................................................... 26
Figure 1.4 The structure of the Human Lens. Suture and Equator are anatomical terms in
ophthalmology. Suture means the seams of the lens. The suture patterns become more
complex as more layers of lens fibers are added to the outer portion of the lens. Equator
means the edge of the largest portion of the lens (similar to the equator on a globe) (source:
http://photobiology.info/Roberts.html) ................................................................................ 27
Figure 1.5 Quantitative elevation maps of the posterior lens surface for an in vitro 65-year
donor lens. Left panel: Measurements with the posterior surface of the lens facing the OCT
beam (“posterior up”); Middle panel: Measurement of the posterior surface of the lens viewed
through the anterior surface of the lens, and no optical distortion correction (simple division
by the index of refraction); Right panel: Measurement of the posterior surface of the lens
viewed through the anterior surface of the lens, after application of optical distortion
correction. Maps are fit relative to the best fitting sphere with Zernike polynomials. R is the
radius of curvature of the best fitting (Ortiz, Perez-Merino et al. 2012). ............................. 29
Figure 1.6 Lens model and definition of some parameters of interest. DIA: Diameter; PS:
Pupil size; ID: Diameter in the intersection; AL: Anterior lens; PL: Posterior lens; EPP:
Equatorial plane position; α: Diameter that defines the central portion of the lens; PROP:
Proportion of the diameter in the intersection. ρ: Part of the central portion taken to fit every
lens side. (E. Martínez-Enriquez 2016) ................................................................................ 30
Figure 1.7 Drawn definitions of optical axis, pupillary axis, line of sight, visual axis
(Arbelaez, Vidal et al. 2008) ................................................................................................ 32
Figure 1.8 Diagrams of refractive error (Normal Eye, Myopia, Hyperopia, and Astigmatism)
.............................................................................................................................................. 34
Figure 1.9 Perceived image with defocus, astigmatism, and high order aberration such as
spherical aberration, coma, trefoil and random aberration vs. light field display (source:
http://www.zdnet.com/article/researchers-eye-vision-correcting-displays-for-devices/)..... 35
Figure 1.10 A quarter section through the anterior segment ............................................... 37

Biometric measurements in the crystalline lens: Applications in cataract surgery
194
Figure 1.11 The modern technique of Phacoemulsification which consists in the
emulsification (dissolve and aspire) of the crystalline lens inside the eye and the introduction
of a foldable lens through an average 2-mm incision. ......................................................... 39
Figure 1.12 Schematic representations of (a) TD-OCT and (b) FD-OCT. (Bezerra, Costa et
al. 2009) ............................................................................................................................... 44
Figure 1.13 Block diagrams of the OCT methods with the use of Fourier-domain detection:
(a) SD-OCT, (b) SS-OCT. (Wojtkowski 2010) ................................................................... 46
Figure 1.14 Hartmann–Shack system in optometry: a laser creates a virtual light source in
the retina. The lenslet array creates spots in the sensor according to the wavefront coming
out of the eye. The local tilt of the wavefront across each lens can be calculated from the
position of the focal spot on the sensor. (Source:
https://en.wikipedia.org/wiki/Shack%E2%80%93Hartmann_wavefront_sensor) .............. 47
Figure 1.15 (a) Scheme of H-S. (b) Scheme of LRT (Navarro and Moreno-Barriuso 1999)
............................................................................................................................................. 48
Figure 1.16 Schematic of Gullstrand-Emsley eye model (cardinal points at reasonable
location; 10.9 D accommodated forms; anterior lens surface moved 0.4mm with more curved
anterior lens surface). ........................................................................................................... 49
Figure 1.17 Models of gradient index with internal optical structure (a) Gullstrand 1909 (b)
Liou & Brennan 1997 (c) Navarro et al. 2007 (d) Alberto et al. 2010 (Crystalline lens GRIN
with age function) ................................................................................................................ 50
Chapter 2
Figure 2.1 Photograph of the actual custom Spectral-Domain Optical Coherence
Tomography device at the VioBio lab (Instituto de Óptica, “Daza de Valdés”) ................. 61
Figure 2.2 The schematic diagram of the custom SD-OCT set-up, components: Low
coherence broad band spectrum source ; Collimating lens; Beam Splitter 1; Reference mirror;
Beam splitter 2; Badal system; Picoprojector and external screen; Scanning galvanic mirror;
Objective lens; Condensing lens; Grating; Line-scan CMOS camera ................................. 63
Figure 2.3 Map of residual fan distortion before (a) and after (b) correction, obtained from a
flat optical surface with the OCT system of the study. Reproduced from (Ortiz, Siedlecki et
al. 2010, Ortiz, Siedlecki et al. 2011) (c) Illustration of the effect of the 3D distortion
correction on the anterior segment surfaces (all surfaces are corrected axially from refractive
index. Green: corrected volumes; red: uncorrected volumes). Reproduced from (Ortiz,
Siedlecki et al. 2009, Perez-Merino, Velasco-Ocana et al. 2015). ...................................... 64
Figure 2.4 Illustration of pupil centration as reference across: A: anterior and posterior
cornea, iris; B: iris and anterior lens; C: pupil, anterior lens and posterior lens in effective
area within the pupil; D: merged volumes of anterior segments. Blue and red points present
anterior and posterior cornea surfaces respectively; Light blue and black points present
anterior and posterior lens surfaces respectively; Yellow, green and pink points present iris.
............................................................................................................................................. 66
Figure 2.5 Coefficients of the Zernike polynomials up to the 6th radial order with 28 terms
using the Optical Society of America (OSA) standard (Thibos, Applegate et al. 2002) ..... 68

Figure and Table List
195
Figure 2.6 Quantitative anterior and posterior cornea and crystalline lens topography, after
full distortion correction. Maps are Zernike fits to the elevation maps, relative to the best
fitting sphere. (Ortiz, Perez-Merino et al. 2012) .................................................................. 68
Figure 2.7 (a) Three-dimensional (3D) optical coherence tomography (OCT) image; (b) en-
face OCT image showing the pupil merging, the locations of PI, PIII, and PIV in red and
pupil center in yellow; (c) PI (left), PIII (center), and PIV (right) in OCT B-Scan images. 70
Figure 2.8 (a) USAF 1951; (b) OCT fundus image in SOCT data process program ; (c) OCT
fundus image rotated 90 deg counterclockwise saved as JPG image; (d) Rescaling the height
and width of JPG from 300 A-scans and 50 B-scans OCT image as taken during OCT
measuremnts15x7 mm measurement setting; (e) Image fundus rotation 90 degree clockwise
and flipping around horizontal axis to have real en-face OCT image;(f) The definition of
global coordinates of eye rotation, IOL tilt and decentration based on en-face OCT image;
(g) Nomenclature and sign conventions for eye rotation, IOL tilt and decentration looking
into the human eyes, as seen by the observer. The coordinate is the same as (Rosales and
Marcos 2006). ...................................................................................................................... 71
Figure 2.9 (a) Custom Laser Ray Tracing setup at the VioBio lab (Instituto de Óptica, “Daza
de Valdés”). Retinal camera captured the light reflected back from the retina. Pupil camera
captured the corresponding image of the eye´s pupil simultaneously with the retinal spots on
the retinal CCD. (b) Scheme of the custom-LRT modified from (Perez-Merino, Birkenfeld
et al. 2014) (red solid line: illumination channel; dark blue dash line: Pupil and retinal
channel.) ............................................................................................................................... 74
Figure 2.10 (a) Snapshot of the control program developed by Carlos Dorronsoro (Top right
and bottom left are the pupil and retinal images, respectively); (b) Example of aerial images
obtained from LRT using green and IR light in Panels A and B. Panel C shows the
corresponding spot diagram. Crosses and circles represent green and IR illumination
respectively. (Llorente, Diaz-Santana et al. 2003) ............................................................... 75
Figure 2.11 (a) commercial Pentacam Scheimpflug topographer (Oculus Optikgeräte GmbH,
Wetzlar, Germany) at the VioBio lab (Instituto de Óptica, “Daza de Valdés”) (b) interface of
commercial Pentacam Scheimplug topographer .................................................................. 76
Figure 2.12 Corneal elevation maps obtained in 4 eyes obtained from different instruments
(relative to the best fitting sphere). R = radii of curvature of the best fitting sphere (from fits
to sphere quadrics), modified from (Ortiz, Siedlecki et al. 2011). ....................................... 77
Figure 2.13 (a) Commercial non-contact profilometry (Sensofar, PLu2300,Barcelona, Spain)
(b) profilometry raw data with tilt and noise (c) quantified anterior and posterior surfaces of
intraocular lens with customized algorithm ......................................................................... 78
Figure 2.14 (a) Photograph and (b) schematic diagram of the physical model eye developed
for this study. A PMMA contact lens simulates the cornea. The IOLs are positioned with an
XYZ micrometer stage and rotational stage (de Castro, Rosales et al. 2007). ..................... 79
Figure 2.15 Illustration of the computation of aberrations using quantitative OCT
geometrical data in a customized computer pseudophakic eye model ................................. 81
Figure 2.16 (a) Example of RMS radius and max GEO radius report of spot diagram from
14 to -14 degree field angle around horizontal axis with three wavelengths (Blue, green and
red present the wavelengths of 486.1 nm, 587.6 nm and 656.3 nm, respectively) in Zemax;
Circle in white is Airy Disk; (b) Example of spots diagram images obtained from LRT at 543
nm wavelength ..................................................................... Error! Bookmark not defined.
Figure 2.17 (a) Optical Distance Errors; (b) Wavefront Error; (c) Ray Errors ................... 83

Biometric measurements in the crystalline lens: Applications in cataract surgery
196
Figure 2.18 Wavefront aberration: 1st order aberrations: (a) Vertical Tilt (b) Horizontal Tilt;
2nd order aberrations: (c) Oblique Astigmatism (d) Vertical Astigmatism (e) Defocus; 3rd
order aberrations: (f) Vertical Coma (g) Horizontal Coma; 4th order aberration: (h) Spherical
Aberration ............................................................................................................................ 84
Figure 2.19 Process steps of patients’ measurement: Aberrometry, Pentacam, IOLmaster and
Optical Coherence Tomography .......................................................................................... 87
Figure 2.20 Solid Model 3/4 draw section of full-OCT based customized eye model. Corneal
Surfaces: OCT-based 6th order Zernike Surface Sag on best fitting sphere; IOL Surfaces:
OCT-based geometry (aspheric surfaces); Biometry: OCT-based corneal thickness and ACD;
axial length from IOLMaster; Alignment: IOL tilt & decentration from Purkinje-like OCT;
Angle lambda from eye rotation. ......................................................................................... 88
Figure 2.21 3D layouts of simulations in ZEMAX (a) PI (b) PIII (c) PIV ......................... 89
Figure 2.22 (a) Real IOL decentration in patient’s eye after cataract surgery (b) solid model
¾ draw sections of customized eye model with simulated decentrations ranging is from -1–
1mm in 0.1 mm steps for 5 mm pupil diameter along horizontal and vertical meridians, with
reference to the pupil center................................................................................................. 90
Figure 2.23 Illustration of OCT automatic image processing (Ortiz, Siedlecki et al. 2010, E.
Martínez-Enriquez 2016) ..................................................................................................... 91
Figure 2.24 Illustrated algorithm of OCT 3D surface topography of isolated human
crystalline lenses .................................................................................................................. 93
Chapter 3
Figure 3.1 Experimental data vs. nominal data in the artificial eye model (a) IOL tilt (in air);
(b) IOL tilt (in water); (c) IOL decentration (in air); (d) IOL decentration (in water) ...... 106
Figure 3.2 (a) IOL tilt and (b) IOL decentration in the 5 eyes studied. Solid symbols represent
data obtained using the Purkinje–like OCT-based method and open symbols represent data
obtained directly from distortion-corrected 3D OCT images (Ortiz, Perez-Merino et al.
2013). Square, rhombus and round represent right eyes (OD) while triangle and rectangle
represent left eyes (OS). Each color (color online only) represents a different eye. Error bars
stand for standard deviations of repeated measurements. .................................................. 106
Figure 3.3 Correlation between data obtained from Purkinje-like and OCT methods for IOL
tilt (a, b) and decentration (c, d) in all 5 eyes of the study. ................................................ 108
Figure 3.4 Bland-Altman plot-differences between Purkinje-like and OCT estimates of tilt
(a) and decentration (b). Horizontal lines represent the mean difference (-0.17 deg and -0.09
mm, respectively) and 95% limits of agreement. .............................................................. 109
Figure 3.5 Experimental en-face OCT image (a) and simulated (b) PI, PIII and PIV, for S#
8 OS ................................................................................................................................... 109

Figure and Table List
197
Chapter 4
Figure 4.1 Upper panels: OCT images corresponding to the anterior-up position of one of
the crystalline lenses imaged, with (a) OCT focused on the anterior surface and (b) OCT
focused on the posterior surface and the image of the cuvette. The detected surfaces are
marked in blue (anterior surface), red (posterior surface) and green (cuvette). Lower panels:
3D OCT data from images of the crystalline lens with (c) the anterior surface up and (d) the
posterior surface up. The blue and red points correspond to the segmented anterior and
posterior surfaces of the lens, respectively. The green points and the black points correspond
to the cuvette imaged through the lens, therefore distorted by the lens, and the cuvette without
distortion respectively. ....................................................................................................... 121
Figure 4.2 Lens surface elevation maps for all lenses, ordered by age. By convention, the
maps are aligned so that the steepest meridian of the anterior lens surface lies on the vertical
axis. Anterior and posterior images are shown as mirrored on the vertical axis. Asterisks
indicate pairs of lenses from the same donor. .................................................................... 122
Figure 4.3 (a) Radii of curvature of anterior and posterior lens surfaces at their corresponding
steepest meridian as a function of age (b) Radii of curvature of anterior and posterior lens
surfaces at their corresponding flattest meridian as a function of age. Data was obtained from
fits to biconic surfaces. Open circles represent data of the anterior lens surface and solid
circles represent data of the posterior lens surface. ............................................................ 123
Figure 4.4 (a) Conic constants of anterior and posterior lens surfaces at their corresponding
steepest meridian as a function of age. (b) Conic constants of the posterior lens surfaces at
their corresponding flattest meridian as a function of age. Data was obtained from fits to
biconic surfaces. Open triangles represent data from the anterior lens surface and solid
triangles represent data from the posterior lens surface. .................................................... 124
Figure 4.5 (a) Magnitude of lens surface astigmatism of the anterior and posterior lens
surfaces as a function of age. (b) Correlation of the magnitude of astigmatism between
anterior and posterior surfaces ........................................................................................... 125
Figure 4.6 (a) Anterior astigmatism power vector polar plot with the steepest meridian
aligned at 90 deg, by convention; (b) Posterior astigmatism power vector polar plot. The
angle (from the vertical axis) represents the relative angle between the anterior and posterior
astigmatic axis. Each arrow represents one lens, the length of the vectors represent the
magnitude of the corresponding astigmatism in diopters. .... Error! Bookmark not defined.
Figure 4.7 Relative angle between anterior and posterior lens surface astigmatic axis as a
function of age (Slope: −0.53 deg/year; r = 0.305; p = 0.071); .......................................... 126
Figure 4.8 (a) Trefoil-v3
3Z
: Anterior vs. Posterior (Slope = 0.387, r = 0.467, p = 0.004) (b)
RMS 3rd order terms: Anterior vs. Posterior (Slope = 0.019; r = 0.477, p = 0.003; (c) RMS
Coma: Anterior vs. Posterior (Slope = 0.387; r = 0.617, p = 0.0001) (d) 4th order RMS:
Anterior vs. Posterior (Slope = 0.387; r = 0.423, p = 0.010.) ............................................. 127
Figure 4.9 (a) Lens elevation high order RMS terms; RMS coma: slope = −0.087μm/year, r
= 0.582 and p = 0.0001for anterior surface, slope = −0.123μm/year, r = 0.515 and p = 0.001
for posterior surface; (b) RMS spherical: slope = −0.175 μm /year, r = 0.439, p = 0.007 for
anterior surface only (c) 3rd order RMS: slope = −0.083μm/year, r = 0.564 and p = 0.0001
for anterior surface only ..................................................................................................... 130

Biometric measurements in the crystalline lens: Applications in cataract surgery
198
Figure 4.10 Relative contributions of different Zernike terms to the overall surface elevation
maps (in terms of RMS2) with an asterisk the terms that change statistically significantly with
age. ..................................................................................................................................... 130
Chapter 5
Figure 5.1 (a) Example movement of 20/20 Snellen E-letter across the display to change the
eye’s fixation angle stimulus; Acquisition at two different foci (cornea and lens) (b) Vertical
cross-sectional scans of a patient’s cornea while fixating foveally, i.e. along the line of sight;
(c) Vertical cross-sectional scans of a patient’s cornea, while fixating eccentrically, i.e.
pupilary axis aligned with the OCT optical axis; (d) Vertical cross-sectional scans of the IOL
implanted in the patient. Typical image acquisitions are obtained with the alignment as in (c)
and (d). The yellow line indicates the iris plane, used for merging. .................................. 140
Figure 5.2 Anterior and posterior corneal topographic maps from Pentacam (upper panel)
and OCT (lower panel). OCT-based maps were used in the computer eye models. Data are
for 6-mm pupil. .................................................................................................................. 144
Figure 5.3 Measured (LRT, 1st column) and Simulated (from OCT-based
geometry/biometry, 2nd −5th columns) wave aberration maps in three pseudophakic eyes.
Simulated aberrations include wave aberration maps for the anterior cornea alone (2nd
column); anterior and posterior cornea (3rd column); eye wave aberration with IOL assuming
no tilt and decentration (4th column); eye wave aberration with IOL with no tilt/decentration
(5th column). (a) Wave aberration maps including astigmatism (no tilt or defocus); (b) Wave
aberrations for 3rd and higher order; Data are for 5-mm pupil, and for foveal fixation,
i.e.including eye rotation. .................................................................................................. 146
Figure 5.4 (a) RMS Astigmatism; (b) RMS Spherical Aberration; (c) RMS Trefoil; (d) RMS
Coma; (e) RMS Tetrafoil, for anterior corneal RMS (blue bars), total corneal RMS (red bars),
simulated total eye RMS assuming centered IOL (green bars), simulated total eye RMS
assuming real IOL tilt/decentration (purple bars); and experimental (LRT) total eye
aberration (light blue bars). ................................................................................................ 147
Figure 5.5 Linear correlations between measured and simulated Zernike coefficients
(astigmatism and 3rd and higher orders) in (a) S#1 OD; (b) S#2 OS; (c) S#3 OS; (d)
combining data from the three subjects (72 points). Data are for 5-mm pupil diameters. . 148
Figure 5.6 (a) MTFs (radial profiles) for astigmatism and higher order terms (b) MTFs (radial
profiles) for 3rd and higher order aberrations, for LRT (blue lines), IOL with no
tilt/decentration (green lines) and IOL with real tilt/decentration (purple lines). Data are for
the three subjects, for 5-mm pupils. ................................................................................... 149
Figure 5.7 (a) Corresponding Visual Strehl with Astigmatism and 3rd and higher order
aberration (b) Corresponding Visual Strehl with 3rd and higher order aberration without
Astigmatism (green bars present Simulation with IOL centered, purple bars present
simulation with IOL tilt and decentration, blue bars present LRT). .................................. 150

Figure and Table List
199
Chapter 6
Figure 6.1 Illustration of estimation of the optical IOL position. (1) Custom model eye is
created with individual anatomical information; (2) Wave aberrations are computed for
different IOL decentrations 1 mm x 1 mm grid (0.2 mm steps); 8 sample wave aberrations
are shown; (3) Visual Strehl is calculated for every wave aberration (for 3-mm pupil
diameter) and a VS pupillary map is created;(4) Location producing the maximum VS is
identified. ........................................................................................................................... 163
Figure 6.2 the Visual Strehl (VS) pupillary maps for one eye (E#1 OD), including:
astigmatism and high order aberrations (in the first row) and only high order aberration (in
the second row) under four conditions (without eye rotation (ER) and IOL tilt (IT) in the first
column; with ER and without IT in the second column; without ER but with IT in third
column; with ER and IT in the fourth column) .................................................................. 165
Figure 6.3 the Visual Strehl (VS) pupillary maps for one eye (E#1 OD) using anterior and
posterior elevation maps (fitted to 6th order polynomials), including: astigmatism and high
order aberrations (in the first row) and only high order aberration (in the second row) under
the same conditions in Figure 6.2. ...................................................................................... 165
Figure 6.4 Visual Strehl (VS) of E#1 OD, E#2 OS and E#3 OS including Astigmatism and
high order aberrations (HO) in the first row and including HOA only in the second row, with
real ER and real IT. ............................................................................................................ 166
Figure 6.5 (a) the maximum VS achieved by optimally placing the IOL, assuming aspheric
corneas (blue lines) or real corneal elevation maps (red lines), in comparison with a perfect
centered IOL, for subject E#1). Solid lines/solid symbols represent the max VS, while dashed
lines/opened symbols represent the VS of centered IOL in the pupil center. Thicker lines/
symbols represent VS including astigmatism and HOA, while thinner lines/smaller symbols
represent VS including HOA only. (b) Optimal IOL position (max VS) using aspherical and
real corneal elevation maps with four conditions. Square, diamond, circle and triangle
symbols represent the condition (without ER and IT) in the first column; with real ER and
without IT in the second column; without ER but with real IT in third column; with real ER
and real IT in the fourth column) respectively. Star symbol represent the real IOL position in
E#1. The color codes are the same in (a). .......................................................................... 168
Figure 6.6 (a) the Maximum Visual Strehl (by optimizing IOL decentration), the Visual
Strehl with the real IOL decentration, and assuming a centered IOL, obtained from patient
specific eye models in all three patients, with their actual anterior and posterior corneal
topographies and real eye rotation and IOL tilt. Data shown include Astigmatism and HOA
(solid bars) and HOA only (shaded bars). (b) The optimal IOL position (squares) and real
IOL positions (circles), from estimations using astigmatism and HOA (closed) and HOA only
(empty) for all three subjects. The stander deviations of real IOL positions are from
measurements. .................................................................................................................... 169
Figure 6.7 (a) RMS astigmatism; (b) RMS Coma and (c) RMS Trefoil changing with four
conditions (no ER, no IT; Real ER, no IT; No ER, Real IT; Real ER and Real IT). Double
solid line, single solid line and dashed line represent the max VS including astigmatism &
HO, the max VS including HOA only, and the VS of a centered IOL in the pupil center. The
color codes are the same in Figure 6.4. .............................................................................. 170
Figure 6.8 (a) RMS astigmatism; (b) RMS Coma and (c) RMS Trefoil with real ER and IT.
Dark solid bars represent the optimal IOL position of max VS including astigmatism & HOA,
shade bars represent the optimal IOL position of max VS including HOA only, light solid
bars represent the real IOL position in the three subjects, and lighter solid bars represent the

Biometric measurements in the crystalline lens: Applications in cataract surgery
200
IOL position centered in the pupil center. The three eyes are coded as the same in Figure 6.5.
........................................................................................................................................... 171
Figure 6.9 Visual Strehl (VS) of high order aberration through focus (from 3rd order Zernike
terms with best focus) (in the first row) and without defocus (in second row) as a function of
IOL position. (a) E1; (b) E2; (c) E3; .................................................................................. 172
Figure 6.10 the residual refractive error (the first row) and astigmatism power (the second
row) as a function of IOL positions of E#1 OD (the first column), E#2 OS (the second
column) and E#3 OS (the third column). (in D) ................................................................ 172

Figure and Table List
201
TABLE LIST Table 1.1 Summary of the eye-models, number of surfaces in each model and average population data
used in each model (MERINO 2015) ................................................................................................. 50
Table 1.2 Summary of Pseudophakic eye model (MERINO 2015) ................................................... 52
Table 3.1 Radii of curvature, axial biometry, and refractive indices, in the physical model eye, and the
five patient eyes. ................................................................................................................................. 91
Table 3.2 A-G coefficients in Eq.2.4for the physical model eye in air and water and the 5 eyes of the
study ................................................................................................................................................. 105
Table 4.1 Mean and standard deviation of the RMS of high-order Zernike coefficients for anterior and
posterior lens surfaces. The Pearson correlation coefficient and the p-value are shown for the
correlation with age of these parameters in each surface and between surfaces. ............................. 128
Table 5.2 Individual OCT-based biometrical and geometrical data used in the computer model eyes.
Data are shown as average±standard deviation of repeated measurements...................................... 143
Table 5.3 Eye rotation and IOL tilt and decentration data from OCT-based Purkinje-like methods.
Data are average±standard deviation of 5 repeated measurements. Rotation/tilt X stands for
rotation/tilt around the horizontal axis; Rotation/tilt Y stands for rotation/tilt around the vertical axis.
Decentration X/Y stands for horizontal /vertical decentration. ..…...……………………………. 145
Table 5.4 Anterior and posterior radius of curvature (R), asphericity (Q) from profilometry and OCT,
and the IOL power estimated from profilometry and OCT. OCT-based data were used in the computer
eye models. ....................................................................................................................................... 145
Table 6.1 show measurements of eye rotation, IOL tilt and decentration (horizontal and vertical
components) for each eye. ................................................................................................................ 164

Biometric measurements in the crystalline lens: Applications in cataract surgery
202

Acknowledgments
203
BIBLIOGRAPHY
A
A. De La Hoz, E. M.-E., H. Subhash, D. Pascual, N. Bekesi, C. Dorronsoro, N. Alejandre-Alba, S.
Marcos. (2016). "Design and evaluation of a surface-changing accommodating IOL." IOVS
58(ARVO E-Abstract 3131 (2016)).
Accardo, P. A. and S. Pensiero (2002). "Neural network-based system for early keratoconus
detection from corneal topography." J Biomed Inform 35(3): 151-159.
Adhi, M., D. Ferrara, R. F. Mullins, C. R. Baumal, K. J. Mohler, M. F. Kraus, J. Liu, E. Badaro, T.
Alasil, J. Hornegger, J. G. Fujimoto, J. S. Duker and N. K. Waheed (2015). "Characterization of
Choroidal Layers in Normal Aging Eyes Using Enface Swept-Source Optical Coherence
Tomography." PLoS One 10(7): e0133080.
Ale, J. B. (2011). "Intraocular lens tilt and decentration: a concern for contemporary IOL designs."
Nepal J Ophthalmol 3(1): 68-77.
Alio, J. L., B. Elkady, D. Ortiz and G. Bernabeu (2008). "Microincision multifocal intraocular lens
with and without a capsular tension ring: optical quality and clinical outcomes." J Cataract Refract
Surg 34(9): 1468-1475.
Alio, J. L., A. B. Plaza-Puche, J. Javaloy, M. J. Ayala and A. Vega-Estrada (2013). "Clinical and
optical intraocular performance of rotationally asymmetric multifocal IOL plate-haptic design
versus C-loop haptic design." J Refract Surg 29(4): 252-259.
Altmann, G. E., L. D. Nichamin, S. S. Lane and J. S. Pepose (2005). "Optical performance of 3
intraocular lens designs in the presence of decentration." J Cataract Refract Surg 31(3): 574-585.
Amano, S., Y. Amano, S. Yamagami, T. Miyai, K. Miyata, T. Samejima and T. Oshika (2004).
"Age-related changes in corneal and ocular higher-order wavefront aberrations." Am J Ophthalmol
137(6): 988-992.
Applegate, R. A., Ballentine, C., Gross, H., Sarver, E. J., Sarver, C. A. (2003). "Visual acuity as a
function of Zernike mode and level of root mean square error." Optometry and Vision Science
80(2)(97-105).
Applegate, R. A., G. Hilmantel, H. C. Howland, E. Y. Tu, T. Starck and E. J. Zayac (2000). "Corneal
first surface optical aberrations and visual performance." J Refract Surg 16(5): 507-514.
Applegate, R. A., J. D. Marsack, R. Ramos and E. J. Sarver (2003). "Interaction between aberrations
to improve or reduce visual performance." J Cataract Refract Surg 29(8): 1487-1495.
Applegate, R. A., J. D. Marsack and L. N. Thibos (2006). "Metrics of retinal image quality predict
visual performance in eyes with 20/17 or better visual acuity." Optom Vis Sci 83(9): 635-640.
Arnulf, A., Dupuy, O. (1956). "Méthode objective pour l'etude des défauts du systéme optique de
l'oeil " Problems in contemporary optics (pp. 330-335):(Inst. Naz. Ottica, Arcetri-Firenze.).
Artal, P., A. Guirao, E. Berrio and D. R. Williams (2001). "Compensation of corneal aberrations by
the internal optics in the human eye." J Vis 1(1): 1-8.
Astbury, N. and B. Ramamurthy (2006). "How to avoid mistakes in biometry." Community Eye
Health 19(60): 70-71.

Biometric measurements in the crystalline lens: Applications in cataract surgery
204
Atchison, D. A. (1989). "Optical design of intraocular lenses. I. On-axis performance." Optom Vis
Sci 66(8): 492-506.
Atchison, D. A. (1989). "Optical design of intraocular lenses. III. On-axis performance in the
presence of lens displacement." Optom Vis Sci 66(10): 671-681.
Atchison, D. A. (1991). "Design of aspheric intraocular lenses." Ophthalmic Physiol Opt 11(2):
137-146.
Atchison, D. A. (1995). "Accommodation and presbyopia." Ophthalmic Physiol Opt 15(4): 255-
272.
Atchison, D. A., E. L. Markwell, S. Kasthurirangan, J. M. Pope, G. Smith and P. G. Swann (2008).
"Age-related changes in optical and biometric characteristics of emmetropic eyes." J Vis 8(4): 29
21-20.
Atchison DA, S. G. (2000). "Optics of the Human Eye." Edinburgh, UK Butterworth-Heinemann.
Atchison, D. A. and G. Smith (1995). "Continuous gradient index and shell models of the human
lens." Vision Res 35(18): 2529-2538.
Atchison, D. A. and G. Smith (2004). "Possible errors in determining axial length changes during
accommodation with the IOLMaster." Optom Vis Sci 81(4): 283-286.
Auffarth, G. U., M. Wilcox, J. C. Sims, C. McCabe, T. A. Wesendahl and D. J. Apple (1995).
"Analysis of 100 explanted one-piece and three-piece silicone intraocular lenses." Ophthalmology
102(8): 1144-1150.
Augusteyn, R. C., A. M. Rosen, D. Borja, N. M. Ziebarth and J. M. Parel (2006). "Biometry of
primate lenses during immersion in preservation media." Mol Vis 12: 740-747.
Auran, J. D., C. J. Koester and A. Donn (1990). "In vivo measurement of posterior chamber
intraocular lens decentration and tilt." Arch Ophthalmol 108(1): 75-79.
B
B, A. N. a. R. (2006). "How to avoid mistakes in biometry." Community Eye Health 19((60)): 70–
71.
Baikoff, G. (2006). "Anterior segment OCT and phakic intraocular lenses: a perspective." J Cataract
Refract Surg 32(11): 1827-1835.
Barbero, S. (2006). "Refractive power of a multilayer rotationally symmetric model of the human
cornea and tear film." J Opt Soc Am A Opt Image Sci Vis 23(7): 1578-1585.
Barbero, S., S. Marcos and J. Merayo-Lloves (2002). "Corneal and total optical aberrations in a
unilateral aphakic patient." J Cataract Refract Surg 28(9): 1594-1600.
Barbero, S., S. Marcos, J. Montejo and C. Dorronsoro (2011). "Design of isoplanatic aspheric
monofocal intraocular lenses." Opt Express 19(7): 6215-6230.
Barer, R., K. F. Ross and S. Tkaczyk (1953). "Refractometry of living cells." Nature 171(4356):
720-724.
Barry, J. C., M. Dunne and T. Kirschkamp (2001). "Phakometric measurement of ocular surface
radius of curvature and alignment: evaluation of method with physical model eyes." Ophthalmic
Physiol Opt 21(6): 450-460.
Baumeister, M., B. Neidhardt, J. Strobel and T. Kohnen (2005). "Tilt and decentration of three-
piece foldable high-refractive silicone and hydrophobic acrylic intraocular lenses with 6-mm optics in an intraindividual comparison." Am J Ophthalmol 140(6): 1051-1058.

Acknowledgments
205
Bedford, R. E. and G. Wyszecki (1957). "Axial chromatic aberration of the human eye." J Opt Soc
Am 47(6): 564-565.
Beebe, D. C. T. l. i. P. L. K., A. Alm (Eds.) (2003). " Adler’s Physiology of the Eye." ed 10. Inc, St
Louis,( MO, Mosby): 117–158.
Beers, A. P. and G. L. Van Der Heijde (1994). "In vivo determination of the biomechanical
properties of the component elements of the accommodation mechanism." Vision Res 34(21): 2897-
2905.
Bellini, N., M. J. Cox, D. J. Harper, S. R. Stott, P. C. Ashok, K. Dholakia, S. Kawaguchi, R. King,
T. Horton and C. T. Brown (2014). "The application of optical coherence tomography to image
subsurface tissue structure of Antarctic krill Euphausia superba." PLoS One 9(10): e110367.
Benedek, G. B. (1971). "Theory of transparency of the eye." Appl Opt 10(3): 459-473.
Bezerra, H. G., M. A. Costa, G. Guagliumi, A. M. Rollins and D. I. Simon (2009). "Intracoronary
optical coherence tomography: a comprehensive review clinical and research applications." JACC
Cardiovasc Interv 2(11): 1035-1046.
Birkenfeld, J., A. de Castro and S. Marcos (2014). "Contribution of shape and gradient refractive
index to the spherical aberration of isolated human lenses." Invest Ophthalmol Vis Sci 55(4): 2599-
2607.
Bolz, M., A. Prinz, W. Drexler and O. Findl (2007). "Linear relationship of refractive and biometric
lenticular changes during accommodation in emmetropic and myopic eyes." Br J Ophthalmol 91(3):
360-365.
Borja, D., F. Manns, A. Ho, N. Ziebarth, A. M. Rosen, R. Jain, A. Amelinckx, E. Arrieta, R. C.
Augusteyn and J. M. Parel (2008). "Optical power of the isolated human crystalline lens." Invest
Ophthalmol Vis Sci 49(6): 2541-2548.
Borja, D., D. Siedlecki, A. de Castro, S. Uhlhorn, S. Ortiz, E. Arrieta, J. M. Parel, S. Marcos and F.
Manns (2010). "Distortions of the posterior surface in optical coherence tomography images of the
isolated crystalline lens: effect of the lens index gradient." Biomed Opt Express 1(5): 1331-1340.
Born, M., & Wolf, E. (1993). "Principles of Optics." Oxford, U.K. Pergamon Press(6th ed.).
Born M. , W. E. (1999). "Principles of Optics." Cambridge University Press 7th Edition( ISBN 978-
0-521-64222-4).
Bradley, A. (1992). "Glenn A. Fry Award Lecture 1991: perceptual manifestations of imperfect
optics in the human eye: attempts to correct for ocular chromatic aberration." Optom Vis Sci 69(7):
515-521.
Bradley. A and L. N. Thibos. (1995). "Modeling off-axis vision - I: The optical effects of
decentering visual targets or the eye’s entrance pupil." In E Peli, editor Vision models for target
detection and resolution(World Scientific Press): pages 313–337.
Brito, P., J. Salgado-Borges, H. Neves, J. Gonzalez-Meijome and M. Monteiro (2015). "Light-
distortion analysis as a possible indicator of visual quality after refractive lens exchange with
diffractive multifocal intraocular lenses." J Cataract Refract Surg 41(3): 613-622.
Bron, A. J., G. F. Vrensen, J. Koretz, G. Maraini and J. J. Harding (2000). "The ageing lens."
Ophthalmologica 214(1): 86-104.
Brooks, A. M., R. H. West and W. E. Gillies (1986). "The risks of precipitating acute angle-closure
glaucoma with the clinical use of mydriatic agents." Med J Aust 145(1): 34-36.
Brown, N. (1972). "An advanced slit-image camera." Br J Ophthalmol 56(8): 624-631.
Bueeler, M., M. Mrochen and T. Seiler (2003). "Maximum permissible lateral decentration in
aberration-sensing and wavefront-guided corneal ablation." J Cataract Refract Surg 29(2): 257-263.
Biometric measurements in the crystalline lens: Applications in cataract surgery
206
Buhren, J., K. Pesudovs, T. Martin, A. Strenger, G. Yoon and T. Kohnen (2009). "Comparison of
optical quality metrics to predict subjective quality of vision after laser in situ keratomileusis." J
Cataract Refract Surg 35(5): 846-855.
Burd, H. J., S. J. Judge and M. J. Flavell (1999). "Mechanics of accommodation of the human eye."
Vision Res 39(9): 1591-1595.
C
Cagini, C., F. Pietrolucci, M. Lupidi, M. Messina, F. Piccinelli and T. Fiore (2015). "Influence of
pseudophakic lens capsule opacification on spectral domain and time domain optical coherence
tomography image quality." Curr Eye Res 40(6): 579-584.
Campbell, C. E. (2010). "Nested shell optical model of the lens of the human eye." J Opt Soc Am
A Opt Image Sci Vis 27(11): 2432-2441.
Campbell, F. W. and R. W. Gubisch (1966). "Optical quality of the human eye." J Physiol 186(3):
558-578.
Campbell, M. C. (1984). "Measurement of refractive index in an intact crystalline lens." Vision Res
24(5): 409-415.
Carlson, A. N., W. C. Stewart and P. C. Tso (1998). "Intraocular lens complications requiring
removal or exchange." Surv Ophthalmol 42(5): 417-440.
Carney, L. G., J. C. Mainstone and B. A. Henderson (1997). "Corneal topography and myopia. A
cross-sectional study." Invest Ophthalmol Vis Sci 38(2): 311-320.
Castejon-Mochon, J. F., N. Lopez-Gil, A. Benito and P. Artal (2002). "Ocular wave-front aberration
statistics in a normal young population." Vision Res 42(13): 1611-1617.
Chang, D. H. and G. O. t. Waring (2014). "The subject-fixated coaxially sighted corneal light reflex:
a clinical marker for centration of refractive treatments and devices." Am J Ophthalmol 158(5): 863-
874.
Charman, W. N. (2008). "The eye in focus: accommodation and presbyopia." Clin Exp Optom
91(3): 207-225.
Chen, Q., T. Leng, L. L. Zheng, L. Kutzscher, L. De Sisternes and D. L. Rubin (2014). "An
improved optical coherence tomography-derived fundus projection image for drusen visualization."
Retina 34(5): 996-1005.
Cheng, J., L. Duan, D. W. Wong, D. Tao, M. Akiba and J. Liu (2014). "Speckle reduction in optical
coherence tomography by image registration and matrix completion." Med Image Comput Comput
Assist Interv 17(Pt 1): 162-169.
Cheng, X., L. N. Thibos and A. Bradley (2003). "Estimating visual quality from wavefront
aberration measurements." J Refract Surg 19(5): S579-584.
Chinn, S. R., E. A. Swanson and J. G. Fujimoto (1997). "Optical coherence tomography using a
frequency-tunable optical source." Opt Lett 22(5): 340-342.
Cholkar, K., H. M. Trinh, A. D. Vadlapudi and A. K. Mitra (2014). "Synthesis and Characterization
of Ganciclovir Long Chain Lipid Prodrugs." Adv Ophthalmol Vis Syst 1(2).
Choma, M., M. Sarunic, C. Yang and J. Izatt (2003). "Sensitivity advantage of swept source and
Fourier domain optical coherence tomography." Opt Express 11(18): 2183-2189.
Choma, M. A., Hsu, K., Izatt, J.A. (2005). "Swept source optical coherence tomography using an
all-fiber 1300-nm ring laser source." J. Biomed. Opt., 10.
Chopdar, A. A., T. (2014). "Multimodal retinal imaging." JP Medical Ltd.

Acknowledgments
207
Coleman, D. J., R. L. Jack, L. A. Franzen and S. C. Werner (1972). "High resolution B-scan
ultrasonography of the orbit. V. Eye changes of Graves' disease." Arch Ophthalmol 88(5): 465-471.
Collins, M. J., C. F. Wildsoet and D. A. Atchison (1995). "Monochromatic aberrations and myopia."
Vision Res 35(9): 1157-1163.
Cook, C. A., J. F. Koretz, A. Pfahnl, J. Hyun and P. L. Kaufman (1994). "Aging of the human
crystalline lens and anterior segment." Vision Res 34(22): 2945-2954.
Crnej, A., N. Hirnschall, Y. Nishi, V. Gangwani, J. Tabernero, P. Artal and O. Findl (2011). "Impact
of intraocular lens haptic design and orientation on decentration and tilt." J Cataract Refract Surg
37(10): 1768-1774.
Croft, M. A., A. Glasser and P. L. Kaufman (2001). "Accommodation and presbyopia." Int
Ophthalmol Clin 41(2): 33-46.
Croft, M. A., J. P. McDonald, N. V. Nadkarni, T. L. Lin and P. L. Kaufman (2009). "Age-related
changes in centripetal ciliary body movement relative to centripetal lens movement in monkeys."
Exp Eye Res 89(6): 824-832.
D
David A Atchison, G. S. (2000). "Optics of the human eye." utterworthHeinemann, Oxford.
David Borja, F. M., Arthur Ho, Noel Ziebarth, Alexandre M Rosen, Rakhi Jain, Adriana Amelinckx,
Esdras Arrieta, Robert C Augusteyn, and Jean Marie Parel. (2008). "Optical power of the isolated
human crystalline lens. ." Invest Ophthalmol Vis Sci 49(6)(2541–2548).
de Boer, J. F., B. Cense, B. H. Park, M. C. Pierce, G. J. Tearney and B. E. Bouma (2003). "Improved
signal-to-noise ratio in spectral-domain compared with time-domain optical coherence
tomography." Opt Lett 28(21): 2067-2069.
de Castro, A., J. Birkenfeld, B. Maceo, F. Manns, E. Arrieta, J. M. Parel and S. Marcos (2013).
"Influence of shape and gradient refractive index in the accommodative changes of spherical
aberration in nonhuman primate crystalline lenses." Invest Ophthalmol Vis Sci 54(9): 6197-6207.
de Castro, A., S. Ortiz, E. Gambra, D. Siedlecki and S. Marcos (2010). "Three-dimensional
reconstruction of the crystalline lens gradient index distribution from OCT imaging." Opt Express
18(21): 21905-21917.
de Castro, A., P. Rosales and S. Marcos (2007). "Tilt and decentration of intraocular lenses in vivo
from Purkinje and Scheimpflug imaging. Validation study." J Cataract Refract Surg 33(3): 418-429.
de Castro, A., D. Siedlecki, D. Borja, S. Uhlhorn, J. M. Parel, F. Manns and S. Marcos (2011).
"Age-dependent variation of the Gradient Index profile in human crystalline lenses." J Mod Opt
58(19-20): 1781-1787.
Demer, J. L., R. A. Clark, B. T. Crane, J. R. Tian, A. Narasimhan and S. Karim (2008). "Functional
anatomy of the extraocular muscles during vergence." Prog Brain Res 171: 21-28.
Deshpande, V. (1999). "Indian influences on early Chinese ophthalmology: glaucoma as a case
study." Bulletin of the School of Oriental and African Studies 62.2(1999): 306–322.
Deshpande, V. (2000). "Ophthalmic surgery: a chapter in the history of Sino-Indian medical
contacts." Bulletin of the School of Oriental and African Studies Studies63.3(2000): 370-388. .
Dorronsoro, C., S. Barbero, L. Llorente and S. Marcos (2003). "On-eye measurement of optical
performance of rigid gas permeable contact lenses based on ocular and corneal aberrometry." Optom
Vis Sci 80(2): 115-125.
Douthwaite, W. A. (2002). "Application of linear regression to videokeratoscope data for tilted
surfaces." Ophthalmic Physiol Opt 22(1): 46-54.

Biometric measurements in the crystalline lens: Applications in cataract surgery
208
Drexler, W., O. Findl, R. Menapace, G. Rainer, C. Vass, C. K. Hitzenberger and A. F. Fercher
(1998). "Partial coherence interferometry: a novel approach to biometry in cataract surgery." Am J
Ophthalmol 126(4): 524-534.
Dubbelman, M., V. A. Sicam and R. G. van der Heijde (2007). "The contribution of the posterior
surface to the coma aberration of the human cornea." J Vis 7(7): 10 11-18.
Dubbelman, M. and G. L. Van der Heijde (2001). "The shape of the aging human lens: curvature,
equivalent refractive index and the lens paradox." Vision Res 41(14): 1867-1877.
Dubbelman, M., G. L. van der Heijde and H. A. Weeber (2001). "The thickness of the aging human
lens obtained from corrected Scheimpflug images." Optom Vis Sci 78(6): 411-416.
Dubbelman, M., G. L. Van der Heijde and H. A. Weeber (2005). "Change in shape of the aging
human crystalline lens with accommodation." Vision Res 45(1): 117-132.
Dubbelman, M., G. L. Van der Heijde, H. A. Weeber and G. F. Vrensen (2003). "Changes in the
internal structure of the human crystalline lens with age and accommodation." Vision Res 43(22):
2363-2375.
Dubbelman, M., R. G. van der Heijde and H. A. Weeber (2005). "Comment on "Scheimpflug and
high-resolution magnetic resonance imaging of the anterior segment: a comparative study"." J Opt
Soc Am A Opt Image Sci Vis 22(6): 1216-1218; discussion 1219-1220.
Dubbelman, M., H. A. Weeber, R. G. van der Heijde and H. J. Volker-Dieben (2002). "Radius and
asphericity of the posterior corneal surface determined by corrected Scheimpflug photography."
Acta Ophthalmol Scand 80(4): 379-383.
Dunne, M. C., L. N. Davies, E. A. Mallen, T. Kirschkamp and J. C. Barry (2005). "Non-invasive
phakometric measurement of corneal and crystalline lens alignment in human eyes." Ophthalmic
Physiol Opt 25(2): 143-152.
Dunne, M. C., G. P. Misson, E. K. White and D. A. Barnes (1993). "Peripheral astigmatic
asymmetry and angle alpha." Ophthalmic Physiol Opt 13(3): 303-305.
Dunne, M. C., J. M. Royston and D. A. Barnes (1992). "Normal variations of the posterior corneal
surface." Acta Ophthalmol (Copenh) 70(2): 255-261.
Dupps, W. J., Jr. and S. E. Wilson (2006). "Biomechanics and wound healing in the cornea." Exp
Eye Res 83(4): 709-720.
E
Elsheikh, A., D. Alhasso and P. Rama (2008). "Biomechanical properties of human and porcine
corneas." Exp Eye Res 86(5): 783-790.
Enrique J. Fern´andez, A. U., Pedro M. Prieto, Boris Hermann, Wolfgang Drexler, and Pablo Artal
(2005). "Ocular aberrations as a function of wavelength in the near infrared measured with a
femtosecond laser." Opt Express 13(2)(400–49,).
Eppig, T., K. Scholz, A. Loffler, A. Messner and A. Langenbucher (2009). "Effect of decentration
and tilt on the image quality of aspheric intraocular lens designs in a model eye." J Cataract Refract
Surg 35(6): 1091-1100.
Era. (2008). "Cataract Surgery in the Modern." American Academy of
Ophthalmology.(http://www.aaofoundation.org/what/heritage/exhibits/online/cataract/modern.cfm
).
F
Acknowledgments
209
Fedorov SN, K. A., Kolinko AI. (1967). "Estimation of optical power of the intraocular lens." Vestn
Oftalmol 80: 27–31.
Fercher, A. F., C. K. Hitzenberger, W. Drexler, G. Kamp and H. Sattmann (1993). "In vivo optical
coherence tomography." Am J Ophthalmol 116(1): 113-114.
Fercher, A. F., Hitzenberger, C.K., Kamp, G., Elzaiat, S.Y. (1995). "Measurement of intraocular
distances by backscattering spectral interferometry." Opt. Commun. 117(43-48).
Fercher, A. F., K. Mengedoht and W. Werner (1988). "Eye-length measurement by interferometry
with partially coherent light." Opt Lett 13(3): 186-188.
Findl, O. (2005). "Biometry and intraocular lens power calculation." Curr Opin Ophthalmol 16(1):
61-64.
Findl, O., K. Kriechbaum, S. Sacu, B. Kiss, K. Polak, J. Nepp, G. Schild, G. Rainer, S. Maca, V.
Petternel, B. Lackner and W. Drexler (2003). "Influence of operator experience on the performance
of ultrasound biometry compared to optical biometry before cataract surgery." J Cataract Refract
Surg 29(10): 1950-1955.
Fink, W. and D. Micol (2006). "simEye: Computer-based simulation of visual perception under
various eye defects using Zernike polynomials." J Biomed Opt 11(5): 054011.
G
Gambra, E., S. Ortiz, P. Perez-Merino, M. Gora, M. Wojtkowski and S. Marcos (2013). "Static
and dynamic crystalline lens accommodation evaluated using quantitative 3-D OCT." Biomed Opt
Express 4(9): 1595-1609.
Garner, L. F. (1983). "Mechanisms of accommodation and refractive error." Ophthalmic Physiol
Opt 3(3): 287-293.
Garner, L. F. and M. K. Yap (1997). "Changes in ocular dimensions and refraction with
accommodation." Ophthalmic Physiol Opt 17(1): 12-17.
Gatinel, D. and T. Hoang-Xuan (2007). "Objective assessment of the quality of vision before and
after repositioning of a dislocated iris-fixated aphakic anterior chamber lens." J Refract Surg 23(9
Suppl): S1005-1010.
Glasser, A. (2008). "Restoration of accommodation: surgical options for correction of presbyopia."
Clin Exp Optom 91(3): 279-295.
Glasser, A. and M. C. Campbell (1998). "Presbyopia and the optical changes in the human
crystalline lens with age." Vision Res 38(2): 209-229.
Glasser, A. and M. C. Campbell (1999). "Biometric, optical and physical changes in the isolated
human crystalline lens with age in relation to presbyopia." Vision Res 39(11): 1991-2015.
Glasser, A., M. A. Croft and P. L. Kaufman (2001). "Aging of the human crystalline lens and
presbyopia." Int Ophthalmol Clin 41(2): 1-15.
Golubovic, B., B. E. Bouma, G. J. Tearney and J. G. Fujimoto (1997). "Optical frequency-domain
reflectometry using rapid wavelength tuning of a Cr4+:forsterite laser." Opt Lett 22(22): 1704-1706.
Goncharov, A. V. and C. Dainty (2007). "Wide-field schematic eye models with gradient-index
lens." J Opt Soc Am A Opt Image Sci Vis 24(8): 2157-2174.
Goss, D. A., H. G. Van Veen, B. B. Rainey and B. Feng (1997). "Ocular components measured by
keratometry, phakometry, and ultrasonography in emmetropic and myopic optometry students."
Optom Vis Sci 74(7): 489-495.

Biometric measurements in the crystalline lens: Applications in cataract surgery
210
Grulkowski, I., M. Gora, M. Szkulmowski, I. Gorczynska, D. Szlag, S. Marcos, A. Kowalczyk and
M. Wojtkowski (2009). "Anterior segment imaging with Spectral OCT system using a high-speed
CMOS camera." Opt Express 17(6): 4842-4858.
Guillon, M., D. P. Lydon and C. Wilson (1986). "Corneal topography: a clinical model." Ophthalmic
Physiol Opt 6(1): 47-56.
Guirao, A. and P. Artal (2000). "Corneal wave aberration from videokeratography: accuracy and
limitations of the procedure." J Opt Soc Am A Opt Image Sci Vis 17(6): 955-965.
Guirao, A. and D. R. Williams (2003). "A method to predict refractive errors from wave aberration
data." Optom Vis Sci 80(1): 36-42.
Gullstrand, A. (1909). "Appendix II in: H. von Helmholtz " ‘Handbuch der Physiologischen Optik’
3rd edition(part I).
Gustafsson, J., E. Terenius, J. Buchheister and P. Unsbo (2001). "Peripheral astigmatism in
emmetropic eyes." Ophthalmic Physiol Opt 21(5): 393-400.
Guyton, D. L., H. Uozato and H. J. Wisnicki (1990). "Rapid determination of intraocular lens tilt
and decentration through the undilated pupil." Ophthalmology 97(10): 1259-1264.
H
Ha Usler, G. and M. W. Lindner (1998). ""Coherence radar" and "spectral radar"-new tools for
dermatological diagnosis." J Biomed Opt 3(1): 21-31.
Haigis W. (2004). "The Haigis formula." In: Shammas HJ, ed, Intraocular Lens Power Calculations.
Thorofare, NJ, Slack, : 41–57.
Hartmann, J. (1900). "Bemerkungen über den Bau und die Justierung von Spektrgraphen." Z
Instumentenkd, 20(47-58).
Hartmann, J. (1904). "Objektivuntersuchungen." Z Instrumentenkd 24(1-32).
Hashemi, H., M. KhabazKhoob, K. Yazdani, S. Mehravaran, E. Jafarzadehpur and A. Fotouhi
(2010). "Distribution of angle kappa measurements with Orbscan II in a population-based survey."
J Refract Surg 26(12): 966-971.
Hayashi, H., K. Hayashi, F. Nakao and F. Hayashi (1998). "Area reduction in the anterior capsule
opening in eyes of diabetes mellitus patients." J Cataract Refract Surg 24(8): 1105-1110.
Hayashi, K. and H. Hayashi (2006). "Long-term changes in corneal surface configuration after
penetrating keratoplasty." Am J Ophthalmol 141(2): 241-247.
Hayashi, K., H. Hayashi, K. Matsuo, F. Nakao and F. Hayashi (1998). "Anterior capsule contraction
and intraocular lens dislocation after implant surgery in eyes with retinitis pigmentosa."
Ophthalmology 105(7): 1239-1243.
Hayashi, K., H. Hayashi, F. Nakao and F. Hayashi (1998). "Comparison of decentration and tilt
between one piece and three piece polymethyl methacrylate intraocular lenses." Br J Ophthalmol
82(4): 419-422.
Hayashi, K., H. Hayashi, F. Nakao and F. Hayashi (1999). "Intraocular lens tilt and decentration
after implantation in eyes with glaucoma." J Cataract Refract Surg 25(11): 1515-1520.
He, J. C., S. A. Burns and S. Marcos (2000). "Monochromatic aberrations in the accommodated
human eye." Vision Res 40(1): 41-48.
He, L., R. Ren, H. Yang, C. Hardin, L. Reyes, J. Reynaud, S. K. Gardiner, B. Fortune, S. Demirel and C. F. Burgoyne (2014). "Anatomic vs. acquired image frame discordance in spectral domain
optical coherence tomography minimum rim measurements." PLoS One 9(3): e92225.

Acknowledgments
211
Hemenger, R. P., L. F. Garner and C. S. Ooi (1995). "Change with age of the refractive index
gradient of the human ocular lens." Invest Ophthalmol Vis Sci 36(3): 703-707.
Hermans, E. A., M. Dubbelman, G. L. van der Heijde and R. M. Heethaar (2006). "Estimating the
external force acting on the human eye lens during accommodation by finite element modelling."
Vision Res 46(21): 3642-3650.
Hermans, E. A., P. J. Pouwels, M. Dubbelman, J. P. Kuijer, R. G. van der Heijde and R. M. Heethaar
(2009). "Constant volume of the human lens and decrease in surface area of the capsular bag during
accommodation: an MRI and Scheimpflug study." Invest Ophthalmol Vis Sci 50(1): 281-289.
Hoffer, K. J. (1980). "Steps for IOL power calculation." J Am Intraocul Implant Soc 6(4): 370.
Hoffer, K. J. (1993). "The Hoffer Q formula: a comparison of theoretic and regression formulas." J
Cataract Refract Surg 19(6): 700-712.
Holladay, J. T., D. Calogero, G. Hilmantel, A. Glasser, S. MacRae, S. Masket, W. Stark, M. E.
Tarver, T. Nguyen and M. Eydelman (2017). "Special Report: American Academy of
Ophthalmology Task Force Summary Statement for Measurement of Tilt, Decentration, and Chord
Length." Ophthalmology 124(1): 144-146.
Holladay, J. T., P. A. Piers, G. Koranyi, M. van der Mooren and N. E. Norrby (2002). "A new
intraocular lens design to reduce spherical aberration of pseudophakic eyes." J Refract Surg 18(6):
683-691.
Holladay, J. T., T. C. Prager, T. Y. Chandler, K. H. Musgrove, J. W. Lewis and R. S. Ruiz (1988).
"A three-part system for refining intraocular lens power calculations." J Cataract Refract Surg 14(1):
17-24.
Howarth, P. A. (1984). "The lateral chromatic aberration of the eye." Ophthalmic Physiol Opt 4(3):
223-226.
Howarth, P. A. and A. Bradley (1986). "The longitudinal chromatic aberration of the human eye,
and its correction." Vision Res 26(2): 361-366.
Howland, B. (1960). "Use of crossed cylinder lens in photographic lens evaluation." Applied Optics
7(1587-1588).
Howland, B. and H. C. Howland (1976). "Subjective measurement of high-order aberrations of the
eye." Science 193(4253): 580-582.
Howland, H. C. and B. Howland (1977). "A subjective method for the measurement of
monochromatic aberrations of the eye." J Opt Soc Am 67(11): 1508-1518.
Huang, D., E. A. Swanson, C. P. Lin, J. S. Schuman, W. G. Stinson, W. Chang, M. R. Hee, T. Flotte,
K. Gregory, C. A. Puliafito and et al. (1991). "Optical coherence tomography." Science 254(5035):
1178-1181.
Hurd, L. B., 2nd and M. L. Feldman (1994). "Purkinje-like cells in rat cochlear nucleus." Hear Res
72(1-2): 143-158.
I
Institute., A. N. S. (2004). "Methods for reporting optical aberrations of the eye, 2004., International
Organization for Standardization." American National Standard for Ophthalmics ANSI Z80.28
Iskander, D. R. (2006). "Computational aspects of the visual Strehl ratio." Optom Vis Sci 83(1): 57-
59.
Izatt, J. A., M. R. Hee, E. A. Swanson, C. P. Lin, D. Huang, J. S. Schuman, C. A. Puliafito and J.
G. Fujimoto (1994). "Micrometer-scale resolution imaging of the anterior eye in vivo with optical
coherence tomography." Arch Ophthalmol 112(12): 1584-1589.

Biometric measurements in the crystalline lens: Applications in cataract surgery
212
J
James T. Schwiegerling (2013). "Eye Axes and Their Relevance to Alignment of Corneal Refractive
Procedures." Journal of Refractive Surgery 29(8): 515-516.
John A. (2001). "The eye and orbit, Fielding." In: Cosgrove D, editor. Clinical Ultrasound((6)): 59–
95.
Jones, C. E., D. A. Atchison, R. Meder and J. M. Pope (2005). "Refractive index distribution and
optical properties of the isolated human lens measured using magnetic resonance imaging (MRI)."
Vision Res 45(18): 2352-2366.
Jones, C. E., D. A. Atchison and J. M. Pope (2007). "Changes in lens dimensions and refractive
index with age and accommodation." Optom Vis Sci 84(10): 990-995.
Juan Tabernero, N. H., Sophie Tatzreiter, Oliver Findl and Pablo Artal (2012). "Determining The
Stability Of Implanted Iols With A Dynamic Purkinje-meter System." Invest Ophthalmol Vis Sci
53(E-Abstract 1373.©ARVO).
Judge, S. J. and H. J. Burd (2002). "Modelling the mechanics of accommodation and presbyopia."
Ophthalmic Physiol Opt 22(5): 397-400.
K
Kamiya, K., K. Shimizu, M. Yamagishi, A. Igarashi and H. Kobashi (2015). "Anterior and Posterior
Corneal Astigmatism after Refractive Lenticule Extraction for Myopic Astigmatism." J Ophthalmol
2015: 915853.
Kasthurirangan, S., E. L. Markwell, D. A. Atchison and J. M. Pope (2008). "In vivo study of changes
in refractive index distribution in the human crystalline lens with age and accommodation." Invest
Ophthalmol Vis Sci 49(6): 2531-2540.
Kasthurirangan, S., E. L. Markwell, D. A. Atchison and J. M. Pope (2011). "MRI study of the
changes in crystalline lens shape with accommodation and aging in humans." J Vis 11(3).
Kasthurirangan, S., Markwell, E., Atchison, D.A., Pope, J.M., Smith, G. (2007). "Magnetic
resonance imaging study of crystalline lens shape with accommodation and age. ." Invest.
Ophtalmol. Vis. Science,(48): E-Abstract 6008.
Kaufman, P. L., L. Z. Bito and C. J. DeRousseau (1982). "The development of presbyopia in
primates." Trans Ophthalmol Soc U K 102 Pt 3: 323-326.
Kelly, J. E., T. Mihashi and H. C. Howland (2004). "Compensation of corneal horizontal/vertical
astigmatism, lateral coma, and spherical aberration by internal optics of the eye." J Vis 4(4): 262-
271.
Kepler, J. (1604). " Ad Vitellionem paralipomena.".
Kim, E., K. Ehrmann, S. Uhlhorn, D. Borja, E. Arrieta-Quintero and J. M. Parel (2011).
"Semiautomated analysis of optical coherence tomography crystalline lens images under simulated
accommodation." J Biomed Opt 16(5): 056003.
Kim, J. H., S. W. Kang, J. R. Kim and Y. S. Chang (2014). "Influence of image compression on the
interpretation of spectral-domain optical coherence tomography in exudative age-related macular
degeneration." Eye (Lond) 28(7): 825-831.
Kirschkamp, T., M. Dunne and J. C. Barry (2004). "Phakometric measurement of ocular surface
radii of curvature, axial separations and alignment in relaxed and accommodated human eyes."
Ophthalmic Physiol Opt 24(2): 65-73.

Acknowledgments
213
Kling, S., Remon, L., Perez-Escudero, A., Merayo-Lloves, J., & Marcos, S. (2009). "Biomechanical
Response of Normal and Cross-linked Porcine Corneas." IOVS
ARVO E-Abstract: 5477.
Koh, S., N. Maeda, T. Kuroda, Y. Hori, H. Watanabe, T. Fujikado, Y. Tano, Y. Hirohara and T.
Mihashi (2002). "Effect of tear film break-up on higher-order aberrations measured with wavefront
sensor." Am J Ophthalmol 134(1): 115-117.
Kohnen, T. (1998). "Complications and complication management with foldable intraocular
intraocular lenses." J Cataract Refract Surg 24(9): 1167-1168.
Konstantopoulos, A., P. Hossain and D. F. Anderson (2007). "Recent advances in ophthalmic
anterior segment imaging: a new era for ophthalmic diagnosis?" Br J Ophthalmol 91(4): 551-557.
Koretz, J. E., S. A. Strenk, L. M. Strenk and J. L. Semmlow (2004). "Scheimpflug and high-
resolution magnetic resonance imaging of the anterior segment: a comparative study." J Opt Soc
Am A Opt Image Sci Vis 21(3): 346-354.
Koretz, J. F., C. A. Cook and P. L. Kaufman (1997). "Accommodation and presbyopia in the human
eye. Changes in the anterior segment and crystalline lens with focus." Invest Ophthalmol Vis Sci
38(3): 569-578.
Koretz, J. F., C. A. Cook and P. L. Kaufman (2001). "Aging of the human lens: changes in lens
shape at zero-diopter accommodation." J Opt Soc Am A Opt Image Sci Vis 18(2): 265-272.
Koretz, J. F., G. H. Handelman and N. P. Brown (1984). "Analysis of human crystalline lens
curvature as a function of accommodative state and age." Vision Res 24(10): 1141-1151.
Koretz, J. F., P. L. Kaufman, M. W. Neider and P. A. Goeckner (1989). "Accommodation and
presbyopia in the human eye--aging of the anterior segment." Vision Res 29(12): 1685-1692.
Koszeghy, A., B. Pal, P. Pap, K. Pocsai, Z. Nagy, G. Szucs and Z. Rusznak (2009). "Purkinje-like
cells of the rat cochlear nucleus: a combined functional and morphological study." Brain Res 1297:
57-69.
Kotecha, A., R. A. Russell, A. Sinapis, S. Pourjavan, D. Sinapis and D. F. Garway-Heath (2014).
"Biomechanical parameters of the cornea measured with the Ocular Response Analyzer in normal
eyes." BMC Ophthalmol 14: 11.
Kozaki, J., H. Tanihara, A. Yasuda and M. Nagata (1991). "Tilt and decentration of the implanted
posterior chamber intraocular lens." J Cataract Refract Surg 17(5): 592-595.
Kretz, F. T., R. Khoramnia, M. S. Attia, M. J. Koss, K. Linz and G. U. Auffarth (2016). "Clinical
Evaluation of Functional Vision of +1.5 Diopters near Addition, Aspheric, Rotational Asymmetric
Multifocal Intraocular Lens." Korean J Ophthalmol 30(5): 382-389.
Kumar, D. A., A. Agarwal, S. Jacob and A. Agarwal (2013). "Glued trans-scleral intraocular lens
exchange for anterior chamber lenses in complicated eyes: analysis of indications and results." Am
J Ophthalmol 156(6): 1125-1133 e1122.
Kuroda, T., T. Fujikado, N. Maeda, T. Oshika, Y. Hirohara and T. Mihashi (2002). "Wavefront
analysis of higher-order aberrations in patients with cataract." J Cataract Refract Surg 28(3): 438-
444.
Kymionis, G. D., A. E. Karavitaki, M. A. Grentzelos, D. A. Liakopoulos, K. I. Tsoulnaras and G.
A. Kontadakis (2014). "Topography-based keratoconus progression after corneal collagen
crosslinking." Cornea 33(4): 419-421.
L

Biometric measurements in the crystalline lens: Applications in cataract surgery
214
Lam, G. T., C. Jiang and C. S. Thummel (1997). "Coordination of larval and prepupal gene
expression by the DHR3 orphan receptor during Drosophila metamorphosis." Development 124(9):
1757-1769.
Landau, I. M. and C. G. Laurell (1999). "Ultrasound biomicroscopy examination of intraocular lens
haptic position after phacoemulsification with continuous curvilinear capsulorhexis and
extracapsular cataract extraction with linear capsulotomy." Acta Ophthalmol Scand 77(4): 394-396.
Le Grand, Y. (1956). "Optique Physiologique " L'espace Visuel (Vol. 3)((1 ed. Vol. 3)): Paris:
Éditions de la Revue d'Optique.
Lee, D. H., H. Y. Lee, K. H. Lee, K. H. Chung and C. K. Joo (2001). "Effect of a capsular tension
ring on the shape of the capsular bag and opening and the intraocular lens." J Cataract Refract Surg
27(3): 452-456.
Lee, J. Y., Y. K. Lee, J. I. Moon and M. H. Park (2014). "Spectral domain optical coherence
tomography cross-sectional image of optic nerve head during intraocular pressure elevation." Int J
Ophthalmol 7(6): 1022-1029.
Lee, K. S., K. P. Thompson and J. P. Rolland (2010). "Broadband astigmatism-corrected Czerny-
Turner spectrometer." Opt Express 18(22): 23378-23384.
Leitgeb, R., C. Hitzenberger and A. Fercher (2003). "Performance of fourier domain vs. time
domain optical coherence tomography." Opt Express 11(8): 889-894.
Letocha, C. E. and C. J. Pavlin (1999). "Follow-up of 3 patients with Ridley intraocular lens
implantation." J Cataract Refract Surg 25(4): 587-591.
Lewis, R. (1983). "The Conquest of Presbyopia." Sydney, Austr.: R. & M. Lewis.((p. 111)).
Lexer, F., C. K. Hitzenberger, A. F. Fercher and M. Kulhavy (1997). "Wavelength-tuning
interferometry of intraocular distances." Appl Opt 36(25): 6548-6553.
Li, L., K. Wang, Y. Yan, X. Song and Z. Liu (2013). "Research on calculation of the IOL tilt and
decentration based on surface fitting." Comput Math Methods Med 2013: 572530.
Li, Y., D. M. Meisler, M. Tang, A. T. Lu, V. Thakrar, B. J. Reiser and D. Huang (2008).
"Keratoconus diagnosis with optical coherence tomography pachymetry mapping." Ophthalmology
115(12): 2159-2166.
Lim, L., G. Gazzard, Y. H. Chan, A. Fong, A. Kotecha, E. L. Sim, D. Tan, L. Tong and S. M. Saw
(2008). "Cornea biomechanical characteristics and their correlates with refractive error in
Singaporean children." Invest Ophthalmol Vis Sci 49(9): 3852-3857.
Lin, Y. S., C. C. Chu, J. J. Lin, C. C. Chang, C. C. Wang, C. Y. Wang and P. H. Tsui (2014).
"Optical coherence tomography: a new strategy to image planarian regeneration." Sci Rep 4: 6316.
Linebarger, E. J., D. R. Hardten, G. K. Shah and R. L. Lindstrom (1999). "Phacoemulsification and
modern cataract surgery." Surv Ophthalmol 44(2): 123-147.
Liou, H. L. and N. A. Brennan (1997). "Anatomically accurate, finite model eye for optical
modeling." J Opt Soc Am A Opt Image Sci Vis 14(8): 1684-1695.
Liu, C., A. Wong, P. Fieguth, K. Bizheva and H. Bie (2014). "Noise-compensated homotopic non-
local regularized reconstruction for rapid retinal optical coherence tomography image acquisitions."
BMC Med Imaging 14: 37.
Liu, Y. C., P. Chou, R. Wojciechowski, P. Y. Lin, C. J. Liu, S. J. Chen, J. H. Liu, W. M. Hsu and
C. Y. Cheng (2011). "Power vector analysis of refractive, corneal, and internal astigmatism in an
elderly Chinese population: the Shihpai Eye Study." Invest Ophthalmol Vis Sci 52(13): 9651-9657.
Llorente, L., S. Barbero, D. Cano, C. Dorronsoro and S. Marcos (2004). "Myopic versus hyperopic
eyes: axial length, corneal shape and optical aberrations." J Vis 4(4): 288-298.

Acknowledgments
215
Llorente, L., L. Diaz-Santana, D. Lara-Saucedo and S. Marcos (2003). "Aberrations of the human
eye in visible and near infrared illumination." Optom Vis Sci 80(1): 26-35.
Long, D. A. and M. L. Monica (1996). "A prospective evaluation of corneal curvature changes with
3.0- to 3.5-mm corneal tunnel phacoemulsification." Ophthalmology 103(2): 226-232.
Loper, L. R. (1959). "The relationship between angle lambda and the residual astigmatism of the
eye." Am J Optom Arch Am Acad Optom 36(7): 365-377.
Lowe, R. F. and B. A. Clark (1973). "Posterior corneal curvature. Correlations in normal eyes and
in eyes involved with primary angle-closure glaucoma." Br J Ophthalmol 57(7): 464-470.
Lu, B. and Z. Shen (1999). "[Measurement and research of posterior chamber intraocular lens tilt
and decentration in vivo]." Zhonghua Yan Ke Za Zhi 35(1): 40-42.
Lyle, W. A. and J. C. Jin (1992). "An analysis of intraocular lens exchange." Ophthalmic Surg 23(7):
453-458.
M
Maeda, N., T. Fujikado, T. Kuroda, T. Mihashi, Y. Hirohara, K. Nishida, H. Watanabe and Y. Tano
(2002). "Wavefront aberrations measured with Hartmann-Shack sensor in patients with
keratoconus." Ophthalmology 109(11): 1996-2003.
Maeda, P. Y. (2003). "Zernike Polynomials and Their Use in Describing the Wavefront Aberrations
of the Human Eye." Psych 221/EE362 Applied Vision and Imaging Systems Course
Project(Stanford University).
Mahajan, V. N. (1994). "Zernike circle polynomials and optical aberrations of systems with circular
pupils." Appl Opt 33(34): 8121.
Majdi, J. A., H. Qian, Y. Li, R. J. Langsner, K. I. Shea, A. Agrawal, D. X. Hammer, J. P. Hanig and
E. D. Cohen (2015). "The use of time-lapse optical coherence tomography to image the effects of
microapplied toxins on the retina." Invest Ophthalmol Vis Sci 56(1): 587-597.
Malacara, D., Martin, J., Sánchez-Mondragón, J. J. (1990). "Wavefront fitting with discrete
orthogonal polynomials in a unit radius circle. ." Optical Engineering, 29(6)(672-675).
Malyugin, B. E., A. A. Shpak and D. F. Pokrovskiy (2015). "Posterior chamber phakic intraocular
lens sizing based on iris pigment layer measurements by anterior segment optical coherence
tomography." J Cataract Refract Surg 41(8): 1616-1622.
Mamalis, N. (2002). "Complications of foldable intraocular lenses requiring explantation or
secondary intervention--2001 survey update." J Cataract Refract Surg 28(12): 2193-2201.
Mandell, R. B. (1995). "Locating the corneal sighting center from videokeratography." J Refract
Surg 11(4): 253-259.
Manns, F., V. Fernandez, S. Zipper, S. Sandadi, M. Hamaoui, A. Ho and J. M. Parel (2004). "Radius
of curvature and asphericity of the anterior and posterior surface of human cadaver crystalline
lenses." Exp Eye Res 78(1): 39-51.
Marcos, S., S. A. Burns, E. Moreno-Barriusop and R. Navarro (1999). "A new approach to the study
of ocular chromatic aberrations." Vision Res 39(26): 4309-4323.
Marcos, S., S. A. Burns, P. M. Prieto, R. Navarro and B. Baraibar (2001). "Investigating sources of
variability of monochromatic and transverse chromatic aberrations across eyes." Vision Res 41(28):
3861-3871.
Marcos, S., L. Diaz-Santana, L. Llorente and C. Dainty (2002). "Ocular aberrations with ray tracing
and Shack-Hartmann wave-front sensors: does polarization play a role?" J Opt Soc Am A Opt Image
Sci Vis 19(6): 1063-1072.

Biometric measurements in the crystalline lens: Applications in cataract surgery
216
Marcos, S., S. Ortiz, P. Perez-Merino, J. Birkenfeld, S. Duran and I. Jimenez-Alfaro (2014). "Three-
dimensional evaluation of accommodating intraocular lens shift and alignment in vivo."
Ophthalmology 121(1): 45-55.
Marcos, S., P. Rosales, L. Llorente, S. Barbero and I. Jimenez-Alfaro (2008). "Balance of corneal
horizontal coma by internal optics in eyes with intraocular artificial lenses: evidence of a passive
mechanism." Vision Res 48(1): 70-79.
Marcos S., M.-E. E., Sun, M. , Perez-Merino P., Velasco-Ocana M. (2016). "3-D OCT ocular
biometry." XXII Biennial Meeting of the International Society for Eye Research ISER · Abstract:
A-817-0005-00262.
Marsack, J. D., L. N. Thibos and R. A. Applegate (2004). "Metrics of optical quality derived from
wave aberrations predict visual performance." J Vis 4(4): 322-328.
Martinez-Enriquez, E., M. Sun, M. Velasco-Ocana, J. Birkenfeld, P. Perez-Merino and S. Marcos
(2016). "Optical Coherence Tomography Based Estimates of Crystalline Lens Volume, Equatorial
Diameter, and Plane Position." Invest Ophthalmol Vis Sci 57(9): OCT600-OCT610.
Martinez-Enriquez, E., M. Sun, M. Velasco-Ocana, J. Birkenfeld, P. Perez-Merino and S. Marcos
(2016). "Optical Coherence Tomography Based Estimates of Crystalline Lens Volume, Equatorial
Diameter, and Plane Position." Invest Ophthalmol Vis Sci 57(9): OCT600-610.
Martinez-Enriquez, E. P.-M., Pablo; Sun, Mengchan; Durán-Poveda, Sonia; Jiménez-Alfaro,
Ignacio; Marcos, Susana (2017). "Full shape crystalline lens quantification from 3-D OCT images
and its application to predict the post-operative IOL position." ARVO E-abstract 2686338.
Marussich, L., F. Manns, D. Nankivil, B. Maceo Heilman, Y. Yao, E. Arrieta-Quintero, A. Ho, R.
Augusteyn and J. M. Parel (2015). "Measurement of Crystalline Lens Volume During
Accommodation in a Lens Stretcher." Invest Ophthalmol Vis Sci 56(8): 4239-4248.
Mathur, A., D. A. Atchison and W. N. Charman (2009). "Myopia and peripheral ocular aberrations."
J Vis 9(10): 15 11-12.
McGinty, S. J. and R. J. Truscott (2006). "Presbyopia: the first stage of nuclear cataract?"
Ophthalmic Res 38(3): 137-148.
McLellan, J. S., S. Marcos and S. A. Burns (2001). "Age-related changes in monochromatic wave
aberrations of the human eye." Invest Ophthalmol Vis Sci 42(6): 1390-1395.
McLeod, S. D. (2006). "Optical principles, biomechanics, and initial clinical performance of a dual-
optic accommodating intraocular lens (an American Ophthalmological Society thesis)." Trans Am
Ophthalmol Soc 104: 437-452.
McNabb, R. P., A. N. Kuo and J. A. Izatt (2013). "Quantitative single and multi-surface clinical
corneal topography utilizing optical coherence tomography." Opt Lett 38(8): 1212-1214.
Meek, K. M. and C. Knupp (2015). "Corneal structure and transparency." Prog Retin Eye Res 49:
1-16.
Meek, K. M. and R. H. Newton (1999). "Organization of collagen fibrils in the corneal stroma in
relation to mechanical properties and surgical practice." J Refract Surg 15(6): 695-699.
MERINO, P. P. (2015). "ANTERIOR SEGMENT TOPOGRAPHY AND ABERRATIONS FOR
CLINICAL APPLICATIONS." PhD thesis.
Michael J. Simpson, J. M. S., Son Trung Tran (2007). "Intraocular Lens with Asymmetric Haptics."
Patentes US20080269881 A1(Candidatura): US 11/741,854.
Michael, R. and A. J. Bron (2011). "The ageing lens and cataract: a model of normal and
pathological ageing." Philos Trans R Soc Lond B Biol Sci 366(1568): 1278-1292.

Acknowledgments
217
Moffat, B. A., D. A. Atchison and J. M. Pope (2002). "Age-related changes in refractive index
distribution and power of the human lens as measured by magnetic resonance micro-imaging in
vitro." Vision Res 42(13): 1683-1693.
Molebny, V. V., Pallikaris, I. G., Naoumidis, L. P., Chyzh, I. H., Molebny, S. V., Sokurenko, V. M.
(1997). "Retina Ray-Tracing technique for eye-refraction mapping." Proceedings of the SPIE,
2971(175-183).
Moreno-Barriuso, E., S. Marcos, R. Navarro and S. A. Burns (2001). "Comparing laser ray tracing,
the spatially resolved refractometer, and the Hartmann-Shack sensor to measure the ocular wave
aberration." Optom Vis Sci 78(3): 152-156.
Moreno-Barriuso, E., J. Merayo-Lloves, S. Marcos, R. Navarro, L. Llorente and S. Barbero (2001).
"Ocular aberrations before and after myopic corneal refractive surgery: LASIK-induced changes
measured with laser ray tracing." Invest Ophthalmol Vis Sci 42(6): 1396-1403.
Mutlu, F. M., A. Bayer, C. Erduman and M. Z. Bayraktar (2005). "Comparison of tilt and
decentration between phacoemulsification and phacotrabeculectomy." Ophthalmologica 219(1):
26-29.
Mutti, D. O., K. Zadnik and A. J. Adams (1992). "A video technique for phakometry of the human
crystalline lens." Invest Ophthalmol Vis Sci 33(5): 1771-1782.
N
Napoletani, D. and T. D. Sauer (2008). "Reconstructing the topology of sparsely connected
dynamical networks." Phys Rev E Stat Nonlin Soft Matter Phys 77(2 Pt 2): 026103.
Navarro, R. (2009). "The Optical Design of the Human Eye: a Critical Review." J Optom Vol. 2
(1): 3-18.
Navarro, R. and M. A. Losada (1997). "Aberrations and relative efficiency of light pencils in the
living human eye." Optom Vis Sci 74(7): 540-547.
Navarro, R. and E. Moreno-Barriuso (1999). "Laser ray-tracing method for optical testing." Opt Lett
24(14): 951-953.
Navarro, R., E. Moreno and C. Dorronsoro (1998). "Monochromatic aberrations and point-spread
functions of the human eye across the visual field." J Opt Soc Am A Opt Image Sci Vis 15(9): 2522-
2529.
Nishi, Y., N. Hirnschall, A. Crnej, V. Gangwani, J. Tabernero, P. Artal and O. Findl (2010).
"Reproducibility of intraocular lens decentration and tilt measurement using a clinical Purkinje
meter." J Cataract Refract Surg 36(9): 1529-1535.
Noorden., G. K. V. (1985). "Burian and Von Noorden’s binocular vision and ocular motility." C. V.
Mosby St. Louis(3rd edition).
Norrby, S. (2001). "Multicenter biometry study of 1 pair of eyes." J Cataract Refract Surg 27(10):
1656-1661.
Norrby, S. (2008). "Sources of error in intraocular lens power calculation." J Cataract Refract Surg
34(3): 368-376.
Norrby, S., E. Lydahl, G. Koranyi and M. Taube (2003). "Reduction of trend errors in power
calculation by linear transformation of measured axial lengths." J Cataract Refract Surg 29(1): 100-
105.
O

Biometric measurements in the crystalline lens: Applications in cataract surgery
218
Obstbaum, S. A. and K. To (1989). "Posterior chamber intraocular lens dislocations and
malpositions." Aust N Z J Ophthalmol 17(3): 265-271.
Ohara, K., S. Kato, S. Hori and S. Kitano (2006). "Tilt and decentration of the intraocular lens
following combined vitrectomy and pars plana lensectomy." Acta Ophthalmol Scand 84(3): 388-
389.
Olsen, T. (1992). "Sources of error in intraocular lens power calculation." J Cataract Refract Surg
18(2): 125-129.
Olsen, T. (2006). "Prediction of the effective postoperative (intraocular lens) anterior chamber
depth." J Cataract Refract Surg 32(3): 419-424.
Olsen T (2004). "The Olsen formula. ." In: Shammas HJ, ed, Intraocular Lens Power Calculations.
Thorofare, NJ, Slack, : 27–40.
Olsen, T., L. Corydon and H. Gimbel (1995). "Intraocular lens power calculation with an improved
anterior chamber depth prediction algorithm." J Cataract Refract Surg 21(3): 313-319.
Olsen, T. and P. Hoffmann (2014). "C constant: new concept for ray tracing-assisted intraocular
lens power calculation." J Cataract Refract Surg 40(5): 764-773.
Ortiz-Toquero, S., G. Rodriguez, V. de Juan and R. Martin (2014). "Repeatability of placido-based
corneal topography in keratoconus." Optom Vis Sci 91(12): 1467-1473.
Ortiz, S., P. Perez-Merino, S. Duran, M. Velasco-Ocana, J. Birkenfeld, A. de Castro, I. Jimenez-
Alfaro and S. Marcos (2013). "Full OCT anterior segment biometry: an application in cataract
surgery." Biomed Opt Express 4(3): 387-396.
Ortiz, S., P. Perez-Merino, E. Gambra, A. de Castro and S. Marcos (2012). "In vivo human
crystalline lens topography." Biomed Opt Express 3(10): 2471-2488.
Ortiz, S., D. Siedlecki, L. Remon and S. Marcos (2009). "Optical coherence tomography for
quantitative surface topography." Appl Opt 48(35): 6708-6715.
Oshika, T., G. Sugita, K. Miyata, T. Tokunaga, T. Samejima, C. Okamoto and Y. Ishii (2007).
"Influence of tilt and decentration of scleral-sutured intraocular lens on ocular higher-order
wavefront aberration." Br J Ophthalmol 91(2): 185-188.
Ostrin, L., S. Kasthurirangan, D. Win-Hall and A. Glasser (2006). "Simultaneous measurements of
refraction and A-scan biometry during accommodation in humans." Optom Vis Sci 83(9): 657-665.
P
P. H. Kiely, G. S., and G. Carney (1982). "The mean shape of the human cornea." Opt. Acta
29(1027–1040 ).
Park, B., M. C. Pierce, B. Cense, S. H. Yun, M. Mujat, G. Tearney, B. Bouma and J. de Boer (2005).
"Real-time fiber-based multi-functional spectral-domain optical coherence tomography at 1.3
microm." Opt Express 13(11): 3931-3944.
Park, C. Y., J. H. Oh and R. S. Chuck (2013). "Predicting ocular residual astigmatism using corneal
and refractive parameters: a myopic eye study." Curr Eye Res 38(8): 851-861.
Pascolini, D., S. P. Mariotti, G. P. Pokharel, R. Pararajasegaram, D. Etya'ale, A. D. Negrel and S.
Resnikoff (2004). "2002 global update of available data on visual impairment: a compilation of
population-based prevalence studies." Ophthalmic Epidemiol 11(2): 67-115.
Patel, S., J. Marshall and F. W. Fitzke (1993). "Shape and radius of posterior corneal surface."
Refract Corneal Surg 9(3): 173-181.

Acknowledgments
219
Patel, S., J. Marshall and F. W. Fitzke, 3rd (1995). "Refractive index of the human corneal
epithelium and stroma." J Refract Surg 11(2): 100-105.
Perez-Escudero, A., C. Dorronsoro and S. Marcos (2010). "Correlation between radius and
asphericity in surfaces fitted by conics." J Opt Soc Am A Opt Image Sci Vis 27(7): 1541-1548.
Perez-Merino, P., J. Birkenfeld, C. Dorronsoro, S. Ortiz, S. Duran, I. Jimenez-Alfaro and S. Marcos
(2014). "Aberrometry in patients implanted with accommodative intraocular lenses." Am J
Ophthalmol 157(5): 1077-1089.
Perez-Merino, P., C. Dorronsoro, L. Llorente, S. Duran, I. Jimenez-Alfaro and S. Marcos (2013).
"In vivo chromatic aberration in eyes implanted with intraocular lenses." Invest Ophthalmol Vis Sci
54(4): 2654-2661.
Perez-Merino, P., S. Ortiz, N. Alejandre, A. de Castro, I. Jimenez-Alfaro and S. Marcos (2014).
"Ocular and optical coherence tomography-based corneal aberrometry in keratoconic eyes treated
by intracorneal ring segments." Am J Ophthalmol 157(1): 116-127 e111.
Petermeier, K., F. Gekeler, A. Messias, M. S. Spitzer, W. Haigis and P. Szurman (2009).
"Intraocular lens power calculation and optimized constants for highly myopic eyes." J Cataract
Refract Surg 35(9): 1575-1581.
Phillips, P., J. Perez-Emmanuelli, H. D. Rosskothen and C. J. Koester (1988). "Measurement of
intraocular lens decentration and tilt in vivo." J Cataract Refract Surg 14(2): 129-135.
Pierscionek, B. K. (1990). "Presbyopia - effect of refractive index." Clin. Exp. Optom. 73((1)): 23–
30.
Pierscionek, B. K. and D. Y. Chan (1989). "Refractive index gradient of human lenses." Optom Vis
Sci 66(12): 822-829.
Pomerantzeff, O., M. Pankratov, G. J. Wang and P. Dufault (1984). "Wide-angle optical model of
the eye." Am J Optom Physiol Opt 61(3): 166-176.
Preussner, P. R., J. Wahl, H. Lahdo, B. Dick and O. Findl (2002). "Ray tracing for intraocular lens
calculation." J Cataract Refract Surg 28(8): 1412-1419.
R
Rao, H. L., A. U. Kumar, A. Kumar, S. Chary, S. Senthil, P. K. Vaddavalli and C. S. Garudadri
(2011). "Evaluation of central corneal thickness measurement with RTVue spectral domain optical
coherence tomography in normal subjects." Cornea 30(2): 121-126.
Rao, S. K. and P. Padmanabhan (1998). "Posterior keratoconus. An expanded classification scheme
based on corneal topography." Ophthalmology 105(7): 1206-1212.
Resnikoff, S., D. Pascolini, D. Etya'ale, I. Kocur, R. Pararajasegaram, G. P. Pokharel and S. P.
Mariotti (2004). "Global data on visual impairment in the year 2002." Bull World Health Organ
82(11): 844-851.
Resnikoff, S., D. Pascolini, S. P. Mariotti and G. P. Pokharel (2008). "Global magnitude of visual
impairment caused by uncorrected refractive errors in 2004." Bull World Health Organ 86(1): 63-
70.
Retzlaff, J. A., D. R. Sanders and M. C. Kraff (1990). "Development of the SRK/T intraocular lens
implant power calculation formula." J Cataract Refract Surg 16(3): 333-340.
Richards, D. W., S. R. Russell and D. R. Anderson (1988). "A method for improved biometry of
the anterior chamber with a Scheimpflug technique." Invest Ophthalmol Vis Sci 29(12): 1826-1835.

Biometric measurements in the crystalline lens: Applications in cataract surgery
220
Rizzo, S., C. Basso, G. Buja, M. Valente and G. Thiene (2014). "Multifocal Purkinje-like
hamartoma and junctional ectopic tachycardia with a rapidly fatal outcome in a newborn." Heart
Rhythm 11(7): 1264-1266.
Roberts, C. (2000). "The cornea is not a piece of plastic." J Refract Surg 16(4): 407-413.
Rohart, C. and D. Gatinel (2009). "Influence of a capsular tension ring on ocular aberrations after
cataract surgery: a comparative study." J Refract Surg 25(1 Suppl): S116-121.
Roorda, A. and A. Glasser (2004). "Wave aberrations of the isolated crystalline lens." J Vis 4(4):
250-261.
Rosales, P., A. De Castro, I. Jimenez-Alfaro and S. Marcos (2010). "Intraocular lens alignment from
purkinje and Scheimpflug imaging." Clin Exp Optom 93(6): 400-408.
Rosales, P., M. Dubbelman, S. Marcos and R. van der Heijde (2006). "Crystalline lens radii of
curvature from Purkinje and Scheimpflug imaging." J Vis 6(10): 1057-1067.
Rosales, P. and S. Marcos (2006). "Phakometry and lens tilt and decentration using a custom-
developed Purkinje imaging apparatus: validation and measurements." J Opt Soc Am A Opt Image
Sci Vis 23(3): 509-520.
Rosales, P. and S. Marcos (2007). "Customized computer models of eyes with intraocular lenses."
Opt Express 15(5): 2204-2218.
Rosales, P. and S. Marcos (2009). "Pentacam Scheimpflug quantitative imaging of the crystalline
lens and intraocular lens." J Refract Surg 25(5): 421-428.
Rosales, P., M. Wendt, S. Marcos and A. Glasser (2008). "Changes in crystalline lens radii of
curvature and lens tilt and decentration during dynamic accommodation in rhesus monkeys." J Vis
8(1): 18 11-12.
Rosen, A. M., D. B. Denham, V. Fernandez, D. Borja, A. Ho, F. Manns, J. M. Parel and R. C.
Augusteyn (2006). "In vitro dimensions and curvatures of human lenses." Vision Res 46(6-7): 1002-
1009.
Rossi, L., R. Piffer, E. Turolla, B. Frigerio, P. Coumel and T. N. James (1985). "Multifocal Purkinje-
like tumor of the heart. Occurrence with other anatomic abnormalities in the atrioventricular
junction of an infant with junctional tachycardia, Lown-Ganong-Levine syndrome, and sudden
death." Chest 87(3): 340-345.
S
S Marcos, M. L.-Q., R Niembro and L N Savushkin (2005). "The pseudospin symmetry in atomic
nuclei." Journal of Physics G: Nuclear and Particle Physics 31: 10.
Salomao, M. Q., A. Esposito and W. J. Dupps, Jr. (2009). "Advances in anterior segment imaging
and analysis." Curr Opin Ophthalmol 20(4): 324-332.
Sanders, D. R. and M. L. Sanders (2007). "Visual performance results after Tetraflex
accommodating intraocular lens implantation." Ophthalmology 114(9): 1679-1684.
Sauer, T. D. (2002). "Shadowing breakdown and large errors in dynamical simulations of physical
systems." Phys Rev E Stat Nonlin Soft Matter Phys 65(3 Pt 2A): 036220.
Sauer, T. D. (2004). "Reconstruction of shared nonlinear dynamics in a network." Phys Rev Lett
93(19): 198701.
Sauer, T. D. and S. J. Schiff (2012). "Rainfall drives hydrocephalus in East Africa." Phys Rev E
Stat Nonlin Soft Matter Phys 10(3): 161-167.

Acknowledgments
221
Sawtell, N. B., A. Williams and C. C. Bell (2007). "Central control of dendritic spikes shapes the
responses of Purkinje-like cells through spike timing-dependent synaptic plasticity." J Neurosci
27(7): 1552-1565.
Scherini, E. and G. Bernocchi (1989). "Ectopic Purkinje-like cells are GABAergic:
immunohistochemistry with an immune serum against glutamic acid decarboxylase." Cell Tissue
Res 258(2): 437-439.
Schwiegerling, J., J. E. Greivenkamp and J. M. Miller (1995). "Representation of videokeratoscopic
height data with Zernike polynomials." J Opt Soc Am A Opt Image Sci Vis 12(10): 2105-2113.
Shack, R., Platt, B. (1971). "Production and use of a lenticular Hartmann screen. ." J. Opt. Soc. Am.
61(656).
Sheehan, M. T. (2012). "Eye modelling for personalised intraocular lens design." PhD thesis
Applied Optics Group, School of Physics, Science Faculty,(National University of Ireland,
Galway).
Sheppard, A. L., C. J. Evans, K. D. Singh, J. S. Wolffsohn, M. C. Dunne and L. N. Davies (2011).
"Three-dimensional magnetic resonance imaging of the phakic crystalline lens during
accommodation." Invest Ophthalmol Vis Sci 52(6): 3689-3697.
Sicam, V. A., J. Coppens, T. J. van den Berg and R. G. van der Heijde (2004). "Corneal surface
reconstruction algorithm that uses Zernike polynomial representation." J Opt Soc Am A Opt Image
Sci Vis 21(7): 1300-1306.
Siedlecki, D., A. de Castro, E. Gambra, S. Ortiz, D. Borja, S. Uhlhorn, F. Manns, S. Marcos and J.
M. Parel (2012). "Distortion correction of OCT images of the crystalline lens: gradient index
approach." Optom Vis Sci 89(5): E709-718.
Simonet, P. and M. C. Campbell (1990). "The optical transverse chromatic aberration on the fovea
of the human eye." Vision Res 30(2): 187-206.
Sinha, A. M., M. Schmidt, H. Marschang, K. Gutleben, G. Ritscher, J. Brachmann and N. F.
Marrouche (2009). "Role of left ventricular scar and Purkinje-like potentials during mapping and
ablation of ventricular fibrillation in dilated cardiomyopathy." Pacing Clin Electrophysiol 32(3):
286-290.
Sivak, J. G. and R. O. Kreuzer (1983). "Spherical aberration of the crystalline lens." Vision Res
23(1): 59-70.
Sivak, J. G. and T. Mandelman (1982). "Chromatic dispersion of the ocular media." Vision Res
22(8): 997-1003.
Smirnov, M. S. (1961). "Measurement of the wave aberration of the human eye." Biofizika 6: 776-
795.
Smolek, M. K. and S. D. Klyce (2000). "Is keratoconus a true ectasia? An evaluation of corneal
surface area." Arch Ophthalmol 118(9): 1179-1186.
Sorsby, A., B. Benjamin, J. B. Davey, M. Sheridan and J. M. Tanner (1957). "Emmetropia and its
aberrations; a study in the correlation of the optical components of the eye." Spec Rep Ser Med Res
Counc (G B) 11(293): 1-69.
Spatz, W. B. (1997). "Differences between guinea pig and rat in the dorsal cochlear nucleus:
expression of calcium-binding proteins by cartwheel and Purkinje-like cells." Hear Res 107(1-2):
136-146.
Spatz, W. B. (2003). "Purkinje-like cells in the cochlear nucleus of the Common Tree Shrew (Tupaia
glis) identified by calbindin immunohistochemistry." Brain Res 983(1-2): 230-232.
Spierer, A., Shalev, B. (2003). "Presbyopia among normal individuals." Graefes Arch Clin Exp
Ophthalmol. 241(101-105.).

Biometric measurements in the crystalline lens: Applications in cataract surgery
222
Strenk, S., Strenk, L., Koretz, J.F. (2005). "The mechanism of presbyopia. ." Prog Retin Eye Res.
24(379-393).
Strenk, S. A., J. L. Semmlow, L. M. Strenk, P. Munoz, J. Gronlund-Jacob and J. K. DeMarco (1999).
"Age-related changes in human ciliary muscle and lens: a magnetic resonance imaging study."
Invest Ophthalmol Vis Sci 40(6): 1162-1169.
Strenk, S. A., L. M. Strenk and J. L. Semmlow (2000). "High resolution MRI study of circumlental
space in the aging eye." J Refract Surg 16(5): S659-660.
Strenk, S. A., L. M. Strenk, J. L. Semmlow and J. K. DeMarco (2004). "Magnetic resonance imaging
study of the effects of age and accommodation on the human lens cross-sectional area." Invest
Ophthalmol Vis Sci 45(2): 539-545.
Strenn, K., R. Menapace and C. Vass (1997). "Capsular bag shrinkage after implantation of an open-
loop silicone lens and a poly(methyl methacrylate) capsule tension ring." J Cataract Refract Surg
23(10): 1543-1547.
Su, R., P. Ekberg, M. Leitner and L. Mattsson (2014). "Accurate and automated image segmentation
of 3D optical coherence tomography data suffering from low signal-to-noise levels." J Opt Soc Am
A Opt Image Sci Vis 31(12): 2551-2560.
Sun, M., J. Birkenfeld, A. de Castro, S. Ortiz and S. Marcos (2014). "OCT 3-D surface topography
of isolated human crystalline lenses." Biomed Opt Express 5(10): 3547-3561.
Sun, M., A. de Castro, S. Ortiz, P. Perez-Merino, J. Birkenfeld and S. Marcos (2014). "Intraocular
lens alignment from an en-face optical coherence tomography image Purkinje-like method." Optical
Engineering 53(6): 061704-061704.
Sun, M., P. Pérez-Merino, E. Martinez-Enriquez, M. Velasco-Ocana and S. Marcos (2016). "Full 3-
D OCT-based pseudophakic custom computer eye model." Biomedical Optics Express 7(3): 1074-
1088.
Sun, R. (2007). "Functions of the capsular tension ring." J Cataract Refract Surg 33(1): 4.
Susana Marcos, E. M.-E., Pablo Perez-Merino, Miriam Velasco-Ocana, Mengchan Sun (2016).
"Unraveling eye crystalline lens optics, structure and function." Optical Society of America Latin
America Optics and Photonics Conference(LTh2C. 1).
Susana Marcos , S. A. B. (2000). "On the symmetry between eyes of wavefront aberration and cone
directionality." Vision Research 40(18): 2437-2447.
Svechnikov, M. V., N. I. Chkhalo, M. N. Toropov and N. N. Salashchenko (2015). "Resolving
capacity of the circular Zernike polynomials." Opt Express 23(11): 14677-14694.
Swanson, E. A., J. A. Izatt, M. R. Hee, D. Huang, C. P. Lin, J. S. Schuman, C. A. Puliafito and J.
G. Fujimoto (1993). "In vivo retinal imaging by optical coherence tomography." Opt Lett 18(21):
1864-1866.
Szigeti, A., E. Tatrai, A. Szamosi, P. Vargha, Z. Z. Nagy, J. Nemeth, D. C. DeBuc and G. M. Somfai
(2014). "A morphological study of retinal changes in unilateral amblyopia using optical coherence
tomography image segmentation." PLoS One 9(2): e88363.
T
Tabernero, J., P. Piers, A. Benito, M. Redondo and P. Artal (2006). "Predicting the optical
performance of eyes implanted with IOLs to correct spherical aberration." Invest Ophthalmol Vis
Sci 47(10): 4651-4658.
Taketani, F., T. Matuura, E. Yukawa and Y. Hara (2004). "Influence of intraocular lens tilt and
decentration on wavefront aberrations." J Cataract Refract Surg 30(10): 2158-2162.

Acknowledgments
223
Tappin, M. J. and D. F. Larkin (2000). "Factors leading to lens implant decentration and exchange."
Eye (Lond) 14 Pt 5: 773-776.
Tearney, G. J., M. E. Brezinski, B. E. Bouma, S. A. Boppart, C. Pitris, J. F. Southern and J. G.
Fujimoto (1997). "In vivo endoscopic optical biopsy with optical coherence tomography." Science
276(5321): 2037-2039.
Thibos, L. N., R. A. Applegate, J. T. Schwiegerling, R. Webb, V. S. T. M. V. science and a. its
(2002). "Standards for reporting the optical aberrations of eyes." J Refract Surg 18(5): S652-660.
Thibos, L. N., X. Hong, A. Bradley and X. Cheng (2002). "Statistical variation of aberration
structure and image quality in a normal population of healthy eyes." J Opt Soc Am A Opt Image
Sci Vis 19(12): 2329-2348.
Thibos, L. N. and D. Horner (2001). "Power vector analysis of the optical outcome of refractive
surgery." J Cataract Refract Surg 27(1): 80-85.
Truscott, R. J. and X. Zhu (2010). "Presbyopia and cataract: a question of heat and time." Prog Retin
Eye Res 29(6): 487-499.
Tscherning, M. (1894). " Die monochromatischen Aberrationen des menschlichen Auges." Z
Psychol Physiola Sinne 6: 456-471.
U
Uhlhorn, S. R., Borja, D., Manns, F., and Parel, J. M. (2008). "Refractive index measurement of the
isolated crystalline lens using optical coherence tomography." Vision Res 48(27)(2732–2738).
Urs, R., F. Manns, A. Ho, D. Borja, A. Amelinckx, J. Smith, R. Jain, R. Augusteyn and J. M. Parel
(2009). "Shape of the isolated ex-vivo human crystalline lens." Vision Res 49(1): 74-83.
V
Venter, J. A., M. Pelouskova, B. M. Collins, S. C. Schallhorn and S. J. Hannan (2013). "Visual
outcomes and patient satisfaction in 9366 eyes using a refractive segmented multifocal intraocular
lens." J Cataract Refract Surg 39(10): 1477-1484.
Vinas, M., C. Dorronsoro, D. Cortes, D. Pascual and S. Marcos (2015). "Longitudinal chromatic
aberration of the human eye in the visible and near infrared from wavefront sensing, double-pass
and psychophysics." Biomed Opt Express 6(3): 948-962.
Vitale, S., L. Ellwein, M. F. Cotch, F. L. Ferris, 3rd and R. Sperduto (2008). "Prevalence of
refractive error in the United States, 1999-2004." Arch Ophthalmol 126(8): 1111-1119.
Von Helmholtz, H. (1909). "Helmholtz's Treatise on Physiological Optics." New York:Optical
Society of America.
W
Wang, Z., H. Jia, J. Tian, T. Soeda, R. Vergallo, Y. Minami, H. Lee, A. Aguirre, J. G. Fujimoto and
I. K. Jang (2014). "Computer-aided image analysis algorithm to enhance in vivo diagnosis of plaque
erosion by intravascular optical coherence tomography." Circ Cardiovasc Imaging 7(5): 805-810.
Weeber, H. A. and R. G. van der Heijde (2007). "On the relationship between lens stiffness and
accommodative amplitude." Exp Eye Res 85(5): 602-607.

Biometric measurements in the crystalline lens: Applications in cataract surgery
224
Weisstein, E. W. "Spherical Bessel Function of the Second Kind." MathWorld--A
WolframWebResource. http://mathworld.wolfram.com/SphericalBesselFunctionof
theSecondKind.html.
Whalen, A. J., S. N. Brennan, T. D. Sauer and S. J. Schiff (2012). "Observability of Neuronal
Network Motifs." Proc Conf Inf Sci Syst 2012.
Wojtkowski, M. (2010). "High-speed optical coherence tomography: basics and applications." Appl
Opt 49(16): D30-61.
Wojtkowski, M., T. Bajraszewski, P. Targowski and A. Kowalczyk (2003). "Real-time in vivo
imaging by high-speed spectral optical coherence tomography." Opt Lett 28(19): 1745-1747.
Wojtkowski, M., A. Kowalczyk, R. Leitgeb and A. F. Fercher (2002). "Full range complex spectral
optical coherence tomography technique in eye imaging." Opt Lett 27(16): 1415-1417.
Wolffsohn, J. S. and L. N. Davies (2007). "Advances in anterior segment imaging." Curr Opin
Ophthalmol 18(1): 32-38.
Wu, M., H. Li and W. Cheng (1998). "Determination of intraocular lens tilt and decentration using
simple and rapid method." Yan Ke Xue Bao 14(1): 13-16, 26.
X
Xing, X. J., X. Tang, H. Song and W. W. Li (2010). "[Comparison of tilt and decentration of four
different kinds of aspheric intraocular lenses implantation]." Zhonghua Yan Ke Za Zhi 46(4): 332-
336.
Xu, D., Y. Huang and J. U. Kang (2014). "Real-time dispersion-compensated image reconstruction
for compressive sensing spectral domain optical coherence tomography." J Opt Soc Am A Opt
Image Sci Vis 31(9): 2064-2069.
Y
Yu, A., Q. Wang, S. Zhu, A. Xue, Y. Su and R. Pan (2015). "[Effects of posterior chamber phakic
intraocular lens on axial length measurements]." Zhonghua Yan Ke Za Zhi 51(3): 206-209.
Yu, F., P. Chang, J. Li, Y. Zhou and Y. Zhao (2015). "[Comparative study of the tilt, decentration
and higher-order aberrations (HOA) of single-piece and 3-piece tecnis aspheric intraocular lenses]."
Zhonghua Yan Ke Za Zhi 51(4): 270-275.
Yun, S., G. Tearney, J. de Boer, N. Iftimia and B. Bouma (2003). "High-speed optical frequency-
domain imaging." Opt Express 11(22): 2953-2963.
Z
Zadnik, K., D. O. Mutti and A. J. Adams (1992). "The repeatability of measurement of the ocular
components." Invest Ophthalmol Vis Sci 33(7): 2325-2333.
Zhao, M., A. N. Kuo and J. A. Izatt (2010). "3D refraction correction and extraction of clinical
parameters from spectral domain optical coherence tomography of the cornea." Opt Express 18(9):
8923-8936.
Zuberbuhler, B. and A. J. Morrell (2007). "Errata in printed Hoffer Q formula." J Cataract Refract
Surg 33(1): 2; author reply 2-3.

Acknowledgments
225
ACKNOWLEDGMENTS
Being a PhD is both exciting and educational, but also quite demanding and fraught with
thousands of failures and reverses, and I could never have managed on my own. I therefore
wish to express my gratitude to each and every one, who helped and encouraged me in one
way or another during these 5 years of PhD study. It has been an incredible experience and
a wonderful memory.
First and foremost, I want to send many warm thanks to is my supervisor Prof. Susana
Marcos, for offering the great opportunity to work in Visual Optics and Biophotonics
(VioBio) Lab, in particular, her strong involvement in this PhD research, her invaluable
guidance during those five years, and her impressive dedication to science. I am so proud
to be a member of VioBio Lab, work with all lovely lab members and have the privilege of
meeting many people: physicists, chemists, optometrists, ophthalmologists, biologists,
electrical and mechanical engineers!
My acknowledgements to OpAL-Marie Curie ITN funding that supported my first three
years of stay in Madrid, and the travels to the annual meetings and conferences. I am
indebted to Prof. Frank Schaeffel at the Laboratory of University Hospital Tübingen
(Tübingen, Germany), Prof. Ioannis Pallikaris and Prof. Harilaos Ginis atthe Laboratory
of Optics and Imaging in the premises of the Department of Medicine (Crete, Greek), Prof.
Linda Lundström and Prof. Peter Unsbo at the Laboratory of Applied Physics/ Biomedical
and X-Ray Physics in AlboNova University center (Stockholm, Sweden),and Prof. Pablo
Perez Artal at the University of Murcia in the Research Center for Optics and Nanophysics
(Murcia, Spain), for valuable training courses, scientific discussions and collaborations.
Thanks to Instituto de Óptica (IO), CSIC, especially to D. Eloy Belda San Mateo and D.
José Luis Revuelta Gonzalez, for providing a productive environment with great assistance
in these five years, Fundación Jiménez Díaz Hospital (FJD), specially to Dr. Sonia Durán
for providing volunteer subjects participating in the measurements and supports from
IOBA-Universidad de Valladolid and Univerisity of Miami/ Bascom Palmer Eye Institute,
specially Prof. José Miguel Maldonado López and Prof. Fabrice Manns are also
acknowledged.
My heartfelt thanks to Alberto de Castro, who is like a co-supervisor in both research work
and otherwise, with plenty of patience and guidance, since the first day I worked in VioBio.
Of course, he is the first reviewer of this thesis as well. Although he left the lab one year
after I joined, we still keep in touch by email to share informal discussions of projects, and
to relieve helplessness and stress when I met project bottlenecks. I am also thankful to Lucie
Sawides. You guys are such a lovely couple. I felt that you are always sharing my daily life
in email, and especially thanks for your wedding wish record in Chinese. How touching it
was!
A special mention about our current OCT team members: Pablo Perez, Eduardo Martinez
Enriquez and Mirian Velasco. Pablo is more than a work partner, he is like a family member
with an infectious optimistic attitude in the face of any problem, with unquantifiable

Biometric measurements in the crystalline lens: Applications in cataract surgery
226
support and suggestions of solutions, no matter whether in work or in life (such as helping
me review the manuscripts, rehearsing the presentations, eyewitness my wedding ceremony
in Shanghai and let me eyewitness your wedding as well, etc.) Eduardede, thanks for
helping me process OCT images, which is the first and key step in the whole thesis research.
Although you always have crazy and incomprehensible whimsy, the lab is full of laughing,
relaxation and pleasure owning to you. Mirian Velasco, owning to my poor Spanish, we
did not communicate a lot at the beginning except working, but our relationship grew closer
and closer after the invitations and attendances of your wedding and “after work workshop“.
Judith Birkenfeld and Sergio Ortiz Egea are ex OCT team members, both of you had
brilliant careers after your left. I learned rigor, as a famous German character, from Judith,
who offered invaluable helps in those five years and thanks to Sergio, who is the largest
contributor in the OCT lab for the OCT image processing. I could not finish this thesis
research without your contribution.
Many warm thanks go to James A Germann. Although we met about one year ago, I feel
like we are very old and close friends. I am shy and dumb as an oyster, but your enthusiasm
gives me great inspiration! I very much enjoyed sharing our thoughts, and learning new
things from you every day! James A Germann did all the English spelling and grammar
correction of this thesis using his busy time under high pressure projects. I do not know
how to express my appreciation, but I know that I could not graduate without you! He is
also one of brave members in the China adventure trip for my wedding, with Maria Viñas
Peña, Rocío Gutiérrez Contreras, and Clara Benedi Carcia. Maria is the best example of
working hard in research in Viobio, and I am so proud of you. I learned organizational
skills, eloquence, serious attitude from the IOSA student chapter under her, Andres de la
Hoz Duran and Mario's sponsorship and feel honor to be invited her wedding as well.
Thanks Rocío and Clara for invitations of family lunches, which cured my home-sickness
a lot. Clara even teaches me how to swim with her after work, at personal cost and with
great patience. What's more, we have had a lot of travel memories together (Granada trip
with Rocío and James, Zaragoza trip with Clara, Rocío, and James, ARVO trips with
Maria, IOSA with you all, etc.). I have enjoyed every moment of your company during
those trips. Thanks to you four, for taking our friendship outside of CSIC.
Another unforgettable person I need to say thanks to is Aiswaryah Radhakrishnan, who is
another OpAL fellowship in the Lab. We shared almost all our PhD lives together with
each annual meetings, conferences, training, scientific / non-scientific trips, and of course,
Office 301 as well. Thanks so much for thoughtful comments and inquisitive suggestions
of project results. You could always be counted on whenever I need Spanish translations
and help for any trivial and daily thing. I am also much grateful to Enrique Bustos, Nohelia
morales, Aida Llera, and Carmen Fernandezfor guiding me through all the paperwork
(ARVO registrations, homologations, NIE extensions or contract extensions, etc.)
Thanks to Nandor Bekesi, Vyas Akondi, Enrique Gambra, Carlos Dorronsoro, Alvaro
Sanchez-Lozano, Daniel Pascual, Nicolas Alejandre Alba, Sergio Barbero, Javier Portilla,
etc, for your helpful suggestions, discussions, assistances and humor through all these years
in so many things. It is being an unbelievable asset for me.

Acknowledgments
227
Thanks to my family (孙国平, 张菊萍, 郑俭, and 沈璐琳), my husband (郑哲). You are
one of the central pillars of my life and sustain who I am and who I want to be, supporting
me without any grumble and enduring long separation and my friends (王莉, 杨起帆, 柏
园雅,Alejandro Garcia Ruiz, 力祎, 韩夏, 张松丽, 江小松, 郭霄, and 陈未亚)
and who I have not mentioned here but did any form of help to me. All of you are my
powerful spiritual pillar to support me.
This thesis research was funded by the following grants, in which Prof. Susana Marcos
was the Principal Investigator: This study has been funded by Spanish Government Grant
FIS2011-25637 and European Research Council ERC-2011 AdG-294099 "Bio-inspired
optical correction of presbyopia" to S. Marcos, and Marie Curie Actions-Networks of Initial
Training (ITN) FP7-PEOPLE-2010-ITN 264605 (OpAL-Optical and adaptational limits of
vision). We acknowledge the collaborative agreement “Unidad Asociada Tecnología e
Innovación sanitaria en Oftalmología” (IIS Fundación Jiménez Díaz / IO-CSIC).
最后,要把我最最珍贵的感谢送给我最亲爱的父母。在过去的 20 多年里, 无论我在
上海 , 荷兰, 瑞典, 还是西班牙,感谢你们都无微不至地支持,照顾和鼓励。 在
过去 8年多的 3,000 多个日日夜夜, 我一直在遥远的欧洲思念着你们。
Thank you all from heart!!
Muchas sinceros agradecimientos a todos!!!
FIS2008-02065, FIS2011-25637
ERC-2011 AdG-294099 "Bio-inspired optical
correction of presbyopia"
FP7-PEOPLE-2010-ITN 264605. Marie Curie
Actions—Networks for Initial Training (ITN). OpAL—Optical
and adaptational limits of vision.
JAE Program
Fellowship

Biometric measurements in the crystalline lens: Applications in cataract surgery
228

229

Biometric measurements in the crystalline lens: Applications in cataract surgery
230