Memphis Water: A Community Treasure Water Quality Report … 2015_final.pdf · A Community Treasure...
8
Memphis Water: A Community Treasure Water Quality Report 2015 Great tasting. Purified by nature. Your drinking water has a long and storied journey to your tap. Its trip begins deep underground in artesian wells. ere, the water has been naturally sand-filtered, for nearly 2,000 years, by an aquifer system that can go as far as 2,600 feet below Memphis’ ground surface. Like eco-guardians of this treasured natural resource, clay strata layers serve as a barrier to protect our water aſter the filtering process. (See Figure 1). e result: drinking water absent of contaminants oſten found in other water sources, and that is minimally treated. is gives the water at your tap the a-h-h factor; a pleasant, refreshing taste. It’s more than just good tasting; MLGW’s Water Quality Assurance Laboratory ensures our water’s quality and safety through a battery of tests (close to 40,000 a year). Memphis Light, Gas and Water is proud to present its 2015 Water Quality Report, which includes required information about the testing, monitoring and treat- ment of our drinking water. In 2015, as years before, Memphis water met or exceeded Environmental Protection Agency (EPA) standards. is Water Quality Report guides you, the consumer, through required monitoring results and information on common contaminants that can be found in drinking water, including bottled water. Drinking water, including bottled water, may reasonably be expected to contain at least small amounts of some contaminants. e presence of contaminants does not necessarily pose a health risk. More information about contaminants and potential health effects can be obtained by calling the EPA’s Safe Drinking Water Hotline at 800.426.4791. e EPA and the Tennessee Department of Environment and Conservation (TDEC) have asked all public water sup- pliers, including MLGW, to include the following language in their Water Quality Reports for your general knowledge: Fort Pillow Sand Aquifer 2500’ Aquifer 500’ Memphis Aquifer Mississippi River Alluvium Alluvium Loess & Terrace Deposits Clay Clay Clay Clay Bedrock Coffee Sand Aquifer Figure 1
-
Upload
trinhthien -
Category
Documents
-
view
213 -
download
0
Transcript of Memphis Water: A Community Treasure Water Quality Report … 2015_final.pdf · A Community Treasure...

Memphis Water: A Community TreasureWater Quality Report 2015Great tasting. Purified by nature.Your drinking water has a long and storied journey to your tap. Its trip begins deep underground in artesian wells. There, the water has been naturally sand-filtered, for nearly 2,000 years, by an aquifer system that can go as far as 2,600 feet below Memphis’ ground surface. Like eco-guardians of this treasured natural resource, clay strata layers serve as a barrier to protect our water after the filtering process. (See Figure 1). The result: drinking water absent of contaminants often found in other water sources, and that is minimally treated. This gives the water at your tap the a-h-h factor; a pleasant, refreshing taste. It’s more than just good tasting; MLGW’s Water Quality Assurance Laboratory ensures our water’s quality and safety through a battery of tests (close to 40,000 a year).
Memphis Light, Gas and Water is proud to present its 2015 Water Quality Report, which includes required information about the testing, monitoring and treat-ment of our drinking water. In 2015, as years before, Memphis water met or exceeded Environmental Protection Agency (EPA) standards. This Water Quality Report guides you, the consumer, through required monitoring results and information on common contaminants that can be found in drinking water, including bottled water.
Drinking water, including bottled water, may reasonably be expected to contain at least small amounts of some contaminants. The presence of contaminants does not necessarily pose a health risk. More information about contaminants and potential health effects can be obtained by calling the EPA’s Safe Drinking Water Hotline at 800.426.4791.
The EPA and the Tennessee Department of Environment and Conservation (TDEC) have asked all public water sup-pliers, including MLGW, to include the following language in their Water Quality Reports for your general knowledge:
Fort Pillow Sand Aquifer
2500’ Aquifer
500’ Memphis Aquifer
Mississippi River Alluvium
Alluvium
Loess & Terrace Deposits
Clay
Clay
Clay
Clay
BedrockCoee Sand Aquifer
Figure 1

2 Memphis Light, Gas and Water Division | 2015 Water Quality Report
The sources of drinking water (both tap water and bottled water) include rivers, lakes, streams, ponds, reservoirs, springs and wells. As water travels over the surface of the land or through the ground, it dissolves naturally-occurring minerals and, in some cases, ra-dioactive material, and can pick up substances resulting from the presence of animals or human activity.
In order to ensure that tap water is safe to drink, EPA and TDEC prescribe regulations which limit the amount of certain contaminants in water provided by public water systems. Food and Drug Administration (FDA) regulations establish limits for contaminants in bottled water which must provide the same protection for public health.
Some people may be more vulnerable to contaminants in drinking water than the general population. Im-muno-compromised individuals such as people with cancer undergoing chemotherapy, people who have undergone organ transplants, people with HIV/AIDS or other immune system disorders, some elderly, and infants can be particularly at risk from infections. These people should seek advice about drinking water from their health care providers. EPA/CDC guidelines on appropriate means to lessen the risk of infection by Cryptosporidium and other microbial contaminants are available from the Safe Drinking Water Hotline at 800.426.4791.
Source water and wellhead protectionAn explanation of Tennessee’s Source Water Assessment Program, the Source Water Assessment summaries, susceptibility scorings, and the overall TDEC report to the EPA can be viewed online at: tn.gov/environment/topic/wr-wq-water-quality.
Finished WaterReservoir
Pump
Distribution Mains
Residential Commercial Industrial
The Treatmentand Distribution
ProcessSandFilter
500’ Well
ElectricPump
TheAerationProcess
Contaminants that may be present in source water:
Photo Credit: University of Memphis CAESER (Center for Applied Earth Science and Engineering Research). The department sponsors Water On Wheels (memphis.edu/wateronwheels).WOW is a mobile learning experience focused on the science of water.
• Microbial contaminants, such as viruses and bacteria, which may come from sewage treatment plants, septic systems, agricultural livestock operations and wildlife.
• Inorganic contaminants, such as salts and metals, which can be naturally-occurring or result from urban storm runoff, industrial, or domestic wastewater discharges, oil and gas production, mining or farming.
• Pesticides and herbicides, which may come from
a variety of sources such as agriculture, urban storm water runoff, and residential uses.
• Organic chemical contaminants, including synthetic and volatile organic chemicals, which are by-products of industrial processes and petroleum production, and can also come from gas stations, urban storm water runoff, and septic systems.
• Radioactive contaminants, which can be naturally-occurring or be the result of oil and gas production and mining activities.

32015 Water Quality Report | Memphis Light, Gas and Water Division
For more information about your drinking water, please contact MLGW’s Customer Care Center at 901.544.6549, 7 a.m.-7p.m., Monday-Friday.
To view this report online, visit: mlgw.com/waterquality or you can request a hard copy by calling 901.320.3950. You can email your comments to us at: [email protected].
En españolInformación para personas de habla hispana: Este reporte contiene información muy importante sobre su agua potable. Hágalo traducir o pida que se lo lea alguien que lo entienda bien. O mejor aún, lea la versión en español en nuestro sitio de red, mlgw.com.
MLGW’s wellhead protection plan and source water assessment are available for public review by calling Odell Johnson, P.E., Manager, Water Engineering and Operations, at 901.320.3939, 7:30 a.m.- 4 p.m., Monday-Friday.
For more information on groundwater protection, call the EPA at 800.490.9198 to request a copy of the EPA’s Citizen’s Guide to Ground Water Protection or view it online at: epa.gov/sites/production/files/2015-10/ documents/2006_08_28_sourcewater_guide_ citguidegwp_1990.pdf.
Unregulated Contaminant Monitoring RuleThe EPA requires MLGW to participate in the Unreg-ulated Contaminant Monitoring Rule (UCMR). This testing identifies chemical contaminants in drinking water that may require future regulation.
Opportunities to discuss water quality issuesMLGW holds meetings of its Board of Commissioners, which are open to the public, on the first and third Wednesdays of each month at 1 p.m. The meetings are held in MLGW’s Administration Building, 220 South Main Street, Memphis, TN.
Public meetings are also held periodically by the Shelby County Groundwater Control Board. For more information on the time and location of future meetings, please call Greg Parker, Supervisor, Water Quality Section, Shelby County Health Department, 901.222.9599.
Photo Credit: University of Memphis CAESER (Center for Applied Earth Science and Engineering Research). The department sponsors Water On Wheels (memphis.edu/wateronwheels).WOW is a mobile learning experience focused on the science of water.
MLGW booth at the Memphis Redbirds' Education Day at Autozone Park.

4 Memphis Light, Gas and Water Division | 2015 Water Quality Report
Fluoride ReductionFluoridation has been successfully practiced in the United States since the mid-1900s. Memphis Light, Gas and Water began adding fluoride to the water supply according to mandates set by a City of Memphis Ordinance at a concentration of 1.0 ppm. In December 2010, the U.S. Depart-ment of Health and Human Services (HHS) proposed through the Center for Disease Control and Prevention that the fluoride level recommend-ed for drinking water be set at 0.7 mg/L. The Rules of the Tennessee Department of Environment and Conservation made this same recommen-dation. MLGW accepted the recommendation and changed the fluoride content in the finished water from 1.0 mg/L to 0.7 mg/L in 2013.
RESULTS OF INORGANIC ANALYSES
Component Average Amount Detected
Maximum Contaminant Level
(MCL)
Maximum Contaminant Level
Goal (MCLG)
Range of Levels Detected
Major Sources in Drinking Water
FLUORIDE 0.6 parts per million
4.0 parts per million
4.0 parts per million
0.4 - 2.4 parts per million
Erosion of natural deposits; water additive which promotes strong teeth; discharge from fertilizer and aluminum factories.
NITRATE as Nitrogen (N)
0.16 parts per million
10.0 parts per million
10.0 parts per million
BDL - 0.39parts per million
Erosion of natural deposits; leaching from septic tanks; sewage; runoff from fertilizer use.
SODIUM * 9.7 parts per million Not applicable Not applicable
6.1 - 11.5parts per million
Naturally present in the environment.
Results surpass state and federal drinking water regulations.
2015 Water Quality Table

52015 Water Quality Report | Memphis Light, Gas and Water Division
Lead and CopperPlumbing materials could contribute to lead and copper levels at the tap. There isn't any detectable lead in Memphis’ source water. Regarding copper, very low levels of this metal occur naturally. Standing water in pipes for six hours or more along with lead or lead component plumbing may yield low levels of lead at the tap. It is rare that the lead levels exceed the action level. Depending on the specific circumstances, copper levels at the tap may be high.
If present, elevated levels of lead can cause serious health problems, especially for pregnant women and young children. Lead in drinking water is primarily from materials and components associated with service lines and home plumbing. Memphis Light, Gas and Water is responsible for providing high-quality drinking water, but cannot control the variety of materials used in plumbing components. When your water has been sitting for several hours, you can minimize the potential for lead exposure by flushing your tap for 30 seconds to two minutes before using water for drinking or cooking. If you are concerned about lead in your water, you may wish to have your water tested. Information on lead in drinking water, testing methods and steps you can take to minimize exposure is available from the Safe Drinking Water Hotline or at water.epa.gov/drink/info/lead/index.cfm.
RESULTS OF LEAD AND COPPER SAMPLING AT RESIDENTIAL WATER TAPS
Component Amount Detected
Maximum Contaminant Level
(MCL)
Maximum Contaminant Level
Goal (MCLG)
Sites Exceeding
Action Level
Major Sources in
Drinking Water
LEAD 8.63 parts per billion (90% of homes tested had lead levels less than 8.63 ppb)
Action Level = 90% of the homes tested must have lead levels less than 15 parts per billion
Zero parts per billion 3 sites of 50 exceeded AL
Corrosion of household plumbing systems; erosion of natural deposits.
COPPER 0.33 parts per million (90% of homes tested had copper levels less than 0.33 ppm)
Action Level = 90% of the homes tested must have copper levels less than 1.3 parts per million
1.3 parts per million 0 sites of 50 exceeded AL
Corrosion of household plumbing systems; erosion of natural deposits; leaching from wood preserva-tives.
Disinfection By-ProductsDisinfection is an absolutely essential component of drinking water treatment. Disinfection prevents the occurrence and spread of many serious and potentially deadly water-borne diseases. When chlorine is used for disinfection, it can react with naturally-occurring organic matter in the water. Minute amounts of disinfection by-products can be formed as a consequence of these reactions.
As a result, regulations limit the amount of disinfection by-products in your water. Two categories of disinfection by-products are specifically limited by these regulations: Total Trihalomethanes and Haloacetic Acids. These by-products must be reported to the state of Tennessee annually. Averages are calculated quarterly on samples taken at various locations through our distribution system. As the table above shows, our water meets the disinfection by-products standards.
RESULTS OF DISINFECTION BY-PRODUCTS
Component Average Amount Detected
Maximum Contaminant Level
(MCL)
Maximum Contaminant Level
Goal (MCLG)
Range of Amount Detected
Major Sources in Drinking Water
TOTAL TRIHALOMETHANES
**10 parts per billion
80 parts per billion Not applicable
2 - 12 parts per billion
By-products of drinking water disinfection.
HALOACETIC ACIDS (HAA5)
**1.3 parts per billion
60 parts per billion Not applicable
<1 - 2parts per billion
By-products of drinking water disinfection.
CHLORINE 1.0 parts per million
MRDL - 4.0 parts per million
MRDLG – 4.0 parts per million
0.3 - 2.1parts per million
Water additive used to control microbes.
Results surpass state and federal drinking water regulations.
6 Memphis Light, Gas and Water Division | 2015 Water Quality Report
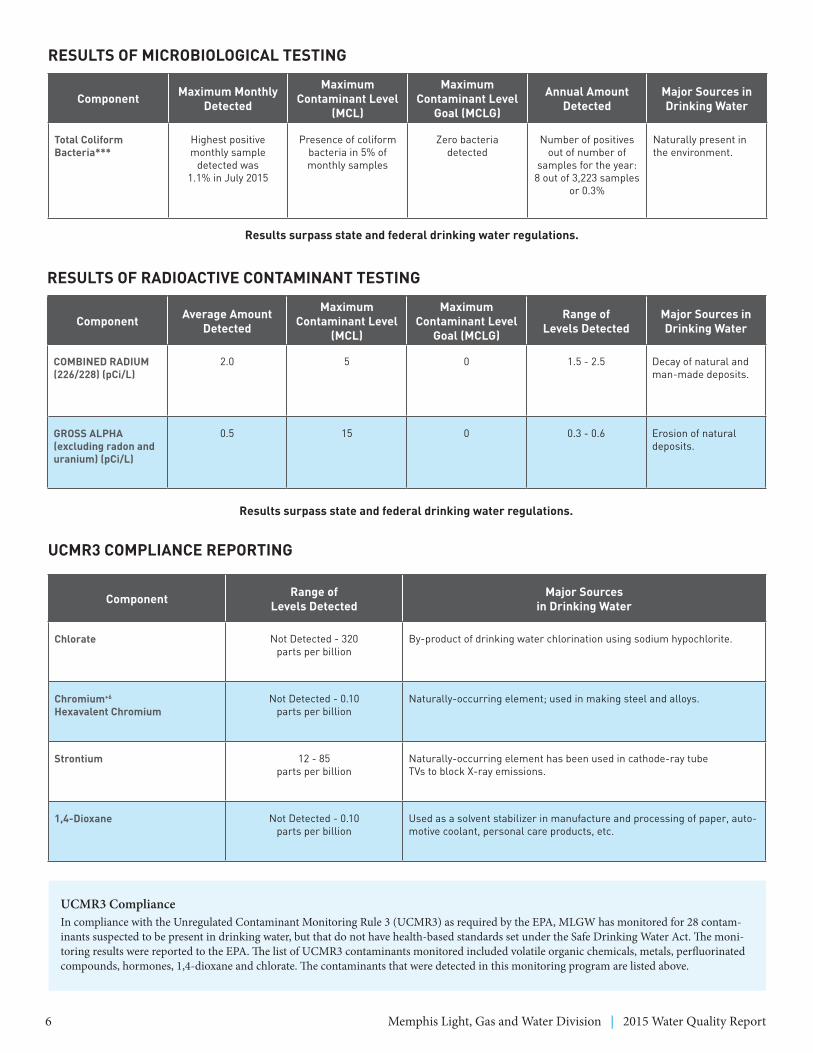
UCMR3 COMPLIANCE REPORTING
Component Range of Levels Detected
Major Sources in Drinking Water
Chlorate Not Detected - 320 parts per billion
By-product of drinking water chlorination using sodium hypochlorite.
Chromium+6 Hexavalent Chromium
Not Detected - 0.10 parts per billion
Naturally-occurring element; used in making steel and alloys.
Strontium 12 - 85 parts per billion
Naturally-occurring element has been used in cathode-ray tube TVs to block X-ray emissions.
1,4-Dioxane Not Detected - 0.10 parts per billion
Used as a solvent stabilizer in manufacture and processing of paper, auto-motive coolant, personal care products, etc.
RESULTS OF RADIOACTIVE CONTAMINANT TESTING
Component Average Amount Detected
Maximum Contaminant Level
(MCL)
Maximum Contaminant Level
Goal (MCLG)
Range of Levels Detected
Major Sources in Drinking Water
COMBINED RADIUM (226/228) (pCi/L)
2.0 5 0 1.5 - 2.5 Decay of natural and man-made deposits.
GROSS ALPHA (excluding radon and uranium) (pCi/L)
0.5 15 0 0.3 - 0.6 Erosion of natural deposits.
Results surpass state and federal drinking water regulations.
RESULTS OF MICROBIOLOGICAL TESTING
Component Maximum Monthly Detected
Maximum Contaminant Level
(MCL)
Maximum Contaminant Level
Goal (MCLG)
Annual Amount Detected
Major Sources in Drinking Water
Total Coliform Bacteria***
Highest positive monthly sample
detected was 1.1% in July 2015
Presence of coliform bacteria in 5% of monthly samples
Zero bacteria detected
Number of positives out of number of
samples for the year:8 out of 3,223 samples
or 0.3%
Naturally present in the environment.
Results surpass state and federal drinking water regulations.
UCMR3 ComplianceIn compliance with the Unregulated Contaminant Monitoring Rule 3 (UCMR3) as required by the EPA, MLGW has monitored for 28 contam-inants suspected to be present in drinking water, but that do not have health-based standards set under the Safe Drinking Water Act. The moni-toring results were reported to the EPA. The list of UCMR3 contaminants monitored included volatile organic chemicals, metals, perfluorinated compounds, hormones, 1,4-dioxane and chlorate. The contaminants that were detected in this monitoring program are listed above.

72015 Water Quality Report | Memphis Light, Gas and Water Division
NON-DETECTED PARAMETERS OF INTERESTAs part of MLGW’s commitment to the safety of Memphis’ drinking water, the following parameters were monitored, but not detected.
UCMR3Bromochloromethane, Bromomethane, 1,3-Butadiene, Chlorodifluoromethane, Chloromethane, 1,1-Dichloroethane, 1,2,3-Trichloropropane, Perfluorobutanesulfonic Acid (PFBS), Perfluoroheptanoic Acid (PFHpA), Perfluorohexanesulfonic Acid (PFHxS), Perfluorononanoic Acid (PFNA), Perfluorooctane Sulfonate (PFOS), Perfluorooctanoic Acid (PFOA), 4-Androstene-3,17-dione, Equilin, 17-B-Estradiol, Estriol, Estrone, 17-alpha-Ethynyl estradiol, Testosterone, Chromium, Cobalt, Molybdenum and Vanadium
VOLATILE ORGANIC COMPOUNDSBenzene, Carbon Tetrachloride, 1,2-Dichloroethane, o-Dichlorobenzene, p-Dichlorobenzene, 1,1-Dichloroethylene, cis-1,2-Dichloroethylene, trans-1,2-Dichloroethylene, Dichloromethane, 1,2-Dichloropropane, Ethylbenzene, Monochlorobenzene, Styrene, Tetrachloroethylene, Toluene, 1,2,4-Trichlorobenzene, 1,1,1-Trichloroethane, 1,1,2-Trichloroethane, Trichloroethylene, o-Xylene, m,p-Xylenes, Chloromethane, Bromomethane, Chloroethane, Dibromomethane, 1,1-Dichloropropene,1,3-Dichloropropane, 1,3- Dichloropropene, 1,2,3-Trichloropropane, 2,2-Dichloropropane, O-Chlorotoluene, P-Chlorotoluene, M-Dichlorobenzene, 1,1-Dichloroethane, 1,1,1,2-Tetrachloroethane, 1,1,2,2-Tetrachloroethane, Bromobenzene, Vinyl Chloride
SYNTHETIC ORGANIC COMPOUNDSAlachlor, Atrazine, Picloram
ADDITIONAL WATER QUALITY PARAMETERS OF INTERESTThis table shows levels of additional water quality parameters which are often of interest to our customers. Values shown are averages from our water treatment plants for 2015. There are no health-based limits for these substances in drinking water.
Parameter (unit of measure)
Average Level Detected
Range of Levels Detected
Typical Source of Contaminants
Alkalinity (ppm) 55 19 - 159 Erosion of natural deposits.
Calcium (ppm) 9.1 2.3 - 26.9 Erosion of natural deposits.
Chloride (ppm) 4.2 2.2 - 6.8 Erosion of natural deposits.
Hardness (ppm) 49 15 - 152 Erosion of natural deposits.
Hardness (grains/gallon) 2.9 0.9 - 8.9 Erosion of natural deposits.
Iron (ppm) 0.04 0.01 - 0.13 Naturally occurring.
pH (Standard) 7.2 6.9 - 7.7 -------
Phosphate (ppm) 1.1 0.5 - 2.3 Water additive for corrosion control.
Sulfate (ppm) 20.8 15.8 - 27.2 Naturally present in the environment.
Temperature (°F) 64.9 56.3 - 70.5 -------

8 Memphis Light, Gas and Water Division | 2015 Water Quality Report
TERMS USED IN THIS REPORT
To protect public health, state and federal agencies set maximum contaminant levels, maximum contaminant level goals or action levels for contami-nants. Below are definitions of terms used in this report to help you understand the 2015 results.
Action level The concentration of a contaminant that, if exceeded, triggers a treatment or other requirement that a water system must follow.
Below detection limit (BDL) The concentration of a compound is less than the smallest amount that can be measured by the test method used.
Maximum contaminant level (MCL) The highest level of a contaminant allowed in drinking water. MCLs are set as close to MCL goals as feasible using the best available treatment technology.
Maximum contaminant level goal (MCLG) The level of a contaminant in drinking water below which there is no known or expected risk to health. MCLGs allow for a margin of safety.
mg/L or ppm Milligrams per liter or parts per million (one penny in $10,000)
µg/L or ppb Micrograms per Liter or parts per billion (one penny in $10,000,000)
pci/L Picocuries per Liter
Maximum residual disinfectant level goal (MRDLG) The level of drinking water disinfectant below which there is no known or expected risk to health. MRDLGs do not reflect the benefits of the use of disinfectants to control microbial contaminants.
Maximum residual disinfectant level (MRDL) The highest level of a disinfectant allowed in drinking water. There is convincing evidence that addition of a disinfectant is necessary for the control of microbial contaminants.
Treatment technique A required process intended to reduce the level of a contaminant in drinking water.
Water Quality Table Footnotes
* There is no state or federal MCL for sodium. Monitoring is required to provide information to consumers and health officials who are concerned about sodium intake due to dietary precautions. If you are on a sodium-restricted diet, you should consult a physician about the level of sodium in the water.
** Data expressed as LRAA – Locational Running Annual Average: The average of four consecutive quarterly results at each monitored sample location.
*** For the highest monthly level detected, there were only eight positive samples out of 3,223 samples taken. MLGW immediately responded by resampling above, at and below where the positive samples had been collected, and all the results were negative.
04/16/OD/5M