MEMORANDUM RM-3650-PR AUGUST 1963 REVIEW AND … · Review and Analysis of...
96
MEMORANDUM RM-3650-PR AUGUST 1963 REVIEW AND ANALYSIS OF CUMULATIVE-FATIGUE-DAMAGE THEORIES Lloyd Kaechele
Transcript of MEMORANDUM RM-3650-PR AUGUST 1963 REVIEW AND … · Review and Analysis of...
MEMORANDUM
RM-3650-PR AUGUST 1963
REVIEW AND ANALYSIS OF CUMULATIVE-FATIGUE-DAMAGE
THEORIES Lloyd Kaechele

Report Documentation Page Form ApprovedOMB No. 0704-0188
Public reporting burden for the collection of information is estimated to average 1 hour per response, including the time for reviewing instructions, searching existing data sources, gathering andmaintaining the data needed, and completing and reviewing the collection of information. Send comments regarding this burden estimate or any other aspect of this collection of information,including suggestions for reducing this burden, to Washington Headquarters Services, Directorate for Information Operations and Reports, 1215 Jefferson Davis Highway, Suite 1204, ArlingtonVA 22202-4302. Respondents should be aware that notwithstanding any other provision of law, no person shall be subject to a penalty for failing to comply with a collection of information if itdoes not display a currently valid OMB control number.
1. REPORT DATE AUG 1963 2. REPORT TYPE
3. DATES COVERED 00-00-1963 to 00-00-1963
4. TITLE AND SUBTITLE Review and Analysis of Cumulative-Fatigue-Damage Theories
5a. CONTRACT NUMBER
5b. GRANT NUMBER
5c. PROGRAM ELEMENT NUMBER
6. AUTHOR(S) 5d. PROJECT NUMBER
5e. TASK NUMBER
5f. WORK UNIT NUMBER
7. PERFORMING ORGANIZATION NAME(S) AND ADDRESS(ES) Rand Corporation,1776 Main Street, PO Box 2138,Santa Monica,CA,90407-2138
8. PERFORMING ORGANIZATIONREPORT NUMBER
9. SPONSORING/MONITORING AGENCY NAME(S) AND ADDRESS(ES) 10. SPONSOR/MONITOR’S ACRONYM(S)
11. SPONSOR/MONITOR’S REPORT NUMBER(S)
12. DISTRIBUTION/AVAILABILITY STATEMENT Approved for public release; distribution unlimited
13. SUPPLEMENTARY NOTES
14. ABSTRACT
15. SUBJECT TERMS
16. SECURITY CLASSIFICATION OF: 17. LIMITATION OF ABSTRACT Same as
Report (SAR)
18. NUMBEROF PAGES
95
19a. NAME OFRESPONSIBLE PERSON
a. REPORT unclassified
b. ABSTRACT unclassified
c. THIS PAGE unclassified
Standard Form 298 (Rev. 8-98) Prescribed by ANSI Std Z39-18
MEMORANDUM
RM-3650-PR AUGUST 1963
REVIEW AND ANALYSIS OF CUMULATIVE-FATIGUE-DAMAGE
THEORIES
Thi~ rt>~rarch i~ spon,-orrd hy the Lnited States Air Force under Project RA\"D
contract ~o. AF 49!638)-700 monitored by the Dirrctorate of Development Planning. Deputy Chief of Staff, Hesearch and Drvelopment. Hq LSAF. Views or conclusions lOntainPd in thi,- :\lrmorandum should not hP interprrtf.'d as repre~rnting thr official
opinion or policy of the L:nitrd Statr,- Air Forrr.
Lloyd Kaechele
----------7~ Q.U rl De~1~ut~ ~100 MAIN Sl • ~.ANI A MONICA • (.AllfOINI.A ---------

-iii-
PREFACE
As the stress changes in an aircraft (or any other) structure,
changes also occur in the material of the structure. Some stress
changes or cycles are large enough to cause some amount of fatigue
damage, even though this damage is not ordinarily discernible.
There are three main problem areas in designing aircraft struc
tures so that the accumulation of fatigue damage does not threaten
safety--evaluation of cumulative damage; predicting and describing
the fatigue-producing stress variations that will be experienced; and
accounting for the wide scatter in fatigue life that is observed for
seemingly identical test specimens and structures.
The first, cumulative damage, arises because stress cycles in
aircraft structures vary so greatly in size, number, and order that
it is a practical impossibility to make enough tests to cover all
variations. Therefore, fatigue damage caused by the many different
stress cycles must be evaluated by adding up the effects of individual
cycles. If we understood well enough the physical processes going on
in a material during each stress cycle, this addition, or determina
tion of cumulative effects, would be no problem. Lacking this under
standing, evaluation of cumulative damage rests on theoretical methods,
related in varying degree to the physical process of fatigue and to
experiment.
This Memorandum presents an investigation of the basic concepts
of cumulative damage and of several current cumulative-fatigue-damage
theories.


-v-
SUMMARY AND CONCLUSIONS
This Memorandum contains the results of a study of cumulative
fatigue damage, The first part of the study investigates the general,
basic foundation of this subject, The main conclusions of this phase
of the study are these:
What fatigue damage is, how it can be measured, and how it grows as a result of the stresses experienced by aircraft are questions that can not be adequately answered today. (However, an opportunity for important advances may exist in utilization of microscopic observation techniques in the study of cumulative fatigue damage.)
Until a sound physical basis is established, evaluation of cumulative fatigue damage must depend on theories,
This Memorandum shows that there are certain key assumptions
which can be identified in current theories, These assumptions de
termine general trends in the structural weight required to provide
a satisfactory fatigue life when a particular theory is used for
fatigue-preventive design of a flight structure.
The key assumptions have to do with the way fatigue damage is
assumed to occur at different stress amplitudes when they are applied
alone and when they are mixed with other stress amplitudes (as is
the case in aircraft). In terms of these assumptions
Cumulative-fatigue-damage theories can be stress-dependent or stress-independent, That is, the amount of fatigue damage produced by a specified fraction of the number of cycles that would produce failure can be the same for all stress amplitudes (stress-independence) or different (stress-dependence).
There can be interaction or interaction-free theories. The course of damage at one stress amplitude may be changed by applying other stress amplitudes (interaction), or it may be unaffected (interaction-free).
As a basis of comparison of cumulative-damage theories, Miner's
theory has the advantages of simplicity and familiarity. It simply
states that when a mixture of stress amplitudes is applied, fatigue
failure will occur when the fractions of life expended at each stress
amplitude add up to one. The fraction of life expended at any one
-vi-
stress amplitude is the ratio of the number of cycles applied at that
amplitude to the number that would cause fatigue failure at that
amplitude.
A study of the effect of the key assumptions mentioned leads to
these conclusions:
Miner's theory amounts to a stress-independent, interactionfree theory, and other theories that have these features are therefore equivalent to Miner's theory.
Stress-dependent, interaction-free cumulative fatigue damage theories, when used to design aircraft structures, will lead to heavier structures than would result if Miner's theory were used, since prediction of shorter fatigue life is inherent in this type of theory.
Interaction effects can lead to designs either heavier or lighter than a design based on Miner's theory. Generally, investigation of the way that interaction effects are postulated in a theory will disclose the direction of design effects.
The utility of the results of the first phase of this study lies
in the evaluation of current cumulative-fatigue-damage theories. By
identifying the key assumptions mentioned above, conclusions about
practical effects on design can be drawn. To provide a basis for
evaluation, use of Miner's theory in design is outlined. Several
other current theories are then examined, in terms of the key assump
tions and also other assumptions (or in some cases, limitations re
sulting from a restricted experimental basis) that would be important
in aircraft design. The theories studied were selected as being repre
sentative of the breadth of possibilities, not as being necessarily
superior to others that have been proposed. Those selected and the
conclusions drawn about them are.~
Valluri 's Theory
This theory is found to be equivalent to Miner's theory if certain restrictions concerning definition of fatigue damage are observed. The restrictions essentially require the use of experimental fatigue data based on a uniform measure of damage or else definition of theoretical damage in terms of a specified structural-failure criterion.
-vii-
Grover's Theory
This theory proposes that fatigue damage proceeds in two discrete stages. It is shown that use of this theory would lead to increased structural weight, compared with use of Miner's theory (unless the fractional life at the transition between stages is the same for all stress amplitudes). The two-stage process is conceptually compatible with a reasonable physical model of fatigue, but sound experimental evidence justifying this theory for evaluation of cumulative damage is lacking.
Corten-Dolan Theory
This is an interaction theory. As developed, it contains the attractive assumption that interaction effects can be determined from fairly simple fatigue tests at two stress levels. Experiments designed to check the theory agree quite well with predictions, although Miner's theory also agrees quite well with the experiments. The experimental basis has not yet been provided for general application of this theory to aircraft structural design.
Freudenthal-Heller Theory
This is also an interaction theory, but interaction effects are related to experiment in a more complex way. Again, an experimental basis for applying this theory to aircraft structural design is not available.
Shanley's Theory
As originally presented, this theory postulated interaction effects which can be considered to result from varying amounts of initial damage produced by the first cycle at any one stress amplitude. This theory, in design work, would also lead to heavier structures than would Miner's theory. Theoretically, the interaction effects can be determined from experiments, and fatigue curves can be modified for use with Miner's theory, but this has not yet been verified.
2-x Method
This is an interpretation of Shanley's original theory, in which interaction effects are included, but in a complicated way not amenable to simple physical interpretation. The result, in design use, would consistently be increased structural weight, compared with Miner's theory.
In conclusion, no radical "breakthroughs" appear in the area of
cumulative-fatigue-damage evaluation in aircraft structures, either
in physical understanding or in theoretical techniques. Spectrum
-viii-
testing thus remains a vital ingredient in the process of designing
fatigue-resistant aircraft structures. However, every effort should
be made to so prescribe test conditions that the results will serve
to aid in discerning useful features of cumulative-damage theories
as well as to furnish design data.
The key characteristics of cumulative-~amage theories concern
effects that are difficult or impossible to observe in spectrum fatigue
tests. Further, they are far from being soundly established by
physical behavior and, worse, are often contrary to expected behavior
in a structure as complicated as an airframe. For example, plastic
strain is generally agreed to be a necessary factor in fatigue damage,
but it can also be a factor in promoting fatigue life in a complex
structure. Nevertheless, cumulative-damage theories fill an impor
tant need today. The results given in this Memorandum should be an aid
in relating, for design use, spectrum-test results and cumulative
damage the or ie s.

-ix-
CONTENTS
PREFACE . . . . • . . • . . . . . . . . . . . . . . . . . . . . . . . . . . . . . . . . . . . . . . • . . . . . . iii
SUMMARY AND CONCLUSIONS . . . . . . • . . . . . . . . . . . • . . . . . . . . . . . • . . . . . . v
LIST OF SYMBOLS . . . • . . . • . . • . . • • . • . . . . . . . . • . . . . . . . . . • . . . . . . . . . xi
Section I. INTRODUCTION 1
II. DA11AGE CONCEPTS . . . . • . • . • • • • . . . . . • . . • • • . . . • • . . • • . . . . . . 5
III. STRESS DEPE1'DENCE • . • . . • • • • • . • . • . • • • • . • . . . . . • • • • • • . • . • 8
IV. INTERACTION EFFECTS . • • • • • . . • • . . • . • . . . . . • • • • • • . • • • . . . . 12
V. THE ROLE OF DAMAGE EXPERIMENTS •..••.•.••.•.•....••••• 13
VI. GENERAL COMPARISON OF CUMULATIVE-DAMAGE THEORIES 15
VII. DESIGNING FOR STRESS SPECTRA WITH MINER'S THEORY 17
VIII. VALL URI Is THEORY • . . . . . • • • • • • • • • • • • • • • • . • • . . . • • • • • . . • . 22 Analysis • . . • • . • • • • • • • • • • . • • • • . . • • • • • . . • . . • • • • • • . . . . 22 Discussion . • . • • . • • • • . . . . • . . • • • . • . . . . • . . • . . . . . • . • . • . 27
IX. GROVER'S THEORY--A STRESS-DEPENDENT THEORY ...•.••.... 30
X. CORTEN-DOLAN THEORY . • . . • • . • • . • . . • . . • . • • . . . . • • • • • • • . . . 38
XI. FREUDENTHAL-HELLER THEORY • . . . • . • . . . . . • . . . • . . . . . . . . . . . 4 7
XII. SHANLEY Is THEORY . . . . . . . . . • • . . . . . . . . . • . . . . . . . . . . • . . . . . 54
XIII. 2-x !1ETHOD . . . . . . . . . . . . • . . . • . . . • . . • . . . . . . . . . . . . . . . . . . . 61
Appendix A. EFFECT OF STRESS DEPENDENCE ON FATIGUE-LIFE PREDIC-
TION . . . . . . . . • • . • . • . . • . . • . . . . • . . . . . . . . . . . . . . . . . . . 6 7
B. ALGEBRAIC ANALYSIS OF GROVER'S THEORY................ 75
REFERENCES . . . . • . . . . • . . . . • . . . . . . • . • . • . . . . . • . . . • . • . . . . . . • . • . . . 81

A
a
a
c
D
E
h
K
L
L cr
~ cr
L. ~n
M
m
m
N'
N r
-xi-
LIST OF SYMBOLS
constant
fraction of cycles to failure during which first stage of damage occurs
exponent in damage equation
constant
fatigue damage
fatigue damage at failure
initial fatigue damage caused by first stress cycle
modulus of elasticity
stress-spectrum-shape parameter
constant
crack length
critical crack length
critical crack length for highest stress in spectrum
crack length produced by first stress cycle
hypothetical initial crack length
interaction factor for spectrum loading
number of applied stress cycles during second stage of damage
number of damage nuclei
number of stress cycles applied at constant amplitude that produces sufficient damage for failure to occur at specified higher amplitude
number of stress cycles applied at constant amplitude that produces conventional failure
revised cycles to failure at one stress amplitude due to interaction of other amplitudes
number of cycles of spectrum loading that produces failure

n
n*
-n
R
r
z
8
y
a ar
-xii-
number of applied stress cycles with greater than a specified amplitude
cycles to failure at constant stress amplitude after increased initial damage
number of applied stress cycles
number of low stress cycles that produces same damage as initial high stress cycle
numbe.r of applied stress cycles starting from n"~'
rate of increase of damage with cycle ratio
ratio of crack-propagation constants
crack-propagation constant
number of stress amplitudes in a spectrum
ratio of number of applied cycles of a specified amplitude to number at a reference amplitude
ratio of number of cycles to failure at a specified amplitude to number at a reference amplitude
amplitude of stress cycle
constant stress amplitude resulting in same number of cycles to failure as spectrum loading
fatigue-endurance limit
mean stress of stress cycle
maximum tensile stress in stress cycle
failure stress in conventional tension test

-1-
I. INTRODUCTION
The problem of structural fatigue confronted European engineers
over a hundred years ago. At that time, the main problem was fatigue
failure of axles in railroad equipment. While considerable progress
has been made since fatigue was considered to be due to "crystalli
zation" of the material, the phenomena occurring at the atomic level
during fatigue are still not understood very well.
This does not preclude engineering solutions to the problem, as
analogy with stability of structures in compression will illustrate.
Long before there was basic understanding of phenomena occurring
during elastic and plastic deformation of a material, it was possible,
by using stress-strain curves, to design efficient structures to carry
compressive loads without failure by instability.
By making repeated load tests of railroad axles, designs were
found that provided the desired lifetime without fatigue failure.
Tests were made at different stress levels, counting the number of
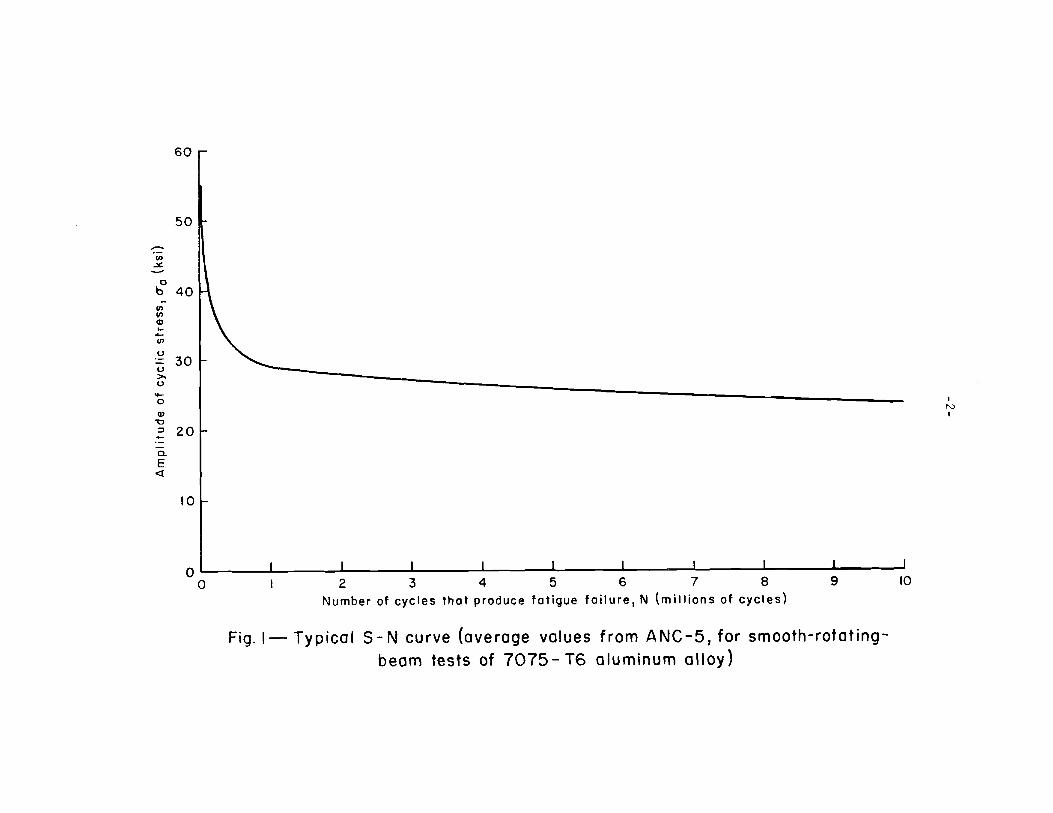
cycles of repeated stress that produced failure. Plotting the rela
tionship between stress (S) and number of cycles to failure (N) led
to the first S - N curves. Constant amplitude tests (repetition of
identical cycles) adequately simulated the loading in service in this
case. It was found that below some stress level, called the endurance
limit, cycles could be applied indefinitely without fatigue failure.
A typical S - N curve is shown in Fig. 1. (Usually, S - N curves are
displayed on log-log or semilog plots, where they appear as nearly
straight lines.)
The problem of designing for stress cycles at one constant level
occurs very rarely in flight structures. The actual stress variation
with time that must be accounted for in fatigue considerations is far
more complicated. The importance of keeping weight low and the absence
of endurance limits in airframe materials rule out the simple solution
of the railroad engineers. It is not practical to make enough tests
to provide a firm experimental basis for guaranteeing adequate fatigue
life for aircraft structures--at least not at the stage of design
when thicknesses and sizes of structural members are chosen. Moreover,
-1/)
.:JC -0
b ~
{/) {/) <I) ... ..... (f)
u
u >. u
..... 0
a> "0 ::;, ..... ·-a. E <I
60
50
40
30
I 20
10
o~----~------_.------~------~----~~----~------~------~------~----~ 0 I 2 3 4 5 6 7 8 9 10
Number of cycles that produce fatigue failure, N (millions of cycles)
Fig. I- Typical S-N curve (average values from ANC-5, for smooth-rotating
beam tests of 7075- T6 aluminum alloy)
I N I
-3-
there will always be some uncertainty in determining the important
features of the stress variation experienced in service until the
aircraft has been built and fl~wn.
Thus it is necessary to evaluate fatigue damage caused by complex
stress variations 0:1. the basis of "basic" data--the S- N relationship
obtained from single-level tests. In order to use basic fatigue
data in designing structures to withstand stress cycles of many dif
ferent levels, it is necessary to decide (1) how damage progresses
at one stress level and (2) how to properly add together the damage
pro3uced by each stress cycle when many different cycles are mixed
together.
The first part of this Memorandum treats the subject of cumulative
damage--the question of how fatigue damage accumulates when many dif
ferent stress cycles are applied. It is shown that cumulative-damage
theories can be categorized by detennining the basic assumptions they
contain regarding the two points above. General conclusions can be
drawn about the relative fatigue life prediction of various theories
when these basic assumptions are identified.
Next several current cumulative-damage theories are examined
and compared in terms of prediction of fatigue life under spectrum
loading. The basis of comparison is Miner's theory. However, life
prediction is only an intermediate step in this study. The impor
tant consequence of differences in the theories considered is not
different predicted lives, but rather differences in the amount of
material that will provide a specified lifetime, as found by appli
cation of the theories in design.
This brings up fundamental differences between methods of analv
sis and methods of design (or synthesis). In fatigue, analysis attempts
to answer the question, "Given a specified structural configuration
and a specified variation of loads, when will the structure fail from
fatigue?" The related design question is, "Given a specified length
of time that the structure must perform its function and a specified
variation of loads, what is the proper design configuration, i.e.,
the required amount and distribution of material in the structure?"

The two aspects are of course intimately interrelated, and design
would not be possible in practice without the foundation of analysis.
It is important to note, however, the difference of emphasis in the
two approaches. The nature of experiments and the interpretation of
results can differ markedly in fatigue work, depending on whether the
analysis or the design orientation predaninates.
Study of how these various theories would be applied in design,
with realistic flight stress spectra, points out any limitations of
these theories and also points out additional experimental work that
is needed to establish their usefulness in design.
-5-
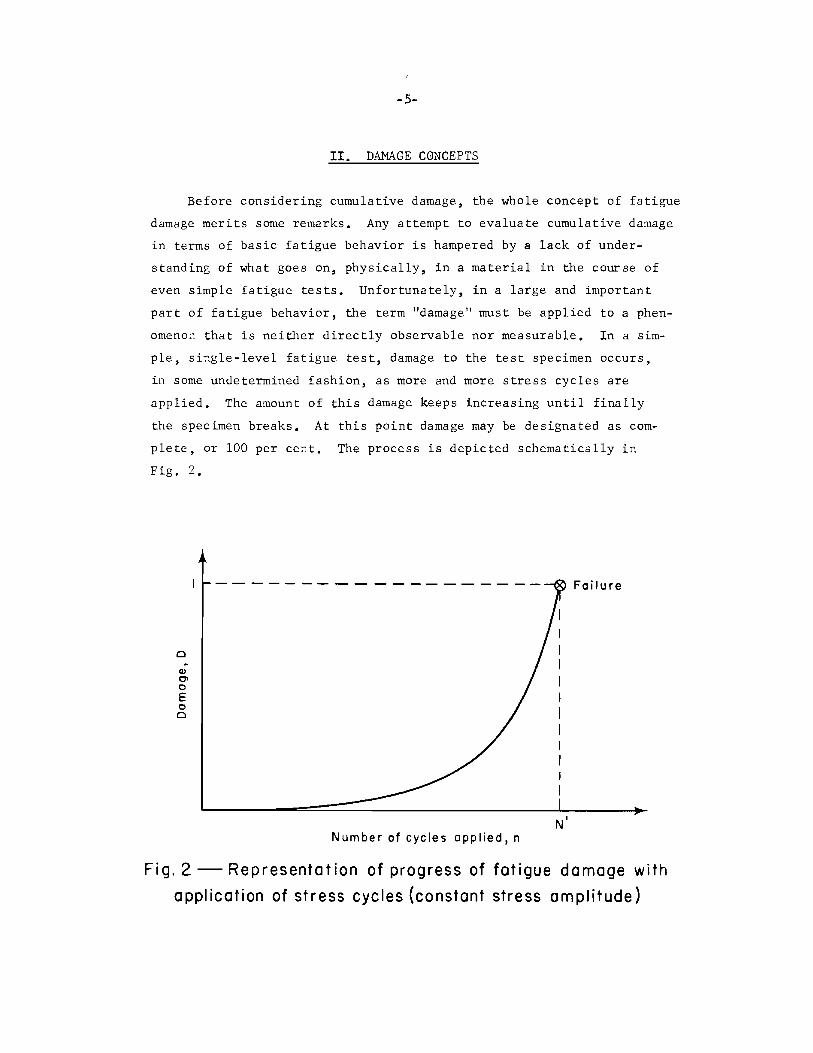
II. DAMAGE CONCEPTS
Before considering cumulative damage, the whole concept of fatigue
damage merits some remarks. Any attempt to evaluate cumulative damage
in terms of basic fatigue behavior is hampered by a lack of under
standing of what goes on, physically, in a material in the course of
even simple fatigue tests. Unfortunately, in a large and important
part of fatigue behavior, the term "damage" must be applied to a phen
omenon that is neither directly observable nor measurable. In a sim
ple, single-level fatigue test, damage to the test specimen occurs,
in some undetermined fashion, as more and more stress cycles are
applied. The amount of this damage keeps increasing until finally
the specimen breaks. At this point damage may be designated as com
plete, or 100 per cent. The process is depicted schematically in
Fig. 2.
0 -Q)
Cl c E c 0
Failure
Number of cycles applied, n
Fig. 2- Representation of progress of fatigue damage with
a ppl ica"tion of stress eye les (constant stress am pi it ude)

-6-
A useful measure of damage would be loss of strength. The strength
of a specimen or structure decreases as stress cycles are applied. A
specimen that would break at a stress of 75,000 psi in a static test
will eventually break at a stress of only 20,000 psi if the stress
is cycled between 0 and 20,000 psi often enough. By the time that
fatigue failure occurs, there has been a loss in strength of 55,000
psi. Generally this loss occurs very gradually until shortly before
failure. If the fatigue test were stopped before fatigue failure and
a static test were then made, static failure would occur at a stress
somewhere between 75,000 and 20,000 psi. As a measure of damage, the
ordinate in Fig. 2 could be the ratio of the strength lost after any
number of cycles to the strength lost when failure finally occurs in
the fatigue test. There are two drawbacks to determination of this
kind of relationship: First, measurement of static strength requires
destruction of the test item and second, for a large part of the life,
the strength decrease is so small that changes would be practically
undetectable and could be obscured by scatter in initial static strength.
Another possible measure of damage is the size or length of
fatigue cracks. Damage could be defined as the ratio of crack length
after any number of cycles to the crack length that finally results
in failure. The damage-cycle relationship would again be similar to
that shown in Fig. 2. The same problems exist, in that for much of
the range of interest cracks are so small that their depth is measur
able only through sectioning and microscopic examination.
Physically meaningful damage concepts should include the micro
scopic phenomena--intrusions, extrusions, fissures, production of sub
grains, fine structure of slip bands, and generation and motion of dis
locations associated with plastic strain--that go on in the neighbor
hood of the damage. One of the most encouraging prospects for really
understanding fatigue is the fairly recent emphasis on observation of
these microscopic phenomena occurring within single grains. Refer-
! ence 1 contains many interesting results of these observations. I
Recent development of techniques for obtaining transmission electron
microscope pictures(Z,J) of "thick" metal specimens offers the possi
bility of observing dislocation movement within the material with

- ~i- -
resolution comparable to previous observations of a surface by replica
methods. ("Thick" in this case may be only a few microns, but this
is thick enough to contain something like 10,000 crystallographic
planes.)
While these techniques have not yet been applied to rigorous
study of cumulative damage, they give promise of helping to understand
and evaluate cumulative damage. Equally important is the possibility
that this understanding will lead to improvements in fatigue behavior
of rna terials.
In summary, there is no simple, unambiguous measure of damage
in the early stages of fatigue, even in the simplest fatigue tests.
Therefore, in order to evaluate damage caused by complex stress var
iations, an assumption for the way that damage proceeds is required.
Reduced to essentials, cumulative-fatigue-damage theories postulate
the form of damage growth and state a rule for adding the damage pro
duced by stress cycles of different amplitudes.
-8-
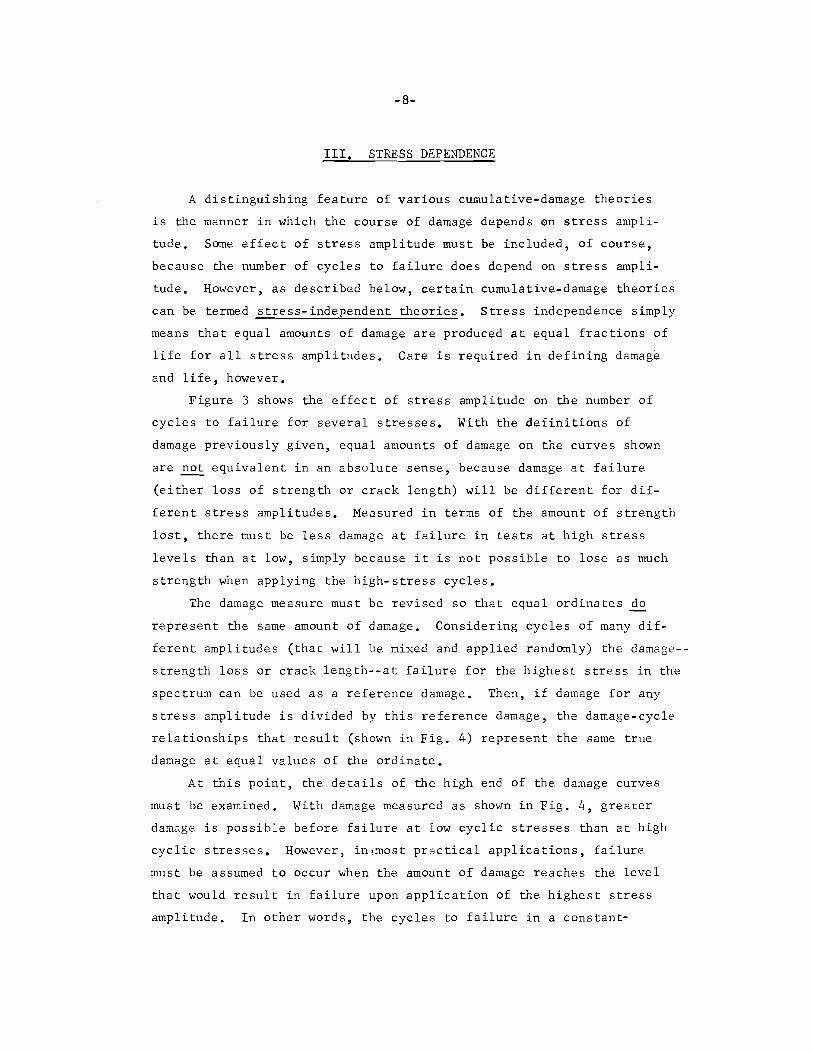
III. STRESS DEPENDENCE
A distinguishing feature of various cumulative-damage theories
is the manner in which the course of damage depends 0n stress ampli
tude. Some effect of stress amplitude must be included, of course,
because the number of cycles to failure does depend on stress ampli
tude. However, as described below, certain cumulative-damage theories
can be termed stress-independent theories. Stress independence simply
means that equal amounts of damage are produced at equal fractions of
life for all stress amplitudes. Care is required in defining damage
and life, however.
Figure 3 shows the effect of stress amplitude on the number of
cycles to failure for several stresses. With the definitions of
damage previously given, equal amounts of damage on the curves shown
are not equivalent in an absolute sense, because damage at failure
(either loss of strength or crack length) will be different for dif
ferent stress amplitudes. Measured in terms of the amount of strength
lost, there must be less damage at failure in tests at high stress
levels than at low, simply because it is not possible to lose as much
strength when applying the high-stress cycles.
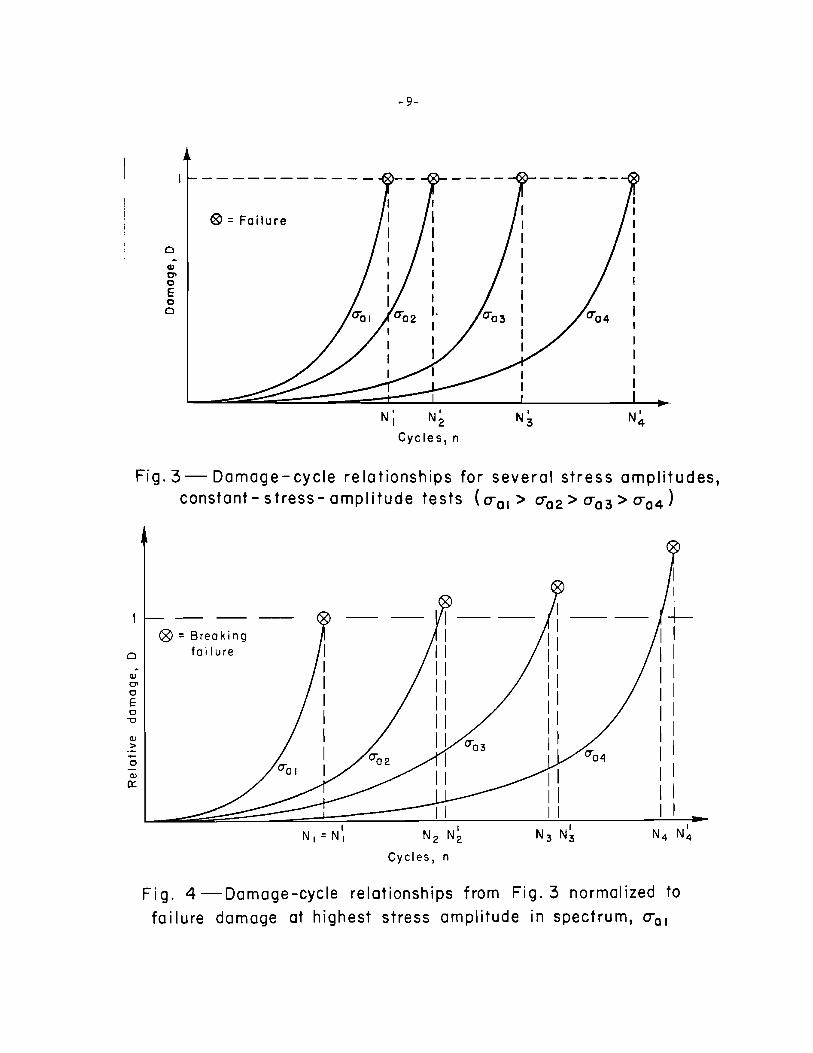
The damage measure must be revised so that equal ordinates do
represent the same amount of damage. Considering cycles of many dif
ferent amplitudes (that will be mixed and applied randomly) the damage-
strength loss or crack length--at failure for the highest stress in the
spectrum can be used as a reference damage. Then, if damage for any
stress amplitude is divided by this reference damage, the damage-cycle
relationships that result (shown in Fig. 4) represent the same true
damage at equal values of the ordinate.
At this point, the details of the high end of the damage curves
must be examined, With damage measured as shown in Fig. 4, greater
damage is possible before failure at low cyclic stresses than at high
cyclic stresses. However, in~most practical applications, failure
must be assumed to occur when the amount of damage reaches the level
that would result in failure upon application of the highest stress
amplitude, In other words, the cycles to failure in a constant-
0 -Q)
Cl 0
E 0 0
® = Failure
-9-
N' N' I 2 Cycles, n
N' 3 N' 4
Fig. 3- Damage-cycle relationships for several stress amplitudes, constant- stress- amplitude tests (o-01 > o-02 > o-03 > o-04 )
0
Q)
> -0
Q)
0::
®=Breaking failure
I N2 N2
Cycles, n
I
I +
I I I I I I I I I I
I I
I I I I I I I I
Fig. 4-Damage-cycle relationships from Fig. 3 normalized to
failure damage at highest stress amplitude in spectrum, o-01

-10-
amplitude test, N!, should be replaced by N., the number of cycles L L
that produce an amount of damage equal to damage at failure at the
highest stress amplitude.
There are several reasons for this approach:
1. A spectrum of stress amplitudes will be encountered during
the lifetime of a flight structure, with the highest stress amplitudes
occurring too frequently to be neglected. A designer could not count,
as part of the design lifetime, any time which depends on not en
countering the high-amplitude stress cycles.
2. In many cases, the rate of strength loss or crack growth
near the end of lifetime becomes so rapid that the difference between
Nand N1 becomes insignificant.
3. The experimental S - N curve may be obtained by determining
N rather than N1, i.e., counting cycles until some prescribed crack
length or strength decrease is reached.
The second and third statements above are often implicit in cum
ulative-damage theories.
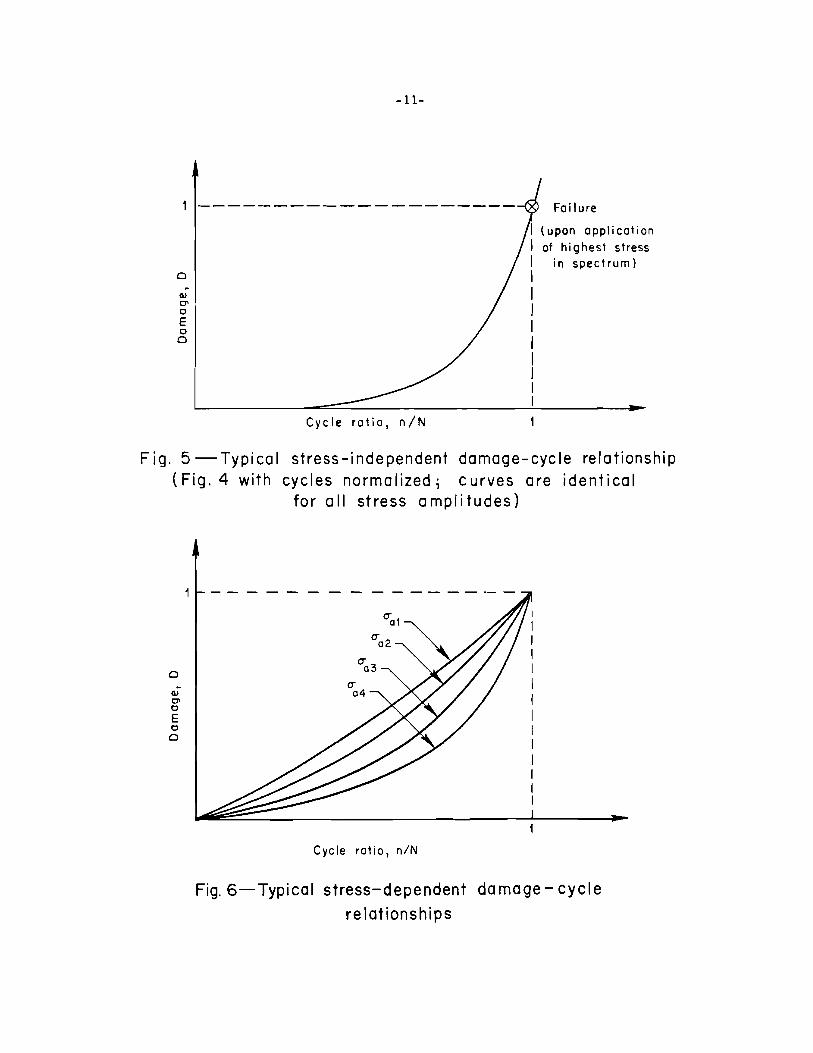
If the curves in Fig. 4 are normalized by dividing the number of
cycles applied by the number of cycles that produces the selected
damage level (damage at failure at the highest stress amplitude),
N., either of two possibilities, Fig. 5 or Fig. 6, will result. L
Figure 5 results from cumulative-damage theories that are stress-in-
dependent, while cumulative-damage theories that reduce to the rep
resentation of Fig. 6 are stress-dependent. (The curves in Fig. 6
do not have to be nonintersecting between the origin and 1,1.)
-11-
1 --------------------
0 ~
GJ 0' 0
E 0 0
Cycle ratio, n/N
Failure
(upon application of highest stress
in spectrum)
Fig. 5- Typi ca I stress -independent damage- eye le relationship (Fig. 4 with cycles normalized; curves are identical
0
GJ 0' 0
E 0 0
for all stress amplitudes)
Cycle ratio, n/N
Fig. 6-Typical stress-dependent damage- cycle
relationships
-12-
IV. INTERACTION EFFECTS
The other important characteristic of cumulative-damage theories
is interaction. If the relationship between damage and number of
cycles for a specified stress amplitude is assumed to be valid whether
or not other stress amplitudes are applied, the cumulative-damage
theory is termed an interaction-free theory. A theory that assumes
that application of other stress amplitudes changes the course of
damage due to the specified stress amplitude is then an interaction
theory.
Consider material in a structure (or laboratory specimen) that
has had enough stress cycles of various amplitudes applied to produce
some specified damage. Now one more cycle is applied, of amplitude
craJ for example. For an interaction-free cumulative-damage theory,
the increment of damage produced by this cycle would be the slope of
the damage-cycle curve for the given stress amplitude (oa3
) at the
specified amount of damage multiplied by the increment in cycle ratio.
For one additional cycle, the increment in cycle ratio, d(n/N), would
be l/N3
• In equation form
fl D 1 N
3 (1)
where dD/d(n/N) is determined at the specified damage level on the
damage curve for the specified stress amplitude, craJ· Cumulative
damage theories in which the above expression is not valid for incre
mental damage are interaction theories.
The definition of interaction-free theories applies equally well
to either the stress-independent theories of Fig. 5 or the stress
dependent theories of Fig, 6,

. ' I
-13-
V. THE ROLE OF DAMAGE EXPERIMENTS
Most of the experimental work exploring differences in damage
rates is of limited usefulness to the designer faced with the spectrum
of stress amplitudes that a flight structure experiences, This is
mainly due to the fact that in the damage range of most interest
(before obvious, measurable cracks appear) the problem of measuring
damage appears to be intractable, As a result, experimental investi
gations utilize the number of stress cycles, which~ be measured,
Typical tests can be termed one-step tests, since a certain number of
cycles of one stress amplitude is applied; the stress amplitude is
then stepped up (or down), and cycles at the second amplitude are
applied until failure occurs. Since the damage at the first ampli
tude cannot be measured, any curve from the origin to the point (1,1)
on Fig. 5 or 6 will suffice for a damage curve, although a monotoni
cally increasing curve is preferable, At the amount of damage on this
curve corresponding to the value of (n/N)1
, which is the ratio of the
number of applied stress cycles at the first amplitude to the number
of cycles to failure at that amplitude, the remaining life at the
second amplitude is plotted, (Actually the calculated equivalent
fraction of cycles used (N2 - n2)/N2 is plotted, or, equivalently,
n2 /N2 is plotted, measured to the left from the line n/N = 1,) When
this is done for several values of n1 /N1
, curves such as those shown in
Fig. 7 result, These are suitable for showing how many cycles at the
second stress amplitude may be applied after a specified number are
applied at the first amplitude, but there is no reason to assume that
these curves are valid as damage curves when cycles of the two ampli
tudes are mixed in together, As a matter of fact, it seems likely
that the one-step type of test engenders extreme emphasis on inter
action effects that could be insignificant in spectrum tests, Con
sidering well-mixed cycles of many amplitudes, there is no way by
which this technique can lead to the proper damage curves,
Spectrum tests can be considered to be damage experiments only
in a very limited sense. They can confirm or deny the validity of a
cumulative-damage theory, but they cannot provide specific knowledge
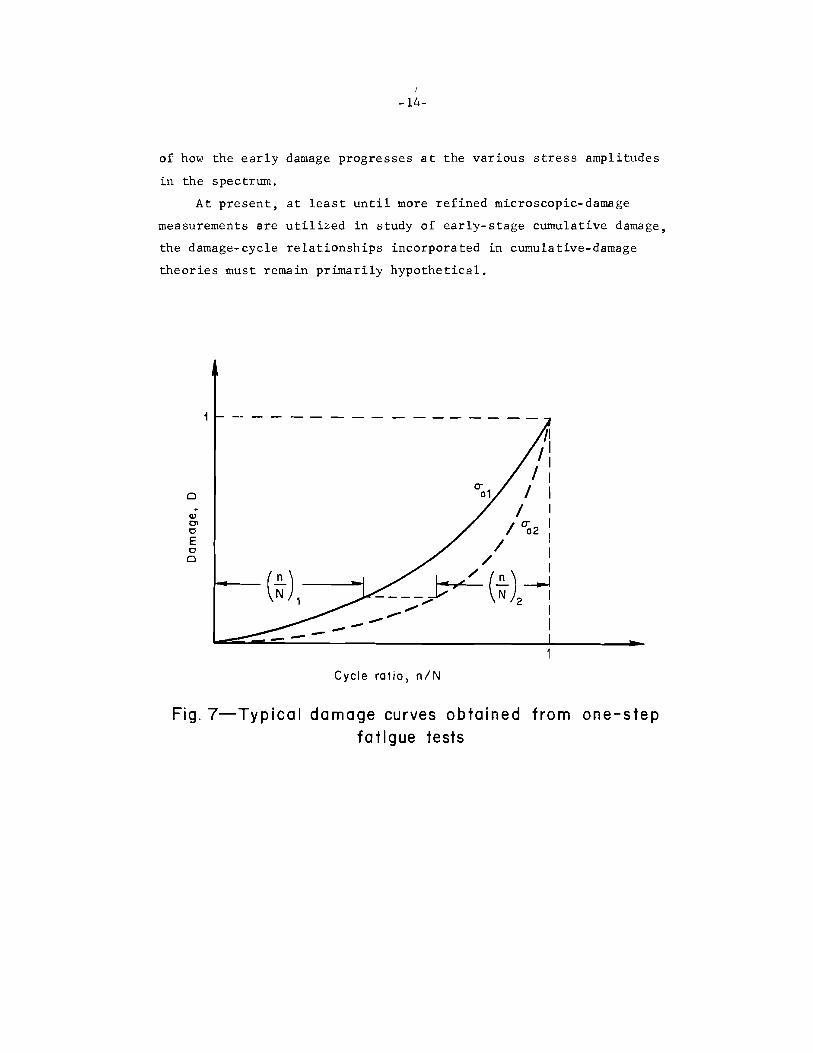
-14-
of how the early damage progresses at the various stress amplitudes
in the spectrum.
At present, at least until more refined microscopic-damage
measurements are utilized in study of early-stage cumulative damage,
the damage-cycle relationships incorporated in cumulative-damage
theories must remain primarily hypothetical.
~
Q) 0> c E c 0
Cycle ratio, n/N
Fig. 7-Typical damage curves obtained from one-step fatigue tests
-15-
VI. GENERAL COMPARISON OF CUMULATIVE-DAMAGE THEORIES I
In the previous sections, some general characteristics of cumula
tive-damage theories were explored, namely, the nature of assumptions
regarding dependence on stress amplitude and on interaction effects.
It will be shown that these characteristics determine general proper
ties of cumulative-damage theories. The most generally known cumula
tive-damage theory, that usually attributed to Miner(4
) in this
country, will be used as a basis of comparison. Miner's theory is
important because of its relative simplicity, its clos~enough approx
imation to reality to be of practical use, and the widespread knowledge
and utilization of this theory.
Actually Palmgren(S) presented cumulative-damage equations iden
tical to Miner's some 20 years earlier, apparently the result of a
purely intuitive approach. Langer's excellent paper(6
) presents
a very perceptive inquiry into fatigue. His work includes Miner's
theory in a more general framework but lacks the attractively simple
cumulative-damage equations and the supporting experimental work pre
sented by Miner.
Miner's theory simply states that the fraction of life used up
by application of stress cycles of any amplitude is just the ratio of
the number applied to the number that would cause failure at that
amplitude. When different amplitude cycles are mixed together, fail
ure occurs when the fractions of life expended at each amplitude add
up to one.
The key features of cumulative-damage theories, concerning stress
and interaction effects, lead (as shown in Appendix A) to these state-
ments:
1. Cumulative-damage theories that reduce to a stress-indepen
dent damage-cycle relationship when normalized in the manner
of Fig. 5 and are interaction-free are equivalent to Miner's
theory.
2. Cumulative-damage theories that are stress-dependent, re
ducing to the form shown in Fig. 6 when normalized, and are

-16-
interaction-free will predict shorter life under random,
spectrum loading than would be predicted by Miner's theory.
3. In order for a cumulative-damage theory to predict longer
life than does Miner's theory, it must be an interaction
type of cumulative-damage theory (and can be either stress
dependent or stress-independent). Interaction-type damage
theories can be constructed so as to predict either shorter
or longer life than does Miner's theory.
Classification and comparison of cumulative-damage theories can
be made fairly simply. This allows general conclusions to be drawn
about predictions and consequences of the use of a theory--whether more
or less structural material than the amount determined with Miner's
theory is required for a specified life. In following sections,
several current cumulative-damage theories will be dissected in order
to make these comparisons.
-17-
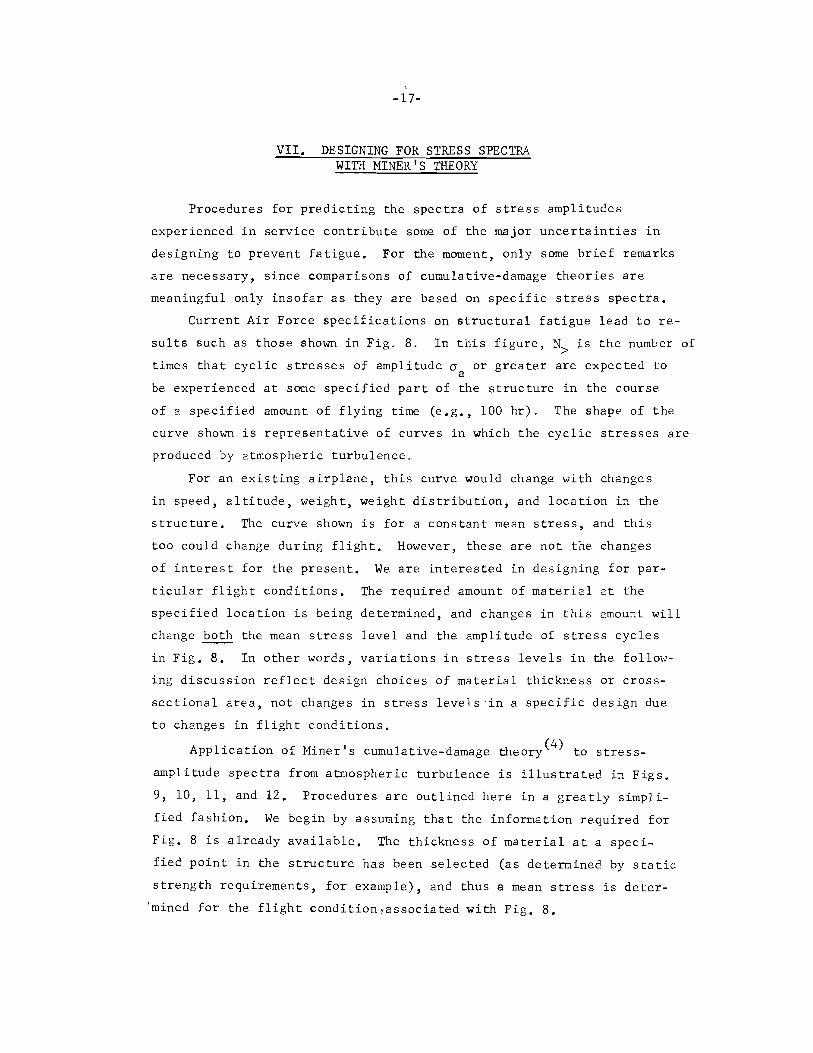
VII. DESIGNING FOR STRESS SPECTRA WITH MINER'S THEORY
Procedures for predicting the spectra of stress amplitudes
experienced in service contribute some of the major uncertainties in
designing to prevent fatigue. For the moment, only some brief remarks
are necessary, since comparisons of cumulative-damage theories are
meaningful only insofar as they are based on specific stress spectra.
Current Air Force specifications on structural fatigue lead to re
sults such as those shown in Fig. 8. In this figure, N> is the number of
times that cyclic stresses of amplitude a or greater are expected to a
be experienced at some specified part of the structure in the course
of a specified amount of flying time (e.g., 100 hr). The shape of the
curve shown is representative of curves in which the cyclic stresses are
produced by atmospheric turbulence.
For an existing airplane, this curve would change with changes
in speed, altitude, weight, weight distribution, and location in the
structure, The curve shown is for a constant mean stress, and this
too could change during flight. However, these are not the changes
of interest for the present. We are interested in designing for par
ticular flight conditions, The required amount of material at the
specified location is being determined, and changes in this amount will
change both the mean stress level and the amplitude of stress cycles
in Fig. 8. In other words, variations in stress levels in the follow
ing discussion reflect design choices of material thickness or cross
sectional area, not changes in stress levels in a specific design due
to changes in flight conditions.
Application of Miner's cumulative-damage theory( 4 ) to stress
amplitude spectra from atmospheric turbulence is illustrated in Figs.
9, 10, 11, and 12, Procedures are outlined here in a greatly simpli
fied fashion, We begin by assuming that the information required for
Fig. 8 is already available, The thickness of material at a speci
fied point in the structure has been selected (as determined by static
strength requirements, for example), and thus a mean stress is deter-
'mined for the flight condition~associated with Fig. 8.

CD "0 ::I
·- A c.z E_:" 0 ....
.c .c .... o ·- 0 ;~:_
., .... Q) Q)
- 0. u~ >. u 0 ., b ., Q) c ... 0 .... .c ., .... -.... 0 Q) .... .... 0 Q) Q) .0 .... E e> ::I 2
-18-
Amplitude of applied stress cycles, eTa
Fig. 8- Typical stress spectrum resulting from atmospheric turbulence
Amplitude of applied stress cycles, eTa
Fig. 9-lncremental number of applied cycles per increment in stress amplitude
-19-
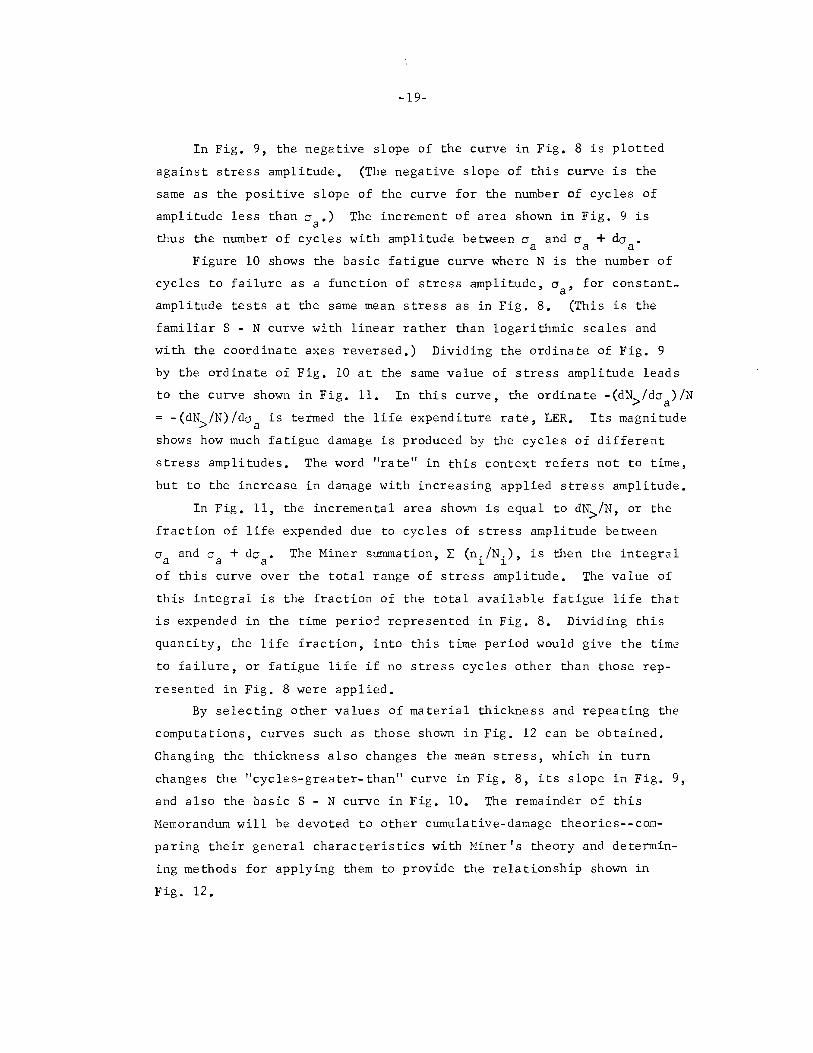
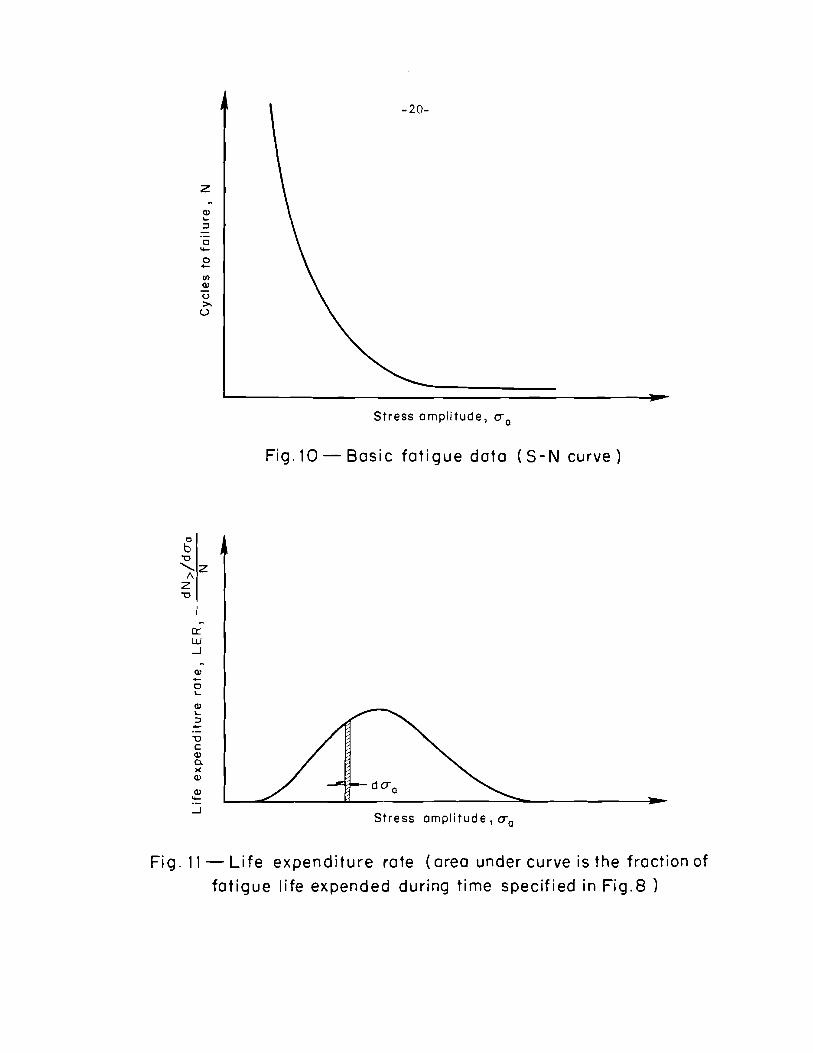
In Fig. 9, the negative slope of the curve in Fig. 8 is plotted
against stress amplitude. (The negative slope of this curve is the
same as the positive slope of the curve for the number of cycles of
amplitude less than a .) The increment of area shown in Fig. 9 is a
thus the number of cycles with amplitude between a and cr + da • a a a Figure 10 shows the basic fatigue curve where N is the number of
cycles to failure as a function of stress amplitude, a , for constant-a
amplitude tests at the same mean stress as in Fig. 8. (This is the
familiar S - N curve with linear rather than logarithmic scales and
with the coordinate axes reversed.) Dividing the ordinate of Fig. 9
by the ordinate of Fig. 10 at the same value of stress amplitude leads
to the curve shown in Fig. 11. In this curve, the ordinate -(dN>/daa)/N
= -(dN>/N)/dca is termed the life expenditure rate, LER. Its magnitude
shows how much fatigue damage is produced by the cycles of different
stress amplitudes. The word "rate" in this context refers not to time,
but to the increase in damage with increasing applied stress amplitude.
In Fig. 11, the incremental area shown is equal to dN>/N, or the
fraction of life expended due to cycles of stress amplitude between
ca and c +de • The Miner summation, L (n./N.), is then the integral a a ~ ~
of this curve over the total range of stress amplitude. The value of
this integral is the fraction of the total available fatigue life that
is expended in the time period represented in Fig. 8. Dividing this
quantity, the life fraction, into this time period would give the time
to failure, or fatigue life if no stress cycles other than those rep
resented in Fig. 8 were applied.
By selecting other values of material thickness and repeating the
computations, curves such as those shown in Fig. 12 can be obtained.
Changing the thickness also changes the mean stress, which in turn
changes the "cycles-greater-than" curve in Fig. 8, its slope in Fig. 9,
and also the basic S - N curve in Fig. 10. The remainder of this
Memorandum will be devoted to other cumulative-damage theories--com
paring their general characteristics with Miner's theory and determin
ing methods for applying them to provide the relationship shown in
Fig. 12.
z
Ql '::J
c ...... E Ul Ql ()
>. u
0
b "0 ........_z
1\ z "0
~
0:: w _J
~
Ql --0 '-
Ql '::J --"0 c Ql D. )(
Ql
Ql ...... _J
Stress amplitude, cr0
Fig.10- Basic fatigue data ( S-N curve)
Stress amplitude, cr0
Fig. 11- Life expenditure rate (area under curve is the fraction of
fatigue life expended during time specified in Fig.S)
-21-
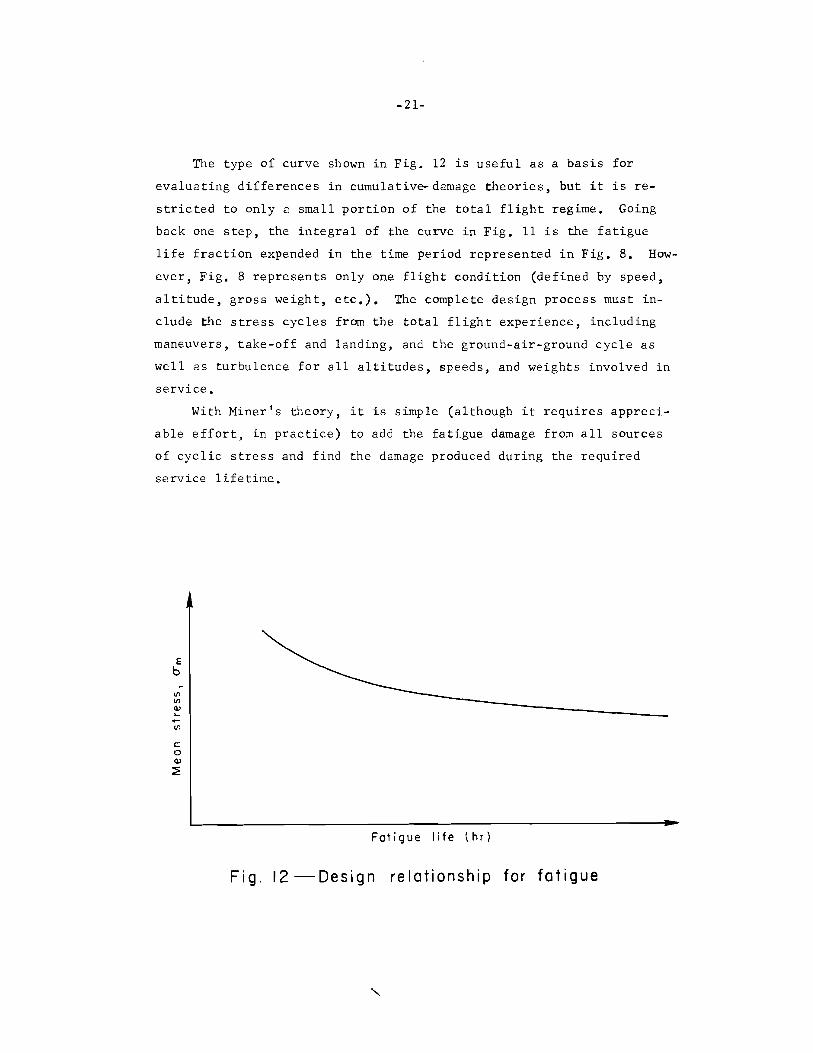
The type of curve shown in Fig. 12 is useful as a basis for
evaluating differences in cumulativ~damage theories, but it is re
stricted to only a small portion of the total flight regime. Going
back one step, the integral of the curve in Fig. 11 is the fatigue
life fraction expended in the time period represented in Fig. 8. How
ever, Fig. 8 represents only one flight condition (defined by speed,
altitude, gross weight, etc.). The complete design process must in
clude the stress cycles from the total flight experience, including
maneuvers, take-off and landing, and the ground-air-ground cycle as
well as turbulence for all altitudes, speeds, and weights involved in
service.
With Miner's theory, it is simple (although it requires appreci
able effort, in practice) to add the fatigue damage from all sources
of cyclic stress and find the damage produced during the required
service lifetime.
E b
Ill Ill (I) ..... -Ill c D (I)
~
Fatigue life thr)
Fig. 12 -Design relationship for fatigue

-22-
VIII. VALLURI'S THEORY
ANALYSIS
Valluri has presented a cumulative-fatigue-damage theory based
on dislocation theory and plastic deformation (and its reduction with
cyclic stressing) at the tip of a crack. ( 7) He develops a relation
ship between crack length and the number of stress cycles applied
which is fundamental to his theory of fatigue:
2 2 [aa + <;m- ae)J c2
:a)
L L c e (2) exp
+ (a -ae)J
n 0
..en [aa m K
Equation (2) is Eq. (19) of Ref. 7, rewritten in the terminology of
this Memorandum, where L is crack length, a is the cyclic stress a
amplitude, a the mean stress, and n the number of applied stress m
cycles. The additional symbols are L , a crack length determined 0
by applying Griffith crack theory to the ultimate tensile stress ob-
tained from a static tension test; a , fatigue endurance limit; and e
E, Young's modulus. In Eq. (2) C is a constant that contains (1)
another constant expressing relationship between the number of cycles
required to narrow a hysteresis loop and the logarithm of the ratio
of the areas of the initial and final hysteresis loops, (2) a constant
relating the size of a plastic enclave ahead of a crack to stress,
Young's modulus, mean grain size, a Burgers vector, and length of
crack, (3) mean grain size, and (4) a Burgers vector. The symbol K
is also defined as a constant, the asymptotic width of the hysteresis
loop (although it appears in the derivation that K also includes a
parameter related to plastic strain in the first cycle, which would
depend on stress for most materials). In application, the values of
C and K and also the endurance limit, ae' are to be determined empiri
cally from fatigue tests.
The form of the exponential growth of a crack with increasing
number of stress cycles, in accordance with Eq. (2), is shown in
-23-
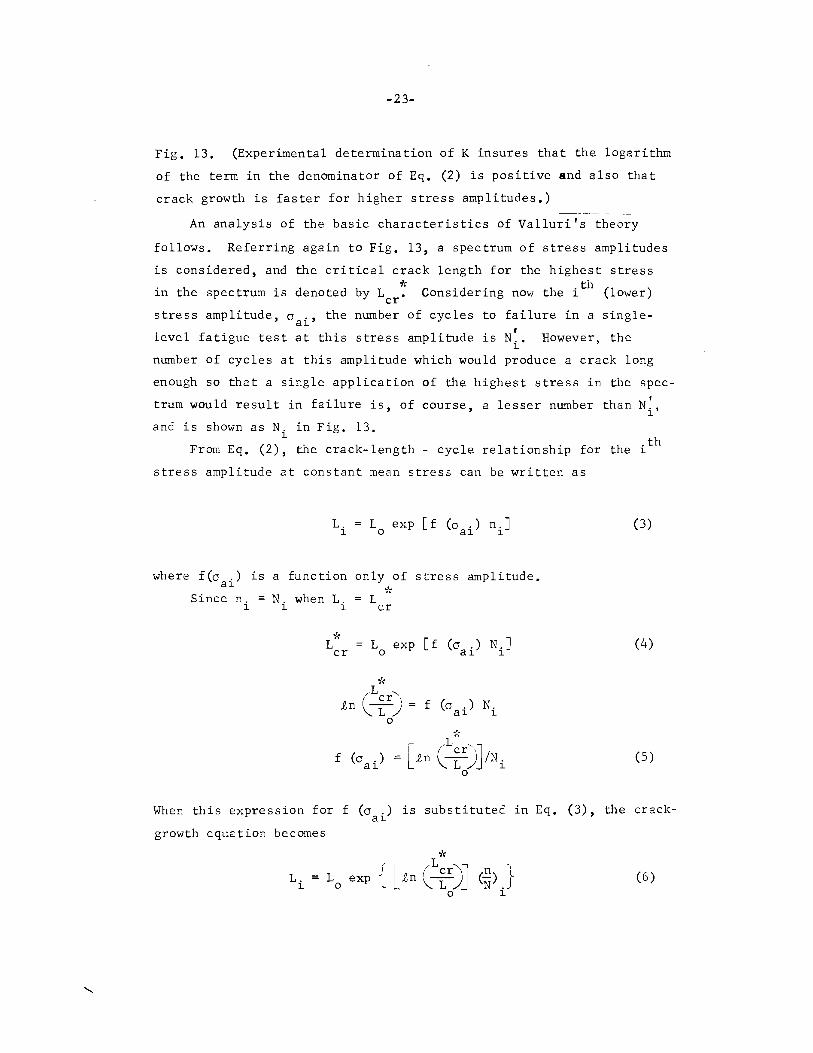
Fig. 13. (Experimental determination of K insures that the logarithm
of the term in the denominator of Eq. (2) is positive and also that
crack growth is faster for higher stress amplitudes.)
An analysis of the basic characteristics of Valluri's theory
folloNs. Referring again to Fig. 13, a spectrum of stress amplitudes
is considered, and the critical crack length for the highest stress * th in the spectrum is denoted by L . Considering now the i (lower) cr
stress amplitude, a ., the number of cycles to failure in a singlea~
level fatigue test at this stress amplitude is I
N .• However, the ~
number of cycles at this amplitude which would produce a crack long
enough so that a single application of the highest stress in the spec
' trum would result in failure is, of course, a lesser number than N., ~
and is shown as N. in Fig, 13, ~ . th
From Eq. (2), the crack-length- cycle relationship for the ~
stress amplitude at constant mean stress can be written as
L. ~
L exp [f (o .) n.] o a~ ~
where f(o . ) is a function only of stress amplitude. al
Since n. ~
N. when L. ~ l
L~~ cr
L cr
L exp [f (a .) N.] o a~ ~
(L ·L~ r "./·: .en = f (a . ) N.
a~ ~ 0
(3)
(4)
(5)
When this expression for f (o .) is substituted in Eq. (3), the cracka~
growth equation becomes
L. ~
""J':
L J [ ~ (1
cr)il (E) l o exp l hn ~ L ~ N .J (6)
0 ~

....J
Lo
~ =Failure
-24-
I I
I I I I I I
:N i : N\ Applied cycles, n
Fig. 13 -Crack-growth relationship (Vall uri)
....J
~ -0> c C1l
..X u 0 .... u
~---------------Lcr
Lo
0
Fig. 14-Crack-growth relationship for all stress amplitudes; cycles normalized by cycles to L~r (Valluri)

-25-
for all values of stress amplitude in the spectrum (that is, all
stress amplitudes that are large enough to avoid endurance-limit
effects).
Since Eq. (6) is independent of stress amplitude, a single curve
as shown in Fig. 14 applies to all stress amplitudes. The crack
length can be normalized by defining damage as
L. - L D
~ 0
* (7)
L - L cr 0
The form of the relationship between damage thus defined and cycles
* normalized by the number of cycles that produce L is shown in Fig. 15. cr
One additional relationship following from Valluri's theory is
pertinent here. With his criterion for failure, the number of cycles
to failure at the ith stress amplitude, N~ (which is not the same as ~
N. in the above derivation), is given by Valluri as ~
I N. ~
-0 + (o - o )£ n L-~-=a:..::i:.___K___;,;_m:.___...;..e_J
~o . + (o -C 1 a~ m
L E
2 2 o )- ~2o .-
e J LTJ e
(8)
Equation (8) is Eq. (21) of Ref. 7 with the present terminology.
The
C' m in
quantity 0 oi pluso., and
a~
the braces in
is equal to
0 u lt is the
Eq. (8) can
L. ~
(L/L ) 0 .
~
the maximum applied tensile stress, or
ultimate tensile stress. The terms with-
be substituted in Eq. (2) to give
(9)
i (10)
This relationship is shown in Fig. 16.

Cl
cV 0> c E c Cl
-26-
Fig. 15-Normalized damage-cycle relationship (Valluri)
16
14
12 Maximum stress in cycle = Ultimate tensile stress
10
0 _J
8 ............ _J
6
4
2
0 0
nil'/
Fig. 16- Crack growth for constant str€SS amplitude,
cycles normalized by Valluri's
cycles to failure
-27-
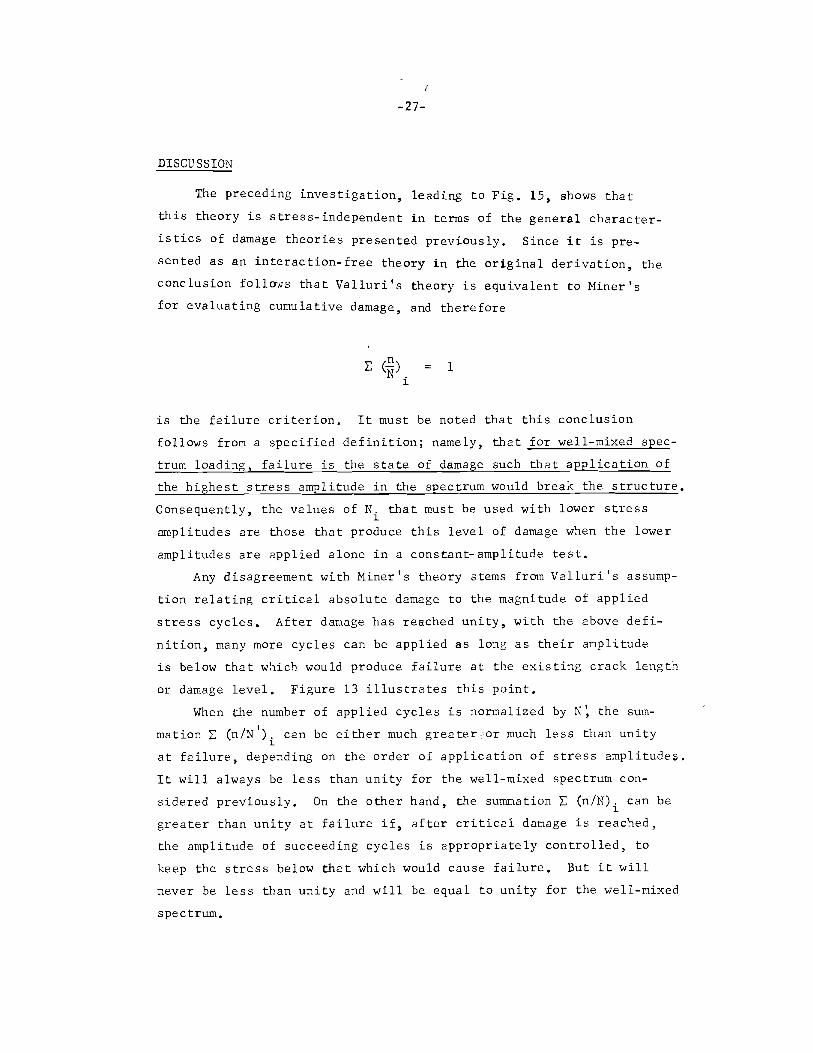
DISCUSSION
The preceding investigation, leading to Fig. 15, shows that
this theory is stress-independent in terms of the general character
istics of damage theories presented previously. Since it is pre
sented as an interaction-free theory in the original derivation, the
conclusion foll~NS that Valluri's theory is equivalent to Miner's
for evaluating cumulative damage, and therefore
~ ~) 1 N . ~
is the failure criterion. It must be noted that this conclusion
follows from a specified definition; namely, that for well-mixed spec
trum loading, failure is the state of damage such that application of
the highest stress amplitude in the spectrum would break the structure.
Consequently, the values of N. that must be used with lower stress ~
amplitudes are those that produce this level of damage w~en the lower
amplitudes are applied alone in a constant-amplitude test.
Any disagreement with Miner's theory stems from Valluri's assump
tion relating critical absolute damage to the magnitude of applied
stress cycles. After damage has reached unity, with the above defi
nition, many more cycles can be applied as long as their amplitude
is below that which would produce failure at the existing crack length
or damage level. Figure 13 illustrates this point.
When the number of applied cycles is normalized by N~ the sum
mation~ (n/N'). can be either much greater;or much less than unity ~
at failure, depending on the order of application of stress amplitudes.
It will always be less than unity for the well-mixed spectrum con-
sidered previously. On the other hand, the summation~ (n/N). can be ~
greater than unity at failure if, after critical damage is reached,
the amplitude of succeeding cycles is appropriately controlled, to
keep the stress below that which would cause failure. But it will
never be less than unity and will be equal to unity for the well-mixed
spectrum.

-28-
An important contribution of Valluri's theory is the emphasis
placed on the possibility of damage at failure depending on stress
level. From Eq. (10) (or from Eq. (4) of Ref. 7) an expression for
failure stress in terms of crack length can be obtained:
(11)
By substitution from Eq. (10), an expression can be obtained that
gives the stress at which failure would occur if a static test were
made on a specimen after any number of cycles of a lower stress amp
litude had been applied:
(12)
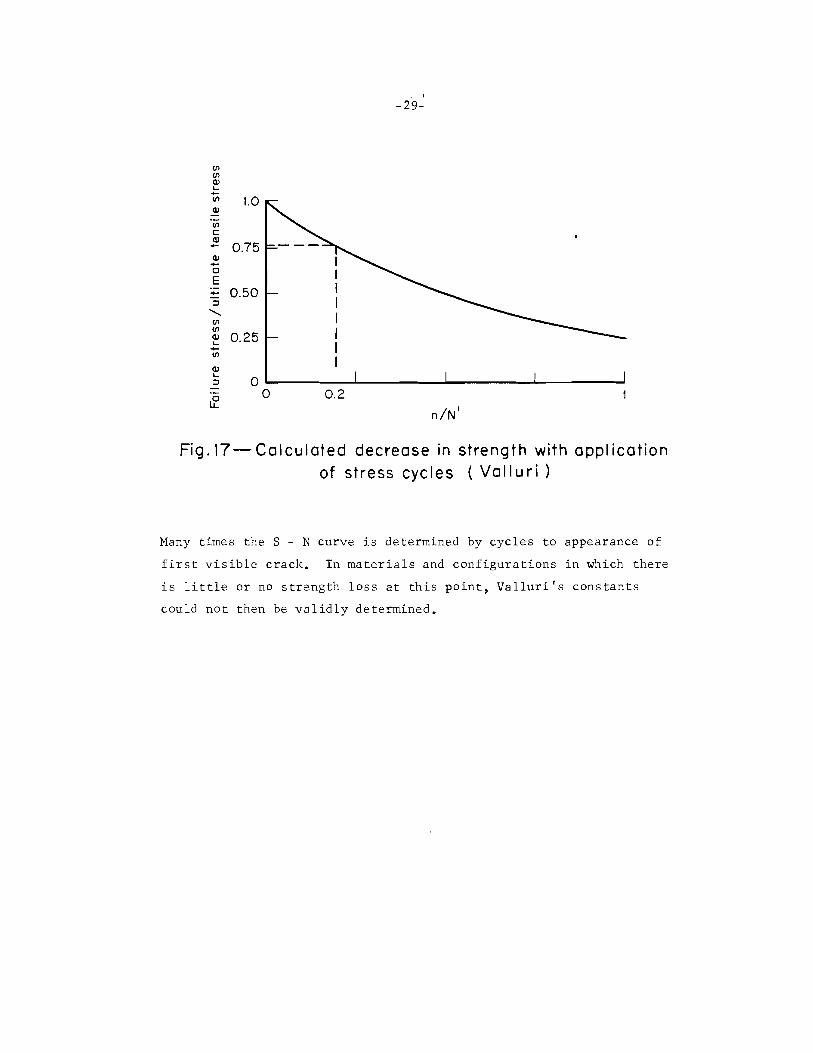
Considering, for example, application of stress cycles in which the
maximum stress is 25 per cent of the ultimate tensile stress, Fig. 17
shows the stress that would produce failure after application of a
number of lower stress cycles, according to this theory. For this
case, application of about 20 per cent of the cycles that would pro
duce failure at the specified cyclic stress results in a decrease of
the failure stress to about 75 per cent of the original ultimate ten
sile stress. There is a lack of experimental verification of this
effect, and as a matter of fact, there is some evidence that the
strength falls off much more slowly until late in the life.
However, Valluri 1 s work emphasizes the importance of insuring
that basic S - N curves are properly determined and understood in
terms of what happens when the number of applied cycles approaches
the value N. For application of spectrum loadings, it must be in
sured that N is the number of cycles that produces the same damage
level at all stress levels in order for Miner's cumulative-damage
theory to be valid. Some investigation is thus called for in partic
ular cases to determine whether Nand N1
are significantly different
and what criterion was used in establishing the basic S - N curve.
-29-
If) If)
Cll .... u; 1.0 ~ If)
c 2 0.75 Cll -c E - 0.50 :J
.......... If) If)
Cll 0.25 .... -If)
Cll .... 0 :J
~ 0 0.2
n/N'
Fig. 17- Calculated decrease in strength with application of stress cycles ( Valluri)
Many times the S - N curve is determined by cycles to appearance of
first visible crack. In materials and configurations in waich there
is little or no strength loss at this point, Valluri's constants
could not then be validly determined.
-30-
IX. GROVER'S THEORY- -A STRESS-DEPENDENT THEORY
Grover has proposed a theory that differs from Miner's theory
in that it postulates a two-stage damage process. (8
) The essential
feature of this theory is the assumption that cracks are initiated
during an initial stage of damage as stress cycles are applied. In
a single-level test, this initial stage is completed at some fraction,
denoted by "a,'' of the total cycles to failure. In the second stage,
propagation of cracks to failure occurs in the c~Jrse of application
of the fraction (1 - a) of the total cycles to failure. It is assumed
that the value of a for any stress amplitude is constant whether or
not cycles of other stress amplitudes are applied. (It is interest
ing to note that the essential features of th~ theory are cont~ined
in the method proposed by Langer. (6))
For cumulative-damage calculations under spectrum loading, it is
assumed that Miner's theory applies to each stage, which results in
two equations:
11.
L: -~- 1 a.N. ~ ~
m. L: ~ 1
(1-a.)N. ~ ~
(13)
(14)
where n denotes cycles applied during the initial stage, and m denotes
cycles during the second.
As noted in Ref. 8, if a. is the same for all stress amplitudes ~
in the spectrum, this theory is equivalent to Miner's theory.
The following discussion of this theory is directed toward com
paring its general features with Miner's theory and investigating
means of applying it to design problems.
For comparison of this theory with Miner's theory in terms of the
general characteristics of cumulative-damage theories presented earlier,

-31-
the normalized damage-cycle relationships postulated by this theory
are shown in Fig. 18. The use of Miner's theory for the two stages
of damage (Eqs. (13) and (14)) implies the curves shown in Figs. 19
and 20, The normalized damage-cycle relationships shown are identical
for all stress amplitudes, in accordance with the stress-independent,
interaction-free basis of Miner's theory as presented in the previous
discussion of general cumulative-damage theory.
From that discussion it also follows that Grover's theory is
stress-dependent, since the damage curves in Fig, 18 differ for dif
ferent stress amplitudes, Thus, for the well-mixed stress spectrum
(when values of the quantity a depend on stress amplitude) it can be
concluded that Grover's theory will predict failure in fewer cycles
than will Miner's theory. Consequently, for design requirements
specifying a load spectrum and lifetime, more material would be re
quired in a design based on Grover's theory than in one based on
Miner's theory. (This conclusion is proved algebraically in Appendix B.)
Differences in life are illustrated in Fig. 21. This figure
shows the ratio of life predicted by Grover's theory to that predicted
by Miner's theory for a well-mixed two-level stress spectrum. Curves
are shown for three combinations of a1
and a 2 , the fractional first
stage life for the two stress levels. The life ratio is seen to be
a function of the relative amount of cycles of the two stress levels
in the spectrum, n1
/n2
. (The life ratio approaches one for large
values of the abscissa.)
While there is little point at present in proceeding to design
considerations, since there are insufficient data to provide a mean
ingful determination of the value of the parameter a and how it
varies with stress amplitude, this theory has interesting possibili
ties, These follow from the earlier discussion of the meaning of
damage and possible measurements of damage, The current efforts to
investigate fatigue damage at the microscopic level and at very
early stages suggest that there are differences in the nature of
damage at very early and later stages. For example, the delineation
between the early and later stages might be the transition from primary

f 0 CD <f)
0
Q)
01 0 E 0 "0
» L-0 "0 c 0 (.) Q)
(f)
+
-32-
I I I
I I
-I
0 ~~~-------------------------------0
n/N
Fig. 18-Form of damage-cycle relationship (Grover)

-c: 0 ....... 0
-33-
n/aN
Fig. 19-Damage-cycle relationship in initial-damage stage for all stress amplitudes (Grover)
0 Gl 1/)
0 .......
c:
0
0
_m_ (1-a)N
Fig. 20- Damage-cycle relationship in secondary- or final
damage stage for all stress amplitudes (Grover)

-~ ... > Q)
~ c:
(!) ~ a)
Q) ---"tl "0 Q)
Q)
u u
"C "0
~ Q)
a.. a.. ......___....
... Q)
> ~
(!)
~ ::J
:E 0
t:IZ
w
1.0
0.8
o.o
0.4
0.2
0 0
-34-
- \~
\ f\._o 1 =0.2, o2 =0.3
1Lo 1 =0.2, o2 =0.1
\01 =0.6, 02=0.1 .--\ ,---~
_.... ~
\ ~ ~ \ v v
2 3 4 5
Fig. 21- Comparison of I ife-prediction data of Grover and Miner for selected in i ti a 1-damage fractions
-35-
intragranular damage (characterized by progressive unbending, intru
sions, extrusions, fissures, etc., within grains) to intergranular
crack formation and propagation on a grosser, more familiar scale-
the joining together of the damaged portions that have occurred in
individual grains to form cracks that traverse more and more grains
as cycling proceeds. Work in this area is not yet adequate to discern
relationships between stress amplitude and initial damage or transi
tion to the second stage, but this certainly appears a possibility.
It would be of extreme interest to investigate cumulative damage under
spectrum loading at this initial microscopic-damage level.
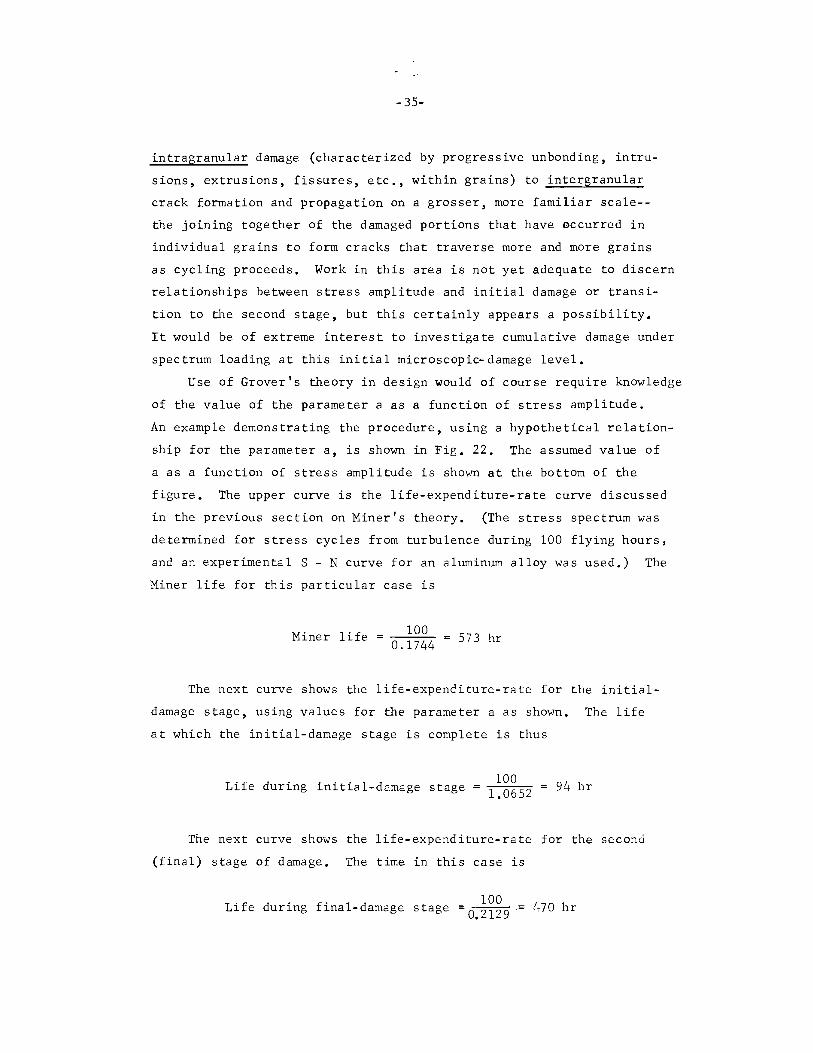
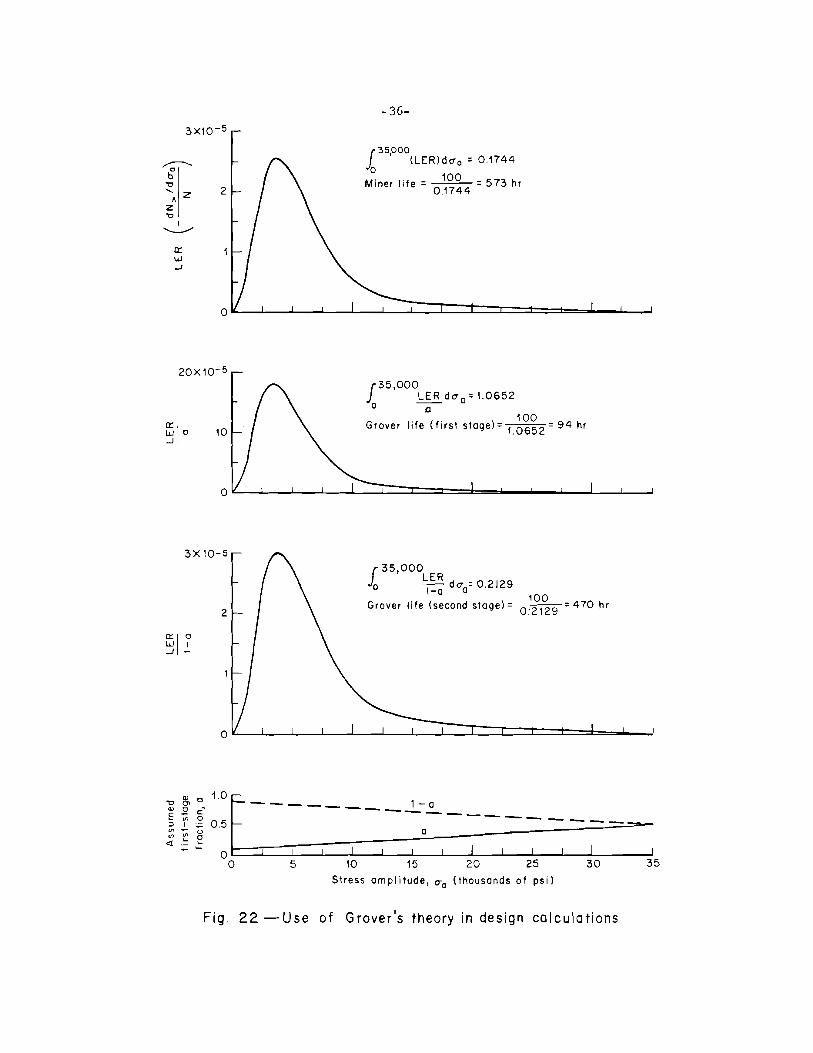
Use of Grover's theory in design would of course require knowledge
of the value of the parameter a as a function of stress amplitude.
An example demonstrating the procedure, using a hypothetical relation
ship for the parameter a, is shown in Fig. 22. The assumed value of
a as a function of stress amplitude is shown at the bottom of the
figure. The upper curve is the life-expenditure-rate curve discussed
in the previous section on Miner's theory. (The stress spectrum was
determined for stress cycles from turbulence during 100 flying hours,
and an experimental S - N curve for an aluminum alloy was used.) The
Miner life for this particular case is
Miner life 100 0.1744 = 573 hr
The next curve shows the life-expenditure-rate for the initial
damage stage, using values for the parameter a as shown. The life
at which the initial-damage stage is complete is thus
Life during initial-damage stage 100
1.0652 94 hr
The next curve shows the life-expenditure-rate for the second
(final) stage of damage. The time in this case is
Life during final-damage stage 100
0.2129 - 470 hr
~ b
"C
',.z z "C
I ......._._,.
0:: w ..J
2
2ox w-5
10
3X 10⁻⁵
2
0:::1 Cl W I ..J -
-36-
135,000
(LER)do- 0 = 0.1744 0
Miner life= 0.~~~ 4 = 573 hr
! 35,000 LER do- a: 1.0652
o -a-
Grover life (firs1 s1age)= 1 -~~~ 2 = 94 hr
f 35,000
LER 0 l-a do-a= 0.2129
100 Grover life (second s1age) = 0: 2129 = 470 hr
~ ~ ..,_ 10[ ________ 1-a
E- c:: -----"''('5?05 ------"'- U a C/) C/) Cl
<! .... ....
~- 0 I 1 I 1 0 5 10 15 20 25 30
S1ress amplitude, o-0
(1housands of psi)
Fig. 22 -Use of Grover1S theory in design calculations
35

-37-
Thus the total life from Grover's theory (with this purely arbi
trary assumption for the value of a) is 564 hr, or only about 1-1/2
per cent less than the Miner life. The difference could be far more
pronounced, of course, for different assumptions about a, but as
noted above there is no way at present to establish the proper mag
nitude of this parameter. It can be seen, however, that use of this
theory in design would be quite straightforward. As shown in this
discussion, use of Grover's theory, for a specified load spectrum and
life requirement will always result in a design requirement for more
material than would be required if Miner's theory were used.

-.:.. 38-
X. CORTEN-DOLAN THEORY
As originally presented(9) the general form of this theory in
cludes both stress-dependence and interaction effects. Subsequent
· 1 k(lO' ll) · · · h th h 1 d f exper~menta wor ~n connect~on w~t e t eory e to ormu-
lation of a stress-independent, interaction theory.
In the original presentation, the expression for damage as a
function of applied cycles (for stress amplitude a .) was given by a~
D. ~
m. r. n. ~ ~ ~
a. ~
(15)
In this expression, m. ~
is some number of "damage nuclei," r. is a ~
crack-propagation constant, and a. is ~
a constant. These quantities
are assumed constant for a specified stress amplitude (in a single-
level test) but may be different for different stress amplitudes.
Damage at failure is prescribed as unity (or 100 per cent), giving
a.
a.. l
m. r. N. ~ ~ l
1 (16)
By dividing m. r. N. ~ 1 into Eq. (15), the following expression ~ ~ ~
for damage is obtained:
D. ~
a. (E) ~ N .
~
(17)
-~Figure 23 shows the appearance of damage curves from this relationship.
If the value of a. depends on stress amplitude, a stress-dependent ~
theory is proposed, while a. independent of stress amplitude leads to ~
a stress-independent theory and a single curve in Fig. 23 for all
stress amplitudes. It was concluded that a. was independent of stress ~
for the materials and stress spectra of the experimental work men
tioned above.

-C1> 0' 0 E 0 Cl
-39-
n/N
Fig. 23 -Theoretical damage-cycle relationship (exponent varying with stress amp I i tude; constant- amp I i tude tests)
(Corten-Dolan theory)
-40-
Interaction effects are introduced into this theory, leading to
the possibility of predictions that differ from Miner's theory. The
possibility of interaction follows from the assumption that the num
ber of damage nuclei produced by the highest stress in a spectrum will
affect the growth of damage at other, lower stress amplitudes. The
original assumption was that damage growth at lower stress amplitudes
would be faster after a higher stress amplitude had been applied than
when the lower amplitude was applied alone. In other words, m for
the higher stress was considered larger than m for the lower stress.
(Subsequent experiments indicated that, from the point of view of this
theory, the damage growth rate at the lower stress was actually re
duced in some cases w~en two stress levels were applied together.)
With the interaction effect included, the damage relationship becomes
a. ml ~
D. = -=-- <B). ~ m. (18)
~ ~
In this equation, m1
is the damage-nuclei number for the highest stress
in the spectrum (assumed to be applied early in the test), and m. is
the damage-nuclei number for the ith (lower) stress amplitude. ~ By defining a new parameter as
M. ~
1/a. ~
the damage relationship of Eq. (15) can be written as
D. ~
n.
(M.~.) ~ ~
a. ~
n. (-~) NI.
~
a. ~
(19)
(20)
In this equation, NI·• which is equal to M.N., is a revised (because ~ ~ ~,
f . . ) b f 1 f '1 h .th 1' d h' h o ~nteract~on num er o eye es to a~ ure at t e ~ amp ~tu e w ~c
should be used in the damage equation when the ith amplitude is mixed
-41-
together with a higher stress amplitude. . (10 11)
The exper~mental work '
in connection with this theory can be considered to be an investiga-
tion of the validity of the above concepts.
The experimental work is, in fact, directed to investigation of
a different parameter, but the parameter M used in Eq. (20) can be
derived from it. The original derivation of this theory(9
) considers
the possibility of an initial nucleation period, but this is later
considered to be inconsequential. The original theory also considers
stress-dependence (different values of the exponent in Eq. (15) for
different stress amplitudes) but, as mentioned, in later work the
exponent is considered to be constant, or a stress-independent theory
is assumed.
(In a discussion of power-law damage rates in Ref. 10, it is
shown that if exponents are identical for different stress levels but
not equal to one, and there is no interaction, the cumulative damage
resulting from spectrum loading will be different than if evaluated
by Miner's theory. This disagrees with the conclusions of this Memoran
dum, where it is shown that use of identical exponents would lead to a
stress-independent, interaction-free theory which is equivalent to
Miner's theory. The disagreement results from the use of incorrect
values of cycle ratio for determination of damage increments in Ref.
10. The derivation there is correct when all exponents equal one be
cause the incorrect terms all become equal to unity and do not affect
the result.)
The parameter investigated experimentally is denoted as R11;, -
where R is the ratio of crack-propagation constants for two different
stress amplitudes. The initial experimental work consisted of spec
trum loading with two stress levels in the spectrum. In the follow
ing, the higher stress amplitude will be called cra1
, and the cycles to
failure at this amplitude alone, N1
• The lower stress amplitude and
the cycles to failure when applied alone are aa2
and N2
• The ficti
tious number of cycles to failure at the lower stress (when interac
tion effects are included) is Niz = MN 2 , as in Eq. (20). Using the
same exponent for the two stress levels and equating damage at fail-
ure from Eq. (16) for the two stress levels
-42-
ml rl Na
1 m2 r2 Na
2
Nl 1/~ 1/~
m r <n-.2) (...1)
N2 1 rl
Nl M jil/; N2
-1/a Nl =~ (21) R MN2 NI
2
The experimental work was done to investigate the relationship
of the parameter Rl/a to the magnitude and the proportion of the two
1 1 · Th · 1 · h -R1 Ia stress eve s ~n a spectrum, e ma~n cone us~ons were t at was
independent of the proportion of high and low stress cycles in the -1/a
spectrum for specified stress levels and that the magnitude of R
could be adequately represented by a power function of the ratio of
the high to the low stress amplitude, (Tests were made in reversed
bending with zero mean stress. The above conclusions apply to the
materials tested, 2024-T4 and 7075-T6 aluminum-alloy wire and two
kinds of steel wire,) -1/a
As a consequence of the relationship between R and the stress -1/a
amplitudes (and the assumption of R independent of the proportion
of cycles), a fictitious S- N curve for use with spectrum loading
can be constructed, On a plot of log o versus log N, this curve is a
a straight line passing through N1
(the experimentally determined
cycles to failure at the highest stress in the spectrum) and through a
point Nr2
at a lower stress amplitude, The value for N12
is determined
from two-level spectrum tests containing the two stress amplitudes
oa1
and oa2
•
With this theory, cumulative damage could then be assessed for
any spectrum by using Miner's theory with the interaction S - N curve
thus obtained, While this approach is attractive because of its rela
tive simplicity and the generally good agreement obtained from its

-43-"
use with fairly complicated stress spectra, there are some reserva
tions that must be disposed of by further ·experiments.
For one thing, similar experiments with specimens more closely
related to aircraft structures and with a range of mean stress are
necessary to evaluate effects of stress raisers and mean stress.
The effect of the proportion of cycles may also require closer
study. An alternative way of looking at the results of experiments
h th . V 1 f -Rl/~ d . d f . . f s ows Ls. a ues o etermLne rom experLments are gLven or
2024 aluminum for several combinations of high and low stress and
several different proportions of high stress cycles in the spectrum.(lO)
B d · . d. -Rl/ a . N /N f E (21) y LVL Lng Lnto 1 2 , rom q.
Nl/N2
-1/a R
M (22)
where M is the number by which N is multiplied to give the value of
NI, the fictitious N, incorporating interaction effects, to be used
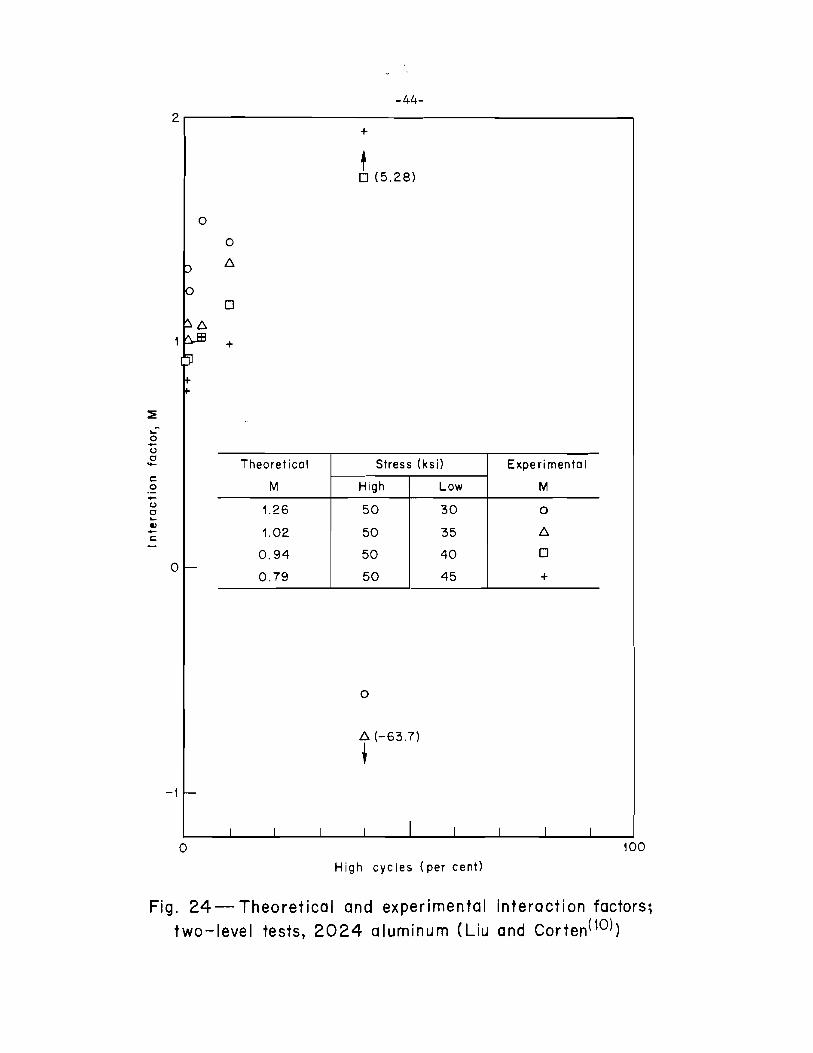
for cumulative damage. In Fig. 24 experimental values of M are shown
for the various stress levels and cycle proportions, together with
the derived theoretical value. It is not clear from this figure that
cycle proportions can be neglected, although it is stated that experi
mental values of 40 per cent of high cycles are uncertain. Negative
values of M indicate that a negative value of NI should be used in the 2
summation of cycle ratios. (This means that more high stress cycles
can be applied if some lower stress cycles are mixed with them than
can be applied at the high stress alone.)
Another reason for further evaluation of this theory is the
results of work to be discussed in the next section. The theory in
this case also leads to a fictitious interaction S - N curve, but
:from the same general type of test on the same material (2024 aluminum)
the interaction curve is found to lie considerably to the left of the
basic S - N curve. In Figs. 25 and 26, basic S- N curves for 2024
d 7075 1 . 11 . b . d d . . . . (ll) f h an a umLnum-a oy WLre o taLne urLng LnvestLgatLon o t e
present theory are shown. The interaction curves determined by the
::::::!
.: ~ (.)
0 -c: 0 -(.)
0 .... I) -c: -
-44-2.-----------------------------------------------
0
0
-1
0
0
6
0
+
Theoretical
M
1.26
1.02
0.94
0.79
+
t 0 {5.28)
Stress {ksi) Experimental
High Low M
50 30 0
50 35 6
50 40 0
50 45 +
0
6 {-63.7)
t
100
High cycles {per cent)
Fig. 24-Theoretical and experimental interaction factors; two-level tests, 2024 aluminum (Liu and Corten(tO))

Q)
"C ::J --c. E c (/)
(/)
Q) ..... -(/) C'> 0 _J
Q)
"C
4.8
4.7
4.6
4.5
4.4
4.3
-45-
X Experimental points(10)
Basic curve<11 >
Interaction curve; ~
maximum stress= 50 ksi(IO) "'-':
X~ ~
~
60
50
40 ·;;; .X.
(/) (/)
Q) .....
30 u;
~----------~----------~----------~----------~20 3 4 5
Log N
6 7
Fig. 25-Basic and interaction S-N curves, 2024 aluminum (mean stress=O) (Liu and Corten)
4.9
70 4.8
60
~ 4.7 50 c. (/)
E Jlnteraction curve; .X.
c (/) 4.6 '- maximum stress= 50 ksi 40 (/)
(/) (/)
Q) Q)
.... ..... - ~ u; (/)
C'> 4.5 ~ 30 0 _J ~
4.4 ~ ~ ~
4.3 20 3 4 5 6 7
Log N
Fig. 26-Basic and interaction S-N curves, 7075 aluminum (mean stress =0) (Liu and Corten<11 ))
-46-
investigation have been added. It can be seen that interaction effects
are very slight. In terms of material required in designing for a
specified life, it would make little difference whether Miner's theory
were used with the basic S - N curves or with the interaction curves,
for the materials and stress spectra considered in these experiments.

-47-
XI. FREUDENTHAL-HELLER THEORY
In Ref. 12, Freudenthal and Heller present an interaction type
of cumulative-damage theory. The first premise of their theory is
that a fictitious S- N curve can be found such that Miner's theory,
used with this curve, is valid for determining cumulative fatigue
damage under spectrum loading. Secondly, interaction effects are
such that the interaction S - N curve has an equation of the form
K X
a a
(23)
The interaction S - N curve is thus a straight line on a logarithmic
plot of stress amplitude versus fictitious (with interaction) cycles to
failure. It is also assumed that this interaction is effective only
below a specified, fairly high stress level.
In connection with the above, it should be pointed out that if
one is given the description of a stress spectrum and also the total
number of cycles to failure when that spectrum is applied, there
exists an infinite number of S - N curves, any one of which, used with
Miner's theory, would predict failure exactly for the specified spec
trum. Generation of these curves would, of course, be a useless pur
suit. The merit of the work discussed in this section lies in the
attempt to relate distinguishing characteristics of the applied stress
spectrum to, in this case, the exponent x in Eq. (23). (Here K is a
constant determined by the condition that the interaction curve passes
through the point on the basic S - N curve corresponding to the upper
stress limit on interaction.)
In a very good program, 220 spectrum tests were made on smooth
2024 aluminum-alloy test specimens in reversed bending. (Tests are
also reported for 4340 steel, and previous tests were made to establish
the basic S - N curves.) The stress spectra contained from four to
six amplitudes, with the relative number of cycles at various ampli
tudes corresponding to distributions representative of gust-produced
stresses in aircraft. The sequence of applications of the various
-48-
stress levels was randomized by using rando~number tables to pre
pare the load programming tape.
The results and analysis of these tests are quite interesting.
Of the eleven test series, the results of all but one (with results
noted as unreliable) were found to fit a fairly simple relationship
for the value of the exponent in Eq. (23), involving a parameter re
lated to the shape of the applied stress spectrum and also the basic
S - N curve. The meaning of the spectrum shape parameter is illus
trated in Fig. 27. This figure shows the relationship between the
number of applied cycles and stress amplitude used in this program to
establish the test stress spectra. The curves show the assumed num
ber of stress cycles of amplitude greater than oa that result from
turbulence in flying a million miles (or from 2000 to 5000 flying
hours for speeds of 500 mph down to 200 mph). The parameter h in
these curves, for the tests on aluminum, is given by
h 1,032,000
0 (1) a
(24)
where o (1) is the stress amplitude (in pounds per square inch) exa
pected to occur on the average of once per million miles.
The values of stress amplitude selected for the test program are
also shown in Fig. 27. The effect of different values of h on the
test spectra is that for the steepest curve, the number of cycles
applied at any of the test amplitudes is about 3 per cent of the num
ber applied at the next lower amplitude. For the middle curve this
figure is about 10 per cent, and it is about 18 per cent for the curve
with h = 17.3. The other part of the parameter involved in the fic
titious-exponent relationship is the predicted number of cycles to
failure determined by Miner's theory and the basicS- N curve. The
shape of the applied stress spectrum enters of course in this deter-
mina t ion.
As stated in Ref. 12, the conclusions apply only to smooth
specimens, and quite different results have been observed in speci-
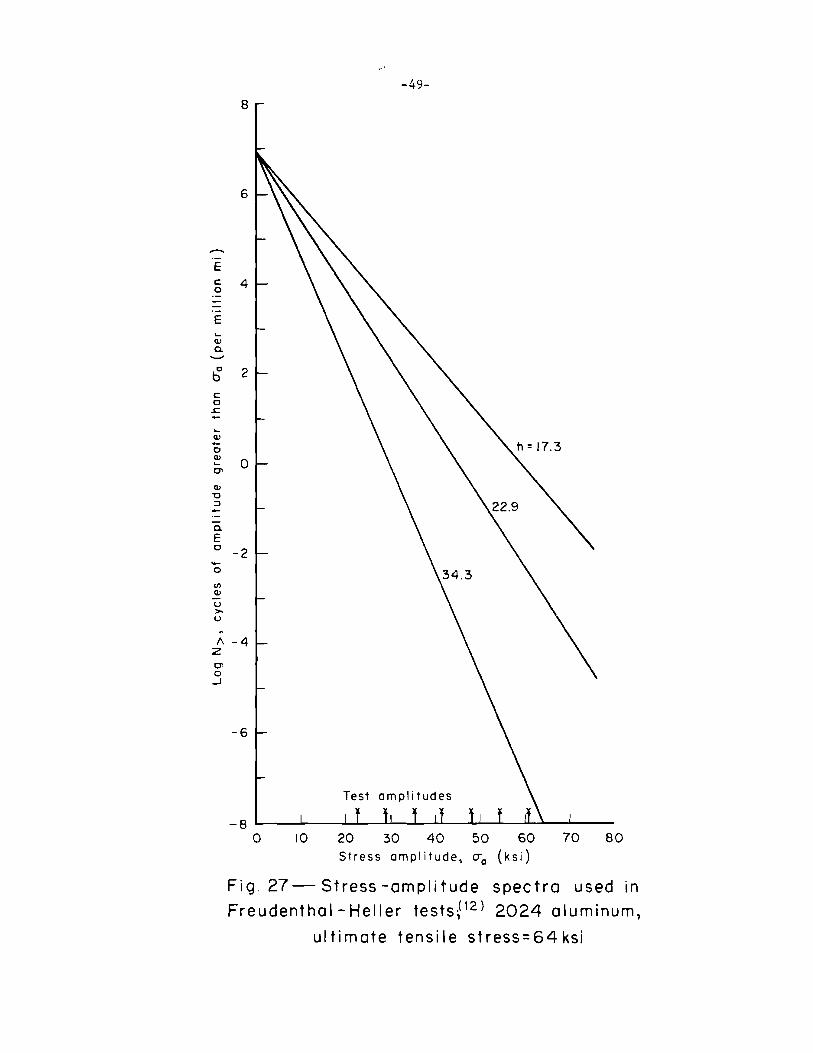
E c: 0
E ..... (I)
0. -b c: 0
.s::. -.... (I) -0
~ 0'
(I)
"0 :I -·-0. E 0
-0
(/) (I)
u >-u ~
/\ z 0' 0 _J
-49-
8
6
4
2
0
-2
-4
-6
-8 ~--~----~--~--~~--~~~~~~~---0 10 20 30 40 50 60
S t res s amp I i t u de, 0"'0 ( k s i )
70 80
Fig. 27- Stress -amplitude spectra used in
Freudenthal-Heller tests;' 12 ) 2024 aluminum,
ultimate tensile stress=64ksi
-50-
mens more representative of aircraft structures. Further, the effect
of nonzero mean stresses cannot be predicted from work done thus far.
Finally, some observations can be made concerning disparities between
this work and the work discussed in the preceding section. From Fig.
27 and test data it appears that the present experiments tend to em
phasize the high end of the stress spectrum. Of the seven test ampli
tudes shown, those chosen for the tests were the lowest 6, the highest
6, the highest 5, and the highest 4. The values determined for the
fictitious exponent are seen to decrease (i.e., the fictitious S- N
curve becomes steeper) in the same order as this description of tests
(aside from the series noted as unreliable). In other words, interac
tion effects become more pronounced when the higher stress amplitudes
are selected for the test spectra. For the series that includes the
lowest test stress amplitude (for each value of h) the values deter
mined for the fictitious-exponent approach the value of the exponent
of the first portion of the basic S - N curve. This can be illustrated
by interpreting the test results discussed in this section in terms
of the quantity M introduced in the previous section (H is the quan
tity by which the number of cycles to failure in a single-level test
is multiplied to give the fictitious number of cycles to failure for
including interaction effects in spectrum loading.) In the previous
theory, interaction was assumed to be effective only for stress ampli
tudes below the highest in the spectrum, while in the present theory,
interaction is assumed to occur at all stresses below a specified
magnitude (95 per cent of ultimate tensile stress for the tests on
aluminum).
The Freudenthal-Heller theory proposes that the value of M can
be expressed as a power function of stress amplitude. Figure 28 shows
the interaction factor, M, as a function of stress amplitude as deter
mined from the experimental investigation of interaction. Curves are
shown for the five test series with the lowest stress amplitudes.
TI1e curves are shown dashed below the lowest stress amplitude in the
stress spectrum. (The discontinuity of slope in these curves results
from the form of the basic S - N curve, which is composed of two
linear segments on a log-log plot.) Also shown in Fig. 28 is the

·-E :::> .... ~
"' a.
"' c
"' "' "' ....
"' o> c o> 0
E ~ 0
""0 0
~~ 0 0 E .....
0 c 0
"'-o>u 0 ~ E
"' 0-""0 c
·-;;; c
~
E
"' ;>
0
"' "' o> 0
E 0
0
1. 2
1.0
0.8
0.6
0.4
0.2
0 0
Interaction Test h
Curve Amplitudes
A lowest 6 17.3 r--t---8 lowest 6 22.9 B,C
n
c highest 6 17.3 D,E A
D highest 6 22.9
E highest 6 34.3 !--'" ~
,.,.......
Lettered points show relative damage oc
/~ ~
I 1 I I / II IJ·/ VB,D
B,DO lllh 11
:!! ~VA OE
~~~v -'--~~ ~ __:4 A -'--
10 20 A 30 40 Stress amplitude, cr0 (ksi)
--~
------~ ~,
if ! I
~
kf A/ I c/ I I
I g
co
B,DO oc OA
~ c A,B,D D ~
E;. AE 50 60 70
Fig. 28-Relative Miner damage at stress amplitudes in spectrum and theoretical interaction factor; lowest-stress-amplitude tests, 2024 aluminum ( Freudentha 1- He ller<12>)
I 1..11 1-' I
-52-
relative damage caused by the various stress amplitudes in the test
spectra for the same five test series, as determined by Miner's theory
and the basic S - N curve. Figure 28 thus shows a tendency for inter
action effects to become more pronounced as the bulk of Miner damage
shifts to the higher stress amplitudes.
In the work(ll) discussed in the previous section, spectrum tests
tended to include more of the lower stresses. Interaction curves
that appear to be quite satisfactory for cumulative-damage calculations
are, in this case, quite close to the basic S - N curves (Figs. 25 and
26). It may well be that the disparity results from the difference
in test spectra and that this effect is adequately included in the
relationship presented for determining the fictitious exponent, al
though this possibility warrants further investigation. At any rate,
the work discussed in this and the preceding section appears to pro
vide useful concepts for cumulative-damage evaluation under conditions
approximating those of the tests.
A final comment concerns the design implications of these two
theories. They are not applicable at present to fatigue design of
an aircraft structural joint, particularly with non-zero mean stress.
However, investigation of their possible use in design is instructive
as a source of suggestions for further research and also for the pos
sibility that similar concepts may later be found valid for more
complex structures and loading.
In general terms, the problem facing the designer is that of design
ing for a spectrum of load cycles. He must design the structure (choose
the proper amount and distribution of material) so that the stress spec
trum that results from the load spectrum will not result in fatigue
failure. (In some cases, the load spectrum may be changed slightly by
changes in amount of material, if loads are affected by structural
stiffness.) In practice, the amount of material is initially deter
mined by a static strength requirement and the fatigue life of this
design is determined. If the life is inadequate, reduction of stress
levels by adding material (or changing material or design details)
must be investigated and a configuration found that is satisfactory.
-53-
With the theory discussed here, the value of h (from Eq. (24)) and
the basic fatigue life would be determined first (for the statically
adequate design), and these in turn would permit determination of the
fatigue life with interaction effects included. If this life were
inadequate, additional material would be required. This would in
crease h and also the basic life, and both changes would tend to make
interaction effects less severe. Repetition of this procedure would
finally lead to a relationship between amount of material and life,
from which the required amount of material for a specified life could
be obtained. The important consideration in th~ process from the
design viewpoint is the effect on fatigue of changes in the applied
stress spectrum as changes in design are considered.
Further experimental investigation of these interesting theories
is necessary to validate their application to design problems. In
particular, tests with constant mean stress and also changing mean
stress, stress raisers, and larger number of test amplitudes covering
the spectrum more completely would be required.

-54-
XII. SHANLEY'S THEORY
In a comprehensive discussion of many facets of fatigue, Shanley
proposed a mechanism for the generation of fatigue cracks, based on
the progressive unbonding of atoms as a result of reversed slip pro
duced by cyclic stresses, (l3) He also presents interesting possibili
ties for relating this mechanism to many fatigue phenomena. It is
interesting to note that recent microscopic observations utilizing
taper-sectioning techniques have disclosed "fissures" produced by
cyclic stressing which are very similar to the physical picture of the
result of progressive unbonding, 7' Also of interest are results of
fatigue tests at extremely high vacuum, In a discussion of recent
progress in ultrahigh vacuum(l 4) (in which so few gas molecules remain
that the probability of one of them striking a freshly unbonded atom
is very small), it is stated that ultrahigh vacuum results in tremen
dous increases in fatigue life, and it is suggested that cracks opened
in tension may reweld in compression.
Shanley also presents two cumulative-damage theories. In the
first, the expression proposed for crack growth is
L. 1.
L. l.n X
exp (C o . n.) al. 1.
(25)
where L. is crack depth for the ith stress amplitude; L. , an initial 1. l.n
crack depth (produced by the first cycle) that is constant for all
stress amplitudes; C, a constant; o ., the magnitude of the ith stress al.
amplitude; x, a constant; and n., the number of applied stress cycles. 1.
Failure is defined as the attainment of a critical crack depth,
Lcr' the same for all stress amplitudes, when the number of cycles
reaches the number of cycles to failure, N., so that 1.
-1:
L cr X
L. exp (Co . N.) 1.n a1. 1.
(26)
See "Some Basic Studies of Fatigue in Metals," by W. A. Wood in Ref. 1.
-55-
It can be seen from this equation that the equation of the S - N
curve is established by this approach:
N constant K
=- (27)
It is well known that many experimental S - N relationships can be
adequately represented by this expression.
A general observation about cumulative-damage theories should be
noted here concerning a point of difference in theoretical approaches.
That is, a theory may or may not include as one of its features the
prediction of the shape of the S - N curve. Theories that contain
S - N relationship prediction as well as means for determining cumu
lative damage might be termed fundamental fatigue theories, while
theories that are addressed only to cumulative damage, accepting the
experimental S - N data, could be called simply cumulative-damage
theories. Miner's theory falls in the latter category, as do several
others, but it should also be noted that even the fundamental theories
at present rely on experimental S - N curves for determination of
constants (generally two or more) and in this respect reflect the
present lack of truly fundamental understanding of fatigue.
Returning to the damage relationships, if damage is defined as
L/1 , then from Eqs. (25) and (26) cr
D (C X c X N.) exp (J • n. - 0 ai a~ ~ ~
n. exp [C a~ N. (...2:. '- l)]
a~ ~ N. ~
N. exp [C K (...2:.
n. l)] (28)
~
As Shanley pointed out, this first theory is equivalent to Miner's
theory. This is also shown by the form of Eq. (28), which shows this
theory to be ~tress-independent. It is stated to be interaction-free
and is therefore equivalent to Miner's theory.
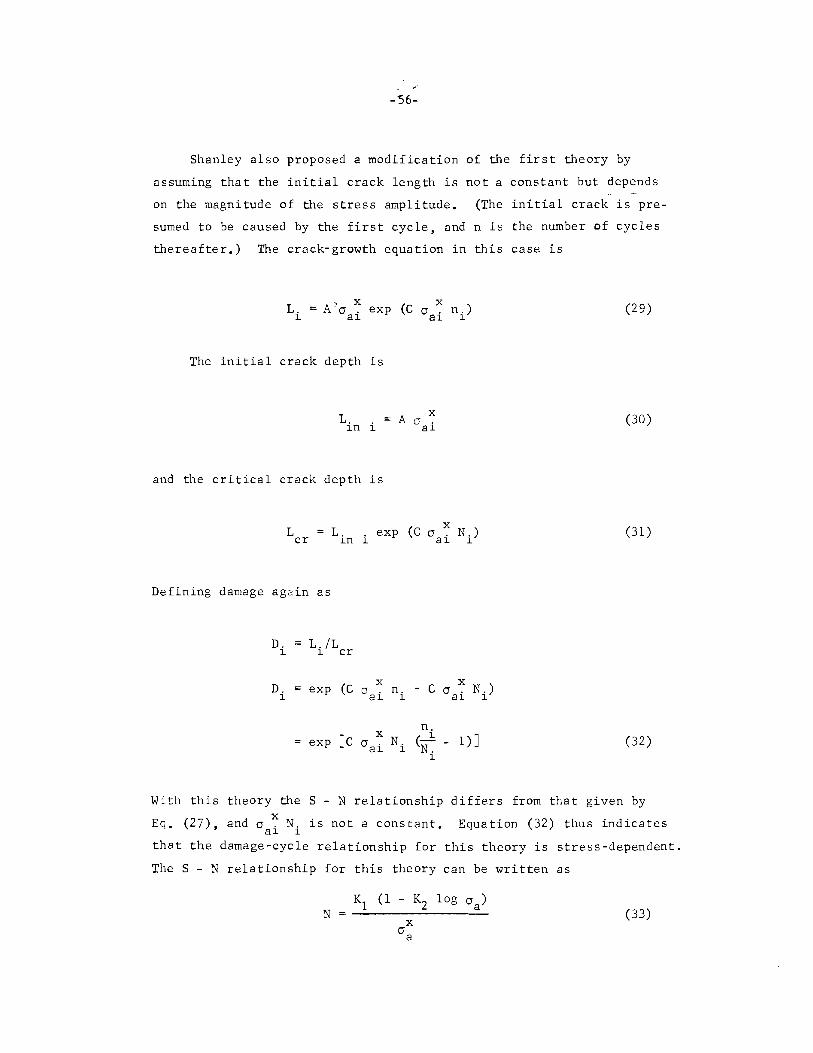
-56-
Shanley also proposed a modification of the first theory by
assuming that the initial crack length is not a constant but depends
on the magnitude of the stress amplitude. (The initial crack is pre
sumed to be caused by the first cycle, and n is the number of cycles
thereafter.) The crack-growth equation in this case is
The initial crack depth is
L. ; ~n .._ A c ~
a~
and the critical crack depth is
L cr
X L. ; exp (C a . N;) ~n .._ a~ .._
Defining damage again as
D. LJLcr ~
D. (C X c X
Ni) exp c n. - (J ~ ai ~ ai
n. [c X
N. (2. - l)] exp 0 ai ~ N. ~
(2 9)
(30)
(31)
(32)
With this theory the S - N relationship differs from that given by
Eq (27) and a~ N. is not a constant. Equation (32) thus indicates • ' a~ ~
that the damage-cycle relationship for this theory is stress-dependent.
The S - N relationship for this theory can be written as
N X
(J a
(33)

-I -57-
In this form it can be seen that this relationship can approach that
given in Eq. (27), depending on the determination of constants. (The
additional constant in Eq. (33) permits better fit of S - N data into
the high stress region.)
If initial damage is defined as
L. . ~n ~
Din i = -1-cr
the damage relationship from Eq. (32) can be written as
D. ~
n. (2- 1)
1 N. (--) ~ D. . ~n ~
[ 1 - (!!) J (D. . ) N i
~n ~
(34)
(35)
The normalized damage-cycle relationship for this theory would then
appear as shown in Fig. 29, with the higher stress amplitudes start
ing at higher initial damage.
When cumulative damage from a well-mixed spectrum is considered,
it can be assumed that the first application of the highest stress
in the spectrum (denoted here by aal) will immediately produce damage
equal to at least D. 1 . Lower stress cycles applied thereafter will ~n
result in damage progressing from that level. Thus, for the well-
mixed spectrum the damage curves should be revised to show this effect.
This can be done by adjusting the damage curves for the loT.ver stress
amplitudes to begin at D. 1
• The revised number of cycles to failure ~n
for the lower stresses is given by
N. ~
* N. - n. ~ ~
(36)

Cl)
C' 0
E 0
0
-58-
1 ----------------------
0 ~----------------~------------------~ 0 1
Fig. 29- Damage-cycle relationship (Shanley's stress- dependent in i ti a I-da mage theory (t3))
h ,., . h b f 1 . d h . th 1 . d w.ere ni ~s t e num er o eye es requ~re at t e ~ stress amp ~tu e
(when applied alone) to produce an amount of damage equal to the
initial damage produced at the highest stress amplitude. This is
given by
(37)
To find the value of (n/N)~', damage at the i th amplitude (from Eq. (35)) ~
is set equal to initial damage at the highest amplitude:
D. 1 ~n
(38)

-59-
In the original damage curve, applied cycles were denoted by n .. ~
Now, for stress amplitudes other than the highest in the spectrum,
* cycles should be counted starting from n., giving a revised cycle count ~
with ;, denoting the number of applied cycles ~
* n. n. n. ~ ~ ~
The revised cycle ratio is then
•k
* (.!!) - (.!!) n. n. - n. N . N . ~ n ~ ~ ~ ~
CN). "i'< ";'~
N. 1 N. - n. l - (-!!) 1 1 ~ N .
1
The original cycle ratio in terms of the revised is thus
Then, to transform the damage relationship
revised cycle ratio
D. (D. . ) [ l - (~). J (D. . ) [ l ~ ~n 1 1 ~n ~
... (D . . ) [ l - <i) . J [ l - (~) _]
~n ~ 1 ~
Using Eq. (38), this equation becomes
D. ~
(D. ~n
"-/\
- (.!!) -N . ~
to a function of
~k
[l - (.!!) J (~).} N . ~ ~
(39)
(40)
(41
the
(42)
(43)

-60-
Thus, if the damage curves are adjusted to begin at the initial
damage corresponding to the highest stress in the spectrum, and the
cycles to failure are adjusted accordingly, this theory can be viewed
as equivalent to Miner's theory, but with a revised S- N curve. The n "i~
quantity l - (N) can be considered as an interaction factor which mul-
tiplies values of N. to giveN., the cycles to failure to be used ~ ~
with Miner's theory for cumulative damage under spectrum loading.
The value of this factor can be determined from Eq. (38)
* £n (D. 1) 1 - (~) ~n
N i .tn (D. i) ~n
(44)
From Eqs. (32) and (34)
X a ai D. i D. l (o a 1) ~n ~n
(45)
The interaction factor can therefore be expressed as
... .R,n (Din 1) n 1 - C"K) (46)
X l [D . (
0ai'j J .R,n
~n 1 \.;al/
The value of initial damage at the highest stress amplitude can
be determined from Eq. (34). The value of C is determined by con
stants in the basicS- N relationship, Eq. (33), together with Eq.
(31) .
This theory clearly predicts shorter lifetimes than does Miner's
theory, but it is limited, strictly speaking, to the particular S - N
relationship used in Eq. (33). As yet, there has not been experimental
verification of variation of initial damage (caused by the first
stress cycle) with stress amplitude, which is basic to this theory.
(Note that the cumulative-damage relationships discussed above are
not those of Shanley's original "2-x" method, which is discussed in
the next section.)
r I

-61-
XIII. 2-x METHOD
In the original derivation of Shanley's 2-x method, (l3) one of
the steps implies the presence of interaction. In effect, it is
assumed that at a specified damage level, under spectrum loading,
high stress amplitudes cause greater damage and low stresses less
than they would cause when applied alone at the same damage level,
and initial-damage differences are neglected. Results are theoreti
cally limited to the specificS- N relationship of Eq. (33).
In the following, a modified 2-x method will be considered,
applicable to any S - N relationship. In other words, it will be
reinterpreted as simply a cumulative-damage theory.
The original derivation leads to definition of a reduced stress
amplitude:
where a ar
2x
[I: dn. a . ~
l al J1
L: dn. l
l/2x
(47)
is the stress amplitude at which failure would result after
the same number of cycles as the number of cycles in the spectrum that
produces failure. The quantities dn. are the number of cycles of l
the ith amplitude at failure or, as they will be used later, the number
of cycles of the ith amplitude applied in a specified period of time.
Now assuming that the S - N relationship of Eq. (27) can be used
with Eq. (47) ..
2x 2x
L: dn. a . l al
L: dn. l
2 K dn. l I: ---,2,---
N. l
L: dn. l

E dn. ~
-;z r
2 ,E dn.) (--~
N r
E dn. ~
N r
~62-
dn. E-~
2 N. ~
E (dni • E dni) N. N. ~ ~
(48)
where N is the total number of spectrum cycles that produces failure. r
If the quantities dn. are defined as the number of cycles of the ith ~
amplitude applied in a specified length of time, the left-hand quan-
tity in Eq. (48) is the fraction of fatigue life expended in that
specified length of time. Denoting this as LF 2x, it can be compared
with the co~parable quantity from Miner's theory, LFM:
[
dn. E I ~ \.~
(49)
~
(50)
In this form it can be seen that in the 2-x method, Miner frac
tions are multiplied by a weighting quantity, and the square root of
the summation provides the life fraction.
It is fairly easy to show that the 2-x method in this form will
always predict shorter life under spectrum loading than the Miner
life, by proving that the life fraction expended during identical

-63-
spectrum loading is larger as computed by the 2-x method, or
Then
(LF )2 > LF 2 2x M
dn. 2
z-1 dn. 2
z-1 z dn. ( _L + _L) > ~ ~ (-1.) + 2: 2: dn. (-1.) + ~ N. 1. J . 2 N. 2 N.
1. i=l j=i+l 1. i=l 1. J
(z is the number of stress amplitudes in the spectrum.)
1 1 2 -+->--N 2 N2 N.N.
. . l. J 1. J
N.2+N.2 _.._ __ _;;1.~ > 2
N.N. l J
N.2 + N.
2 > 2 N.N.
J l l. J
2 (N.-N.) >0
J l
z 2:
j=i+l
dn. dn. 2 1. J
N .N. 1. J
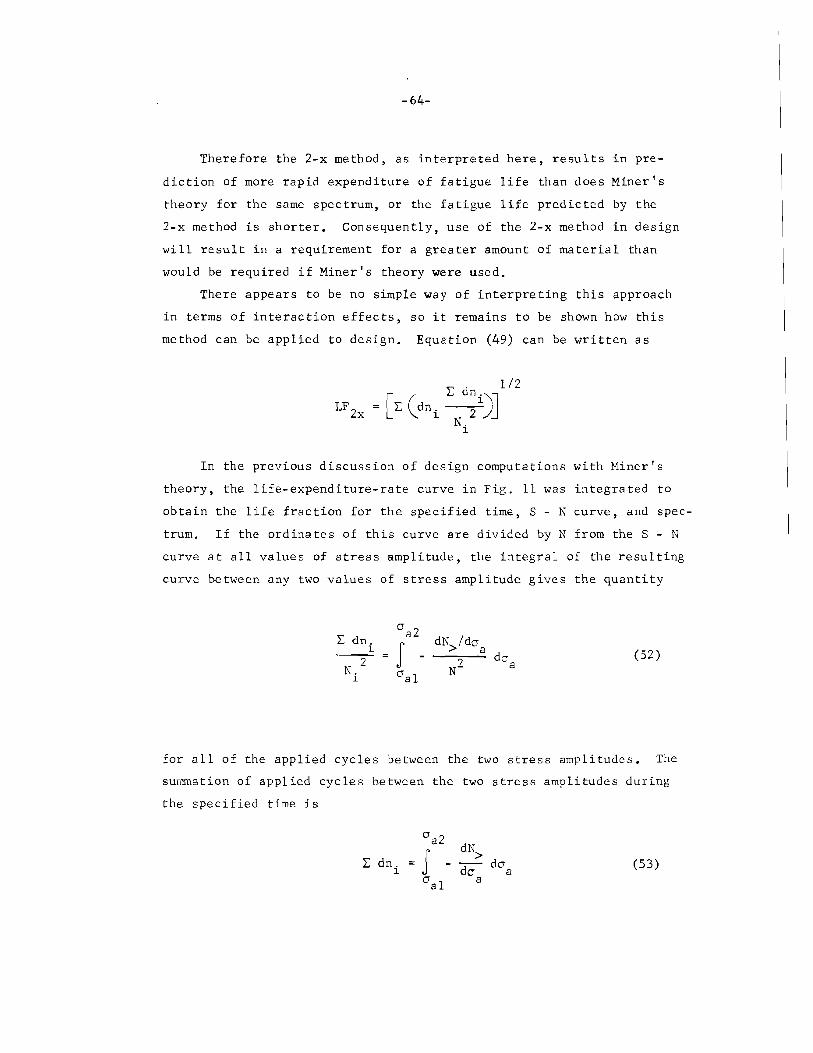
-64-
Therefore the 2-x method, as interpreted here, results in pre
diction of more rapid expenditure of fatigue life than does Miner's
theory for the same spectrum, or the fatigue life predicted by the
2-x method is shorter. Consequently, use of the 2-x method in design
will result in a requirement for a greater amount of material than
would be required if Miner's theory were used.
There appears to be no simple way of interpreting this approach
in terms of interaction effects, so it remains to be shown how this
method can be applied to design. Equation (49) can be written as
In the previous discussion of design computations with Miner's
theory, the life-expenditure-rate curve in Fig. ll was integrated to
obtain the life fraction for the specified time, S - N curve, and spec
trum. If the ordinates of this curve are divided by N from the S - N
curve at all values of stress amplitude, the integral of the resulting
curve between any two values of stress amplitude gives the quantity
L: dn. ~
~ ~
(52)
for all of the applied cycles between the two stress amplitudes. The
summation of applied cycles between the two stress amplitudes during
the specified time is
L: dn. ~
(53)
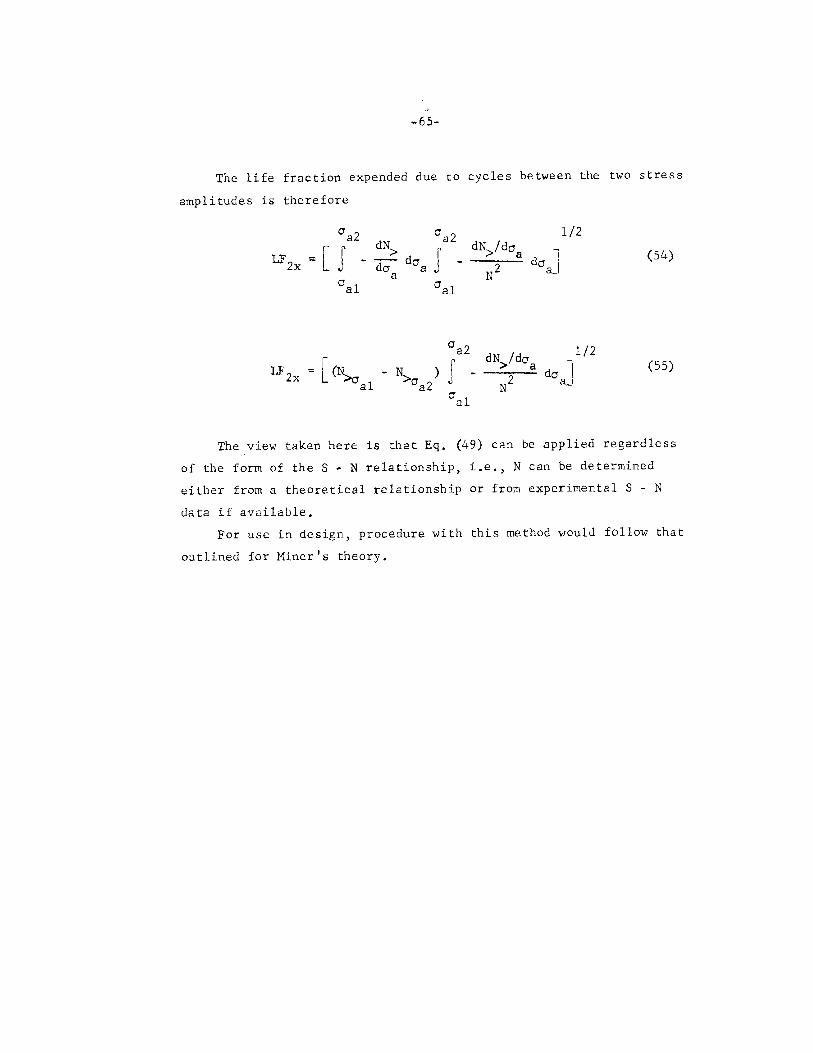
-65-
The life fraction expended due to cycles between the two stress
amplitudes is therefore
l/2
(54)
(55)
The view taken here is that Eq. (49) can be applied regardless
of the form of the S ~ N relationship, i.e., N can be determined
either from a theoretical relationship or from experimental S - N
data if available.
For use in design, procedure with this method would follow that
outlined for Miner's theory.

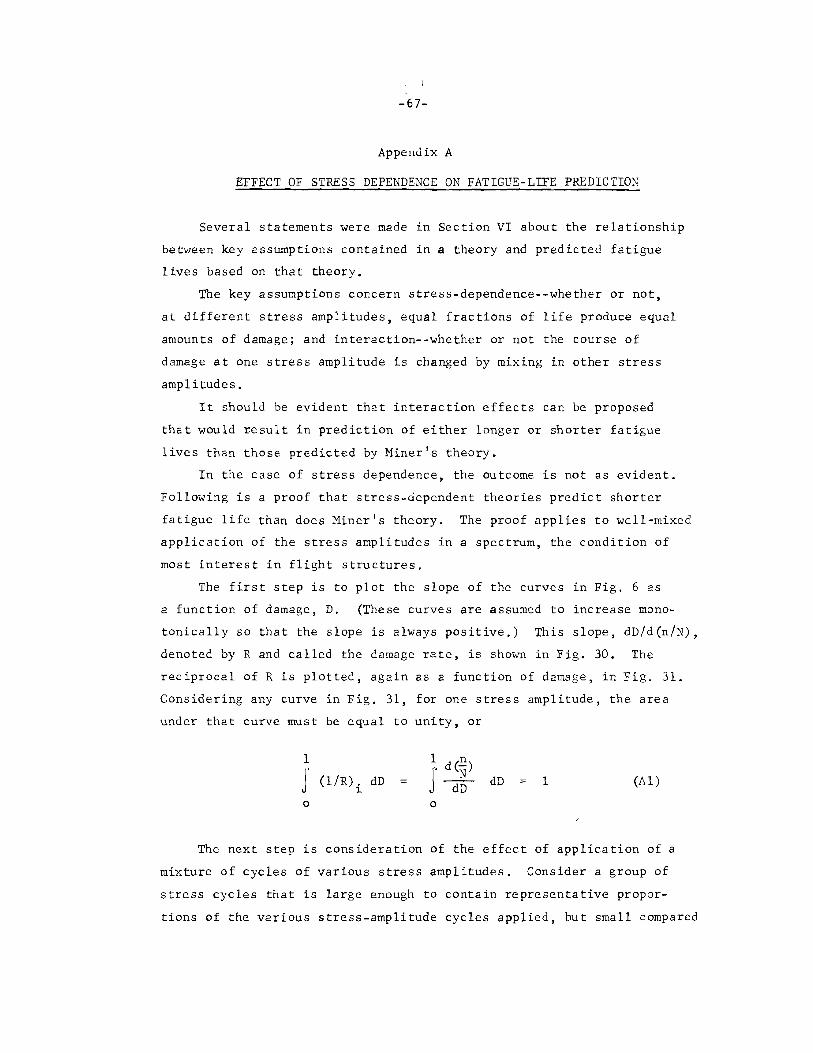
-67-
Appendix A
EFFECT OF STRESS DEPENDENCE ON FATIGUE-LIFE PREDICTION
Several statements were made in Section VI about the relationship
between key assumptions contained in a theory and predicted fatigue
lives based on that theory.
The key assumptions concern stress-dependence--whether or not,
at different stress amplitudes, equal fractions of life produce equal
amounts of damage; and interaction--whether or not the course of
damage at one stress amplitude is changed by mixing in other stress
amplitudes.
It should be evident that interaction effects can be proposed
that would result in prediction of either longer or shorter fatigue
lives than those predicted by Miner's theory.
In the case of stress dependence, the outcome is not as evident.
Following is a proof that stress-dependent theories predict shorter
fatigue life than does Miner's theory. The proof applies to well-mixed
application of the stress amplitudes in a spectrum, the condition of
most interest in flight structures.
The first step is to plot the slope of the curves in Fig. 6 as
a function of damage, D. (These curves are assumed to increase mono
tonically so that the slope is always positive.) This slope, dD/d(n/N),
denoted by R and called the damage rate, is shown in Fig. 30. The
reciprocal of R is plotted, again as a function of damage, in fig. 31.
Considering any curve in Fig. 31, for one stress amplitude, the area
under that curve must be equal to unity, or
1
J (1/R) i dD
0
1 n
I d(N)
dD dD
0
1 (Al)
The next step is consideration of the effect of application of a
mixture of cycles of various stress amplitudes. Consider a group of
stress cycles that is large enough to contain representative propor
tions of the various stress-amplitude cycles applied, but small compared

a::: Cl)
0
Cl)
0' 0
E 0 Cl
a::: '
Cl)
0' 0 E c
-68-
Damage, D
Fig. 3 0- Damage rate versus damage curves (from damage-cycle curves of Fig. 6)
d(~) ..1.=--R dD
~1 0 u e 0.. u <ll
a:::
Damage, D
Fig. 31- Reciprocal-damage rate as a function of damage

-69-
with the total number of cycles to be applied. The total (as yet
unknown) number of cycles of the ith stress amplitude that can be
applied before failure will be designated by n.; dn. is the number of 1. 1.
1 f h .th 1' d . th . N . h eye es o t e 1. amp 1.tu e 1.n e representat1.ve group; . 1.s t e 1.
number of cycles to failure when the ith amplitude is applied alone.
Two further definitions are required: ~. is equal to dn./dn1
, 1. 1.
the ratio of the number of cycles of the ith amplitude in the repre-
sentative group to the number of cycles of an arbitrarily selected
amplitude (called the first amplitude) in the representative group.
The assumption that the group is representative means that ~. is also 1.
equal to ni/n1 • And ~i is equal to Ni/N1
, the ratio of cycles to failure
in a single-level test at the ith amplitude to cycles to failure in a
single-level test at the designated first amplitude. The ~. are del.
termined by the shape of the applied stress spectrum, and the ~i by
the S - N curve.
Now consider the situation after stress cycles have been applied
until damage has reached some specified level. The aforesaid repre
sentative group of cycles is then applied. The damage produced by
this group will be called dD. If the number of cycles in the group
is small enough, dD will be independent of the order of application
of the various amplitude cycles within the group. The situation is
depicted graphically in Fig. 32, which shows a section of Fig. 31
with the horizontal scale greatly expanded. The total damage incre
ment, dD, is made up of the sum of the damage increments due to each
amplitude, or
dD l:dD. 1.
The incremental damage from the ith amplitude is given by
dn. dD --\ dD.
1.
(d(E)_; R. d(E) 1. N. 1. N . 1. 1. N . 1.
(A2)
(A3)

.... ....... ...... Q)
0 <Tal .... Q)
~i Ol 0
E 0
"U o-oz _!_ 0
\ u 0 .... a. -u Q)
a:
' I r··.·.~········~
dDi
1-r ~ D -----~ Damage. D
Fig. 32-Expanded section of Fig. 31, showing incremental damage produced by
representative group of cycles within a spectrum of stress amplitudes
I
" 0 I
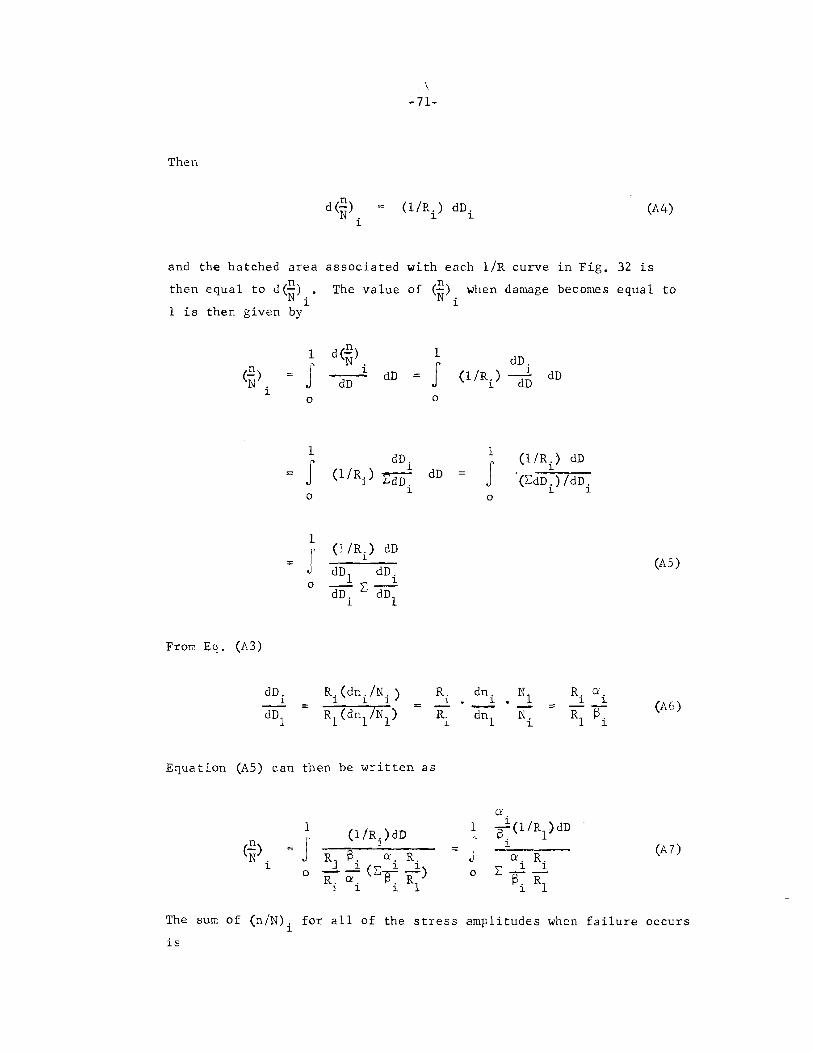
-71-
Then
(1/R.) dD. ~ ~
(A4)
and the hatched area n
then equal to d(N) .• ~
1 is then given by
associated with each 1/R curve in Fig. 32 is
The value of (~) when damage becomes equal to N i
From Eq. (A3)
1 1
J dD J 0 0
1
I dD.
(1/Ri) tdo~ dD
0
1 ·· (1/R.) dD
J dD1
t dDi 0 -L:;
dDi dD1
~
(1 /R.) ~
1
J 0
dD. ~
dD dD
(1/R.) dD ~
(tdD.)/dD. ~ ~
Ri dni • N1 ~ dn1 Ni
Equation (AS) can then be written as
Q'
1 (1/R.)dD
l ~~(l/R1 )dD (.!!) J 1 J 1
N . Rl ~. a. R. 0'. R. ~ 1 (L: 1 1 L: 2 _.2 0 -- s--) 0
(:\ Rl R. a. . R1 1 1 1
(AS)
(A6)
(A 7)
The sum of (n/N). for all of the stress amplitudes when failure occurs ~
is

' /
-72-
(AS)
If R (which, it must be remembered, is a function of D) is the same for
all stress amplitudes (as would be the case for the stress-independent
damage-cycle relationship shown in Fig. 5), Eq. (A8) becomes
Ct'. 2:2
13. l
1 (A9)
This result shows that the assumptions of stress-independent, inter
action-free, monotonically increasing damage (not necessarily linear
with cycles) in a cumulative fatigue damage theory make that theory
equivalent to Miner's theory.
For the case of stress-dependence, evaluation of the summation
in Eq. (A8) is more difficult. However, it can be shown that this
summation is less than one. This will be done by proving the following
inequality:
<
0!.
L: (3~ (1/Ri) l
0!.
z:2 13.
l
(AlO)
The left-hand side of this inequality is the integrand of Eq. (AS).
The right-hand side is a quantity such that the value of its integral
over the range of damage from zero to one is unity, i.e.
l 0! Ct' J 1 ~ i
(1/R.) I: i (1/R.)dD
J T. l 13:" 0 l l
dD l = 1 (All)
ct Ct'. 0 L:2 L: l
13. F. l l
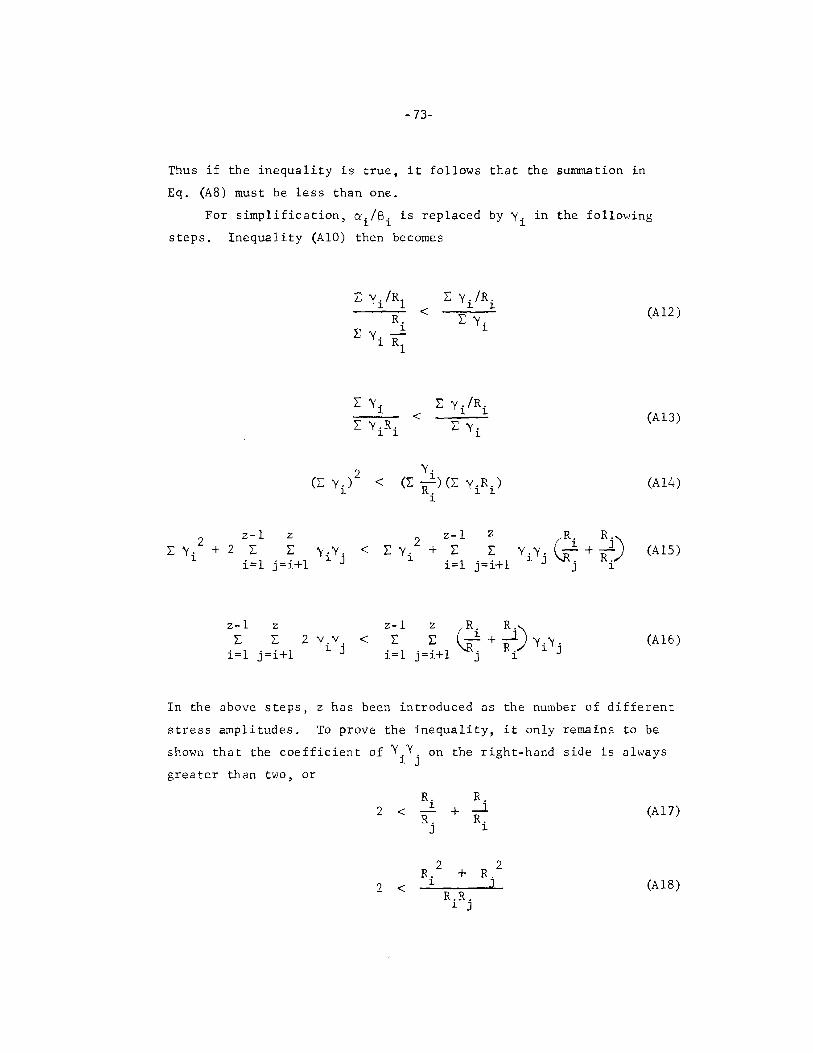
-73-
Thus if the inequality is true, it follows that the summation in
Eq. (A8) must be less than one.
For simplification, a./~. is replaced by yl.. in the following l. l.
steps. Inequality (AlO) then becomes
R. l: y, Rl.
l. 1
L: y./R. l. l.
2:: y i
L: y. l.
y,
0: R ~ )(L: y i R i) l.
< GR. R.) ~+___.l
. R.
z-1 z l: L: 2 yiyj
i=l j =i+l <
J l.
z-1 z (~· R ') L: L: ~+__.1 yy
i=l j=i+l j Ri i j
(Al2)
(Al3)
(Al4)
(Al5)
(Al6)
In the above steps, z has been introduced as the number of different
stress amplitudes. To prove the inequality, it only remains to be
shown that the coefficient of Y Y. on the right-hand side is always i J
greater than two, or
R. R. 2
l. + _l < -
R. R. J l.
(Al7)
R. 2 + R.2 2 <
l.
R.R. (Al8)
l. J

-74-
2 R. R. < R. 2 + R. 2 l J l J
(Al9)
0 < (Ri R.)2 J
(A20)
The inequality is thereby proved if R is not identically equal (at
equal values of D) for all stress amplitudes. Values of R are not
equal at equal values of D in a stress-dependent theory, and therefore
these theories must predict shorter life than would Miner's theory
for the same stress spectrum, barring assumption of interaction.

-75-
Appendix B
ALGEBRAIC ANALYSIS OF GROVER'S THEORY
In the discussion of Grover's theory it was stated that it could
be shown algebraically that this theory predicts shorter lives than
does Miner's theory (except for the special case when the ratio of
first-stage cycles to total cycles is constant for all stress levels).
In the following proof, the notation is the same as that in the ori
ginal reference. (S)
The basic equations of the theory, for failure under spectrum
loading, are
n. 2: __ 1._ . a .N. 1. 1. 1.
1 (Bl)
1 (B2)
In these equations n. is the number of cycles applied at the ith 1.
stress amplitude during the first stage of fatigue damage, and mi is
the corresponding number of cycles during the second stage; N. is 1. th b f 1 f 1 h . th 1 . d . 1 e num er o eye es to ai ure at t e 1. amp 1.tu e in a s1.ng e-
level test, and a. is the fraction of N. at which first-stage damage 1. 1.
is complete and second-stage damage begins.
Considering a specified spectrum of stress amplitudes, one ampli
tude is selected as a reference amplitude, and the quantities defined
above are denoted n1
, m1
, N1
, and a1
for this amplitude. With a known
spectrum and basic S - N curve, the quantities below are also known:
n. m. 1. 1. Q'i = =
nl ml (B3)
N. si
1. = Nl
(B4)
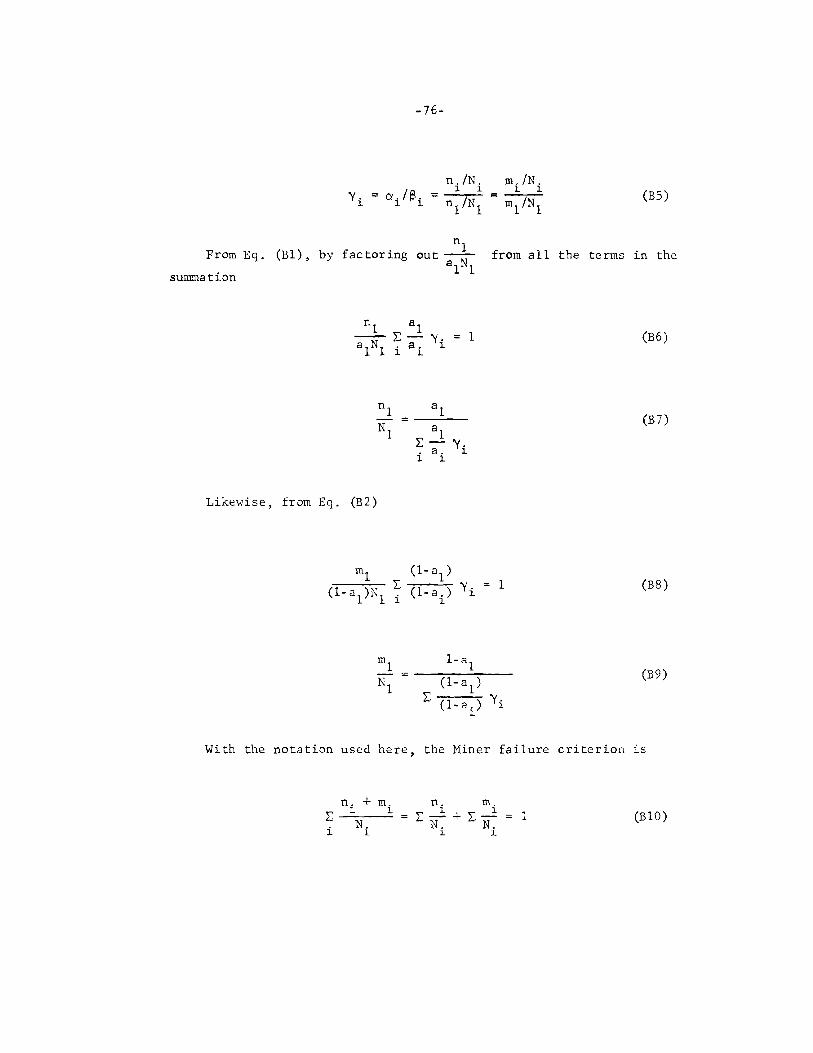
-76-
(BS)
nl From Eq. (Bl), by factoring out-
alNl from all the terms in the
summation
1 (B6)
nl al
Nl al l:- 'Yi i a.
l
(B7)
Likewise, from Eq. (B2)
m1
(l-a1
)
(l-a1
)K1 ~ (1-ai) 'Yi
1 (BS)
ml l-a1
(B9) N (l-a
1)
1 L: ( 1- a . ) 'Yi
l
With the notation used here, the Miner failure criterion is
2:: i
n. + m. l l
N. l
n. m. L:....2:.+L:2
N. N. 1 (BlO)
l l
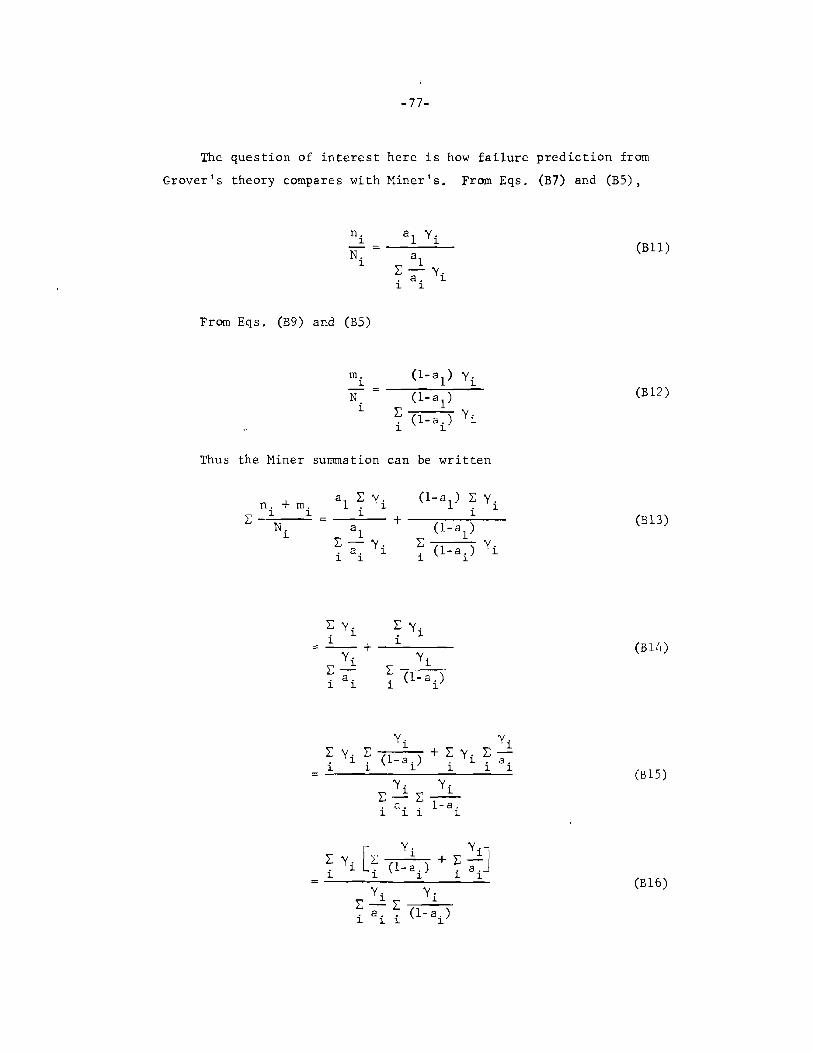
-77-
The question of interest here is how failure prediction from
Grover's theory compares with Miner's. From Eqs. (B7) and (BS),
From Eqs. (B9)
Thus the Miner
n. + m. L:
~ ~
N. ~
n. al Yi ~
N. al ~ L:- y. i a. ~
~
and (BS)
m. (l-a1) yi ~
N (l-a1) i L: (1-a.) yi
i ~
summation can be written
al L: y. . ~ (l-a
1) L: y. . ~
~ ~
+ (l-a1) al L:- y. L: (1-a.) i a. ~ i ~ ~
L:y. L:y. . ~ . ~
= -~- + --~---y.
2::2 i ai
y. L: ~ . (1- a.) ~ ~
y. y. L: 2 L: -~; a .. 1-a. .... ~ ~ ~
yi
r Y; Y '] L: LL: .... + L: _2: . y i . (1- a.) . a. ~ ~ ~ ~ ~
y. y; L: .2. L: --:---""". a .. (1-a.) ~ ~ ~ ~
(Bll)
(Bl2)
(Bl3)
(Bl4)
(Bl5)
(Bl6)
-78-
y. y{ L: 2 L: ~-.L~
a. (1-a.) ~ ~
yi ~ yi ~ a.(l-a.) ~ ~ ~ ~
y. y{ L: 2 L: --:-~ .... .._,... ~ a .. (1-a.) .L ~ ~ ~
2 yi
L: a.(l-a.) +
i ~ 1.
2 yi
L: a. (1- a.) + i ~ ~
2 yi
L: + a.(l-a.) i ~ ~
2 yi
L: a. (1-a.)
+ i ~ 1.
z-1 L:
i=l
z-1 L:
i=l
z-1 L:
i=l
z-1 L:
i=l
z G 1 . 1 ) L: y.y. ~+ . '+l 1. J .(1-a.) a.(l-a.) ~=~ ~ ~ J J
z G 1 1 L: y.y. + a. (1- a.)) . '+l 1. J .(1-a.)
j=~ J ~ ~ J
z a.+a.-a. 2 2 -a.
L: y.y. ~ J ~ J
a.a.(l-a.)(l-a.) j=i+l ~ J ~ J ~ J
z a.+a.-2a.a. L: y .y. ~ J 1. J
a.a.(l-a.)(l-a.) j=i+l ~ J ~ J ~ J
(Bl7)
(Bl8)
(Bl9)
(B20)
For each value of i and j, the numerator and denominator of
Eq. (B20) are identical except for the numerator of the coefficient
of y .y .. 1. J
(The symbol z in the summations denotes the total number of
amplitudes in the stress spectrum.) If the values of a are not equal
f h . th d . th 1 . d or t e 1. an J stress amp ~tu es
(a. 2 - a.) > 0 1. J
2 2 > 2 a. +a. a. ~ J ~
(B2l)
a. J
(B22)

-79-
In view of the inequality (B22), it can be seen that the coeffi
cient of y.y. in the numerator of Eq. (B20) is less for each i and j L J
than the corresponding coefficient in the denominator. Therefore it
follows that the Miner summation in Eq. (Bl3) will be less than one
unless the value of a is identical for all stress amplitudes. Thus,
for any nonequal values of a, Grover's theory will predict failure in
fewer cycles than will Miner's theory. In terms of design, for a spec
ified load spectrum and a specified life requirement, use of Grover's
theory would lead to a design requiring a greater amount of material
than would be required by use of Miner's theory.


-81-
REFERENCES
1. Averbach, B. L., et al., (eds.), Fracture, Proceedings of an International Conference on the Atomic Mechanisms of Fracture, The Technology Press of Massachusetts Institute of Technology and John Wiley and Sons, Inc., New York, 1959.
2. Grosskreutz, J. C., and P. Waldow, Research on the Mechanisms of Fatigue in Ultra Small Specimens, Midwest Research Institute, Kansas City, Missouri, Quarterly Progress Report No. 3, December 1961.
3. Dupouy, G., and F. Perrier, "Study of the Structure of Metals and Alloys with a Mill ion Volt Electron Microscope," Comptes Rend us (Proceedings of the French Academy of Science), No. 22, November 27, 1961.
4. Miner. M.A., "Cumulative Damage in Fatigue," J. Appl. Mech., Vol. 12, No. 1, September 1945,
5. Palmgren, A., "Die Lebensdauer von Kugellagern," Zeitschrift des Vereines Deutscher Ingenieure, Vol. 68, No. 14, 1924.
6. Langer, B. F., "Fatigue Failure from Stress Cycles of Varying Amplitudes," J. Appl. Mech., Vol. 4, No. 4, December 1937.
7. Valluri, S. A., "A Unified Engineering Theory of High Stress Level Fatigue," Aerospace Eng., Vol. 20, No. 10, October 1961.
8. Grover, H. J., "An Observation Concerning the Cycle Ratio in Cumulative Damage," Symposium on Fatigue of Aircraft Structures, American Society for Testing Materials, Special Technical Publication No. 274, 1960.
9. Corten, H. T., and T. J. Dolan," Cumulative Fatigue Damage," International Conference on Fatigue of Metals, Institution of Me~ anical Engineers and American Society of Mechanical Engineers, 1956.
10, Liu, H. W., and H. T. Corten, Fatigue Damage During Complex Stress Histories, NASA TN D-256, November 1959.
11. Liu, H. W., and H. T. Corten, Fatigue Damage Under Varying Stress Amplitudes, NASA TN D-647, November 1960.
12. Freudenthal, A.M., and R. A. Heller, "On Stress Interaction in Fatigue and a Cumulative Damage Rule," J. Aerospace Sci., Vol. 26, No. 7, July 1959.
13. Shanley, F. R., A Theory of Fatigue Based on Unbonding During Reversed Slip, The RAND Corporation, P-350, November 11, 1952.

-82-
14. Steinherz, H. A., and P. A. Redhead, "Ultrahigh Vacuum,"~ Amer., Vol. 206, No. 3, March 1962.