MEMORANDUM - gouv€¦ · MEMORANDUM Golder Associates ... The study reach for Dyke EM-A beach...
10
Date: November 18, 2008 Project No. 07-1221-0028 To: Carl Pednault, Golder Associates Ltd. (Montreal) 1/5 MEMORANDUM Golder Associates Ltd. was commissioned by Osisko to conduct a dyke breach flood inundation study of a proposed Polishing Pond for the Malartic Project in southwestern Quebec. The main purpose of the study was to prepare a dyke breach flood inundation map. The study was conducted in accordance with industry-accepted standards and the 2007 Canadian Dam Association’s (CDA) Dam Safety Guidelines for inundation studies. The proposed Polishing Pond has a water volume of about 6 million m 3 and a surface area of 1.38 km 2 at the operating level of 325.0 m. The Polishing Pond is contained by five dykes. The dyke breach analysis was conducted for two dykes; EM-A and EM-B. The heights of Dykes EM-A and EM-B above the valley bottom are approximately 13.5 m and 9.5 m, respectively. The FLDWAV model (Version 2-0-0 dated June 1, 2000) developed by the U.S. National Weather Service was used to simulate the outflows from the proposed Polishing Pond and through the downstream valley resulting from breaches in Dykes EM-A and EM-B. The study reach for Dyke EM-A beach flood routing is about 16 km, from the Dyke EM-A to Thompson River at Dubuisson. The main structures along the potential dyke breach floodway include a road crossing on the Ruisseau Raymond reach and three road crossings on the Piche River reach. The populated areas along the dyke breach floodway include the Northern Star Mine and Dubuisson. The floodway for a potential Dyke EM-B failure flood is along an Unnamed Creek between Dyke EM-B and Lake Fourniere, with a study reach of about 1.8 km. The main structures along the potential dyke breach floodway are two local road crossings on the Unnamed Creek. The only populated area along the floodway is adjacent to the Rang 7 Road. Two dyke breach scenarios were analyzed. One scenario was a “flood induced” dyke overtopping event as dictated by the CDA guidelines for determining dam/dyke classification. The overtopping failure was conducted under an extreme flood event (i.e. design PMF). The other scenario was a fair weather piping failure at the operating water level of 325.0 m in the proposed Polishing Pond. The scenarios were analyzed for Dykes EM-A and EM-B. The dyke breach model requires two main types of input data: i) dyke breach parameters; and ii) pond inflow rates. Dyke breach parameters are defined by the shape and size of a breach and the time required for its development (also called time to failure). Table 1 shows the estimated dyke breach parameter values for Dykes EM-A and EM-B. Dyke breach parameter values were selected based on the recommendations made by the U.S. Federal Energy Regulatory Commission (FERC 1994) and the empirical formulations by Fread (2001). A trapezoidal type breach with 1:1 (H:V) breach side slopes was assumed. The breach was assumed to commence 0.3 m above the top of the dykes (326.8 m) for dyke overtopping failures and at the operating level (325.0 m) for dyke piping failures. TO Carl Pednault, Golder Associates Ltd. (Montreal) DATE November 18, 2008 CC Michel Julien, Golder Associates Ltd. (Montreal) FROM Moniz Mukto, Hua Zhang, Murray Fitch and Dejiang Long, Golder Associates Ltd. (Calgary) PROJECT No. 07-1221-0028 SUMMARY OF A DYKE BREACH FLOOD INUNDATION STUDY – CANADIAN MALARTIC PROJECT.
Transcript of MEMORANDUM - gouv€¦ · MEMORANDUM Golder Associates ... The study reach for Dyke EM-A beach...

Date: November 18, 2008 Project No. 07-1221-0028 To: Carl Pednault, Golder Associates Ltd. (Montreal) 1/5
MEMORANDUM
Golder Associates Ltd. was commissioned by Osisko to conduct a dyke breach flood inundation study of a proposed Polishing Pond for the Malartic Project in southwestern Quebec. The main purpose of the study was to prepare a dyke breach flood inundation map. The study was conducted in accordance with industry-accepted standards and the 2007 Canadian Dam Association’s (CDA) Dam Safety Guidelines for inundation studies.
The proposed Polishing Pond has a water volume of about 6 million m3 and a surface area of 1.38 km2 at the operating level of 325.0 m. The Polishing Pond is contained by five dykes. The dyke breach analysis was conducted for two dykes; EM-A and EM-B. The heights of Dykes EM-A and EM-B above the valley bottom are approximately 13.5 m and 9.5 m, respectively.
The FLDWAV model (Version 2-0-0 dated June 1, 2000) developed by the U.S. National Weather Service was used to simulate the outflows from the proposed Polishing Pond and through the downstream valley resulting from breaches in Dykes EM-A and EM-B. The study reach for Dyke EM-A beach flood routing is about 16 km, from the Dyke EM-A to Thompson River at Dubuisson. The main structures along the potential dyke breach floodway include a road crossing on the Ruisseau Raymond reach and three road crossings on the Piche River reach. The populated areas along the dyke breach floodway include the Northern Star Mine and Dubuisson. The floodway for a potential Dyke EM-B failure flood is along an Unnamed Creek between Dyke EM-B and Lake Fourniere, with a study reach of about 1.8 km. The main structures along the potential dyke breach floodway are two local road crossings on the Unnamed Creek. The only populated area along the floodway is adjacent to the Rang 7 Road.
Two dyke breach scenarios were analyzed. One scenario was a “flood induced” dyke overtopping event as dictated by the CDA guidelines for determining dam/dyke classification. The overtopping failure was conducted under an extreme flood event (i.e. design PMF). The other scenario was a fair weather piping failure at the operating water level of 325.0 m in the proposed Polishing Pond. The scenarios were analyzed for Dykes EM-A and EM-B. The dyke breach model requires two main types of input data: i) dyke breach parameters; and ii) pond inflow rates. Dyke breach parameters are defined by the shape and size of a breach and the time required for its development (also called time to failure). Table 1 shows the estimated dyke breach parameter values for Dykes EM-A and EM-B. Dyke breach parameter values were selected based on the recommendations made by the U.S. Federal Energy Regulatory Commission (FERC 1994) and the empirical formulations by Fread (2001). A trapezoidal type breach with 1:1 (H:V) breach side slopes was assumed. The breach was assumed to commence 0.3 m above the top of the dykes (326.8 m) for dyke overtopping failures and at the operating level (325.0 m) for dyke piping failures.
TO Carl Pednault, Golder Associates Ltd. (Montreal) DATE November 18, 2008
CC Michel Julien, Golder Associates Ltd. (Montreal)
FROM Moniz Mukto, Hua Zhang, Murray Fitch and Dejiang Long, Golder Associates Ltd. (Calgary) PROJECT No. 07-1221-0028
SUMMARY OF A DYKE BREACH FLOOD INUNDATION STUDY – CANADIAN MALARTIC PROJECT.

Date: November 18, 2008 Project No. 07-1221-0028 To: Carl Pednault, Golder Associates Ltd. (Montreal) 2/5
MEMORANDUM
Table 1: Estimated Dyke Breach Parameter Values Dyke EM-A Dyke EM-B
Dyke Breach Parameters Overtopping Failure
Piping Failure
Overtopping Failure
Piping Failure
Bottom Width of Breach (m) 54.0 27.0 38.0 19.0 Side Slope of Breach (H:V) 1:1 1:1 1:1 1:1 Time to Failure (hour) 0.5 1.0 0.5 1.0 A normal flow boundary condition was conservatively assumed for the most downstream cross section of the study reaches. The channel depths were assumed to be 1 m and 1.5 m along the floodway for Dykes EM-B and EM-A, respectively. The channels bed and bank roughness (i.e. Manning’s roughness coefficients) were assumed to be 0.04 and 0.10 for the main channel and floodplain, respectively. These coefficients were estimated based on the aerial photographs of the sites.
For estimating the pond inflow rates, Polishing Pond volume, configurations of Polishing Pond and dykes, and Probable Maximum Flood (PMF) were used as inputs. HEC-HMS (Hydrologic Engineering Center – Hydrologic Modeling System), an industry-standard modeling package, was used for estimating the PMF.
A conservative approach was adopted in this study to generate conservative modeling results for the dyke breach flood inundation mapping to account for the uncertainty caused by the modeling of the dyke breach process, the unavailability of any known historical floods for a reliable calibration of the dyke breach floods, and the limited stream channel and floodplain survey information. This conservative approach is characterized by the selection of conservative breach modeling parameters and conservative Manning’s n values for the creek channels and floodplains. This approach generates modeling results on a conservative basis for preparing the dyke breach flood inundation map and for evaluating the potential downstream impacts of the dyke breach floods within the study areas.
The modeling results were used to prepare a dyke breach flood inundation map as shown in Figure 1. Figure 2 to 9 shows the predicted dyke breach modeling results for Dykes EM-A and EM-B. Both the overtopping and piping failure modeling results were compared to show the differences of these two types of dyke breach floods.
The dyke breach modeling results for Dyke EM-A (see Figure 2 to 5) are summarized as follows:
In the event of an overtopping failure of Dyke EM-A, the flood peak level immediately downstream of the dyke is predicted to be 321.3 m or approximately 10.3 m above the valley bottom. The time to flood peak level is estimated to be approximately 0.5 hour after commencement of the dyke breach. The predicted flood peak discharge is about 4700 m3/s. In the event of a piping failure, the flood peak level immediately downstream of the dyke is predicted to be 319.0 m, which is 2.3 m lower than the flood peak level associated with the overtopping failure.

Date: November 18, 2008 Project No. 07-1221-0028 To: Carl Pednault, Golder Associates Ltd. (Montreal) 3/5
MEMORANDUM
The first local road crossing at the Ruisseau Raymond located approximately 1.8 km downstream of Dyke EM-A, would be overtopped and damaged by the dyke breach flood. The flood peak level at the road crossing is predicted to be 312.0 m and the corresponding peak flow depth is predicted to be 10.0 m. The time to flood peak level is 0.8 hours after commencement of the dyke breach. The flood peak discharge is predicted to be 3600 m3/s. In the event of a piping failure, the flood peak level at the bridge crossing is predicted to be 309.8 m, which is 2.2 m lower than the flood peak level associated with the overtopping failure.
The second local road crossing at the Piche River located approximately 5.6 km downstream of Dyke EM-A, would be overtopped and damaged by the dyke breach flood. The flood peak level at the road crossing is predicted to be 302.2 m and the corresponding peak flow depth is predicted to be 5.7 m. The time to flood peak level is 2.2 hours after commencement of the dyke breach. The flood peak discharge is estimated to be 1400 m3/s. In the event of a piping failure, the flood peak level at the road crossing is predicted to be 301.5 m, which is 0.7 m lower than the flood peak level associated with the overtopping failure.
The third road crossing at the Piche River, located approximately 7.8 km downstream of Dyke EM-A, would be overtopped and damaged by the dyke breach flood. The flood peak level at the road crossing is predicted to be 300.6 m and the corresponding peak flow depth is predicted to be 5.7 m. The time to flood peak level is 3.5 hours after commencement of the dyke breach. The flood peak discharge is estimated to be 530 m3/s. In the event of a piping failure, the flood peak level at the road crossing is predicted to be 300.0 m, which is 0.6 m lower than the flood peak level associated with the overtopping failure.
The fourth road crossing at the Piche River, located approximately 14.1 km downstream of Dyke EM-A, would be overtopped and damaged by the dyke breach flood. The flood peak level at the road crossing is predicted to be 297.7 m and the corresponding peak flow depth is predicted to be 4.8 m. The time to flood peak level is 9.0 hours after commencement of the dyke breach. The flood peak discharge is estimated to be 230 m3/s. In the event of a piping failure, the flood peak level at the road crossing is predicted to be 297.3 m, which is 0.4 m lower than the flood peak level associated with the overtopping failure.
The most downstream boundary is located approximately 16 km downstream of Dyke EM-A, just before the confluence of the Piche River with the Thompson River. At this location, the flood peak level is predicted to be 296.9 m and the corresponding peak flow depth is predicted to be 4.4 m. The time to flood peak level is 10.1 hours after commencement of the dyke breach. The flood peak discharge is estimated to be 220 m3/s. In the event of a piping failure, the flood peak level at the road crossing is predicted to be 296.5 m, which is 0.4 m lower than the flood peak level associated with the overtopping failure.
In the event of failure of Dyke EM-A, the residential homes or buildings near the Northern Star Mine and Dubuisson would likely be flooded as shown in Figure 1.
Date: November 18, 2008 Project No. 07-1221-0028 To: Carl Pednault, Golder Associates Ltd. (Montreal) 4/5
MEMORANDUM
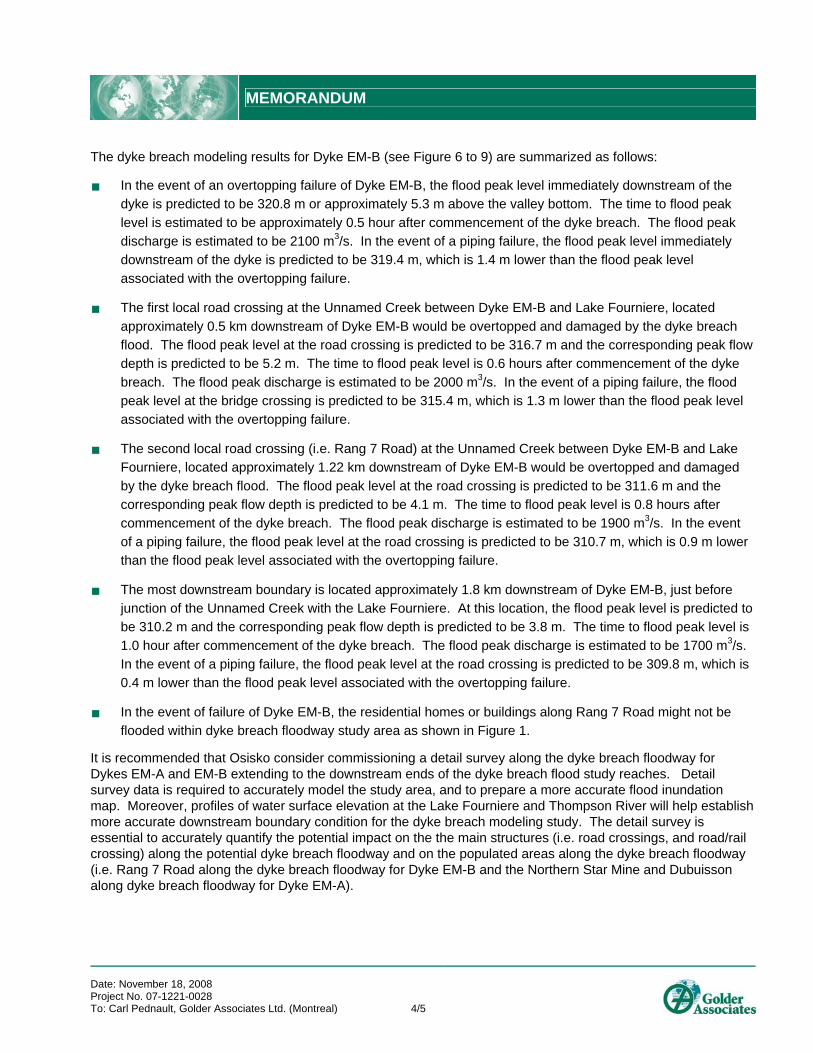
The dyke breach modeling results for Dyke EM-B (see Figure 6 to 9) are summarized as follows:
In the event of an overtopping failure of Dyke EM-B, the flood peak level immediately downstream of the dyke is predicted to be 320.8 m or approximately 5.3 m above the valley bottom. The time to flood peak level is estimated to be approximately 0.5 hour after commencement of the dyke breach. The flood peak discharge is estimated to be 2100 m3/s. In the event of a piping failure, the flood peak level immediately downstream of the dyke is predicted to be 319.4 m, which is 1.4 m lower than the flood peak level associated with the overtopping failure.
The first local road crossing at the Unnamed Creek between Dyke EM-B and Lake Fourniere, located approximately 0.5 km downstream of Dyke EM-B would be overtopped and damaged by the dyke breach flood. The flood peak level at the road crossing is predicted to be 316.7 m and the corresponding peak flow depth is predicted to be 5.2 m. The time to flood peak level is 0.6 hours after commencement of the dyke breach. The flood peak discharge is estimated to be 2000 m3/s. In the event of a piping failure, the flood peak level at the bridge crossing is predicted to be 315.4 m, which is 1.3 m lower than the flood peak level associated with the overtopping failure.
The second local road crossing (i.e. Rang 7 Road) at the Unnamed Creek between Dyke EM-B and Lake Fourniere, located approximately 1.22 km downstream of Dyke EM-B would be overtopped and damaged by the dyke breach flood. The flood peak level at the road crossing is predicted to be 311.6 m and the corresponding peak flow depth is predicted to be 4.1 m. The time to flood peak level is 0.8 hours after commencement of the dyke breach. The flood peak discharge is estimated to be 1900 m3/s. In the event of a piping failure, the flood peak level at the road crossing is predicted to be 310.7 m, which is 0.9 m lower than the flood peak level associated with the overtopping failure.
The most downstream boundary is located approximately 1.8 km downstream of Dyke EM-B, just before junction of the Unnamed Creek with the Lake Fourniere. At this location, the flood peak level is predicted to be 310.2 m and the corresponding peak flow depth is predicted to be 3.8 m. The time to flood peak level is 1.0 hour after commencement of the dyke breach. The flood peak discharge is estimated to be 1700 m3/s. In the event of a piping failure, the flood peak level at the road crossing is predicted to be 309.8 m, which is 0.4 m lower than the flood peak level associated with the overtopping failure.
In the event of failure of Dyke EM-B, the residential homes or buildings along Rang 7 Road might not be flooded within dyke breach floodway study area as shown in Figure 1.
It is recommended that Osisko consider commissioning a detail survey along the dyke breach floodway for Dykes EM-A and EM-B extending to the downstream ends of the dyke breach flood study reaches. Detail survey data is required to accurately model the study area, and to prepare a more accurate flood inundation map. Moreover, profiles of water surface elevation at the Lake Fourniere and Thompson River will help establish more accurate downstream boundary condition for the dyke breach modeling study. The detail survey is essential to accurately quantify the potential impact on the the main structures (i.e. road crossings, and road/rail crossing) along the potential dyke breach floodway and on the populated areas along the dyke breach floodway (i.e. Rang 7 Road along the dyke breach floodway for Dyke EM-B and the Northern Star Mine and Dubuisson along dyke breach floodway for Dyke EM-A).

Date: November 18, 2008 Project No. 07-1221-0028 To: Carl Pednault, Golder Associates Ltd. (Montreal) 5/5
MEMORANDUM
References Federal Energy Regulatory Commission, 1994, “Engineering Guidelines for the Evaluation of Hydropower
Projects,” FERC 0119-2, Office of Hydropower Licensing, Washington D.C.
Fread, D. L., 2001, “Some Existing Capabilities and Future Directions for Dam-Breach Modeling/Flood Routing,” Proceedings FEMA Workshop on “Issues, Resolutions, and Research Needs Related to Embankment Dam Failure Analysis,” Oklahoma City, Oklahoma.
Attachments Figure 1: Dyke Breach Flood Inundation Map
Figure 2: Predicated Flood Peak Discharges Associated with the Dyke EM-A Breach Floods
Figure 3: Predicated Flood Peak Levels Associated with the Dyke EM-A Breach Floods
Figure 4: Predicated Peak Flood Depths Associated with the Dyke EM-A Breach Floods
Figure 5: Predicated Times to Flood Peak Levels Associated with the Dyke EM-A Breach Floods
Figure 6: Predicated Flood Peak Discharges Associated with the Dyke EM-B Breach Floods
Figure 7: Predicated Flood Peak Levels Associated with the Dyke EM-B Breach Floods
Figure 8: Predicated Peak Flood Depths Associated with the Dyke EM-B Breach Floods
Figure 9: Predicated Times to Flood Peak Levels Associated with the Dyke EM-B Breach Floods
N:\Actif\2007\1221\07-1221-0028 Osisko Est-Malartic\Phase 4000 rupture de digues\Summary Nov 13\Summary Report_Nov 18-08 unlock.doc

B6B5
B4
B3 DYKE EM-B
A2 A3A4
A5A6
A7A8 A9
A10
A11
A12
A13
Polishing PondMaximum FloodLevel = 326.8 m
B2DYKE EM-A
A1
B1
DYKE EM-DDYKE EM-E
DYKE EM-C
DYKE 5
DYKE BREACH FLOOD INUNDATION MAP
DYKE BREACH FLOOD INUNDATION STUDYFOR THE MALARTIC PROJECT
FIGURE: 1ORIGINAL DRAWINGS OBTAINED FROM CLIENT. 32c04201h.dwg, 32c04201t.dwg,32cd101t.dwg, 32da202t.dwg 1:20,000 TOPO MAPS CONVERTED TO MTM ZONE 10
REFERENCE
CONTOUR LINE (10 m)LEGEND
OVERTOPPINGPIPING

Dyke Breach Modeling Results for Dyke EM-A
Figure 2 Predicted Flood Peak Discharges Associated with the Dyke EM-A Breach Floods
0
1000
2000
3000
4000
5000
6000
0.0 2.0 4.0 6.0 8.0 10.0 12.0 14.0 16.0 18.0
Distance from the Dyke EM-A (km)
Peak
Dis
char
ge (m
3 /s)
Overtopping Failure under PMF Event
Piping Failure
Dyke EM-A(Cross-sec. A1)
Downstream Boundary /Thompson River(Cross-sec. A13)
First Local Road Crossing(Cross-sec. A4)
Second Local Road Crossing(Cross-sec. A7)
Third Local Road Crossing(Cross-sec. A9)
Fourth Local Road Crossing
(Cross-sec. A12)
Figure 3 Predicted Flood Peak Levels Associated with the Dyke EM-A Breach Floods
290
295
300
305
310
315
320
325
330
0.0 2.0 4.0 6.0 8.0 10.0 12.0 14.0 16.0 18.0
Distance from the Dyke EM-A (km)
Elev
atio
n (m
)
Overtopping Failure under PMF EventPiping Failure
Channel Thalweg Profile
Dyke EM-A(Cross-sec. A1)
Downstream Boundary /Thompson River(Cross-sec. A13)
First Local Road Crossing(Cross-sec. A4)
Second Local Road Crossing(Cross-sec. A7)
Third Local Road Crossing(Cross-sec. A9) Fourth Local
Road Crossing(Cross-sec. A12)
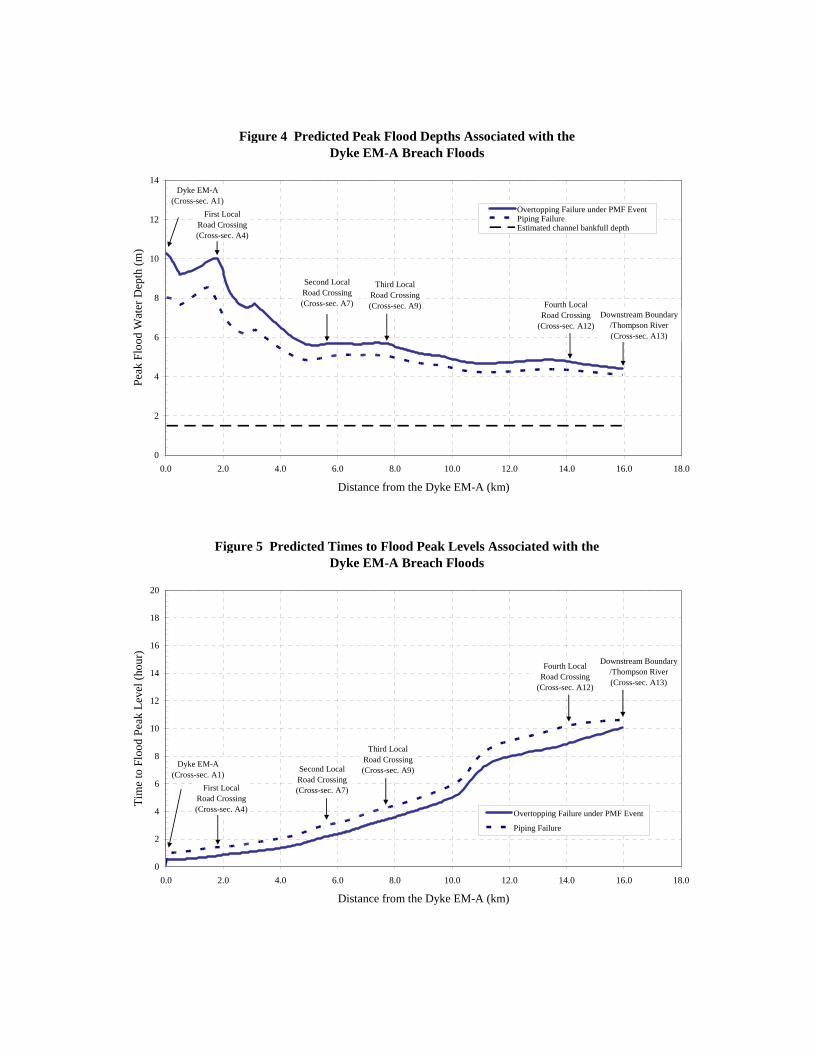
Figure 4 Predicted Peak Flood Depths Associated with the Dyke EM-A Breach Floods
0
2
4
6
8
10
12
14
0.0 2.0 4.0 6.0 8.0 10.0 12.0 14.0 16.0 18.0
Distance from the Dyke EM-A (km)
Peak
Flo
od W
ater
Dep
th (m
)
Overtopping Failure under PMF EventPiping FailureEstimated channel bankfull depth
Dyke EM-A(Cross-sec. A1)
First Local Road Crossing(Cross-sec. A4)
Downstream Boundary /Thompson River(Cross-sec. A13)
Second Local Road Crossing(Cross-sec. A7)
Third Local Road Crossing(Cross-sec. A9) Fourth Local
Road Crossing(Cross-sec. A12)
Figure 5 Predicted Times to Flood Peak Levels Associated with the Dyke EM-A Breach Floods
0
2
4
6
8
10
12
14
16
18
20
0.0 2.0 4.0 6.0 8.0 10.0 12.0 14.0 16.0 18.0
Distance from the Dyke EM-A (km)
Tim
e to
Flo
od P
eak
Leve
l (ho
ur)
Overtopping Failure under PMF Event
Piping Failure
Dyke EM-A(Cross-sec. A1)
First Local Road Crossing(Cross-sec. A4)
Downstream Boundary /Thompson River(Cross-sec. A13)
Second Local Road Crossing(Cross-sec. A7)
Third Local Road Crossing(Cross-sec. A9)
Fourth Local Road Crossing
(Cross-sec. A12)

Dyke Breach Modeling Results for Dyke EM-B
Figure 6 Predicted Flood Peak Discharges Associated with the Dyke EM-B Breach Floods
0
500
1000
1500
2000
2500
3000
0.0 0.2 0.4 0.6 0.8 1.0 1.2 1.4 1.6 1.8 2.0
Distance from the Dyke EM-B (km)
Peak
Dis
char
ge (m
3 /s)
Overtopping Failure under PMF Event
Piping FailureDyke EM-B(Cross-sec. B1)
Downstream Boundary /Lac Fourniere(Cross-sec. B6)
First Local Road Crossing(Cross-sec. B4) Second Local
Road Crossing(Cross-sec. B5)
Figure 7 Predicted Flood Peak Levels Associated with the Dyke EM-B Breach Floods
300
305
310
315
320
325
330
0.0 0.2 0.4 0.6 0.8 1.0 1.2 1.4 1.6 1.8 2.0
Distance from the Dyke EM-B (km)
Elev
atio
n (m
)
Overtopping Failure under PMF EventPiping FailureChannel Thalweg Profile
Dyke EM-B(Cross-sec. B1)
Downstream Boundary /Lac Fourniere(Cross-sec. B6)
First Local Road Crossing(Cross-sec. B4)
Second Local Road Crossing(Cross-sec. B5)
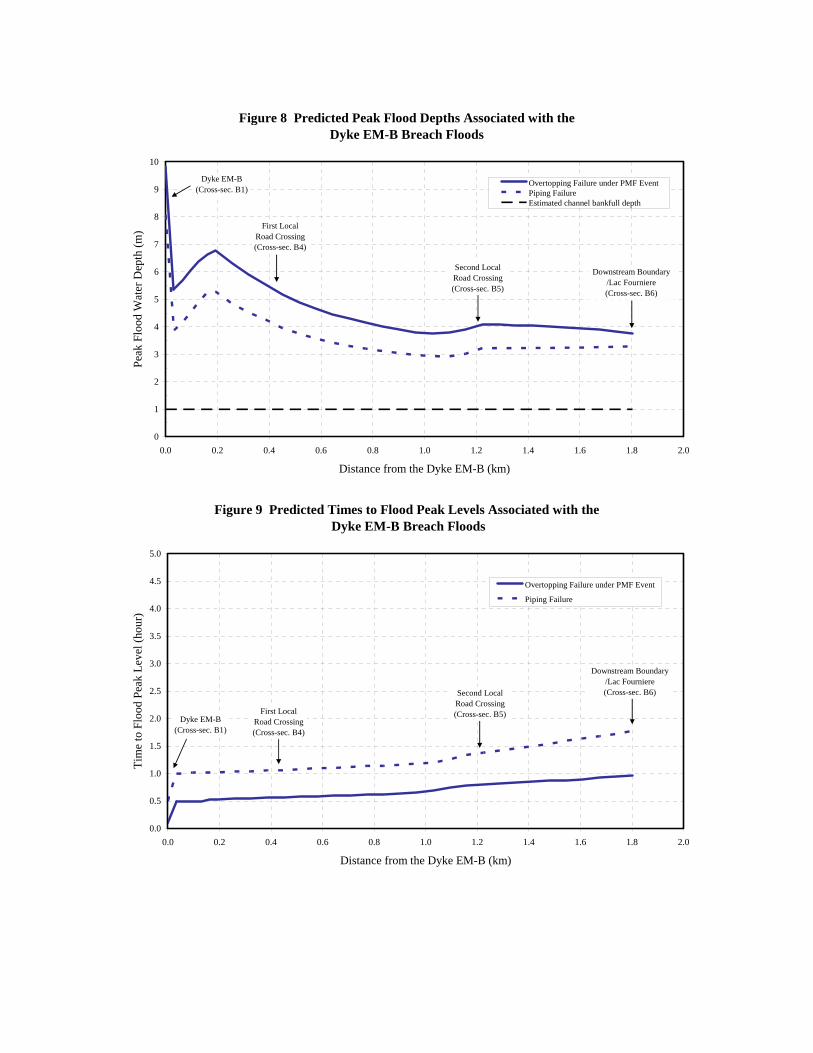
Figure 8 Predicted Peak Flood Depths Associated with the Dyke EM-B Breach Floods
0
1
2
3
4
5
6
7
8
9
10
0.0 0.2 0.4 0.6 0.8 1.0 1.2 1.4 1.6 1.8 2.0
Distance from the Dyke EM-B (km)
Peak
Flo
od W
ater
Dep
th (m
)
Overtopping Failure under PMF EventPiping FailureEstimated channel bankfull depth
Dyke EM-B(Cross-sec. B1)
Downstream Boundary /Lac Fourniere(Cross-sec. B6)
First Local Road Crossing(Cross-sec. B4)
Second Local Road Crossing(Cross-sec. B5)
Figure 9 Predicted Times to Flood Peak Levels Associated with the Dyke EM-B Breach Floods
0.0
0.5
1.0
1.5
2.0
2.5
3.0
3.5
4.0
4.5
5.0
0.0 0.2 0.4 0.6 0.8 1.0 1.2 1.4 1.6 1.8 2.0
Distance from the Dyke EM-B (km)
Tim
e to
Flo
od P
eak
Leve
l (ho
ur)
Overtopping Failure under PMF Event
Piping Failure
Dyke EM-B(Cross-sec. B1)
Downstream Boundary /Lac Fourniere(Cross-sec. B6)
First Local Road Crossing(Cross-sec. B4)
Second Local Road Crossing(Cross-sec. B5)