MEMORANDUM 10:30 AM on Wednesday, October 3 at the … · XII. Report from NCDOT Transportation...
42
MEMORANDUM TO: Technical Coordinating Committee FROM: Deanna Trebil – MPO Administrator DATE: September 24, 2018 RE: Rescheduled TCC Meeting – October 3, 2018 The Technical Coordinating Committee will meet at 10:30 AM on Wednesday, October 3 at the Meeting Room A, Jacksonville City Hall (815 New Bridge Street). This meeting is the rescheduled bimonthly meeting that was previously cancelled due to Hurricane Florence. Discussion topics for this meeting include an update on the performance targets for pavement condition and travel time, transit asset management, and discussion regarding Division Needs Local Input Points for P5.0. Your attendance, or that of your alternate, at this meeting is very important. Conference call participation is available upon request. Please contact me at (910) 938-5073 with any questions or concerns.
-
Upload
nguyenngoc -
Category
Documents
-
view
213 -
download
0
Transcript of MEMORANDUM 10:30 AM on Wednesday, October 3 at the … · XII. Report from NCDOT Transportation...

MEMORANDUM
TO: Technical Coordinating Committee
FROM: Deanna Trebil – MPO Administrator
DATE: September 24, 2018
RE: Rescheduled TCC Meeting – October 3, 2018
The Technical Coordinating Committee will meet at 10:30 AM on Wednesday, October 3 at the Meeting Room A, Jacksonville City Hall (815 New Bridge Street). This meeting is the rescheduled bimonthly meeting that was previously cancelled due to Hurricane Florence. Discussion topics for this meeting include an update on the performance targets for pavement condition and travel time, transit asset management, and discussion regarding Division Needs Local Input Points for P5.0. Your attendance, or that of your alternate, at this meeting is very important. Conference call participation is available upon request. Please contact me at (910) 938-5073 with any questions or concerns.

AGENDA
TECHNICAL COORDINATING COMMITTEE
October 3, 2018 – 10:30 AM
Meeting Room A – Jacksonville City Hall – 815 New Bridge Street
I. Call to Order Ben Warren
II. Welcome and Introductions Ben Warren
III. Public Comment Ben Warren
Action Items
IV. July 12, 2018 Meeting Minutes (Attachment 1) Ben Warren Recommended Action: Approval of meeting minutes
V. Performance Targets – PM 2 and PM 3 (Attachment 2) Anthony Prinz Recommended Action: Recommend TAC adoption of NCDOT performance targets
VI. Performance Targets – Transit Asset Management (Attachment 3) Anthony Prinz Recommended Action: Recommend TAC adoption of NCDOT performance targets
VII. Division Needs Local Input Points (Attachment 4) Deanna Trebil Recommended Action: Recommend TAC approval of Division Needs Local Input Points
Discussion Items
VIII. Prioritization 5.0 Status Update Deanna Trebil
IX. Jacksonville Station Anthony Prinz
Reports/Comments
X. Report from MPO Anthony Prinz
XI. Report from NCDOT Division 3 Caitlyn Marks
XII. Report from NCDOT Transportation Planning Division Zack O’Keefe
XIII. Report from FHWA Field Officer Kristina Solberg
XIV. Questions, Closing Comments Ben Warren

[Type here]
Attachment: 1
Technical Coordinating Committee
Action Required
To: Technical Coordinating Committee
From: Deanna Trebil, MPO Administrator
Subject: July 12, 2018 Meeting Minutes
10/3/2018
Recommended Action: Approval of meeting minutes
Attachments: July 12, 2018 meeting minutes

JACKSONVILLE METROPOLITIAN PLANNING ORGANIZATION TECHNICAL COORDINATING COMMITTEE
REGULAR MEETING July 12, 2018 10:30 a.m.
CENTER FOR PUBLIC SAFETY EMERGENCY OPERATIONS CENTER ROOM
Present: Mr. Ben Warren, Mr. Wally Hansen, Ms. Carol Long, Mr. Ryan King, Ms. Kristina Solberg, Mr. Zack O’Keefe,
Others Present:
Mr. Anthony Prinz, Mr. Chris White , Ms. Debbie Jefferson, Mr. Roy Bredahl, Mr. Justin Lins, Ms. Stephanie Kutz, Ms. Deanna Trebil, Mr. Tim McCurry, Mr. Kerry Terrell, and Lt. Sean Magill
I. Call to Order
Mr. Ben Warren called the TCC meeting to order at 10:30am, Thursday, July 12, 2018, at the Emergency Operations Center Room – Center for Public Safety – 200 Marine Boulevard, Jacksonville, NC.
Mr. Warren welcomed everyone to the meeting and asked for a round table introduction.
III. Public Comment
Mr. Warren asked if there were any public comments. No public comments were made. Action Items
IV. May 10, 2018 Meeting Minutes
Mr. Ben Warren asked for a motion to approve the May 10, 2018 Meeting Minutes. Mr. Wally Hansen moved to approve the May 10, 2018 Meeting Minutes. Ms. Carol Long seconded the motion. The motion to approve the May 10, 2018 Meeting Minutes was unanimously approved by the Committee Members present. V. Performance Targets – PM 2 and PM 3
II. Welcome and Introductions

Mr. Anthony Prinz discussed performance measures 2 and 3, which include pavement and bridge condition and travel time reliability. Mr. Prinz discussed the individual targets for each performance measure and noted that this was a similar exercise to adoption of the safety performance measure and its targets. There was a lengthy discussion regarding the performance targets that have been set by NCDOT ensued among several members of the committee. Ms. Kristina Solberg and Mr. Zack O’Keefe suggested having a conference call with JUMPO Staff, NCDOT and FHWA to better understand the intent of the targets that were set. The committee agreed that further discussion was needed before these measures are presented to the TAC. Mr. Ben Warren asked for approval of Performance Targets – PM 2 and PM 3 to the TAC. Mr. Wally Hansen made a motion to approve the Performance Targets – PM 2 and PM 3. Mr. Ryan King seconded the motion. Ms. Carol Long opposed the motion. The motion to approve the recommendation for Performance Targets – PM 2 and PM 3 to the TAC for final approval. Discussion Items VI. Build NC Mr. Prinz discussed Build NC, which is state law. It is an additional tool for transportation funding modeled after the framework of GARVEE. The legislation does set a maximum for the 10 years and for a single year, over 10 years the maximum is $3 billion and the maximum per year is $300 million. This money is then dispersed through the STI process. Mr. Prinz presented several of the slides that the Transportation Secretary has been presenting when discussing NC Build. He noted that this funding would go to the Regional level and the Division level within the STI process and that it would help to accelerate projects that have been programmed through STI. VII. LRTP Update Ms. Deanna Trebil provided an update on the bike/ped and collector street portions of the LRTP. She noted that these updates as well as the performance measures will be included into the LRTP with the main goal being a major update to the LRTP before April 2020. VIII. CTP Update Ms. Trebil provided an update on the Onslow County CTP and noted that staff was working with the RPO and NCDOT to make some changes and incorporate the work that is being completed with the Bike/Ped and Collector Street updates. She noted that the goal was to have the CTP completed by the end of the year.

IX. P5.0 Status Update
Mr. Prinz provided an update on prioritization 5.0. He noted that Regional Impact Local Input Points were going to be submitted at the end of the month. He also noted that work was still being done with NCDOT to try and reclassify a couple of projects that should have state route designations to score at the Regional level but currently do not and are subsequently only scoring at the Division level. He made the committee aware that although Regional Impact Local Input Points had been assigned that there was a chance that points could be reallocated dependent upon what happened with the NC route designations on the NC 111 projects.
Reports/Comments X. Report from MPO Mr. Prinz mentioned that Mr. Alford has been reappointed to the Board of Transportation. He noted that he has previous board experience and is also on the Military Affairs Commission for the state. Mr. Prinz also noted that the Strategic Transportation Corridor planning has been disengaged for the time being. He noted that this regional planning was key to our area to determine how to get interstate connectivity into Jacksonville. Mr. Zack O’Keefe added that the project will be picking back up but additional funds and coordination with stakeholders is needed to continue on with the project. XI. Report from NCDOT Division 3 Mr. Justin Lins was present but Mr. Prinz gave the report using the project list provided by NCDOT. He noted that the Ridge Road realignment is complete. Additionally, he noted that traffic should be utilizing the new alignment on US 17 North and that the intersection of Gum Branch and Western was bid but would need to be rebid. XII. Report from NCDOT Transportation Planning Division Mr. Zack O’Keefe gave a brief update and provided a newsletter to the committee. XIII. Report from FHWA Field Officer Ms. Kristina Solberg provided a brief update. She noted that a BUILD Grant was currently available and that project submissions were due the following week. XIV. Questions, Closing Comments Mr. Ben Warren thanked everyone for attending the meeting.
Mr. Ryan King made a motion to adjourn the meeting. The meeting was adjourned at 11:40 a.m.

[Type here]
Attachment: 2
Technical Coordinating Committee
Action Required
To: Technical Coordinating Committee
From: Anthony Prinz, TAC Secretary
Subject: Performance Targets – PM2 and PM3
10/3/2018
Current federal transportation legislation (FAST Act) requires states and MPOs adopt
performance measures and targets to monitor their progress over time toward achieving
USDOT transportation goals. Safety performance measures (PM1) were adopted on January 11,
2018. Remaining areas include FHWA Highway Assets (PM2) and System Performance (PM3),
which focused on interstate and non-interstate National Highway System (NHS) pavement
condition, NHS bridge condition, travel time reliability, freight reliability, and emissions
reduction.
NCDOT adopted associated performance measures in May 2018. As such, the Jacksonville MPO
is required to adopt performance measures by the end of October 2018. While the FAST Act
allows MPOs to adopt measures and targets independently of their state, NCDOT has
encouraged MPOs to follow their lead by adopting the established statewide performance
measures.
When this item was initially presented, concerns were expressed that it appeared that the
recommended performance measures were lower than current NCDOT standards. Further
discussion with NCDOT resulted in greater clarification on how the performance measures were
developed as well as adjusted when needed.
Recommended Action: Recommend TAC adoption of NCDOT performance targets
Attachments: Draft Resolution PM2 and PM3 Performance Measures Handout

ENDORSEMENT OF TARGETS FOR PERFORMANCE MEASURES ESTABLISHED BY NCDOT
WHEREAS, the Jacksonville Urban Area MPO is responsible for comprehensive, continuing, and
cooperative transportation planning for the Jacksonville metropolitan area, and;
WHEREAS, Federal regulations (23 CFR Part 490) require States and MPOs to set performance targets
for certain areas of emphasis including: interstate and non-interstate National Highway System (NHS)
pavement condition, NHS bridge condition, travel time reliability, freight reliability, and emissions
reduction, and;
WHEREAS, the North Carolina Department of Transportation (NCDOT) has established performance
targets for each area of emphasis, and;
WHEREAS, the Jacksonville MPO may establish safety targets by agreeing to plan and program projects
that contribute toward the State’s targets, or establish its own targets, and;
WHEREAS, the Jacksonville MPO must establish performance targets within 180 days of the State
establishing performance targets, and;
WHEREAS, performance targets established by the State are listed for each area of emphasis below:
Areas of Emphasis 2 Year Target
1/1/2018 – 12/31/2019 4 Year Target
1/1/2018 – 12/31/2021
Interstate Pavement Condition (Good) 37.0 % Interstate Pavement Condition (Poor) 2.2 % Non-Interstate NHS Pavement Condition (Good) 27.0% 21.0% Non-Interstate NHS Pavement Condition (Poor) 4.2% 4.7% NHS Bridge Condition (Good) 33.0% 30.0% NHS Bridge Condition (Poor) 8.0% 9.0% Interstate Level of Travel Time Reliability 80.0% 75.0% Non-Interstate NHS Level of Travel Time Reliability 70.0% Interstate Truck Travel Time Reliability 1.65 1.70
NOW, THEREFORE, BE IT RESOLVED, that the Transportation Advisory Committee agrees to plan
and program projects that contribute toward the State’s targets as noted above. On this, the 11th day of
October 2018.
________________________________ Robert Warden, Chairman
Subscribed and sworn to me this _____ day of ____________ 2018. ____________________________________ Commission expires ____________________ Notary Public

Interstate Pavement Condition (Good)
7
Ap
pro
ac
hA
ssu
mp
tio
ns
•Funding stability
•State-driven targets, not Federal budget
allocations
•Overall Interstate VMT growth and truck VMT
growth
•Maintain balance, levels of percent good v. fair
Ad
dre
ssA
cc
ou
nta
ble
•Will review progress and can adjust target at
mid-point of first 4-year performance period
(2020, based on 2018 and 2019 performance).
•The first performance period - January 1st, 2018
through December 31st, 2021
•NCDOT transition to full-extent data collection in
2017, enabling improved performance tracking.
•Pavement Management Unit, Division of
Highways
•Note, the actual 2-year condition (2018 and
2019) will become the baseline condition for
the first performance period for this measure.
4-Year Target(1/1/2018 – 12/31/2021)
37.0%
PM2 Measure: Performance Trend:
% of Interstate
pavement in Good
condition
Percentage of Interstate pavement
in “Good” condition:
Total interstate lane miles in good
condition based on IRI (measure of
pavement smoothness), cracking
percent, and rutting or faulting. All
condition metrics must exhibit good
to classify pavement as good.
Federal guidance is still being
reviewed for measure/metric
computational analysis and
application. NCDOT
completing transition to full
extent data collection to
support IRI elemental data
review.
50%
60%
70%
80%
2013 2014 2015 2016
Interstate Pavement Condition (Good)
•Understand measure definition and underlying
data (including data collection methods).
•Evaluate trend, external factors, and internal
factors impacting future performance.

Interstate Pavement Condition (Poor)
8
4-Year Target(1/1/2018 – 12/31/2021)
2.2%
PM2 Measure: Performance Trend:
% of Interstate pavement in
Poor condition
0.0%
0.5%
1.0%
2013 2014 2015 2016
Interstate Pavement Condition (Poor)
Ap
pro
ac
hA
ssu
mp
tio
ns
•Funding stability
•State-driven targets, not Federal budget
allocations
•Overall Interstate VMT growth and truck VMT
growth
•Maintain balance, levels of percent good v. poor
Ad
dre
ssA
cc
ou
nta
ble
•Will review progress and can adjust target at
mid-point of first 4-year performance period
(2020, based on 2018 and 2019 performance).
•The first performance period - January 1st, 2018
through December 31st, 2021
•NCDOT transition to full-extent data collection in
2017, enabling improved performance tracking.
•Pavement Management Unit, Division of
Highways
•Federal threshold (minimum): If more than 5%
of Interstate pavement is rated in Poor
condition for any year, the State must obligate
NHPP funds and transfer STP funds to improve
pavement.
•Understand measure definition and underlying
data (including data collection methods).
•Evaluate trend, external factors, and internal
factors impacting future performance.
Percentage of Interstate pavement
in “Poor” condition:
Total interstate lane miles in poor
condition based on IRI (measure of
pavement smoothness), cracking
percent, and rutting or faulting. If
one condition metric exhibits poor,
the segment is classified as poor
pavement.
Target set below minimum 5%
federal threshold for “poor”
condition. Federal guidance is
still being reviewed for
measure/metric
computational analysis and
application. NCDOT
completing transition to full
extent data collection to
support IRI elemental data
review.

Non-Interstate NHS Pavement Condition (Good)
9
2-Year Target(1/1/2018 – 12/31/2019)
4-Year Target(1/1/2018 – 12/31/2021)
27.0%
PM2 Measure: Performance Trend:
21.0%% of non-Interstate NHS
pavement in Good condition
Federal guidance is still being
reviewed for measure/metric
computational analysis and
application. NCDOT
completing transition to full
extent data collection to
support IRI elemental data
review. Influence of any data
“noise” is magnified on Non-
Interstate (impacts larger
number of miles).
% of non-Interstate NHS
pavement in Good condition
25%
35%
45%
2013 2014 2015 2016
Non-Interstate NHS Pavement
Condition (Good)
Percentage of Non-Interstate NHS
pavement in “Good” condition:
Total non-Interstate NHS lane miles
in good condition based on IRI
(measure of pavement smoothness),
cracking percent, and rutting or
faulting. All condition metrics must
exhibit good to classify pavement as
good.
Ap
pro
ac
hA
ssu
mp
tio
ns
• Interstate system analysis concerns are
magnified for the non-Interstate NHS network
•Restrictive use of chip seal treatment
•Difficult to keep good facilities “good” and to
accurately track
•Timing and gaps of data collection and reporting
Ad
dre
ssA
cc
ou
nta
ble
•Will review progress and can adjust target at
mid-point of first 4-year performance period
(2020, based on 2018 and 2019 performance).
•The first performance period - January 1st, 2018
through December 31st, 2021
•8.5% invalid data influence on trend analysis and
target setting.
•Pavement Management Unit, Division of
Highways
•For non-Interstate pavement targets, FHWA will
make a determination of significant progress at
the midpoint and end of the first performance
period.
•Understand measure definition and underlying
data (including data collection methods).
•Evaluate trend, external factors, and internal
factors impacting future performance.

Non-Interstate NHS Pavement Condition (Poor)
10
2-Year Target(1/1/2018 – 12/31/2019)
4-Year Target(1/1/2018 – 12/31/2021)
4.2%
PM2 Measure: Performance Trend:
4.7%
Federal guidance is still being
reviewed for measure/metric
computational analysis and
application. NCDOT
completing transition to full
extent data collection to
support IRI elemental data
review. Influence of any data
“noise” is magnified on Non-
Interstate (impacts larger
number of miles).
0%
2%
4%
2013 2014 2015 2016
Non-Interstate NHS Pavement
Condition (Poor)
Percentage of Non-Interstate NHS
pavement in “Poor” condition:
Total non-Interstate NHS lane miles
in poor condition based on IRI
(measure of pavement smoothness),
cracking percent, and rutting or
faulting. If one condition metric
exhibits poor, the segment is
classified as poor pavement.
% of non-Interstate NHS
pavement in Poor condition
% of non-Interstate NHS
pavement in Poor condition
Ap
pro
ac
hA
ssu
mp
tio
ns
• Interstate system analysis concerns are
magnified for the non-Interstate NHS network
•Restrictive use of chip seal treatment
•Timing and gaps of data collection and reporting
Ad
dre
ssA
cc
ou
nta
ble
•Will review progress and can adjust target at
mid-point of first 4-year performance period
(2020, based on 2018 and 2019 performance).
•The first performance period - January 1st, 2018
through December 31st, 2021
•8.5% invalid data influence on trend analysis and
target setting.
•Pavement Management Unit, Division of Highways
•No minimum threshold requirement.
•For non-Interstate pavement targets, FHWA will make a determination of significant progress at the midpoint and end of the first performance period.
•Understand measure definition and underlying
data (including data collection methods).
•Evaluate trend, external factors, and internal
factors impacting future performance.

NHS Bridge Condition (Good)
11
Ap
pro
ac
hA
ssu
mp
tio
ns
•Understand measure definition and underlying
data, including differences with NCDOT Bridge
Health Index (BHI).
•Evaluated trend, external factors, and internal
factors impacting future performance.
• Includes all NHS bridges and culverts over 20 ft.
in length.
•NCDOT responsible for the collection of all
bridge condition data necessary to set targets.
•Targets consistent with findings of
Transportation Asset Management Plan (TAMP)
analysis and evaluation of bridges consistent
with Federal measure.
Ad
dre
ssA
cc
ou
nta
ble
•Will review progress and can adjust target at
mid-point of first 4-year performance period
(2020, based on 2018 and 2019 performance).
•The first performance period - January 1st,
2018 through December 31st, 2021
•Structures Management Unit, Division of
Highways
•Takes into account the number of NHS bridge
replacements expected over next 10 years.
•No minimum threshold requirement.
2-Year Target(1/1/2018 – 12/31/2019)
4-Year Target(1/1/2018 – 12/31/2021)
33.0%
PM2 Measure: Performance Trend:
30.0%% of NHS bridges by deck
area in Good condition
Percentage of NHS bridges by deck
area classified in “Good” condition:
Total deck area of NHS bridges and
culverts where all components
(deck, superstructure, substructure
for bridges) are assigned a condition
rating of “Good” or better based on
annual inspections, compared to
total NHS bridge deck area.
Percent of NHS bridge deck
area in good condition has
steadily decreased since 2013.
Federal approach is different
and more stringent compared
to NCDOT Bridge Health
Index, which tracks by
structure and average
condition (and shows an
improving trend since 2013). 30%
40%
50%
60%
2013 2014 2015 2016 2017
NHS Bridge Condition (Good)
% of NHS bridges by deck
area in Good condition
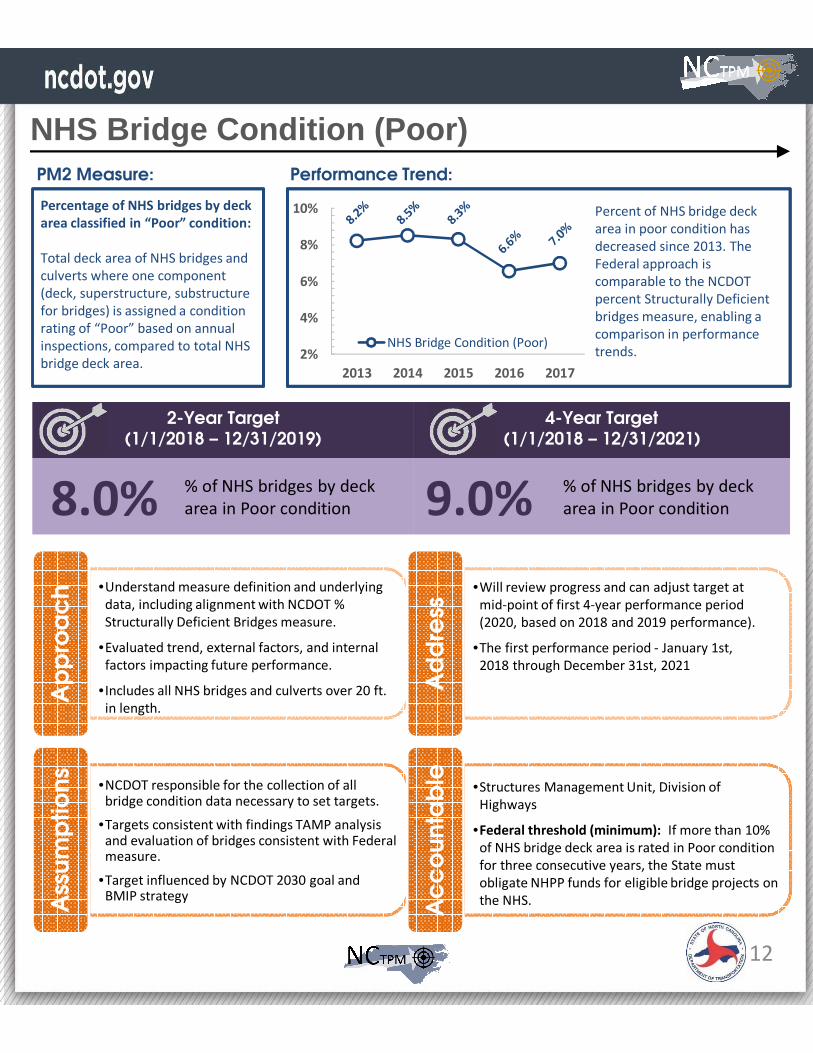
NHS Bridge Condition (Poor)
12
Ap
pro
ac
hA
ssu
mp
tio
ns
•Understand measure definition and underlying
data, including alignment with NCDOT %
Structurally Deficient Bridges measure.
•Evaluated trend, external factors, and internal
factors impacting future performance.
• Includes all NHS bridges and culverts over 20 ft.
in length.
•NCDOT responsible for the collection of all bridge condition data necessary to set targets.
•Targets consistent with findings TAMP analysis and evaluation of bridges consistent with Federal measure.
•Target influenced by NCDOT 2030 goal and BMIP strategy
Ad
dre
ssA
cc
ou
nta
ble
•Will review progress and can adjust target at
mid-point of first 4-year performance period
(2020, based on 2018 and 2019 performance).
•The first performance period - January 1st,
2018 through December 31st, 2021
•Structures Management Unit, Division of
Highways
•Federal threshold (minimum): If more than 10%
of NHS bridge deck area is rated in Poor condition
for three consecutive years, the State must
obligate NHPP funds for eligible bridge projects on
the NHS.
2-Year Target(1/1/2018 – 12/31/2019)
4-Year Target(1/1/2018 – 12/31/2021)
8.0%
PM2 Measure: Performance Trend:
9.0%% of NHS bridges by deck
area in Poor condition
Percentage of NHS bridges by deck
area classified in “Poor” condition:
Total deck area of NHS bridges and
culverts where one component
(deck, superstructure, substructure
for bridges) is assigned a condition
rating of “Poor” based on annual
inspections, compared to total NHS
bridge deck area.
Percent of NHS bridge deck
area in poor condition has
decreased since 2013. The
Federal approach is
comparable to the NCDOT
percent Structurally Deficient
bridges measure, enabling a
comparison in performance
trends.
% of NHS bridges by deck
area in Poor condition
2%
4%
6%
8%
10%
2013 2014 2015 2016 2017
NHS Bridge Condition (Poor)

Interstate Travel Time Reliability
13
Ap
pro
ac
hA
ssu
mp
tio
ns
•Focus on analysis-driven approach, resulting in
simple, objective target setting process.
•Considered external and internal factors
impacting 2- and 4-year performance including
VMT growth, work zones and current project
completions, and potential benefits of incident
management / ITS strategies.
•Targets consistent with average annual 5-year trend of 1.5% per year decline through 2019, and steeper decline through 2021.
•Continued VMT growth outpaces other factors that might change trend direction.
•Maintains conservative stance given external and internal factors.
Ad
dre
ssA
cc
ou
nta
ble
•Will review progress and can adjust target at
mid-point of first 4-year performance period
(2020, based on 2018 and 2019 performance).
•The first performance period - January 1st,
2018 through December 31st, 2021
•Traffic System Operations, Transportation
Mobility and Safety, Division of Highways
•FHWA will not make a significant progress
determination for reliability measures.
2-Year Target(1/1/2018 – 12/31/2019)
4-Year Target(1/1/2018 – 12/31/2021)
80.0%
PM3 Measure: Performance Trend:
75.0%Interstate percent of person
miles traveled that are
reliable
Interstate percent of person
miles traveled that are
reliable
Interstate LOTTR (Level of Travel
Time Reliability):
Reliability measure (based on 80th
percentile travel time v. 50th
percentile travel time, sourced
from in-vehicle GPS and mobile
sources) is combined with person
miles traveled to estimate the
percent of person miles traveled
that are reliable.
Since 2013, Interstate LOTTR
in North Carolina has steadily
decreased by 1.0% to 1.5%
annually. This trend is
primarily impacted by
continuing VMT growth and
traffic incidents, and can also
be impacted by work zones.80%
85%
90%
95%
100%
2013 2014 2015 2016 2017
Interstate LOTTR - % of person
miles traveled that are reliable

Non-Interstate NHS Travel Time Reliability
14
Ap
pro
ac
hA
ssu
mp
tio
ns
•Focus on analysis-driven approach, resulting in
simple, objective target setting process.
•Considered external and internal factors
impacting 2- and 4-year performance including
VMT growth, work zones and current project
completions, and potential benefits of incident
management / ITS strategies.
•Targets consistent with maximum past 5-year
trend of 3.9% per year decline through 2021.
•Continued VMT growth outpaces other factors
that might change trend direction.
•Maintains conservative stance given external and
internal factors.
Ad
dre
ssA
cc
ou
nta
ble
•Will review progress and can adjust target at
mid-point of first 4-year performance period
(2020, based on 2018 and 2019 performance).
•The first performance period - January 1st,
2018 through December 31st, 2021
•Note the data vendor, collection, and process
shift in 2017.
•Traffic System Operations, Transportation
Mobility and Safety, Division of Highways
•FHWA will not make a significant progress
determination for reliability measures.
4-Year Target(1/1/2018 – 12/31/2021)
70.0%
PM3 Measure: Performance Trend:
Non-Interstate NHS percent
of person miles traveled
that are reliable
Non-Interstate NHS LOTTR (Level
of Travel Time Reliability):
Reliability measure (based on 80th
percentile travel time v. 50th
percentile travel time, sourced
from in-vehicle GPS and mobile
sources) is combined with person
miles traveled to estimate the
percent of person miles traveled
that are reliable.
Since 2013, Non-Interstate
NHS LOTTR in North Carolina
has steadily decreased by
2.9% to 3.9% annually. This
trend is primarily impacted by
continuing VMT growth and
traffic incidents, and can also
be impacted by land use
decisions and weekend travel.
* Note: 2016 to 2017 data shift a
result of FHWA vendor change
and data expansion, not change
in performance.
70%
80%
90%
100%
2013 2014 2015 2016 2017
Non-Interstate NHS LOTTR
*

Truck Travel Time Reliability (Interstate)
15
Ap
pro
ac
hA
ssu
mp
tio
ns
•Focus on analysis-driven approach, resulting in
simple, objective target setting process.
•Considered external and internal factors
impacting 2- and 4-year performance including
work zones and project completions, weigh
station locations, incident management, and
truck volumes.
•Targets consistent with maximum past 5-year
trend of 3.4% per year increase through 2019
and increasing trend through 2021.
•Related to decrease in LOTTR performance (TTTR
focuses on the ratio, not the percent of travel).
•Maintains conservative stance given external and
internal factors.
Ad
dre
ssA
cc
ou
nta
ble
•Will review progress and can adjust target at
mid-point of first 4-year performance period
(2020, based on 2018 and 2019 performance).
•The first performance period - January 1st,
2018 through December 31st, 2021
• Increased data coverage in 2017 is primary
driver for performance change
•Traffic System Operations, Transportation
Mobility and Safety, Division of Highways
•FHWA will not make a significant progress
determination for reliability measures.
2-Year Target(1/1/2018 – 12/31/2019)
4-Year Target(1/1/2018 – 12/31/2021)
1.65
PM3 Measure: Performance Trend:
1.70Interstate truck travel time
reliability index
Interstate TTTR (Truck Travel Time
Reliability):
Reliability measure based on the
worst 95th percentile truck travel
time v. 50th percentile truck travel
time, sourced from in-vehicle GPS
and fleet date) is averaged across
the length of all Interstate
segments.
Since 2013, Interstate TTTR in
North Carolina has steadily
increased by 1.7% annually.
This trend is primarily
impacted by continuing truck
VMT growth and traffic
incidents, and can also be
impacted by work zones.
Interstate truck travel time
reliability index
1.30
1.50
1.70
2013 2014 2015 2016 2017
Interstate Truck Travel Time
Reliability
*
*2016 to 2017 data shift a result
of FHWA vendor change.

[Type here]
Attachment: 3
Technical Coordinating Committee
Action Required
To: Technical Coordinating Committee
From: Anthony Prinz, TAC Secretary
Subject: Performance Targets – Transit Asset Management
10/3/2018
Current federal transportation legislation (FAST Act) requires states and MPOs adopt
performance measures and targets to monitor their progress over time toward achieving
USDOT transportation goals by States, public transportation providers, and Metropolitan
Planning Organizations.
The Federal Highway Administration (FHWA) and the Federal Transportation Administration
(FTA) issued a joint final rule on planning (Statewide and Nonmetropolitan Transportation
Planning; Metropolitan Transportation Planning), under which MPOs shall establish performance
targets for maintaining transit assets within 180 days of a State or transit provider setting
targets.
While the FAST Act allows MPOs to adopt measures and targets independently of their State,
NCDOT has encouraged MPOs to follow their lead by adopting the established statewide
performance measures through the NCDOT/PTD Group Transit Asset Management (TAM) Plan
for all community transportation systems and small urban systems. As such, the Jacksonville
MPO is required to adopt TAM performance measures and targets by the end of October 2018.
Recommended Action: Recommend TAC adoption of NCDOT performance targets
Attachments: Draft Resolution NCDOT TAM Plan Summary

Endorsement of Targets for Transit Asset Management Performance Measures
WHEREAS, the Jacksonville Urban Area has been designated by the Governor of the State of North
Carolina as the Metropolitan Planning Organization (MPO) responsible, together with the State, for the
comprehensive, continuing, and cooperative transportation planning process for the MPO’s metropolitan
planning area; and
WHEREAS the FAST Act continued the implementation of performance based planning and programming
to achieve desired performance outcomes for the multimodal transportation system, including the setting
of targets for future performance by States, providers of public transportation, and metropolitan
planning organizations (MPOs); and
WHEREAS, the Federal Transit Administration (FTA) issued a final rule on transit asset management to
establish a system to monitor and manage public transportation assets to improve safety and increase
reliability and performance, under which providers of public transportation receiving federal funds were
required to set their initial asset management targets by January 1, 2017; and
WHEREAS, the Federal Highway Administration (FHWA) and the FTA issued a joint final rule on planning
(Statewide and Nonmetropolitan Transportation Planning; Metropolitan Transportation Planning), under
which MPOs shall establish performance targets within 180 days of a State or transit provider setting
targets; and
WHEREAS, the transit agencies or jurisdictions operating public transportation in the MPO’s planning
area have developed information and targets toward compliance with the law and regulation and have
communicated their current targets for transit asset management to the MPO; and
WHEREAS 49 CFR Part 625, the FTA Transit Asset Management Rule, which became effective on
October 1, 2016, requires transit operators to develop and adopt a Transit Asset Management Plan that
addresses State of Good Repair for rolling stock, infrastructure, equipment, and facilities; and
NOW THEREFORE, BE IT RESOLVED, that the MPO’s Transportation Advisory Committee (TAC) supports
the Jacksonville Transit and Onslow United Transit System targets and agrees to plan and program
projects that contribute toward the accomplishment of the transit agency’s targets as noted below for
each of the listed performance measures below:

Asset Category - Performance Measure Asset Class
Useful Life Benchmark
2019 Target
REVENUE VEHICLES
Age - % of revenue vehicles within a particular asset class that have met or exceeded their Useful Life Benchmark (ULB)
AO - Automobile 8 20%
BU - Bus 14 20%
CU - Cutaway Bus 10 20%
MB - Mini-bus 10 20%
MV - Mini-van 8 20%
SV - Sport Utility Vehicle 8 20%
VN - Van 8 20%
Other 8 20%
EQUIPMENT
Age - % of vehicles that have met or exceeded their Useful Life Benchmark (ULB)
Non Revenue/Service Automobile 8 20%
Steel Wheel Vehicles 8 20%
Trucks and other Rubber Tire Vehicles
8 20%
Maintenance Equipment Agency Determined 20%
Computer Software Agency Determined 20%
FACILITIES
Condition - % of facilities with a condition rating below 3.0 on the FTA Transit Economic Requirements Model (TERM) Scale
Administration N/A 20%
Maintenance N/A 20%
Parking Structures N/A 20%
Passenger Facilities N/A 20%
NOW, THEREFORE, BE IT RESOLVED, that the Transportation Advisory Committee (TAC) agrees to
adopt the Transit Asset Management Plan performance measures as presented and does hereby add
these requirements to the 2040 Long Range Transportation Plan on this, 11th day of October, 2018.
_____________________________ Robert Warden, Chairman
Subscribed and sworn to me this ____ day of _______________ 2018.
_________________________ My commission expires _____________________________ Notary
Public

1
NCDOT TAM Plan Summary
The North Carolina Department of Transportation/Public Transportation Division (NCDOT/PTD) has
prepared a Group TAM (Transit Asset Management) plan for all community transportation systems and
small urban systems opting to be included in the plan. This activity is mandated by Federal Transit
Administration (FTA) (Federal Register/Vol. 81, No. 143 § 625.3). The purpose of this document is to
summarize the components of the TAM Plan and the process.
1. Expectations and Relationship to Funding
The Federal Register/Vol. 81, No. 143/Tuesday, July 26, 2016/Rules and Regulations/PART 625
establishes the Transit Asset Management requirements. The requirements for group plan sponsors and
participants include:
Group Plan Expectations
§625.27 Group plans for transit asset management.
(a) Responsibilities of a group TAM plan sponsor.
(1) A sponsor must develop a group TAM plan for its tier II provider subrecipients, except
those subrecipients that are also direct recipients under the 49 U.S.C. 5307 Urbanized
Area Formula Grant Program. The group TAM plan must include a list of those
subrecipients that are participating in the plan.
(2) A sponsor must comply with the requirements of this part for a TAM plan when
developing a group TAM plan.
(3) A sponsor must coordinate the development of a group TAM plan with each
participant’s Accountable Executive.
(4) A sponsor must make the completed group TAM plan available to all participants in a
format that is easily accessible.
(b) Responsibilities of a group TAM plan participant.
(1) A tier II provider may participate in only one group TAM plan.
(2) A tier II provider must provide written notification to a sponsor if it chooses to opt-out
of a group TAM plan. A provider that opts-out of a group TAM plan must either develop
its own TAM plan or participate in another sponsor’s group TAM plan.
(3) A participant must provide a sponsor with any information that is necessary and
relevant to the development of a group TAM plan.
Relationship to Funding
The NCDOT Group TAM Plan is a planning tool for predicting when assets should be replaced to maintain
safety and reliability through a State of Good Repair (SGR). Identifying an asset in the group plan as
warranting replacement does not guarantee the asset will be funded. If NCDOT is to be a partner in
funding, multiple department procedures must be followed. This plan will help all transit systems
identify future funding needs and enable them to begin the process of exploring funding options.

2
2. Participation in the State-Sponsored Group TAM Plan
All current §5311 sub-recipient agencies of NCDOT and §5307 recipientswith“one hundred (100) or
fewer vehicles in revenue service during peak regular service across all non-rail fixed route modes or in
any one non-fixed route mode”,within North Carolina are Tier II Providers [49 CFR § 625.45] and are
invited to participate in the NCDOT Group TAM Plan. Participation in this Group TAM Plan is optional.
Per federal requirements, transit systems receiving §5311 and/or §5307 funds must either participate in
a group plan or develop their own plan.
Transit systems are invited to offer input into the State Group TAM Plan. However, individualized
performance targets for transit systems in the group plan will not be considered. If specific performance
targets are required by a transit system, the transit system must either develop its own plan or
participate in another group plan. If an agency chooses to “opt out”, the accountable executive must
indicate in writing that the transit system will not be participating in the State Group TAM Plan.
The National Transit Database (NTD) is the official mechanism for reporting transit data. Transit systems
participating in this group TAM Plan reporting their own data to NTD should select the NCDOT Group
TAM Plan in their annual NTD report.
Accountable Executives representing each system participating in this group plan must provide certified
asset inventory data and approve the NCDOT Group TAM Plan. The plan participants are listed on page 4
of the TAM Plan under the heading “Group Plan Contributors”. The sponsor, NCDOT, reserves the right
to decide, develop and communicate:
• Eligibility for participation in the group plan
• Plans, timelines, and deadlines for TAM plan development
• Data needs and formats from agencies
• Procedures for policy discussions
• Targets and prioritizing investments
• Thresholds and procedures for amending the TAM plan
• Coordination with planning organizations
• Expectations for the process of opting out of the plan
3. Relationship with Metropolitan Planning Organization Performance Targets
Metropolitan Planning Organization’s (MPOs) are required to develop and report transit performance
targets. These targets may be based on Group Plans or transit system plans within the MPO area or the
targets may be developed independently. Transit systems and group plan sponsors should share their
targets with MPOs to facilitate consistency within the plans and to establish a dialogue about
appropriate transit asset conditions. MPOs should also share their targets with Group Plan sponsors and
transit systems in their areas for the same reasons. Although consistency is preferred between the
performance targets, the MPO plans are not required to be consistent with the Group Plans and/or
transit system plans.
4. Timeline
The competed NCDOT Sponsored Group TAM Plan and corresponding Performance Targets and
Measures will be provided to transit providers and MPOs by October 1st, 2018. Targets will also be
submitted annually to the National Transit Database (NTD). This Group TAM Plan is required to be
updated at least every four years in alignment with the State Transportation Improvement Program

3
updates. NCDOT will provide TAM Inventories to the transit systems by June 25 of each year. Transit
systems will submit TAM Inventories certified by the Accountable Executive by July 15 of each year.
5. Asset Inventory Data
Asset data used to inform the TAM Plan are compiled from three primary sources: the NCDOT Vehicle
Inventory, the Electronic Asset Management (EAM) system, and the TAM Inventory.
The NCDOT Vehicle inventory tracks all vehicles NCDOT participated in funding. The vehicle ending
odometer mileage as of July 1st will be updated annually from the EAM system.
The TAM Inventory will be completed annually by the transit systems to supply inventories and mileage
for all vehicles purchased without NCDOT assistance, all equipment, and all facilities. Instructions for
completing the TAM Inventory are attached in Appendix A. If NCDOT participated in funding the
equipment, the equipment must include a Claim ID matching the claim submitted to NCDOT/PTD via
Partner Connect. Useful life benchmarks for equipment and TERM Scale Condition Ratings for all
facilities will be established by the transit systems in the TAM Inventory.
Agencies participating in the Group TAM Plan must submit a completed TAM Inventory to NCDOT via
Partner Connect. This inventory must be certified annually by the Accountable Executive [49 CFR §
625.5] for a participating agency. Failure to submit this inventory in the specified annual time frame may
result in funding penalties according to NCDOT guidelines. This TAM Inventory shall be sent out annually
on the 25th of June to gather updates and must be returned by the 15th of July each year.
6. NCDOT Group TAM Plan Elements
The NCDOT Group TAM Plan is based on an excel workbook template specifically designed by FTA for
state-sponsored TAM Plans which includes the following sections: Capital Asset Inventory, Decision
Support, Investment Prioritization and Project Ranking, Performance Measures, and Performance
Targets.
Capital Asset Inventory
The Capital Asset Inventory contains an Asset Inventory Summary which calculates statistics regarding
the asset categories and replacement costs found in the Asset Register in Appendix A of the TAM Plan.
This section also contains an Asset Condition Summary of data shown in the Revenue Vehicle,
Equipment and Facility Condition tables found in Appendix B1, Appendix B2 and Appendix B3 of the
TAM Plan. This summary expands on the Capital Asset Inventory detailing the condition of all assets
utilizing useful life benchmarks and TERM Scale Condition ratings.
Decision Support
The Decision Support page gives a synopsis of the investment prioritization process and the decision
support tools used to make these prioritizations. This section also includes descriptions of each tool
used in the process of creating the TAM Plan. The tools include: projecting asset replacement
timeframes and costs, tools for gathering data on all assets utilized by NCDOT Group TAM Plan
participants in the provision of transportation services, and tools for prioritizing assets according to state
guidelines. The following tools are included:
• Strategic Transportation Investment (STI)
• Vehicle Replacement Schedule

4
• NCDOT Vehicle Inventory
• TERM Scale Condition Worksheet
• TAM Inventory
• EAM Asset Management Software
Investment Prioritization and Project Ranking
The FTA requires an asset prioritization and ranking for all assets. Each year, NCDOT completes a vehicle
investment prioritization using vehicle mileage. Non-vehicular assets are assessed using useful life and
condition. Qualifying assets are also ranked in accordance with FTA’s guidelines in the process described
below.
EQUIPMENT
-Non-revenue vehicles are considered to be equipment. The Useful Life Benchmark (ULB) for these
vehicles is initially set to 8 years.
-All non-vehicular equipment valued at greater than (>) $50,000 (ie. Generators, hydraulic lifts, etc.)
must have a useful life benchmark provided by the transit system. This useful life benchmark will
determine the priority and ranking of such investments. Systems are expected to maintain equipment
until this useful life benchmark is met.
ROLLING STOCK
-Vehicle replacement prioritization is determined by mileage using the Vehicle Replacement Schedule
which is updated annually to reflect actual mileages. Vehicle odometers are determined using the
transit system managed software EAM (AssetWorks). The annual mileage information is used by NCDOT
to project the mileage for the next 5 (five) years. Using the replacement mileages defined by NCDOT
(TAM Plan Appendix D) each vehicle is assigned a projected year of replacement (Project Year) based on
projected mileage.
-Vehicle ranking corresponds to the vehicle Project Year and the mileage in relation to other vehicles in
that project year. Vehicles are organized by Project Year and sorted by the ratio of projected year end
odometer to replacement mileage. Vehicles in each project year are assigned a priority of “Low”,
“Medium” or “High” based on this ratio. Any vehicle projected to become due for replacement more
than 5 years from FY18 is assigned a project year of “5555” because the inventory requires data entry in
this field.
FACILITIES
-Facility replacements and upgrades are based on TERM-scales.

5
Performance Measures
EQUIPMENT
- Percentage of equipment meeting or exceeding respective Useful Life Benchmarks (ULB), measured in
accordance with the FTA 2017 Asset Inventory Module Reporting Manual. Includes all tangible assets
used in the provision of transportation (Replacement Cost >$50,000) and all non-revenue vehicles.
• Service/Support Vehicles ULB: (8) years
• All Other Equipment ($50,000 or >) ULB: Set by system
ROLLING STOCK
-Percentage of revenue vehicles within a particular asset class meeting or exceeding respective ULBs.
Tracking all revenue vehicles including NCDOT funded vehicles and locally-owned vehicle assets.
• 6 Asset Classes w/ ULBs:
• Bus: (14) years
• LTV: (10) years
• Minivan: (8) years
• Other: (8) years
• Sports Utility Vehicle: (8) years
• Van: (8) years
• Assessed according to Age based on Model Year -1.
FACILITIES
-Calculated according to percentage of facilities with a condition rating below 3.0 on the FTA Transit
Economic Requirements Model (TERM) scale (1=Poor to 5=Excellent).
• TERM SCALE: Required to determine mean value across components. Calculate the TERM SCALE
by averaging all component ratings. Example: If 5 components are inspected and the results are
evenly distributed between the 5 rating categories, the overall rating is 3.

6
Performance Targets
A performance target of 20% is set for all asset categories, meaning that 80% of the assets in each
category meet or exceed the state of good repair performance measure. Twenty-percent was selected
to account for delays in acquiring the local match, the grant cycle, procurement process, and asset
delivery.
Asset Category -
Performance Measure Asset Class
Useful Life
Benchmark
2019
Target
REVENUE VEHICLES
Age - % of revenue
vehicles within a
particular asset class
that have met or
exceeded their Useful
Life Benchmark (ULB)
AO - Automobile 8 20%
BU - Bus 14 20%
CU - Cutaway Bus 10 20%
MB - Mini-bus 10 20%
MV - Mini-van 8 20%
SV - Sport Utility Vehicle 8 20%
VN - Van 8 20%
Other 8 20%
EQUIPMENT
Age - % of vehicles that
have met or exceeded
their Useful Life
Benchmark (ULB)
Non Revenue/Service Automobile 8 20%
Steel Wheel Vehicles 8 20%
Trucks and other Rubber Tire Vehicles 8 20%
Maintenance Equipment Agency Determined 20%
Computer Software Agency Determined 20%
Custom 1 Agency Determined 20%
FACILITIES
Condition - % of
facilities with a
condition rating below
3.0 on the FTA Transit
Economic
Requirements Model
(TERM) Scale
Administration N/A 20%
Maintenance N/A 20%
Parking Structures N/A 20%
Passenger Facilities N/A 20%
Shelter N/A 20%
Storage N/A 20%
Custom 1 N/A 20%

7
Data Cleaning and Default Values
The data analysis and entry process requires accurate and complete data from every participating
agency in the Group TAM Plan. While every effort has been made to validate and clean this agency
provided data, there are often instances in which the data requests cannot be fulfilled due to
incomplete knowledge, lost records or known inaccuracies. In these instances, the following default
values may have been utilized:
FOR EMPTY RECORDS
EQUIPMENT DEFAULT VALUE
Vehicle Mileage 0
Acquisition Year 2010
Replacement Cost/Value 0
Useful Life Benchmark Maintenance - 15, Service Vehicle - 8, Software - 5 FACILITIES DEFAULT VALUE
Acquisition Year 1950
Replacement Cost/Value $350,000 ROLLING STOCK DEFAULT VALUE
Vehicle Mileage 0
Replacement Cost/Value 0

8
Appendix A

9

[Type here]
Attachment: 4
Technical Coordinating Committee
Action Required
To: Technical Coordinating Committee
From: Deanna Trebil, MPO Administrator
Subject: Division Needs Local Input Points
10/3/2018
The Prioritization 5.0 (P5.0) process allows MPOs and RPOs to assign local input points at the
Regional Impact and Division Needs funding levels to voice their preference regarding
transportation projects. Ultimately, local input points influence final project scores helping to
determine which are funded for implementation. Division Needs projects receive 25% of their
final score from the MPO/RPO local point assignment, with another 25% assigned by local input
points from the Division Engineer. Point assignment must be based on an adopted methodology
and a 30-day public comment period is required prior to final submittal to NCDOT.
The attached spreadsheet reflects P5.0 composite scores for all JUMPO highway,
bicycle/pedestrian and aviation projects. The TCC Subcommittee met August 28, 2018 to
discuss allocation of the 1,300 local input points JUMPO is allotted to assign to Division Needs
projects.
Recommended Action: Recommend approval of Division Needs to the TAC
Attachments: Prioritization 5.0 Division Needs Composite Scores
Local Input Methodology
Prioritization 5.0 Work Program

9/6/18
SPOT IDM
ode
TIP
Proj
ect
Cate
gory
Route / Facility Name
From / Cross Street
To /
Cro
ss
Stre
et
DescriptionSpecific
Improvement Type
Cost
to N
CDO
T Division Needs Total Score
(Out of 100)
Community Importance
(40 max)
Project Readiness (25 max)
Transportation Performance
Mgmt (20 max)
P5.0 Qscore
(15 max)
Raw Score Total
MPO Local Input Points (25%)
Division Local Input Points (25%)
Total Regional Impact Score
H140357
High
way
U-59
15 Regional Impact
NC 111 (Catherine Lake Rd)
US 258 (Richlands Hwy)
SR 1265 (Airport Rd)
Upgrade roadway to 12' travel lanes with 4' FDPS and improved geometry at intersections.
16 - Modernize Roadway $ 26,000,000 31.13
40 10 20 10 80 100 56.13
H111197
High
way
U-59
03 Division Needs
SR 1336 (Henderson Drive)
SR 1308 (Gum Branch Road)
NC 53 (Western Boulevard)
Upgrade to a multilane superstreet4 - Upgrade Arterial to Superstreet
$14,500,000 36.61
30 20 10 15 75 100 61.61
H140365
High
way
U-57
33 Division Needs
Catherine Lake Road Extension
US 258 (Richlands Hwy)
SR 1308 (Gum Branch Rd)
Construct continuation of NC 111 on new alignment to SR 1308 at existing SR 1324 intersection
5 - Construct Roadway on New Location
$47,000,000 32.59
40 5 20 10 75 100 57.59
H150967
High
way
U-60
82 Division Needs
SR 1308 (Bell Fork Road)
SR 1403 (Country Club Road)
Improve the at-grade intersection of SR 1308 (Bell Fork Road), SR 1403 (Country Club Road) & SR 1403 (Hargett Street)
10 - Improve Intersection $ 3,400,000 35.09
30 15 10 15 70 100 60.09
B171216
Bike
Ped
Division Needs
Downtown Greenway
Chaney Ave (end of existing greenway)
Wardola Dr Construct multiuse path from end of existing path to Sturgeon City Trail
2 - Off-Road/Separated Linear Bicycle Facility (Bicycle)
$ 639,000 33.10
30 20 5 10 65 100 58.10
H111196
High
way
U-59
13 Division Needs
SR 1336 (Henderson Drive)
NC 53 (Western Boulevard)
Commons Drive, North (at Firehouse Road)
Extend Henderson Drive to Commons Drive, north (at Firehouse Drive) on New Alignment as a Four-Lane Divided Highway
5 - Construct Roadway on New Location
$ 5,000,000 34.04
30 15 10 10 65 34.04
B171019
Bike
Ped
Division Needs
Henderson Sidewalk
SR1308 (Gum Branch Rd)
US 17B (Marine Blvd)
Upgrade sidewalk to meet ADA standards
7 - Protected Linear Pedestrian Facility (Pedestrian)
$ 464,000 41.28
40 0 5 15 60 41.28
A171138
Avia
tion
Regional Impact
OAJ - Albert J. Ellis Airport
OAJ - Access Roadway Extension and Realignment
N/AConstruct new entrance road between the terminal area and NC 111. (Project Request Number 3110)
1320 - General Aviation Terminal Building: Construct Terminal Access Road
$ 300,000 26.08
30 15 10 5 60 26.08
H090911
High
wa
y
U-57
93 Division Needs
SR 1308 (Gum Branch Road)
SR 1322 (Summersill School Road)
SR 1324 (Ramsey Rd) Upgrade roadway to Superstreet
4 - Upgrade Arterial to Superstreet
$15,400,000 43.0020 0 20 15 55 100 68.00
H170491
High
wa
y U-57
93B Division
NeedsSR 1308 (Bell Fork Road)
SR 1324 (Ramsey Rd)
SR 1390 (Country Club Blvd)
Upgrade to multilane superstreet4 - Upgrade Arterial to Superstreet
$47,100,000 39.5620 0 20 15 55 100 64.56
B171018
Bike
Ped
Division Needs
Western Greenway
US 17 (Marine Blvd)
SR 1308 (Gum Branch Rd)
Upgrade sidewalk to share-use path and construct shared-use path where none exists
2 - Off-Road/Separated Linear Bicycle Facility (Bicycle)
$ 3,235,500 37.4540 0 0 15 55 37.45
B171008
Bike
Ped
Division Needs
Gum Branch Greenway
SR 1336 (Henderson Dr)
SR 1322 (Summersill School Rd)
Construct a shared-use sidepath adjacent on the west side of SR 1308 (Gum Branch Rd) from end of existing path north of SR 1336.
2 - Off-Road/Separated Linear Bicycle Facility (Bicycle)
$ 2,643,200 34.3240 0 5 10 55 34.32
1 of 3

9/6/18
SPOT IDM
ode
TIP
Proj
ect
Cate
gory
Route / Facility Name
From / Cross Street
To /
Cro
ss
Stre
et
DescriptionSpecific
Improvement Type
Cost
to N
CDO
T Division Needs Total Score
(Out of 100)
Community Importance
(40 max)
Project Readiness (25 max)
Transportation Performance
Mgmt (20 max)
P5.0 Qscore
(15 max)
Raw Score Total
MPO Local Input Points (25%)
Division Local Input Points (25%)
Total Regional Impact Score
H170569
High
way Regional
Impact
US 17 BUS (Wilmington Highway)
US 258 (Richlands Highway) NC 24 Bypass
Upgrade arterial to superstreet between NC 24 EB off-ramp and US 258 signalized intersection.
4 - Upgrade Arterial to Superstreet $ 8,000,000 27.62
40 0 10 5 55 27.62
A171145
Avia
tion
Regional Impact
OAJ - Albert J. Ellis Airport
OAJ - GA Apron Expansion and Hangar Site Preparation
N/AConstruct a southern expansion of the GA apron and site preparation for hangars (Project Request Number 3102)
1200 - Aircraft Apron / Helipad Requirements
$ 300,000 34.8210 15 10 15 50 100 59.82
A130298
Avia
tion
AV-5
809
Regional Impact
OAJ - Albert J. Ellis Airport
OAJ - Airport Access Road Realignment and Extension
N/A
This project will realign and extend the access roadway into the airport. This project will be funded by NCDOT Grants and local funds. (includes Project Request Numbers: 3110 )
1320 - General Aviation Terminal Building: Construct Terminal Access Road
$ 300,000 26.08
20 15 10 5 50 100 51.08
A171141
Avia
tion
Regional Impact
OAJ - Albert J. Ellis Airport
OAJ - GA Terminal Access Roadway Phase 3
N/A Construct new roadway to divert traffic away from the main terminal
1320 - General Aviation Terminal Building: Construct Terminal Access Road
$ 300,000 25.95
20 15 10 5 50 25.95
B171016
Bike
Ped
Division Needs
Midway Park Greenway Rail Tral
Piney Green Shopping Center Driveway
Construct shared-use path adjacent to the north side of NC 24
1 - Grade-Separated Bicycle Facility or National, State, or Regional Bicycle Route (Bicycle)
$ 1,909,000 35.19
30 0 0 15 45 35.19
H170571
High
wa
y Division Needs
SR 1308 (Gum Branch Road)
Williamsburg Parkway Indian Drive
Upgrade 5-lane cross-section to superstreet between existing traffic signals
4 - Upgrade Arterial to Superstreet
$ 7,100,000 34.3520 0 10 10 40 100 59.35
H171302
High
way Division
NeedsSR 1324 (Ramsey Rd)
SR 1308 (Gum Branch Rd)
Future - SR 2714 (Jacksonville Pkwy)
Upgrade to multilane superstreet4 - Upgrade Arterial to Superstreet
$46,500,000 28.5720 0 10 5 35 100 53.57
H111194-B Hi
ghw
ay
U-57
91 Division Needs
SR 1324 (Ramsey Road)
SR 2714 (Jacksonville Parkway)
US 17 (New Bern Highway)
Upgrade to a Multi-lane Superstreet4 - Upgrade Arterial to Superstreet
$24,800,000 25.6910 15 10 0 35 25.69
H170607
High
way Division
Needs
SR 1403 (Country Club Road)
NC 53 (Western Boulevard)
SR 1406 (Piney Green Road)
Upgrade to multilane superstreet4 - Upgrade Arterial to Superstreet
$19,200,000 34.8110 0 10 10 30 34.81
H150382
High
way Division
NeedsCatherine Lake Road
SR 1230 (Haw Branch Road)
SR 1265 (Airport Road)
Realign roadway to comply with FAA requirements
5 - Construct Roadway on New Location
$ 8,200,000 14.77
10 15 5 0 30 14.77
H111205-C
High
way Regional
Impact NC 210 South of SR 1518 (Old Folkstone Rd)
SR 1568 (New River Inlet Rd) Add turn lanes, shoulders and greenway 16 - Modernize
Roadway $ 30,300,000 18.78
10 5 10 0 25 18.78
2 of 3

9/6/18
SPOT IDM
ode
TIP
Proj
ect
Cate
gory
Route / Facility Name
From / Cross Street
To /
Cro
ss
Stre
et
DescriptionSpecific
Improvement Type
Cost
to N
CDO
T Division Needs Total Score
(Out of 100)
Community Importance
(40 max)
Project Readiness (25 max)
Transportation Performance
Mgmt (20 max)
P5.0 Qscore
(15 max)
Raw Score Total
MPO Local Input Points (25%)
Division Local Input Points (25%)
Total Regional Impact Score
B171005
Bike
Ped
Division Needs
Hunter's Trail Greenway
SR 1829 (Hunter's Trail)
SR 1860 (Hunter's Trail)
Construct shared-use path between the dead-end streets, including a bridge over the creek
2 - Off-Road/Separated Linear Bicycle Facility (Bicycle)
$ 396,000 13.7720 0 0 0 20 13.77
H140427
High
wa
y Division Needs
SR 1130 (Old Maplehurst Rd)
US 17 (Wilmington Hwy)
NC 53 (Burgaw Hwy)
Widen existing roadway 1 - Widen Existing Roadway $17,200,000 30.17
0 0 10 5 15 100 55.17
H150827
High
way Statewide
Mobility
US 17 (Wilmington Hwy)
SR 1119 (High Hill Rd)
SR 1116 (Onslow Pines Rd)
Upgrade to superstreet 4 - Upgrade Arterial to Superstreet $ 25,500,000 29.10
0 0 10 5 15 100 54.10
H170612
High
wa
y Division Needs New Route SR 1403 (Country
Club Road)SR 2614 (W. Huff Drive) Construct roadway on new alignment
5 - Construct Roadway on New Location
$ 5,900,000 20.7210 0 5 0 15 20.72
H170613
High
way Division
NeedsSR 1119 (High Hill Road)
US 17 (Wilmington Highway)
SR 1107 (Dawson Cabin Road)
Upgrade to 12' travel lanes and 4' paved shoulders.
16 - Modernize Roadway $ 9,100,000 15.03
0 0 5 0 5 15.03
H170614
High
way Division
Needs New Route SR 1829 (Hunters Trail)
SR 1860 (Hunters Trail)
Construct a connection on new alignment between the dead-end streets. Will require pipe or bridge at stream.
5 - Construct Roadway on New Location
$ 3,800,000 12.300 0 5 0 5 12.30
3 of 3

March 8, 2018 1
P5.0 LOCAL INPUT POINT METHODOLOGY
Introduction The State Transportation Improvement Program (STIP) and the Transportation Improvement Program (TIP) are federally required programming documents that depict phases (preliminary engineering, right-of-way acquisition, construction) of transportation projects by fiscal year and funding source. In North Carolina, the project selection process is governed by the Strategic Transportation Investments Act (STI) which was signed into law on June 26, 2013. The law provides a method to fund and prioritize transportation projects to ensure the maximum benefit to our state. The FY 2020-2029 STIP/TIP prioritization process, known as P5.0, is driven by data and local input, with all modes competing for funding. The formula breaks projects into three categories: Statewide Mobility (Interstate, National Highway System, Strategic Highway Network, Major Airports, Class I Railroads), Regional Impact (all other US and NC Routes, Regional Airports, Railroad, Ferry, Regional Transit) and Division Needs (all other state roadways, General Aviation Airports, Bicycle & Pedestrian, Railroad, Ferry, Transit, Federally Funded Municipal Roadways). Highway projects not funded in their primary category are eligible to cascade to a lower level to compete for funding. Go to www.ncdot.gov/strategictransportationinvestments for additional STI information. NCGS 136-18 requires MPO’s to develop methodologies to assign local input points to projects and North Carolina Department of Transportation (NCDOT) approval of the methodologies. JUMPO will not use modal specific criteria. The same criteria will be used to assign local input points to all modes. As part of the P5.0 transportation prioritization process, local input points at the Regional Impact and Division Needs levels are split evenly between the MPO and the Division Engineer. JUMPO will assign local points for Regional Impact (15% of total score) once the final data-driven P5.0 quantitative scores are generated and the draft Statewide Mobility projects have been identified. The Division Needs (25% of total score) local points will be assigned after the draft Regional Impact projects have been identified. The MPO has 1,300 points to assign to projects within each respective category (Regional Impact and Division Needs) and will use the methodology described in this document to determine the merits of the projects for assignment of points. The points assigned in each category cover all modes: aviation, bicycle & pedestrian, highway, transit. A maximum of 100 points may be assigned to any one project. The JUMPO P5.0 Local Input Methodology is based upon guidance from NCDOT and dialogue with the MPO’s Technical Coordinating Committee (TCC) Prioritization Subcommittee. Public comment will be solicited on this methodology in accordance with the adopted JUMPO Public Participation Plan prior to adoption by the MPO Transportation Advisory Committee (TAC) in March 2018.

March 8, 2018 2
Description of Criteria and Weights Community Importance Assessment – 40 points maximum This criterion allows local discretion, based upon public comment and TAC concurrence, to determine the relative importance of proposed projects to the community and categorize them accordingly. Local knowledge of the merits of proposed projects has been deemed to carry considerable weight in the distribution of preliminary points.
In accordance with the metropolitan planning process, input on proposed projects will be solicited by following outreach strategies contained within the adopted JUMPO Public Participation Plan. These include the use of the MPO website (www.jumpo-nc.gov), social media, newspaper advertising and a public forum.
o Project listings of all modes will be published in spring (potentially April) 2018 on the MPO website, along with a survey to allow the public to comment on and categorize submitted projects The survey will ask respondents to rate projects on a 1 to 5 scale based on
their level of support Final survey compilation will provide a score from 1 to 5 for each project
o Comments may also be received from the public by writing, telephone, social media, or in person, either at the public forum or in the MPO office
All modes will be combined and ranked from highest score to lowest. The scores will be divided into five equal groupings. Points will be awarded as follows:
o Top group - 40 points o Second highest group - 30 points o Middle group - 20 points o Second lowest group - 10 points o Lowest group - 0 points
Feedback from the public, including the public prioritization comments, will be provided to the TCC and TAC for consideration.
Project Readiness – 25 points maximum This criterion encourages local preference scoring based on the ability to construct or implement the project in a timely fashion. All modes are evaluated using the same criteria. In order to compare the different processes, the basis for point distribution will be on the project’s readiness for construction or implementation and what phase of the process the project is at the time of evaluation as reported by the project manager.
Projects are assigned points based upon status within the project development process. The phase of project development that has been started will determine the points awarded.
o Feasibility Study – 5 points o Project Scoping – 10 points o Environmental – 15 points o Design – 20 points o Right-of-way – 25 points

March 8, 2018 3
Transportation Performance Management National Goals – 20 points maximum
Transportation Performance Management is a strategic approach that uses system information to make investment and policy decisions to achieve national performance goals. The national Federal highway program performance goals as established by Congress are:
1. Safety - To achieve a significant reduction in traffic fatalities and serious injuries on all public roads.
2. Infrastructure Condition - To maintain the highway infrastructure asset system in a state of good repair
3. Congestion Reduction - To achieve a significant reduction in congestion on the National Highway System
4. System Reliability - To improve the efficiency of the surface transportation system 5. Freight Movement and Economic Vitality - To improve the national freight network,
strengthen the ability of rural communities to access national and international trade markets, and support regional economic development.
6. Environmental Sustainability - To enhance the performance of the transportation system while protecting and enhancing the natural environment.
7. Reduced Project Delivery Delays - To reduce project costs, promote jobs and the economy, and expedite the movement of people and goods by accelerating project completion through eliminating delays in the project development and delivery process, including reducing regulatory burdens and improving agencies' work practices
This criterion will award 5 points for each goal that is being furthered by the project, with a maximum of 20 total points available. Data sources for this criterion include, but are not limited to: P5.0 quantitative data items, the Long Range Transportation Plan or other applicable plan, project studies, purpose and need statements. The source(s) and goal(s) will be listed for each project.
P5.0 Quantitative Score – 15 points maximum This criterion encourages local prioritization scores that work with, not against, P5.0 quantitative results. The P5.0 quantitative score accounts for 70% of Regional Impact and 50% of Division Needs project scores and represents a significant portion of the prioritization process. Local prioritization scores that do not align with P5.0 quantitative results could be counterproductive for funding projects.
The P5.0 data driven score will determine the number of points assigned in each tier All modes will be combined and projects will be listed in descending order of P5.0 scores Projects will be divided into four equal groups with the following point assignment:
o Top group - 15 points o Second highest group - 10 points o Second lowest group - 5 points o Lowest group - 0 points

March 8, 2018 4
Total Score and Project Ranking Approach Preliminary Local Input Points The four criteria scores will be added together for each project and become the basis for the TAC to assign the local input points to the top 13 projects. These top scoring projects will each receive 100 local input points (or the maximum allowable percentage of points within the MPO for shared projects).
The prioritized listing with preliminary local input point assignment (including raw scores) will be publicized using the JUMPO Public Participation Plan to obtain public comment
o Regional Impact category in April – May 2018 o Division Needs category in September – October 2018
Recommendations for less than the maximum point assignment may be made depending on overall analysis of projects within Region B and/or Division 3
The P5.0 scores and Division Engineer assigned local prioritization input points will also be available to the public at the same time for their review through NCDOT’s websites.
Schedule and Public Outreach The following schedule for prioritization of projects to be included in the FY 2020-2029 TIP is subject to change at the discretion of NCDOT/JUMPO. Specific dates and any changes to this schedule will be posted on the JUMPO website. In addition to a public open house, the public is welcome to address their concerns during the public comment portions of the TCC or TAC meetings. All materials will be available on the JUMPO website, www.jumpo-nc.org. April 2018 – P5.0 Quantitative Scores are released by NCDOT April 2018 – Draft list of programmed Statewide Mobility projects released April 2018 – Survey available on JUMPO website for public comment and input on Regional
Impact project prioritization Late April – May 2018 – Public Comment period for draft assignment of Regional Impact local
input points May 2018 – Public open house for review of draft assignment of Regional Impact local input
points May 2018 – TCC will review draft assignment of Regional Impact local input points June 2018 – TAC will assign Regional Impact local input points and submission to NCDOT September 2018 – Draft list of programmed Regional Impact projects released September 2018 – Survey available on JUMPO website for public comment and input on
Division Needs project prioritization September – October 2018 – Public Comment period for draft assignment of Division Needs
local input points September 2018 – Public open house for review of draft assignment of Division Needs local
input points September 2018 – TCC will review draft assignment of Division Needs local input points October 2018 – TAC will assign Division Needs local input points and submission to NCDOT January 2019 – NCDOT will release draft FY 2020-2029 STIP

March 8, 2018 5
Point Assignment Process All final project rankings, points assigned per project and any rationale/justification for point adjustments which deviate from this methodology will be available on the MPO website in June 2018 for the Regional Impact category and in October 2018 for the Division Needs category. NCDOT final project scores will be released in late 2018 and the draft FY 2020-2029 STIP will be available for public review and comment in early 2019. Final Local Prioritization Input Points The draft local input points for each project will be finalized after public comments have been received and coordination with the Division Engineer is complete. The TCC and TAC will direct the final award of local input points into the P5.0 prioritization process and may, at the board’s discretion, award less than 100 points on a project in order to increase the number of priority projects receiving local input points. The board may also award points to a project that was not shown in the draft listing or remove points from a project that was shown in the listing. The board reserves the right to make adjustments they believe are in the best interest of the metropolitan planning area. A total of 1,300 points to projects in the Regional Impact category will be submitted no later than the end of June 2018 or as directed by NCDOT. A total of 1,300 points to projects in the Division Needs category will be submitted no later than the end of October 2018 or as directed by NCDOT. Spreadsheets with project information and final point assignment will be available on the JUMPO website, www.jumpo-nc.org, immediately after TAC meetings in June for Regional Impact and October for Division Needs. The spreadsheets will be updated to show which projects are moving forward once NCDOT has completed selection of the projects that will be included in the draft FY 2020-2029 STIP.

JACKSONVILLE URBAN AREA
JUMPO METROPOLITAN PLANNING ORGANIZATION
RESOLUTION ADOPTING THE JACKSONVILLE URBAN AREA METROPOLITAN PLANNING ORGANIZATION PRIORITIZATION 5.0 LOCAL INPUT POINTS METHODOLOGY
A motion was made by TAC Member :J?a u_l ]>LLC.haoa.n and seconded by
TAC Member 'R0,;~6 Tooma.S for adoption of the following resolution, and upon being put to a vote was duly adopted.
WHEREAS, a new method of funding and prioritizing transportation projects to ensure maximum
benefit to our state was enacted when the Strategic Transportation Investments program was signed into law on June 26, 2013; and
WHEREAS, prioritization (also known as Prioritization 5.0, or PS.O) is primarily a data-driven
process, involving local assignment of points for projects in the Regional Impact and Division Needs funding categories by the Jacksonville MPO; and
WHEREAS, the Jacksonville MPO developed a PS.O Local Prioritization Input Methodology, which complies with state law and NCDOT guidance; and
WHEREAS, the preliminary PS.O Local Input Points Methodology for all projects was published for
public comment on February 2, 2018; and
WHEREAS, all public comments were duly considered; and
WHEREAS, the PS.O Local Input Points Methodology (Exhibit A) has been made to enhance the
greatest likelihood of future funding in the State Transportation Improvement Program for projects that improve the mobility of our region.
NOW, THEREFORE, BE IT RESOLVED by the Jacksonville Urban Area Transportation Advisory Committee that the PS.O Local Input Points Methodology is hereby adopted, this the 8th day of March, 2018. -------
Robert Warden, Chairman

815 New Bridge Street • Post Office Box 128 • Jacksonville, North Carolina 28541-0128
Prioritization 5.0 Work Program
TCC subcommittee:
City of Jacksonville (2) Onslow County (2) MCB Camp Lejeune (2) NCDOT Division 3 (2) NCDOT District 1 (1)
NCDOT Transportation Planning Branch (1)
Timeline:
May 11, 2017 - TAC considers work program, creates P5.0 subcommittee
June 26, 2017 – MPO issues Call for Projects
July6, 2017 – Staff coordination with others in Region B and Division 3 for alternate criteria
July 28, 2017 – Subcommittee evaluates new projects and comments for submittal, alternate criteria for
Regional Impact and Division Needs
August 1, 2017 – Public Meeting for comment on project submissions
August 10, 2017 – Subcommittee evaluates non-highway projects for submittal
August 10, 2017 – TCC presented with new projects for consideration
August 25, 2017 – Last day for existing project deletions and carry-over project modifications
September 14, 2017 – TAC considers new projects for submission
September 29, 2017 – Project submission submitted to NCDOT
December 2017 – Project submittal data review
January 2018 – NCDOT approval of Local Input Methodology
February 2 - 28, 2018 – Public comment period for Local Input Methodology
February 8, 2018 – Complete review of Local Input Methodology and present to TCC

Project Prioritization Work Program
2
March 8, 2018 – TAC adopts Local Input Methodology
April 2018 – NCDOT releases quantitative scores and identifies funded Statewide Mobility projects
April 2018 – Subcommittee convenes to develop Regional Impact point assignments
April – June 2018 – Public comment period on subcommittee recommended local point assignments
May 10, 2018 –TCC consideration of Regional Impact local point assignments,
June 14, 2018 – TAC adopts point assignments
June 15, 2018 July 27, 2018 – Regional Impact local point assignments submitted to NCDOT
September 2018 – NCDOT identifies funded Regional Impact projects
September 2018 August 28, 2018 – TCC subcommittee develops Division Needs local point assignments
September – October 2018 – Public comment period on subcommittee recommended Division Needs
local point assignments
October 3, 2018 – TCC consideration of Division Needs local point assignments
October 11, 2018 –TAC Division Needs local point assignment concurrence
October 12, 2018 –Local point assignment submitted to NCDOT
January 2019 – NCDOT releases draft STIP
Winter-Spring 2019 – Public comment period for draft STIP
Spring 2019 – MPO completes draft TIP and financial plan
June 2019 – Board of Transportation Adoption of STIP
July 2019 – MPO Public Comment Period for final TIP
August 2019 – TCC recommends adoption of TIP
September 2019 – TAC adopts TIP, forwards to NCBOT for adoption
October 2019 – TIP/STIP approved by FHWA
October 2019 – FY 2018-2027 TIP/STIP active

SPOT ID
Mo
de
TIP
Project
Category
Route /
Facility
Name
From / Cross Street
To /
Cross
Street
Description
Specific
Improvement
Type
Cost to NCDOT
Statewide
Mobility
Quantitative
Score
(Out of 100)
Regional
Impact
Total
Score
(Out of
100)
Funded
Status -
Draft
Programmed
Amount
(2020-2029) -
Draft
Rig
ht-
of-
Wa
y D
ate
-
Dra
ft
Co
nstr
ucti
on
Da
te -
Dra
ft
H170604
Hig
hw
ay
U-6
107
Statewide
Mobility
US 17
(Marine
Blvd)
McDaniel Drive
Add left turn lane on
McDaniel Dr.; add right turn
lane on Workshop Ln; add
cross-walks, curb ramps,
ped signals, improve
drainage structure under
McDaniel Dr.
10 - Improve
Intersection $ 1,400,000 81.31 N/A
Statewide
Mobility $ 1,400,000
FY 2
025
FY 2
027
A150610
Avia
tion
AV-5
806
Regional
Impact
OAJ - Albert
J. Ellis
Airport
OAJ - Runway 23 Extend 900' N/A
Extend runway 23 and
taxiway A 900'
(construction) (Project
Request Number 3761)
0500 - Runway
Length/Width $ 300,000 N/A 81.44
Regional
Impact $ 300,000
FY 2
025
H150380
Hig
hw
ay
U-6
081
Regional
Impact
NC 53
(Western
Blvd)
SR 1308 (Gum Branch Rd)
US 17
(Marine
Blvd)
Upgrade to a Multi-Lane
Superstreet
4 - Upgrade
Arterial to
Superstreet
$ 31,400,000 N/A 81.40Regional
Impact $ 22,067,000
FY 2
026
FY 2
028
A150605
Avia
tion
AV-5
804
Regional
Impact
OAJ - Albert
J. Ellis
Airport
OAJ - Land Acquisition for Runway
Projection Zone, Runway Extension and
Road Relocation
N/A
Acquire land for roadway
relocation, RPZ and runway
extension
0500 - Runway
Length/Width $ 300,000 N/A 77.63
Regional
Impact $ 300,000
FY 2
023
A150604
Avia
tion
AV-5
805
Regional
Impact
OAJ - Albert
J. Ellis
Airport
OAJ - Land Acquisition for Runway
Extension and Road RelocationN/A
Acquire land for runway
extension and roadway
relocation (Project Request
Number 3442)
0500 - Runway
Length/Width $ 300,000 N/A 77.22
Regional
Impact $ 300,000
FY 2
023
H171392
Hig
hw
ay
U-6
148
Statewide
Mobility
US 258
(Richlands
Hwy), NC 24
SR 1329 (Rhodestown Fire Dept Rd)
Add right turn lane on
northbound US 258 and
right turn lane on SR 1329
10 - Improve
Intersection $ 1,600,000 63.67 72.10
Regional
Impact $ 1,266,000
FY 2
026
FY 2
028